Article

VSG Control Strategy Incorporating Voltage Inertia and Virtual Impedance for Microgrids

1
National-Local Joint Engineering Laboratory of Digitalize Electrical Design Technology, Wenzhou University, Wenzhou 325035, China
2
College of Electrical and Information Engineering, Hunan University, Changsha 410082, China
3
Guangdong Zhicheng Champion Group Co., Ltd., Dongguan 523718, China
*
Author to whom correspondence should be addressed.
Energies 2020, 13(16), 4263; https://doi.org/10.3390/en13164263
Submission received: 20 July 2020 / Revised: 10 August 2020 / Accepted: 13 August 2020 / Published: 18 August 2020
(This article belongs to the Section F: Electrical Engineering)

Abstract

:
Virtual synchronous generator (VSG) control lacks voltage inertia and powerful decoupling capabilities. The voltage of the distributed generator (DG) unit controlled by the VSG will be easily affected by power fluctuations and high-frequency noise, and the DG coupling usually makes the VSG control effect unsatisfactory. In order to effectively reduce power fluctuations, the influence of high-frequency noise on voltage, the influence of coupling on the power regulation, and effectively improve the economy of the economic system, the improved VSG control that combines voltage inertia and virtual impedance is proposed in this paper. The second-order inertia in the proposed VSG control strategy can minimize the voltage change rate and filter high-frequency noise from the excitation and virtual impedance. The virtual impedance in the proposed VSG control strategy can simulate the actual impedance to change the line characteristics, so the coupling of the DG unit can be reduced. Experimental results based on the microgrid platform prove the feasibility of improving the VSG control.

1. Introduction

Virtual synchronous generator (VSG) control simulates the dynamic droop characteristic and steady-state droop characteristic of the synchronous generator, which adjusts the voltage amplitude and frequency by means of calculating the reactive power and active power separately. It has been widely used in the applications of the microgrid because of its strong frequency inertia and power self-regulation ability [1,2,3,4,5,6,7,8]. However, the performance of the VSG control mainly relies on the inductive line impedance of the distributed generator (DG) units. Meanwhile, its voltage block lacks sufficient inertia [9,10,11]. When large power fluctuations occur in the microgrid, the voltages of the DG units will be easily affected by the power fluctuations, resulting in the fluctuations of the voltages, and if the line impedance reflects the characteristics of resistance and inductance, there is a strong coupling in the DG unit. Therefore, the adjustment precision of the power of the VSG control will be easily affected by the coupling. As a result, dynamic performance and microgrid power distribution cannot be obtained well [12,13].
Virtual impedance can reduce the coupling of VSG control to a certain extent [14,15,16]. It reflects the real situation to a certain extent, which allows the coupling of the DG unit to be adjusted by setting the appropriate value of the virtual impedance.
Although the coupling of the DG units can be decreased by changing the characteristic of the virtual impedance, the differential equations in the virtual impedance cannot suppress the voltage fluctuation caused by the power fluctuations. That is the reason why the voltage inertia of the VSG control cannot be enhanced by this method, and the excitation block also has no strong inertia in VSG control.When the power fluctuations occur in the microgrid, the voltage in the VSG control will be easily affected by power fluctuations through the excitation block and virtual impedance block. Therefore, the stability of the DG device will be reduced, and the high-frequency noise and virtual impedance generated by the excitation block can easily affect the voltage quality of the DG device. In fact, the inertia equation can be adopted to decrease the influence of the power fluctuations and suppress the effect of the high frequency noises. In [17], a method of using first-order inertia to suppress the influence of high-frequency noise was proposed. However, the influence of the coupling is not considered in this method, resulting in low dynamic performance of the voltage-source converters. In [18], it was proposed to use first-order inertia and virtual output impedance in the VSG control, but did not consider the impact of power fluctuations on the control system through the virtual impedance. In [19], a first-order inertia is introduced into the excitation block and virtual impedance. It enhances the inertia of the voltage and reduces the influence of the high frequency noises from the excitation block and virtual impedance. In [20], a first-order inertia is introduced into the virtual impedance to suppress the influence of the high frequency noises. Meanwhile, the influence of the fluctuations from virtual impedance on voltage can also be decreased. Although the first-order inertia in these papers can enhance the inertia of the voltage in some extent, and it can also filter out the high frequency noises, its inertia and filtering performance are greatly limited by the stability of the DG units adopting the VSG control.
In order to solve the disadvantages of the dynamic performance of VSG control and the poor accuracy of microgrid power distribution, and realize the stable power regulation of DG units, this paper proposes an improved VSG control that combines voltage inertia and virtual impedance. The voltage inertia in the improved VSG control is the second-order voltage inertia. Compared to the first-order inertia, it can further improve the voltage inertia and the filtering ability. The influence of DG unit coupling can be adjusted by increasing the virtual reactance. Meanwhile, proposed method in this article can achieve the same effect without additional power electronic equipment, which means that the cost of hardware can be effectively reduced. The rest of this paper is organized as follows. In Section 2, the structure of the VSG control and the comparative experimental results between the first-order inertia and second-order inertia are presented. Then, with the given condition that the improved VSG control incorporating voltage inertia and virtual impedance. Stability analysis of the DG units adopting the improved VSG control and experimental results are presented in Section 3. Finally, conclusions are presented in Section 4.

2. Improved VSG Control

2.1. VSG Control

In order to prove the advantage of second-order inertia through the Bode plot, the formula of the torque governor is written as [1,2,3,4,5,6]
P m = Δ ω K ω + P r = ( ω r ω ) K ω + P r
where P r , P m , ω r , and K ω are the active power reference signal, mechanical power, angular frequency reference signal, and coefficient of the angular frequency regulating, respectively.
The formula of the rotor motion is written as
J v d Δ ω d t + D v Δ ω = T m T e = P m ω m P ω m
where J v , D v , T m , and T e are the virtual inertia, damping factor, mechanical torque, and electromagnetic torque, respectively.
The formula of the excitation is simplified as
V v = V r + K v ( Q r Q )
where Q r , K v , and V v are the reactive power reference signal, coefficient of the voltage regulating, and output voltage of the excitation, respectively.

2.2. Comparisons of First-Order Inertia and Second-Order Inertia

In order to prevent the voltage of the DG unit from being easily affected by power fluctuations when the microgrid has large power fluctuations, the control proposed in this paper introduces inertia. At the same time, in order to minimize the voltage change rate and filter out high-frequency noise from the excitation and virtual impedance, this article chooses the second-order inertia link. The detailed comparison is shown below.
First-order inertia and second-order inertia are the common inertia equations [21,22,23,24]. However, their filtering effect and stability performance are different when their response times for the input signals are almost equal. To verify the validity of the second-order inertia, the comparisons of the bode diagrams and positions of the poles of the inertia equations are presented as follow.

2.2.1. Comparison of Bode Diagram

In order to get an accurate Bode diagram, this part establishes a model of first-order inertia and second-order inertia. The formula of the first-order inertia is written as [21,22]
I f = ω f s + ω f
where ω f represents the cutoff angular frequency of the first-order inertia.
The formula of the second-order inertia is written as [23,24]
I s = ω s 2 s 2 + ζ ω s s + ω s 2
where ζ = 1 / Q , and Q is the quality factor. ω s is the cutoff angular frequency of the second-order inertia.
Comparing the (4) and (5), the structure of the first-order inertia is simpler than that of the second-order inertia. When the input signals of the second-order inertia and first-order inertia are the step signals, and their response times for the step signals are almost equal, the parameters of the second-order inertia are set as follow: ζ = 3.340 and ω s = 57.1 , and the parameter of the first-order inertia is set as follow: ω f = 18 . The bode diagrams of them are shown in the Figure 1. As shown in the Figure 1, the phase margin and delay margin of the second-order inertia are 180 and inf, respectively, and the phase margin and delay margin of the first-order inertia are 180 and inf, respectively. Therefore, the bode diagrams can demonstrate that the first-order inertia and second-order inertia adopting the above parameters are stable. However, the slope of the magnitude attenuation of the second-order inertia is larger than that of the first-order inertia. It means that the filtering effect of the second-order inertia is better than that of the first-order inertia.

2.2.2. Comparison of Positions of Poles

When the first-order inertia adopts the above parameter, the value of the pole of the first-order inertia is calculated as
λ 1 = 18
When the second-order inertia adopts the above parameters, the values of the poles of the second-order inertia are calculated as
λ 2 95.35 i 30.139 λ 3 95.35 + i 30.139
Comparing the (6) and (7), the real parts of the poles of the second-order inertia are smaller than those of the first-order inertia. This means that the distance between the pole of the second-order inertia and the imaginary axis will be greater. Therefore, the stability of the second-order inertia is better than that of the first-order inertia when they adopt the above parameters.

2.3. Improved VSG Control

In order to reduce the coupling of the DG units, the virtual impedance is adopted, and the formula of the virtual impedance is given by [14,15,16]
V d V q = R v L v ω L v 0 ω L v 0 R v L v i d d i d d t i q d i q d t + V v 0
where L v and R v represent the virtual reactance and resistance, respectively. The virtual impedance can simulate the real situation, which means that the characteristics of the line impedance of the DG units can be changed. In this paper, the impact of line resistance can be decreased by adjusting the value of virtual reactance. Therefore, the influence of the coupling of the DG units can be effectively reduced.
According to the (3) and (8),the power fluctuations can affect the VSG control through the excitation block, and the influence of the power fluctuations can be enhanced by the differential equations of the virtual impedance. In order to reduce the influence of power fluctuations on voltage, the voltage inertia should be considered. According to the analyses in the previous section, the slope of the magnitude attenuation and stability of the second-order voltage inertia are higher than those of the first-order inertia when their response times for the input signals are almost equal. Therefore, the second-order inertia is considered in this paper, and the formula of considering second-order inertia is written as
V d i V q i = ω s 2 s 2 + ζ ω s s + ω s 2 0 0 ω s 2 s 2 + ζ ω s s + ω s 2 V d V q
According to the (9), the second-order inertia is added into the place which is behind the excitation block and virtual impedance, so it can greatly slow down the change rate of the voltage generated by them, which also means that the impact of the power fluctuations on the voltage can be greatly decreased.Meanwhile, it can also filter out the high frequency noises of the voltage from the excitation and virtual impedance.
The schematic diagram of the improved VSG control incorporating voltage inertia and virtual impedance is shown in the Figure 2. As shown in the Figure 2, the voltage V v is obtained by the excitation block, and the angle frequency ω is obtained by the torque governor block and rotor motion block. The virtual impedance obtains the voltage V v to generate the voltage reference signals of the dq-axis ( V d and V q ). According to the second-order inertia, the voltage reference signals V d and V q are changed to the new voltage reference signals V d i and V q i . The phase angle θ can achieve the coordinate transformation, and use PI control strategy to control the voltage loop and the current loop.

3. Stability Analysis and Experiment

The connection model of the microgrid is shown in the Figure 3. In the Figure 3, it comprises batteries based DG units (DG1 and DG2), a photovoltaic based DG unit (DG3), a grid, and a load. V o n θ o n ( n = 1 , 2) is the output voltage of the DG unit, and V P C C represents the voltage at the common coupling point. L n and C n ( n = 1 , 2, 3) are the filter inductors and filter capacitors, respectively. R l n ( n = 1 , 2) is expressed as line resistance and L l n ( n = 1 , 2) is expressed as line reactance. The DG3 adopts the rectifier controller [25], and it is a good method to get the reference voltage through maximum power point tracking (MPPT) [26].
This article uses lithium-ion battery packs as batteries for DG1 and DG2, and their open circuit voltage (OCV) is approximately 330 V. L n ( n = 1 , 2 , 3 ) = 2.5 mH, C n ( n = 1 , 2 , 3 ) = 12   μ F, and the ratio of the transformers is 160/400. The parameters of the improved VSG control are set as follow: K ω = 10,000, K v = 0.001 , R v 1 = 0   Ω (DG1), L v 1 = 6 mH (DG1), J v = 1 , D v = 5 , ζ = 1.4 , ω o = 100 , R v 2 = 0   Ω (DG2), and L v 2 = 9 mH (DG2). The parameters of the VSG control are set as follow: K ω = 10,000, K v = 0.001 , J v = 1 , and D v = 5 .

3.1. Stability Analysis

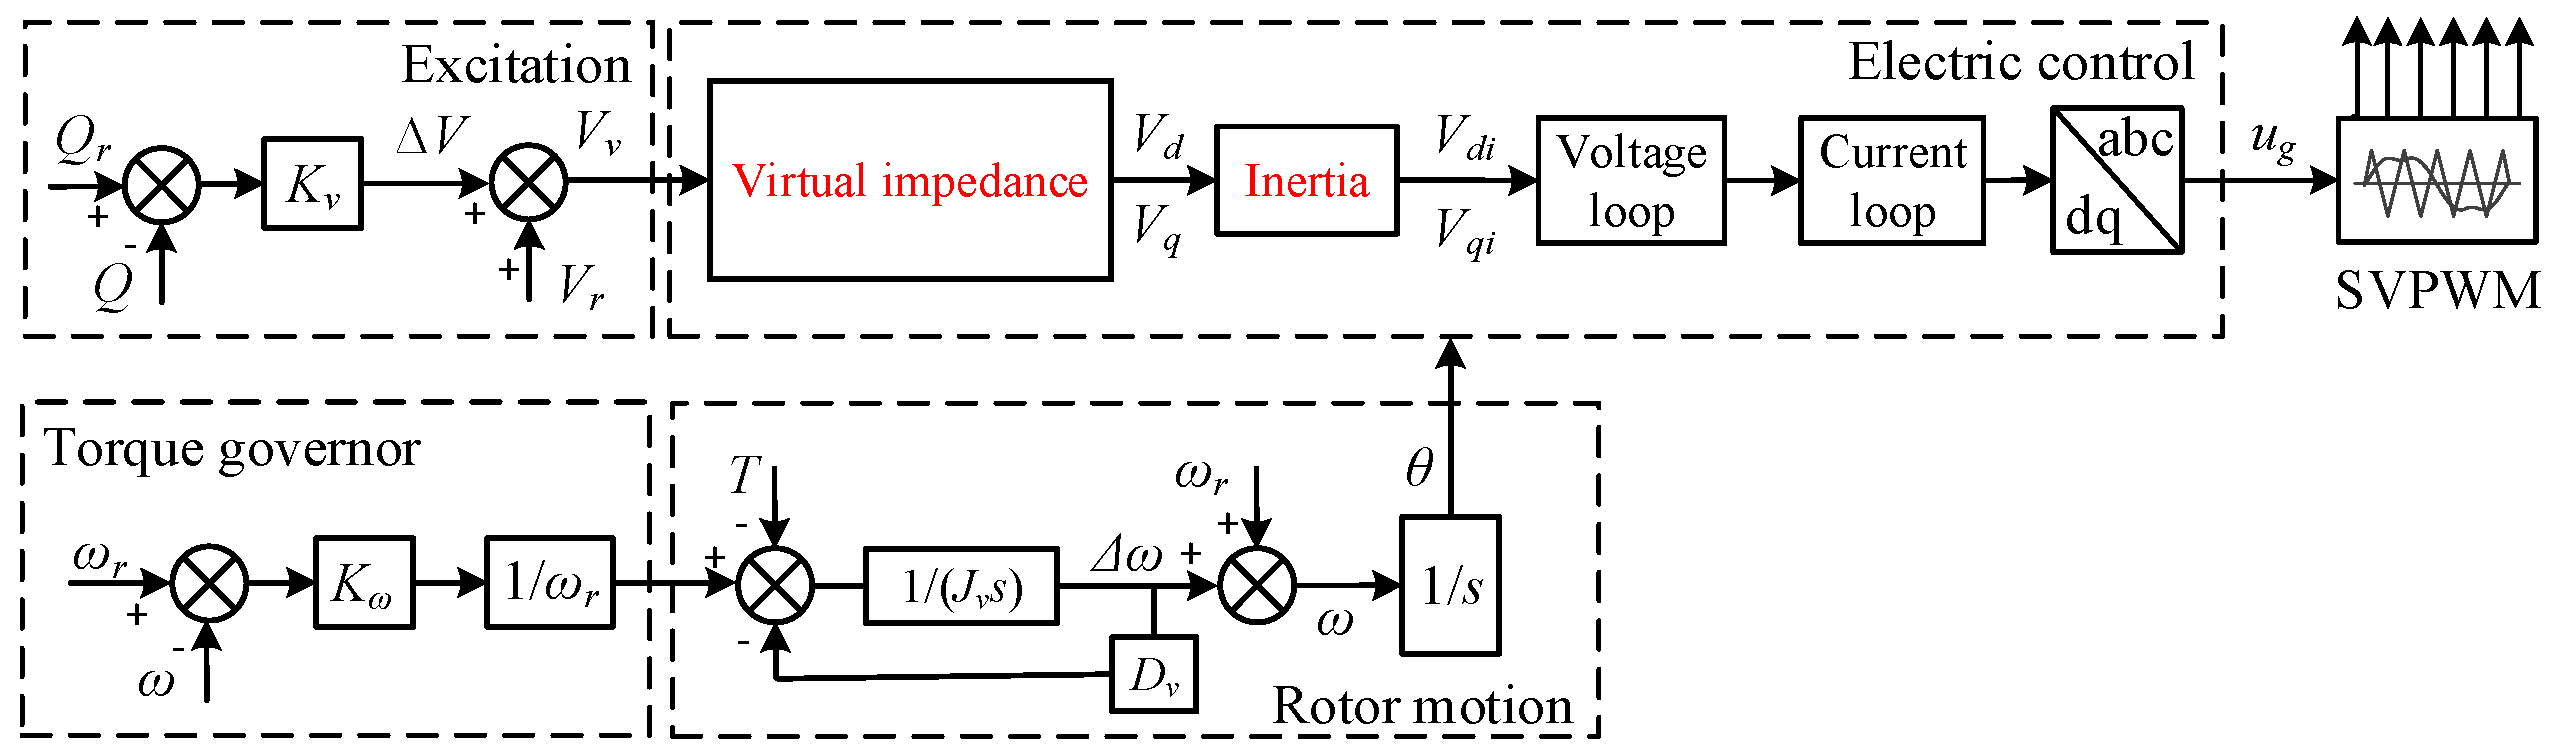
When the above parameters are selected, it is a good method to analyze the stability of the DG unit controlled by the improved VSG by establishing a corresponding small signal model. In order to simplify the model, this paper divides the small signal model of the improved VSG controlled DG unit into two parts. The one comprises the P- ω control block and Q-V control block (Torque governor block, rotor motion block, and excitation block), and the another is the electric control block (Voltage inertia, voltage loop, current loop, model of the inverter, and so on). Referring to [27,28,29,30], the small-signal model of the DG unit controlled by the improved VSG is described as follows.
(a) P- ω control block and Q-V control block
According to the Figure 3, and only considering the DG1 (The analysis method of the DG2 is the same as that of the DG1), the linear relationship equation of the phase angle, power, and voltage is written as
Δ P 1 = a 1 Δ θ o 1 + b 1 Δ V o 1 Δ Q 1 = c 1 Δ θ o 1 + d 1 Δ V o 1
Setting cos ( θ o 1 ) 1 and sin ( θ o 1 ) θ o 1 , the coefficients a 1 , b 1 , c 1 , and d 1 are written as
a 1 = V o 1 V p c c L L 1 V o 1 V p c c R L 1 θ o 1 R L 1 2 + L L 1 2 b 1 = V p c c R L 1 + V p c c L L 1 θ o 1 R L 1 2 + L L 1 2 c 1 = V o 1 V p c c R L 1 + V o 1 V p c c L L 1 θ o 1 R L 1 2 + L L 1 2 d 1 = V p c c L L 1 V p c c R L 1 θ o 1 R L 1 2 + L L 1 2
where, Δ P 1 , Δ P 2 , Δ θ o 1 , and Δ V o 1 represent the active power deviation, reactive power deviation, phase angle deviation, and voltage deviation, respectively, and there is
L L 1 = L t 1 + L l 1 + L v R L 1 = R t 1 + R l 1 + R v
where L t 1 and R t 1 are the equivalent reactance and equivalent resistance of the transformer, respectively. Neglecting the subscript and differentiating the (10), the equation is written as
s Δ P = a 1 Δ ω + s b 1 Δ V s Δ Q = c 1 Δ ω + s d 1 Δ V
As mentioned before, when choosing a suitable virtual reactance, the line resistance can be ignored. Let R L 1 = 0 , and substituting the (10) and (11) into (13), the model can be obtained as
A p s 2 + B p s + C p = 0
where
A p = ω m J v + ω m J v d 1 K v B p = ( D v + K ω ) ( ω m + ω m d 1 K v ) C p = a 1 + a 1 d 1 K v b 1 c 1 K v
It is a good way to judge the stability of the model by using the Routh-Hurwitz stability criterion [31,32,33], and the Routh array of the (14) is shown in the Table 1. In the Table 1, A p , B p , and C p in the first column are positive values, which demonstrates the stability of the corresponding small-signal model.
(b) Electric control block
Because the electric control block of the dq-axis is symmetrical. Therefore, only the electrical control block of the d-axis is needed to be considered, and its small-signal model is written as
V d o 1 V d i 1 = A e s 3 + B e s 2 + C e s D e s 5 + E e s 4 + F e s 3 + G e s 2 + H e s + I e
where
A e = ω o 2 L 1 + ω o 2 k p 2 T + ω o 2 k i 2 T Z C 1 + ω o 2 Z C 1 + ω o 2 2.5 Z T B e = ω o 2 k i 2 T + ω o 2 k p 2 + ω o 2 k i 2 Z C 1 + ω o 2 Z C e = ω o 2 k i 2 D e = L 1 + k p 2 T + k i 2 T Z C 1 + Z C 1 + 2.5 Z T E e = k i 2 T + k p 2 + k i 2 Z C 1 + Z + Z k p 1 k p 2 + ζ ω o ( L 1 + k p 2 T + k i 2 T Z C 1 + Z C 1 + 2.5 Z T ) F e = k i 2 + Z k p 2 k i 1 + Z k p 1 k i 2 + ζ ω o ( k i 2 T + k p 2 + k i 2 Z C 1 + Z + Z k p 1 k p 2 ) + ω o 2 ( L 1 + k p 2 T + k i 2 T Z C 1 + Z C 1 + 2.5 Z T ) G e = Z k i 1 k i 2 + ζ ω o ( k i 2 + Z k p 2 k i 1 + Z k p 1 k i 2 ) + ω o 2 ( k i 2 T + k p 2 + k i 2 Z C 1 + Z + Z k p 1 k p 2 ) H e = ζ ω o Z k i 1 k i 2 + ω o k i 2 + ω o Z k p 2 k i 1 + ω o Z k p 1 k i 2 I e = Z k i 1 k i 2 ω o
In the (17), k p 1 and k i 1 represent the proportional and integral control parameters in the voltage loop PID controller, respectively. k p 2 and k i 2 represent the proportional and integral control parameters in the current loop PID controller, respectively. T is the sampling time and Z is the resistance load. The Routh array of the characteristic equation of the (16) is shown in the Table 2. In the Table 2, D e , E e , E e F e D e G e E e , E e F e G e + D e I e E e D e G e 2 E e 2 H e E e F e D e G e , I e ( E e F e D e G e ) 2 E e ( E e F e G e + D e I e E e D e G e 2 E e 2 H e ) , and I e in the first column are the positive values, which demonstrates the stability of the corresponding small-signal model.
According to the Routh–Hurwitz stability criterion, these two small-signal models are stable. Therefore, the DG unit adopting the improved VSG control is also stable.

3.2. Performance Comparisons of Different VSG Control

In order to verify the feasibility of the improved VSG control, the corresponding experimental platform is established, which is shown in the Figure 4. In the Figure 4, the experimental platform comprises programmable DC power supplies, Scope Corder, three sets of DG units, an electronic load, and grid simulator, and the control strategies of the DG units are implemented by the TMS320F2812 controller. Meanwhile, the parameters of the experimental platform are the same as those of the connection model.
When DG3 is connected to DG1, the waveforms of the voltage ( V d i 1 and V p c c ), frequency ( f 1 ), output active power ( P 1 ), and output reactive power ( Q 1 ) of the DG1 are shown in the Figure 5. As shown in the Figure 5a, the voltage reference signal changes immediately when the VSG control is adopted, and the maximum overshoot of the voltage reference signal is over 2%. As shown in the Figure 5b, when the improved VSG control is adopted, the overshoot of the voltage signal is less than the overshoot under VSG control, which is less than 0.8%, and the high frequency noises of the voltage reference signal can be filtered out. As shown in the Figure 5c, there is a distortion of V p c c when the VSG control is adopted, and the THD of V p c c is approximately 2.98%. As shown in the Figure 5d, when the improved VSG control is adopted, the V p c c distortion of DG1 will be lower than the value of the VSG control, and the THD of V p c c is approximately 2.18%, which is smaller than that under the VSG control.
When the transformer load is loaded, the voltage, frequency, and power waveforms of the DG1 are shown in the Figure 6. As shown in the Figure 6a, the voltage reference signal of the VSG control changes immediately when the transformer load is loaded, and its maximum overshoot is over 3%. As shown in the Figure 6b, when the transformer load is loaded, the overshoot of the voltage signal is less than the overshoot under VSG control, which is less than 1.1%, and the high frequency noises of the voltage reference signal can be filtered out. As shown in the Figure 6c, there is a large distortion of V p c c when the transformer load is loaded. The THD of V p c c is approximately 3.43%. As shown in the Figure 6d, when the transformer load is loaded, the value of the V p c c distortion of DG1 under the control of the improved VSG is smaller than the value under the control of the VSG. And the THD of V p c c is approximately 2.62%, which is smaller than that under the VSG control.
When the DG unit has a load and is in parallel operation, the waveforms of active power ( P 1 and P 2 ) and reactive power ( Q 1 and Q 2 ) are shown in the Figure 7. The circulating current of active power when adopting VSG control and adopting modified VSG control, the values are 55 and 47 W, respectively. The reactive power of the microgrid is 30 Var and 26 Var, respectively, when using VSG control and when using improved VSG control. When the resistive load increases suddenly, the power overshoot of DG2 controlled by VSG is greater than 9%, which is greater than the maximum power overshoot of DG2 when the recommended control is adopted.

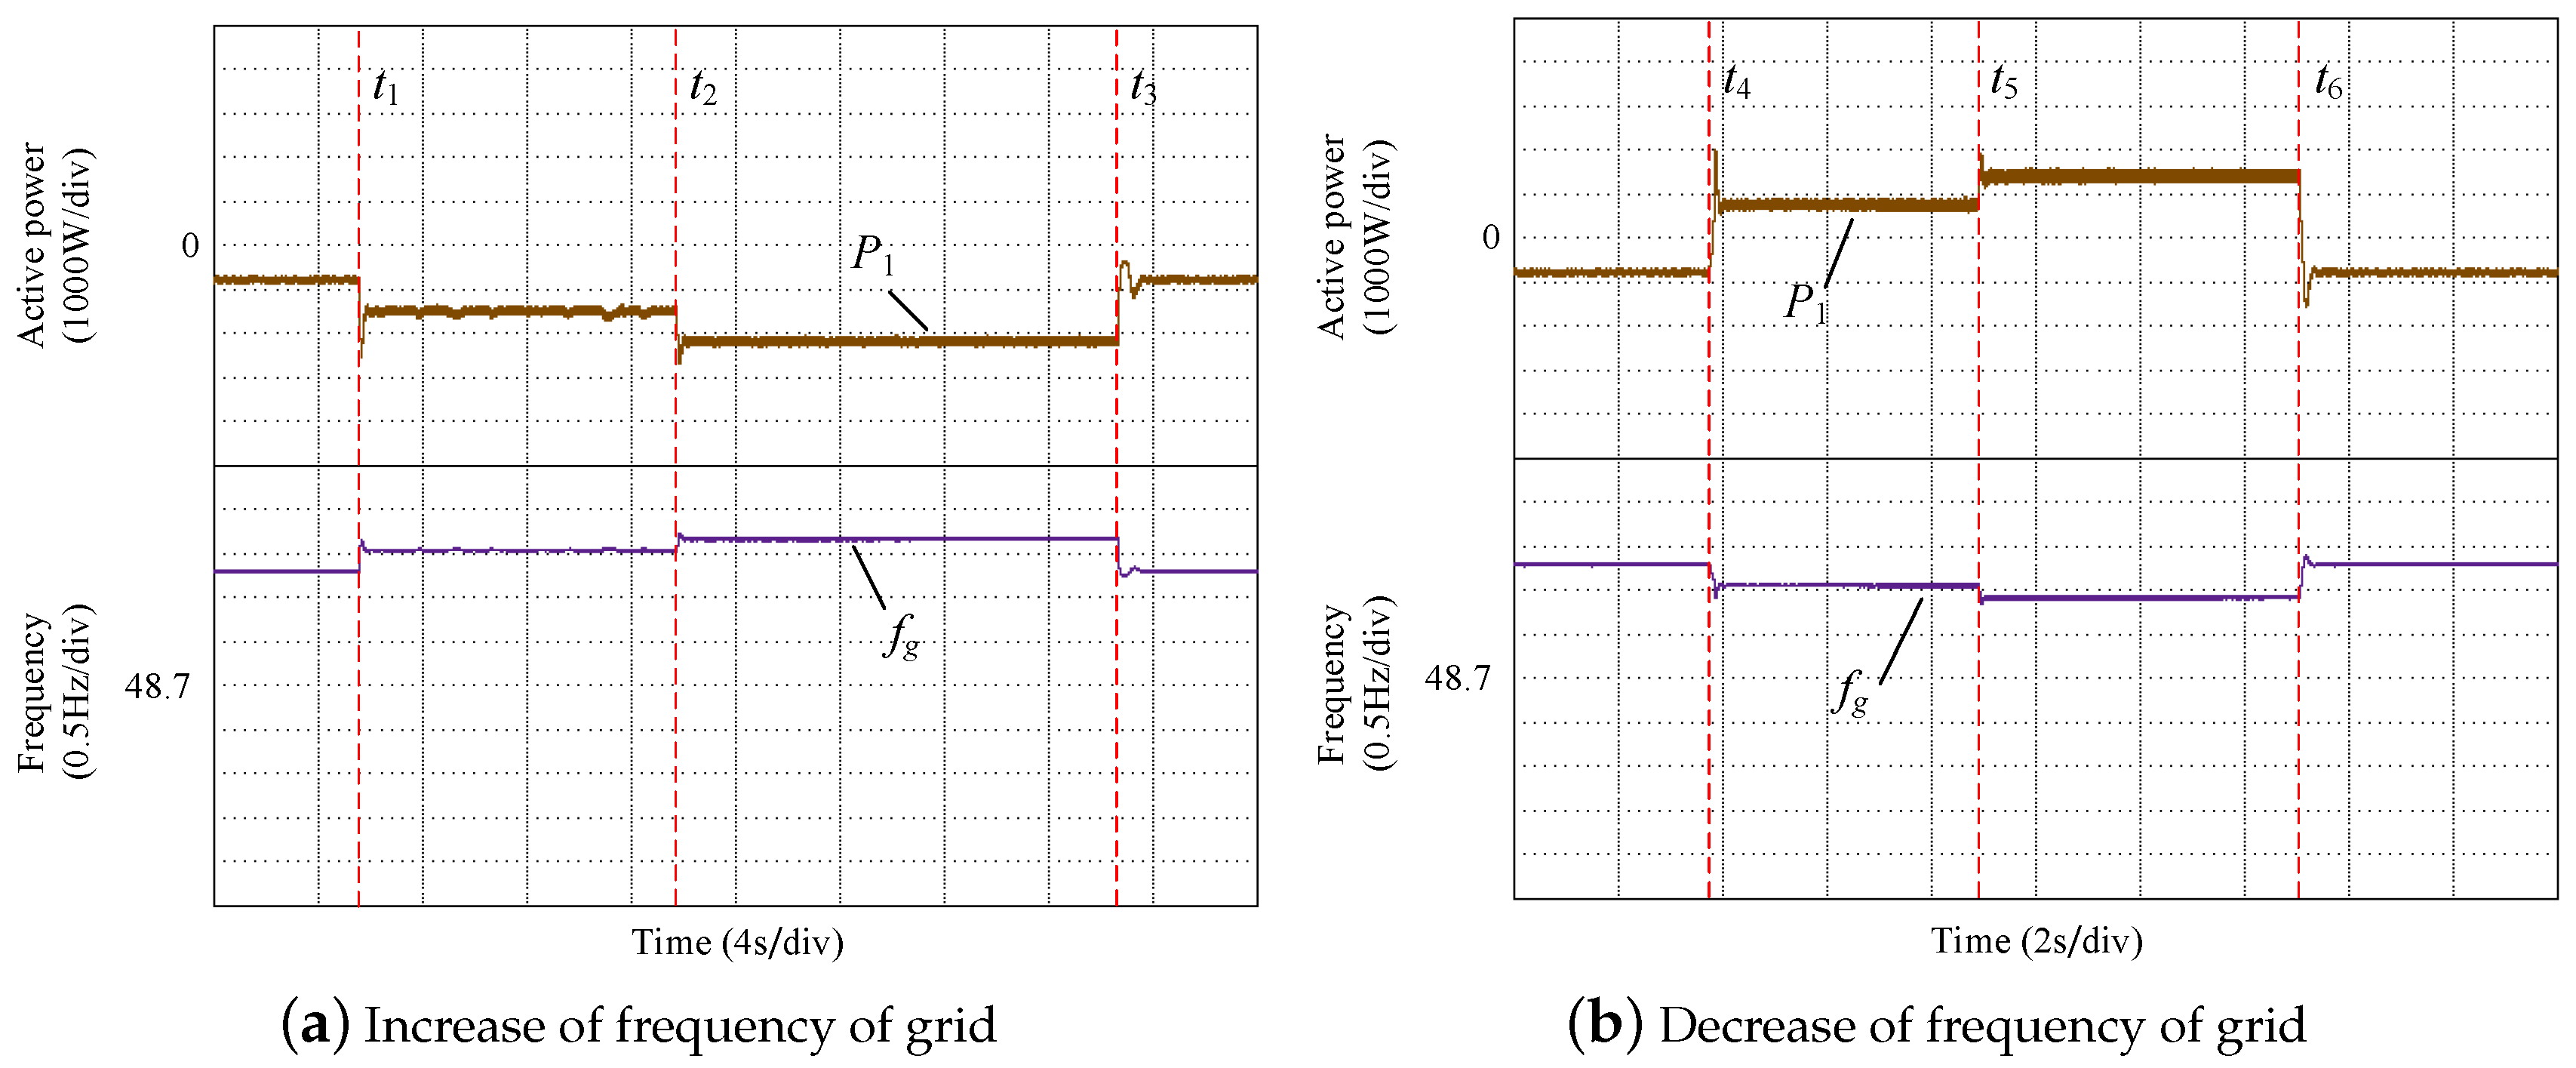
3.3. Performance Tests of Improved VSG Control Under Different Frequencies of Grid

This article tests the various performances of the grid-connected DG1 when the frequency is lower than 50.5 Hz and higher than 49.5 Hz. When the frequency increases or decreases, the injected or absorbed active power of DG1 is limited within the range of [−2500 W, 2500 W]. This article discusses the working status of DG1 under different frequencies of the proposed control strategy.
Figure 8 in this article shows the active power and frequency waveform of the proposed control DG1 when the frequency increases or decreases.It can be seen from Figure 8a that when the frequency of the grid increases from 50 to 50.2 Hz, the absorbed active power of DG1 first decreases to over −2500 W, but immediately returns to −1560 W. Then when the frequency of the grid increases from 50.2 to 50.3 Hz, the active power of DG1 can be quickly adjusted to about −2160 W. Finally, when the frequency is reduced from 50.3 to 50 Hz, the active power of DG1 can be immediately increased to −900 W. When the frequency is basically unchanged, the fluctuation of the active power is small. It can be seen from Figure 8b that when the frequency is reduced from 50 to 49.7 Hz, the injected active power of DG1 will first increase to 3000 W, but immediately return to 1910 W. Then when the frequency is reduced from 49.7 to 46.65 Hz, the active power speed of DG1 increases to 2430 W. Finally, when the frequency increases from 49.65 to 50 Hz, the active power of DG1 is reduced to −900 W. It can be obtained that when the frequency is basically unchanged, the fluctuation of the active power is small.

3.4. Active Power Regulation of Islanded Microgrid

In this article, the active power of the island microgrid can be adjusted by DG1 and DG2. However, lithium-ion battery packs are easily affected by unlimited charging/discharging, resulting in overcharging or over-discharging. The phenomenon of rapid open circuit voltage (OCV) change will occur when the state of charge (SOC) is too large or too small. In this regard, SOC greater than 90% or less than 20% is prohibited. At the same time, it is necessary to set an interval between different operating states to prevent frequent charging and discharging when the DG unit of the lithium-ion battery pack operates on the microgrid. In order to keep the lithium-ion battery pack in a stable operating state, and considering the capacity of the lithium-ion battery pack, setting the interval to [30%, 40%] is an appropriate value.
When the resistive load remains unchanged and DG3 is always in the MPPT state. The operating state of the island microgrid in the proposed control is shown below.
(1) Case 1
Make the SOC of DG1 and DG2 greater than 40%. At this time DG3 runs in MPPT mode, and the active power injected by DG1 and DG2 into the microgrid is equal. There is
P l = P G 1 + P G 2 + P G 3 m P l o s s P G 1 = P G 2
where P l is the active power of the load, P G 1 and P G 2 are the active power of DG1 and DG2 respectively, P l o s s is the power loss, and P G 3 m is the output active power of the MPPT mode.
The waveform of the output active power of Case 1 is shown in the Figure 9. Among them is the output active power of DG units ( P 1 , P 2 , and P 3 ). It can be seen from the Figure 9 that when t = t 1 , the active power of DG1, DG2 and DG3 drop from about 1580 to 551 W, from about 1615 to 606 W, and from 0 W to about 2100 W. When DG3 is connected to the microgrid, the maximum overshoot of the active power of all DG units is less than 0.9%.
(2) Case 2
Make the SOC of DG1 and DG2 less than 30%. At this time, DG3 runs in MPPT state, and the active power absorbed by DG1 and DG2 from DG3 is the same. There is
P G 1 + P G 2 = ( P G 3 m P l o s s ) P G 1 = P G 2
The waveforms of the output active power at Case 2 are shown in the Figure 10. When load shedding occurs at t = t 2 , the active power of DG1 is reduced from approximately 551 W to −884 W, the active power of DG2 is reduced from approximately 606 W to −856 W, and the active power of DG3 is unchanged. When load shedding occurs, the overshoot of active power of DG1 and DG2 is smaller than 0.9%, and the operation state of DG3 is almost unchanged in this condition. Meanwhile, the active power fluctuations of all DG units are very small when the microgrid operates in steady state.
(3) Case 3
Let the SOC of DG1 less than 30%, and the SOC of DG2 should be greater than 40%, DG3 runs in MPPT mode. At this time, DG1 absorbs active power from the microgrid, and DG2 injects active power into the microgrid. There is
P G 1 = ( P G 3 m + P G 2 P l P l o s s )
The waveforms of the output active power at Case 3 are shown in the Figure 11. When t = t 3 , DG1 changes its working state. At this time, the active power of DG1 and DG2 is reduced from 551 to −420 W, and 606 W is increased to 1615 W, and the active power of DG3 remains unchanged. When DG1 changes working status, the overshoot of active power in DG1 and DG2 is less than 1%. In this case, the working status of DG3 remains unchanged. At the same time, when the microgrid remains unchanged, the active power fluctuations of all DG units are very small.
(4) Case 4
Assuming that the initial SOC of DG1 and DG2 is less than 40% and greater than 30%, the working status of DG1 and DG2 will be the same as in case 2, and if the SOC of DG1 and DG2 is less than 40% and greater than 30%, the operating state of DG1 and DG2 will be the same as the previous operating state.

4. Conclusions

An improved VSG control is proposed in this paper to solve the drawbacks of the VSG control. It incorporates second-order voltage inertia and virtual impedance into the VSG control. The second-order voltage inertia can effectively decrease the influence caused by the power fluctuations. It can also effectively reduce the influence of high frequency noises on the voltage. The virtual impedance has the characteristic of reducing coupling in the DG unit. Therefore, their combination can not only improve the performance of the microgrid, but also make the power distribution of the microgrid more accurate.
According to the experiments, when the improved VSG control is adopted, the accuracy and characteristics of the power sharing of the microgrid is optimized compared with the VSG control. Therefore, improved VSG control can have better performance than VSG control. When the improved VSG control is adopted, not only the DG unit can operate stably under the state of changing frequency, but also the island microgrid can operate stably under different changing states. Meanwhile, it can also be used in more complex systems.

Author Contributions

Z.K., writing—review and editing; Y.D., supervision; Z.P., writing—original draft and investigation; G.Z., conceptualization; J.W., project administration; M.L., funding acquisition; Y.N., software. All authors have read and agreed to the published version of the manuscript.

Funding

This work was supported by the Chinese National Natural Science Foundation. (Projects No. 51977064 and No. 61972288).

Conflicts of Interest

The authors declare no conflict of interest.

References

  1. Hirase, Y.; Abe, K.; Sugimoto, K. A novel control approach for virtual synchronous generators to suppress frequency and voltage fluctuations in microgrids. Appl. Energy 2018, 210, 699–710. [Google Scholar] [CrossRef]
  2. Zhong, Q.C. Virtual Synchronous Machines: A unified interface for grid integration. IEEE Power Electron. Mag. 2016, 3, 18–27. [Google Scholar] [CrossRef]
  3. Shuai, Z.; Huang, W.; Shen, C. Characteristics and Restraining Method of Fast Transient Inrush Fault Currents in Synchronverters. IEEE Trans. Ind. Electron. 2017, 64, 7487–7497. [Google Scholar] [CrossRef]
  4. Shuai, Z.; Hu, Y.; Peng, Y. Dynamic Stability Analysis of Synchronverter-Dominated Microgrid Based on Bifurcation Theory. IEEE Trans. Ind. Electron. 2017, 64, 7467–7477. [Google Scholar] [CrossRef]
  5. Wei, Y.L.; Zhang, H.; Song, Q. The title of the cited contribution. In Proceedings of the 2016 IEEE 8th International Power Electronics and Motion Control Conference (IPEMC-ECCE Asia), Hefei, China, 22–26 May 2016; pp. 2015–2021. [Google Scholar]
  6. Zhu, X.W.; Xia, M.C.; Chiang, H.D. Coordinated sectional droop charging control for EV aggregator enhancing frequency stability of microgrid with high penetration of renewable energy sources. Appl. Energy 2018, 210, 936–943. [Google Scholar] [CrossRef]
  7. Ma, Y.; Cao, W.; Yang, L. Virtual Synchronous Generator Control of Full Converter Wind Turbines with Short-Term Energy Storage. IEEE Trans. Ind. Electron. 2017, 64, 8821–8831. [Google Scholar] [CrossRef]
  8. Hirase, Y.; Sugimoto, K.; Sakimoto, K.; Ise, T. Analysis of Resonance in Microgrids and Effects of System Frequency Stabilization Using a Virtual Synchronous Generator. IEEE J. Emerg. Sel. Top. Power Electron. 2016, 4, 1287–1298. [Google Scholar] [CrossRef]
  9. Li, B.; Zhou, L. Power Decoupling Method Based on the Diagonal Compensating Matrix for VSG-Controlled Parallel Inverters in the Microgrid. Energies 2017, 10, 2159. [Google Scholar]
  10. Liu, J.; Miura, Y.; Bevrani, H.; Ise, T. Enhanced Virtual Synchronous Generator Control for Parallel Inverters in Microgrids. IEEE Trans. Smart Grid 2017, 9, 2268–2277. [Google Scholar] [CrossRef]
  11. Xu, H.; Zhang, X.; Liu, F.A. Reactive Power Sharing Strategy of VSG Based on Virtual Capacitor Algorithm. IEEE Trans. Ind. Electron. 2017, 64, 9520–9531. [Google Scholar] [CrossRef]
  12. Mo, O.; D’Arco, S.; Suul, J.A. Evaluation of Virtual Synchronous Machines with Dynamic or Quasi-Stationary Machine Models. J. Abbr. 2017, 64, 5952–5962. [Google Scholar] [CrossRef] [Green Version]
  13. Fang, J.; Tang, Y.; Li, H.; Li, X.A. Battery/Ultracapacitor Hybrid Energy Storage System for Implementing the Power Management of Virtual Synchronous Generators. IEEE Trans. Power Electron. 2018, 33, 2820–2824. [Google Scholar] [CrossRef]
  14. Asrari, A.; Mustafa, M.; Ansari, M. Impedance Analysis of Virtual Synchronous Generator-Based Vector Controlled Converters for Weak AC Grid Integration. IEEE Trans. Sustain. Energy 2019, 10, 1481–1490. [Google Scholar] [CrossRef]
  15. Micallef, A.; Apap, M.; Spiteri-Staines, C. Mitigation of Harmonics in Grid-Connected and Islanded Microgrids Via Virtual Admittances and Impedances. IEEE Trans. Smart Grid 2017, 8, 651–667. [Google Scholar] [CrossRef] [Green Version]
  16. Chen, M.; Xiao, X.N. Hierarchical frequency control strategy of hybrid droop/VSG-based islanded microgrids. Electr. Power Syst. Res. 2018, 155, 131–143. [Google Scholar] [CrossRef]
  17. Ashabani, M.; Mohamed, Y.A.R.I. Novel Comprehensive Control Framework for Incorporating VSCs to Smart Power Grids Using Bidirectional Synchronous-VSC. IEEE Trans. Power Syst. 2014, 29, 943–957. [Google Scholar] [CrossRef]
  18. Suul, J.A.; D’Arco, S. Virtual Synchronous Machine-Based Control of a Single-Phase Bi-Directional Battery Charger for Providing Vehicle-to-Grid Services. IEEE Trans. Ind. Appl. 2016, 52, 3234–3244. [Google Scholar] [CrossRef]
  19. Li, B.; Zhou, L.; Yu, X. Improved power decoupling control strategy based on virtual synchronous generator. IET Power Electron. 2017, 10, 462–470. [Google Scholar] [CrossRef]
  20. Li, B.; Zhou, L.; Yu, X.R.; Zheng, C.; Liu, J.H. New control scheme of power decoupling based on virtual synchronous generator. In Proceedings of the 2016 IEEE Power and Energy Conference at Illinois (PECI), Urbana, IL, USA, 19–20 February 2016; pp. 1–8. [Google Scholar]
  21. Salvatore, D.; Jon, A.S.; Fosso, O.B. A Virtual Synchronous Machine implementation for distributed control of power converters in SmartGrids. Electr. Power Syst. Res. 2015, 122, 180–197. [Google Scholar]
  22. D’Arco, S.; Suul, J.A. Equivalence of Virtual Synchronous Machines and Frequency-Droops for Converter-Based MicroGrids. IEEE Trans. Smart Grid 2014, 5, 394–395. [Google Scholar] [CrossRef]
  23. Wu, S.T.; Lian, S.H.; Chen, S.H. Vibration control of a flexible beam driven by a ball-screw stage with adaptive notch filters and a line enhancer. J. Sound Vib. 2015, 348, 71–87. [Google Scholar] [CrossRef]
  24. Nicolae, P.M.T.; Dobroiu, A.G.I.; Popa, L.D.D. Designing and testing of a second order active RC low-pass filter with different quality factors. In Proceedings of the 2014 International Symposium on Fundamentals of Electrical Engineering (ISFEE), Bucharest, Romania, 28–29 November 2014; pp. 1–4. [Google Scholar]
  25. Khenar, M.; Adabi, J.; Pouresmaeil, E. A control strategy for a multi-terminal HVDC network integrating wind farms to the AC grid. Int. J. Electr. Power Energy Syst. 2017, 89, 146–155. [Google Scholar] [CrossRef]
  26. Fathabadi, H. Novel fast and high accuracy maximum power point tracking method for hybrid photovoltaic/fuel cell energy conversion systems. Renew. Energy 2017, 106, 232–242. [Google Scholar] [CrossRef]
  27. Wu, D.; Tang, F.; Dragicevic, T.; Vasquez, J.C. A Control Architecture to Coordinate Renewable Energy Sources and Energy Storage Systems in Islanded Microgrids. IEEE Trans. Smart Grid 2015, 6, 1156–1166. [Google Scholar] [CrossRef] [Green Version]
  28. Kim, J.; Guerrero, J.M.; Rodriguez, P.; Teodorescu, R. Mode Adaptive Droop Control with Virtual Output Impedances for an Inverter-Based Flexible AC Microgrid. IEEE Trans. Power Electron. 2011, 26, 689–701. [Google Scholar] [CrossRef]
  29. Liu, M.; Xiao, G.C.; Zhao, F.Z.; Yang, D.S. An enhanced virtual synchronous generator strategy for suppressing grid voltage sag. In Proceedings of the 2017 IEEE 3rd International Future Energy Electronics Conference and ECCE Asia (IFEEC 2017—ECCE Asia), Kaohsiung, Taiwan, 3–7 June 2017; pp. 2064–2069. [Google Scholar]
  30. Hua, T.; Yan, X.; Fan, W. Research on power point tracking algorithm considered spinning reserve capacity in gird-connected photovoltaic system based on VSG control strategy. In Proceedings of the 2017 IEEE 3rd International Future Energy Electronics Conference and ECCE Asia (IFEEC 2017—ECCE Asia), Kaohsiung, Taiwan, 3–7 June 2017; pp. 2059–2063. [Google Scholar]
  31. Choghadi, M.A.; Talebi, M.A. The Routh-Hurwitz Stability Criterion, Revisited: The Case of Multiple Poles on Imaginary Axis. IEEE Trans. Autom. Control 2013, 58, 1866–1869. [Google Scholar] [CrossRef]
  32. Zhang, Y.; Liu, J.; Dong, Z.; Wang, H.; Liu, Y.H. Dynamic Performance Improvement of Diode-capacitor-Based High Step-up DC-DC Converter Through Right-Half-Plane Zero Elimination. IEEE Trans. Power Electron. 2017, 32, 6532–6543. [Google Scholar] [CrossRef]
  33. Ferrante, A.; Lepschy, A.; Viaro, U. A simple proof of the Routh test. IEEE Trans. Autom. Control 1999, 44, 1306–1309. [Google Scholar] [CrossRef]
Figure 1. Bode diagrams.
Energies 13 04263 g001
Figure 2. Schematic diagram of improved VSG control.
Energies 13 04263 g002
Figure 3. Connection model of microgrid.
Energies 13 04263 g003
Figure 4. Experiment platform of microgrid.
Energies 13 04263 g004
Figure 5. Waveforms of microgrid when DG3 is connected to DG1.
Energies 13 04263 g005
Figure 6. Waveforms of microgrid when transformer load is loaded.
Energies 13 04263 g006
Figure 7. Power waveforms of parallel operation.
Energies 13 04263 g007
Figure 8. Waveforms of power and frequency of grid-connected DG1.
Energies 13 04263 g008
Figure 9. Active power waveforms of microgrid at Case 1.
Energies 13 04263 g009
Figure 10. Active power waveforms of microgrid at Case 2.
Energies 13 04263 g010
Figure 11. Active power waveforms of microgrid at Case 3.
Energies 13 04263 g011
Table 1. Routh array of (14).
s 2 A p C p
s 1 B p
s 0 C p
Table 2. Routh array of characteristic Equation of (16).
s 5 D e F e H e
s 4 E e G e I e
s 3 E e F e D e G e E e E e H e D e I e E e  
s 2 E e F e G e + D e I e E e D e G e 2 E e 2 H e E e F e D e G e I e  
s 1 I e ( E e F e D e G e ) 2 E e ( E e F e G e + D e I e E e D e G e 2 E e 2 H e )  
s 0 I e

