Article

The Analysis of the Effectiveness of Implementing Emission Reduction Measures in Improving Air Quality and Health of the Residents of a Selected Area of the Lower Silesian Voivodship

1
Department of Environment Protection Engineering, Faculty of Environmental Engineering, Wroclaw University of Science and Technology, Pl. Grunwaldzki 9, 50-377 Wroclaw, Poland
2
BSiPP EKOMETRIA Sp. z o.o., ul. Orfeusza 2, 80-299 Gdańsk, Poland
3
Integrated Environmental Monitoring Department, Institute of Environmental Protection—National Research Institute, ul. Krucza 5/11d, 00-548 Warsaw, Poland
4
inFAIR, ul. Puszczyka 10/55, 02-785 Warsaw, Poland
5
Department of Spatial Planning and Settlements Processes, Faculty of Architecture, Wroclaw University of Science and Technology, B. Prusa 53/55, 50-317 Wroclaw, Poland
6
Institute for Territorial Development, J. Wl. Dawida 1a, 50-527 Wroclaw, Poland
7
Institute of Environmental Engineering, Polish Academy of Sciences in Zabrze, M. Skłodowskiej-Curie 34 Str., 41-819 Zabrze, Poland
*
Author to whom correspondence should be addressed.
Energies 2020, 13(15), 4001; https://doi.org/10.3390/en13154001
Submission received: 7 July 2020 / Revised: 24 July 2020 / Accepted: 27 July 2020 / Published: 3 August 2020
(This article belongs to the Special Issue Energy Processes, Systems and Equipment)

Abstract

:
The case study selected in order to analyze and evaluate the effectiveness of implemented solutions for improving air quality with the WRF-CALMET/CALPUFF modeling system as an element of decision support was the subject of this paper. Its character can be considered unique due to its geographical location, topography and the functioning PGE GiEK S.A. Turów Power Complex (ELT), and, in particular, the PGE GiEK S.A. Turów Coal Mine (KWBT). The conducted analyses have defined three scenarios of emission changes: (1) scenario related to the activities of the energy complex resulting from the minimizing measures indicated in the report on the environmental impact of the mine, (2) scenario resulting from the so-called “anti-smog” regional resolution and (3) scenario compiling the abovementioned scenarios. According to the analyses, the lowest values of the annual mean PM2.5 concentration were noted in the eastern part of the studied area and did not exceed 14 µg/m3 (56% of the permissible level). The best results in improving air quality were proven for scenario 3, i.e., a 10% reduction in concentration values over the entire analyzed area of the commune. In the case of this scenario, as the most effective and health-promoting solution, only in 25% of the area was the improvement in the residents’ health below 5%, while the reduction in the estimated number of premature deaths by over 15% was observed in nearly one third of the studied area.

Graphical Abstract

1. Introduction

Ambient air pollution is one of the main environmental problems in Europe, and some pollutants are the issue primarily in Poland. The European Union has implemented legislation that sets standards and goals for many air pollutants in the form of Directives 2008/50/EC and 2004/107/EC [1,2]. These provisions have been transposed into national law, primarily as the provisions of the Act on Environmental Protection Law and the Regulation of the Minister of the Environment on the levels of certain substances in the air [3,4]. In addition to standards for the concentrations of selected pollutants, the provisions also regulate the methods of air quality assessment and management, e.g., through the development and implementation of recovery programs and air quality plans.
International organizations dealing with air quality issues and assessing their impact on society, health and the environment, such as the World Health Organization (WHO) and the European Environment Agency (EEA), study and analyze the impact of air pollution on health. According to EEA estimates, there were around 412,000 premature deaths attributable to ambient PM2.5 pollution in 41 European countries in 2016, of which 43,100 deaths occurred in Poland (premature deaths are deaths that occur before reaching the average age defined by life expectancy. Premature deaths are considered avoidable if their causes were eliminated) [5]. Particulate matter, both less than 2.5 µm and less than 10 µm in diameter, is the source of pollution that causes the most problems and exceeds permissible air quality standards.
Adverse health effects of air pollution, particularly regarding particulate matter, are observed as a result of both long- and short-term exposure. For this reason, WHO recommendations, as well as air quality standards introduced by the European Union legislation and transposed into the laws of individual Member States, define annual mean and daily limit values. According to Polish regulations, pursuant to Directive 2008/50/EC, the annual mean limit value concentration for PM2.5 is 25 µg/m3 (since 1 January 2020, the so-called second phase of the standard is 20 µg/m3). For PM10, the annual mean is 40 µg/m3 and the 24-h mean is 50 µg/m3 (allowing 35 days with exceedances of the limit value in a calendar year). In addition, selected European countries have introduced information and alarm thresholds for PM10 concentration. As of 2019, these thresholds in Poland are respectively 100 µg/m3 and 150 µg/m3 for the daily mean concentration [6].
The results of the air quality assessments carried out annually in Poland by the Chief Inspectorate for Environmental Protection indicate a bigger problem with meeting the PM10 daily limit value. In 2018, the norm was exceeded in 39 of the 46 assessed zones in the country. Annual means were exceeded in nine zones. The limit value was exceeded during this period at 160 and 25 measuring sites in the country out of 227 included in the assessment, for both standardized averaging times, respectively [7]. Therefore, actions have been taken to improve air quality in Poland [8]. One example of these activities is restrictions and bans on the operation of fuel-burning installations, effective also in the Lower Silesian Voivodship. This is due to three so-called “anti-smog” resolutions adopted by the Lower Silesian Regional Assembly on 30 November 2017 [9,10,11]. One of the abovementioned resolutions covers the territory of the entire voivodship, excluding the city of Wrocław and 11 health resorts of the Lower Silesian Voivodship. The provisions introduced by this resolution are binding in Bogatynia commune and introduce restrictions and bans on the operation of fuel-burning installations. As of 1 July 2018, in Bogatynia commune, it is forbidden to use the following:
  • lignite and solid fuels manufactured with lignite
  • coal sludges, coal flotoconcentrates and mixtures manufactured with them
  • hard coal in fine form (fine coal) with grain size less than 3 mm
  • solid biomass (including wood) with moisture content above 20%.
The resolution introduces a gradual withdrawal of out-of-class installations, and as of 1 July 2018, it is allowed to install only such new boilers and local air heaters (fireplaces) that meet the ecodesign requirements regarding particulate matter emissions [12]. As of 1 July 2024, the resolution introduces a ban on the use of solid fuel installations that do not meet a minimum of third class requirement according to PN-EN 303-5:2012. The deadline for the implementation of the resolution and the resulting bans is 1 July 2028. From then on, the use of solid fuel installations that do not meet the minimum emission standards of class 5 in terms of particulate matter emission limits according to PN-EN 303-5:2012 will be prohibited. Introducing these restrictions for the combustion of solid fuels and the use of installations is expected to bring a significant improvement in air quality and thus reduce the likelihood of developing air pollution-related diseases.
In Poland, according to official data, the majority of PM10 emissions to the atmosphere (approximately 47%) are generated by non-industrial combustion processes, including in the municipal and residential sector related to solid fuel biomass combustion for heating and hot water preparation [13]. The next three groups with the largest share in PM10 emissions are combustion processes in industry (approximately 14%), road transport (approximately 8%) and manufacturing (approximately 7%). These data are from 2017 and concern the entire country [14]. The situation may be different in individual regions or may be considered locally, where the impact of individual sectors may vary. This may be connected with the presence of a specific source or group of industrial sources, or the density of the high-traffic road network, which occurs primarily in the central areas of the agglomeration and large cities. The impact of specific groups of sources is also time-varying and depends, e.g., on the season of the year (heating and non-heating period) or day (variability of household heating systems activity or the volume of traffic) [15].
The analysis of the reasons for high levels of particulate matter concentration, including the exceedance of daily limit values, must also consider the episode period, location of the area of exceedance in relation to emission sources and local topographic conditions affecting ventilation possibilities, as well as meteorological conditions conducive to the accumulation of pollution, such as low wind speed or temperature inversion phenomena. In the case of large urban centers, peripheral areas are generally more exposed to the influence of heating sources, while car transport may be of more importance in the city centers. In special meteorological situations and certain areas, the movement of pollutants (inflows) and their accumulations affect the range of impact of individual emission sources [16].
One of the elements of ambient air quality management in a given area is its assessment and diagnosis of the conditions, taking into account possible exceedances of the limit values. In accordance with the current laws, as part of the State Environmental Monitoring coordinated by the Chief Inspectorate of Environmental Protection (CIEP), this assessment is carried out using three basic groups of methods [17,18]:
  • measuring (monitoring) concentrations of selected pollutants,
  • mathematical modeling of transformation in the atmosphere and transport of pollution,
  • objective estimation, based on various methods and information, including the spatial distribution and activity of pollution emission sources.
Actions connected with the following aspects are examples of the air quality management process:
  • air quality plans and programs for corrective measures aimed at achieving and/or maintaining appropriate level of air quality
  • analysis of the effects of implementing specific solutions (scenario analysis)
  • analysis of the impact of air pollution on specific social groups and other environment elements, such as vegetation or materials (e.g., buildings or technical facilities)
  • air quality forecasting, considering emission sources and meteorological conditions
  • informing the public and policymakers about historical, current and predicted air quality.
All of the above elements occur at various levels: international (e.g., European), national, regional (e.g., voivodship) and local (e.g., urban or a specific industrial plant or a single installation). All of them also use various air quality modeling techniques, such as chemical modeling of transport and transformation of pollutants, receptor or statistical modeling, also using, e.g., artificial neural networks [16,19,20].
Table 1 summarizes examples of the use of modeling techniques at various levels and for the purpose of achieving various main objectives of air quality management. It presents general examples and, in selected cases, references to specific projects or applied solutions. Considering the comfort of life and health of people, especially in the areas close to objects that can significantly affect the environment, activities aimed at minimizing the onerous impact of those objects are particularly important. Therefore, in order to analyze and evaluate the effectiveness of the implemented solutions in the context of improving air quality using modeling, the area selected as a case study is the commune in Poland of a nature unique to Poland and Europe, both due to its geographical location bordering with two countries—Czechia and Germany—and its characteristically diverse terrain. The selected area is an interesting case also because it contains one of the largest energy complexes in Poland, which includes an open-pit lignite mine with a large lignite-fired fuel combustion facility. In addition, ambient air quality in the analyzed area is influenced by combustion processes in household boilers. Therefore, the analysis of the distribution of pollutant concentrations and the assessment of the effectiveness of measures for reducing air pollutant emissions, including health risk assessment, are extremely important.

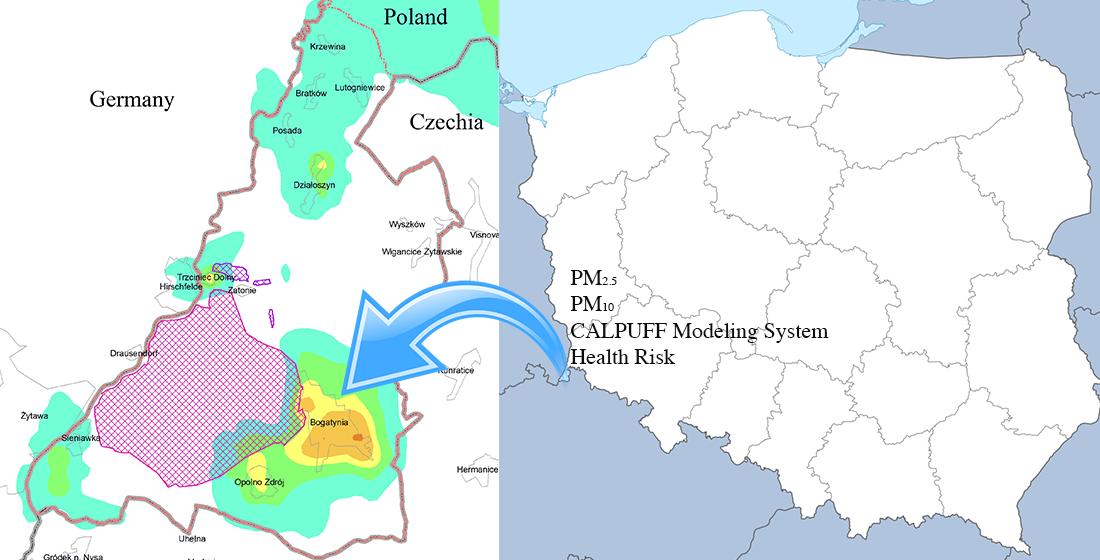
2. Characteristics of the Research and Analysis Area

The area of Bogatynia commune (Figure 1) located within three basic geographical regions: the mesoregion of the Zittau Basin, the Izera Foothills and Izera Mountains and the Nysa Łużycka Valley were selected for the case study. The mesoregion of the Zittau Basin has a lower terrain in relation to the Izera Foothills and the Izera Mountains surrounding it from the northeast and the east. On the west side, the area is limited by the Nysa Łużycka Valley, behind which the Zittau Valley extends into the Lusatian Foothills. Such location and character of the area mean that its diverse terrain can significantly shape air mass flows within it.
The largest cities of the studied region are Polish Bogatynia in the center and German Zittau (Żytawa) and Czech Hrádek nad Nisou (Gródek na Nysą) (Figure 2) in the southwest, already outside Poland. The other places are of a rural character.
Three low-volume voivodship roads, with a volume below 10,000 vehicles a day, run through the studied area. The DW352 road connects Zgorzelec with the state border at the Kunratice/Bogatynia crossing. The DW354 road runs from the Bogatynia–Zatonie district to the west, and further south to the town of Sieniawka, along the border with Germany, where it crosses the border. Road DW332 is a short section connecting route 178 (on the German side) and a border crossing with Germany in the town of Sieniawka, as well as a border crossing with Czechia in the direction of Hrádek nad Nisou, where on the Czech side it turns into route 35. Another regional road is route 99 running on the German side of the border along the Nysa Łużycka River. Other roads are local and have basically no influence on local air quality.
The analyzed area holds one of the largest energy production complexes in Poland, which supplies around 8% of the energy production to the national energy system. It consists of a conventional block heat and power plant (ELT) located in the north, with interstage steam superheating and a closed cooling water system, whose basic fuel is lignite. Currently, the installed capacity of the PGE GiEK S.A. Turów Power Plant Complex (ELT) is 1498.8 MW in six power units of 235 MW and 260 MW capacity. Coal is supplied directly by belt conveyors from the PGE GiEK S.A. Turów Coal Mine (KWBT) located in the south. The surface of the open-pit excavation area with an internal backfill area currently covers around 26 km2. The open pit is directly adjacent to the town of Bogatynia (in the east) and the state border (in the west). Two districts of Bogatynia—Trzciniec Dolny and Zatonie, located between the power plant and the mine, are significantly exposed to the impact of both facilities. Currently, the bottom of the open-pit mine is around 10 m.a.s.l., and the elevations around it are at 225–300 m.a.s.l. The surrounding mountains and foothills lie at heights above 500 m.a.s.l. in the southern part and in the range 400–500 m.a.s.l. in the northern part.
By 2028, the ambient air quality in the analyzed area will have been shaped by a number of changes significantly affecting the size of emission balances in Bogatynia commune. These activities are discussed in detail in Section 3.1.3.

3. Materials and Methods

3.1. Mathematical Modeling and Available Input Data

Model calculations were made using the WRF-CALMET/CALPUFF system. This system is based on the 2nd generation cloud model (CALPUFF), powered by data from the WRF meteorological model (Weather Research and Forecasting Model) [21,22]. Meteorological data for calculations are prepared by the CALMET preprocessor, which determines the time and space variables of meteorological parameters with the grid resolution specified by the user. The conducted analyses defined three scenarios of emission changes: (1) scenario (scenario 1) related to changes in emissions in the studied mine resulting from the minimizing measures indicated in the report on the mine’s environmental impact [23], (2) scenario resulting from the anti-smog resolution in force in the Lower Silesian Voivodship [11] (scenario 2) and (3) scenario compiling the abovementioned scenarios (scenario 3).
For calculations on a local scale, smaller mesh sizes with detailed information about the terrain and land use are applied, as these parameters can significantly affect the shape of the pollution field, especially in mountainous areas. For the purposes of this study, a system of nested grids with resolution sizes of 0.25–1 km was used. The domain in which the meteorological parameter fields were calculated covered the area within 10 km of the border of Bogatynia commune. Meteorological data from 2018 were used, which were adapted to two nested grids with a resolution of 0.5 km in Bogatynia commune and 1 km in the rest of the computational domain (Figure 3a). Information about the terrain (as the average in a grid) and land use (as the prevailing value) was implemented into the model with the same resolution [24,25].
Calculations of pollution concentrations were carried out based on grids in two resolutions: 0.25 km in the area of Bogatynia commune and 1 km in the rest of the computational domain (Figure 3b). The obtained results were visualized using inverse distance weighting (IDW). According to this method, the value for each interpolated cell is calculated based on the values of neighboring points weighed by the inverse of their distance. For such a dense receptor network, this is the most optimum interpolation method [26].
In the air quality modeling, the influx of pollutants from outside the examined area was also taken into account as boundary conditions varying in time and space derived from chemistry transport model (CTM) calculations. Data from the Copernicus project were used [27].

3.1.1. Emission Data

Due to the location of the studied area (direct neighborhood of Poland, Czechia and Germany), and the resulting problems with the unification of emission databases, data from three sources described below were used for more comprehensive analyses.
In the area of Poland, data from a detailed emission inventory were used for annual air quality assessments performed up to 2017 by the Voivodship Inspectorate for Environmental Protection in Wrocław (currently the Regional Department of Environmental Monitoring of the Chief Inspectorate for Environmental Protection) [28,29]. This database contains data on all types of emissions from the voivodship, including emissions from residential heating (SNAP0202), transport (SNAP07), agriculture (SNAP10) and industry (SNAP0201, SNAP01, SNAP03, SNAP04). Inventories took into account the activity of sources. Due to the fact that the above database has been created continuously since 2012, data contained therein can be considered of a good quality. The database was additionally validated with annual model calculations [30].
In the calculations, an indispensable element is capturing the temporal and spatial variability of the emission field, because such changes together with the variability of meteorological conditions practically determine the final distribution of pollution concentrations in the studied area. Considering the temporal variability of emissions can also capture the cases of high concentration episodes and link them to the types of emissions responsible for poor air quality. Therefore, the concentration calculations were implemented in an emission model, which includes primarily variations dependent on changes in meteorological conditions (e.g., temperature for emissions from residential heating and precipitation for emissions from transport, agriculture) or the mode of source operation. This methodology was used, among others, in modeling air quality for the needs of annual air quality assessments in the Lower Silesian Voivodship [29]. The results of the calculations obtained in the context of the balance of specific sources in PM2.5 and PM10 emissions in Bogatynia commune are presented in Figure 4.
The performed analyses show that Turów power complex, particularly the mine, has the largest share in the total PM10 emission in Bogatynia commune. In the case of PM2.5 emissions, the communal and household sector is clearly the main source of emissions in the studied area. While emissions from household sources, or from transport, can be considered a seasonal variable (heating and post-heating season, daily and weekly transport cycle) and of a quasi-uniform nature, the emission associated with industrial sources may be characterized by short-term changes and be dependent on a number of factors resulting from, e.g., technology, specificity of the sources or a specific mode of operation of an industrial installation. Therefore, considering the impact of industrial sources on air quality, it was necessary to build an emission model dedicated to the examined facility (in this case, ELT), which was presented in the report on the environmental impact of the KWBT [23].
In the case of the ELT power plant, organized emissions resulting mainly from the boiler operating conditions were taken into account. In addition, in the case of ELT, fugitive emission sources were considered, i.e., combustion waste buffer area, where ash from boilers is temporarily stored before being mixed with overburden in an open pit. This happens when it cannot be collected by the mine (KWBT). Emissions for this source were determined on the basis of United States Environmental Protection Agency (US-EPA) emission factors adapted to the characteristics of the source in terms of quantity and quality of the stored material, including machine operation [23]. Examples of emission values included in the calculation scenarios are presented in Table 2.
In the case of KWBT, four basic groups of emission sources were identified: emissions related to the mining process, storage and reloading of coal, transport and entrainment of material from exposed surfaces. The emissions related to the mining process covered the exploitation area (northern part of the open pit) and the backfilling area (southern part of the open pit). It was assumed that the volume of emissions from the exploitation area compared to the backfilling area would be significantly lower due to the quarried material, which is very moist and heavy. In the backfilling area, the quarried material is much more volatile because it consists mainly of overburden loam and ash from power plant boilers. Emissions related to storage and reloading concerned a coal bin located in the north of the facility. In the area of the bin, there are two trenches in which higher quality coal is deposited and two coal sales points—wholesale and retail. In addition to emissions from coal loading and unloading, emissions associated with wind entrainment are an important factor in this case. The last group is formed by emissions related to transport, both through belt conveyors and through vehicles and railways (wholesale and retail). The emission model for the mine was based on indicators determined with reverse modeling, US-EPA methodologies, considering the specificity of meteorological conditions and mineral material mined and backfilled in the open pit, and the time of operation of the machines [23,30]. Examples of emission values included in the calculation scenarios are presented in Table 3.
The last group of data is information on emissions from Czechia and Germany from the emission inventory posted on the public websites of the Czech Hydrometeorological Institute and the German Ministry of the Environment [31,32]. In Germany, the inventory included sources related to residential heating (SNAP 0202) and SNAP 07 road transport (also SNAP 08 other transport), and the total emission of PM10 and PM2.5 was 44.6 Mg. For Czechia, the data concerned industry (SNAP01, SNAP03, SNAP04), residential heating (SNAP0202) and road transport (SNAP07). Total emissions in the studied area are around 182 Mg for PM10 and 169 Mg for PM2.5.

3.1.2. Validation of Modeling Results in the Base Year

The obtained calculation results were validated using the available measurement data from measuring stations located in Poland, Czechia and Germany (Figure 3, Table 2). The stations were selected based on the availability of results in publicly available databases (e.g., AIRBASE, EEA European Air Quality Portal, JPOAT via the Air Quality Portal of the Chief Inspectorate for Environmental Protection). It was also assumed that the completeness of the measurement series must meet the requirements of the CAFE directive [1]. Ultimately, the analysis included measurements from six stations: four in Poland (Wyszków, Jasna Góra, Bogatynia, Działoszyn), one in Czechia (Frýdlant) and one in Germany (Zittau), the location of which is shown in Figure 5. Three of the selected stations located in Poland belong to the measurement network of ELT, and the station in Działoszyn is included in the network of the State Environmental Monitoring (SEM) run by the Chief Inspectorate of Environmental Protection under the national code DSDzialoszyn. The stations in Zittau and Frýdlant are national stations of the German and Czech networks.
The relative error rate of the modeling result in relation to the measurement was the basic measure of the correctness of the results of model calculations. According to the CAFE directive, this parameter for particulate matter (including PM10 and PM2.5) should not exceed 50% for annual mean values [1]. Negative values indicate an underestimation of concentrations.
The values obtained as a result of the comparison allowed us to determine the uncertainty of the model (relative errors) and are listed in Table 4. In most cases, the uncertainty of the model did not exceed 13%. The highest compliance was obtained at the station in Bogatynia (for both PM10 and PM2.5) and at stations in Zittau and Frýdlant, where the relative errors did not exceed 5%. The highest 32% underestimation of results was obtained at the station in Działoszyn. At the same time, it can be stated that a match of results was much better for PM2.5 concentrations than for PM10.

3.1.3. Emission Change Scenarios

The assessment of the effectiveness of planned long-term actions or ad hoc measures limiting the emission of pollutants is carried out, among others, through changes in the emission introduced into the model, activity of sources and through a possible modification of the original assumptions regarding, e.g., operating mode or frequency of preventive measures used. These changes may concern both the volume of emission loads and the modification of time variations. Then, based on the new emission values, re-calculations were made, assuming no changes for the remaining emission data and/or meteorological parameters. This study discusses three scenarios for emission changes. The first scenario is related to changes in the volume of emissions from the mine, indicated in the report on the mine’s Environmental Impact Assessment [23]. The second scenario evaluates the effectiveness of implementing the anti-smog resolution in force in the Lower Silesian Voivodship, which will result in a deep modification in the profile of residential heat sources [11]. The last scenario is an assessment of the implementation of both previously mentioned scenarios. The data included in the calculations for the three assumed scenarios are summarized in Table 5.
As a result of the analyses presented in the report on the environmental impact of the mine [23], in order to avoid a significant impact of the object on the neighboring areas, it was necessary to indicate possible additional mitigation measures (Table 6).
In addition, in 2019, a new ash conveyor was created directly from the power plant to the open pit, which will eliminate the impact of the storage area. It was estimated that, as a result of the implemented measures, the total emissions from the mine will be reduced from 935.4 Mg by approximately 44% for PM10 and from 363.6 Mg by approximately 43% for PM2.5 and will be 521.5 Mg and 207.9 Mg, respectively.
Another important change in the emission characteristics of the commune is the implementation of the anti-smog resolution, according to which, by 2028, boilers of a class lower than 5 will not be operating in the entire Lower Silesian Voivodship. Within the voivodship, it is allowed to burn solid fuels in devices from which “particulate matter emissions do not exceed the emission threshold values set out in Commission Regulation (EU) 2015/1189 of 28 April 2015 implementing Directive 2009/125/EC of the European Parliament and of the Council with regard to ecodesign requirements for solid fuel boilers” [12]. The implementation of the resolution is estimated to result in around a 95% reduction in dust pollution. Total PM10 emissions are to be reduced from 452.8 to around 19 Mg and PM2.5 from 394.3 to 18.1 Mg. The values of emission totals and the scale of emission reduction were estimated on the basis of an emission database from a detailed inventory of emissions prepared for annual air quality assessments carried out until 2017 by the Voivodship Inspectorate for Environmental Protection in Wrocław (currently the Regional Department of Environmental Monitoring of CIEP). This database contains, among others, information on surfaces heated using old-type boilers fed with coal and wood.

3.2. Health Risk Assessment

The health risk assessment associated with long-term (annual) PM2.5 exposure for the analyzed scenarios was performed using the dose–response function and relative risk index (RR (95% CI) = 1.062 (1.040–1.083) for every 10 µg/m3) [33,34].
The crucial element of health risk assessment for the analyzed area was accurate mapping of the exposure of the population at risk. For this reason, the health assessment was performed for each of the separated areas adopted as the air quality model grid, based on obtained results of the level of annual mean PM2.5 concentration and demographic indicators assigned to the model grid (Figure 6). The number of exposed people and the number of deaths classified by causes were determined on the basis of data from official statistics with a division of the population into age groups [35]. For more detailed analysis, data from spatial distribution were used, considering the current administrative division of the country according to Nomenclature of Territorial Units for Statistics (NUTS) level 5 and the state register of administrative borders [36,37,38,39]. For this purpose, among others, the dasymetric map of population density developed by the European Environment Agency—raster layer “Population density grid of EU-27+, version 4 and 5”—was used. The dasymetric map and population density were corrected in line with the current land use information. To verify the population in the model grid, the National Official Register of the Territorial Division of the Country was used with the distinction of towns with district rights, urban, rural and urban-rural communes as well as towns and rural areas in urban-rural communes.
The analyses were performed for the baseline condition without considering emission reduction scenarios and for each scenario separately. The results are presented both in the form of the estimated number of premature deaths related to the exposure of the general population to PM2.5 and relative changes in the impact assessment for each scenario.

4. Results

4.1. Meteorological Conditions in the Base Year

On the basis of calculations made with the WRF/CALMET model, the analysis of meteorological conditions significantly affecting the dispersion of pollutants in 2018 was performed (Figure 7, Figure 8, Figure 9, Figure 10, Figure 11, Figure 12, Figure 13, Figure 14 and Figure 15). Both spatial variability of selected parameters per year and monthly variability were discussed based on selected locations—Bogatynia (the largest city in the commune), Sieniawka (located in the southwest of the examined area) and Działoszyn (located in the north of the examined area).
Wind as a parameter shaping the rate and direction of the pollution spread is one of the most important parameters for the dispersion process. With complex terrain, it can be highly variable, and when dealing with such a specific object as a deep open-pit mine, it is necessary to include it in the model as a field variable in space. This is clearly marked when analyzing the prevailing wind directions, where a significant change in the air flow occurs in the area of the open pit and, while the wind is southern for the most part of the area, in the pit, it changes direction to the west or east. The significant dynamics of the dominant wind direction can also be seen in the depression in which Zittau and Hrádek nad Nisou are located, where in 2018, winds from the western sector prevailed.
The calculations show that the wind field in the analyzed area is characterized by variability of annual mean speeds in the range of 3.8 to 4.4 m/s. The highest speeds (above 4.2 m/s) characterize the northwest and southeast parts of the analyzed area (Figure 7). Reduced wind speeds are characteristic of the valley areas (around Bogatynia, as well as Zittau and Hrádek nad Nisou).
Based on the hourly wind speeds and directions, annual wind roses were prepared for selected grids within meteorological domains representing the following cities: Bogatynia, Sieniawka and Działoszyn (Figure 8). The obtained calculation results indicate that, in 2018 in Bogatynia, winds from the southern sector (19%) definitely dominated; the highest speeds were also recorded in this sector. In Sieniawka, the share of winds from the southern sector was also the largest (13%), but the share of winds from the NW and WNW sectors was also significant (around 10% per year). In Działoszyn, apart from southern winds (13%), there was a large share of SSW winds (11%). Only in Działoszyn, the share of winds from the direction in which KWBT is located (in this case, the southern sector) was significant. The highest amount of calm winds was recorded in Bogatynia (1.8%); in other cities, this value was around 1%.
In the case of the analysis of wind speed values, higher values of monthly mean wind speeds (except for the summer months, i.e., June–August) were observed in Bogatynia than in Działoszyn and Sieniawka (Figure 9). According to the distribution of monthly mean wind speeds in 2018, higher wind speeds (above 5 m/s) occur in the autumn and winter months (October, January, November, and December). The spring–summer period (May–August) was characterized by lower wind speeds (below 3.5 m/s).
On the other hand, the classification of wind speeds for selected grids from the studied area shows that the most frequently occurring were the winds with speeds in the 3–5 m/s range (30.5–38.1%), referred to as mild winds (Figure 10). Weak winds, i.e., 1.5–3 m/s, and winds with speeds above 5 m/s occurred with similar frequency in all towns (around 21%–27%). In Bogatynia, more than 1% of winds with very high speeds >10.8 m/s were observed. In 2018, wind speeds less than 1.5 m/s occurred in 9.9% of cases in Działoszyn, 11% in Sieniawka and 12.6% in Bogatynia.
According to the Climate Monitoring Bulletin of Poland, published annually by the Institute of Meteorology and Water Management, 2018 has been classified as an extremely warm year [40,41]. The analyses show that the annual mean air temperature in 2018 in the studied area varied from around 9 °C to over 10 °C, while in most of the area, it was around 9.5 °C. Temperatures above 10 °C occurred in the northern part of KWBT and in the vicinity of ELT and in the northwest of the area (Figure 11). The coldest month in 2018 and the only one with the average temperature below 0 °C was February (around −4 °C). March was also quite cool (monthly mean around 0 °C) (Figure 12). The month with the highest mean (>20 °C) was August. At the same time, from April to October, monthly mean temperatures were above 10 °C. The characteristics of monthly mean temperatures indicate that the Bogatynia and Działoszyn regions are thermally similar, while the Sieniawka area is slightly cooler.
The Pasquill atmospheric stability classes, which describe the vertical air turbulence associated with temperature gradient and wind speed, are very important parameters for the dispersion of pollution. The model adopts six stability classes (PGT1–PGT6). Classes 1 and 2 are unfavorable for the dispersion of pollutants due to the fact that the trail of exhaust gases rises and falls due to intense turbulence. Classes 5 and 6, in which inverse conditions occur, are very unfavorable; the pollutants remain in the given area at low altitudes because they have no conditions for dispersion. The incidence of individual classes was determined for the towns of Sieniawka, Działoszyn and Bogatynia (Figure 13). The calculations show that, in the vicinity of the towns in question, in 2018, the most common was the atmospheric stability class 4, which represents neutral conditions (around or over 50% of cases). Class 1, defined as extremely unstable conditions, was very rare (less than 1% of cases). However, unfavorable classes 5 and 6 occurred in a total of around 21–30% cases during the year, most often in Sieniawka.
The year of 2018 was a dry year, which is also confirmed by the spatial distribution of the annual total precipitation in the area (Figure 14). Such conditions adversely affect the rise of dust pollutants, which, in the case of a large-scale object such as a mine, may contribute to the occurrence of high concentrations. In 2018, the annual rainfall totals in the studied area ranged from around 600 (in the west in the area of the Nysa Łużycka Valley) to 800 mm (in the east in the area of the Izera Mountains). The analysis of the annual rainfall totals in selected locations indicates a relatively small variability: from around 590 mm in Sieniawka to around 620 mm in Bogatynia and Działoszyn. The analysis of the variability of precipitation in 2018 shows that the lowest rainfall occurred in February and November—below 10 mm—while the highest was measured in June and December (77–97 mm) (Figure 15). In Sieniawka, high rainfall was noted also in January, where the total was around 30 mm higher than in Bogatynia and Działoszyn. For the remaining period of the year, rainfall totals in Sieniawka were slightly lower than for Bogatynia and Działoszyn, especially in May and June. In the remaining months of the year, the differences in the total precipitation between individual towns did not exceed 10 mm.

4.2. The Results of Air Quality Modeling

Human health protection is the main criterion for air quality assessment. This study focuses on the analysis of long-term effects; therefore, the values of annual mean concentrations of PM10 and PM2.5 were assessed, with limit levels of 40 µg/m3 and 25 µg/m3, respectively. The assessment of changes resulting from the implementation of individual scenarios is presented as a relative difference.
Additionally, the shares of the main particulate matter emission sources in concentrations in two selected profiles of different emission nature were analyzed for scenarios 1 and 2. The first profile, around 40 km long, running from Działoszyn through Zatonie to Hrádek nad Nisou, clearly shows the impact of the energy complex. The second profile, around 26 km long, running from Olbersdorf through Zittau, Bogatynia and Hermanice to Frydlant, reflects the characteristics of the concentration field associated with emissions from household heating.

4.2.1. Annual Mean PM10 Concentrations

The obtained results show that, in the year of diagnosis, the annual mean PM10 concentration practically in the entire analyzed area did not exceed the limit value (Figure 16). The area located near the ash storage area, where maximum concentrations reached over 100 µg/m3, was the exception. However, this area is located outside built-up areas, within a forest complex, so its range is limited. High concentrations also occur within the open pit, which is justified by the industrial characteristics of the area. Within the settlement area, the annual mean concentrations of PM10 are in the range of 18–26 µg/m3 (45–65% of the permissible level). The highest concentrations in built-up areas occurred in Bogatynia and reached 34 µg/m3 (85% of the permissible level). The lowest concentrations in the studied area occurred in its northwestern and southeastern regions (in elevated areas, marked in dark green).
The model calculations show that the implementation of corrective actions discussed in scenario 1 (Figure 16b) regarding the power complex facilities results in a maximum 70% reduction in concentrations nearby ash storage area. The greatest effectiveness is expected in the immediate vicinity of the ash stockyard (area marked with an arrow). Within a radius of 4 km from the main emission sources, a maximum reduction of 5% can be expected. The greatest effectiveness of actions in development areas is expected in the districts of Bogatynia–Zatonie (30–40%) and Trzciniec (10–15%), but also in Sieniawka (5–10%) and on the German side in the cities of Hirschfelde and Drausendorf and in eastern areas of Zittau (5–10%).
On the other hand, of the analyses carried out for activities indicated in scenario 2, they will be most effective in built-up areas (Figure 16c). In Bogatynia, as much as 20–40% decrease in annual mean PM10 concentrations is estimated. In larger cities, concentrations will fall by around 10–20%, and, in the remaining areas, the change will not exceed 5–10%.
The best effect was obtained for the compilation of scenarios 1 and 2, which is scenario 3 (Figure 16d), in which case at least a 10% decrease in concentrations can be expected basically in the entire analyzed area within the Polish borders. A small impact on the decrease in concentrations on the Czech and German side may, however, prove that the impact of both the energy complex and local emissions associated with the combustion of fuels in household heating devices is very limited.
Analyzing the share of emission sources in the annual mean PM10 concentrations in the profile between Działoszyn and Hrádek nad Nisou (Figure 17), it can be concluded that the inflow of pollutants from outside the computational domain has a very significant share, which is estimated at around 16 µg/m3 basically along the entire length of the profile. The concentrations related to household heating, which are clearly marked only on the Polish side of the border, are also an important component of the profile. The closer the sources of the power complex, the more significant the increase in their share; however, their range of influence is very limited (a few km). In the immediate vicinity of the ash storage area, its share is similar to the share of the inflow. The impact of KWBT is practically limited to industrial areas and may be associated with local high concentrations, even exceeding the target values. At the same time, it is clear that individual operations (transshipment at a coal yard, dumping or mining) have a significant impact basically in the place of their performance.
The implementation of the measures from scenario 1 will result in a very large decrease in concentrations, and so air quality standards will be met throughout the entire length of the analyzed profile (Figure 18). In this case, the most important factor shaping the air quality in the studied area will be the inflow of pollution. The impact of the power complex will be comparable to the current impact of emissions from household heating.
In the profile from Olbersdorf to Frydlant, the inflow of pollutants from outside of the studied area has the largest share in annual mean PM10 concentrations (Figure 19), similar to the profile analyzed earlier. However, in Poland, emissions related to household heating also have a very high share in concentration. This is particularly evident in Bogatynia, where concentrations from this type of emission can reach up to 12 µg/m3. Transport is the third most important group of sources in the studied profile (maximum annual mean PM10 concentrations reach up to around 3 µg/m3). The impact of the mine is relatively small, and it is significant only within the open pit (mining). At the same time, there are no exceedances of air quality standards virtually along the entire length of the profile.
The implementation of the anti-smog resolution will practically eliminate the impact of emissions from household heating, which will result in a significant reduction in the concentrations associated with it. This is clearly marked on the analyzed profile (Figure 20).

4.2.2. Annual Mean PM2.5 Concentrations

The results of the conducted model tests indicate that the lowest values of the annual mean PM2.5 concentration occurred in the eastern part of the area, where they do not exceed 14 µg/m3 (56% of the limit value) (Figure 21a). In the central part of the area, concentrations remain in the range of 14–16 µg/m3. Outside the industrial area, the highest annual mean PM2.5 concentrations occur in Bogatynia, where they reach around 23 µg/m3 (92% of the limit value). In other locations in the studied area, higher annual mean concentrations of PM2.5 were also recorded in Trzciniec Dolny (84% of the limit value), Zatonie (79% of the limit value), Sieniawka (76% of the limit value) and Działoszyn (70% of the limit value).
Minimizing measures implemented in scenario 1 will locally (nearby ash storage area) result in a maximum 75% reduction in annual mean PM2.5 concentrations (Figure 21b). However, the range of maximum reductions is smaller than it was in the case of PM10, which is due to the nature of the dust associated with the emitters of the power complex (in particular, KWBT and ash storage area). Emissions from this type of facility primarily concern mineral dust with larger fractions and lower volatility. The greatest efficiency is expected in the immediate vicinity of the ash storage area. Within a radius of 1.5 km from the main sources, a maximum reduction of 5% can be expected. Analyzing the development areas, the direct significant impact of the application of the measures resulting from scenario 1 can only be seen in Zatonie and Trzciniec.
The implementation of scenario 2 will result in similar reductions in PM2.5 concentrations, as in the case of PM10, but the reduction range is greater (Figure 21c).
As in the case of PM2.5, the best effect was obtained for scenario 3: a 10% reduction in concentration values was obtained practically throughout the entire analyzed area within the Polish borders (Figure 21d).
In the profile between Działoszyn and Hrádek nad Nisou (Figure 22), there are no exceedances of air quality standards set for annual mean concentrations of PM2.5. Analyzing the shares of emission sources, it can be stated that, also in the case of this pollution, the inflow of pollutants from outside the computational domain has a very significant share, which is estimated at around 13 µg/m3 on the entire length of the profile. An important component of the profile is also concentrations related to household heating. As the sources of the power complex approach, their share increases, and the impact is much smaller than it was in the case of PM10.
The emission reduction related to the implementation of scenario 1 will significantly reduce the annual mean concentrations of PM2.5 and the share of concentrations from local emissions will be lower than the concentrations from inflow (Figure 23). The impact of emissions related to the ash storage area will practically disappear and the impact of emissions from the mine will be limited to its area. The largest share of local emissions in concentrations will be associated with the impact of local heating sources.
In the profile between Olbersdorf and Frydlant, the annual mean concentration of PM2.5 also has the most significant share of pollution (Figure 24). Locally, however, in Bogatynia, there is a very large share of emissions associated with household heating systems. The concentrations in Bogatynia are approaching the limit value, but they do not exceed it. Other local sources (also emissions related to KWBT) are much less important.
The implementation of the anti-smog resolution in the examined area will practically result in a very large reduction of local emissions and thus its impact on the formation of air quality in the examined area (Figure 25). The more significant impact of KWBT is practically limited to the open-pit area, but its share is similar to the share of emissions from local transport.

4.3. Assessment of the Effectiveness of the Implementation of Various Scenarios Based on the Results of Health Risk Analyses

The obtained results of health risk assessment analyses indicate the 6% general improvement in air quality from the implementation of scenario 1 (all activities specified for the mine) in the entire commune leads to the reduction of health effects by nearly 5%. This confirms that the mine itself has a negligible impact on the health of residents (current estimated health impact—base scenario—is approximately 7%; see Table 7).
A completely different situation is observed in the case of scenario 2 (introduction of provisions resulting from the implementation of regional measures, i.e., anti-smog resolution). A noticeable decrease of over 7% in the level of pollution in the commune when implementing scenario 2 causes over a two-fold higher (14.4%) decrease in health risk (premature deaths).
Both abovementioned scenarios can be implemented independently and simultaneously by separate units based on their competence (mine authorities and local government). The implementation of both scenarios together (scenario 3) causes a significantly higher improvement in air quality and reduction in health risk in the studied area (e.g., changes in the values of the weighted population annual average concentration). After implementing the scenario 3 measures in the analyzed area, the 18% decrease in the number of premature deaths can be expected (estimated according to the baseline scenario) when the concentration of average annual particulate matter is reduced by just over 13%.
In each case (scenarios), the spatial distribution of health effects reduction changes is not regular (Figure 26, Figure 27 and Figure 28). The analysis of the obtained results of premature death changes distribution for the areas of the commune shows little impact on the populated area for scenario 1, where in the vast majority of areas (nearly 73% of the area), the observed changes do not exceed 5% (Figure 26). Despite this, in this scenario, there are close to 1% areas with over 30% improvement in health. Generally, in 7% of areas, the number of premature deaths is reduced by at least 15%.
The situation looks much better with the implementation of scenario 2 (Figure 27). For this scenario, a decrease in the number of premature deaths associated with long-term exposure to PM2.5 lower than 5% is already observed in nearly 58% of areas. An improvement in health—that is, at least a 15% reduction in premature deaths—has already been noticed in 12% of areas.
Implementation of scenarios 1 and 2 at the same time remains the most effective and health-promoting solution (for scenario 3, see Figure 28). Assessment results for scenario 3 show that only in 25% of the areas, the improvement in health is less than 5%, while a reduction in premature deaths of over 15% is observed almost in 33% of the commune’s area.

5. Summary and Final Conclusions

Mathematical modeling is one of the tools whose application within the air quality management system is crucial. Commonly, mathematical models apply, among others, when developing plans and programs of corrective actions aimed at achieving and/or maintaining air quality at an appropriate level; analyses of the effectiveness of implementing specific solutions; analyses of the impact of air pollution on various elements of the environment, including human health; air quality forecasting, considering changes in the activity of emission sources and meteorological conditions, and providing the public and decision-makers with adequate information. In the case of modeling systems, it is important that the input data used in the analyses (including emission, meteorological and topographic data) are current and accurate. This has a significant impact on the results obtained by modeling and their credibility and representativeness. An important element of this type of analysis is the assessment of discrepancies in the results of model calculations, including the relative error rate of the modeling result in relation to the results of measurements made at measuring stations using devices compatible with or equivalent to the reference method specified for a given pollutant. This type of procedure was undertaken as part of the work in which the selected case study was the area of the commune in Poland, whose character was considered unique and complex due to the geographical location and diversity of the terrain and the functioning energy complex. Analyses were carried out considering the defined activities for three emission reduction scenarios: (1) scenario related to changes in emissions in the analyzed mine resulting from the minimizing measures indicated in the report on the mine’s environmental impact, (2) scenario resulting from the “anti-smog” resolution in force in the Lower Silesian Voivodship and (3) scenario compiling the abovementioned scenarios. Additionally, to demonstrate the effectiveness of planned preventive and corrective actions taken in the analyzed area, a health risk analysis was performed. All analyses were made considering the changes in the distribution of pollutant concentrations within the boundaries of the commune.
The results of the conducted analyses indicated that the lowest values of the annual mean PM2.5 concentration occurred in the eastern part of the studied area and did not exceed 14 µg/m3 (56% of the limit value). The implementation of activities resulting from the considered scenario 1 will result in a reduction in annual mean concentrations of PM2.5 (maximum 75% in industrial area), mainly due to the maximum reduction in activities carried out within the furnace ash storage area, as well as the construction of a new ash conveyor, thanks to which the storage area will be practically taken out of operation. The achieved range of maximum concentration reduction was smaller than in the case of PM10, which may be due to the nature of the dust associated with the emitters of the energy complex (in particular, KWBT and ash storage area). Emissions from this type of facility primarily concern mineral dust of larger fractions that are transported in the atmosphere to a much lesser extent. The greatest result is expected in the immediate vicinity of the ash storage area. Within a radius of 1.5 km from the main sources, a slight reduction in concentrations, not exceeding 5% of the current state, can be expected. For this reason, actions taken under this scenario do not have a major impact on the health of the surrounding residents.
The performed analyses have shown that the implementation of scenario 2 will result in similar levels of PM2.5 concentration reductions as PM10, but with a much vaster spatial range, which translates into a much higher impact on the population threat related to air quality, with an estimated 14% reduction.
The best effect was obtained for scenario 3, where, in total, the average 10% reduction in concentration values was obtained practically in the entire analyzed area within the borders of the community. Therefore, the implementation of both scenarios seems to be the most effective for limiting the health risk associated with the exposure of residents to particulate matter (estimated health effect reduction is almost 20%). The full implementation of scenario 3 shows that only in 25% of the area was the expected improvement of health lower than 5%. A significant decrease in health risk (more than 15%) was observed in as much as one third of the studied area.
Mathematical modeling as a tool should be disseminated, and the data used in the model should be available not upon special request but due to the obligation to provide access to information on the environmental impact of an installation, plant and/or the group of emitters in a given area.

Author Contributions

Conceptualization, I.S., M.P. and K.S.; methodology, I.S., M.P. and K.S.; software, M.P. and K.S.; validation, I.S., M.P. and K.S.; formal analysis, I.S., M.P., K.S., D.K., M.Z. and K.K.; investigation, I.S., M.P., K.S., D.K., M.Z. and K.K.; writing—original draft preparation, I.S., M.P., K.S., D.K., M.Z. and K.K.; writing—review and editing, I.S., M.P., K.S., D.K., M.Z. and K.K.; visualization, M.P. and K.S.; supervision, I.S. All authors have read and agreed to the published version of the manuscript.

Funding

This work was co-financed within the “Excellent Science” program of the Polish Ministry of Science and Higher Education. Energies 13 04001 i001

Acknowledgments

The authors of the study thank for their cooperation: Anita Kuliś from ONE WAY Anita Kuliś (Zielonka, Poland), Rafał Skorupiński, as well as Milena Gola-Kozak and Dorota Sucholas from PGE Górnictwo i Energetyka Konwencjonalna S.A., Kopalnia Węgla Brunatnego Turów (Bogatynia, Poland).

Conflicts of Interest

The authors declare no conflict of interest. The funders had no role in the design of the study; in the collection, analyses, or interpretation of data; in the writing of the manuscript, or in the decision to publish the results.

References

  1. CAFE Directive. Directive 2008/50/EC of the European Parliament and of the Council of 21 May 2008 on ambient air quality and cleaner air for Europe. Off. J. Eur. Union 2008, L152, 1–44. [Google Scholar]
  2. European Parliament and of the Council. Directive 2004/107/EC of the European Parliament and of the Council of 15 December 2004 relating to arsenic, cadmium, mercury, nickel and polycyclic aromatic hydrocarbons in ambient air. Off. J. Eur. Union 2008, L23, 3–16. [Google Scholar]
  3. Sejm of the Republic of Poland. Act of 27 April 2001—Environmental Protection Law (Announcement of the Marshal of the Sejm of the Republic of Poland of 19 July 2019 regarding the publication of a uniform text of the Act—Environmental Protection Law. J. Laws 2019, 1396, 1–155. (In Polish) [Google Scholar]
  4. Polish Minister of the Environment. Regulation of the Polish Minister of the Environment of 24 August 2012 on the levels of certain substances in the air. J. Laws 2012, 1031, 1–9. (In Polish) [Google Scholar]
  5. Air Quality in Europe—2019 Report, European Environment Agency, Copenhagen 2019. Available online: https://www.eea.europa.eu/publications/air-quality-in-europe-2019 (accessed on 6 May 2020).
  6. Polish Minister of the Environment. Regulation of the Polish Minister of the Environment of 24 August 2012. of 8 October 2019 changing the regulation on the levels of certain substances in the air. J. Laws 2019, 1931, 1. (In Polish) [Google Scholar]
  7. Kobus, D.; Iwanek, J.; Skotak, K. Assessment of Air Quality in the Zones in Poland for 2018, Commissioned by the Polish Chief Inspectorate of Environmental Protection by the Institute of Environmental Protection—National Research Institute; Polish Chief Inspectorate of Environmental Protection: Warsaw, Poland, 2018. (In Polish)
  8. Sówka, I.; Kobus, D.; Skotak, K.; Zathey, M.W.; Merenda, B.; Paciorek, M. Assessment of the health risk related to air pollution in selected Polish health resorts. J. Ecol. Eng. 2019, 20, 132–145. [Google Scholar] [CrossRef]
  9. Lower Silesian Regional Assembly. Resolution No. XLI/1407/17/of the Lower Silesian Regional Assembly of 30 November 2017 regarding the introduction of restrictions and bans on operation of fuel-burning installations in the Lower Silesian Voivodship, with the exception of the Municipality of Wrocław and health resorts. Low. Sil. Voiv. J. Laws 2017, 5155, 1–2. (In Polish) [Google Scholar]
  10. Lower Silesian Regional Assembly. Resolution No. XLI/1406/17/of the Lower Silesian Regional Assembly of 30 November 2017 regarding the introduction of restrictions and bans on operation of fuel-burning installations in the area of health resorts in the Lower Silesian Voivodship. Low. Sil. Voiv. J. Laws 2017, 5154, 1–3. (In Polish) [Google Scholar]
  11. Lower Silesian Regional Assembly. Resolution No. XLI/1405/17/of the Lower Silesian Regional Assembly of 30 November 2017 regarding the introduction of restrictions and bans on operation of fuel-burning installations in the area of the Municipality of Wrocław. Low. Sil. Voiv. J. Laws 2017, 5153, 1–3. (In Polish) [Google Scholar]
  12. EU Commission. EU Commission Regulation 2015/1189 of 28 April 2015 on the implementation of Directive 2009/125/EC of the European Parliament and of the Council with regard to ecodesign requirements for solid fuel boilers. Off. J. Eur. Union 2015, L193, 100–114. [Google Scholar]
  13. Witamy na Stronie Internetowej KOBiZE. Available online: https://www.kobize.pl/ (accessed on 6 May 2020).
  14. KOBIZE. Krajowy Bilans Emisji SO2, NOX, CO, NH3, NMLZO, Pyłów, Metali Ciężkich i TZO za Lata 2015–2017 w Układzie Klasyfikacji SNAP; Raport Syntetyczny: Warsaw, Poland, 2019. (In Polish) [Google Scholar]
  15. Kobus, D.; Nych, A.; Sówka, I. Analysis of PM10 high concentration episodes in Warsaw, Krakow and Wroclaw in the years 2005–2017 with application of selected elements of information systems. E3S Web Conf. 2018, 44, 70. [Google Scholar] [CrossRef] [Green Version]
  16. Fine Dust in the Atmosphere. Compendium of Knowledge about Air Pollution with Particulate Matter in Poland. Available online: https://www.gios.gov.pl/images/aktualnosci/Pyly_drobne_w_atmosferze.Kompendium_wiedzy.pdf (accessed on 6 May 2020).
  17. Polish Minister of the Environment. Regulation of the Polish Minister of the Environment of 8 August 2018 on the assessment of the levels of certain substances in ambient air. J. Laws 2018, 1119, 1–25. (In Polish) [Google Scholar]
  18. Minister of the Environment. The Polish State Environmental Monitoring Program for the Years 2016–2020; Chief Inspector of Environmental Protection: Warsaw, Poland, 2015. (In Polish)
  19. The Application of Models under the European Union’s Air Quality Directive: A Technical Reference Guide, EEA Technical Report No 10/2011. Available online: https://www.eea.europa.eu/publications/fairmode (accessed on 6 May 2020).
  20. Blagojević, M.; Papić, M.; Vujičić, M.; Šućurović, M. Artificial neural network model for predicting air pollution. Case study of the Moravica district, Serbia. Environ. Prot. Eng. 2018, 44, 129–139. [Google Scholar]
  21. Exponent Engineering and Scientific Consulting. Available online: http://www.src.com/ (accessed on 6 May 2020).
  22. The Weather Research & Forecasting Model. Available online: https://www.mmm.ucar.edu/weather-research-and-forecasting-model (accessed on 6 May 2020).
  23. PGE GIEK S.A. Oddział KWB Turów. Kontynuacja Eksploatacji Złoża Węgla Brunatnego Turów, Raport o Oddziaływaniu na Środowisko (Report on the Environmental Impact, Codified Version); Reference Number WOOŚ. 4235.1.2015. MS; PGE GIEK S.A. Oddział KWB Turów: Bogatynia, Poland, 2019. (In Polish) [Google Scholar]
  24. SRTM 90m Digital Elevation Database v4.1. Available online: https://cgiarcsi.community/data/srtm-90m-digital-elevation-database-v4-1/ (accessed on 6 May 2020).
  25. CORINE Land Cover. Available online: https://land.copernicus.eu/pan-european/corine-land-cover (accessed on 6 May 2020).
  26. ArcGIS 10 Tutorial. Available online: https://www.esri.com (accessed on 6 May 2020).
  27. Global Forecasts of Aerosol. Available online: https://atmosphere.copernicus.eu/catalogue#/ (accessed on 6 May 2020).
  28. Assessment of Air Quality in the Lower Silesian Voivodship in 2017, Provincial Environmental Protection Inspectorate in Wrocław. Available online: https://www.wroclaw.pios.gov.pl/pliki/powietrze/ocena_roczna_2017.pdf (accessed on 6 May 2020). (In Polish)
  29. Uwaga! Informujemy, że Wszystkie Aktualne Oceny Stanu Środowiska od 2019 r. Znajdują sie na Stronie Głównego Inspektoratu Ochrony Środowiska. Available online: https://www.wroclaw.pios.gov.pl/index.php?dzial=monitoring&pod=powietrze&pod2=oceny (accessed on 6 May 2020).
  30. Compilation of Air Pollutant Emission Factors, 13.2.4 Aggregate Handling And Storage Piles (US-EPA). Available online: https://www3.epa.gov/ttn/chief/ap42/ch13/final/c13s0204.pdf (accessed on 6 May 2020).
  31. Cesky Hydrometeorologicky Ustav. Available online: http://portal.chmi.cz/historicka-data/ovzdusi (accessed on 6 May 2020).
  32. Stoffeintrage Diffuser Quellen in Die Luft. Available online: https://diffuse-quellen.de/diffuse-quellen/map.html?type=luft (accessed on 6 May 2020).
  33. Health Risks of Air Pollution in Europe—HRAPIE Project Recommendations for Concentration–Response Functions for Cost–Benefit Analysis of Particulate Matter, Ozone and Nitrogen Dioxide; World Health Organization: Geneva, Switzerland, 2013. Available online: https://www.euro.who.int/__data/assets/pdf_file/0006/238956/Health_risks_air_pollution_HRAPIE_project.pdf?ua=238951 (accessed on 6 May 2020).
  34. Review of Evidence on Health Aspects of Air Pollution (REVIHAAP); Technical Report; WHO Regional Office for Europe: Copenhagen, Denmark, 2013; Available online: https://www.euro.who.int/en/health-topics/environment-and-health/air-quality/publications/2013/review-of-evidence-on-health-aspects-of-air-pollution-revihaap-project-final-technical-report (accessed on 6 May 2020).
  35. GUS. Available online: https://bdl.stat.gov.pl/BDL/start (accessed on 6 May 2020).
  36. Geostatistics Portal. Available online: https://geo.stat.gov.pl/imap/ (accessed on 6 May 2020).
  37. Historia Klasyfikacji NUTS. Available online: https://stat.gov.pl/statystyka-regionalna/jednostki-terytorialne/klasyfikacja-nuts/historia-klasyfikacji-nuts/ (accessed on 6 May 2020).
  38. Dane z Państwowego Rejestru Granic i Powierzchni Jednostek Podziałów Terytorialnych Kraju—PRG. Available online: http://www.gugik.gov.pl/pzgik/dane-bez-oplat/dane-z-panstwowego-rejestru-granic-i-powierzchni-jednostek-podzialow-terytorialnych-kraju-prg (accessed on 6 May 2020).
  39. Zmieniona Organizacja Pracy Rejestru TERYT. Available online: http://eteryt.stat.gov.pl/eTeryt/rejestr_teryt/aktualnosci/aktualnosci.aspx (accessed on 6 May 2020).
  40. Polish Climate Monitoring Newsletter; Institute of Meteorology and Water Management—National Research Institute: Warsaw, Poland, 2018; Available online: https://klimat.imgw.pl/pl/biuletyn-monitoring (accessed on 6 May 2020).
  41. Biuletyn Monitoringu Klimatu Polski PSHM IMGW-PIB. Available online: http://klimat.pogodynka.pl/pl/biuletyn-monitoring/ (accessed on 6 May 2020).
Figure 1. Natural topography in Bogatynia area (source: own study).
Energies 13 04001 g001
Figure 2. The analyzed area (source: own study).
Energies 13 04001 g002
Figure 3. Parametrization of grids and receptors in the model: (a) meteorological grid; (b) discrete receptors (source: own study; map background: https://www.google.pl/maps).
Energies 13 04001 g003
Figure 4. Particulate matter emissions for different emission sources inventoried in Bogatynia commune (source: own study).
Energies 13 04001 g004
Figure 5. Location of measuring stations (source: own study).
Energies 13 04001 g005
Figure 6. Map of the population density distribution (source: own study).
Energies 13 04001 g006
Figure 7. Spatial distribution of annual mean speeds and dominant wind direction determined by the WRF/CALMET model in 2018 (source: own study).
Energies 13 04001 g007
Figure 8. The distribution of wind directions and wind speeds determined by the WRF/CALMET model in the meshes of the meteorological grid corresponding to the location of selected towns in 2018 (Source: Own study): (a) Bogatynia, (b) Sieniawka, (c) Działoszyn.
Energies 13 04001 g008aEnergies 13 04001 g008b
Figure 9. Monthly mean wind speeds determined by the WRF/CALMET model in selected towns in 2018 (source: own study).
Energies 13 04001 g009
Figure 10. The frequency of wind speeds in specific ranges in selected towns in 2018 (source: own study).
Energies 13 04001 g010
Figure 11. Spatial distribution of annual mean air temperature values determined by WRF/CALMET in 2018 (source: own study).
Energies 13 04001 g011
Figure 12. The course of the monthly mean air temperature determined by the WRF/CALMET model in selected towns in 2018 (source: own study).
Energies 13 04001 g012
Figure 13. Share of the Pasquill atmospheric stability classes determined by the WRF/CALMET model in selected towns in 2018 (source: own study).
Energies 13 04001 g013
Figure 14. Spatial distribution of annual precipitation determined by the WRF/CALMET model in 2018 (source: own study).
Energies 13 04001 g014
Figure 15. Monthly precipitation totals determined by the WRF/CALMET model in selected towns in 2018 (source: own study).
Energies 13 04001 g015
Figure 16. Annual mean PM10 concentrations in 2018: modeled values and relative differences for the analyzed scenarios (source: own study): (a) in 2018, (b) relative difference for scenario 1, (c) relative difference for scenario 2, (d) relative difference for scenario 3.
Energies 13 04001 g016
Figure 17. Profile of annual mean concentrations of PM10 between Działoszyn and Hrádek nad Nisou, considering the shares of individual source groups in 2018 (source: own study).
Energies 13 04001 g017
Figure 18. Profile of annual mean concentrations of PM10 between Działoszyn and Hrádek nad Nisou, considering the shares of individual source groups for scenario 1 (source: own study).
Energies 13 04001 g018
Figure 19. Profile of annual mean concentrations of PM10 between Działoszyn and Hrádek nad Nisou, considering the shares of individual source groups in 2018 (source: own study).
Energies 13 04001 g019
Figure 20. Profile of annual mean concentrations of PM10 between Olbersdorf and Frydlant, considering the shares of individual source groups in scenario 2 (source: own study).
Energies 13 04001 g020
Figure 21. PM2.5 annual mean concentrations in 2018: modeled values and relative differences for the analyzed scenarios (source: own study): (a) in 2018, (b) relative difference for scenario 1, (c) relative difference for scenario 2, (d) relative difference for scenario 3.
Energies 13 04001 g021
Figure 22. Profile of annual mean concentrations of PM2.5 between Działoszyn and Hrádek nad Nisou, considering the shares of individual source groups in 2018 (source: own study).
Energies 13 04001 g022
Figure 23. Profile of annual mean concentrations of PM2.5 between Działoszyn and Hrádek nad Nisou, considering the shares of individual source groups for scenario 1 (source: own study).
Energies 13 04001 g023
Figure 24. Profile of annual mean concentrations of PM2.5 between Olbersdorf and Frydlant, considering the shares of individual source groups in 2018 (source: own study).
Energies 13 04001 g024
Figure 25. Profile of annual mean concentrations of PM2.5 between Olbersdorf and Frydlant, considering the shares of individual source groups in scenario 2 (source: own study).
Energies 13 04001 g025
Figure 26. Spatial distribution of relative changes (reductions) in the number of premature deaths for scenario 1 relative to the baseline scenario.
Energies 13 04001 g026
Figure 27. Spatial distribution of relative changes (reductions) in the number of premature deaths for scenario 2 relative to the baseline scenario.
Energies 13 04001 g027
Figure 28. Spatial distribution of relative changes (reductions) in the number of premature deaths for scenario 3 relative to the baseline scenario.
Energies 13 04001 g028
Table 1. Examples of the use of modeling techniques at various levels for the purposes of achieving the main objectives of air quality management with particular emphasis on the area of Poland.
Purpose of ActivitiesInternational LevelNational LevelRegional LevelLocal Level
Air quality assessment (diagnosis)Analyses regarding air quality in Europe and its impact on health and the mortality rate of society conducted by the European Environment Agency and the cooperating European Topic Centre on Air Pollution, Transport, Noise and Industrial pollution https://www.eea.europa.eu/themes/air
Air quality analyses on a continental and regional scale, developed and published as part of the European CAMS (Copernicus Atmosphere Monitoring Service) project https://atmosphere.copernicus.eu/
Air quality analyses in Europe carried out under the EMEP Programme implemented under the Convention on Long-Range Transboundary Air Pollution (LRTAP) https://emep.int/mscw/mscw_moddata.html
Assessment of air quality carried out as part of the SEM * by CIEP **, including identification and analysis of situations and areas of exceedance in individual zones of the country, e.g., with the use of modeling provided by IEP-NRI *** http://powietrze.gios.gov.pl/pjp/publications/card/19100
Identification of episodes of high concentrations of particulate matter in Poland and neighboring countries, considering the aspect of transboundary pollution transfer
http://powietrze.gios.gov.pl/pjp/publications/card/2052
Analyses of air quality in Poland performed by West and East Meteorological Synthesizing Centers operating under the Convention on Long-Range Transboundary Air Pollution (LRTAP)
https://www.emep.int/mscw/mscw_publications.html
http://en.msceast.org/index.php/publications/reports?id=204
Additional diagnostic analyses performed for the purposes of developing Air Protection Programmes for voivodships (e.g., identification of the share of emission sources)
http://bip.umwd.dolnyslask.pl/dokument,iddok,51944,idmp,293,r,r
Air quality analyses at city level, with impact assessment of specific emission sources.
https://journals.pan.pl/dlibra/show-content?id=102486&
https://laqm.defra.gov.uk/
Impact analysis for specific groups of emission sources, industrial facilities or installations, with health impact assessment
http://life-apis.meteo.uni.wroc.pl/
Programming and designing of activitiesSectoral analyses at European Union level, e.g., emissions control strategy analyses using the GAINS **** model
http://gains.iiasa.ac.at/gains/emissions.EU/index.menu?page=303
Analyses related to the development and implementation of legislative solutions (e.g., EU directives), e.g., Air Quality–Fitness Check of the AAQ Directives ***** conducted by the European Commission
https://ec.europa.eu/environment/air/quality/aqd_fitness_check_en.htm
Sectoral analyses on a national scale
https://bip.mos.gov.pl/strategie-plany-programy/krajowy-program-ograniczania-zanieczyszczenia-powietrza/
https://nfosigw.gov.pl/download/gfx/nfosigw/pl/nfoekspertyzy/858/92/1/2011-160.pdf
https://www.gov.pl/web/aktywa-panstwowe/zaktualizowany-projekt-polityki-energetycznej-polski-do-2040-r
Scenarios and long-term forecasts related to adopting legal and organizational solutions at national level, e.g., implemented at the request of CIEP
http://powietrze.gios.gov.pl/pjp/content/air_quality_forecast_long_term
Development of air protection programs, including scenario analysis and assessment of the effectiveness of corrective actions at the voivodship level.
https://www.mazovia.pl/ekologia-i-srodowisko/ochrona-powietrza/
Analyses related to the development of regional anti-smog resolutions
https://irt.wroc.pl/pliki/ekspertyza_wskazujaca_efekt_ekologiczny_w_dolnoslaskich_uzdrowiskach/index.html
Analyses of local corrective action scenarios
https://bip.um.wroc.pl/artykul/643/25539/ograniczenia-niskiej-emisji-z-indywidualnego-ogrzewania-weglowego-na-terenie-wroclawia-w-latach-2016-2020
Estimating the impact of implementing local policies and programs on air quality (e.g., in commune, city or health resort)
https://bip.um.wroc.pl/artykul/643/25539/ograniczenia-niskiej-emisji-z-indywidualnego-ogrzewania-weglowego-na-terenie-wroclawia-w-latach-2016-2020
Environmental impact assessment of projects, including the potential impact of planned installations on air quality
https://bip.gmstrzelin.finn.pl/res/serwisy/pliki/17237287?version=1.0
Analysis of the effectiveness of designed mechanisms and techniques for reducing air emissions
http://raportyspoleczne.pl/wp-content/uploads/raports/efeb6cc9f3e11a50f68503b53485a5c9.pdf
Estimating the effects of implementing organizational and technological solutions at the city level (e.g., changing the communication system, introducing Intelligent Transport Systems, etc.)
https://its.tychy.pl
Forecasting and informationRegional air quality forecasts published as part of the CAMS project https://atmosphere.copernicus.eu/
Information on air quality in Europe (European Air Quality Index) based on measurement and modeling results (forecasts) implemented by the European Environment Agency
https://airindex.eea.europa.eu/
Current and forecasted air quality information obtained using modeling, made available on an open and commercial basis on the BreezoMeter website
https://breezometer.com/
Short-term air quality forecasts on a national scale performed by the IOŚ-PIB and published by CIEP http://powietrze.gios.gov.pl/pjp/airPollution.Regional air quality forecasts and information services
http://powietrze.podkarpackie.pl/
https://powietrze.malopolska.pl/jakosc-powietrza/
http://powietrze.gios.gov.pl/pjp/airPollution?woj=mazowieckie&rwms=true
Local small-scale air quality forecasts, considering specific conditions of topography, development and arrangement of emission sources
https://air.wroclaw.pios.gov.pl/prognozyhttp://life-apis.meteo.uni.wroc.pl/
http://powietrze.pwr.edu.pl/
https://www.londonair.org.uk
* SEM—State Environmental Monitoring; ** CIEP—Chief Inspectorate of Environmental Protection; *** IEP-NRI—Institute of Environmental Protection—National Research Institute; **** GAINS model —Greenhouse gas—Air pollution INteractions and Synergies model; ***** AAQ Directives - EU Ambient Air Quality Directives
Table 2. PM10 and PM2.5 emission from ELT in 2018.
Emission SourcesPM10
(Mg/Year)
PM2.5
(Mg/Year)
Point source emitters375.6194.7
Fugitive emission60.323.8
Table 3. PM10 and PM2.5 emission from ELT in 2018 by sector (on the basis of [23,30]).
Emission SourcesPM10
(Mg/Year)
PM2.5
(Mg/Year)
Mining47.712.4
Backfilling860.90344.36
Coal bin with a coal transfer point22.935.94
Coal sorting area0.110.03
Retail point of sales area0.00070.0002
Wheeled transport3.730.9
Total935.37363.63
Table 4. Annual mean concentrations of PM10 and PM2.5 modeling results and measurement.
Monitoring Station NameParameterMeasurement (µg/m3)Model (µg/m3)Relative Error (%)
Wyszków (ELT station)PM10 year20.8418.70−10
PM2.5 year15.5214.77−5
Jasna Góra, ul. Sportowa (ELT Station)PM10 24 h36.5431.89−13
PM10 year22.5819.83−12
Bogatynia, ul. Chopina (ELT station)PM10 year30.2030.150
PM2.5 year20.7520.61−1
Działoszyn/DSDzialoszyn (SEM station)PM10 year28.9319.81−32
Zittau (DE)PM10 year21.7022.654
Frýdlant (CZ)PM10 year18.017.4−3
Table 5. Emission for individual sources included in the calculations for individual scenarios.
Emission SourcePM10 (Mg/Year)PM2.5 (Mg/Year)PM10 (Mg/Year)PM2.5 (Mg/Year)PM10 (Mg/Year)PM2.5 (Mg/Year)
Scenario 1Scenario 2Scenario 3
KWBT521.51207.88935.37363.63521.51207.88
ELT435.3218.49435.3218.49435.3218.49
Household heating452.8349.31918.11918.1
Road transport104.3934.34104.3934.34104.3934.34
Oth. industry0.560.280.560.280.560.28
Czechia and Germany226.8213.65226.8213.65226.8213.65
Total1741.361023.941721.42848.491307.56692.74
Table 6. Measures to minimize the impact of KWBT on air quality in Bogatynia commune (on the basis of [23]).
ActionLocation of ActionEffectiveness of Action
Spraying of working levels (water cannons)Open-pit area (backfilling and operation area)Up to 60%
Securing the top of the backfill area, which will be backfilled again or redepositedThe open-pit regionDepending on the degree of land cover (reduction of emissions to 100%)
Organization of work control system depending on weather conditionsOpen-pit area and coal bin20–100%
Housing of selected sections of conveyor belts with particular emphasis on ash linesOpen-pit area and coal binUp to 70–85%
Water mist installations in transfer nodesOpen-pit area and coal binUp to 90%
Limiting the height of free falling of dusting materialOpen-pit area and coal binDepending on the degree of reduction, e.g., reduction of height by 50%; reduction of emissions by around 60%
Building on selected transfer node Coal bin100%
Windscreen assemblyCoal bin70–80%
Sprinkling of technical roadsCoal bin/transportUp to 60%
Regular road washingCoal bin/transport50%
Reduction of car traffic on the “coal road” by 50%Coal bin/transport40–50%
Reducing brown coal sales including liquidation of sales to domestic retail customersCoal bin/retail saleUp to 90%
Table 7. PM2.5 concentration and related premature deaths calculated for emission scenarios.
ScenarioAnnual Mean PM2.5 ConcentrationEstimated Total Number of Premature Deaths (95% CI)
Arithmetic Average
(95% CI)
Population Weighted Average
(µg/m3)(µg/m3)-
Baseline scenario17.1 (10.4:23.9)19.3122.2 (78.8:163.6)
Including the mine’s influence1.01 (−2.1:4.1)1.49.0 (5.8:12.0)
Scenario 1(16.1 19.8)18.3116.2 (75.0:155.6)
Scenario 215.9 (9.7:22.0)16.5104.6 (67.5:140.1)
Scenario 314.9 (12.8: 16.9)15.598.6 (63.6:132.0)

