Article

Maintenance Management through Intelligent Asset Management Platforms (IAMP). Emerging Factors, Key Impact Areas and Data Models

by
Adolfo Crespo Marquez
*,
Juan Francisco Gomez Fernandez
,
Pablo Martínez-Galán Fernández
and
Antonio Guillen Lopez
Department of Industrial Management, School of Engineering, University of Seville, 41092 Seville, Spain
*
Author to whom correspondence should be addressed.
Energies 2020, 13(15), 3762; https://doi.org/10.3390/en13153762
Submission received: 7 May 2020 / Revised: 13 July 2020 / Accepted: 15 July 2020 / Published: 22 July 2020
(This article belongs to the Special Issue Advances in Maintenance Management)

Abstract

:
Maintenance Management is a key pillar in companies, especially energy utilities, which have high investments in assets, and so for its proper contribution has to be integrated and aligned with other departments in order to conserve the asset value and guarantee the services. In this line, Intelligent Assets Management Platforms (IAMP) are defined as software platforms to collect and analyze data from industrial assets. They are based on the use of digital technologies in industry. Beside the fact that monitoring and managing assets over the internet is gaining ground, this paper states that the IAMPs should also support a much better balanced and more strategic view in existing asset management and concretely in maintenance management. The real transformation can be achieved if these platforms help to understand business priorities in work and investments. In this paper, we first discuss about the factors explaining IAMP growth, then we explain the importance of considering, well in advance, those managerial aspects of the problem, for proper investments and suitable digital transformation through the adoption and use of IAMPs. A case study in the energy sector is presented to map, or to identify, those platform modules and Apps providing important value-added features to existing asset management practices. Later, attention is paid to the methodology used to develop the Apps’ data models from a maintenance point of view. To illustrate this point, a methodology for the development of the asset criticality analysis process data model is proposed. Finally, the paper includes conclusions of the work and relevant literature to this research.

1. Introduction

Nowadays, companies are focused on acquiring or developing Asset Management Platforms instead of individual Computerized Management Systems (CMMS), mainly in the network utilities sector with high capital investment on assets. These types of companies (providing Oil and Gas, Telecommunications, water, electricity, etc.) have a crucial objective to conserve assets as best as possible, but specially in the more critical assets (with more value for the business). In order to make effective decisions about these assets, the maintenance management of network utilities should take into account a multitude of input data of different natures, such as:
  • The aggregate historical data of management, planning, and costs,
  • The real-time status of equipment and its use, using alarms, thresholds and degradation patterns, and
  • The predictions derived from reliability studies.
Electricity network utilities have thousands of assets dispersed among several geographic areas, which suffer diverse operational and environmental changes [1]. These configurational changes have to be collected and processed in order to evaluate the asset states. Without a proper management framework standardization in their analysis and correspondent decisions, managers could misalign with the company objectives, deriving tailor-made managerial behaviors for each area and set of conditions. In addition, consensus among these area managers, for instance about budget decisions, could be difficult to reach.
Intelligent asset management platforms are software platforms to collect and analyze data from industrial assets, and these are conceived mainly from the energy sector (Oil and Gas, and Electricity) to solve previous issues [2].
This is the main reason for our study; from the observed Intelligent Assets Management Platforms (IAMP) solutions in different energy network utility companies, there are three basic scenarios: Some assuming developed solutions from asset providers [3], others developing tailor-made solutions internally [4], and others, more recently, where the developments are supported over big data intelligent solutions configured over cloud IT solutions [5]. The similarity in concept application and compatibility with new assets or among systems is very difficult to maintain and only with enormous cost effort periodically. In this paper, the basic structure according to international standards is analyzed in order to guide these systems’ developments in the energy sector.
Based on recollected definitions of Cloud Computing [6], they could be defined as cloud-based PaaS (Platform as a Service: A class of cloud computing services that supplies a platform supporting the development, running, and management of applications for asset management) providing a standard way to connect sensing elements, instruments, and other devices together with computers’ industrial applications and people. This connectivity easily allows data collection from different devices, exchange and subsequent data analysis, providing an unprecedented improvement in asset performance management (APM) and optimization of operations. The APM market has been around for more than a decade, but the vendor community has recently doubled its R&D [7], which is now boosting growth rates. The growing maturity of communications infrastructure at industrial sites supports broader APM adoption, as does a wave of new CEOs launching digital transformation strategies.
A main advantage of a PaaS environment is that software developers don’t have to worry about some of the lower-level details of the environment. You can consider a software stack as a pyramid [6,8].
As shown in Figure 1, the pyramid is divided into the following three levels:
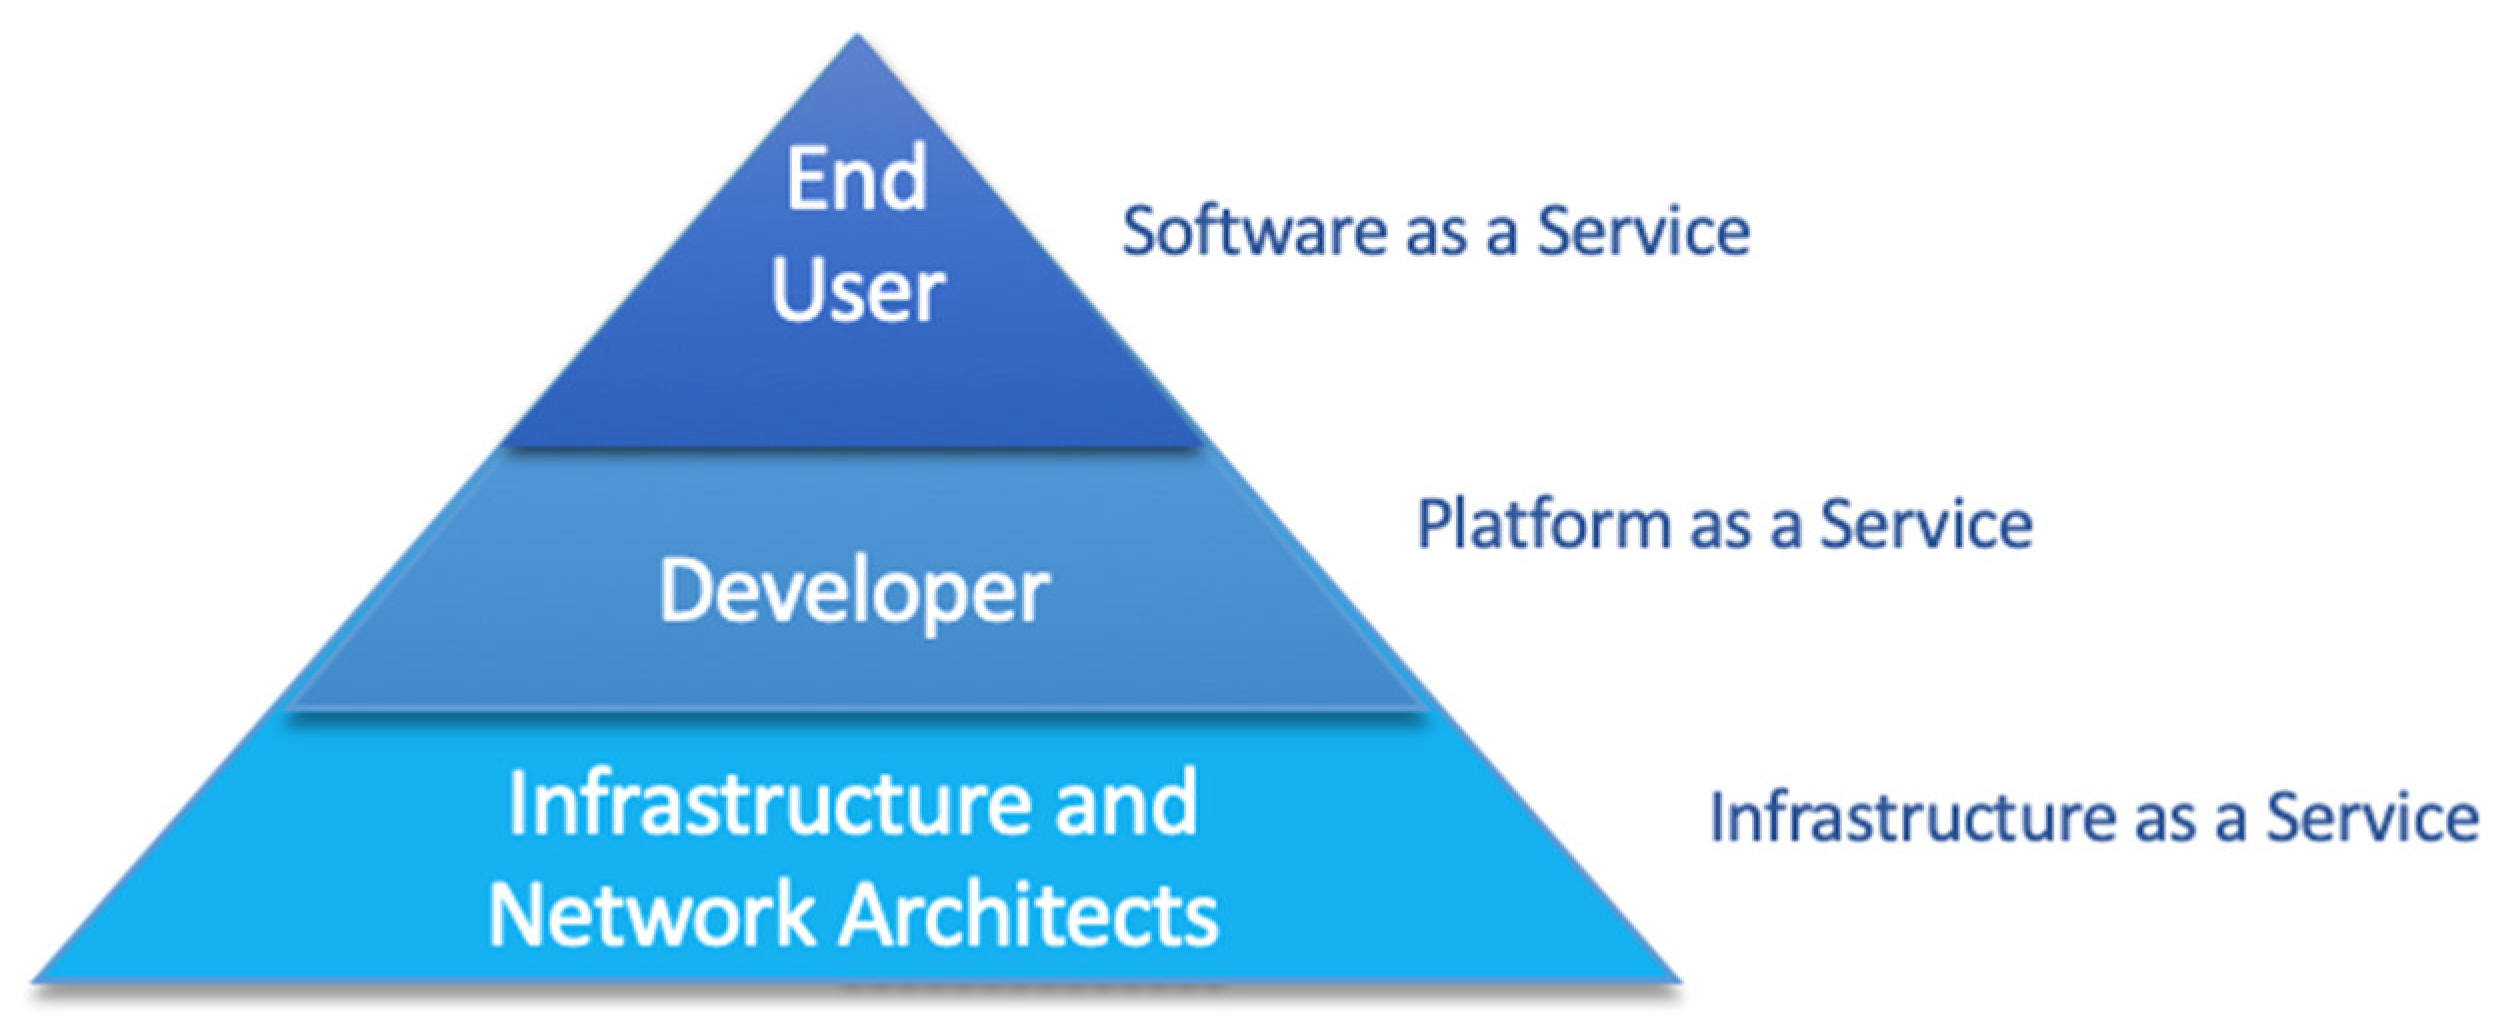
  • Infrastructure as a service (IaaS): It is located at the lowest level of the pyramid and contains, among other capabilities, the operating systems, networks and storage.
  • Platform as a service (PaaS): It is located at the medium level and includes services related to the development and implementation of applications.
  • Software as a service (SaaS): It is located at the top of the pyramid and represents the applications (Apps) provided to end users.
The Apps provided, by different industrial and IT vendors, to end users in the SaaS level of the pyramid are structured according to principles of software hierarchy design [9], as presented in Figure 2, developed by the authors. Normally, an IAMP commercial name encompasses “everything needed” for “digital asset management”. Examples of these names are: GE’s Predix, SAP’s IAM or SIEMENS’ MindSphere. Under the umbrella of this commercial name, the software is structured as follows:
  • In the first level, the M number of modules can be found, each one referring to different domains within asset management. These modules are inter-dependent, in fact, their interrelation can be crucial. Examples of modules are: Reliability module, health module, strategy module, etc.
  • In the second level, each module contains Apps that will have different purposes according to the scope of the specific decision-making process that they support. For instance, Apps will be found dealing with the hierarchy of assets, with the analysis of recurrent failures, with the design of the maintenance strategies, with the development of Condition-Based Maintenance (CBM) programs, with the assessment of the assets’ health, integrity and their life cycle cost, with the performance and analysis of the maintenance processes and activities, etc.
  • Finally, in the third level, each application contains a data model. The data model serves to configure the databases where the relevant data for the Apps will be stored, with k-level scalability.
The Apps offered to end users by different vendors sit at the top of the software pyramid, and they benefit from the services provided by the platform (basically ETL, data storage and virtual machine services). The main challenge of these SaaS packages is to provide friendly user customization in a comprehensive way, to ensure each module’s sustainably with minimum effort in data acquisition and manipulation. This is solved thanks to the framework described above, which links different data models, correlating data tables structurally, similar to human reasoning, to support the corresponding decision-making processes, without the need to know the complexity of the low-level software. Within this environment, appropriate asset data models are compulsory.
A generic intelligent asset management platform App (IAMP App), for a given decision-making process (for instance, criticality analysis, Reliability-Centered Maintenance (RCM) or CBM analyses), structures the data model to configure the databases where relevant data for the corresponding analysis will be stored (Figure 3). At the same time, the App selects the data sources and properly orders the data extraction, data processing and transformation, according to the corresponding analysis scope (see Figure 3). IAMP Apps may also interact with additional simulation tools and they may add complementary data to the database records with results provided by these software elements. Some functions are facilitated for employing a real-time remote asset diagnosis and prognosis without specific expertise regarding modelling and statistical techniques. These are focused on asset knowledge discovery, creation and storage.
As a general rule, IAMP Apps are provided by vendors together with business intelligent Apps (BI Apps), the BI App is designed for the interaction with the end user and extracts database records to present the information according to the reporting needs and end user requirements, on demand or at the time needed by the business.
The objectives of this research are: First, to explain in detail why different factors are boosting the growth of IAMPs. Second, to identify those asset management areas that could importantly benefit from this platform’s introduction in industry. Last but not least, this paper offers a methodology to understand the data needs of these tools. The “asset data model” results are a key factor for the new platform’s Apps to be sustainable and valuable for businesses.
In the sequel, Section 2 discusses in detail the different factors explaining IAMP growth. Then, Section 3 deals with those key managerial areas that could benefit from proper investments and suitable digital transformation through the adoption and use of IAMPs. In Section 4, a case study is presented to map, or to identify, those platform modules and Apps that provide important value-added features to existing asset management practices. Section 5 is devoted to presenting a methodology to develop the asset data model required for a certain Asset Management (AM) decision-making process. A methodology proof of concept is presented in Section 6, where the asset data model for the asset criticality analysis process is developed in an electricity network utility. Finally, the paper includes conclusions of the work in Section 7 and relevant literature to this research.

2. Factors Driving IAMP Market Growth

The recent report by Verdantix [7] states that the total market spend is expected to grow from $2.3 billion in 2019 to $4.0 billion in 2024. The report states that the forecasted compound annual growth rate of 11.5% will be mainly driven by:
  • The availability of the industrial IoT;
  • New technologies (such as predictive maintenance analytics together with big data);
  • Digital twin simulations.
In this Section, these factors are analyzed to explain their capabilities and the value they add to the IAMPs.

2.1. The Availability of the “Internet of Things” (IoT) Technologies

The adoption and development of advanced “Internet of Things” (IoT) technologies enables important advances of these platforms [10]. The efforts of open membership organizations like The Industrial Internet Consortium (IIC) has promoted the development, implementation and widespread use of interconnected machines and devices and intelligent analytics. Thanks to these types of organizations, many companies are now planning to support the growing IIoT “Industrial Internet of Things” with cloud servers and app stores (application components can be found in a cloud environment, integrated with applications managed in private clouds or in data centers) [11].
IIoT platforms were originated in the form of IoT middleware [12,13], with the intention to serve as an intermediary between the hardware and application layers. Following this idea, powerful IT vendors such as SAP HANA, GE Predix or RFID4U show in their catalogs a structure similar to that proposed in Figure 4. An advantage of IIoT platforms is that they support integration with almost any connected device and blend with third-party applications used by the device. This independence between hardware and software allows a single platform to manage any type of device in the same direct way.
The new IoT platforms introduce a multitude of interesting features. They provide components for front-end and analytics, on-device data processing, and cloud-based deployment. The studies by Mineraud et al. [14], Borgia [15] and Perry [16] pointed out that the following platform characteristics should be taken into account when choosing an IoT platform:
  • Device management: The platform should store a list of all connected devices with the corresponding operating status. In general, an IoT platform will have to manage thousands to millions of devices. To operate with low power consumption, you have to use light communication protocols.
  • Data collection and storage: Storage of device data in the cloud is at a higher level in terms of data volume, variety and speed.
  • Creation of virtual machines: The analysis (in real time, batch, predictive or interactive) of all the data from the sensors connected to the platform provides valuable information.
  • Remote device configuration and control: Managing the configuration is essential to control the performance of the device.
  • Reliability and data safety: The IoT platform must ensure reliability in the most demanding environments. The company’s most critical functions are at stake and the reliability of the platform has to be indisputable.
It is important to highlight the flexibility offered by the best IoT platforms, which allow adding your own industry-specific components and third-party applications. This flexibility avoids significant extra costs and delays due to the adaptation of an IoT platform to a specific industry scenario.

2.2. The Improvements in Big Data Management

In modern APM systems, input data to critical asset management decision-making processes must be collected, evaluated and analyzed with more than remarkable quality for good results [17]. In an organization that has effective asset management that leads to good decision making, we would expect to find:
  • The company identified the data necessary to effectively analyze and manage critical assets, and
  • The company specified the quality standards for the data. Data quality can be specified in terms of many attributes according to ISO 9000: 2015, including:
    Completeness (is all of the data to be collected, or only some of it);
    Accuracy (does the data accurately represent reality—particularly a concern when human data input is required);
    Timeliness (is the data available as and when required);
    Availability (is the data readily available to those using it);
    Consistency (are the same definitions and standards applied across the organization).
The time spent by data scientists in the processing and preparation of data represents almost 80% of their work [18], as shown in Figure 5. This work, which includes the collection, cleaning and organization of data, is undoubtedly the slowest task faced by data analysts.
Data in modern IoT platforms, when dealing with health monitoring and predictive analytics, is stored and processed in a different way because [20]: It has too big of a volume, with very high velocity, high variability, low veracity (high noise) and variety is also high (much diversity). Some examples of analytical functions that big data can perform, thus facilitating data collection and processing, are:
  • Complex aggregation analysis: To process information obtained on different dates or in different locations;
  • Multi-dimensional query and analysis: To analyze and extract asset data from different viewpoints;
  • Log data analysis: To control the asset health during its operation;
  • Time-window-based stream data analysis: To detect trends in operation;
  • Complex event processing: To detect failures before they occur.

2.3. The Emerging Predictive Maintenance Analytics

Although predictive analytics has been well known for years, the development of new technologies has boosted these techniques. Business CEOs increasingly emphasize the importance of predictive analytics and machine learning as it translates into increased profits. A survey conducted in 2016 [21] showed that 69% of business managers or data scientists believed that data analysis was essential to the future of their business. Furthermore, 79% of the respondents considered that predictive or prescriptive maintenance was extreme or very important. This trend has been confirmed over the years, as shown in Figure 6, even becoming increasingly important in recent years [22].
Depending on the desired results and the available input data, different analyses can be performed, as shown in Figure 7 [11]:
  • Baseline analytics is used to detect anomalies, and the data used is usually local to the asset itself when it operates under normal operating conditions.
  • Diagnostic analytics provide very fast results and identify the root cause of the failure, so it requires a prior study of the different states of the failure.
  • Prognostic analytics is generally used to calculate the remaining useful life of a component, requiring a multitude of input data and is not as fast as diagnostic analytics.
Deployment of analytics generally consists of three steps:
  • Training a model for predictive analytics;
  • Testing and validating the model with different data;
  • Implementing the model in a real scenario.
Important efforts must be developed to reach analytic models providing value by improving asset performance. In most of today’s complex engineering assets, despite the existence of well-developed physical models for a component of a system, the complexity that arises from the combination of elements, and often the changes in environmental and operational conditions, make it impractical to characterize a complete system through closed mathematical expressions. As a solution, stochastic models are often used to characterize this type of system.
The application of Artificial Intelligence (AI) and Machine Learning (ML) techniques provide intelligence and flexibility to predictive models and are very valuable for discovering patterns of behavior in the presence of randomness. Both reasons make these techniques increasingly important [23]. In diagnostic analytics, data must be examined to answer the question “Why did it happen?”; techniques such as drill-down, data discovery, data mining and correlations are used to take a deeper look at data to try to understand the causes of failures and behaviors.
In prognostic analytics, data-based approaches are gaining ground, especially when the system is very complex and the development of a model with more accuracy is prohibitive in economic terms. The disadvantages of this approach are that it has a wider confidence interval than other approaches and needs a high amount of data to train the model. Data-based approaches can be divided into fleet-based statistics and sensor-based conditioning. Both include modeling the accumulated damage (or, equivalently, health) and then extrapolating to a threshold of damage (or health) [24], or directly calculating the remaining useful life [25,26,27].

2.4. Digital Twin Simulations

Digital Twin (DT) is understood as the complete physical and functional description of an asset or system, which includes the most relevant information of its life cycle [28]. DT is considered a virtual entity that has the capacity to detect and transmit data from the IoT infrastructure, calculate new data using data analysis and simulation tools, optimize equipment performance and make informed decision making. This improvement in decision-making throughout the life cycle of an asset leads to the possibility of creating applications based on the DTs of physical assets [29].
With the benefit of IoT data, the actual operating conditions can be simulated easily, and very useful information can be obtained quickly. For example, one of the most interesting possibilities is to use simulation to calculate the time that an asset will remain operational. A DT can track its own failures and its own degradation. Using the simulation, the twin can estimate its remaining useful life (RUL), which is very interesting data for maintenance management.

3. Key Managerial Areas to be Supported with the IAMPs

Global companies are always concerned with optimizing investments, prolonging the life of assets with quality and at minimum cost. This increases the importance of AM decisions and associated data.
In addition to considering the advanced technological aspects of the platforms, IAMP can become tools providing very valuable support to the AM process, which must be properly designed and controlled to achieve substantial improvements in management results.
Most of the data that are collected should be used to increase the effectiveness of asset management decision-making. Consequently, the types of asset management decisions and their importance in meeting the organization’s AM objectives need to be identified.
The importance of each reporting requirement associated with a given decision-making process can be estimated by identifying the benefits of better reporting and decision making and the risks associated with poor (non-data-driven) decision making or reporting. To this end, the process to follow could be [30]:
  • Identify the requirements of all key stakeholders with respect to the provision of information.
  • Identify the most critical assets and then select the information that must be taken into account that will lead to effective decision making. Finally, it is necessary to determine what data is needed to get this information. The necessary data could take many different forms, including:
    Data about the assets (themselves, current condition, current level of performance);
    Data relating to the activities that have been performed on the assets (operational activities, maintenance activities and modifications, upgrades or replacements);
    Data about the financial or other impacts if the assets underperform or fail to perform at all;
    Data relating to safety, environmental or other incidents;
    Data relating to expected future asset performance, costs and risks;
    Etc.
  • Identifying the types of decisions that will have the greatest potential impact on the achievement of asset management (and organizational) objectives. The decisions can be made at many different organizational levels, including:
    Strategic Decisions—potentially those with the greatest potential business impact, capital investment and allocation of operating expenditure decisions. Moreover, those decisions for which objective data is most likely to be difficult to obtain and analyze.
    Management Decisions—such as to replace or upgrade an asset to meet specific business needs, about the timing of these major events, also those related to the allocation of working capital (such as for spare parts holdings), decisions relating to whether to insource or outsource particular activities.
    Operational Decisions—involved with short-term control of maintenance and operational activities, these are technical decisions relating to day-to-day operations.
Some experts agree that there has been unequal attention paid to the management and operational areas over the last decades, where many business resources were spent on activities to get the jobs done more efficiently (right hand side of Figure 8, a figure adapted from the Asset Management (AM) decisions and controls of Woodhouse [31]). For instance, master asset registers were created, work management systems and procurement systems were developed, communication with craftsmen were improved. However, it seems that a better balanced and more strategic view is needed (Left hand side of Figure 8), understanding business priorities in work and investments. For instance, simple and robust methods for project evaluation and investment, or to consider life cycle extension prior to reinvestment, are still needed [32].

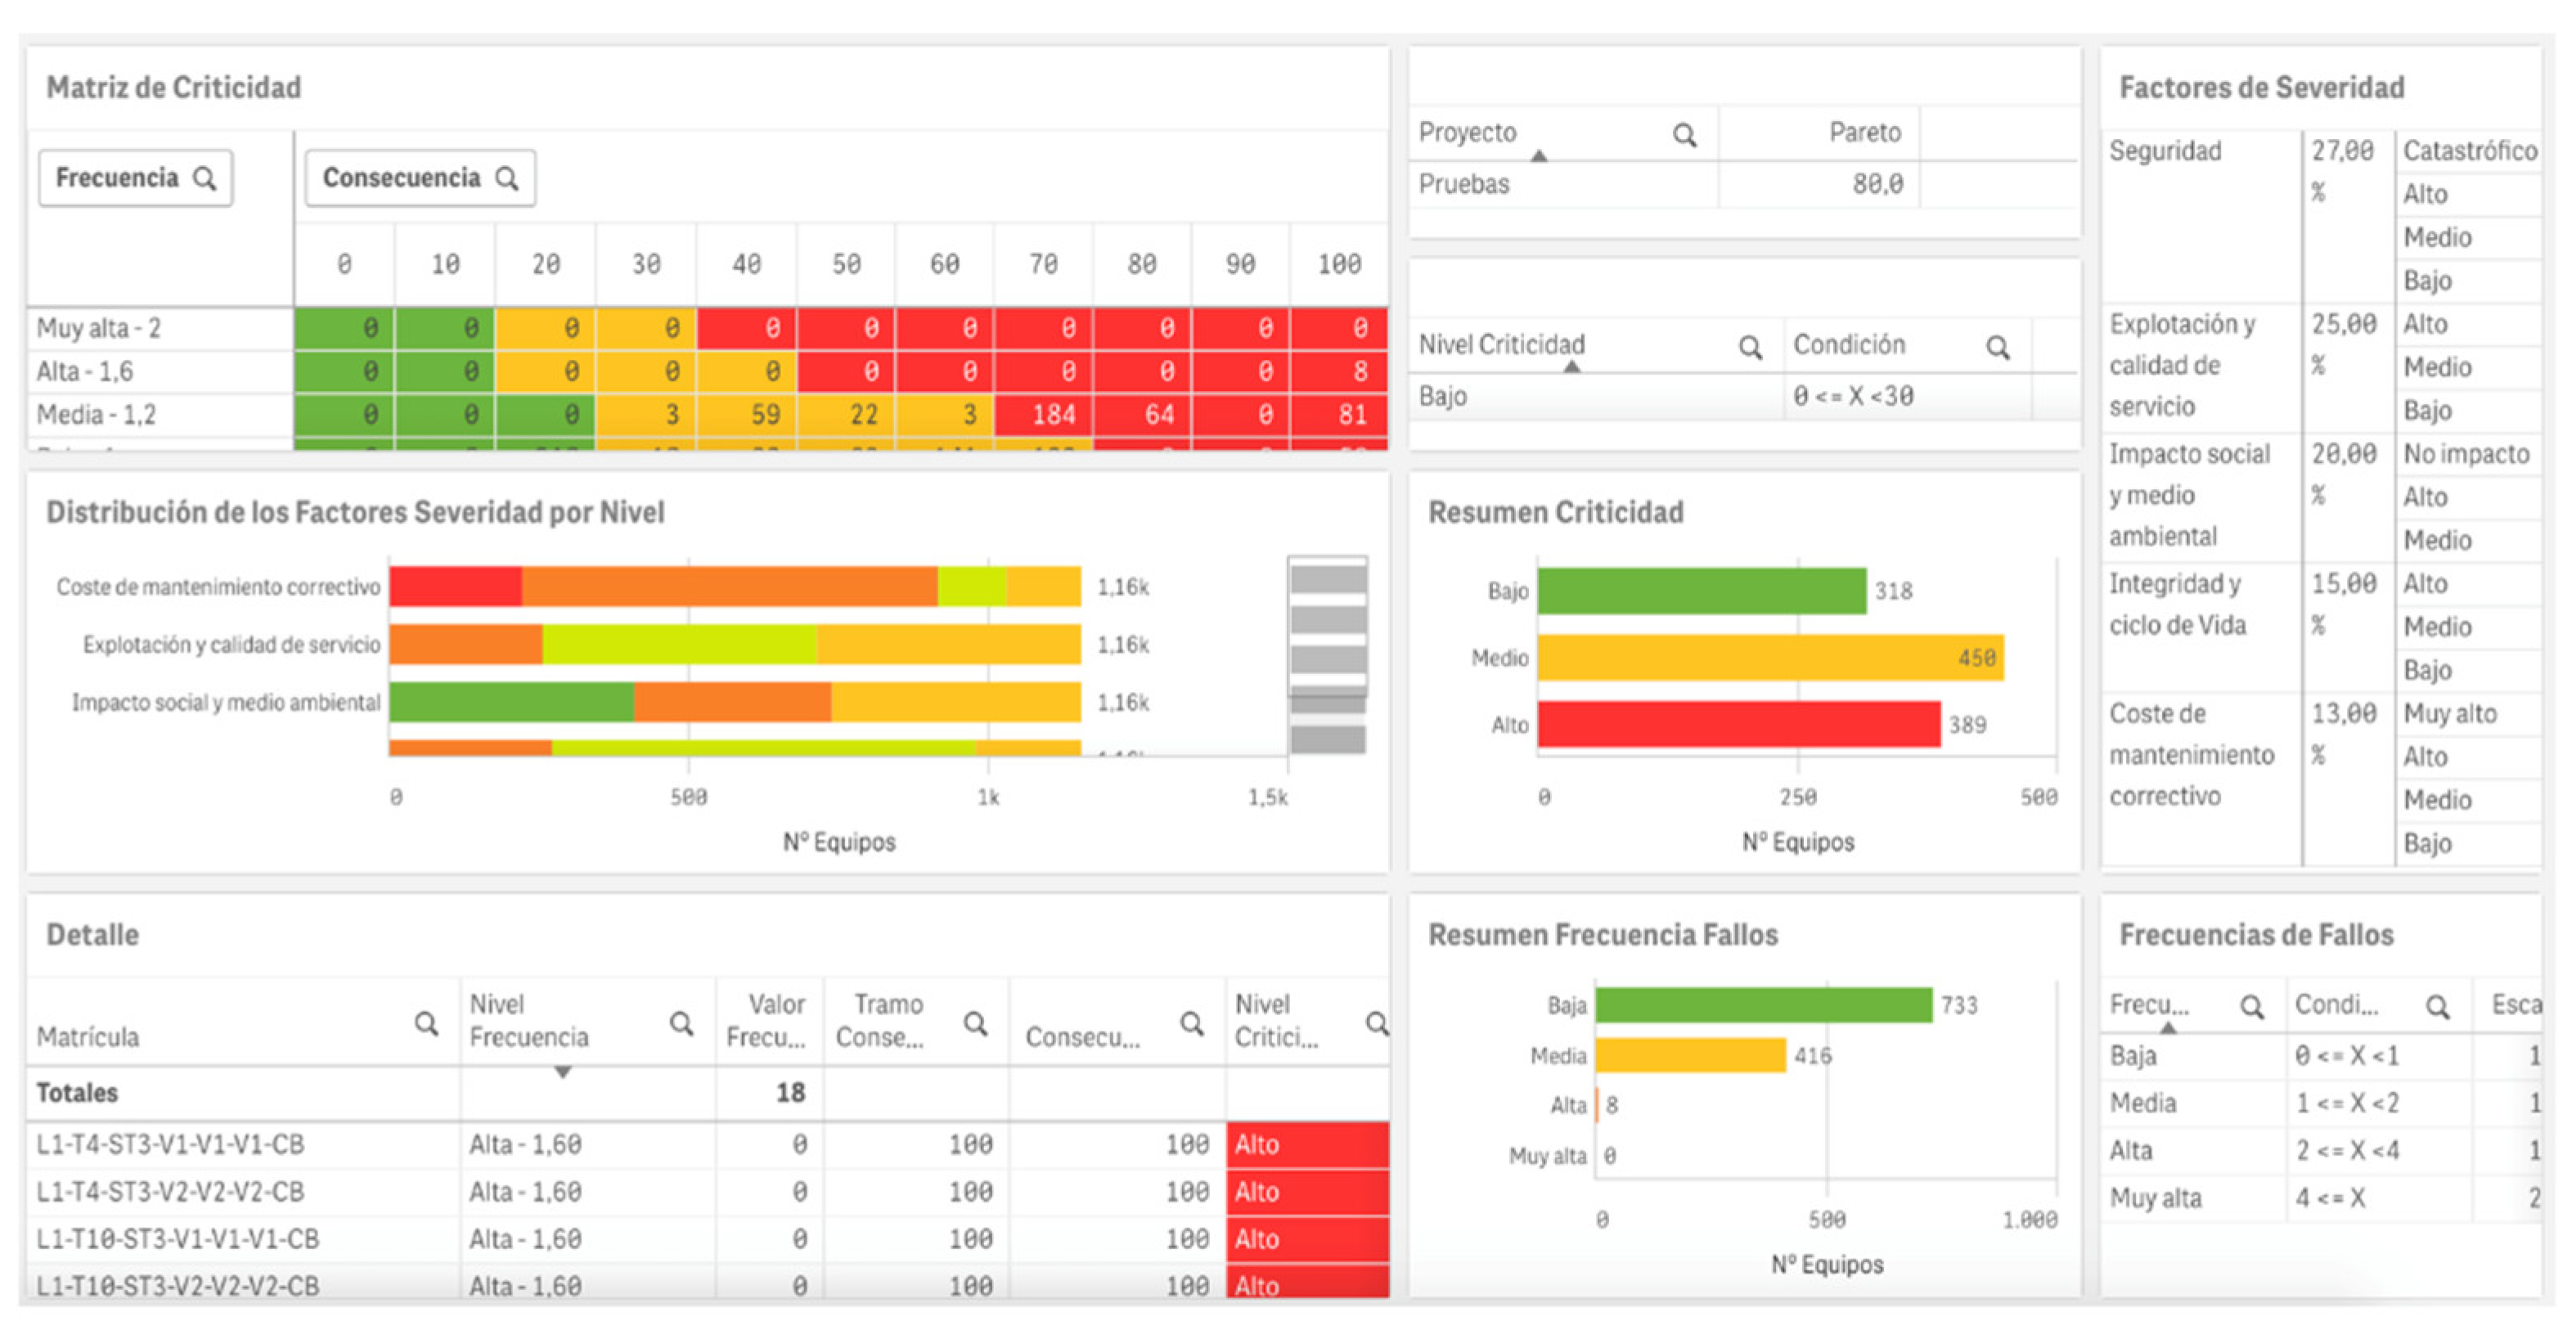
4. Case Study. Analysis of an Industrial Vendor’s IAMP

In this Section of the paper, a review of a well-known OEM software (Predix Platform, General Electric) division product is analyzed. The intention is to identify those Apps in the software that cover the basic AM processes to appreciate how the IAMP is structured and to explore issues related to platform implementation.
Besides reading the information found about the software, provided by the vendor, the authors have had the experience of collaborating in some of this platform’s Apps’ implementation, together with a relevant electrical utility in the north of Spain.
The company had the intention of benefitting from the platform to support the existing AM processes, as presented in the documentation included in their ISO 55001 standard certification. More specifically, the IAMP selected is Predix Platform, developed by GE Digital [33].
In December 2018, GE announced a new company by merging GE Digital with GE Power Digital Solutions and GE Grid Solutions. GE saw a great market opportunity and created the Predix platform, which can connect physical asset data to powerful analytical tools and industrial applications, to improve the performance of assets, reduce costs and develop new services. Predix APM is comprised of Predix Platform-powered SaaS and on-premises Apps with the intention to “increase the reliability and availability of assets while optimizing maintenance costs, minimizing risks and reducing total cost of ownership (TCO)”. The suite works in all OEMs and all industries and covers the full range of industrial asset needs: APM Health, APM Reliability, APM Integrity and APM Strategy.
In Table 1, first column, the basic AM key company business processes are presented. The headings of the next four columns of the table are the names of the Predix platform modules (APM Health, APM Reliability, APM Integrity and APM Strategy). Within those modules in the current platform structure, the Apps that are relevant to support the key AM business processes are identified. The table is therefore a cross reference table, linking AM key processes for the company to the corresponding Predix platform App.

5. A Methodology to Develop Proper Asset Data Models

To ensure the functionality of the Apps, they have to structure the asset data model and configure the databases where all relevant data for the corresponding analysis will be stored. To this end, in this paper, we generalize a framework introduced by Guillen et al. [34]. The referred framework classifies the different natures of the source data required for the AM decision-making process, grouping the data in 5 processing blocks. In that precise paper, which dealt with the data structure for CBM solutions, data elements were grouped as presented in Figure 9.
The proposed framework comprises five blocks. Four of them correspond with maintenance management process blocks (Blocks 1, 2, 4 and 5) and one block of information resources for the processes (Block 3). The sequence of blocks can also be interpreted as the basic process that the user will follow to analyze any CBM solution.
This paper claims that this framework can be easily generalized by changing the terms used in the definition of the last two blocks of the framework, as presented in Figure 9. Where Block 4, comprises the analysis done for a certain asset management process and Block 5, the final AM process decision-making (as in Figure 10).
Through this Block sequence and its conceptual representation in the UML (Unified Modeling Language) class diagram, any AM Apps can be developed with different functionalities, following their concepts and relations as standard and facilitating their computational implementation in a sustainable way.
The key of this data model is to link the physical structure elements and functional logic elements, and identify the parameters required to analyze criticality and to provide accurate support to decisions over different variables/parameters that can offer analysis about their potential influence (severity) in asset business contribution. The pursued results of the framework implementation perform a better problem analysis, collect and incorporate expert knowledge, improve and automate the decision-making and increase the value of decisions as continuous improvement.

6. Methodology Proof of Concept: Data Model for a Criticality Analysis App

Criticality analysis (CA) is understood as the methodology that allows the establishment of a hierarchy of the assets of a company, creating a structure that facilitates making successful and effective decisions. Specifically, in the energy industry, this analysis takes on special importance. Asset management in the energy sector is focused on assets, therefore it is key to have all the assets of a company hierarchized. This hierarchy allows companies to withdraw resources from less important assets and put maximum resources into the most critical assets, which can cause serious problems for the company.
A process to rank the hierarchy of electrical network assets according to criticality was presented by Crespo et al. [3]. To this end, a Criticality Analysis App could be offered to an end customer. The App would support the CA process, which is designed to be applied to a massive number of assets (over 200,000 power lines in our example), and would need to be re-elaborated every six months for a proper asset criticality tracking. The question is: How can a data model, for this business process purpose, be elaborated?
Proceeding according to the previous Section and to the original work [34], a detailed representation of the data model proposed for this criticality analysis, using a UML class diagram, is presented in Figure 11.
In a UML diagram, classes of entities are in rectangles, linked to include information related to each other. This link includes an expression on the triangle that describes the specific role that entity class plays in an association (aggregation, composition and reflexive associations), and at both ends a number indicating the number of instances of a class related to one instance of the other class (that is, 0. *—zero to any number) [35]. This schema allows a comprehensive view of the data structure, elements and blocks, and the relationships among them. The reader can appreciate the data requirements and the way the relationships among data elements are structured.
Figure 11 illustrates the relationship among data that is required for the criticality analysis; through this figure, the link to the experimental process and data can be illustrated:
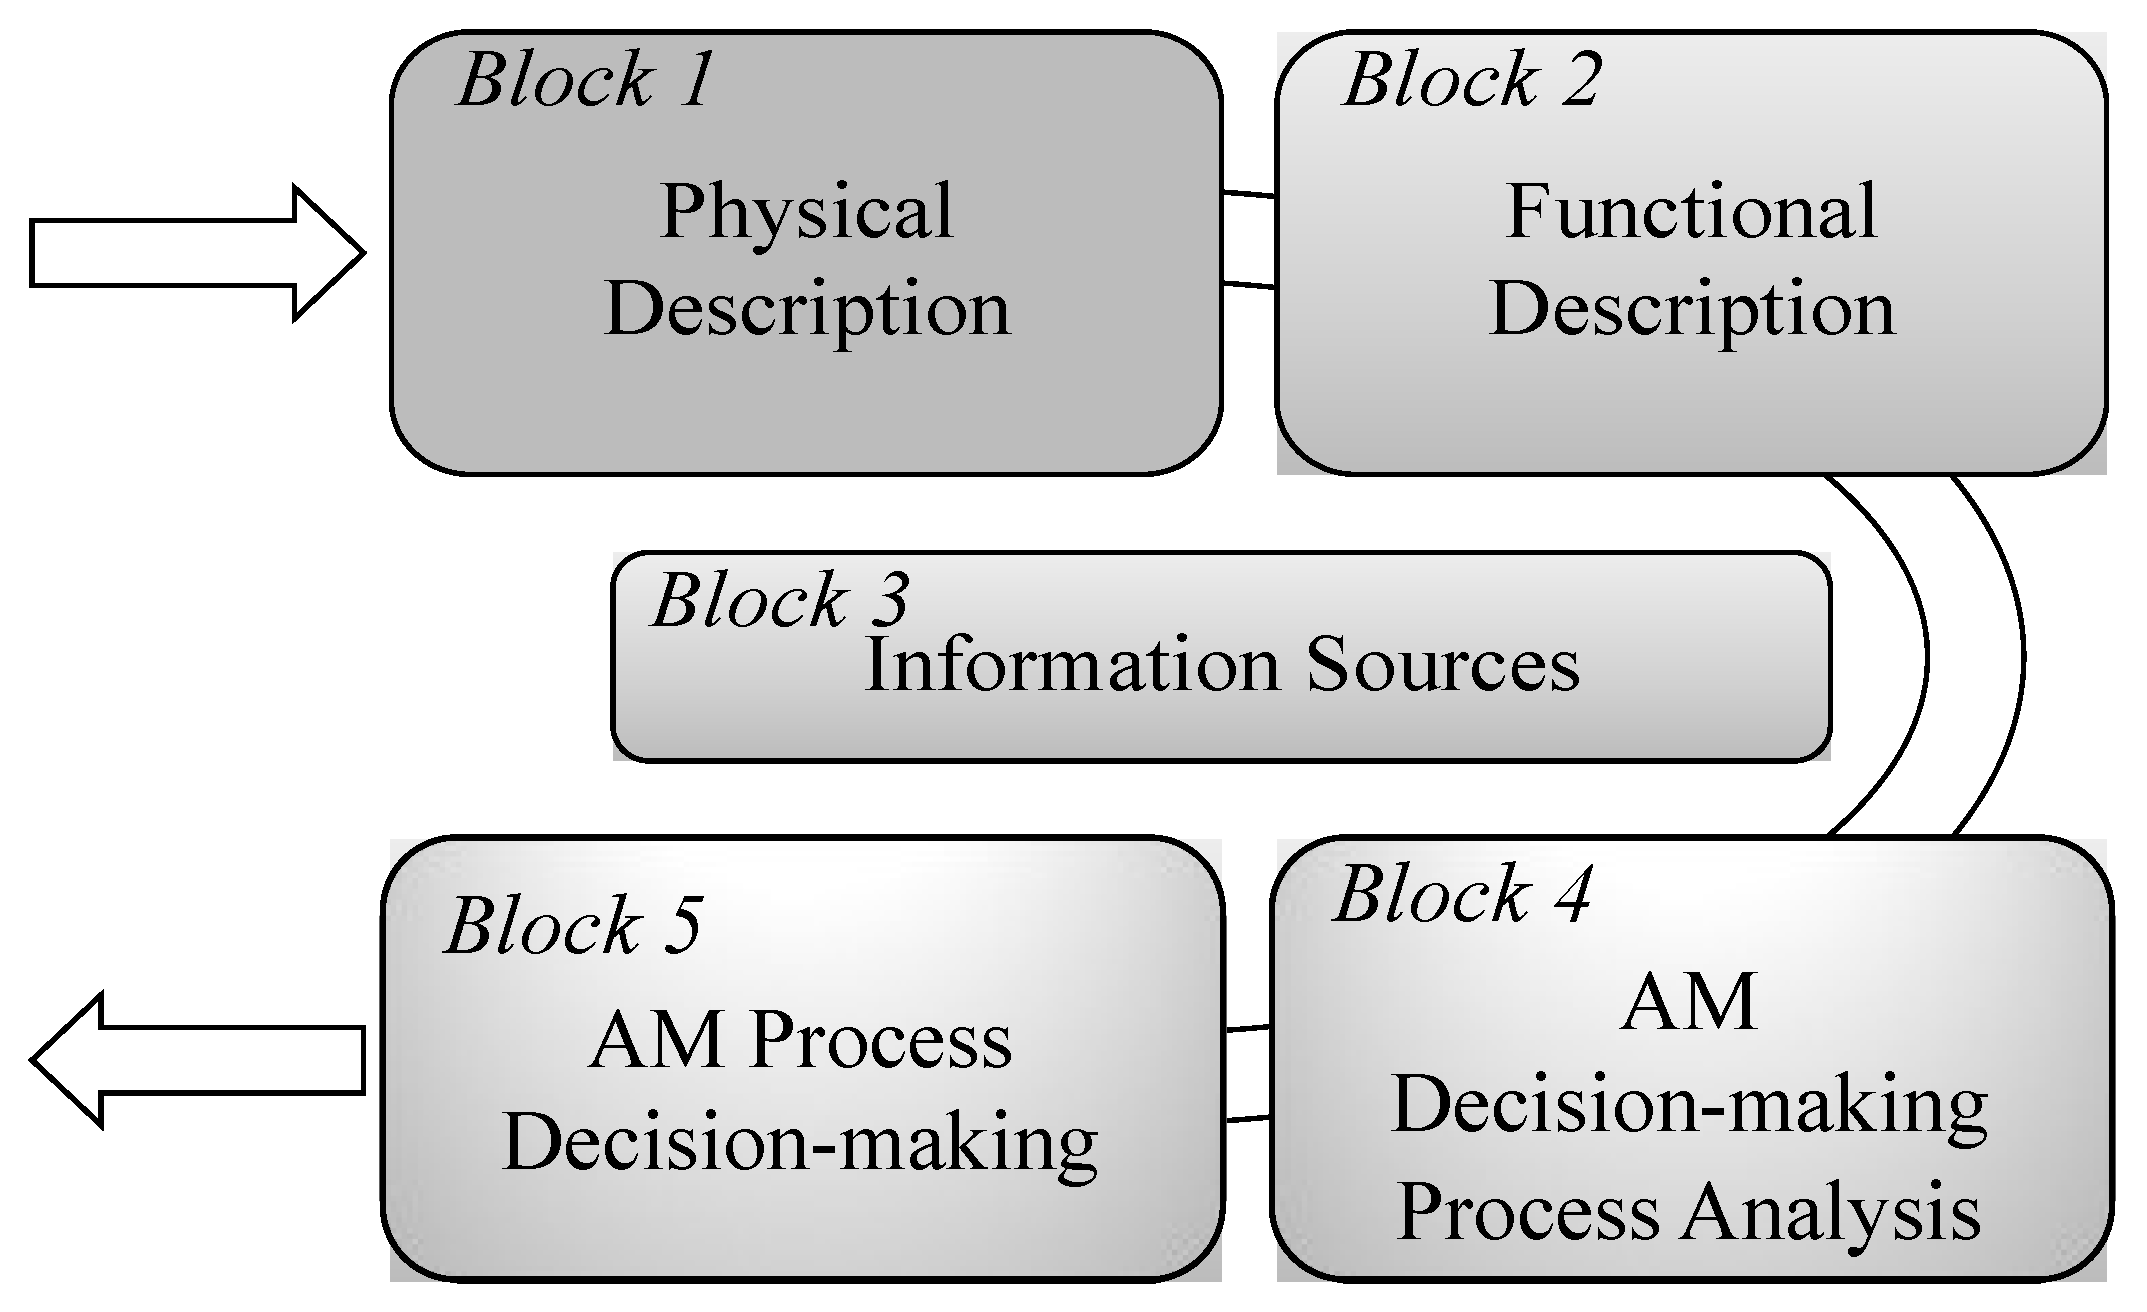
It shows in Block 1 how a system is composed by one or more than one equipment units, which will be placed in specified functional locations and properly geo-referenced (data in this block), each one executing one or more functions.
For the power lines example, 6 groups of functional locations were considered as maintainable items (see Figure 12), and geo-referencing these locations was included.
In Block 2, for the Functional Description, each function may have different identified functional failures. Each function may have one or more functional failures and these failures will be caused by one or more maintainable items.
Block 3 depicts how when the functional failure occurs, the description of the effects of failure, history and frequency are recorded in a certain activity management system, and that data can be used later in Block 4.
For the power lines example, the CMMS had recorded the failures of each functional location, and the criticality App just assigns a factor of failure frequency to each functional location accordingly (see Table 2 with the factors used in the example):
For the same example, power lines’ failure effects were classified according to their impact on: Industrial safety, environment, quality of service, availability of the network and maintenance cost (see Table 3). The criteria selected to be considered for the analysis were defined according to the objectives of the company. The most important, in that case, was the quality of the service (35%), followed by industrial security (30%). Logically, for each company, specific factors and weights will be taken into account according to their own objectives.
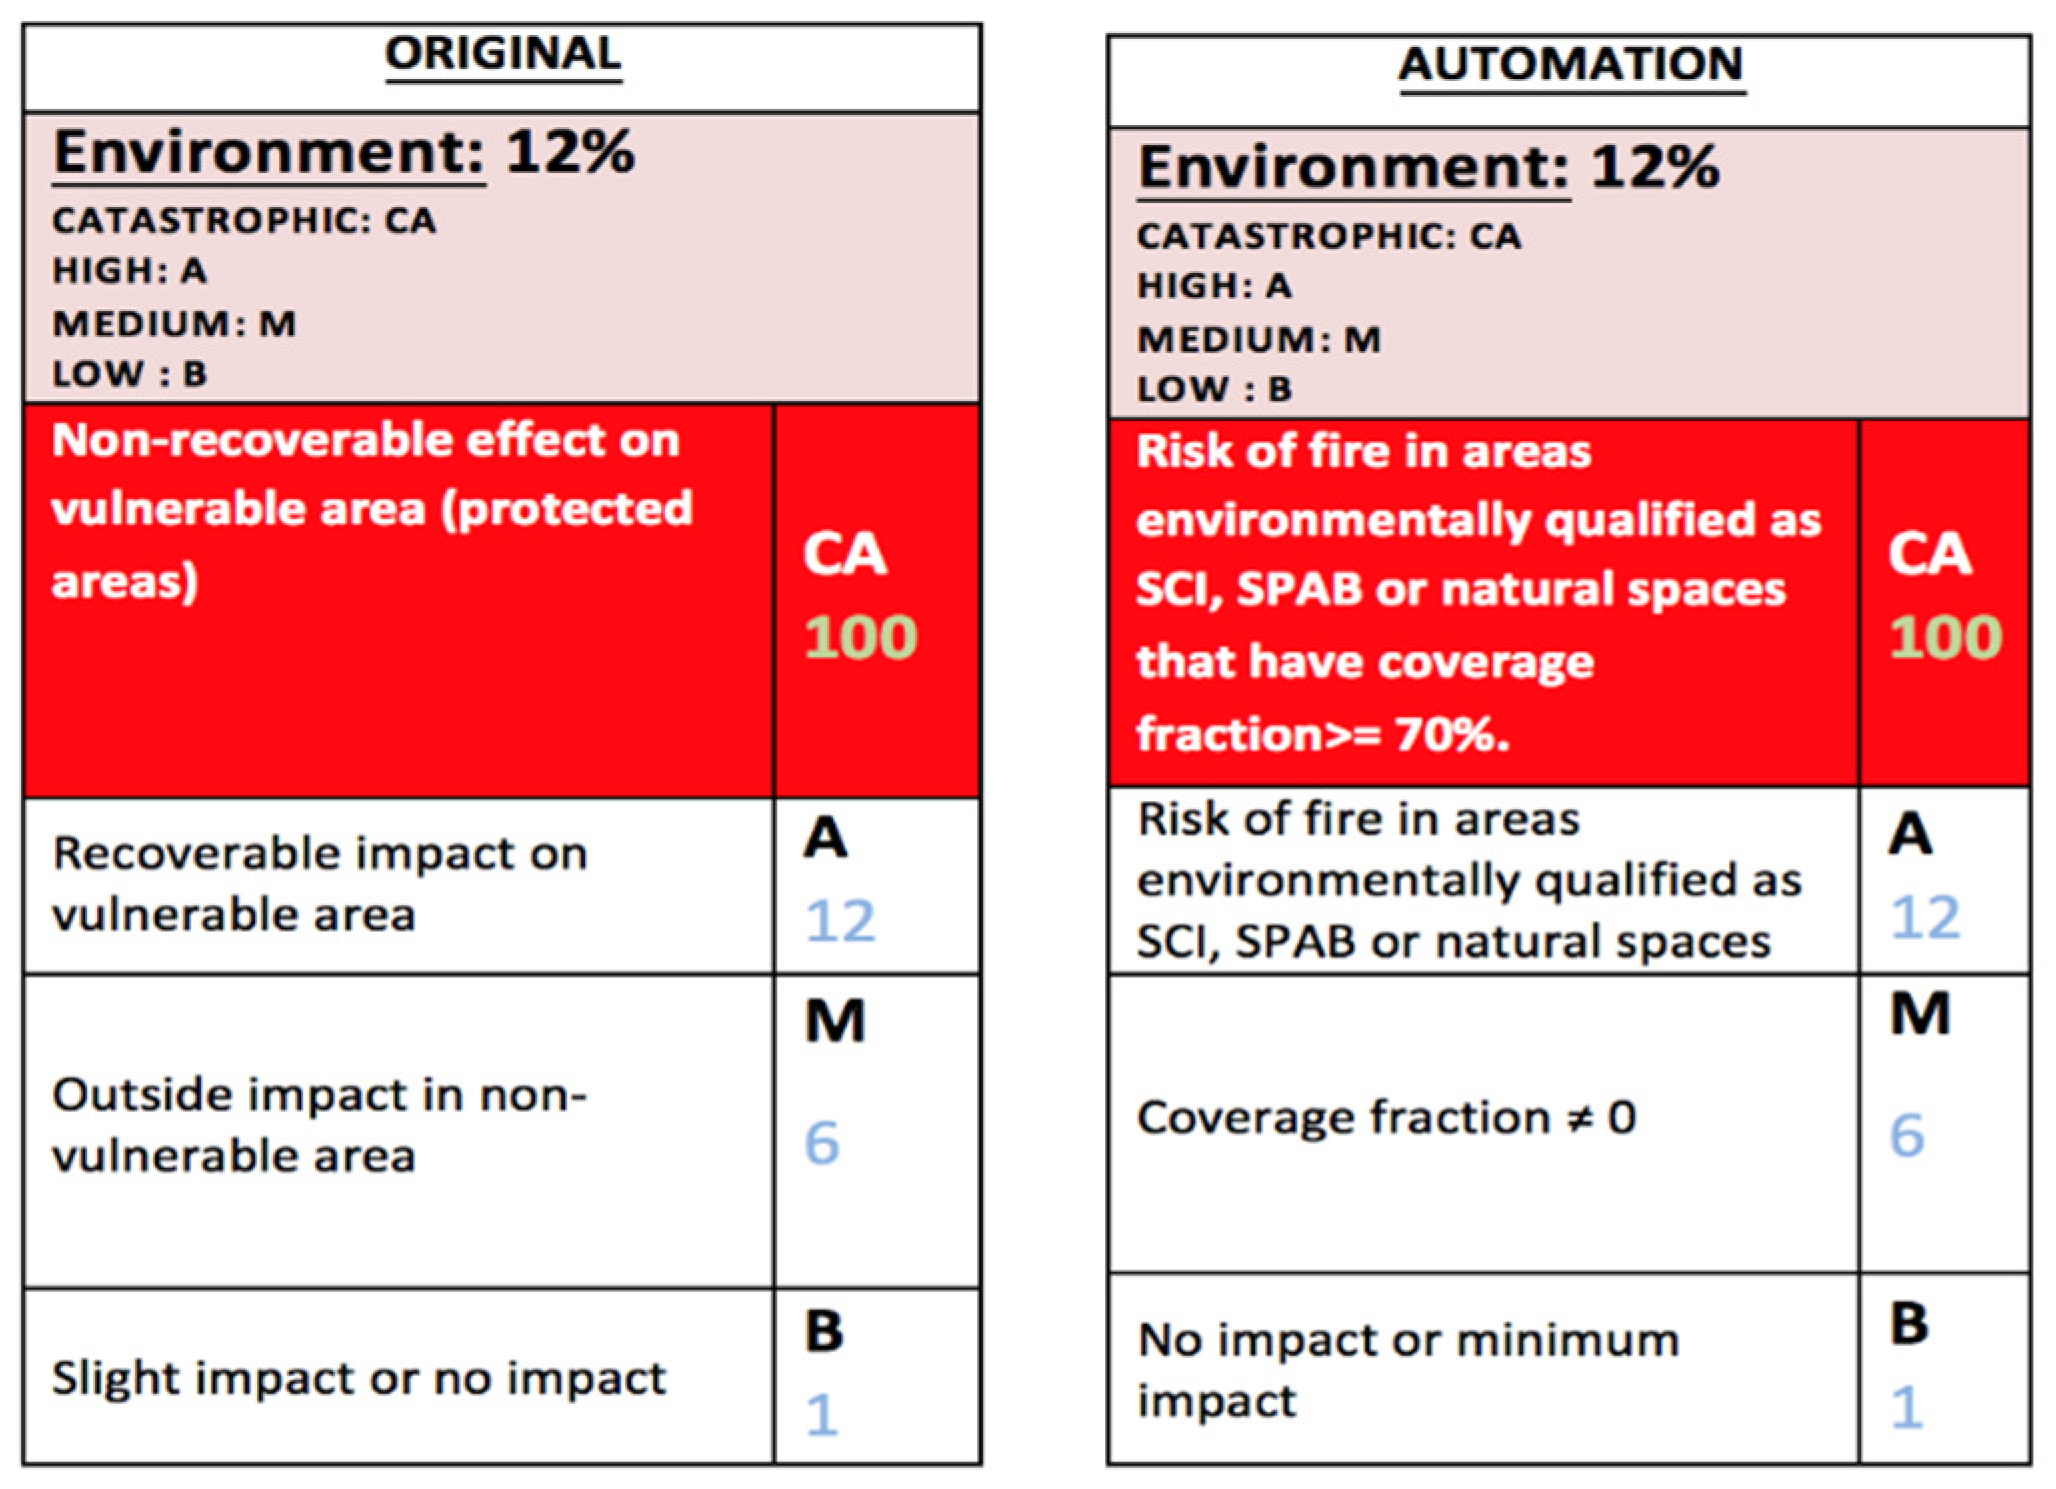
In this particular example, the Block 4 AM decision-making analysis, refers only to the asset’s criticality analysis. For this kind of analysis, the contribution of each functional failure must be measured in terms of risk, which requires capturing the frequency of the failure on the one hand (deriving a Frequency Factor), and estimating the Severity of the failure on the other hand (deriving a Severity Factor). Frequency times severity results in a measure of failure risk, which must fit within the company risk objectives. Both parts have to be matched for each specific functional failure.
In the example of the power lines, the company’s CMMS is connected to the GIS (geographic information system) and asset locations are recorded when assets are registered, as shown in Table 4: Data for Frequency Factors for each Maintainable Item and each Functional Failure that are collected from CMMS.
At the same time, the “fault location” functionality can be used by a dispatch center to provide information about the potential number of affected clients when a failure occurs at a specific point in the network. Failure severity data (factors, their weights and scores of the failures for effects on these factors) is normally placed in companies’ custom-made Apps for that purpose [27]. Thanks to these possibilities, the assessment of the potential impact of a functional location failure can be done using automated rules according to the functional location GIS data. For instance, see in Figure 13 how a functional location failure impact on “Environment” can be derived automatically from GIS data.
In Block 5, data for failures’ frequency and severity for a given equipment unit is transformed into a criticality value and then classified according to particular risk levels (company assets criticality levels: High, mid or low criticality). This makes easier the definition of actions, according to an existing Risk Strategy, to fulfil the company Risk Goals. In consequence, in Block 5, the decision-making process for each asset (equipment unit) is to determine the correspondent strategy to be applied to the asset in order to fulfill the company risk strategy, and also to make clear what is the priority for the execution of these asset strategies in a systematic way.
For instance, in the powerlines case, the determination of the criticality limits was established by the business, as in Table 5.
Immediately after this decision and the automatic evaluation of the asset’s criticality, the actions in order to accomplish the company goals can be established as in Figure 14, as a starting point for another App utilization.
Notice how Blocks 1 and 2, as physical and functional inventory of the assets, will be common data blocks for all the Asset Management Apps in an IAMP. While data in Blocks 4 and 5 are clearly specified and modelled for each type of Asset Management Decision-Making App.
When the information mentioned above is available, a set of simple rules to automate the criticality analysis can be used. Failure consequences, for all the criteria previously selected and for each asset, can be assessed straight away.
For a complete description of the process followed in the case study, for specific elements of the network, the reader is referred to Crespo et al. [4].
Using a business intelligent App, we can present information about the criticality analysis process to interact with the end user and, according to the reporting needs and end user requirements, this can be done on demand or at the time needed by the business (see an example in Figure 15).

7. Conclusions

This paper explains why Industrial IoT availability, new technologies such as predictive maintenance analytics together with big data, besides digital twin simulations, are boosting the growth of the IAMP market. Especially in the energy sector (Oil and Gas and Electricity network utilities) where high investments are implemented, to control asset value continuously, and to report with high levels of detail to shareholders and public regulators.
In this paper, the functionality that should be provided by an IAMP in order to enhance effectiveness and efficiency of existing AM practices, is identified. At this moment, and thanks to the IAMP platforms, the existing gap between attention paid to AM management and operational areas, and the attention paid to more strategic AM areas, could be closed or at least reduced considerably. An example of a commercial IAMP has been analyzed to corroborate this fact.
It has been described how data in these modern platforms differs from traditional data: Volume, velocity, variability, low veracity and variety are current data features that are properly managed by these platforms thanks to their big data analytics functionality. This functionality has enabled what nowadays is known as predictive analytics. The different types of predictive analytics have been reviewed beside the required different types of data. To discover behavioral patterns in this data, it is analyzed how intelligence and flexibility need to be incorporated to these platforms and how this is now done using AI-ML techniques.
Because of the importance of data, the design of asset data models is found to be very important. The way data is structured and interrelated, within these IAMPs, will be critical for their sustainability. The paper presents a methodology, a technique to help to understand the data models of any IAMP App, and proof of this concept by applying it to the data model of a criticality analysis App.

Author Contributions

Conceptualization, A.C.M.; Methodology, A.C.M., J.F.G.F. & A.G.L.; Software Investigation, P.M.-G.F.; Writing—Original Draft Preparation, A.C.M.; Writing—Review & Editing, J.F.G.F. & P.M.-G.F.; Project Administration, A.C.M.; Funding Acquisition, A.C.M. & A.G.L. All authors have read and agreed to the published version of the manuscript.

Funding

This research was funded by The University of Seville: Project: “Metodología para aplicación industrial de soluciones de mantenimiento inteligente. Integración de técnicas de Analítica Predictiva y Machine Learning en plataformas IoT”. Grant Number: CEI-19-TEP134.

Conflicts of Interest

The authors declare no conflict of interest.

References

  1. Birlasekaran, S.; Ledwich, G. Asset Management of Power Apparatus. In Engineering Asset Management; Mathew, J., Kennedy, J., Ma, L., Tan, A., Anderson, D., Eds.; Springer: London, UK, 2006. [Google Scholar] [CrossRef]
  2. Darvish Sarvestani, A.; Moazami Goodarzi, A.; Hadipour, A. Integrated asset management: A case study of technical and economic optimization of surface and well facilities. Pet. Sci. 2019, 16, 1221–1236. [Google Scholar] [CrossRef] [Green Version]
  3. Crespo, A.; Sola, A.; Moreu, P.; Gómez, J.F.; de la Fuente, A.; Guillén, A.; González-Prida, V. Criticality Analysis for improving maintenance, felling and pruning cycles in power lines. IFAC Pap. OnLine 2018, 51, 211–216. [Google Scholar] [CrossRef]
  4. Crespo Márquez, A.; Rosique, A.S.; Moreu de León, P.; Gómez Fernández, J.F.; Diego, A.G.; Fernández, E.C. Exploiting EAMS, GIS and Dispatching Systems Data for Criticality Analysis. In Value Based and Intelligent Asset Management; Springer: Cham, Switzerland, 2020. [Google Scholar] [CrossRef]
  5. Kolevski, G.; Gusev, M. Analysis of Cloud Solutions for Asset Management. In Conference: ICT Innovations 2010, Web Proceedings ISSN 1857-7288; Gusev, M., Ed.; Springer: Ohrid, Macedonian, 2010. [Google Scholar]
  6. Hamdaqa, M.; Tahvildari, L. Cloud Computing Uncovered: A Research Landscape. In Advances in Computers; Elsevier: Ontario, Canada, 2012. [Google Scholar] [CrossRef]
  7. Metcalfe, D.; Winter, S. Operational Risk Management Software Market Size and Forecast 2018–2038. 2018. Available online: https://research.verdantix.com/report/operational-risk-management-software-market-size-and-forecast-2018-2038 (accessed on 21 July 2020).
  8. Abualkibash, M.; Elleithy, K. Cloud Computing. The Future of IT industry. Int. J. Distrib. Parallel. Syst. 2012, 3, 1–12. [Google Scholar] [CrossRef] [Green Version]
  9. Maciaszek, L.A.; Skalniak, T.; Biziel, G. Architectural Principles for Service Cloud Applications. In Business Modeling and Software Design. BMSD 2014. Lecture Notes in Business Information Processing; Shishkov, B., Ed.; Springer: Berlin, Germany, 2020; p. 220. Available online: https://link.springer.com/chapter/10.1007/978-3-319-20052-1_1 (accessed on 21 July 2020).
  10. Kumar, S.; Tiwari, P.; Zymbler, M. Internet of Things is a revolutionary approach for future technology enhancement: A review. J. Big Data 2019, 6, 111. [Google Scholar] [CrossRef] [Green Version]
  11. Industrial Internet Consortium. Industrial Internet Reference Architecture. Tech. Rep. 2015. [Google Scholar] [CrossRef] [Green Version]
  12. Schiefelbein, U.H.; Soligo, D.; Maran, V.; de Oliveira, J.P.M.; Lima, J.C.D.; Machado, A. Internet of Things based on Situation-Awareness for Energy Efficiency. iSys Rev. Bras. Sist. Inf. (Braz. J. Inf. Syst.) 2019, 12, 28–53. [Google Scholar] [CrossRef]
  13. Xiao, Y.; Kalyanaraman, R.; Ylä-Jääski, A. Middleware for energy-awareness in mobile devices. In Proceedings of the 4th International ICST Conference on COMmunication System softWAre and middlewaRE-COMSWARE ‘09, Dublin, Ireland, 15–19 June 2009. [Google Scholar]
  14. Mineraud, J.; Mazhelis, O.; Su, X.; Tarkoma, S. A gap analysis of Internet-of-Things platforms. Comput. Commun. 2016, 89–90, 5–16. [Google Scholar] [CrossRef] [Green Version]
  15. Borgia, E. The Internet of Things vision: Key features, applications and open issues. Comput. Commun. 2014, 54, 1–31. [Google Scholar] [CrossRef]
  16. Perry, M. Evaluating and Choosing An Iot Platform; O’Reilly Media, Inc.: Sebastopol, CA, USA, 2016. [Google Scholar]
  17. Hariri, R.H.; Fredericks, E.M.; Bowers, K.M. Uncertainty in big data analytics: Survey, opportunities, and challenges. J. Big Data 2019, 6, 44. [Google Scholar] [CrossRef] [Green Version]
  18. Crespo Márquez, A.; de la Fuente Carmona, A.; Antomarioni, S. A Process to Implement an Artificial Neural Network and Association Rules Techniques to Improve Asset Performance and Energy Efficiency. Energies 2019, 12, 3454. [Google Scholar] [CrossRef] [Green Version]
  19. Wilder-James, E. Breaking Down Data Silos. 2016. Available online: https://hbr.org/2016/12/breaking-down-data-silos (accessed on 12 December 2019).
  20. ISO/IEC JTC 1. Information Technology. 2015. Available online: http://www.iso.org/iso/big_data_report-jtc1.pdf (accessed on 14 October 2019).
  21. Lueth, K.L.; Patsioura, C.; Williams, Z.D.; Kermani, Z.Z. Industrial Analytics 2016/2017: The current state of data analytics usage in industrial companies. IoT Anal. 2016, pp. 1–50. Available online: https://digital-analytics-association.de/wp-content/uploads/2016/03/Industrial-Analytics-Report-2016-2017-vp-singlepage.pdf (accessed on 21 July 2020).
  22. Iot-analytics.com. Predictive Maintenance Report 2019–2024. 2019. Available online: https://iot-analytics.com/product/predictive-maintenance-report-2019-2024/ (accessed on 25 February 2020).
  23. Rodríguez, F.; Fleetwood, A.; Galarza, A.; Fontán, L. Predicting solar energy generation through artificial neural networks using weather forecasts for microgrid control. Renew. Energy 2018, 126, 855–864. [Google Scholar] [CrossRef]
  24. Vachtsevanos, G.; Lewis, F.; Roemer, M.; Hess, A.; Wu, B. Intelligent Fault Diagnosis and Prognosis for Engineering Systems. In Intelligent Fault Diagnosis and Prognosis for Engineering Systems; Wiley: Hoboken, NJ, USA, 2007. [Google Scholar] [CrossRef]
  25. Mosallam, A.; Medjaher, K.; Zerhouni, N. Data-driven prognostic method based on Bayesian approaches for direct remaining useful life prediction. J. Intell. Manuf. 2016, 27, 1037–1048. [Google Scholar] [CrossRef]
  26. Mosallam, A.; Medjaher, K.; Zerhouni, N. Component based data-driven prognostics for complex systems: Methodology and applications. In Proceedings of the 1st International Conference on Reliability Systems Engineering, ICRSE 2015, Beijing, China, 21–23 October 2015. [Google Scholar] [CrossRef]
  27. Jia, X.; Jin, C.; Buzza, M.; Di, Y.; Siegel, D.; Lee, J. A deviation based assessment methodology for multiple machine health patterns classification and fault detection. Mech. Syst. Signal Process. 2018, 99, 244–261. [Google Scholar] [CrossRef]
  28. Boschert, S.; Rosen, R. Digital twin-the simulation aspect. In Mechatronic Futures: Challenges and Solutions for Mechatronic Systems and Their Designers; Springer: Berlin, Germany, 2016. [Google Scholar] [CrossRef]
  29. Roda, I.; Macchi, M. A framework to embed Asset Management in production companies. Proc. Inst. Mech. Eng. Part O J. Risk Reliab. 2018, 232, 368–378. [Google Scholar] [CrossRef]
  30. Dunn, S. Asset Management Data and Decision Making—Implementing ISO 55000. 2019. Available online: https://www.assetivity.com.au/article/asset-management/asset-management-data-and-decision-making-implementing-iso-55000.html (accessed on 18 December 2019).
  31. Woodhouse, J. Asset Management Decision-Making. 2001. Available online: http://plant-maintenance.com/articles/AMdecisions.pdf (accessed on 14 June 2019).
  32. Woodhouse, J. Asset management: A science emerging. Int. J. COMADEM 2003, 6, 4–10. [Google Scholar]
  33. Available online: https://www.ge.com/digital/sites/default/files/download_assets/Predix-asset-performance-management-brochure.pdf (accessed on 14 July 2019).
  34. Guillén, A.J.; Crespo, A.; Gómez, J.F.; Sanz, M.D. A framework for effective management of condition based maintenance programs in the context of industrial development of E-Maintenance strategies. Comput. Ind. 2016, 82, 170–185. [Google Scholar] [CrossRef]
  35. Ciccozzi, F.; Malavolta, I.; Selic, B. Execution of UML models: A systematic review of research and practice. Softw. Syst. Model. 2019, 18, 2313–2360. [Google Scholar] [CrossRef] [Green Version]
Figure 1. Intelligent Assets Management Platforms (IAMP) software stack pyramid.
Energies 13 03762 g001
Figure 2. Structure of Apps at the software as a service (SaaS) level.
Energies 13 03762 g002
Figure 3. A generic vision of the basic IAMP functional elements.
Energies 13 03762 g003
Figure 4. “Internet of Things” (IoT) Platform layer.
Energies 13 03762 g004
Figure 5. Percentage of time consumed by data scientists. Adapted from [19].
Energies 13 03762 g005
Figure 6. Importance of IA for business managers and data scientists. Adapted from [22].
Energies 13 03762 g006
Figure 7. Types of analytics based on their applications. Adapted from [11].
Energies 13 03762 g007
Figure 8. A perspective of Asset Management (AM) decisions and controls.
Energies 13 03762 g008
Figure 9. Processing blocks in the proposed framework Guillen et al., (2016). Reproduced from [34], Computers in Industry: 2016.
Energies 13 03762 g009
Figure 10. Generalization of the framework proposed by Guillen et al., (2016). Reproduced from [34], Computers in Industry: 2016.
Energies 13 03762 g010
Figure 11. Data Model supporting the assets criticality analysis (CA) decision-making process.
Energies 13 03762 g011
Figure 12. Selected functional structure of the network for the analysis.
Energies 13 03762 g012
Figure 13. Environment criteria effects conversion (with GIS Data).
Energies 13 03762 g013
Figure 14. Assets’ strategy, according to their criticality, to fulfil company’s goals.
Energies 13 03762 g014
Figure 15. Sample results presented by the BI of the asset criticality analysis APP.
Energies 13 03762 g015
Table 1. Correlation of business AM basic processes with Predix Platform Apps.
Sample Basic AM Process (Application)Apps Big Modules in GE Predix
APM HealthAPM ReliabilityAPM StrategyAPM Integrity
Criticality Analysis for Assets HierarchyAsset Criticality Analysis: Uses default indenture level and severity factors. The User can select factors.---
Root Cause Analysis-Root Cause Analysis: Based on the PROACT® RCA Methodology --
PM and Inspection Plan Design--Reliability Centered Maintenance: Uses SAE Standard JA1012, “Evaluation Criteria for RCM Processes”Risk Based Inspection: Uses the API 580/1 methods to derive risk and optimized inspection plan
PM and Inspection strategy Review/Management--Asset Strategy Management: Let’s you create a strategy to optimize equipment performance to achieve business goals.Inspection Management: To manage inspection plans, document the condition of an asset on a mobile device, and track inspection recommendations
Predictive/Condition-Based Asset Management-Digital Twin blueprints and Predictive diagnostics: Leverages advanced predictive diagnostics, analyzes data and detects and diagnoses well in advance.--
Asset Performance Analysis-Reliability Analysis: Collection of tools that apply reliability engineering principles.--
Life Cycle Cost Analysis--Life Cycle Cost Analysis:It provides the ability to balance costs, plan budgets, collect performance data and build contingency plans-
Spares Analysis-Reliability Analysis/Spares Analysis: Monte Carlo simulation is used to spare analysis.--
Health IndexAsset Health Manager: A graphical summary of an asset’s health, based on information stored in various records, is presented.---
Table 2. Frequency factors used in the power lines example.
Annual Frequency FailureClassificationManagement DefinitionFrequency Factor
2 ≤ fVery HighInadmissible failures2
1 ≤ f < 2HighRecurrent failures1.5
0.5 ≤ f < 1MediumAcceptable failures1.2
<0.5LowPossible failures1
Table 3. Failure severity criteria and levels used in the power lines example.
Industrial Safety
(30%)
Environmental (12%)Quality Service (35%)Availability (14%)Maintenance Costs (5%)
Catastrophic: Very serious effect with damage to the network or fatalities100Catastrophic: Non-recoverable effect100Catastrophic: Loss of continuity in electric service for more than 20,000 customers100Very High: Total loss of capacity of the line20Very High: Maint. Cost >30,000 €5
High: High impact to the net or serious injury or severe damage to third parties (>300,000 M€) 30High: Recoverable impact on vulnerable area12High: The same for 2000–20,000 customers impacted35High: Total loss of capacity of the line in grid or branch network with redundancy10High: >30,000 € Maint. Cost >6000 €4
Medium: Average impact or damage to third parties (>50,000 €)18Medium: Outside impact in non-vulnerable area6Medium: The same for 200–2000 customers impacted12Medium: Partial loss of line capacity with possibility of remote manoeuvering5Medium: >6000 € Maint. Cost >1000 €3
Slight1Slight1Slight1L Slight1Slight1
Table 4. Data in the GIS layers to be assigned to a functional location.
Data Layers in the GIS Content
Fire risk zoneYes/No
Place of public interestYes/No
Special protection zone (animals)Yes/No
Natural parkYes/No
Vegetation fraction covered (%)%
Railway crossingYes/No
Main road crossingYes/No
Populated zoneYes/No
High frequency of persons areaYes/No
Other network crossing AT, MT, BT, PhoneYes/No
Table 5. Criticality limits.
CriticalityValue Range
Critical91–200
Semi-critical50–90
Non-Critical1–49

