Article

Acoustic Emission Characteristics of Coal Samples under Different Stress Paths Corresponding to Different Mining Layouts

1
State Key Laboratory of Hydraulics and Mountain River Engineering, College of Hydraulic and Hydropower Engineering, Sichuan University, Chengdu 610065, China
2
MOE Key Laboratory of Deep Earth Science and Engineering, School of Architecture and Environment, Sichuan University, Chengdu 610065, China
*
Author to whom correspondence should be addressed.
Energies 2020, 13(12), 3295; https://doi.org/10.3390/en13123295
Submission received: 11 April 2020 / Revised: 19 June 2020 / Accepted: 20 June 2020 / Published: 26 June 2020
(This article belongs to the Special Issue Green Coal Mining Techniques 2020)

Abstract

:
Research on the mining-induced mechanical behavior and microcrack evolution of deep-mined coal has become increasingly important with the sharp increase in mining depth. For rock units in front of the working face, the microcrack evolution characteristics, structural characteristics, and stress state correspond well to mining layouts and depths under deep mining. The acoustic emission (AE) characteristics of typical coal under deep mining were obtained by conducting laboratory experiments to simulate mining-induced behavior and utilizing AE techniques to capture the variation in AE temporal and spatial parameters in real time, which provide an important basis for studying the rupture mechanisms and mechanical behavior of deep-mined coal. The findings were as follows: (1) AE activity under deep mining was characterized by three stages, corresponding to crack initiation, crack stable propagation, and crack unstable propagation. As the three stages proceeded, the AE counting rate and AE energy rate presented stronger clustering characteristics, and the cumulative AE counting and cumulative AE energy exhibited a sharp increase by an order of magnitude. (2) The crack initiation and the main stages of crack propagation were determined by characteristic points of variation curves in the AE parameters over time. In the main crack propagation stage, the number of cumulative AE events and the cumulative AE counts were similar among the three mining conditions, while coal samples under coal pillar mining released the largest amount of AE energy. The amount of accumulated AE energy released by coal samples increased by one order of magnitude according to the sequence of protective coal-seam mining, top-coal caving mining, and nonpillar mining. (3) Fractal technology was applied to quantitatively analyze the AE spatial evolution process, showing that the fractal dimension of the AE location decreased as the peak stress increased, corresponding to protective seam mining, caving-coal mining, and nonpillar mining. The above results showed that the deformation and fracture characteristics of coal under deep mining followed a general law, but were affected by different mining conditions. The crack initiation and main rupture activity of coal occurred earlier under the conditions of protective seam mining, top-coal caving mining, and nonpillar mining, successively. Moreover, nonpillar mining induced the strongest and highest degree of unstable rupture of the coal body in front of the working face.

1. Introduction

Worldwide, recoverable coal deposits will last just over 150 years at the current consumption rate [1]; coal energy is playing an increasingly important role in supplying the primary energy of developing countries such as China [2]. Coal is the dominant energy source in China, accounting for 76% and 66% of the primary energy production and consumption structure, respectively. In China, coal mining activity has deepened at a rate of 0 to 25 m annually, with the mining depths of major mines in the central and eastern regions of China reaching 800 to 1000 m [3,4,5]. As the mining depth increases, the stress of the coal mass increases accordingly, which leads to phenomena such as a high ground stress, high ground temperature, and high osmotic pressure, thereby inducing disasters such as rock bursts, water inrushes, and coal and gas outbursts. The rheology of the surrounding rock makes the roadway difficult to support and causes the associated maintenance costs to increase dramatically [6]. To meet the worldwide demand for coal resources and ensure the safe and reliable development of deep coal resources, it is particularly important to conduct research on issues related to deep coal mining. In the past five years, many researchers have investigated various aspects of deep coal mining. Yang et al. [7] carried out numerical simulations to study the mechanism for the large deformation of a deep soft rock roadway. Sun et al. [8] studied the relationship between deep mining and surface subsidence, and analyzed coal pillar safety for strip mining in deep mines. Kong et al. [3], Wang et al. [4], Liu et al. [9] and Zhou et al. [10] carried out hydraulic fracturing in a high gassy coal seam and reduced the coal seam gas content through surface shafts and underground deep holes to eliminate the risk of coal and gas outbursts during the initial mining.
In situ coal in stress equilibrium exhibits the phenomena of deformation, failure, shock and instability under mining operations. Therefore, the mechanical behavior of deep coal is closely related to mining layouts and mining disturbances [11]. In the actual mining process, the coal mass in front of the working face experiences a complete mining-induced mechanical unloading process, in which the in situ stress and axial stress increase to failure while the confining pressure decreases [12]. Recently, researchers conducted a series of studies on the mining-induced mechanical behavior of coal under different mining conditions. Xie et al. [11] carried out mining-induced mechanical tests, and showed that, under different mining layouts, the peak stress of coal and its corresponding axial strain and circumferential strain decrease, while the volumetric strain increases in the order of nonpillar mining, top-coal caving mining and protective coal-seam mining. Zhang et al. [13] studied the structural and connectivity characteristics of coal sample ruptures under different mining layouts. Zhang et al. [14] conducted laboratory tests and in situ observations from which they derived a theoretical expression of the mining-induced permeability change ratio, observing that the stress evolution process under different mining layouts affects the mechanical behavior and permeability change rate of the coal mass. Zhang et al. [15] studied the fractal characteristics of fractures under different mining layouts, and found that a relatively large volume of fractures can be generated in nonpillar mining, resulting in a large number of fractures in front of the working face. Overall, based on the consideration of the mining-induced mechanical behavior of coal, it was found that there are notable differences, in terms of variations in strength characteristics, damage and permeability, among coal under different mining layouts. Additionally, the yield criterion and failure mechanism of coal, considering the mining process, were established. However, the existing research outcomes were not derived based on deep conditions. The influence of different mining layouts on the mechanical properties and failure mechanism of coal mass under the deep environment of high ground stress, high ground temperature and high osmotic pressure is still unclear. To address this problem, it is necessary to simultaneously study the deep environment and the mining conditions associated with deep coal mining.
Research on the mining-induced mechanical behavior of deep coal has usually focused on crack evolution and the failure characteristics of coal. Microcrack propagation and the failure process of rock are closely related to its acoustic emission (AE) behavior [16,17,18,19]. In recent years, three-dimensional (3D) AE localization technology has been widely used in laboratory mechanical testing, and has proven to be an effective method for studying crack propagation and failure characteristics [20,21]. Su et al. [22] studied the AE and temperature variations of coal, and demonstrated that AE is the result of thermal stress-induced crack formation and propagation. Agioutantis et al. [23] used AE to predict rock damage, and showed that the local rock damage can be determined based on the occurrence of AE events in the critical stress region. Coal exhibits poor homogeneity and complex mechanical properties compared to other rocks, leading to some deficiencies in the current implementation of 3D AE localization technology. Nevertheless, the technology has gradually matured and is now generally stable. Many studies involving laboratory mechanical tests of coal and simultaneous 3D AE localization have been published [17,24,25,26]. Because the mining-induced mechanical behavior of deep coal is related mainly to unloading, it is, to some extent, still experimentally difficult to simultaneously use AE localization technology while conducting a laboratory unloading experiment for mining simulation. As a result, only a limited amount of literature exists in this area [17,24,27,28,29].
It is generally believed that deep mining corresponds to a coal-seam burial depth greater than 800 m [30,31]. In this study, a series of laboratory experiments were carried out to simulate the mining process of coal at a burial depth of 1000 m, and real-time monitoring of this process was conducted for simultaneous AE localization. The time series activities, spatial localization evolution and fractal characteristics of AE under different deep mining conditions were studied to deepen the understanding of the mining-induced mechanical behavior and rupture process of deep coal. In the study, three deep mining conditions, i.e., protective coal-seam mining [32], top-coal caving mining [33], and non-pillar mining [34], were considered.

2. Experimental Area

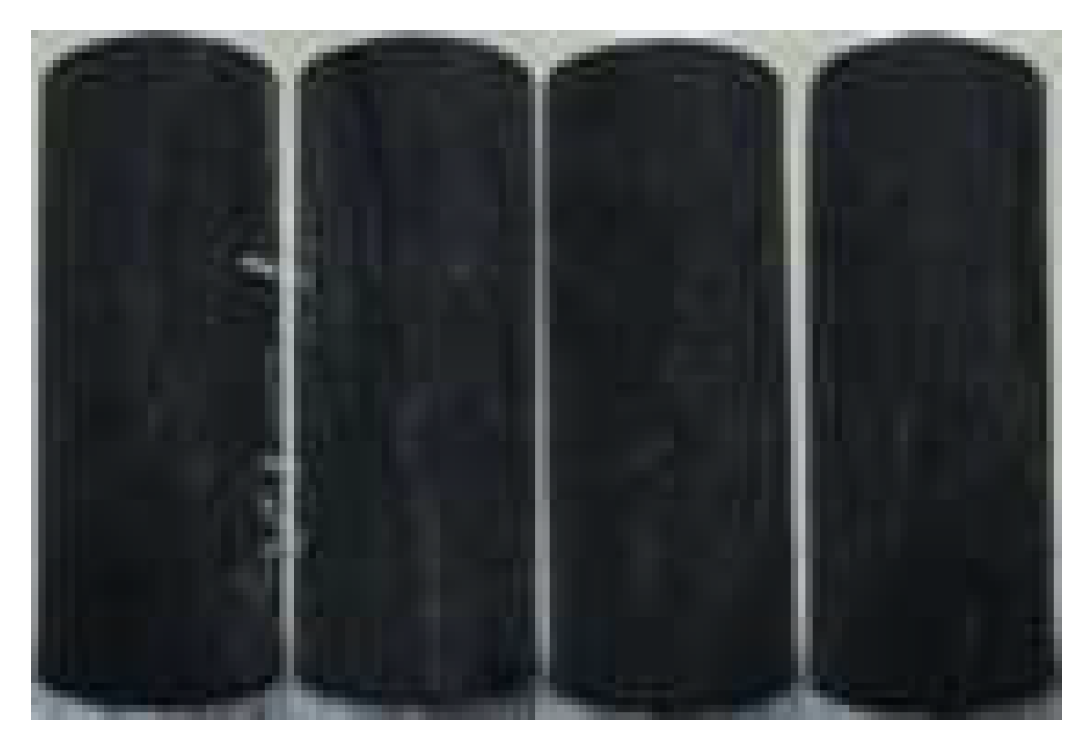
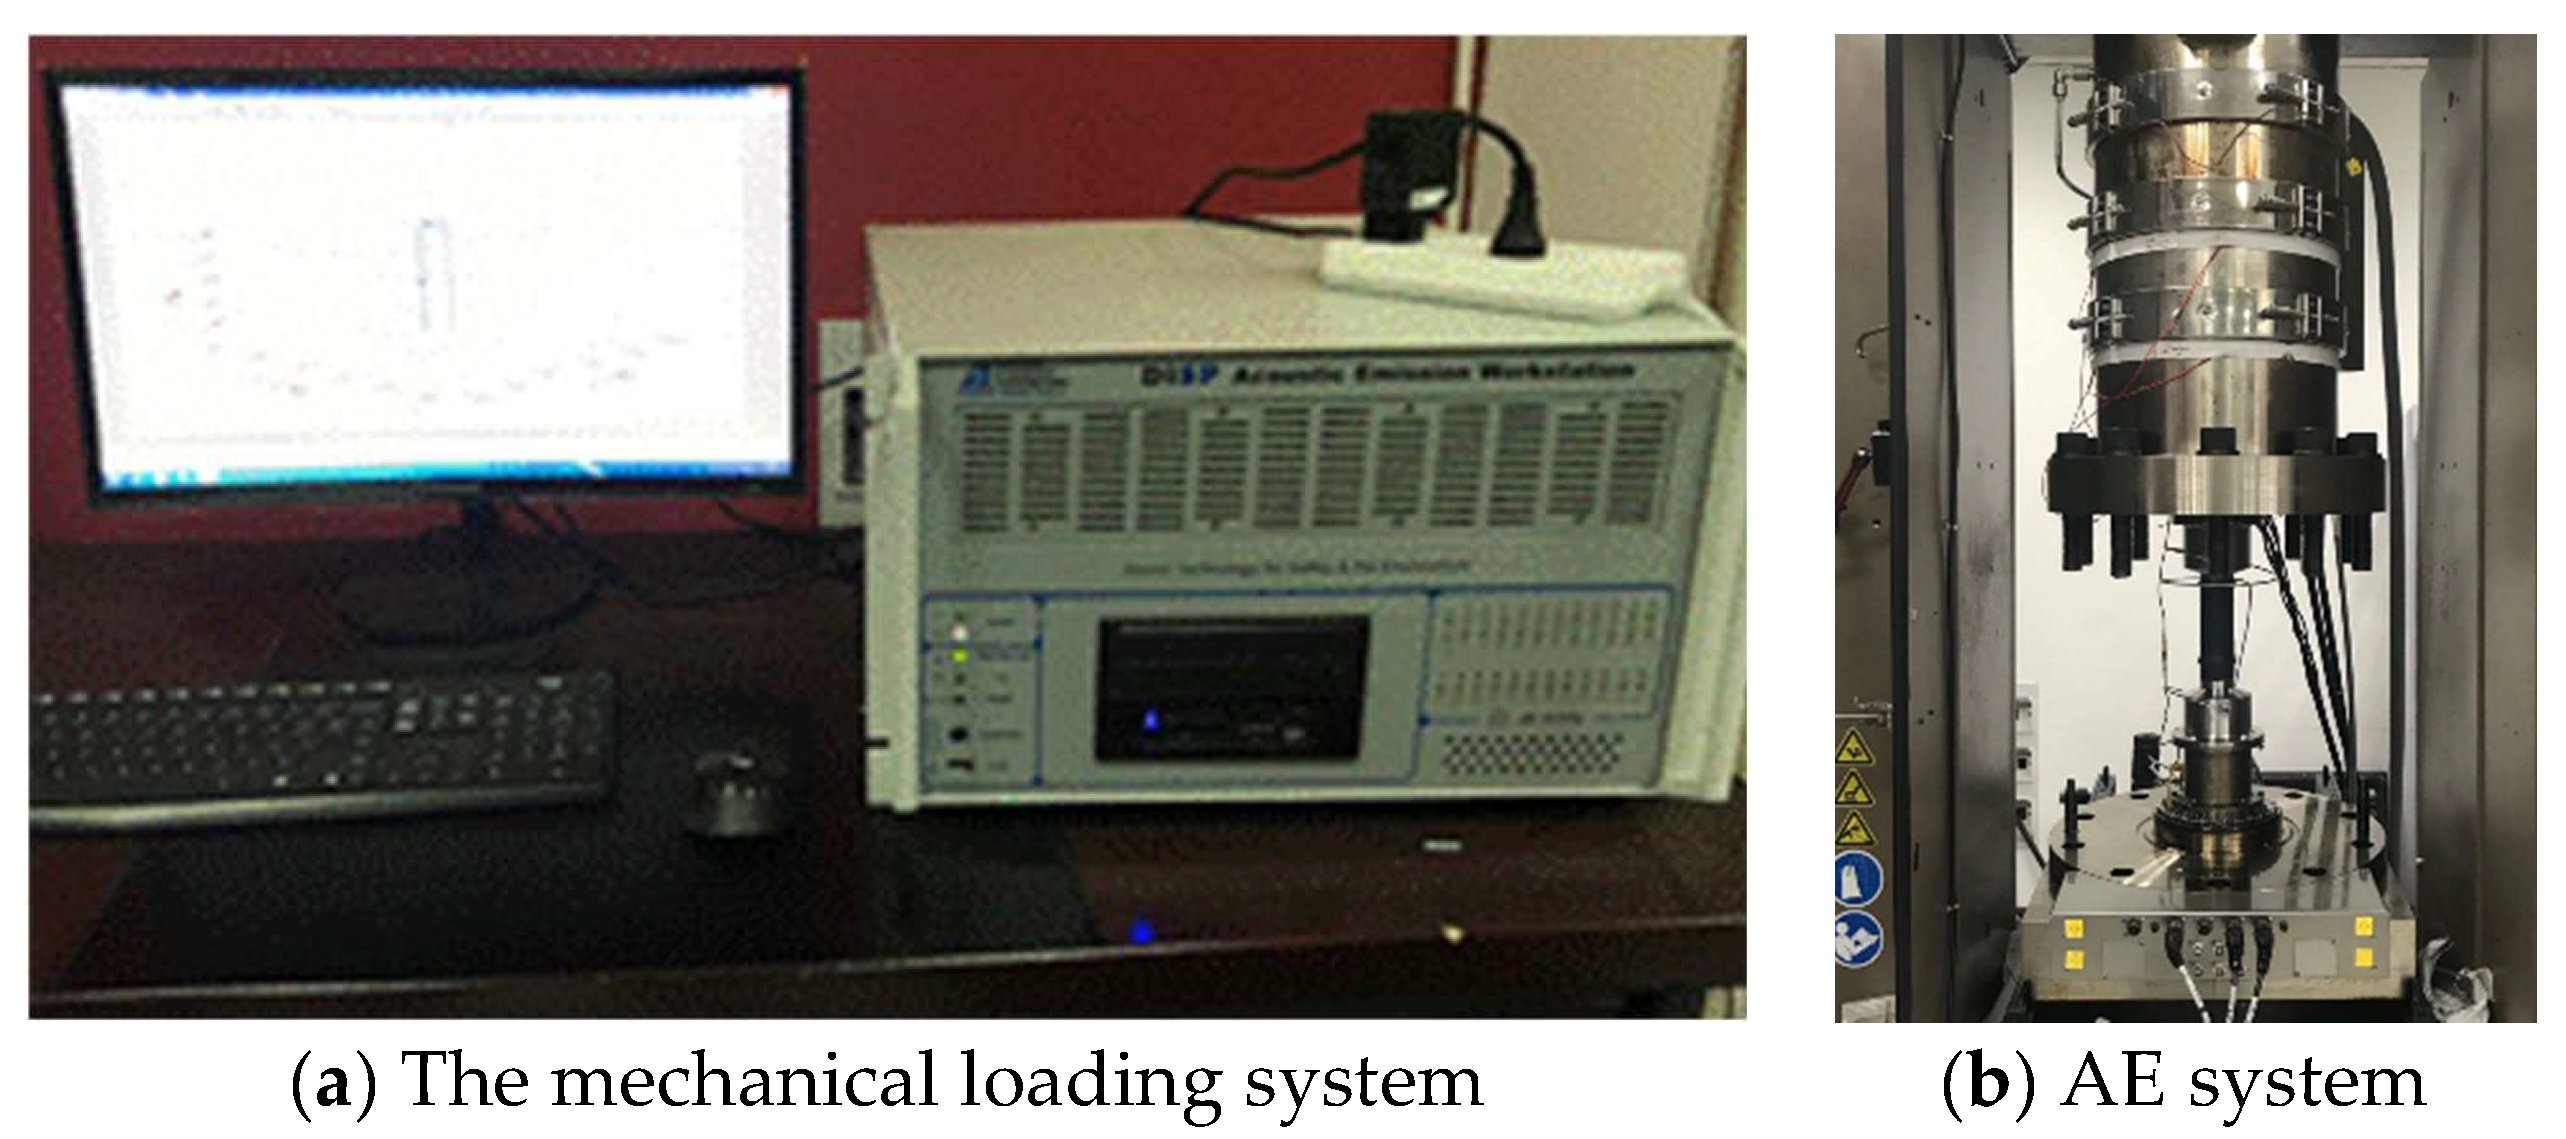
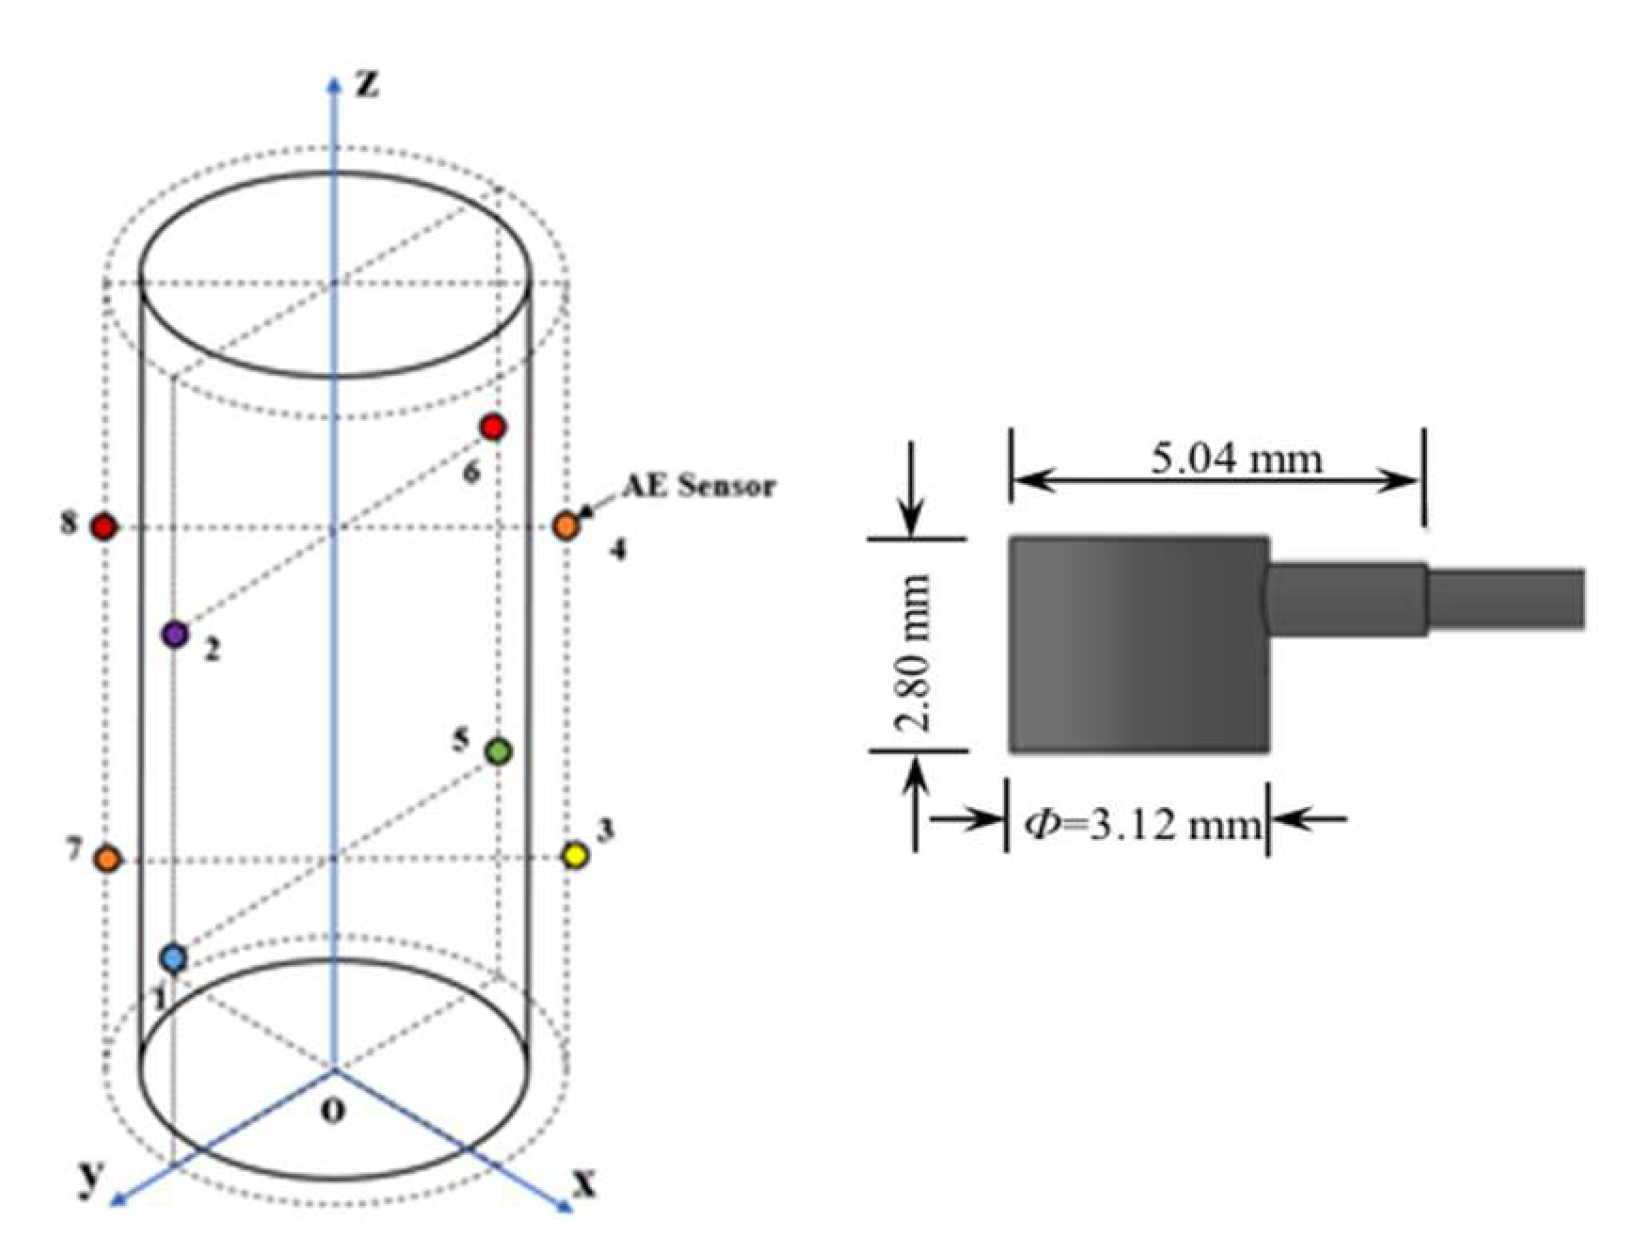
2.1. Sample Specification and AE Sensor
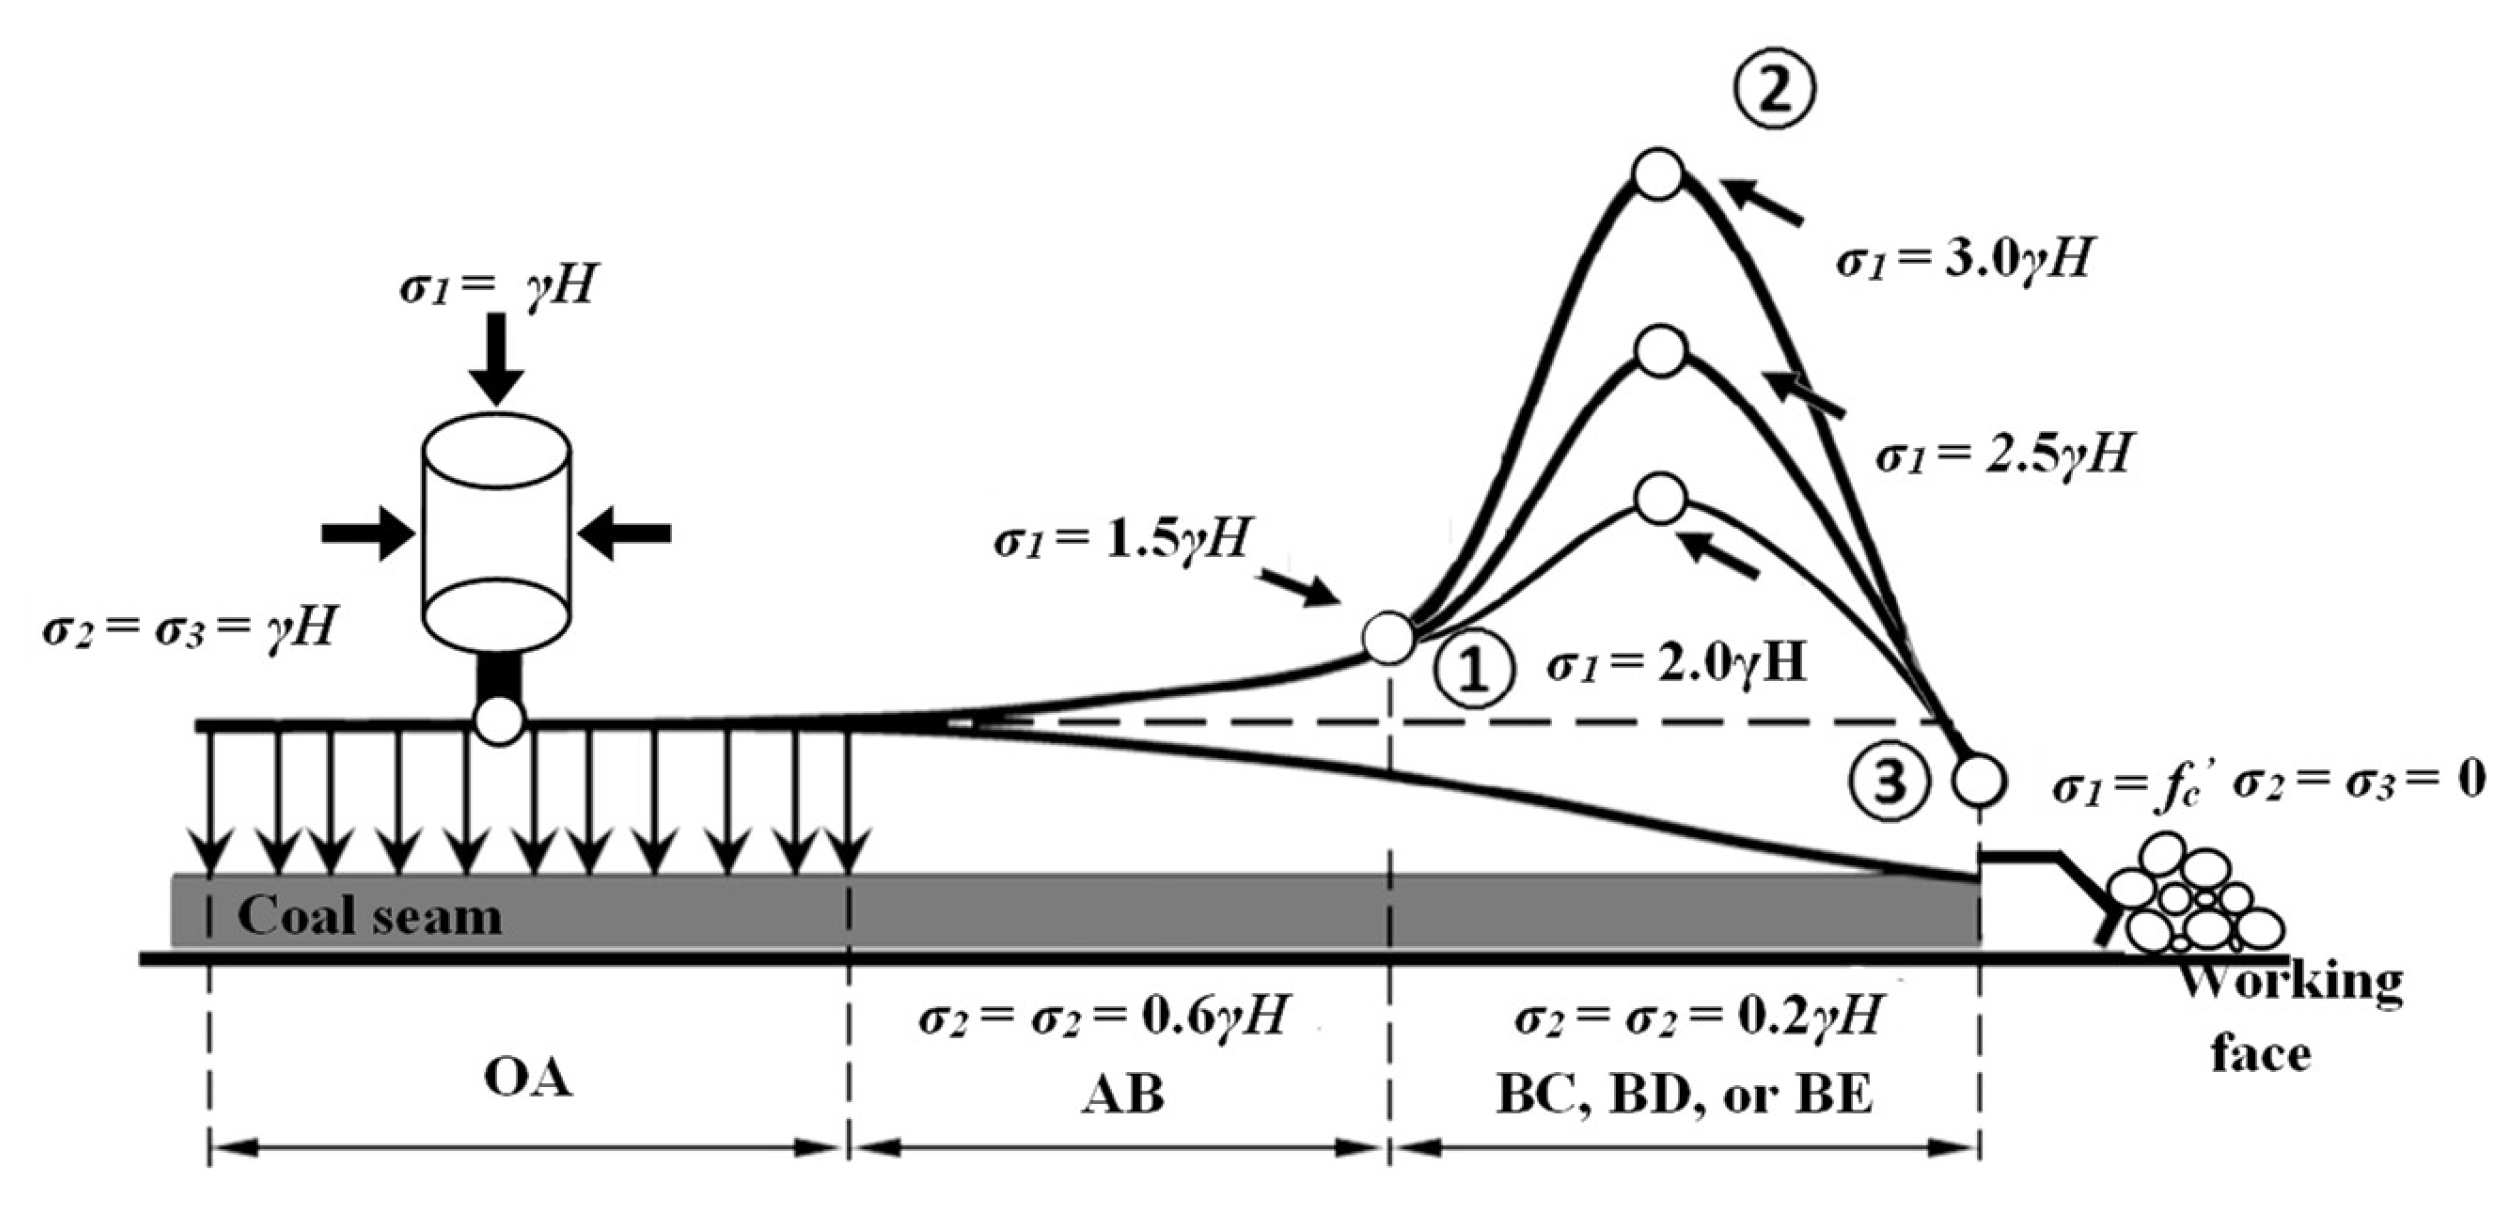
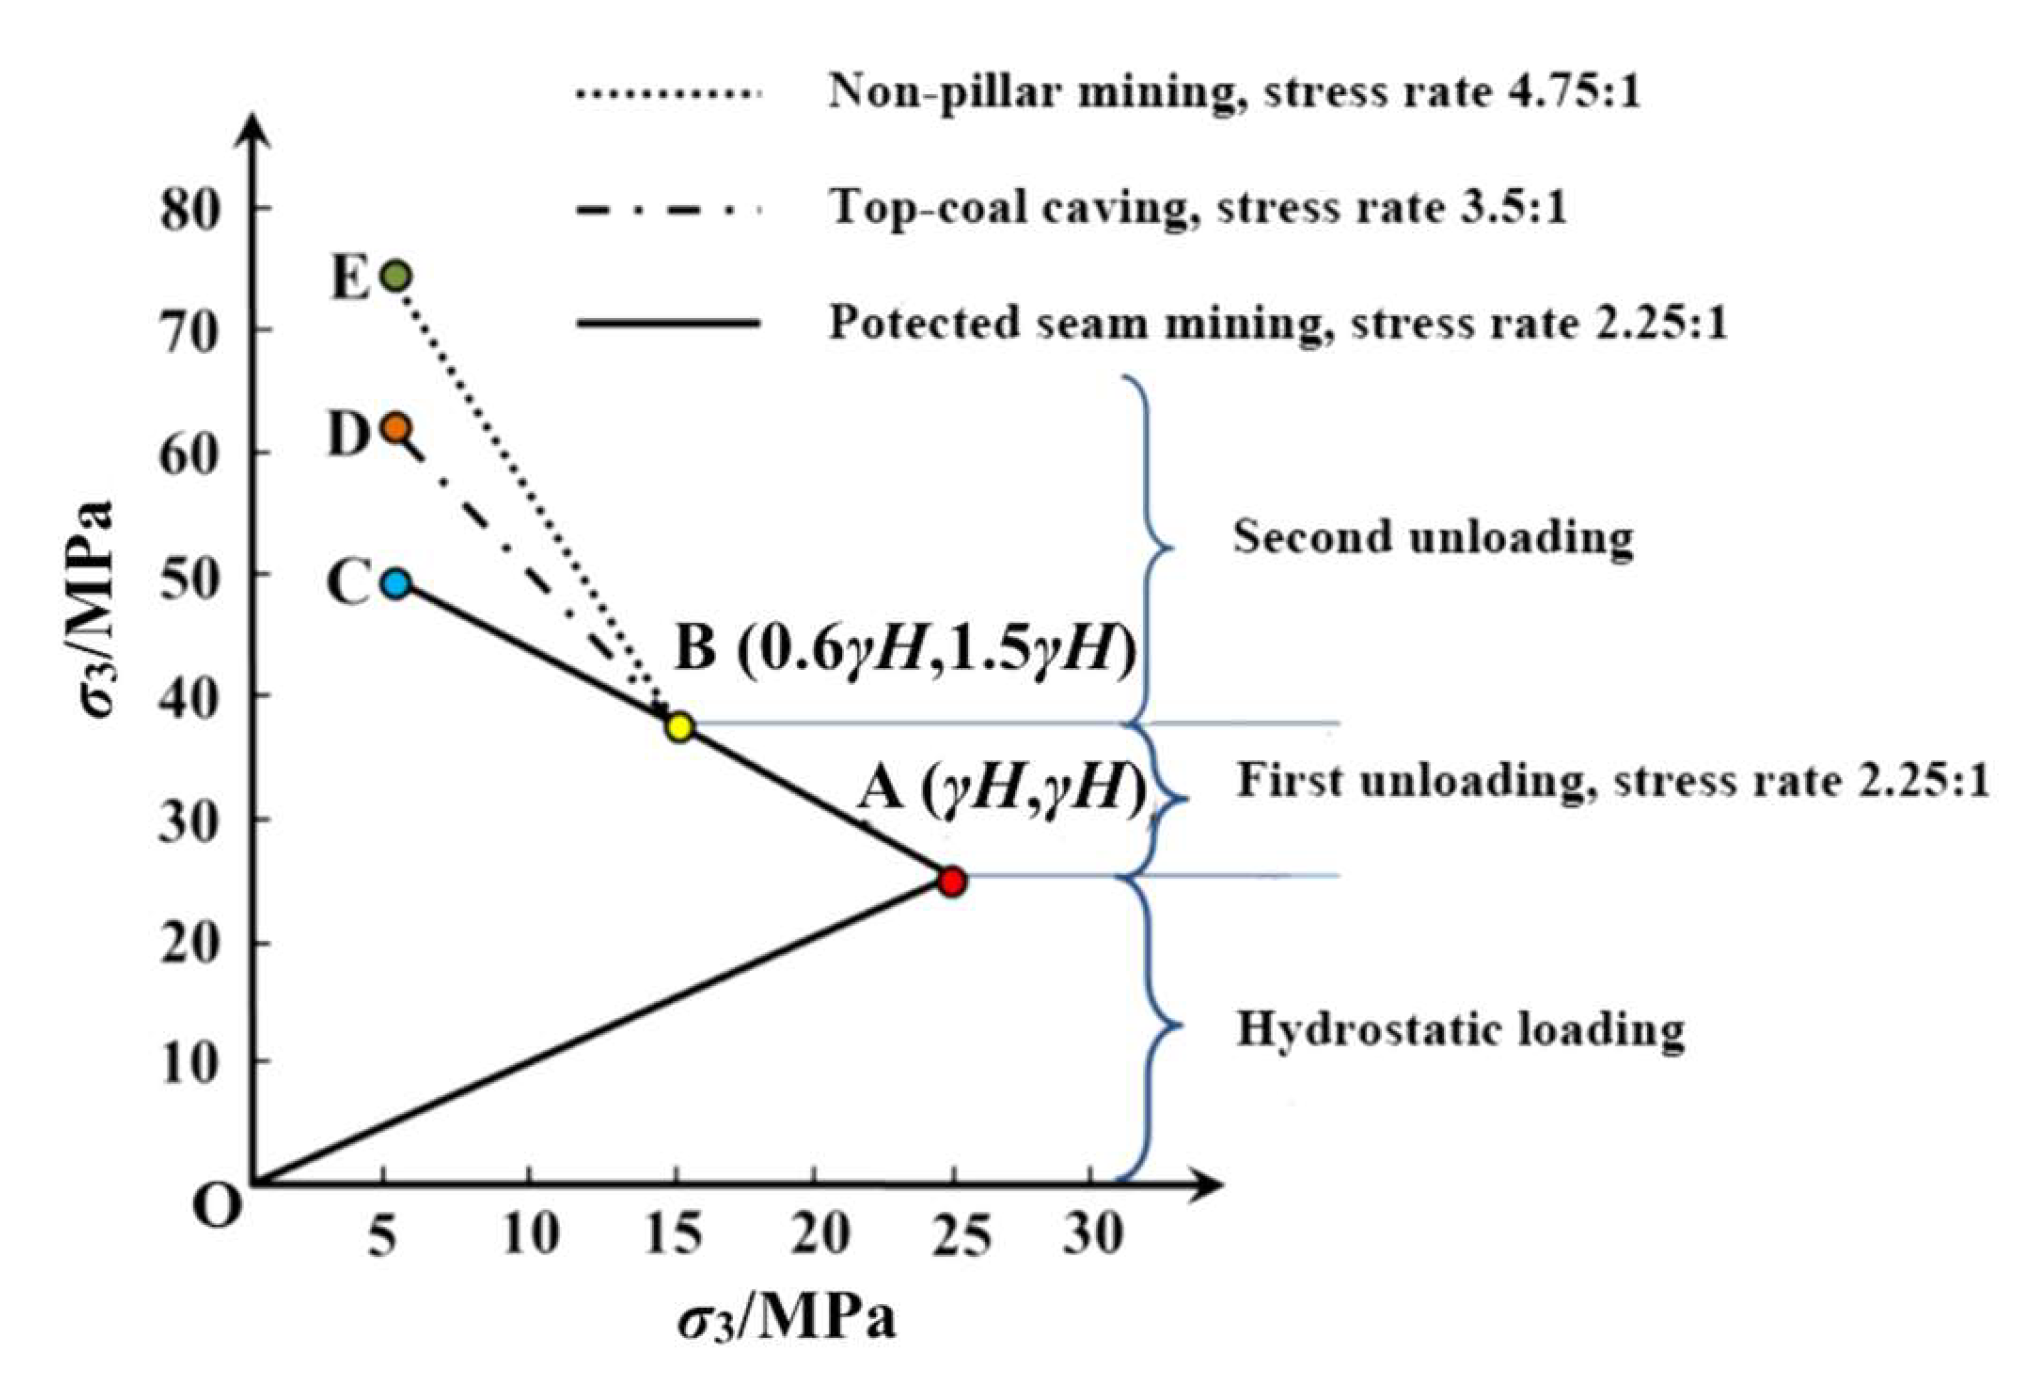
Samples were taken from working face 8105 of the Tashan Mine, operated by Datong Coal Industry Group Co., Ltd. The coal seam has an average thickness of 18.17 m. The coal was processed into cylindrical samples with a height of 100 mm and a diameter of 50 mm. Coal samples are relatively difficult to process, so there is always a certain amount of error between the actual and ideal samples. The statistical analysis of the 9 coal samples used in the test showed diameters in the range of 49.90 to 50.42 mm, and heights in a range of 98.53 to 100.46 mm. Some of the processed samples are shown in Figure 1.
Mechanical loading was performed using an MTS815 Flex test GT concrete and rock mechanics test system. An AE system (PCI-2, Physical Acoustics Co./PAC) was used for data acquisition. The test setup was exhibited in Figure 2. As shown in Figure 3, eight AE sensors were evenly placed on the outer wall surface of the triaxial pressure chamber (an upper and lower circle of four sensors each). The sensors were coupled with the wall of the pressure chamber by coating their contact area with Vaseline and fixing them using a rubber ring, and were used for real-time monitoring of the time parameters and spatial location of the AE events. The AE sensor model was a Nano30 resonator sensor, with a peak frequency of 300 kHz and a working frequency band of 100 to 500 kHz. Because the sensor was small (see Figure 3) and the chip was at the center of the probe, Vaseline was used as an adhesive to ensure that the chip of the sensor probe fully contacted the measured point, thus ensuring that AE signals could be received. In the test, the wave velocity was 1500 m/s and the threshold was 40 dB.

2.2. Test Process

According to various data collected from field tests, Xie et al. [12,35] summarized the variation characteristics of the abutment pressure of the coal mass in front of the working face induced by actual mining activities. The stress concentration coefficient α under different mining layouts differed under the condition of similar roof property and mining depth, which were 2.5–3.0, 2.0–2.5, and 1.5–2.0 respectively, in the order of nonpillar mining, top-coal caving and protective seam mining. Nonpillar mining is a longwall mining process in which there is no mining roadway and no reserves of coal pillars, while protective seam mining is characterized by mining the protective layer in advance, thus disturbing the adjacent coal seam to weaken its risk of coal and gas outburst. In the simulation experiment, it was assumed that α was 3.0, 2.5 and 2.0 for nonpillar mining, top-caving mining and protected seam mining, respectively. Therefore, based on the theory proposed by Xie et al. [12,36], the entire mining-induced mechanical loading (unloading) process can be divided into three stages: the hydrostatic pressure stage (OA), the first unloading stage (AB) and the second unloading stage (BC, BD, or BE), as shown in Figure 4. In Figure 4, γ refers to the average specific gravity of rocks on top of the coal seam and fc’ is the triaxial compressive strength of coal. The simulated mining depth was approximately 1000 m and the hydrostatic confining pressure in OA was defined as 25 MPa; from this, the horizontal and vertical stress in each stage can be calculated.
Figure 5 exhibits the loading (unloading) scheme corresponding to different mining layouts at 1000 m depth. In the first stage, to simulate the influence of initial hydrostatic pressure on coal rock before mining, the hydrostatic confining pressure was applied to an in situ stress state at point A (σ1 = σ3 = γH = 25 MPa) at the same confining pressure loading rate of 3 MPa/min under each of the three mining layouts. The second stage was the first unloading stage. With the occurrence of excavation disturbance, the axial stress of coal rock increased and the horizontal stress decreased. All three groups of coal samples were unloaded, starting from point A, at a confining pressure unloading rate of 1 MPa/min; at the same time, all were loaded to point B (σ1 = 1.5 γH = 37.5 MPa, σ3 = 0.6 γH = 15 MPa) at an axial pressure loading rate of 2.25 MPa/min. In other words, the axial stress was increased at a rate of 2.25:1 and the lateral stress was reduced. After point B, the specimen was divided into three loading paths to reflect the stress effect produced by different mining methods. The three mining layouts were associated with the same confining pressure unloading rate of 1 MPa/min and axial loading rates of 2.25 MPa/min (protective seam), 3.5 MPa/min (top-coal caving) and 4.75 MPa min (nonpillar) until sample failure.

3. Results

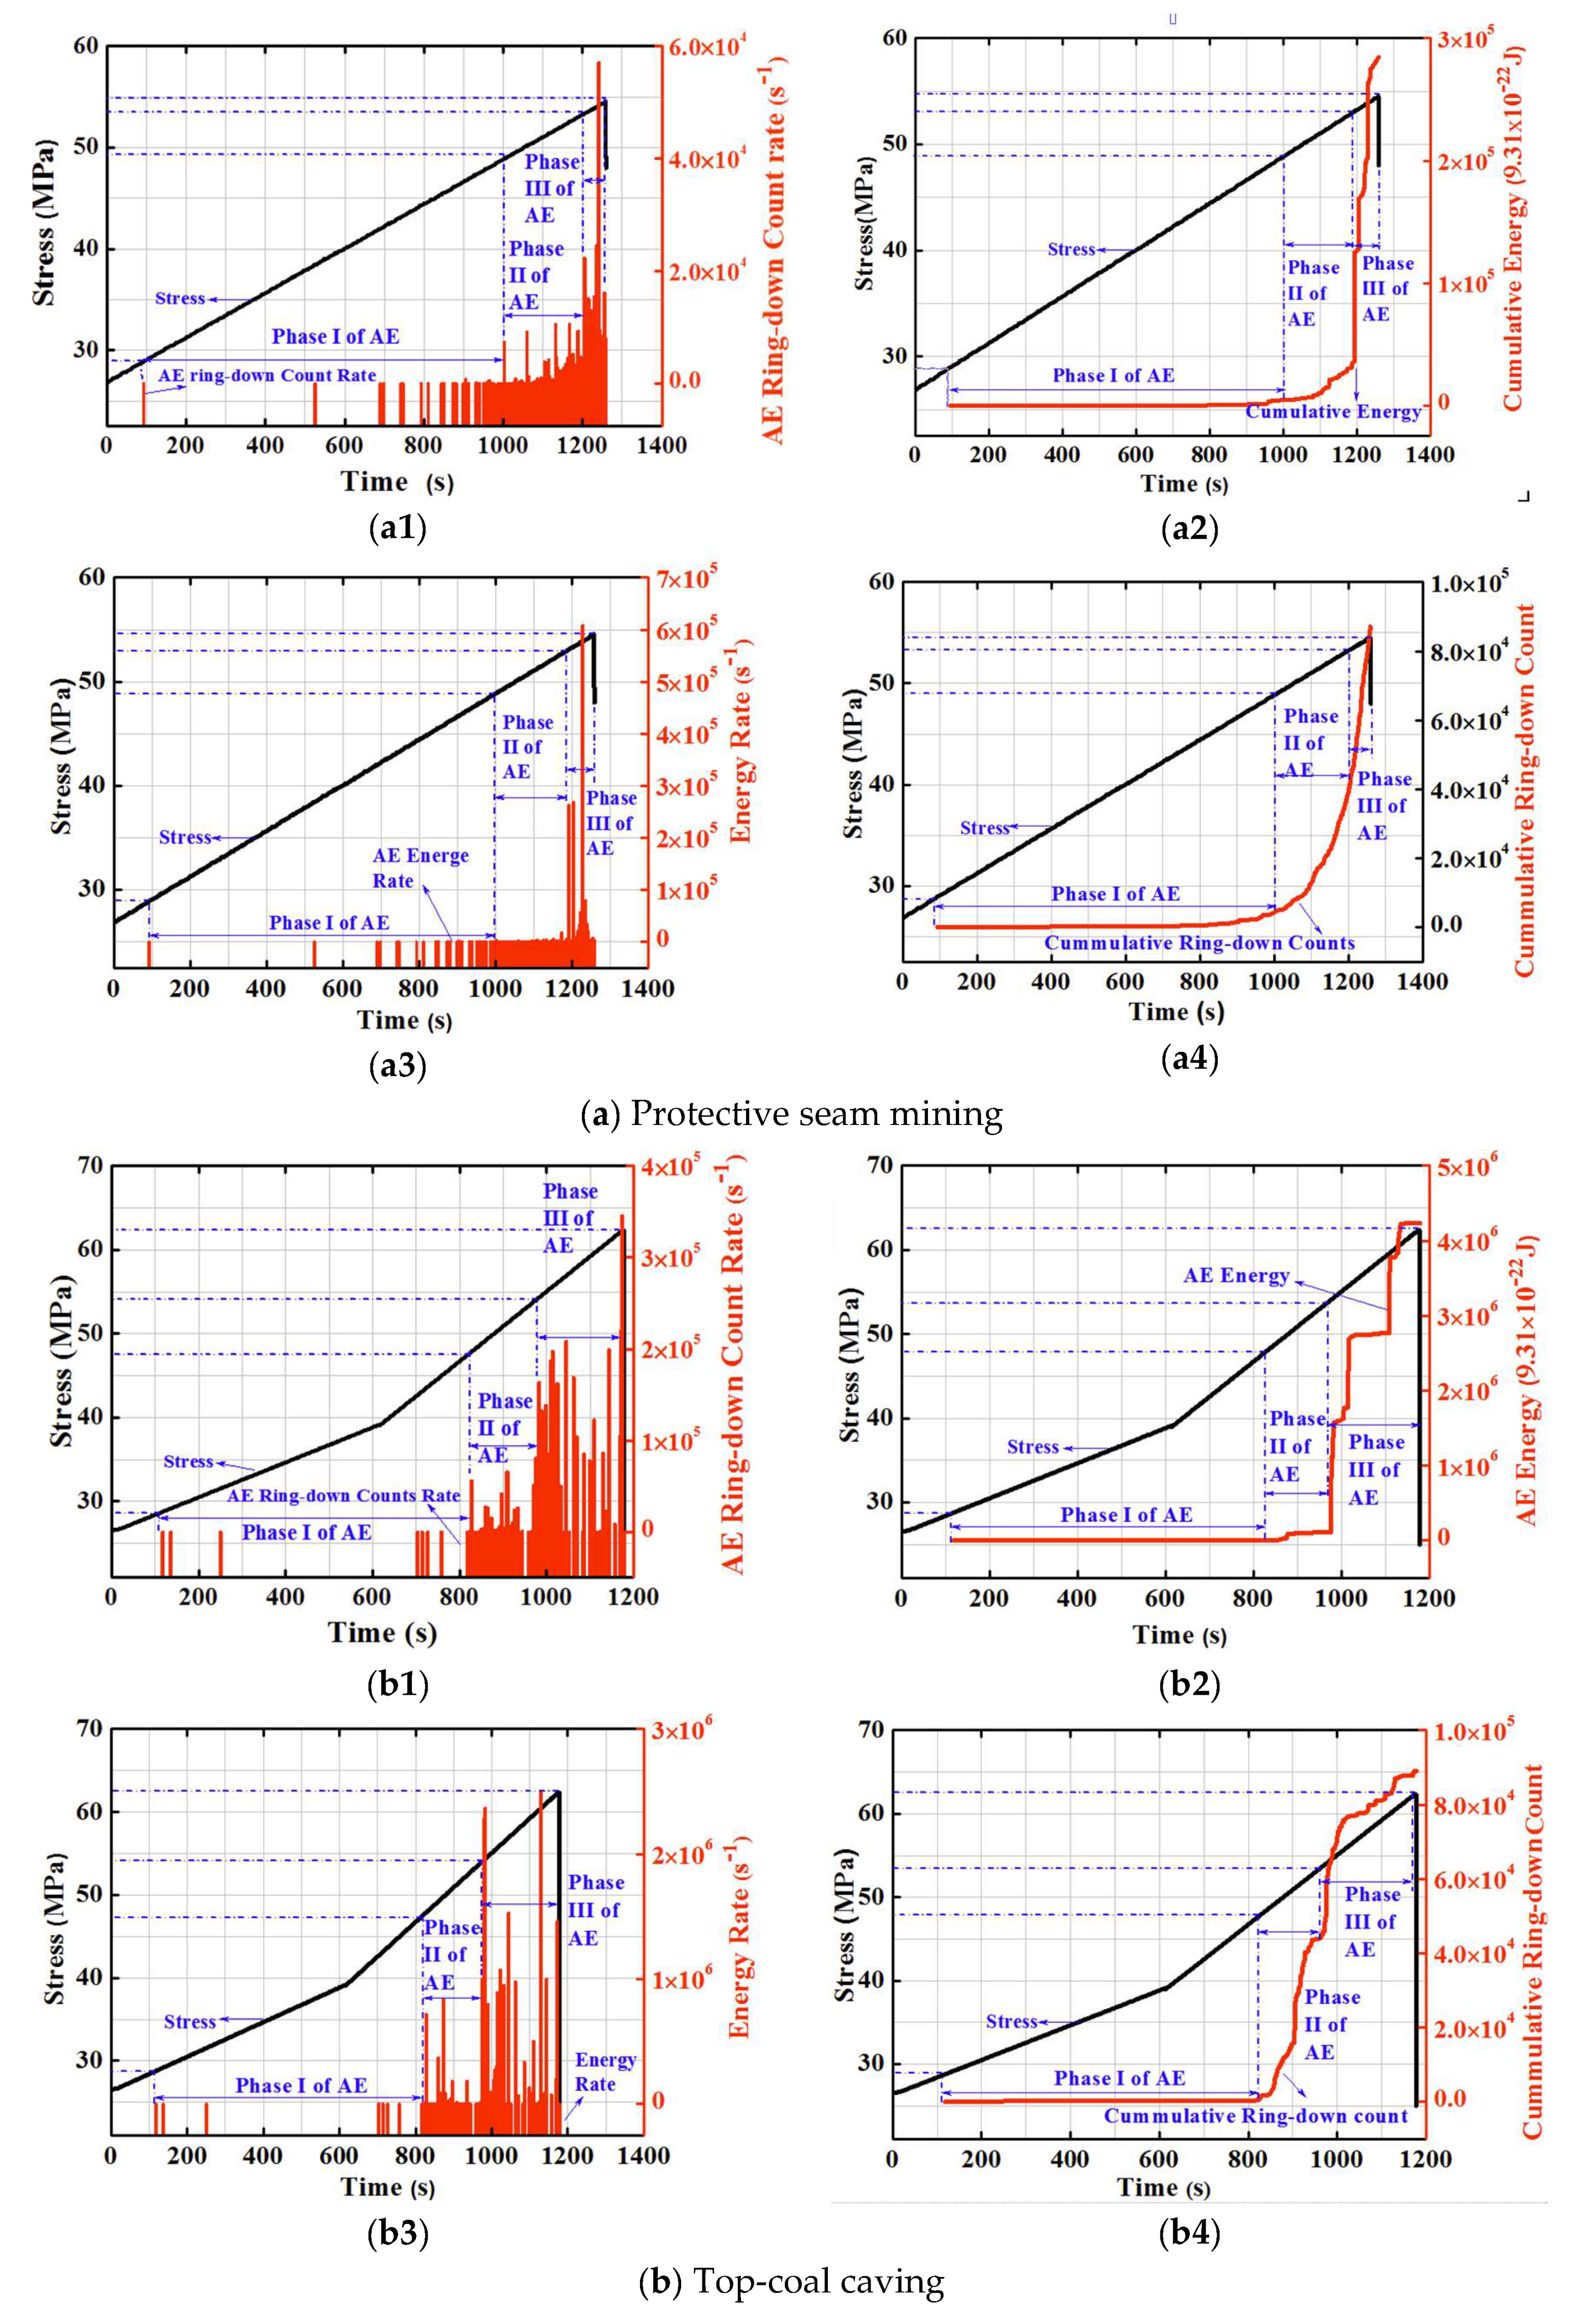
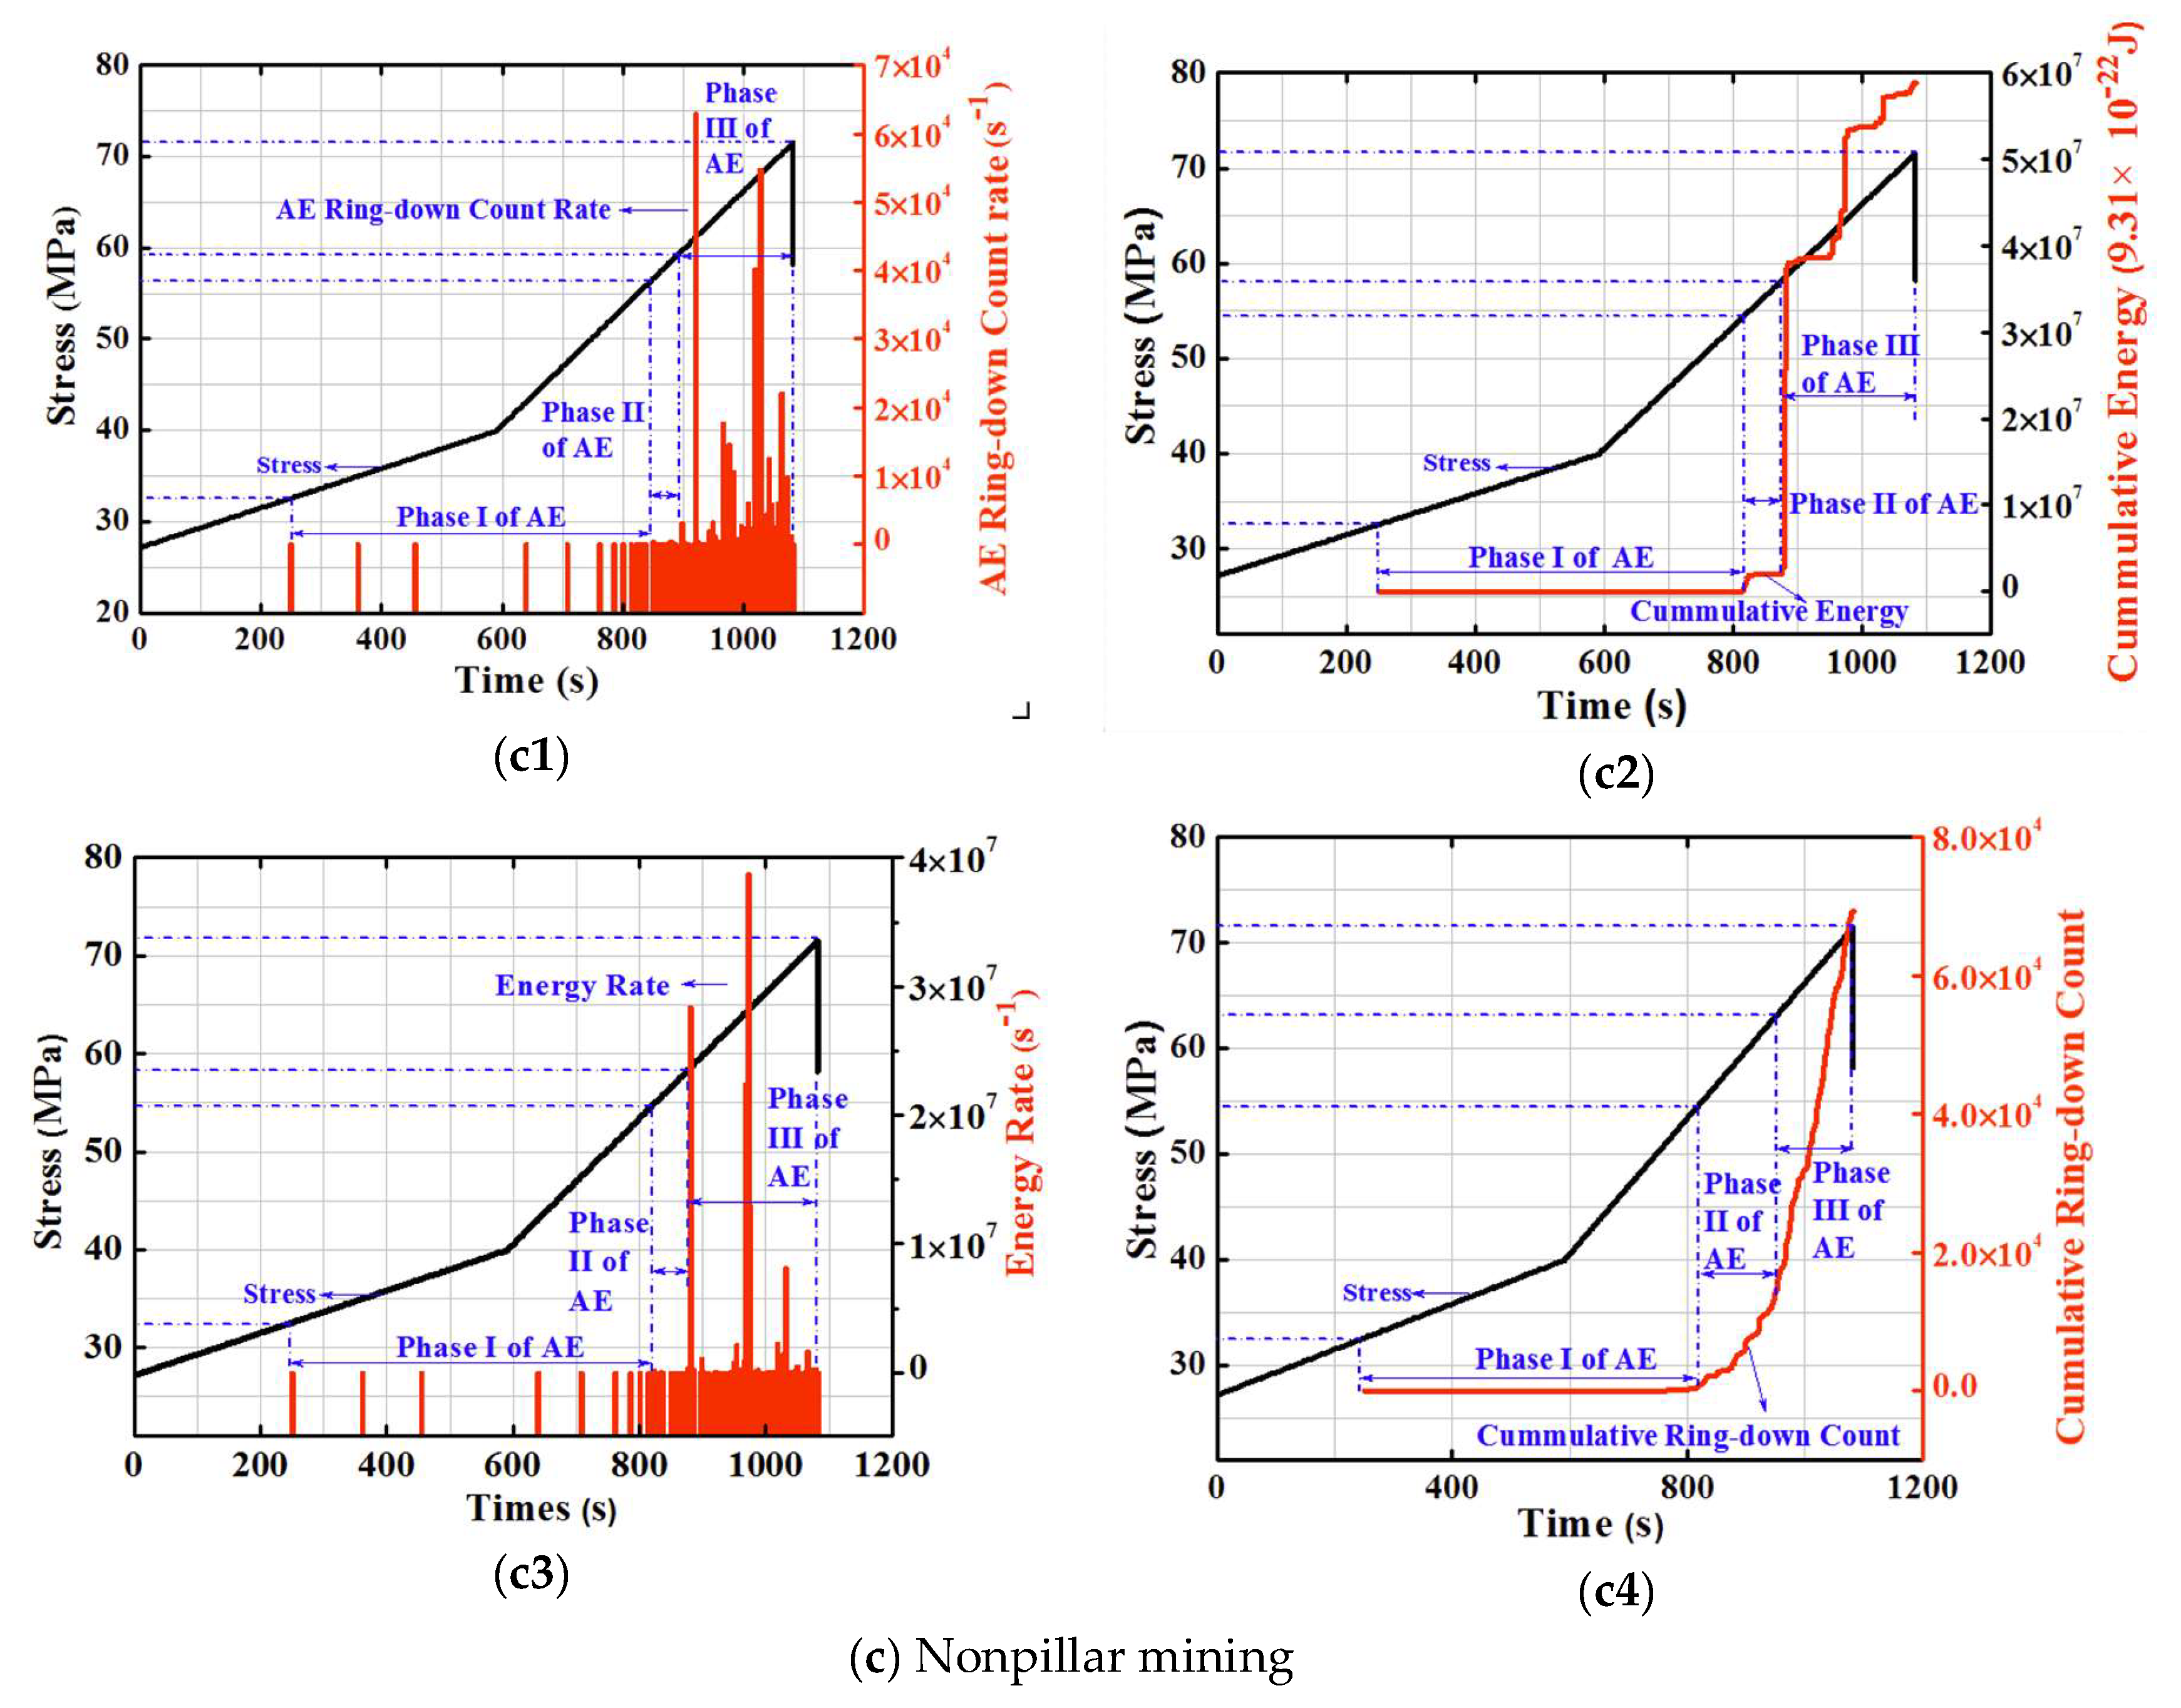
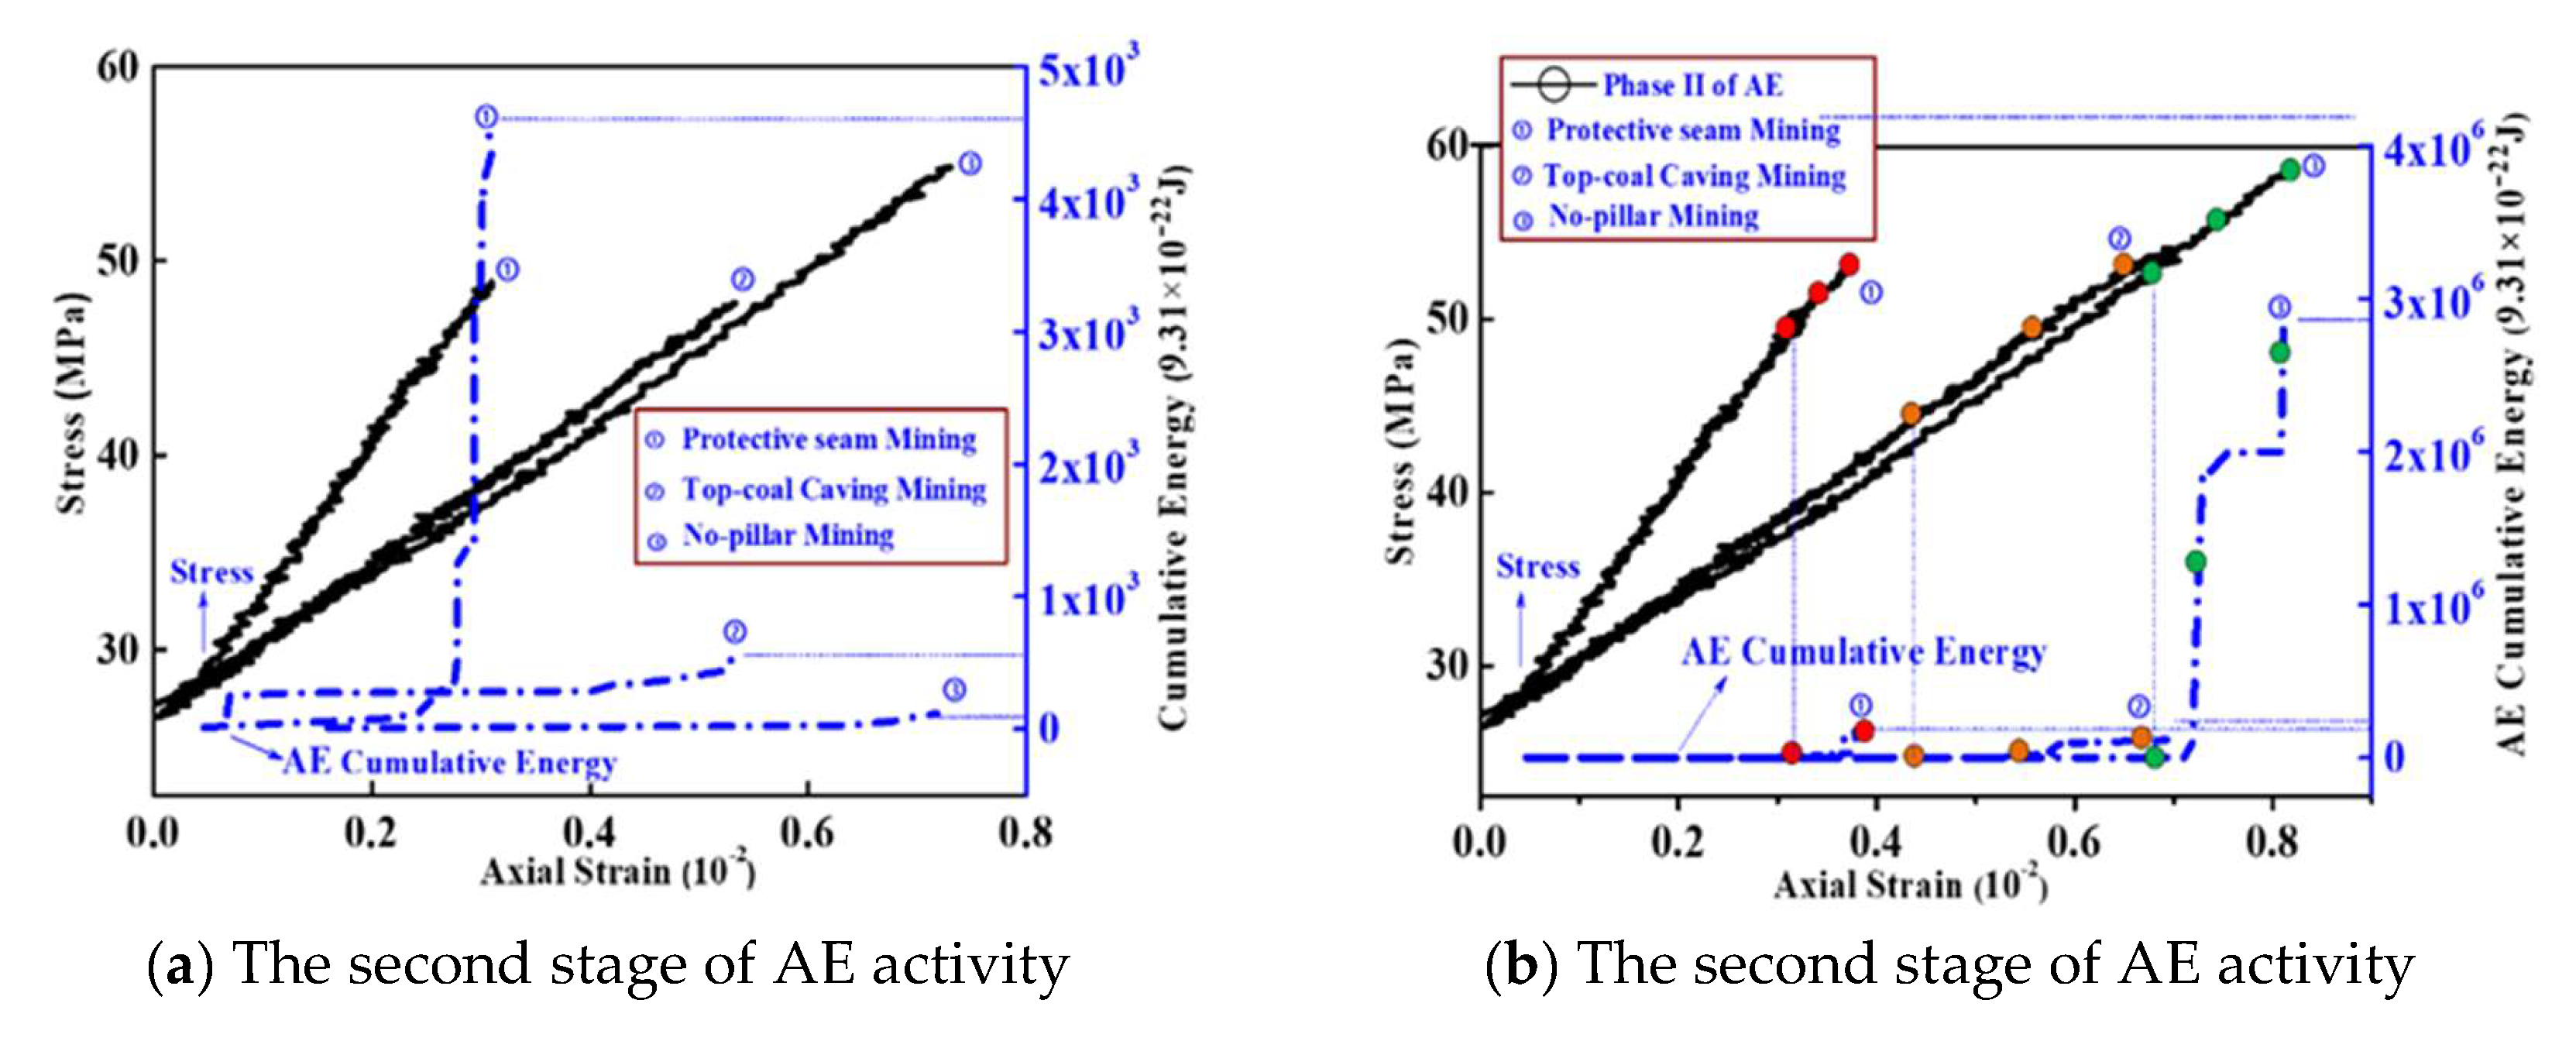
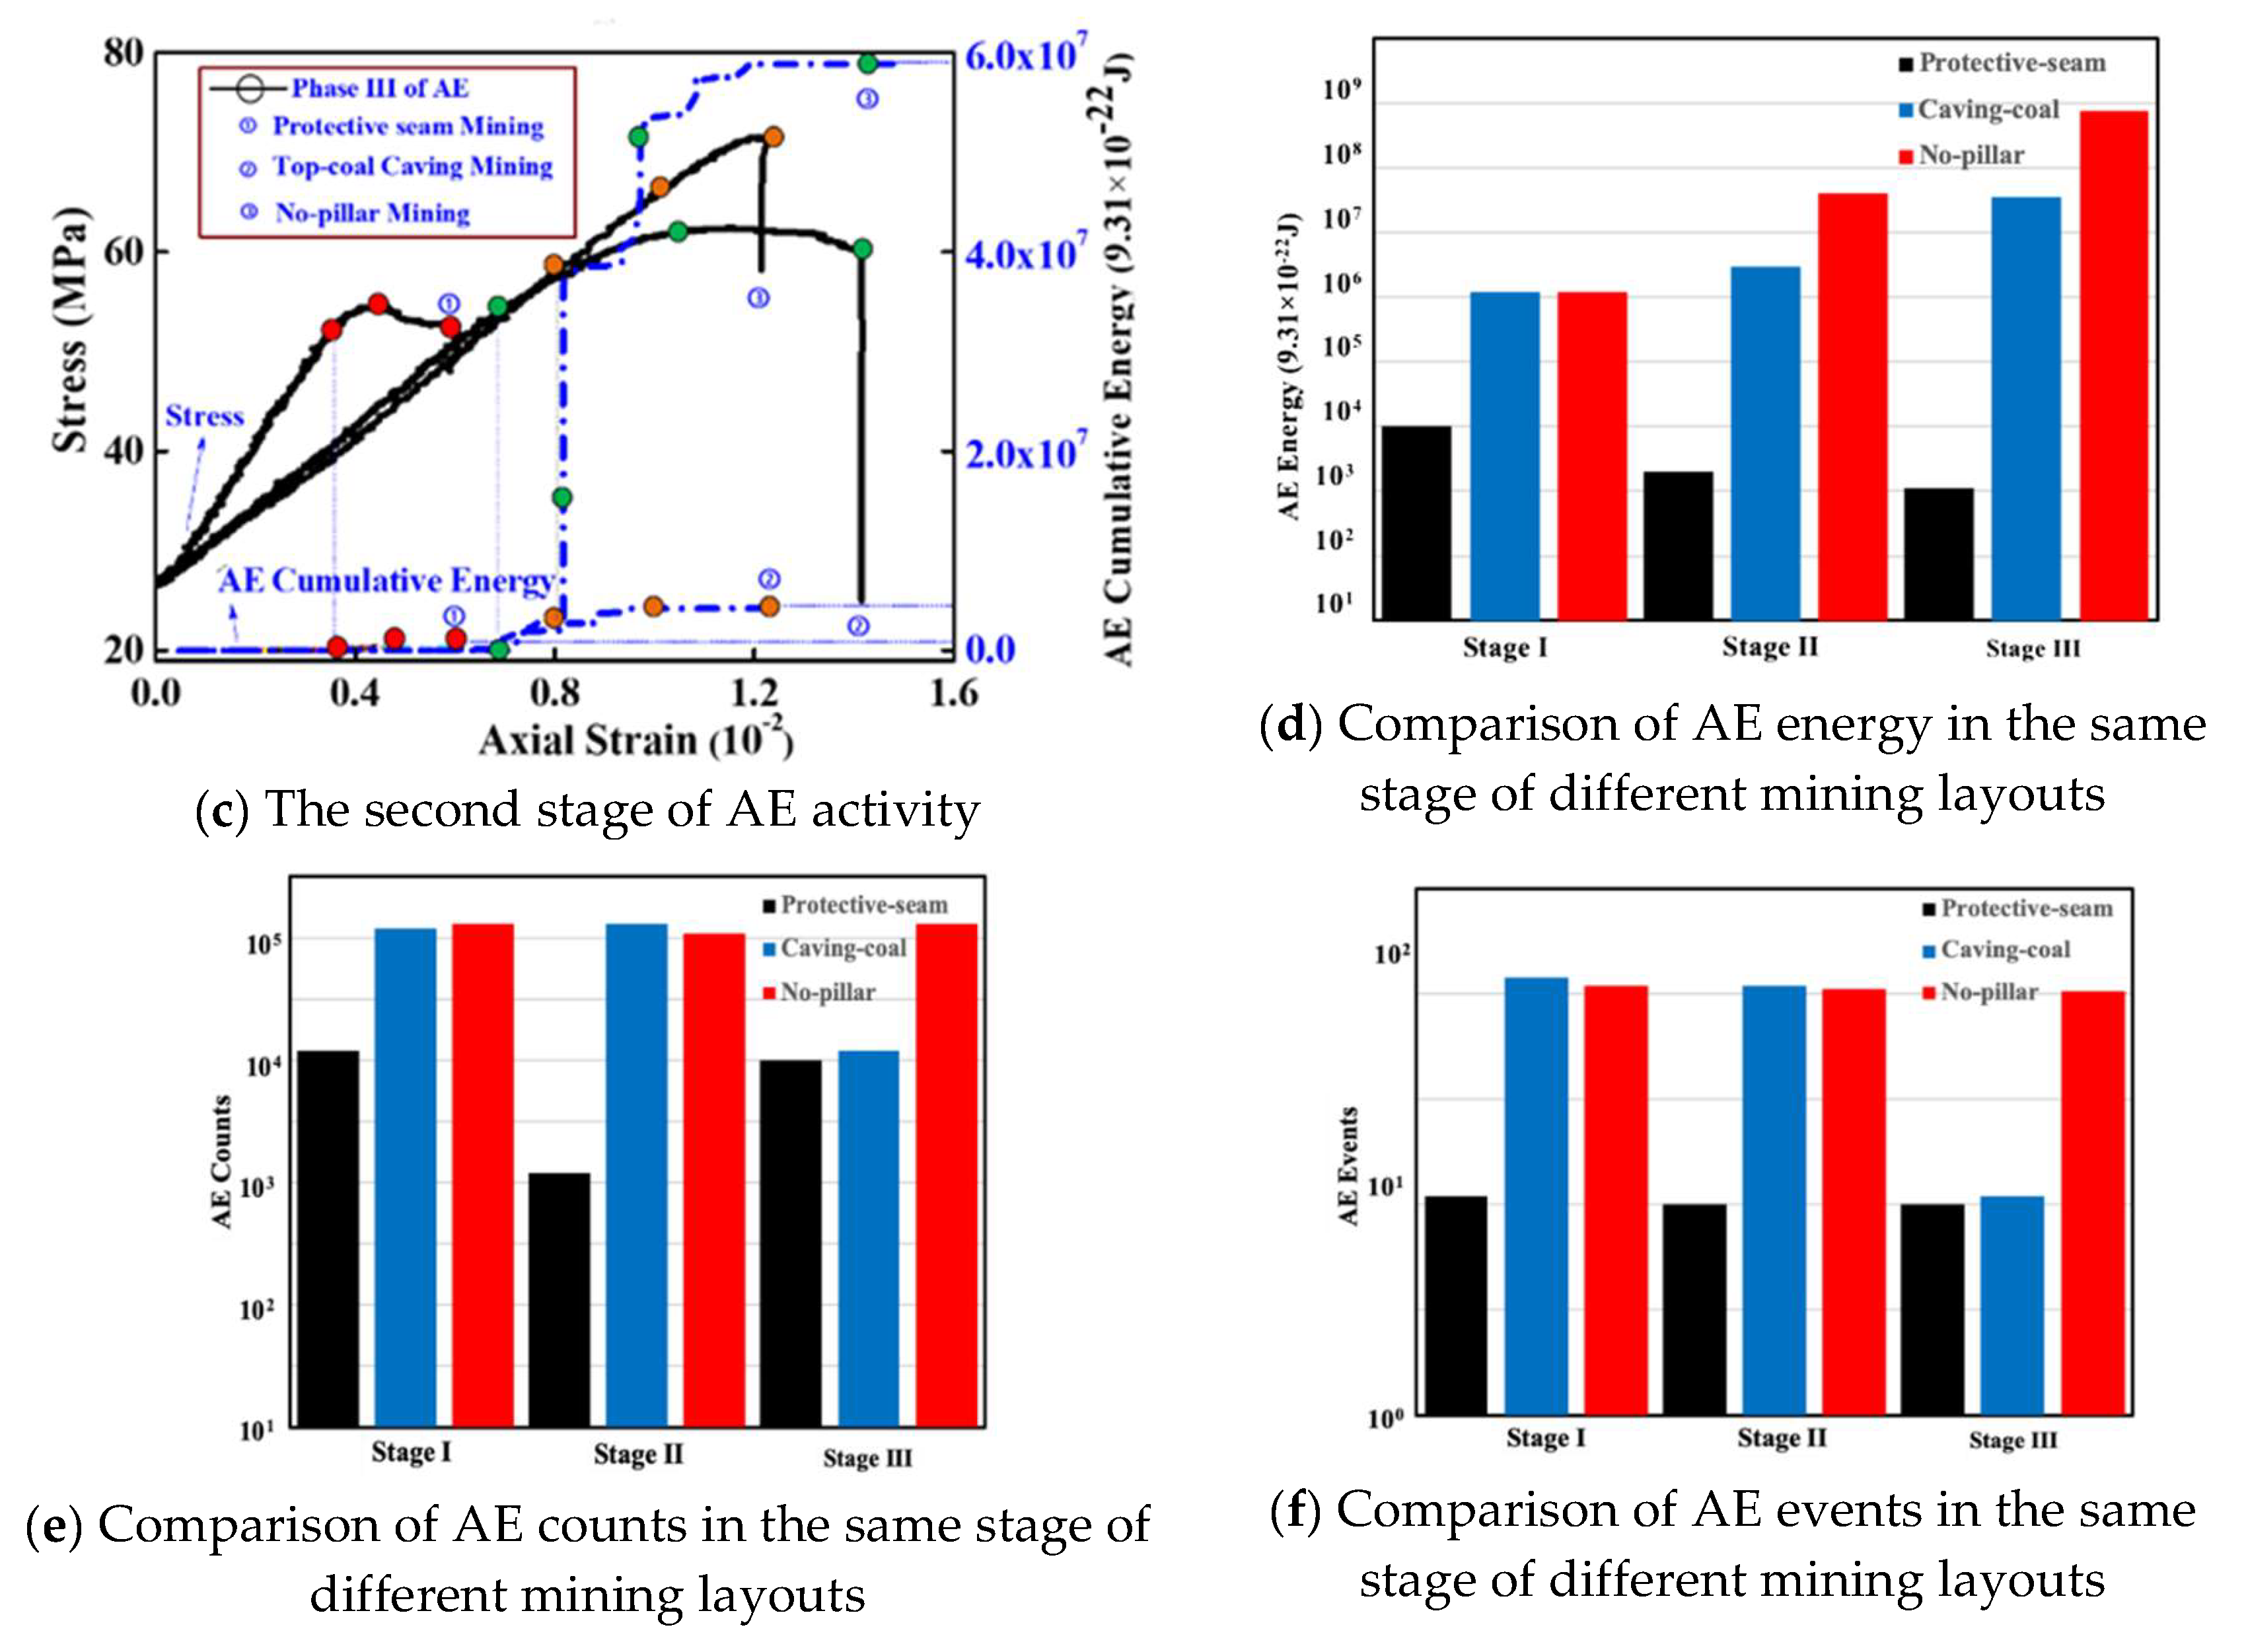
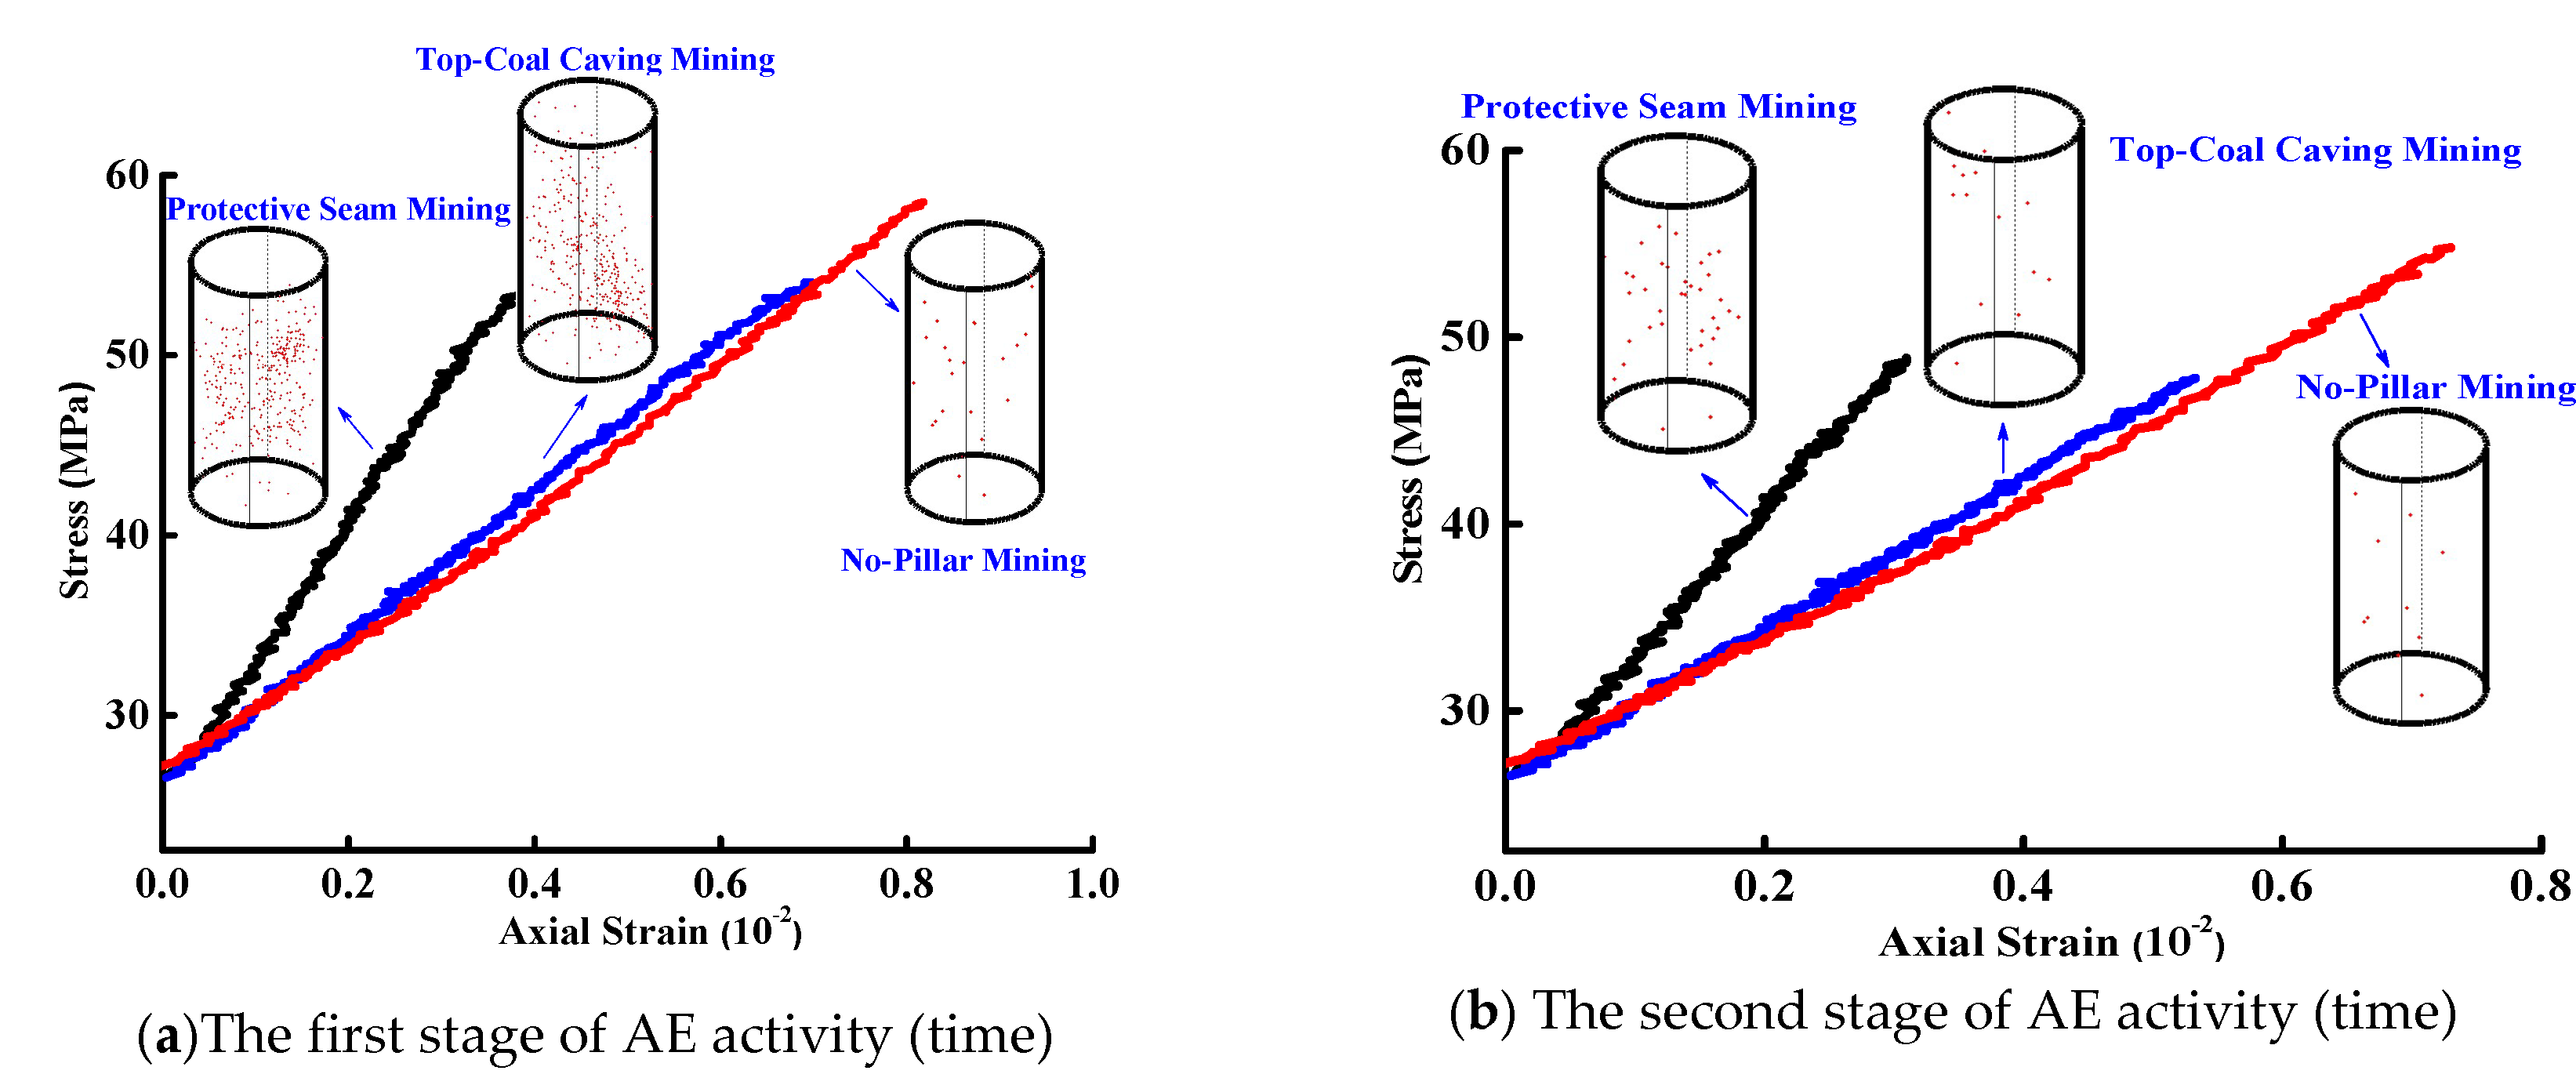
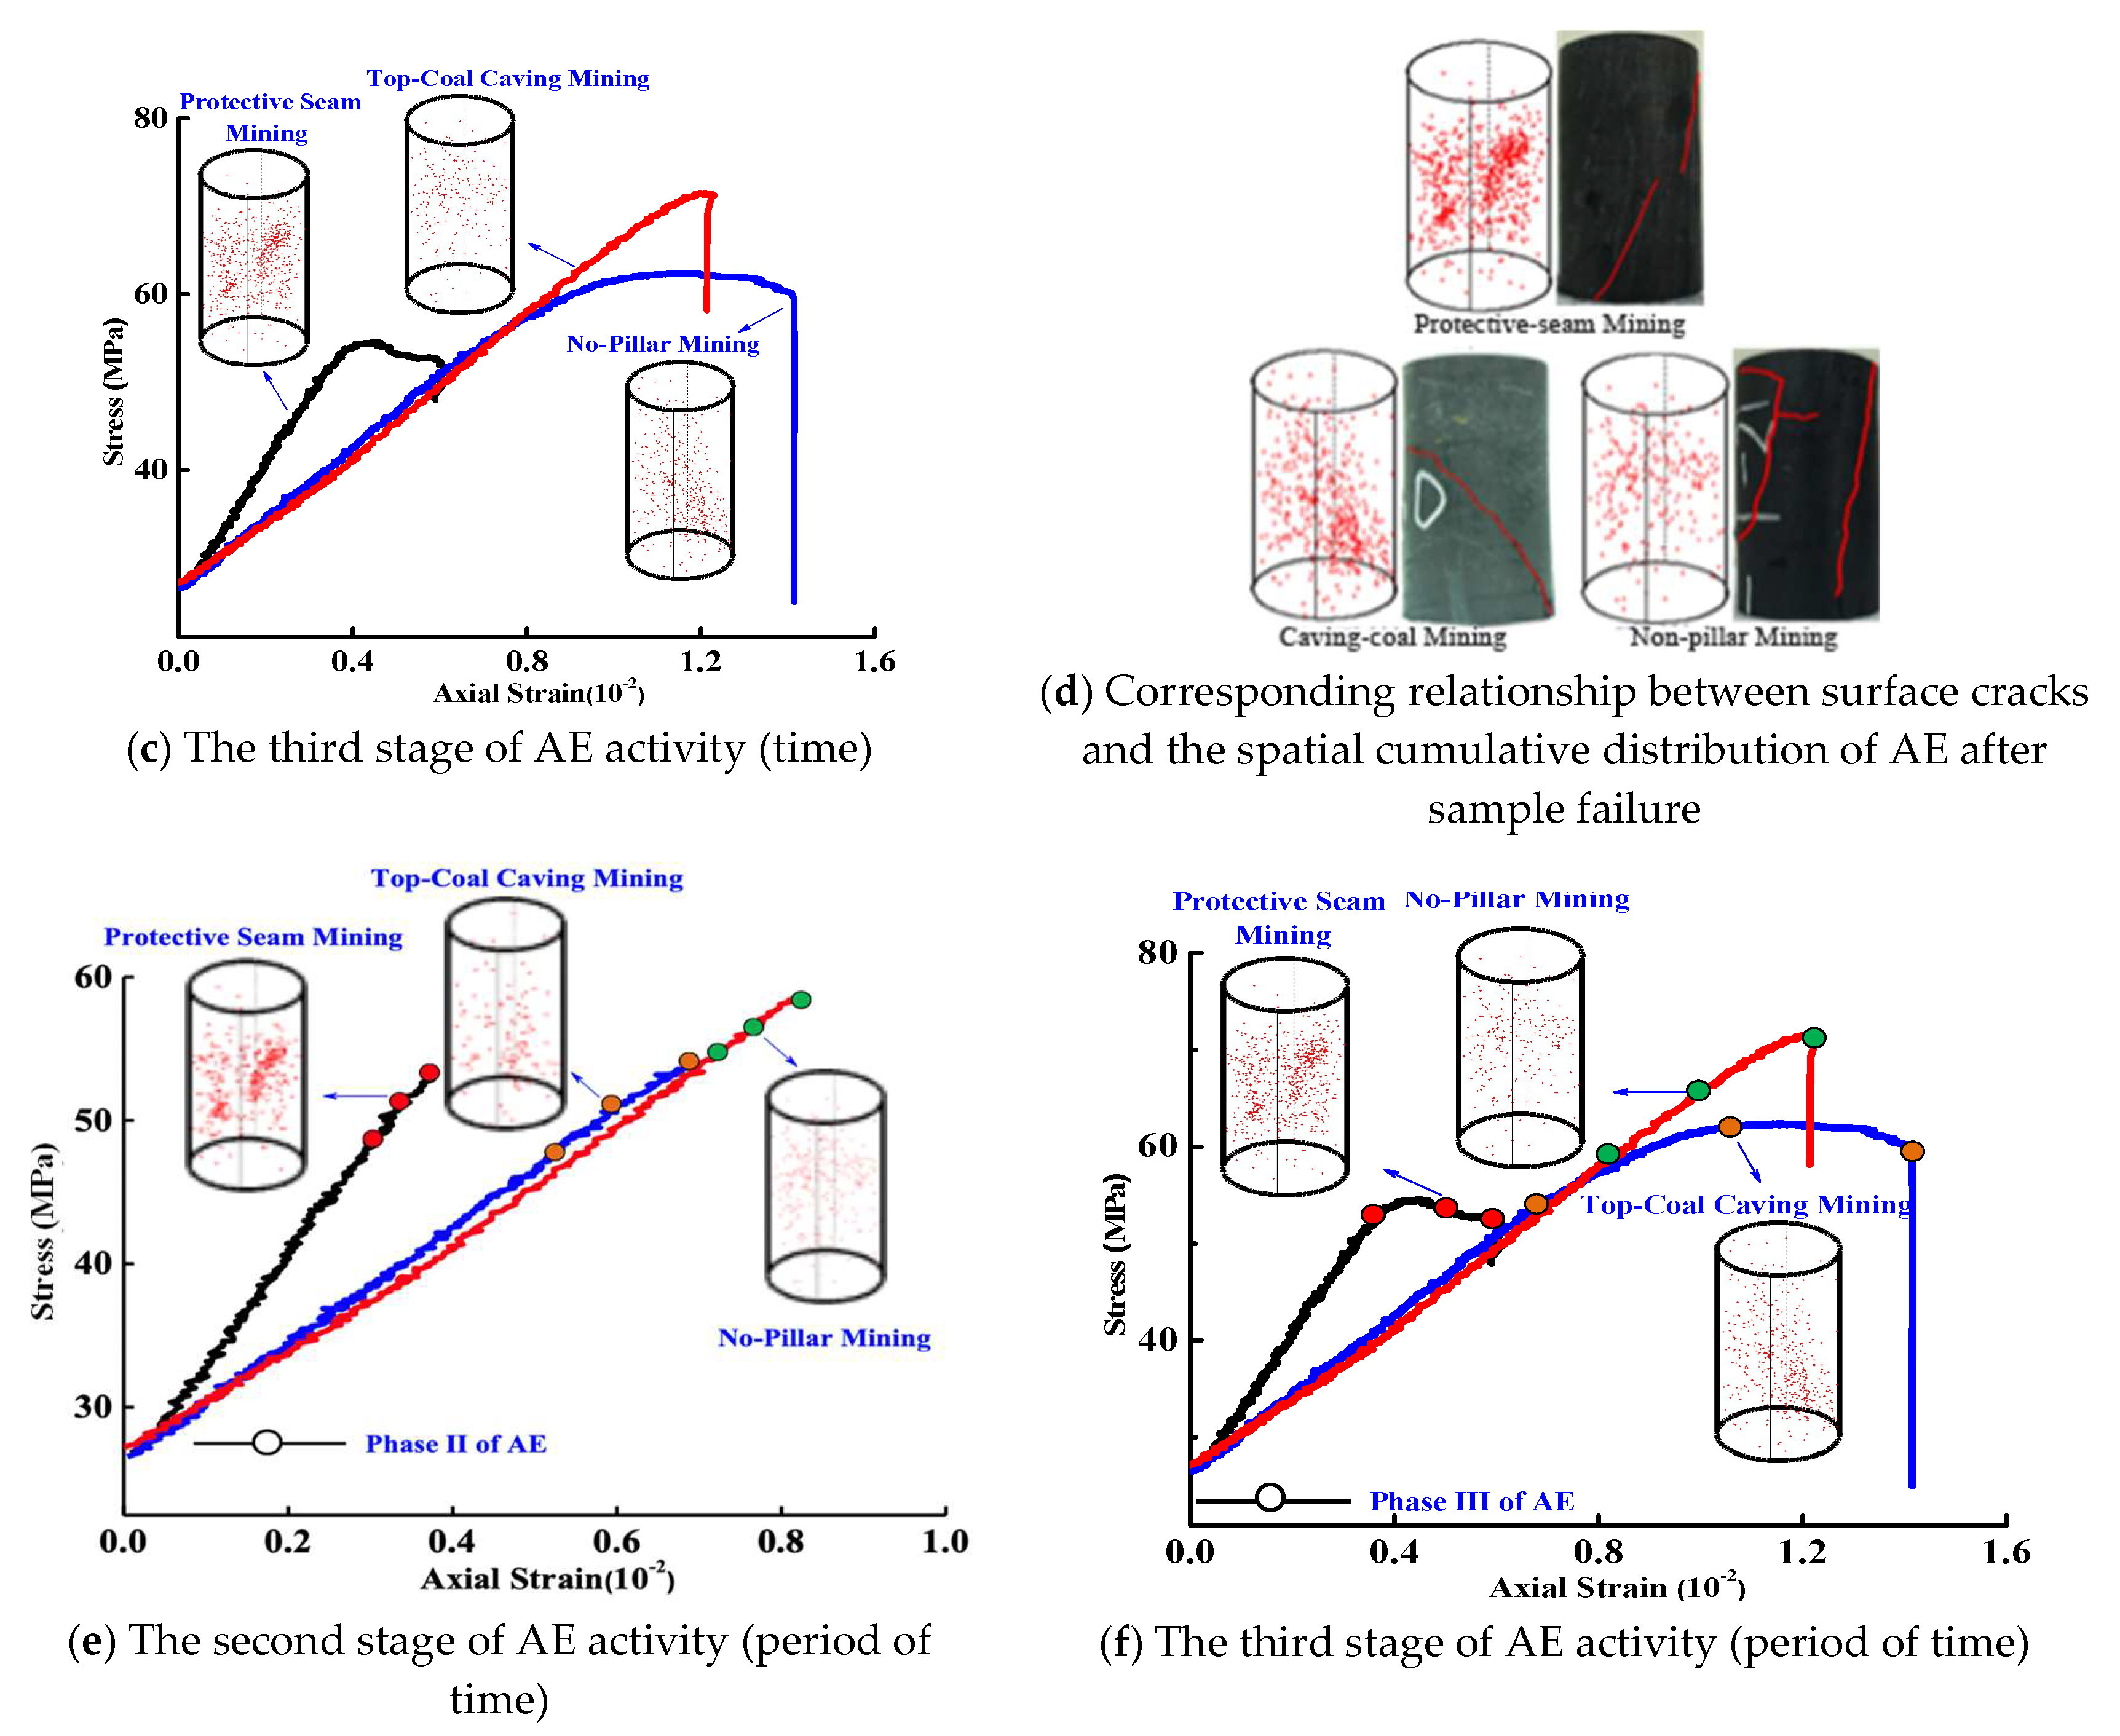
3.1. Characteristics of AE Time Series Evolution of Coal under Deep Mining Conditions

Of the AE data obtained by simultaneous real-time monitoring, the cumulative ring count and ring count rate reflect the frequency of AE occurrence, and the cumulative energy and energy rate reflect the intensity of AE occurrence. Figure 6 shows the variation in the AE ring-down count rate (a1,b1,c1), cumulative ring-down count (a2,b2,c2), energy rate (a3,b3,c3) and cumulative energy (a4,b4,c4) over time under the simulated deep mining condition at a depth of 1000 m. In Figure 6a–c correspond to protective seam mining, top-coal caving and nonpillar mining, respectively.
For rocks with prefabricated cracks, the crack initiation point and propagation process are the usual targets of research [37,38]. For cylinder specimens without macroscopic cracks, Cai et al. [27] concluded that rock experiences four stages: crack initiation, microcrack formation, crack coalescence and macrocrack formation under compression conditions. Coal has a complex structure with viscoelastic characteristics such as instantaneous deformation, elastic hysteresis and irreversible plastic deformation. Hence, its mechanical behavior is also complex, and cannot be simply described by the five-stage constitutive rock model. Studying the characteristics of the AE time series evolution curve can make the research results of the crack initiation point and propagation process more convincing. Figure 6 shows that the overall AE activity exhibited three characteristic stages over time. During the first stage of AE activity, the overall AE activity was at a low level. In the second stage, the amplitudes of the AE ring-down count rate and energy rate showed a significant increase compared to those in the previous stage on average, and began to exhibit a cluster characteristic with time, but had a small range of fluctuation (see Figure 6 (a1,a3,b1,b3,c1,c3)). The AE cumulative energy and cumulative ring-down count began to increase slowly (see Figure 6 (a2,a4,b2,b4,c2,c4)). In the third stage, the amplitudes of the AE ring-down count rate and the energy ratio changed abruptly compared with those in the previous two stages on average, and exhibited an increasingly strong clustering characteristic with time. In this stage, the cumulative energy curve began to show a relatively high step, increasing by an order of magnitude in a few seconds. It can be concluded that the three variation stages of AE activity correspond to the three processes (i.e., microcrack initiation, stable propagation and unstable propagation) inside the coal.
Statistical analyses were performed on the characteristic points of the three AE activity stages of coal under three mining layouts, as shown in Table 1. The starting point for each of the three AE activity stages corresponding to the three mining layouts (i.e., nonpillar, top-coal caving and protective seam) is associated with an increasing stress level, allowing the occurrence timing of rupture initiation and main rupture activity under the above mining layouts to be ranked in ascending order.
Based on the three stages of AE activities quantitively divided previously, the stress-strain curves can also be divided into three parts. Figure 7a–c shows the relationship between the released AE energy and the axial strain at the three characteristic stages under each of the three mining layouts plotted in the same coordinate system. Combined with Figure 7d, the following can be observed. In the first stage of AE activity, the axial stress and strain under each of the three mining layouts were in an elastic range; the magnitude of released AE energy was on the order of 9.31 × 10⁻¹⁸ to 10−20 J. In the second stage, the coal deformation progressed from the elastic stage to the elastoplastic deformation stage; the magnitude of released AE energy increased to the order of 9.3 × 10⁻¹⁵ to 10−17 J. In the third stage of AE activity, the stress-strain relationship curve showed an increase in curvature and exhibited a stress plateau, indicating plastic deformation of coal in this stage; the released AE energy was in the range of 10−15 to 10−17 J. Therefore, it can be seen that, for each of the three mining layouts, the AE energy was mainly released during the second and third stages of AE activity. Thus, these two stages can be considered the main stages of coal rupture.
In the main stages of coal rupture, the statistical results of AE events or ring-down counts (Figure 7e,f) revealed that there was no significant difference in the order of magnitude of AE events and ring-down counts under the three mining layouts. This indicates that there was no significant difference in the number of ruptures under the three mining layouts. The cumulative released AE energy was ranked in the order of nonpillar > top-coal caving> protective seam, and the former was an order of magnitude higher than the latter, indicating that in the third stage, cracks in the coal underwent unstable propagation, and the difference in mining layouts led to the difference in the rupture strength of coal, i.e., a single rupture under nonpillar mining released more energy than under the other two methods.

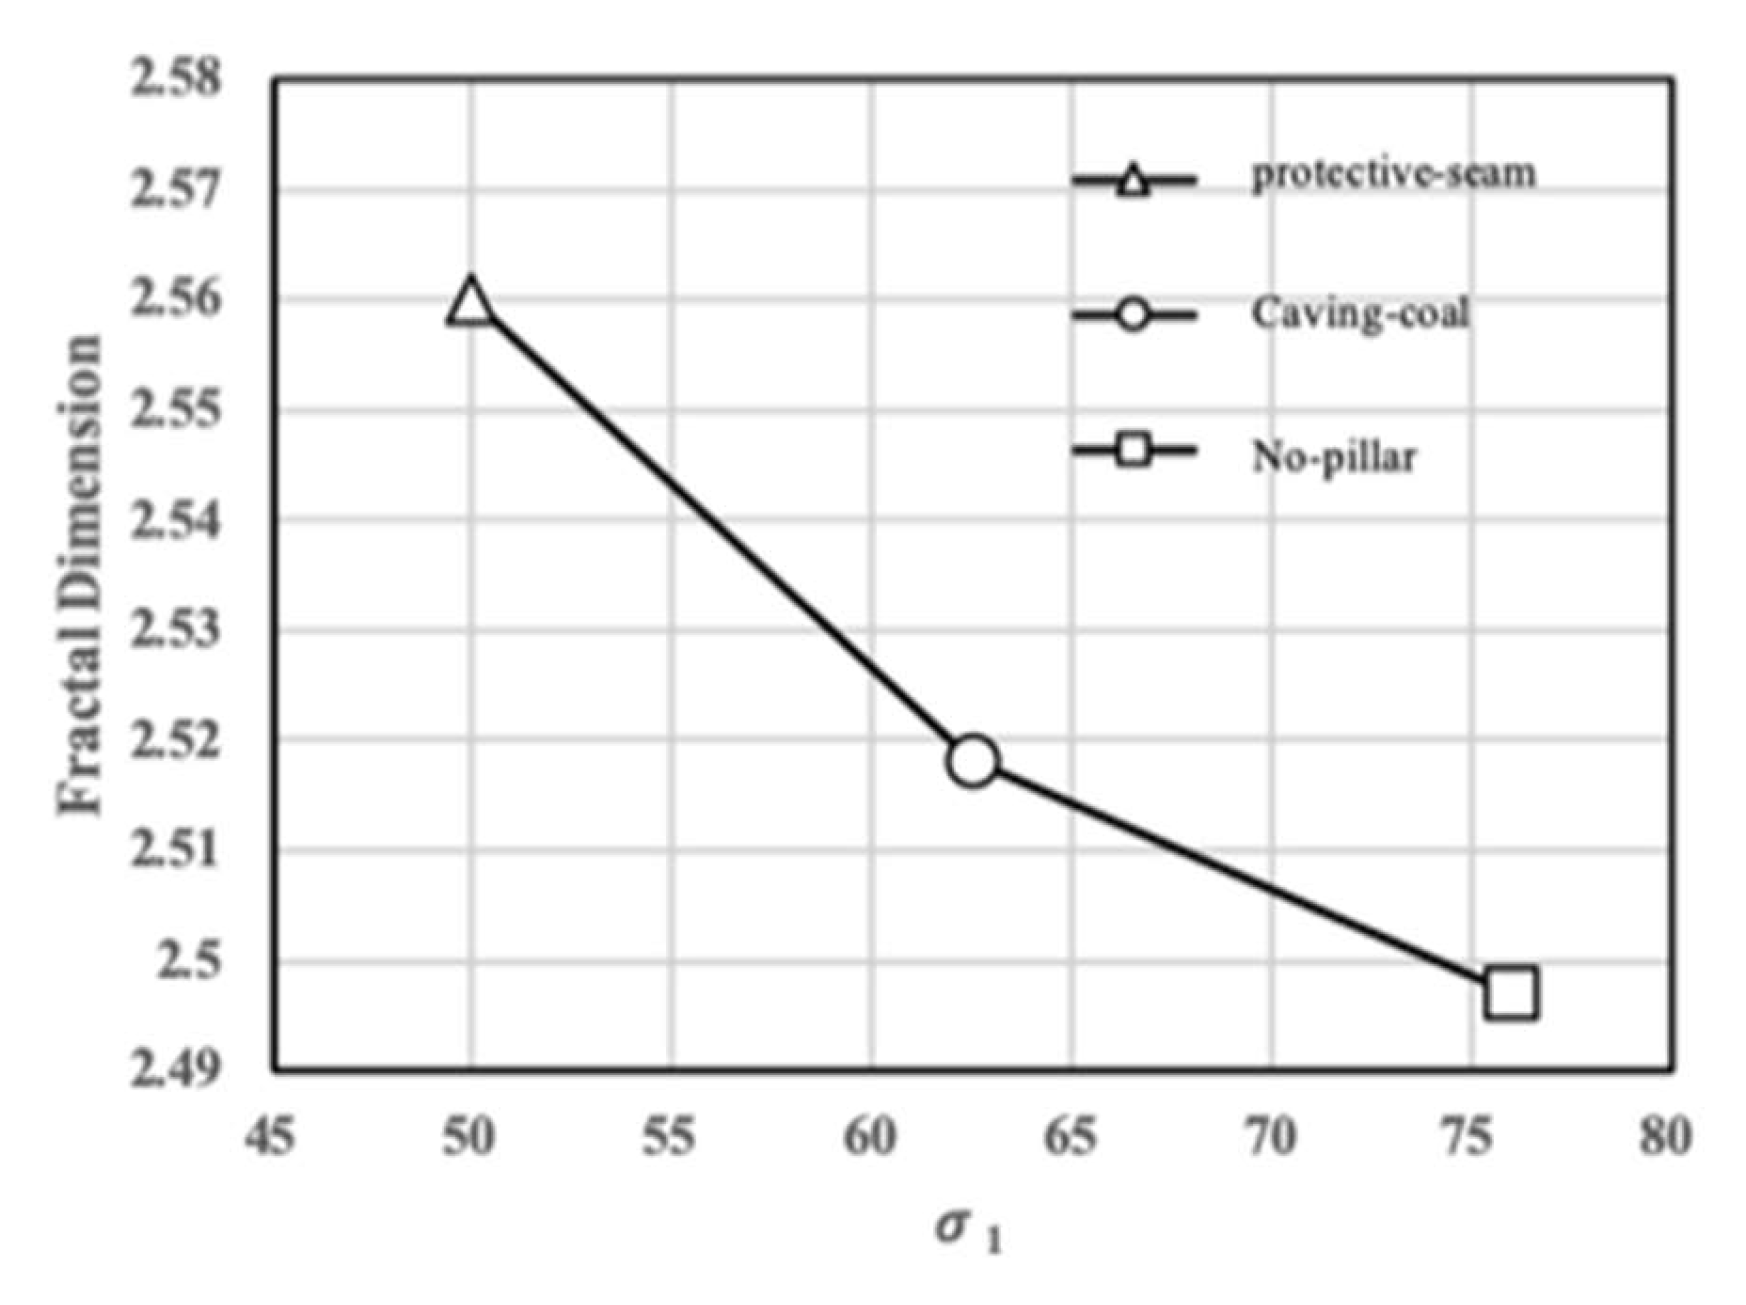
3.2. Spatial Evolution and Fractal Characteristics of AE of Coal under Deep Mining Conditions

According to the defined standard for the three-stage evolution of the AE time series, Figure 8 shows the spatial relationship between the AE event and the strain under different mining layouts. In the first stage, AE events were distributed inside the sample, as shown in Figure 8a. At the end of the second stage, the coal material began to yield, and a main AE cluster area formed, as seen in Figure 8b,e. In the subsequent evolution process, the generated AE was concentrated in the main cluster area, as seen in Figure 8c,f, corresponding to the main coalescing area of coal cracks, as shown in Figure 8d. After the completion of the entire experiment, the cumulative morphological distribution of AE spatial localization had a consistent corresponding relationship with the macrocracks in the ruptured coal mass experiencing the complete mining process. The coal failure mode under each of the three mining layouts can be preliminarily determined from Figure 8d as follows: The sample corresponding to the protective coal-seam mining failed under compression, and the coal corresponding to top-coal caving mining and nonpillar mining failed under tension.
Fractal geometry provides a quantitative method for testing spatial morphology. Hirata et al. and Zhang et al. [39,40] used AE localization tests to verify that the spatial distribution of AE events has fractal characteristics. The evolution process of the AE spatial distribution under the influence of coal mining can be viewed as a transition from a disorderly to an orderly state, and the fractal dimension provides us with an accurate order parameter describing the AE activity during such a transition.
The general formula for solving fractal dimension D is
logN = logaDlogδ,
Boxes of different sizes δ were used to cover the study objects, and the total number of boxes covering the study objects was denoted as N. A set of (δ, N) data obtained in the covering process is presented in a log-log plot, and the slope is the fractal dimension D.
The cylinder covering method [41] was used for the fractal measurement of AE spatial localization. The mass center of the cylindrical sample was used as a base point, and a small cylinder (with a radius of r and a height of h) proportional to the sample with respect to the height-diameter ratio was taken. By simultaneously increasing r and h, the number of AE localization points covered by each cylinder was counted, and then Equation (1) was used to obtain the cluster dimension of AE spatial location points.
Figure 9 shows the relationship between the AE spatial fractal dimension and the peak stress at the coal peak stress location plotted in the same coordinate system. As the peak stress increased, the AE spatial fractal dimension decreased successively under the protective seam, top-coal caving and nonpillar mining layouts.
In a deep mining process, under the influence of confining pressure unloading (Figure 9), the spatial microcracks were clustered into two-dimensional (2D) variants, resulting in a relatively small fractal dimension corresponding to the peak stress. At the peak stress location, nonpillar mining corresponds to the lowest fractal dimension, which is closest to the 2D stress state, indicating that the nonpillar mining layout resulted in a higher degree of unstable coal mass rupture in front of the working face. The higher degree of coal mass rupture indicates a lower energy accumulation, and implies that the possibility of coal burst risk tends to be low, which coincides with views, based upon practical applications, that nonpillar mining is a relatively safe mining scheme to reduce rock burst likelihood. In nonpillar mining, the working face outside the seam line of the pillar is not reserved, and the roof strata will collapse to the goaf, generating roadside support under the influence of the gangue retaining system behind the support. That process also releases the accumulative energy in the surrounding rock, thereby reducing the risk.

4. Conclusions

Based on three typical mining layouts, i.e., protective coal-seam, top-coal caving and nonpillar mining, the coal mining process at a depth of 1000 m was simulated through mechanical tests on a laboratory scale, and simultaneous AE localization of this process was carried out to study the AE characteristics under deep coal mining conditions. Based upon this, the following conclusions were drawn:
(1)
Under deep mining conditions, the time series evolution of AE activity exhibits three-stage characteristics, which correspond to the processes of initiation, stable propagation and unstable propagation of cracks in the coal.
(2)
Under deep mining conditions, the occurrence timing of the main ruptures of the three-stage coal activities may be ranked in descending order, i.e., protective coal seam, top-coal caving and nonpillar mining layouts. The number of cumulative AE events and the number of AE ring-down counts of the three mining layouts were on the same order of magnitude. The accumulated AE energy released by the coal mass in front of the working face of the protective coal seam was one order of magnitude lower than that of caving coal; similarly, the accumulated AE energy of caving coal was lower by one order of magnitude than that of nonpillar mining. The energy released from a single rupture of the sample under the nonpillar layout was higher than that under the other two mining layouts.
(3)
Under deep mining conditions, as the peak stress increased, the AE spatial fractal dimension decreased successively under the protective seam, top-coal caving and nonpillar mining layouts. The nonpillar mining layout resulted in a higher degree of unstable coal mass rupture in front of the working face.

Author Contributions

Y.Y., T.A. and Z.Z. contributed to conducting the experiments and writing the manuscript. R.Z. and L.R. modified the writing of the manuscript. J.X. and Z.Z. assisted in the analysis of AE data. All authors have read and agreed to the published version of the manuscript.

Funding

This research was funded by Department of Science and Technology of Sichuan Province (CN) (Grant No. 2017TD0007) and the National Natural Science Foundation of China (Grant No. 51622402).

Acknowledgments

The authors thank anonymous colleagues for their kind efforts and valuable comments, which have improved this work.

Conflicts of Interest

The authors declare no conflict of interest.

References

  1. Nicholls, T. How the Energy Industry Works: An Insider’s Guide; Silverstone Communications Ltd.: London, UK, 2010; pp. 111–112. [Google Scholar]
  2. Han, Y.; Yin, F.; Li, X. A review on water in low rank coals: The existence, interaction with coal structure and effects on coal utilization. Fuel Process. Technol. 2013, 106, 9–20. [Google Scholar]
  3. Kong, S.; Cheng, Y.; Ren, T.; Liu, H. A sequential approach to control gas for the extraction of multi-gassy coal seams from traditional gas well drainage to mining-induced stress relief. Appl. Energy 2014, 131, 67–78. [Google Scholar] [CrossRef]
  4. Wang, L.; Cheng, Y.P.; An, F.H.; Zhou, H.X.; Kong, S.L.; Wang, W. Characteristics of gas disaster in the huaibei coalfield and its control and development technologies. Nat. Hazards 2014, 71, 85–107. [Google Scholar] [CrossRef]
  5. Liang, Y. Strategic thinking of simultaneous exploitation of coal and gas in deep mining. J. China Coal Soc. 2016, 41, 1–6. [Google Scholar]
  6. Lobanova, T.V. Geomechanical state of the rock mass at the Tashtagol mine in the course of nucleation and manifestation of rock bursts. J. Min. Sci. 2008, 44, 146–154. [Google Scholar] [CrossRef]
  7. Yang, S.Q.; Chen, M.; Jing, H.W.; Chen, K.F.; Meng, B.A. Case study on large deformation failure mechanism of deep soft rock roadway in Xin’an coal mine, China. Eng. Geol. 2016, 217, 89–101. [Google Scholar] [CrossRef]
  8. Sun, W.; Zhang, Q.; Luan, Y.; Zhang, X.P. A study of surface subsidence and coal pillar safety for strip mining in a deep mine. Environ. Earth Sci. 2018, 77, 627. [Google Scholar] [CrossRef]
  9. Liu, T.; Lin, B.; Wei, Y.; Tong, L.; Cheng, Z. An integrated technology for gas control and green mining in deep mines based on ultra-thin seam mining. Environ. Earth Sci. 2017, 76, 243. [Google Scholar] [CrossRef]
  10. Zhou, A.; Kai, W.; Lei, L.; Wang, C.A. Roadway driving technique for preventing coal and gas outbursts in deep coal mines. Environ. Earth Sci. 2017, 76, 236. [Google Scholar] [CrossRef]
  11. Xie, H.P.; Zhang, Z.; Gao, F.; Zhang, R.; Gao, M.Z.; Liu, J.F. Stress-fracture-seepage Field Behavior of Coal under Different Mining Layouts. J. China Coal Soc. 2016, 41, 2405–2417. [Google Scholar]
  12. Xie, H.P.; Zhao, X.; Liu, J.; Zhang, R.; Xue, D. Influence of different mining layouts on the mechanical properties of coal. Int. J. Min. Sci. 2012, 22, 749–755. [Google Scholar] [CrossRef]
  13. Zhang, R.; Ai, T.; Li, H.; Zhang, Z.; Liu, J. 3D reconstruction method and connectivity rules of fracture networks generated under different mining layouts. Int. J. Min. Sci. Technol. 2013, 23, 863–871. [Google Scholar] [CrossRef]
  14. Zhang, Z.; Ru, Z.; Xie, H.; Gao, M.; Jing, X. Mining-induced coal permeability change under different mining layouts. Rock Mech. Rock Eng. 2016, 49, 3753–3768. [Google Scholar] [CrossRef]
  15. Zhang, R.; Ai, T.; Zhou, H.W.; Ju, Y.; Zhang, Z.T. Fractal and volume characteristics of 3D mining-induced fractures under typical mining layouts. Environ. Earth Sci. 2015, 73, 6069–6080. [Google Scholar] [CrossRef]
  16. Kramadibrata, S.; Matsui, K.; Shimada, H. Role of acoustic emission for solving rock engineering problems in indonesian underground mining. Rock Mech. Rock Eng. 2011, 44, 281–289. [Google Scholar] [CrossRef]
  17. Ai, T.; Ru, Z.; Liu, J.; Li, R. Space–time evolution rules of acoustic emission location of unloaded coal sample at different loading rates. Int. J. Min. Sci. Technol. 2012, 22, 847–854. [Google Scholar]
  18. Vishal, V.; Ranjith, P.G.; Singh, T.N. An experimental investigation on behaviour of coal under fluid saturation, using acoustic emission. J. Nat. Gas Sci. Eng. 2015, 22, 428–436. [Google Scholar] [CrossRef]
  19. Wu, S.; Ge, H.; Wang, X.; Meng, F. Shale failure processes and spatial distribution of fractures obtained by ae monitoring. J. Nat. Gas Sci. Eng. 2017, 41, 82–92. [Google Scholar] [CrossRef]
  20. Cai, M.; Kaiser, P.K.; Tasaka, Y.; Maejima, T.; Morioka, H.; Minami, M. Generalized crack initiation and crack damage stress thresholds of brittle rock masses near underground excavations. Int. J. Rock Mech. Min. Sci. 2004, 41, 833–847. [Google Scholar] [CrossRef]
  21. Zhou, H.; Yu, Y.; Zhang, Y.; Lei, F.; Zuo, Y.; Xiang, W. Fine test on progressive fracturing process of multi-crack rock samples under uniaxial compression. Chin. J. Rock Mech. Eng. 2010, 29, 465–470. [Google Scholar]
  22. Su, F.Q.; Itakura, K.I.; Deguchi, G.; Ohga, K. Monitoring of coal fracturing in underground coal gasification by acoustic emission techniques. Appl. Energy 2017, 189, 142–156. [Google Scholar] [CrossRef] [Green Version]
  23. Agioutantis, Z.; Kaklis, K.; Mavrigiannakis, S.; Verigakis, M.; Vallianatos, F.; Saltas, V. Potential of acoustic emissions from three point bending tests as rock failure precursors. Int. J. Min. Sci. Technol. 2016, 26, 155–160. [Google Scholar] [CrossRef]
  24. Liu, Q.; Zhang, R.; Gao, M.; Guo, L.I.; Zhang, Z.; Zhang, Z. Acoustic emission characteristics and comprehensive failure precursors of coal under unloading conditions. J. Sichuan Univ. 2016, 48, 67–74. [Google Scholar]
  25. Shkuratnik, V.L.; Nikolenko, P.V.; Koshelev, A.E. Spectral characteristics of acoustic emission in loaded coal specimens for failure prediction. J. Min. Sci. 2017, 53, 818–823. [Google Scholar] [CrossRef]
  26. Zhang, Z.; Zhang, R.; Zhang, Z.; Gao, M.; Dai, F. Experimental research on effect of bedding plane on coal acoustic emission under uniaxial compression. Chin. J. Rock Mech. Eng. Geol. 2015, 34, 770–778. [Google Scholar]
  27. Shkuratnik, V.L.; Filimonov, Y.L.; Kuchurin, S.V. Experimental investigations into acoustic emission in coal samples under uniaxial loading. J. Min. Sci. 2004, 40, 458–464. [Google Scholar] [CrossRef]
  28. Shkuratnik, V.L.; Filimonov, Y.L.; Kuchurin, S.V. Regularities of acoustic emission in coal samples under triaxial compression. J. Min. Sci. 2005, 41, 44–52. [Google Scholar] [CrossRef]
  29. Wang, J.; Xie, L.; Xie, H.; Li, R.; Bo, H.; Li, C. Effect of layer orientation on acoustic emission characteristics of anisotropic shale in Brazilian tests. J. Nat. Gas Sci. Eng. Geol. 2016, 36, 1120–1129. [Google Scholar] [CrossRef]
  30. Xie, H.P.; Gao, F.; Ju, Y.; Gao, M.Z.; Zhang, R.; Gao, Y.N. Quantitative definition and investigation of deep mining. J. China Coal Soc. 2015, 40, 1–10. [Google Scholar]
  31. Xie, H.P.; Zhou, H.W.; Xue, D.J.; Wang, H.W.; Zhang, R.; Gao, F. Research and consideration on deep mining and limit mining depth of coal. J. China Coal Soc. 2012, 37, 535–542. [Google Scholar]
  32. Min, T.U.; Miao, X.X.; Colliery, Z. Deformation rule of protected coal seam exploited by using the long-distance-lower protective seam method. J. Min. Saf. Eng. 2006, 23, 253–257. [Google Scholar]
  33. Hao, Y.; Zhang, J.; Nan, Z.; Sheng, Z.; Dong, X. Shaft failure characteristics and the control effects of backfill body compression ratio at ultra-contiguous coal seams mining. Environ. Earth Sci. 2018, 77, 458. [Google Scholar]
  34. Wang, J.C. Fully mechanized longwall top coal caving technology in china and discussion on issues of further development. Coal Sci. Technol. 2005, 33, 14–17. [Google Scholar]
  35. Xie, H.P.; Zhou, H.W.; Liu, J.F.; Gao, F.; Zhang, R.; Xue, D.J.; Zhang, Y. Mining-induced Mechanical Behavior in Coal Seams under Different Mining Layouts. J. China Coal Soc. 2011, 36, 1067–1074. [Google Scholar]
  36. Ju, Y.; Zhang, Q.; Zheng, J. Experimental study on CH4 permeability and its dependence on interior fracture networks of fractured coal under different excavation stress paths. Fuel 2017, 202, 483–493. [Google Scholar] [CrossRef]
  37. Luo, Y.; Ren, L.; Xie, L.Z.; Ai, T.; He, B. Fracture behavior investigation of a typical sandstone under mixed-mode I/II loading using the notched deep beam bending method. Rock Mech. Rock Eng. 2017, 50, 1–19. [Google Scholar] [CrossRef]
  38. Ren, L.; Xie, L.Z.; Xie, H.P.; Ai, T.; He, B. Mixed-mode fracture behavior and related surface topography feature of a typical sandstone. Rock Mech. Rock Eng. 2016, 49, 1–17. [Google Scholar] [CrossRef]
  39. Hirata, T.; Satoh, T.; Ito, K. Fractal structure of spatial distribution of micro-fracturing in rock. Geophys. J. Int. 1987, 90, 369–374. [Google Scholar] [CrossRef]
  40. Zhang, R.; Dai, F.; Gao, M.Z.; Xu, N.W.; Zhang, C.P. Fractal analysis of acoustic emission during uniaxial and Triaxial loading of rock. Int. J. Rock Mech. Min. Sci. 2015, 79, 1365–1609. [Google Scholar] [CrossRef]
  41. Pei, J.L. Study on Mechanical Behavior of Natural Multi-Group Fractured Rocks. Doctor Dissertation, Sichuan University, Chengdu, China, 2011. [Google Scholar]
Figure 1. Coal samples.
Energies 13 03295 g001
Figure 2. Test setup.
Energies 13 03295 g002
Figure 3. Distributions and dimensions of an AE sensor.
Energies 13 03295 g003
Figure 4. The stress state of coal mass in front of the working faces under three different mining layouts.
Energies 13 03295 g004
Figure 5. The loading (unloading) scheme under different mining layouts (γH = 25 MPa).
Energies 13 03295 g005
Figure 6. Evolution of the AE ring-down count rate, cumulative energy, energy rate and cumulative ring-down count over time.
Energies 13 03295 g006aEnergies 13 03295 g006b
Figure 7. AE events, ring-down count, and energy under different mining layouts.
Energies 13 03295 g007aEnergies 13 03295 g007b
Figure 8. Spatial distribution of AE under different mining layouts.
Energies 13 03295 g008aEnergies 13 03295 g008b
Figure 9. Relationship between AE spatial fractal dimension and stress under different mining conditions.
Energies 13 03295 g009
Table 1. Statistics of stress and time for typical stages of AE activity under different mining layouts.
Mining LayoutsPhase I Starting PointPhase II Starting PointPhase III Starting Point
Stress/%Time/sStress/%Time/sStress/%Time/s
Protective-seam5392.989.61002.797.81205.3
Top-coal caving46.1117.976.7827.786.7976.1
Nonpillar45.6250.276.8823.781.9880.7

