Author Contributions
Conceptualization, J.-S.B. and D.-K.C.; methodology, D.-K.C. and H.-G.L.; software, D.-K.C. and B.-D.P.; validation, S-.Y.L. and J.-S.B.; formal analysis, D.-K.C.; investigation, D.-K.C.; resources, S.-Y.L. and H.-G.L.; data curation, D.-K.C. and B.-D.P.; writing—original draft preparation, D.-K.C.; writing—review and editing, S.-Y.L., H.-G.L. and J.-S.B.; visualization, J.-S.B.; supervision, S.-Y.L. and J.-S.B.; project administration, J.-S.B.; funding acquisition, J.-S.B. All authors have read and agreed to the published version of the manuscript.
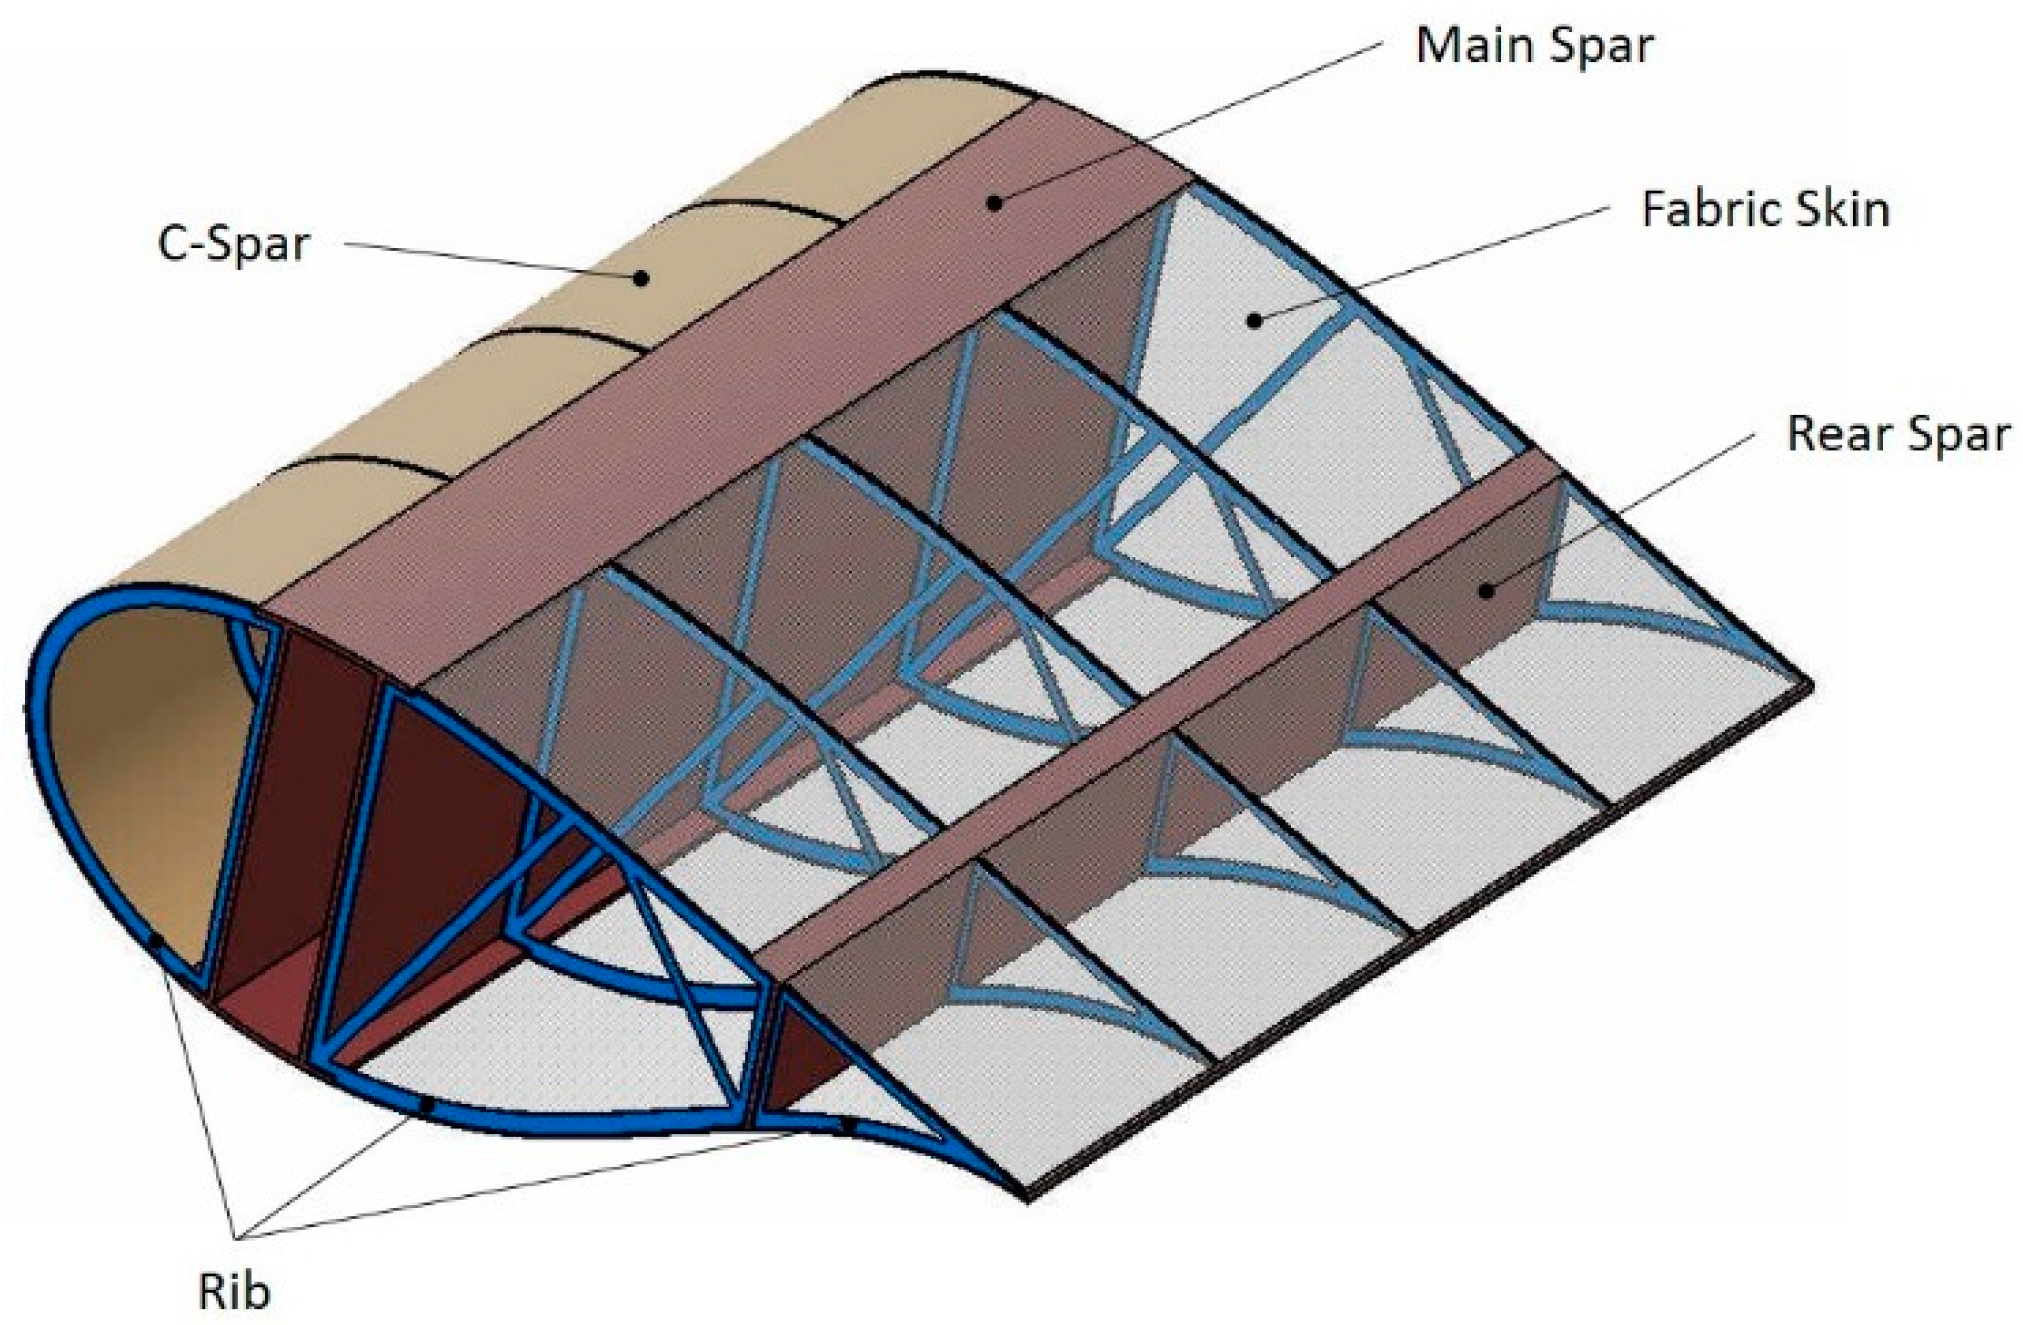
Figure 1.
The concept of a fabric-covered wind turbine (WT) blade.
Figure 1.
The concept of a fabric-covered wind turbine (WT) blade.
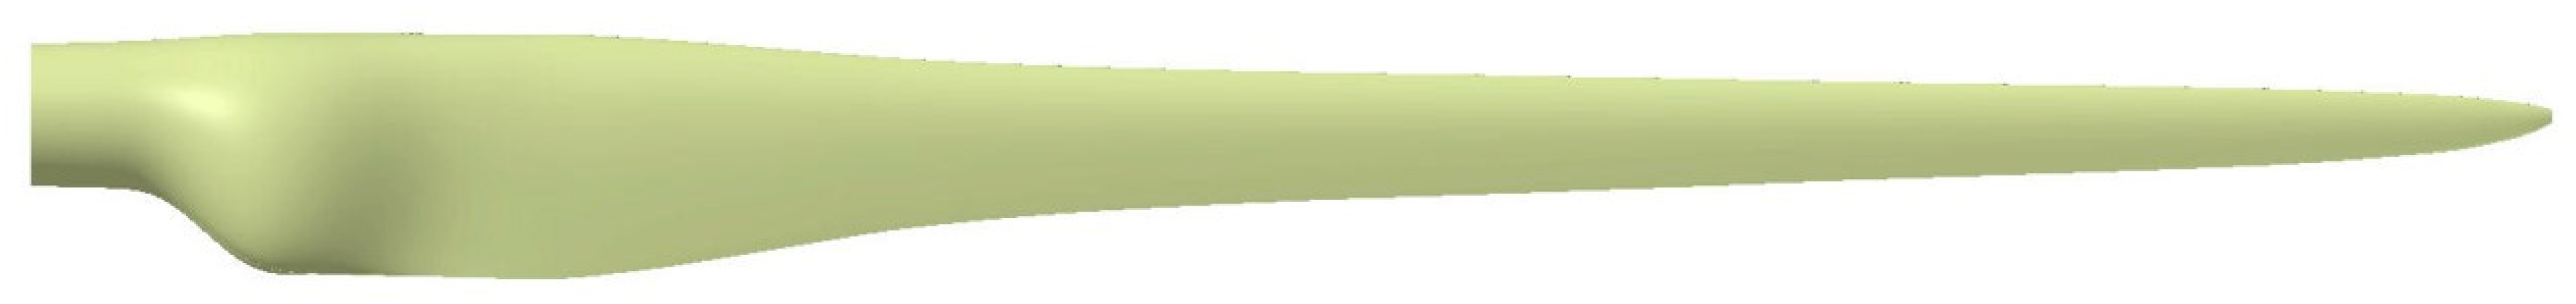
Figure 2.
The aerodynamic shape of the blade.
Figure 2.
The aerodynamic shape of the blade.
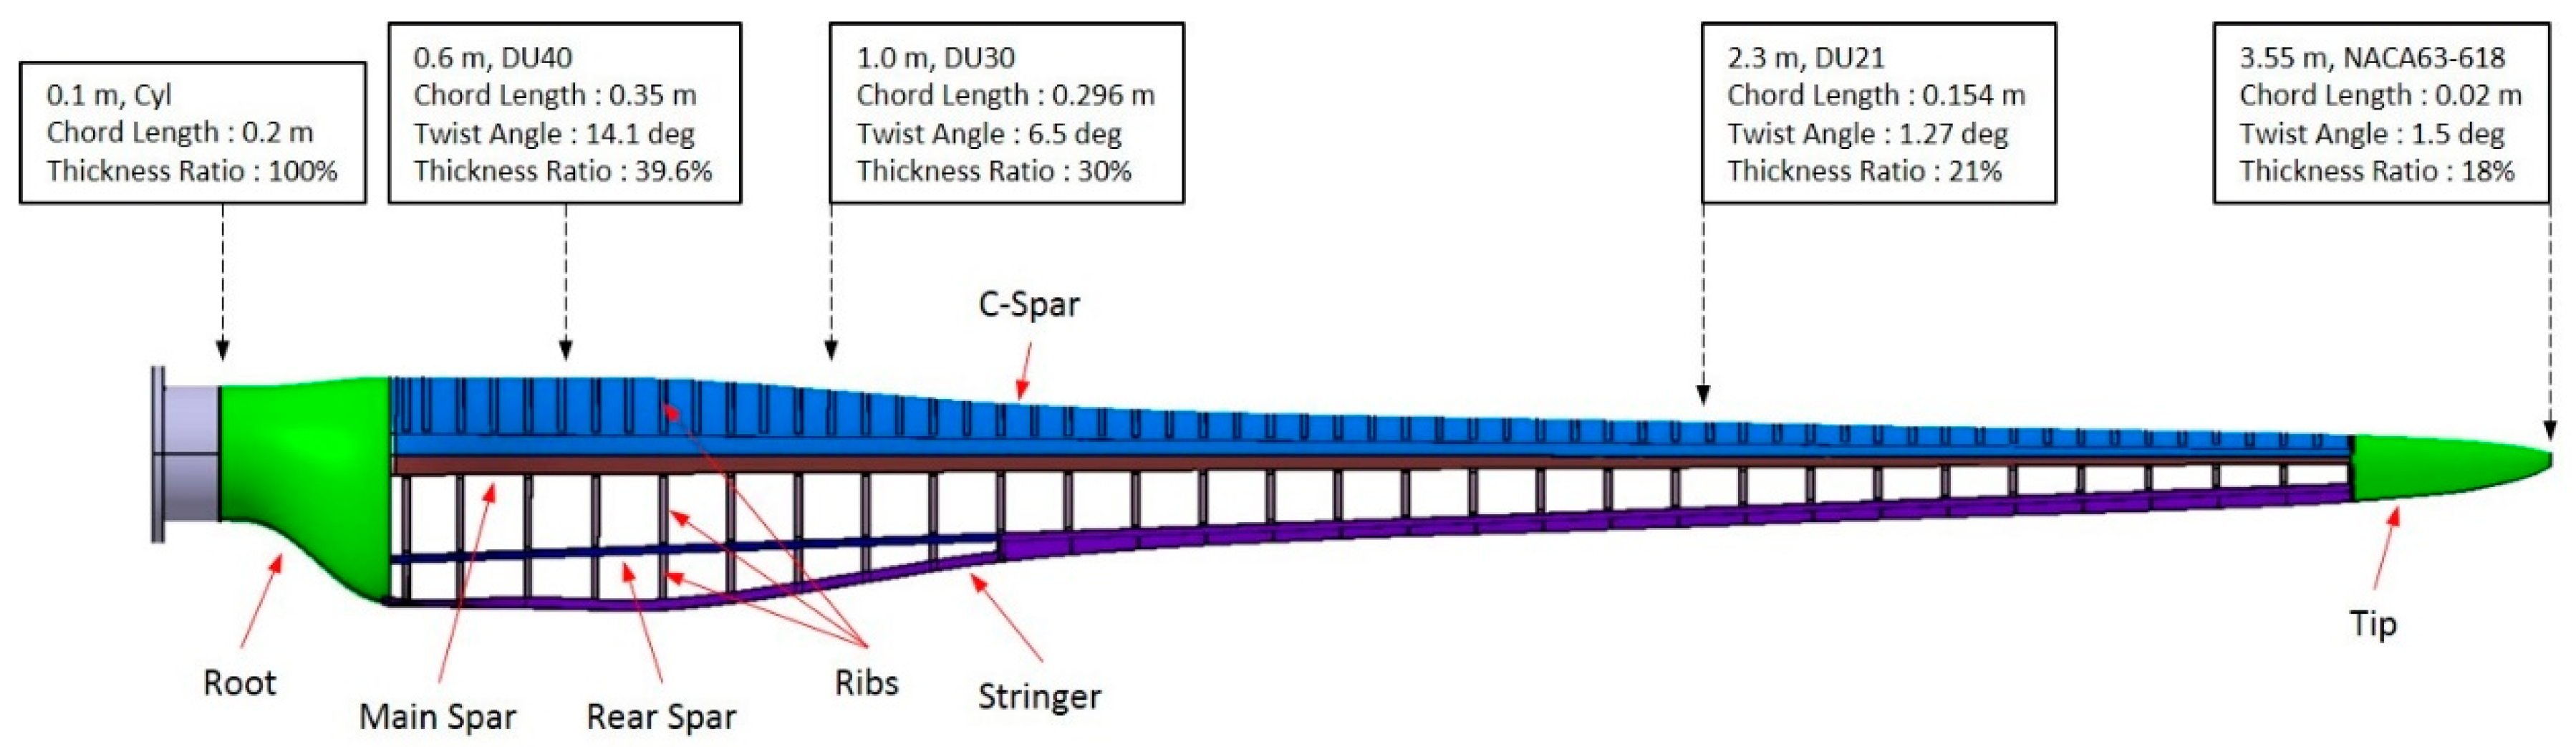
Figure 3.
The fabric-covered blade structure.
Figure 3.
The fabric-covered blade structure.
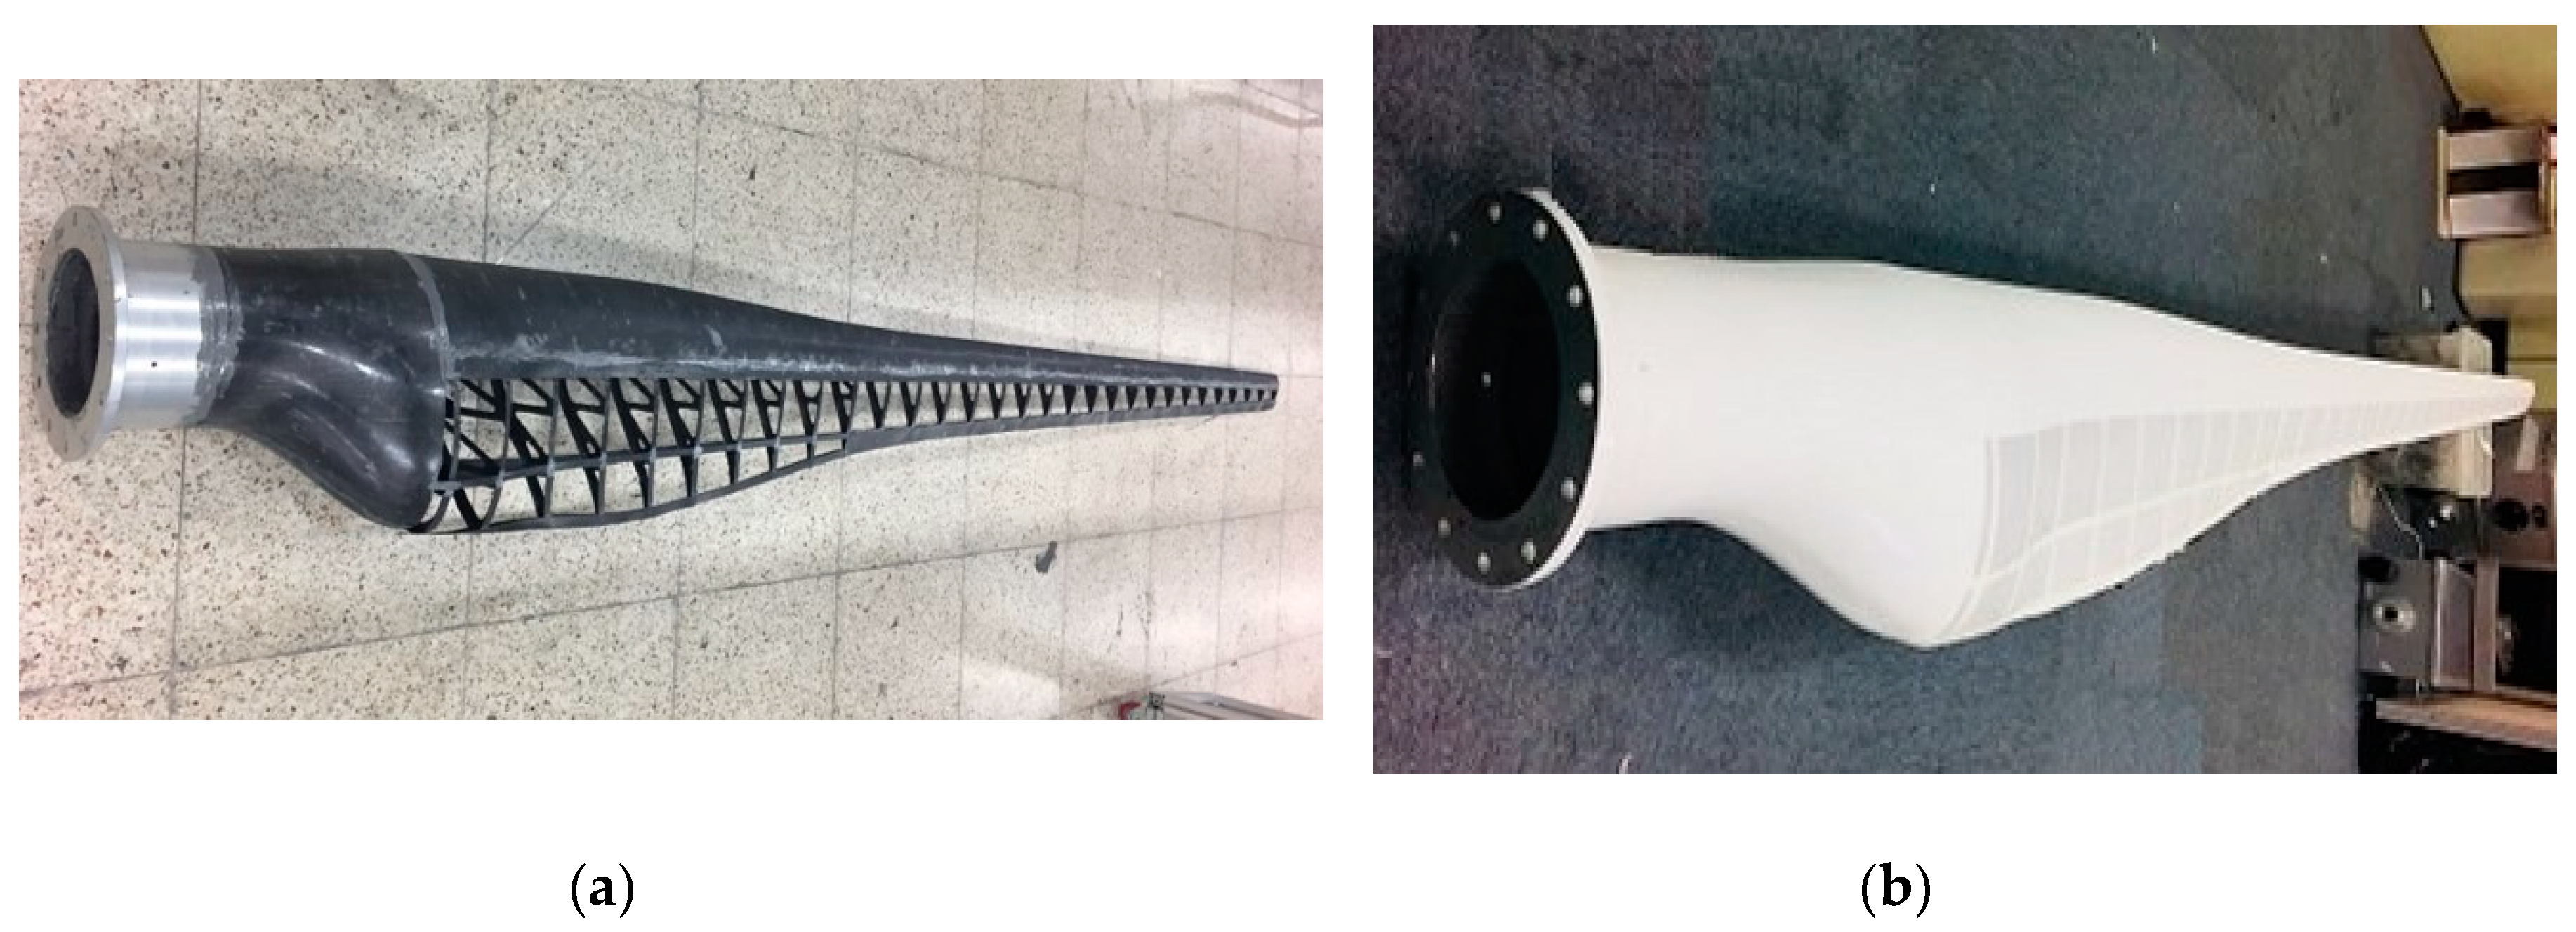
Figure 4.
The fabricated fabric-covered blade: (a) without skin and (b) with skin.
Figure 4.
The fabricated fabric-covered blade: (a) without skin and (b) with skin.
Figure 5.
The simulated loads: (a) flapwise direction and (b) edgewise direction.
Figure 5.
The simulated loads: (a) flapwise direction and (b) edgewise direction.
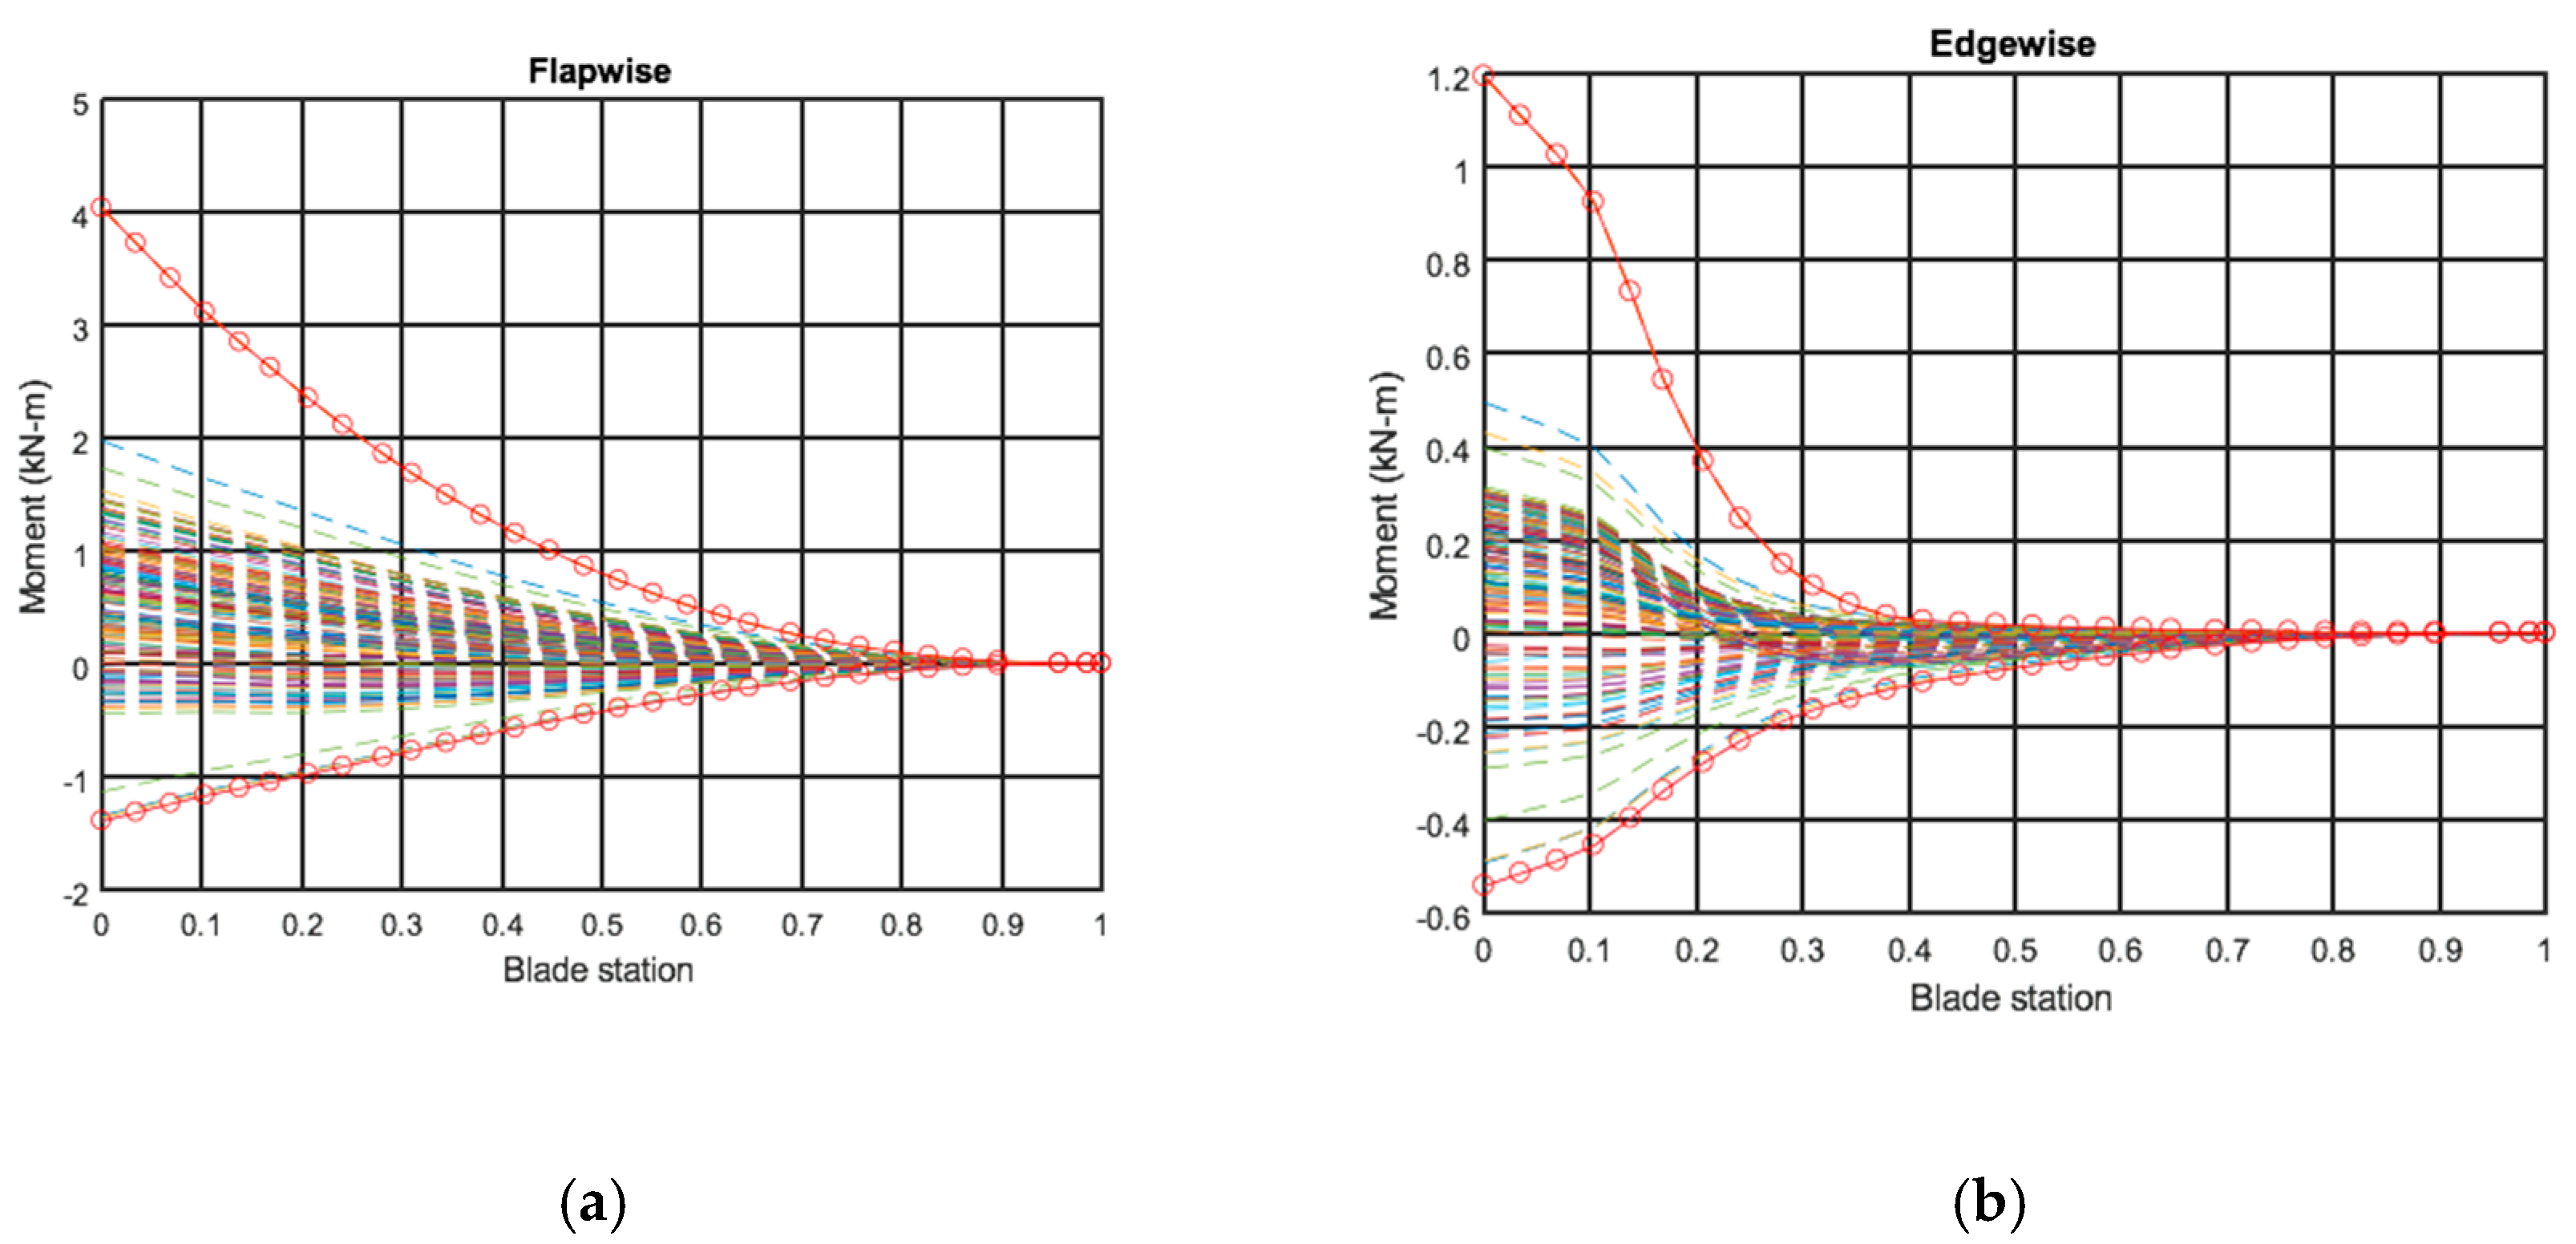
Figure 6.
The design loads: (a) flapwise direction and (b) edgewise direction.
Figure 6.
The design loads: (a) flapwise direction and (b) edgewise direction.
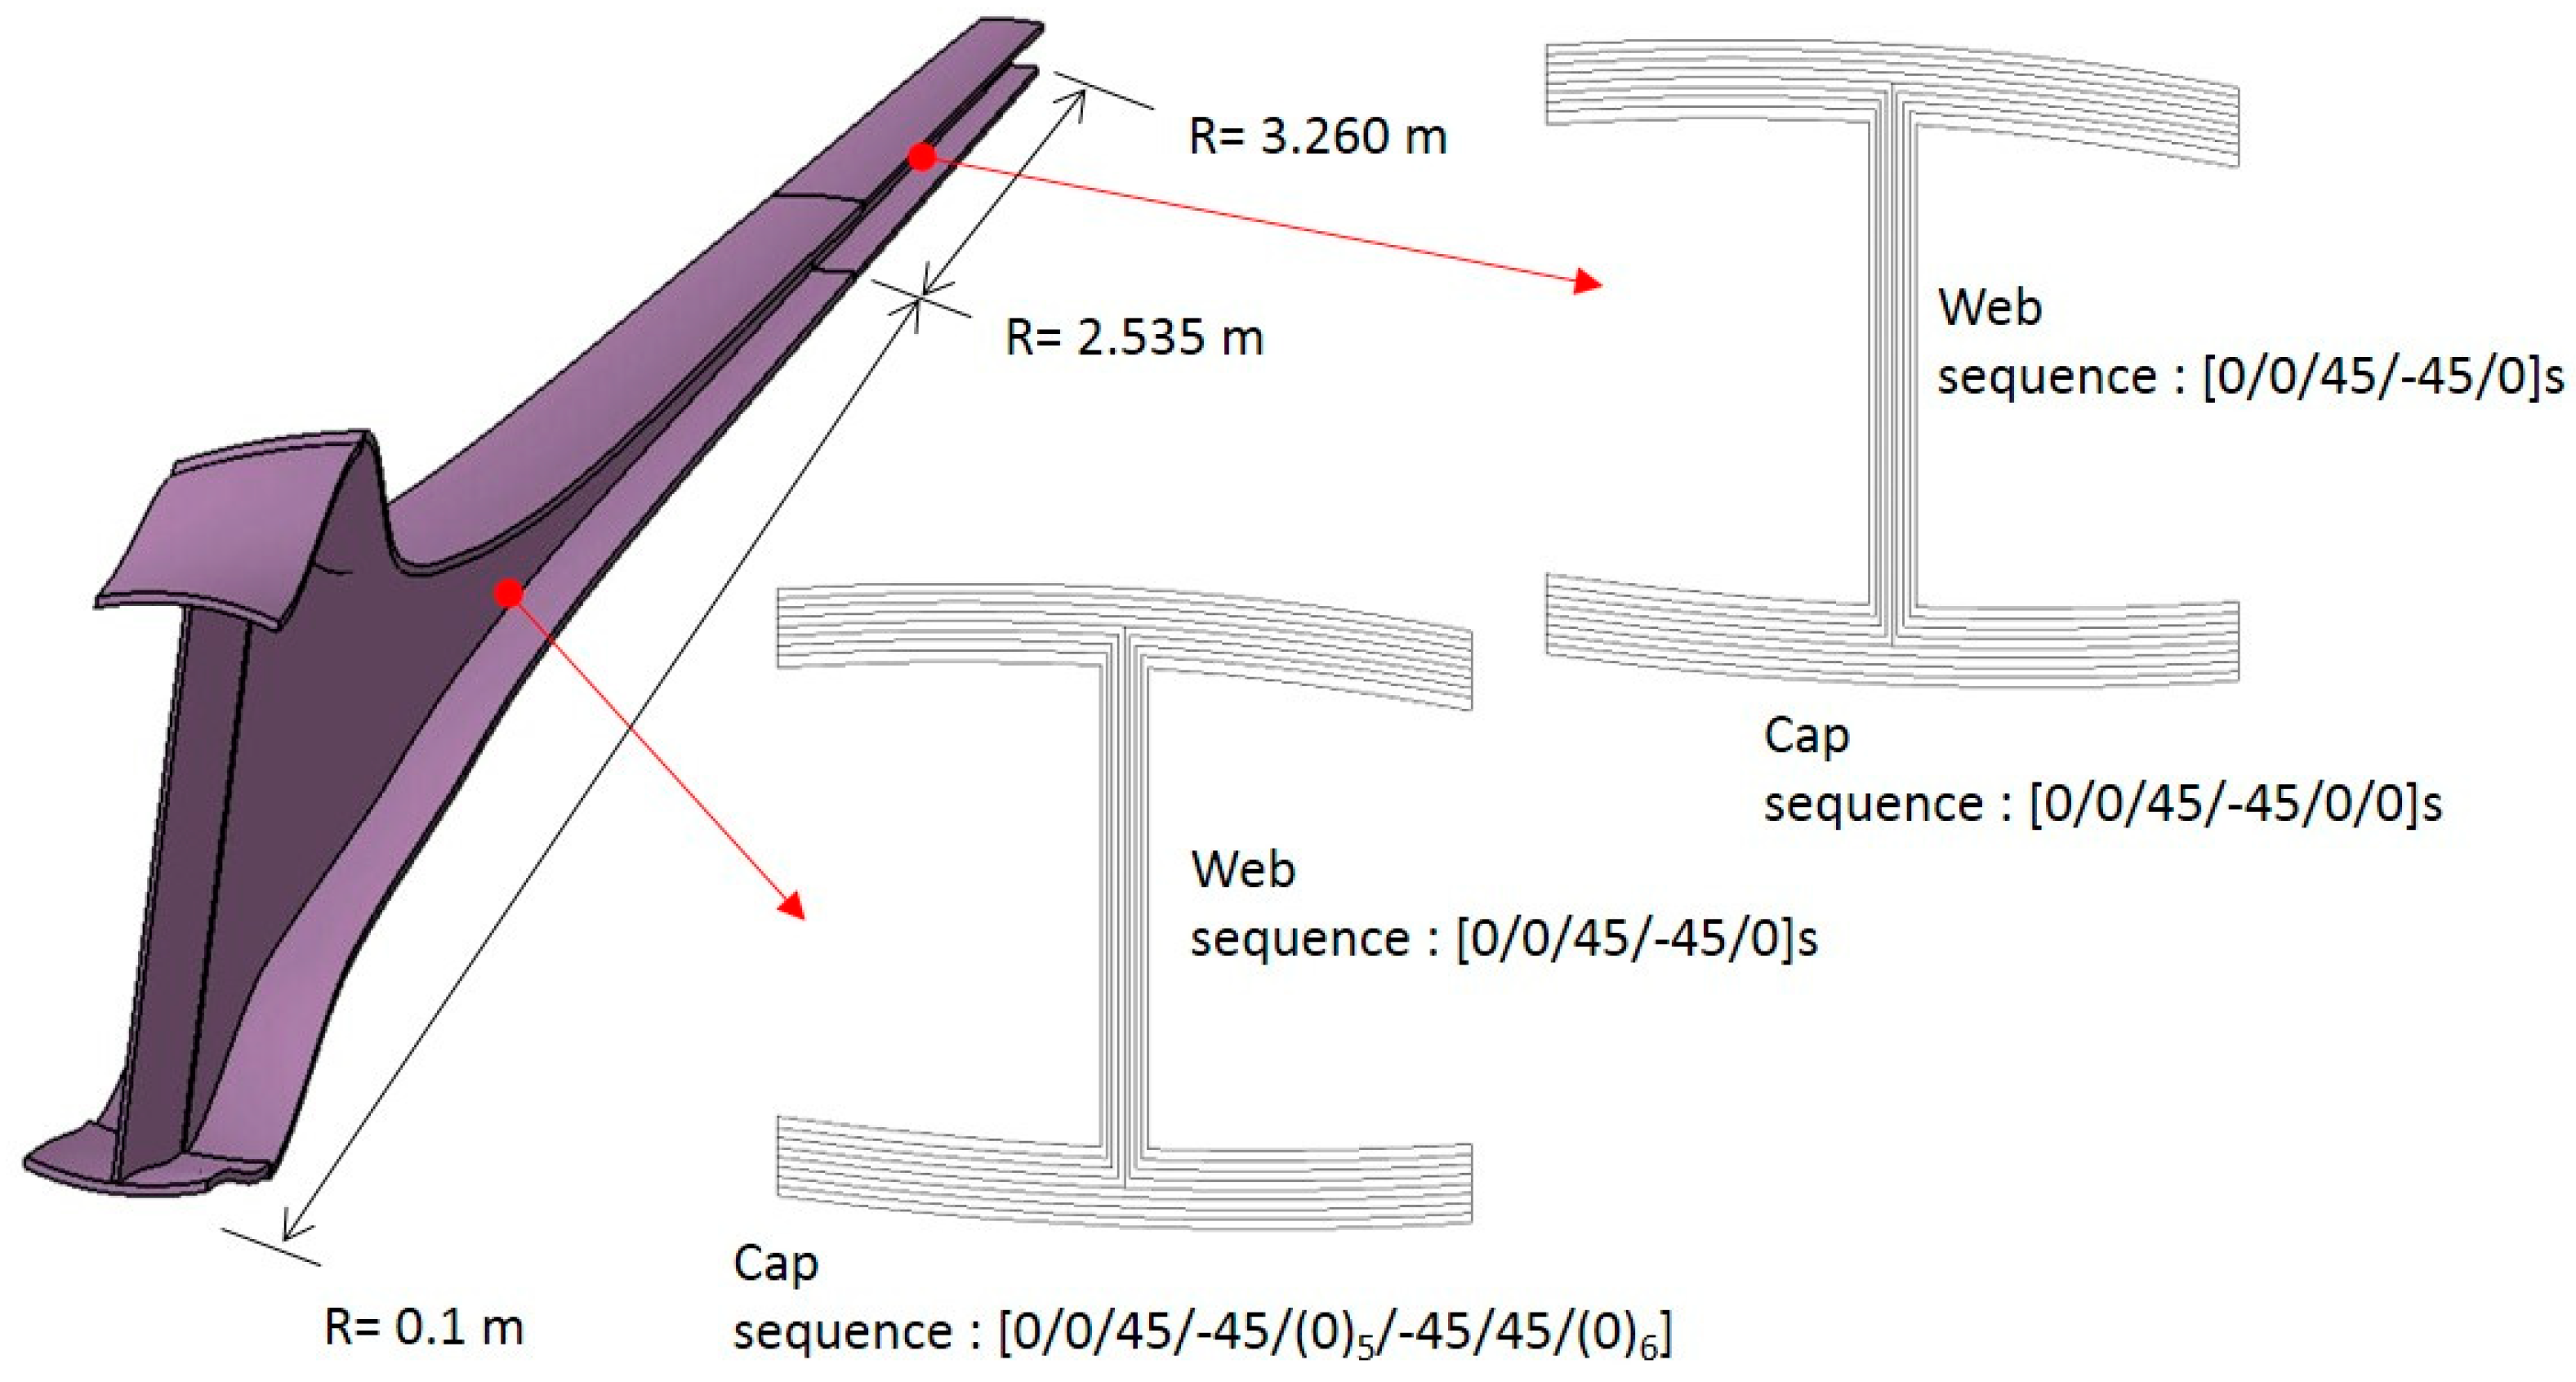
Figure 7.
Main spar cross-section and stacking sequence.
Figure 7.
Main spar cross-section and stacking sequence.
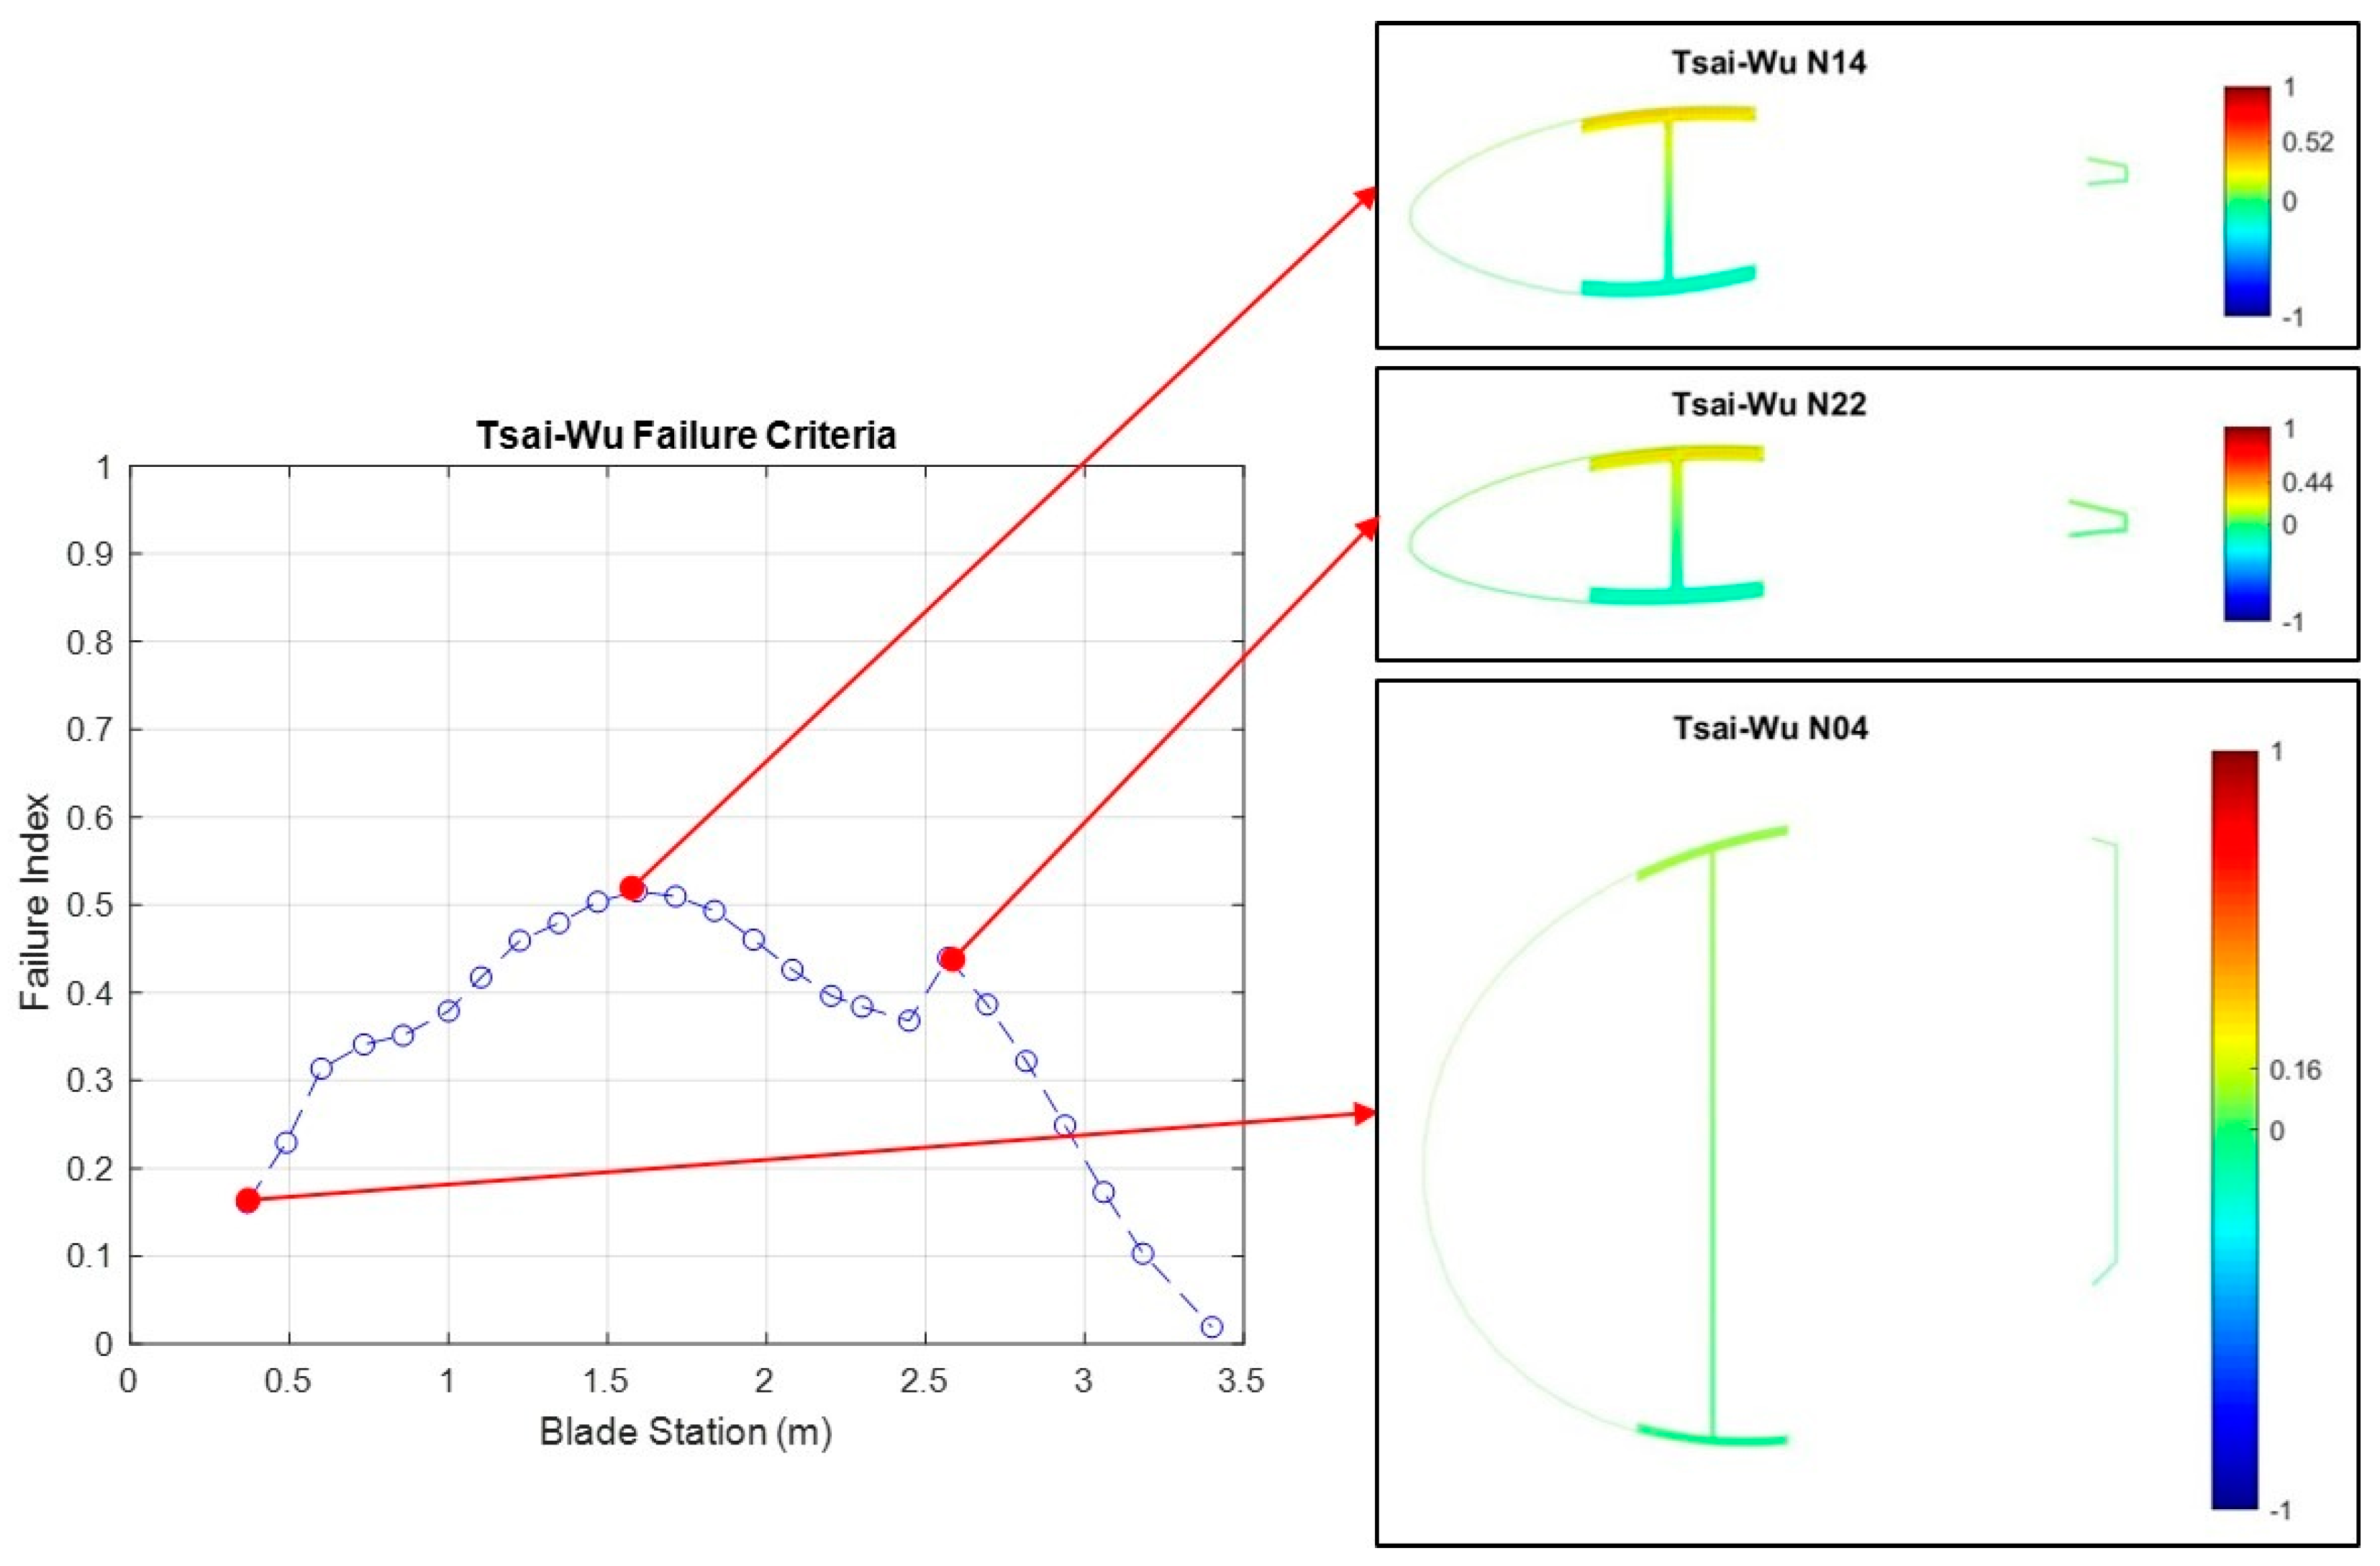
Figure 8.
The maximum failure indexes of the cross-sections along the blade span.
Figure 8.
The maximum failure indexes of the cross-sections along the blade span.
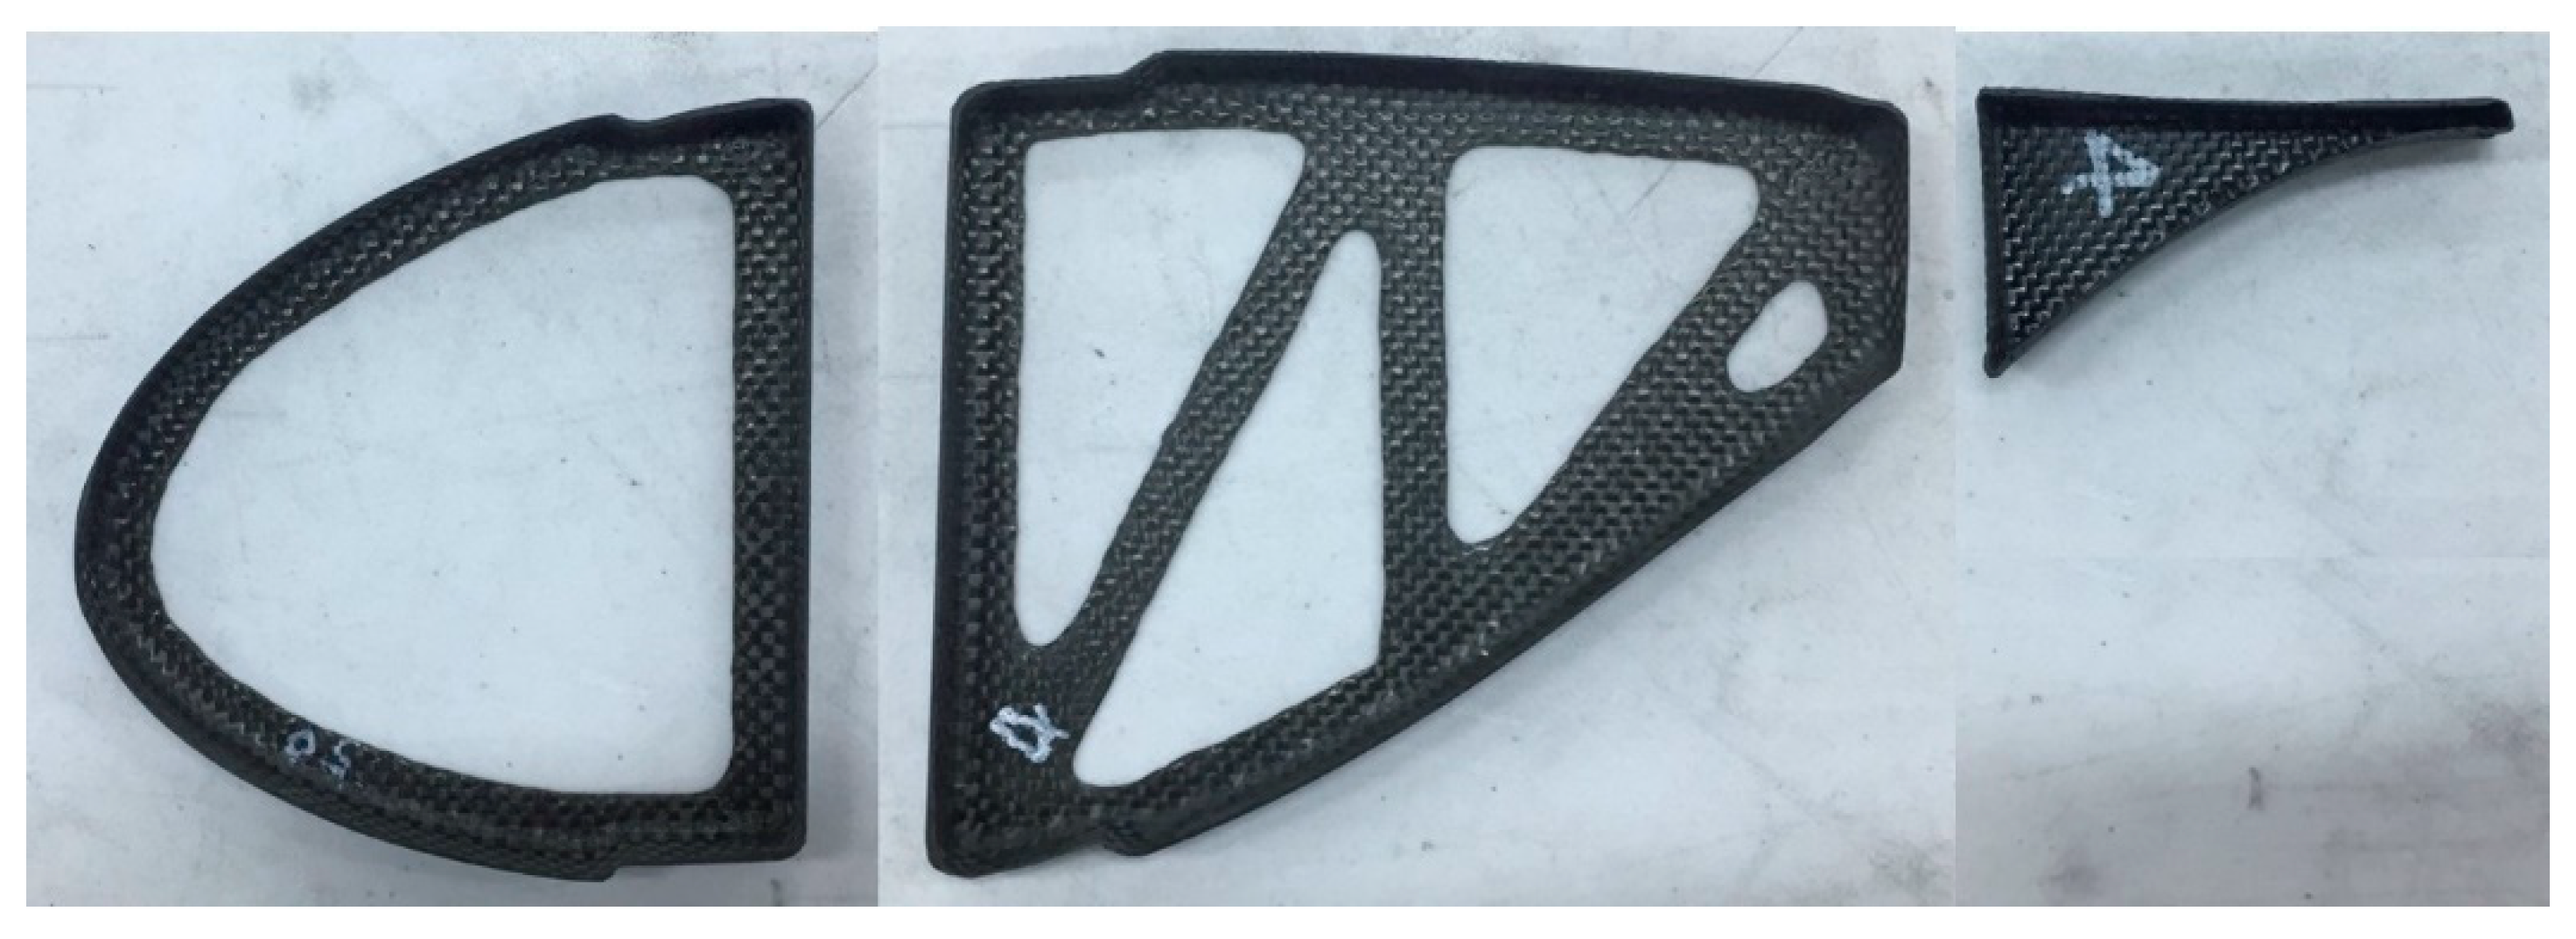
Figure 9.
The truss ribs.
Figure 9.
The truss ribs.
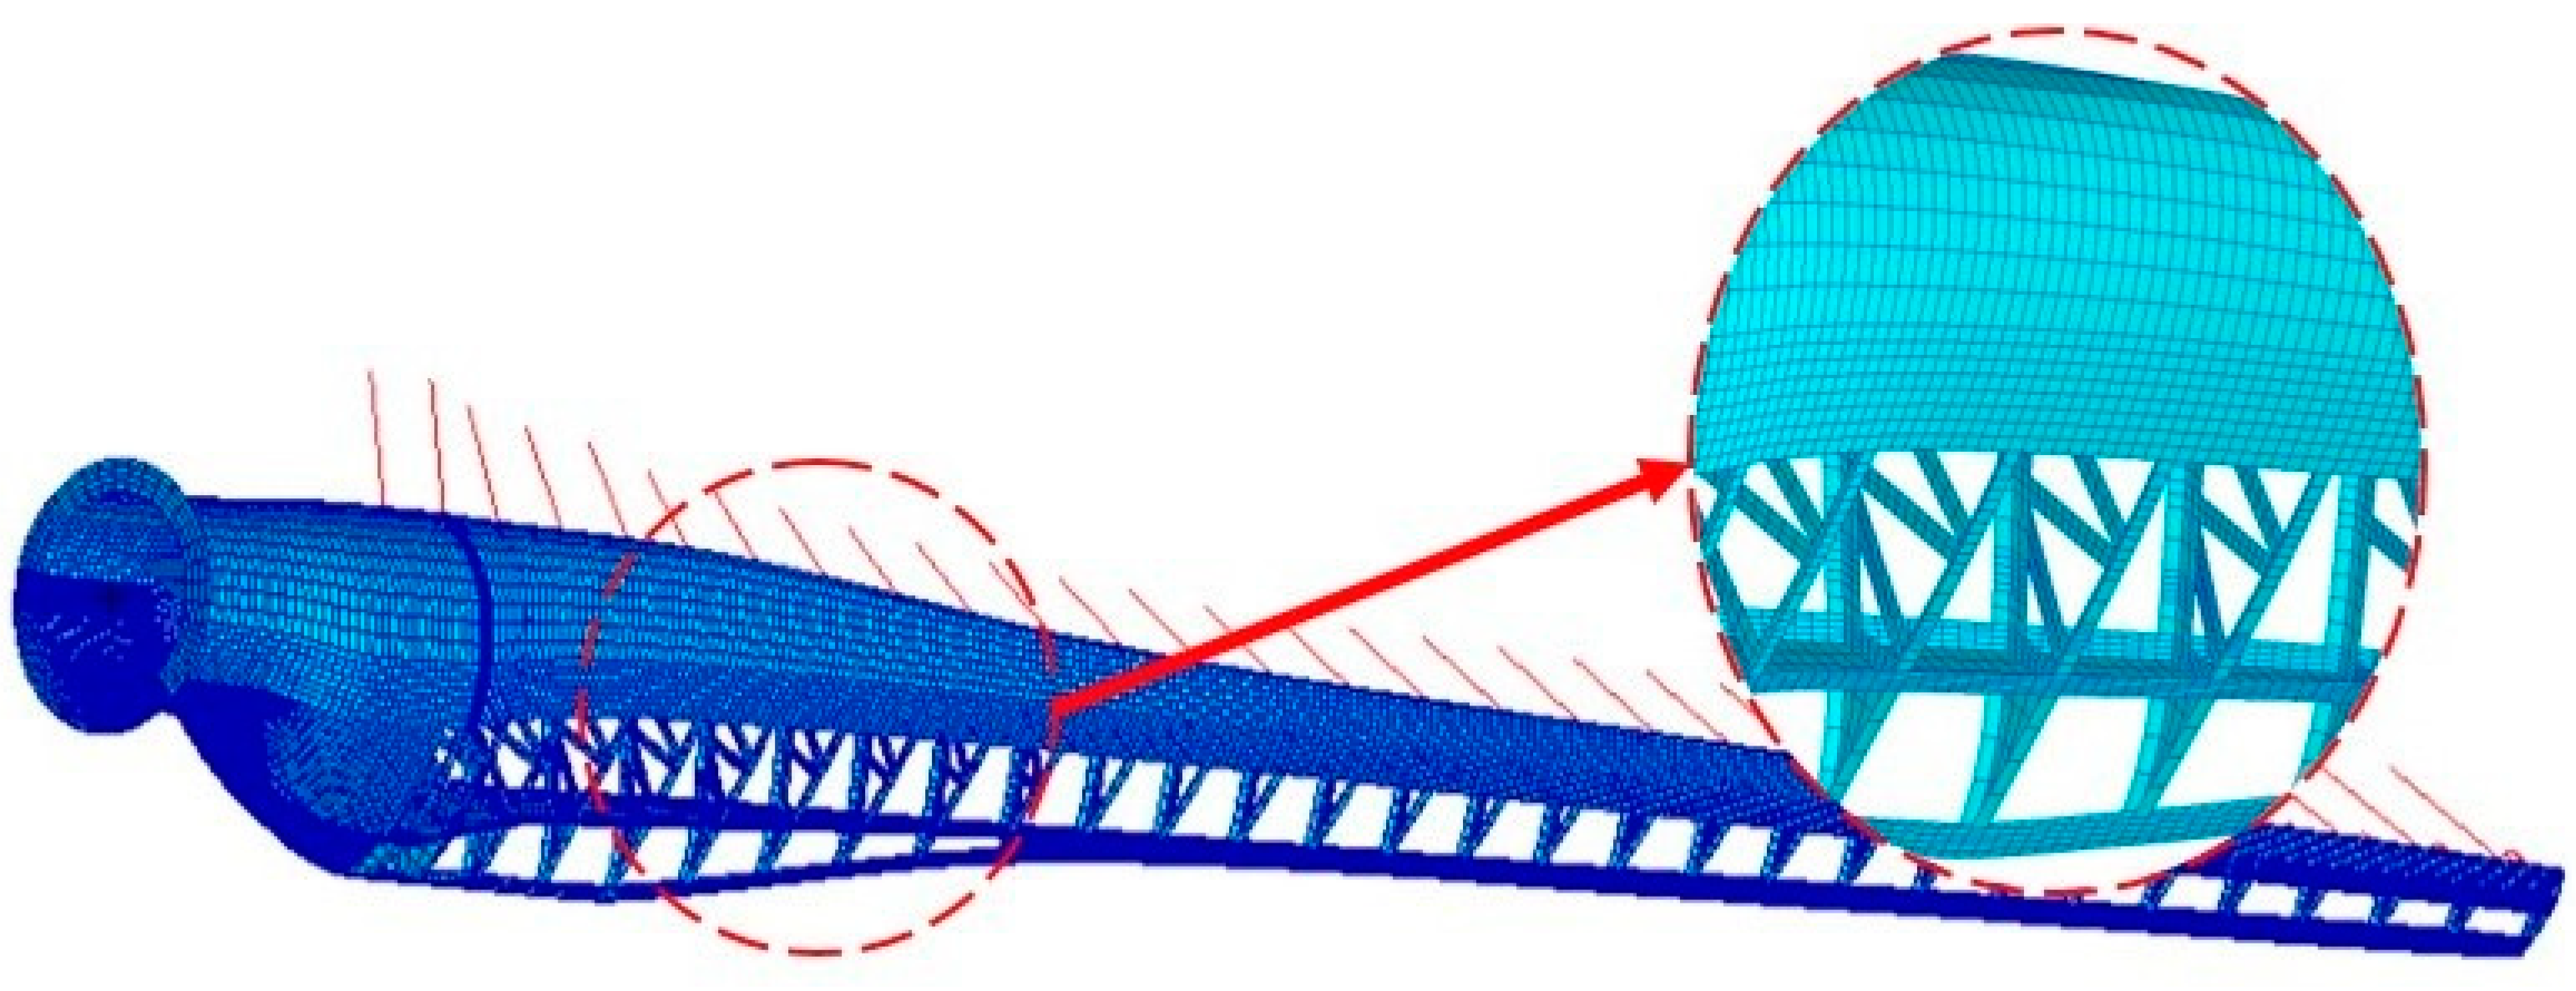
Figure 10.
The 3D blade finite element model.
Figure 10.
The 3D blade finite element model.
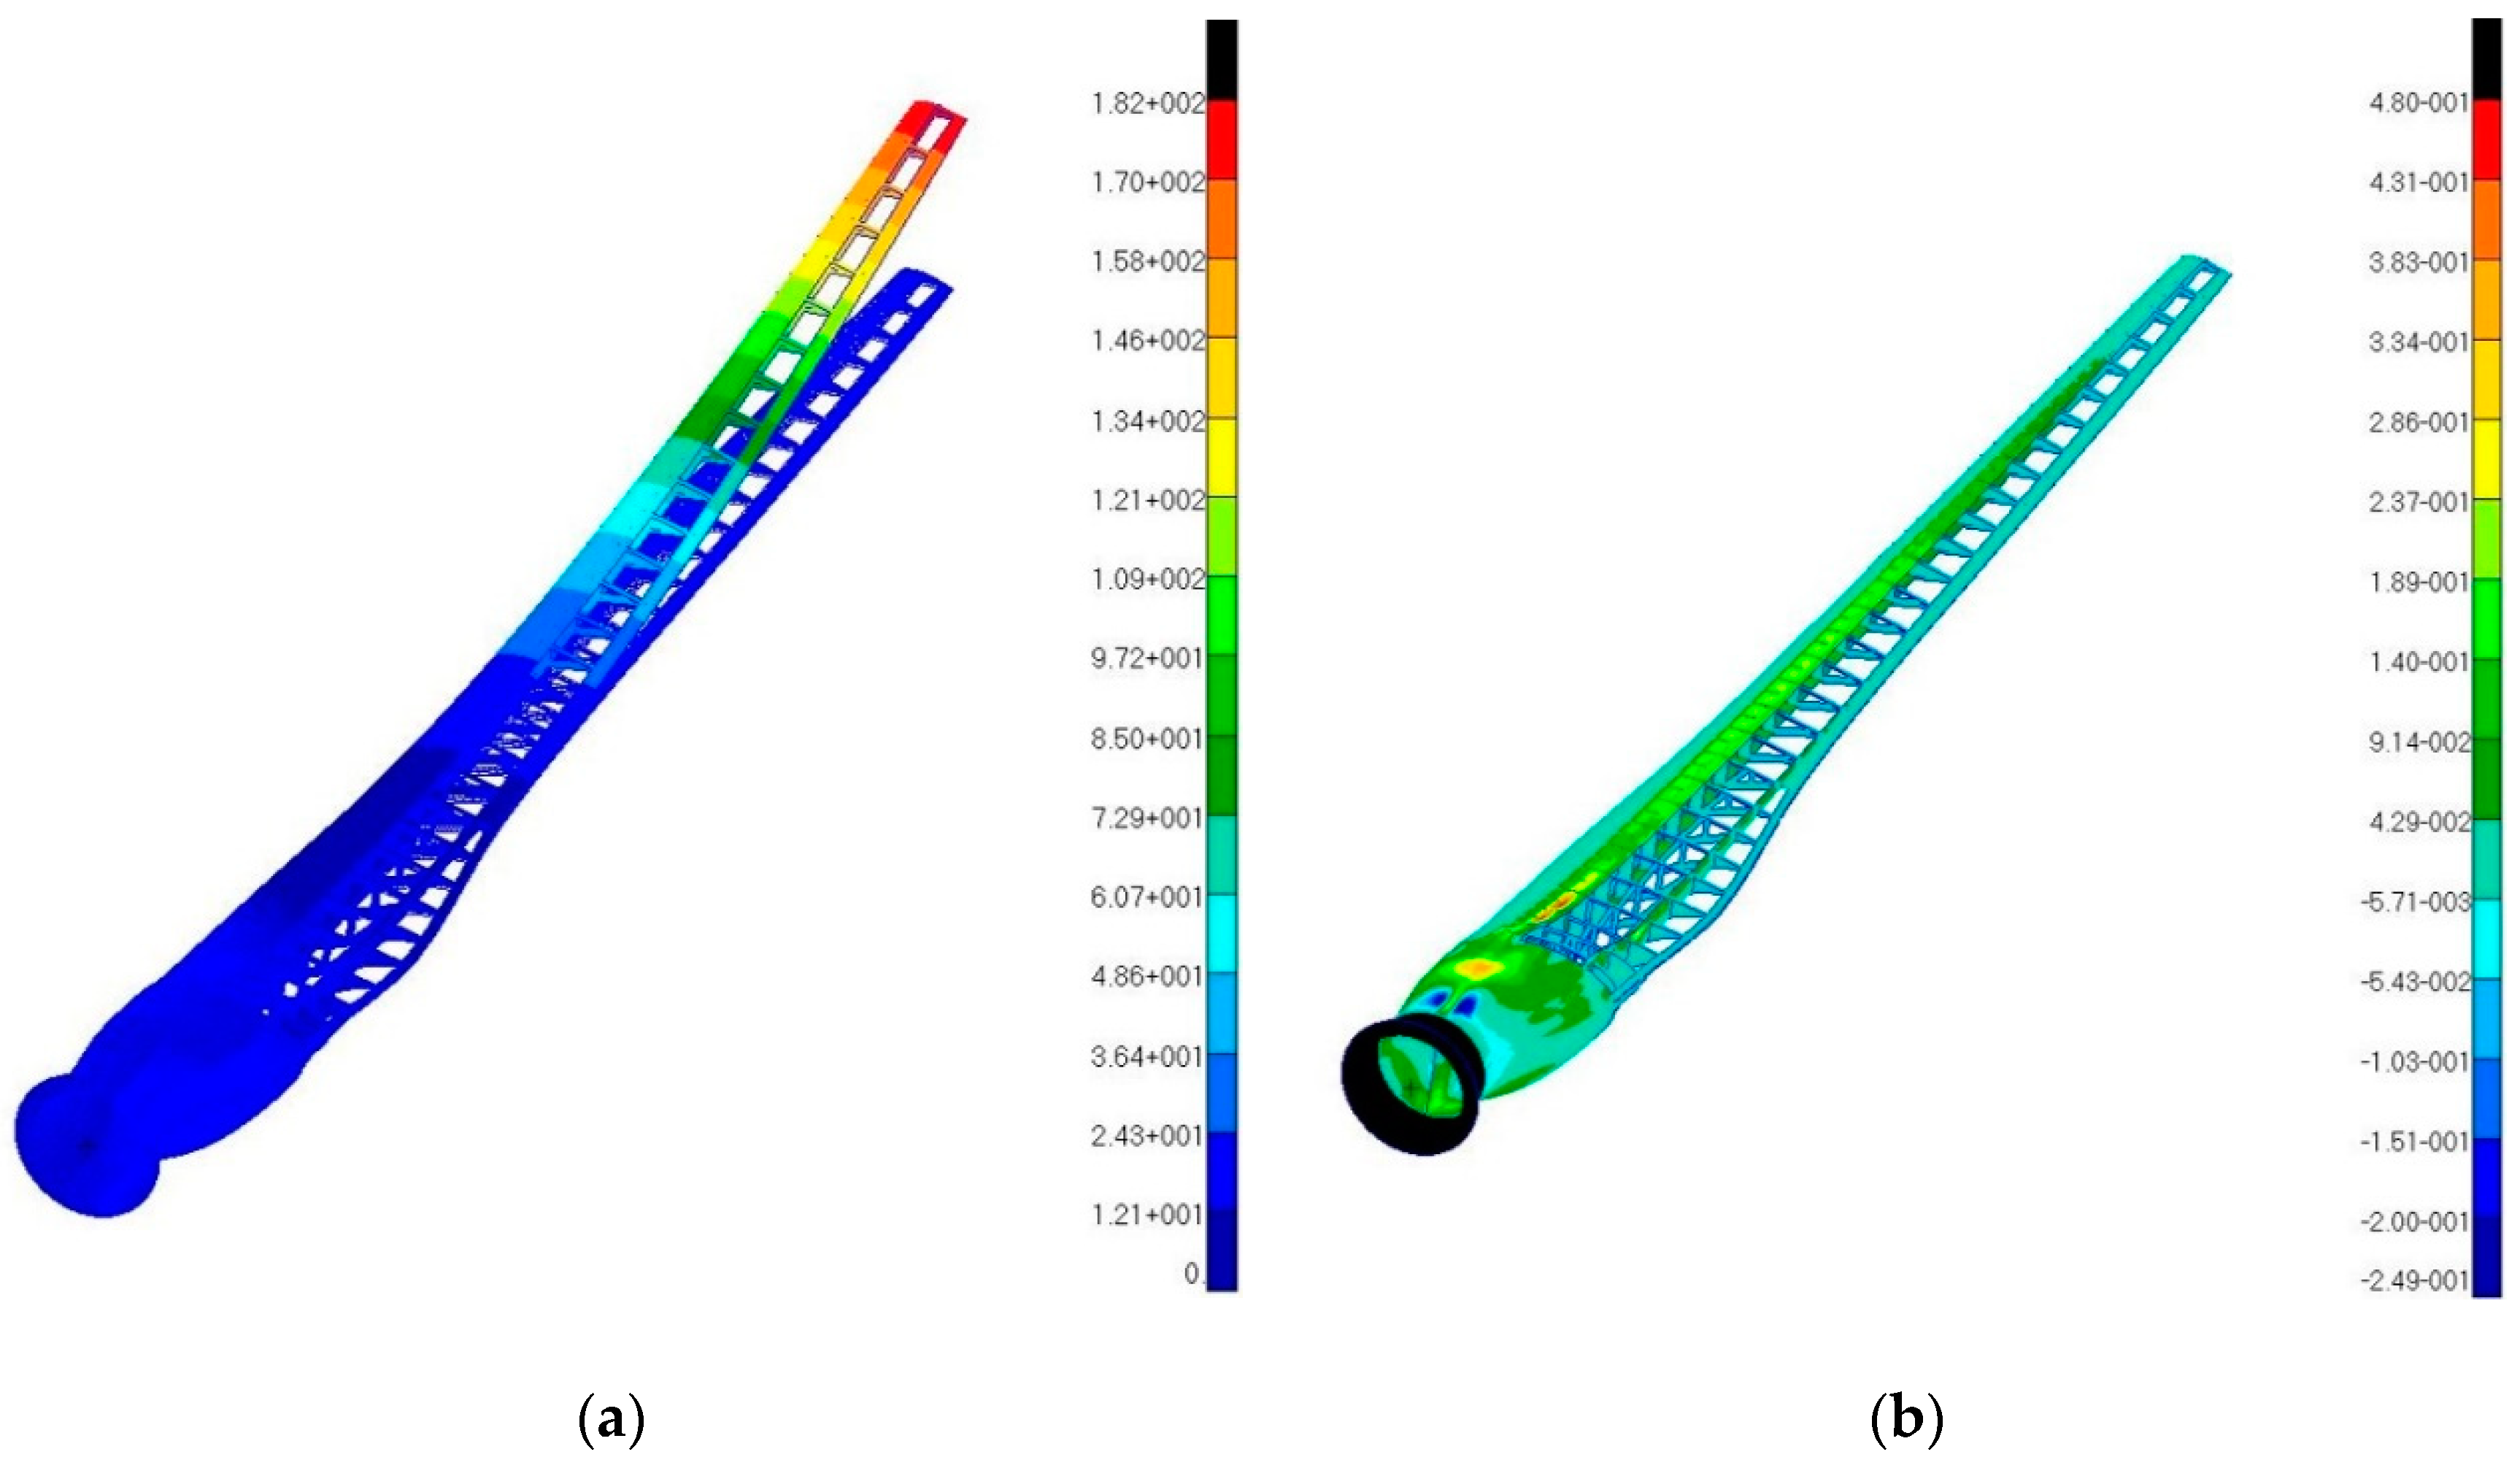
Figure 11.
The structural analysis results of the 3D blade model: (a) deflection and (b) Tsai–Wu failure criteria indexes.
Figure 11.
The structural analysis results of the 3D blade model: (a) deflection and (b) Tsai–Wu failure criteria indexes.
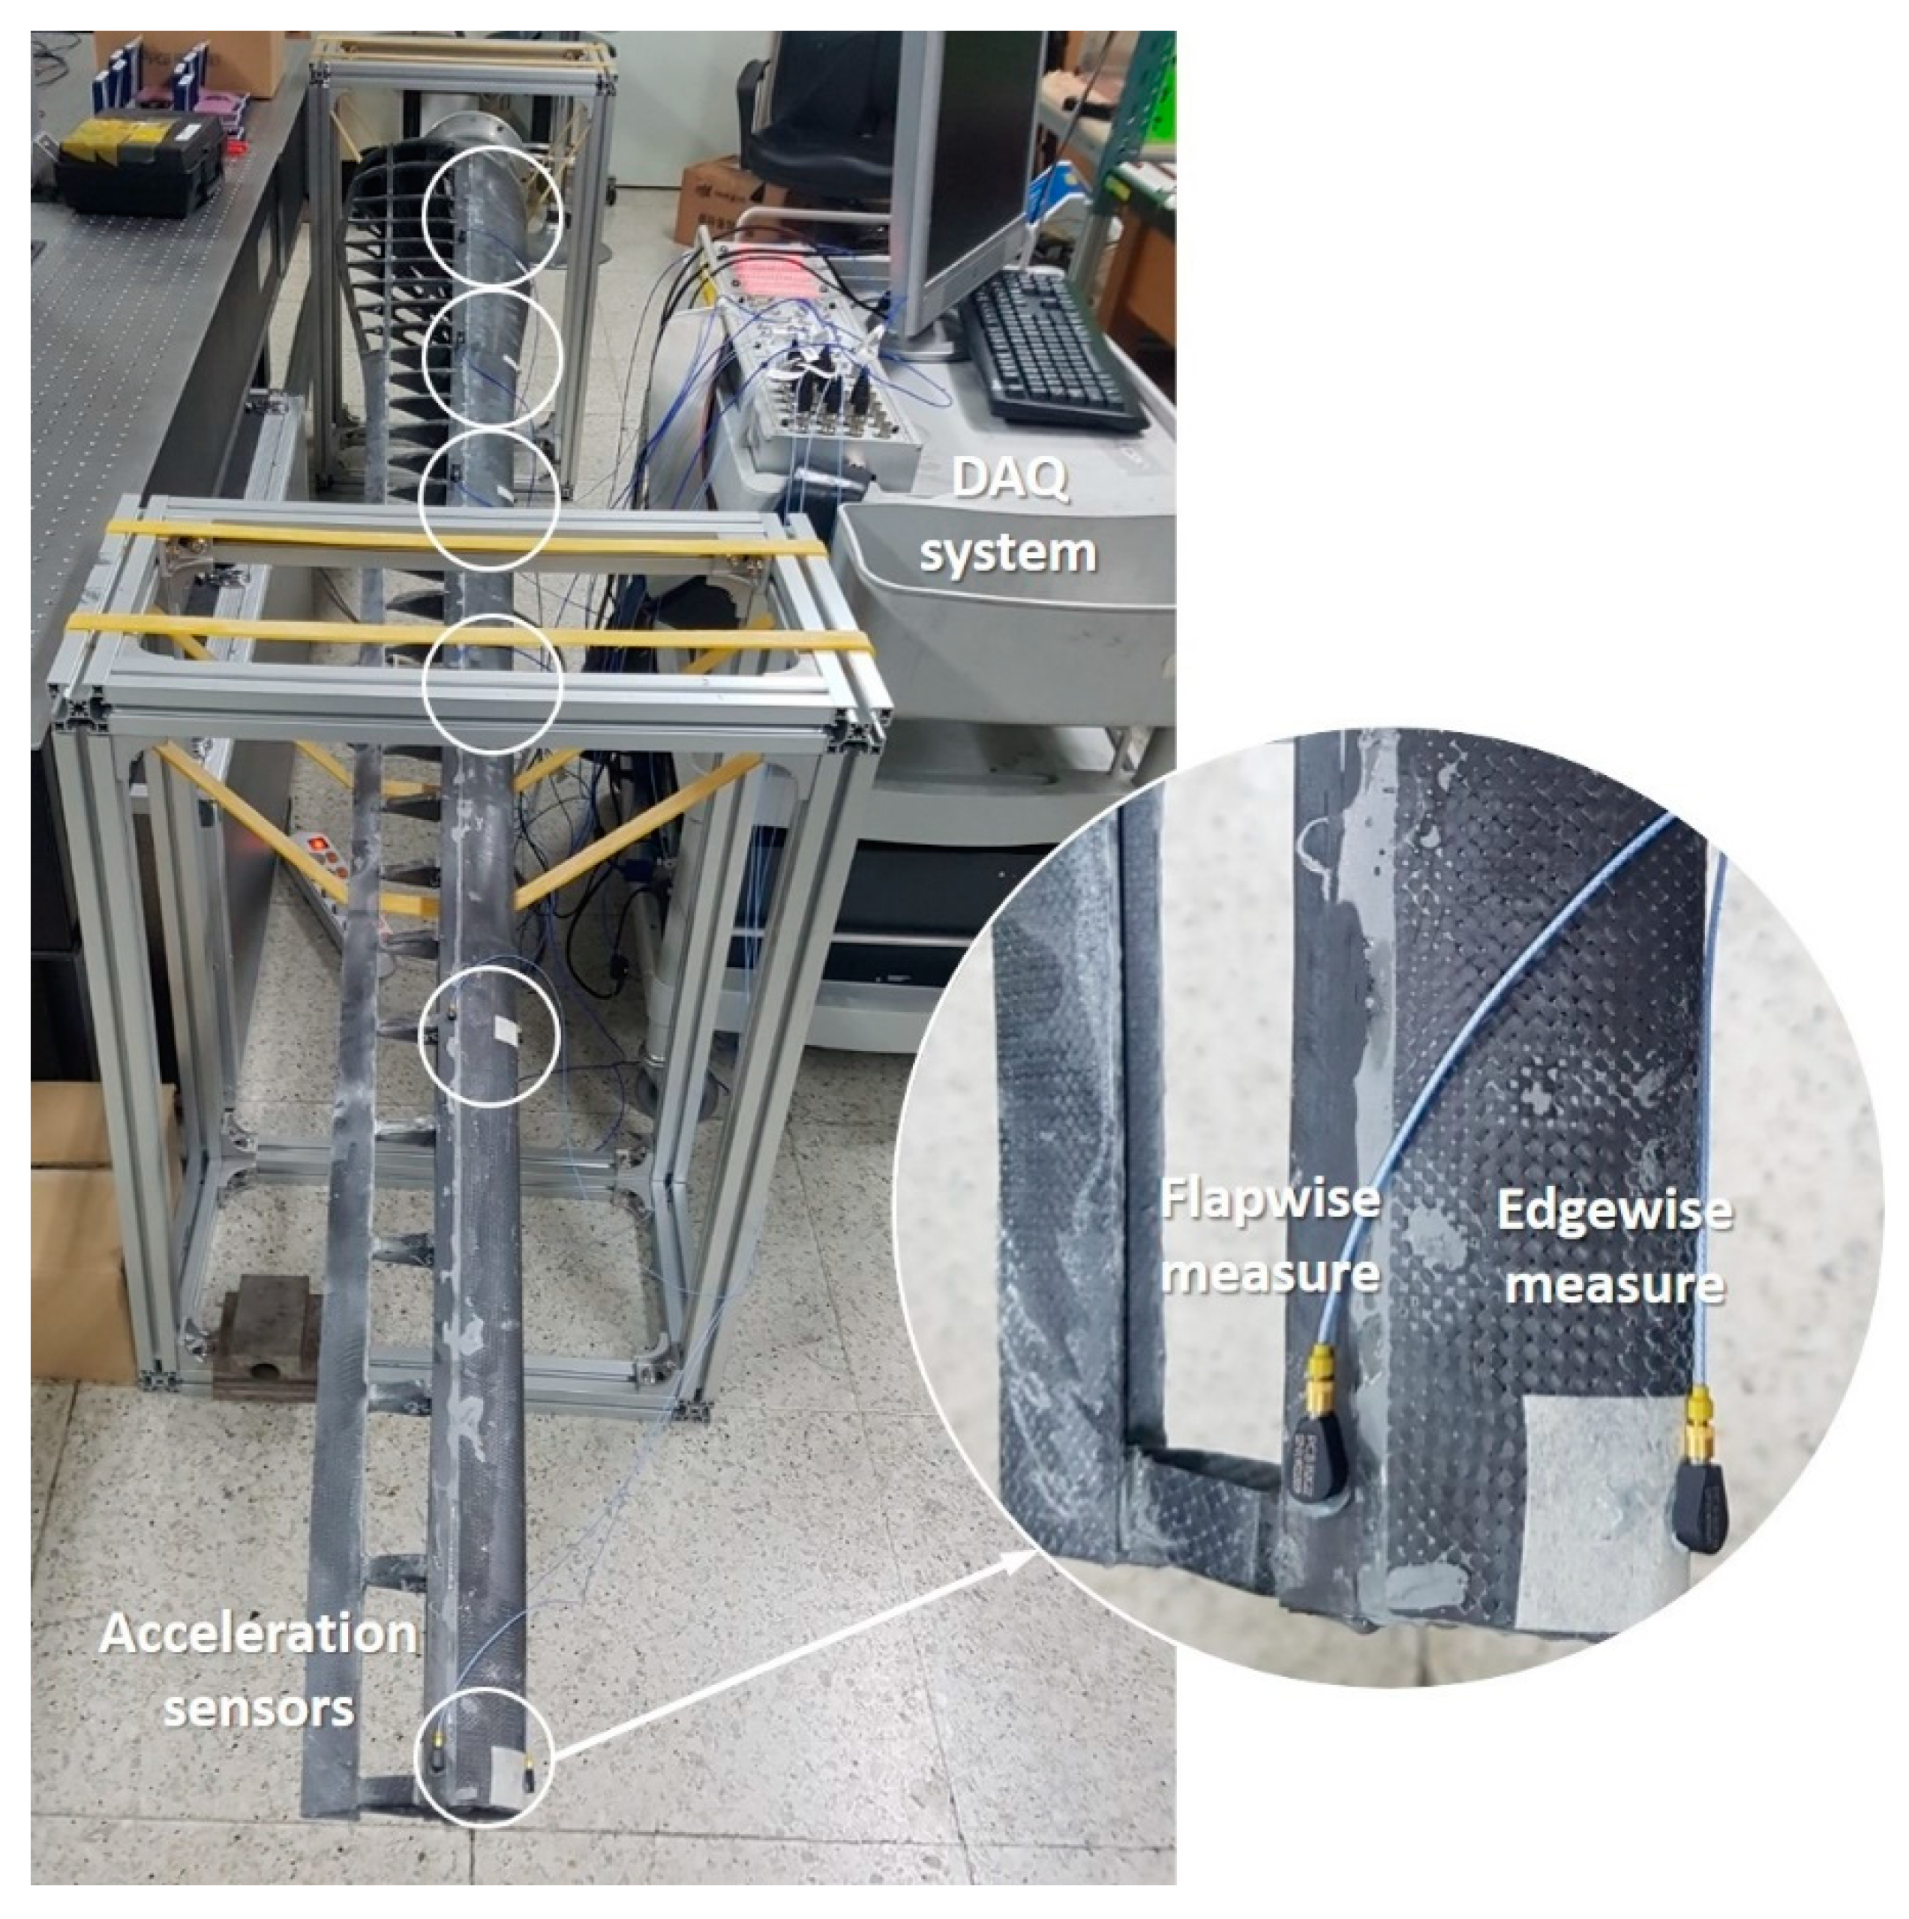
Figure 12.
The modal test setup.
Figure 12.
The modal test setup.
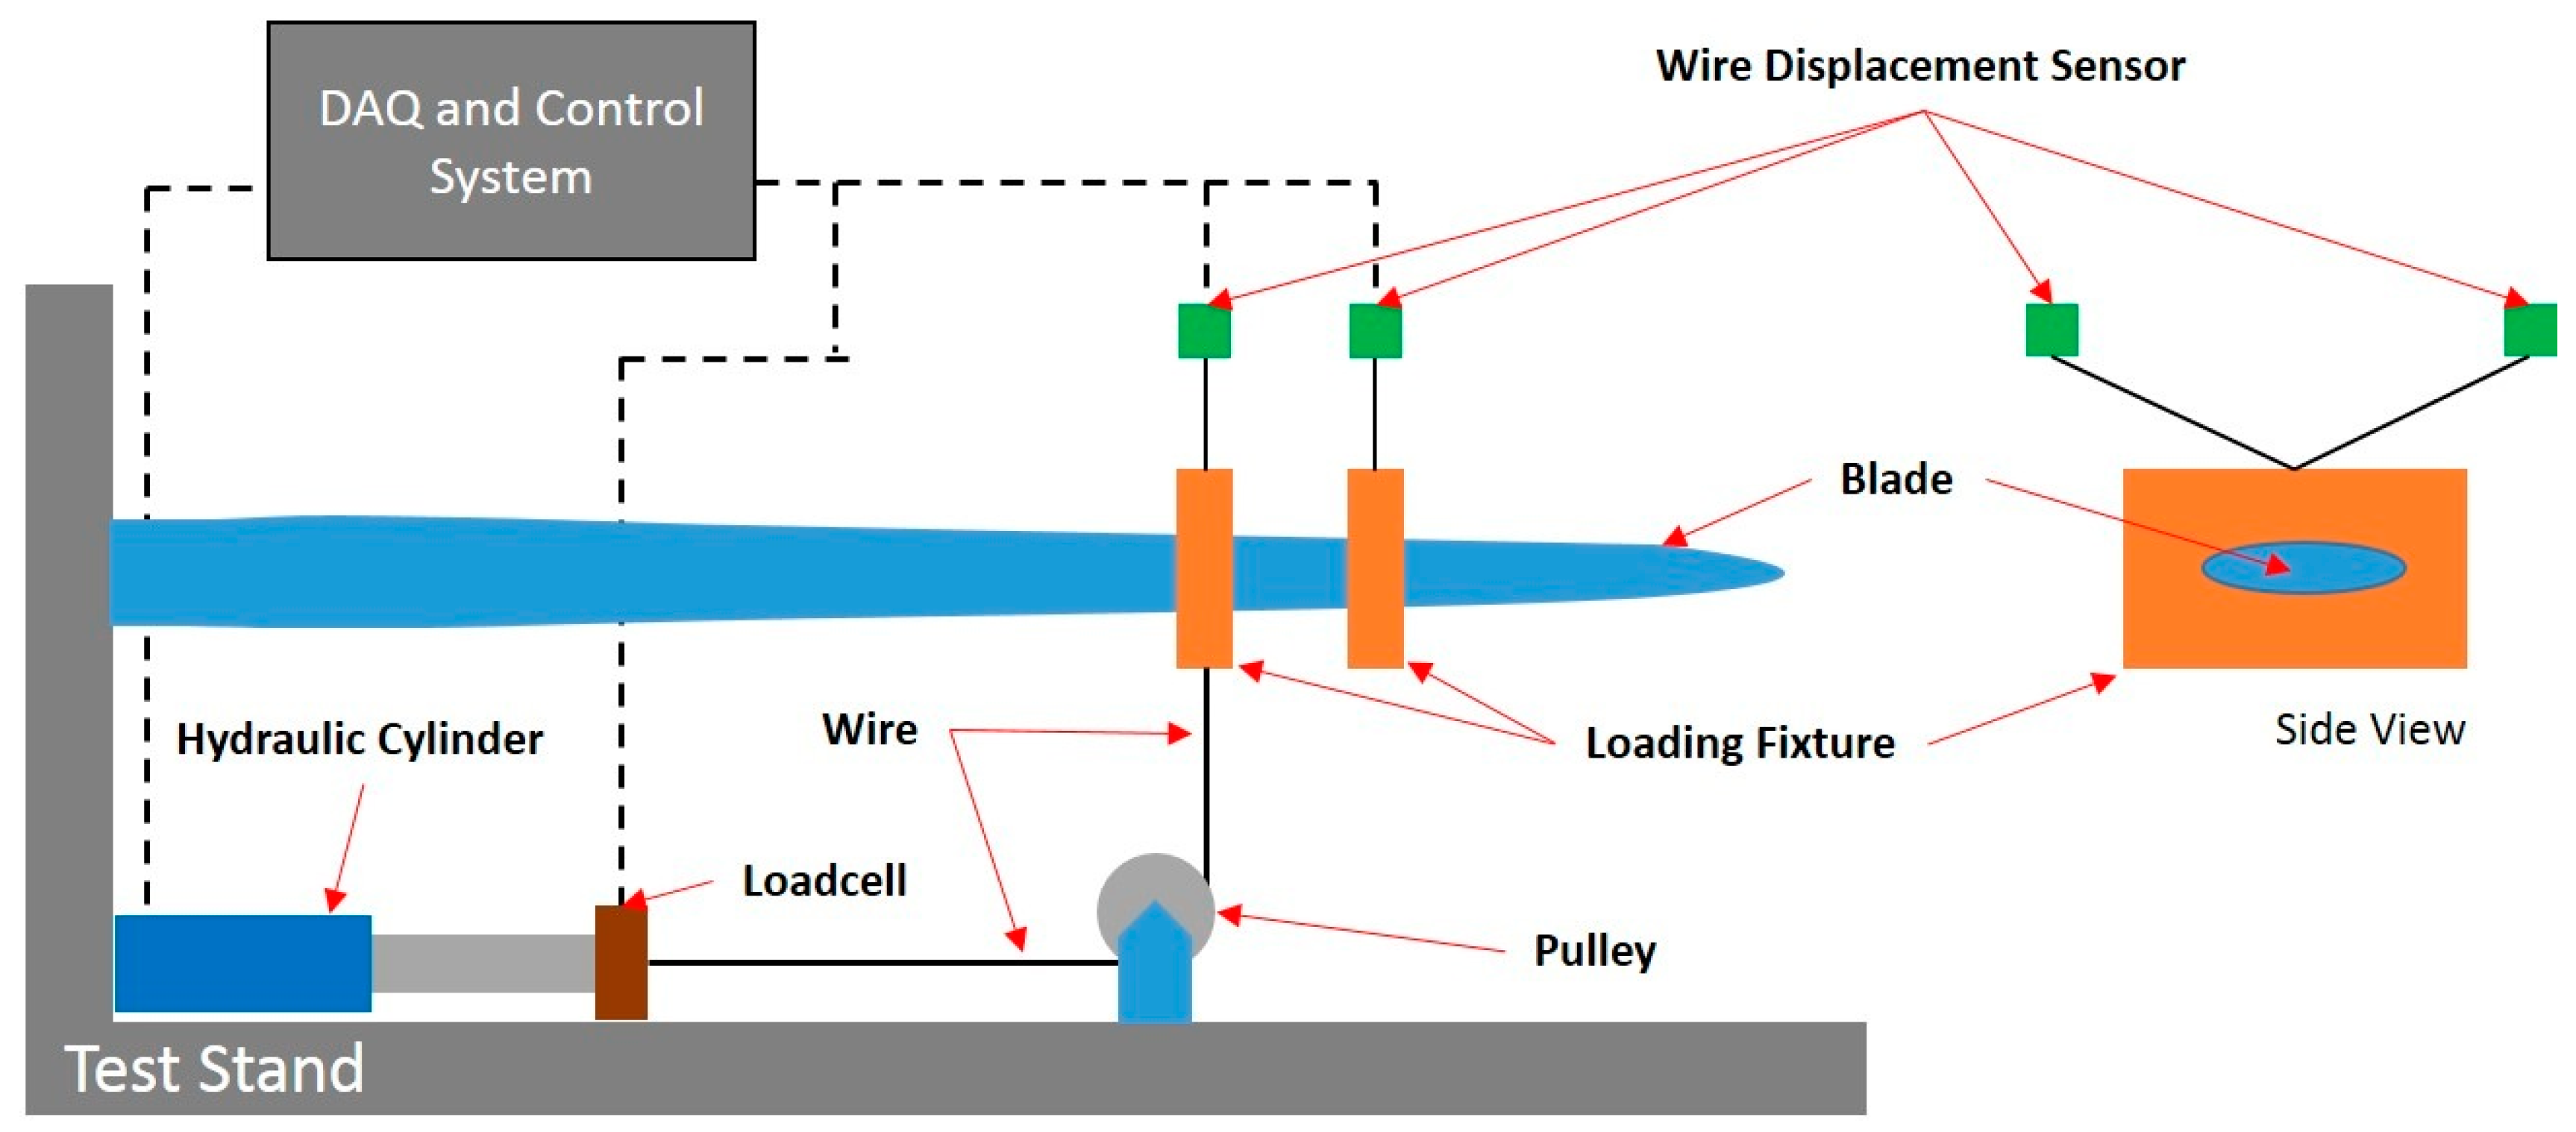
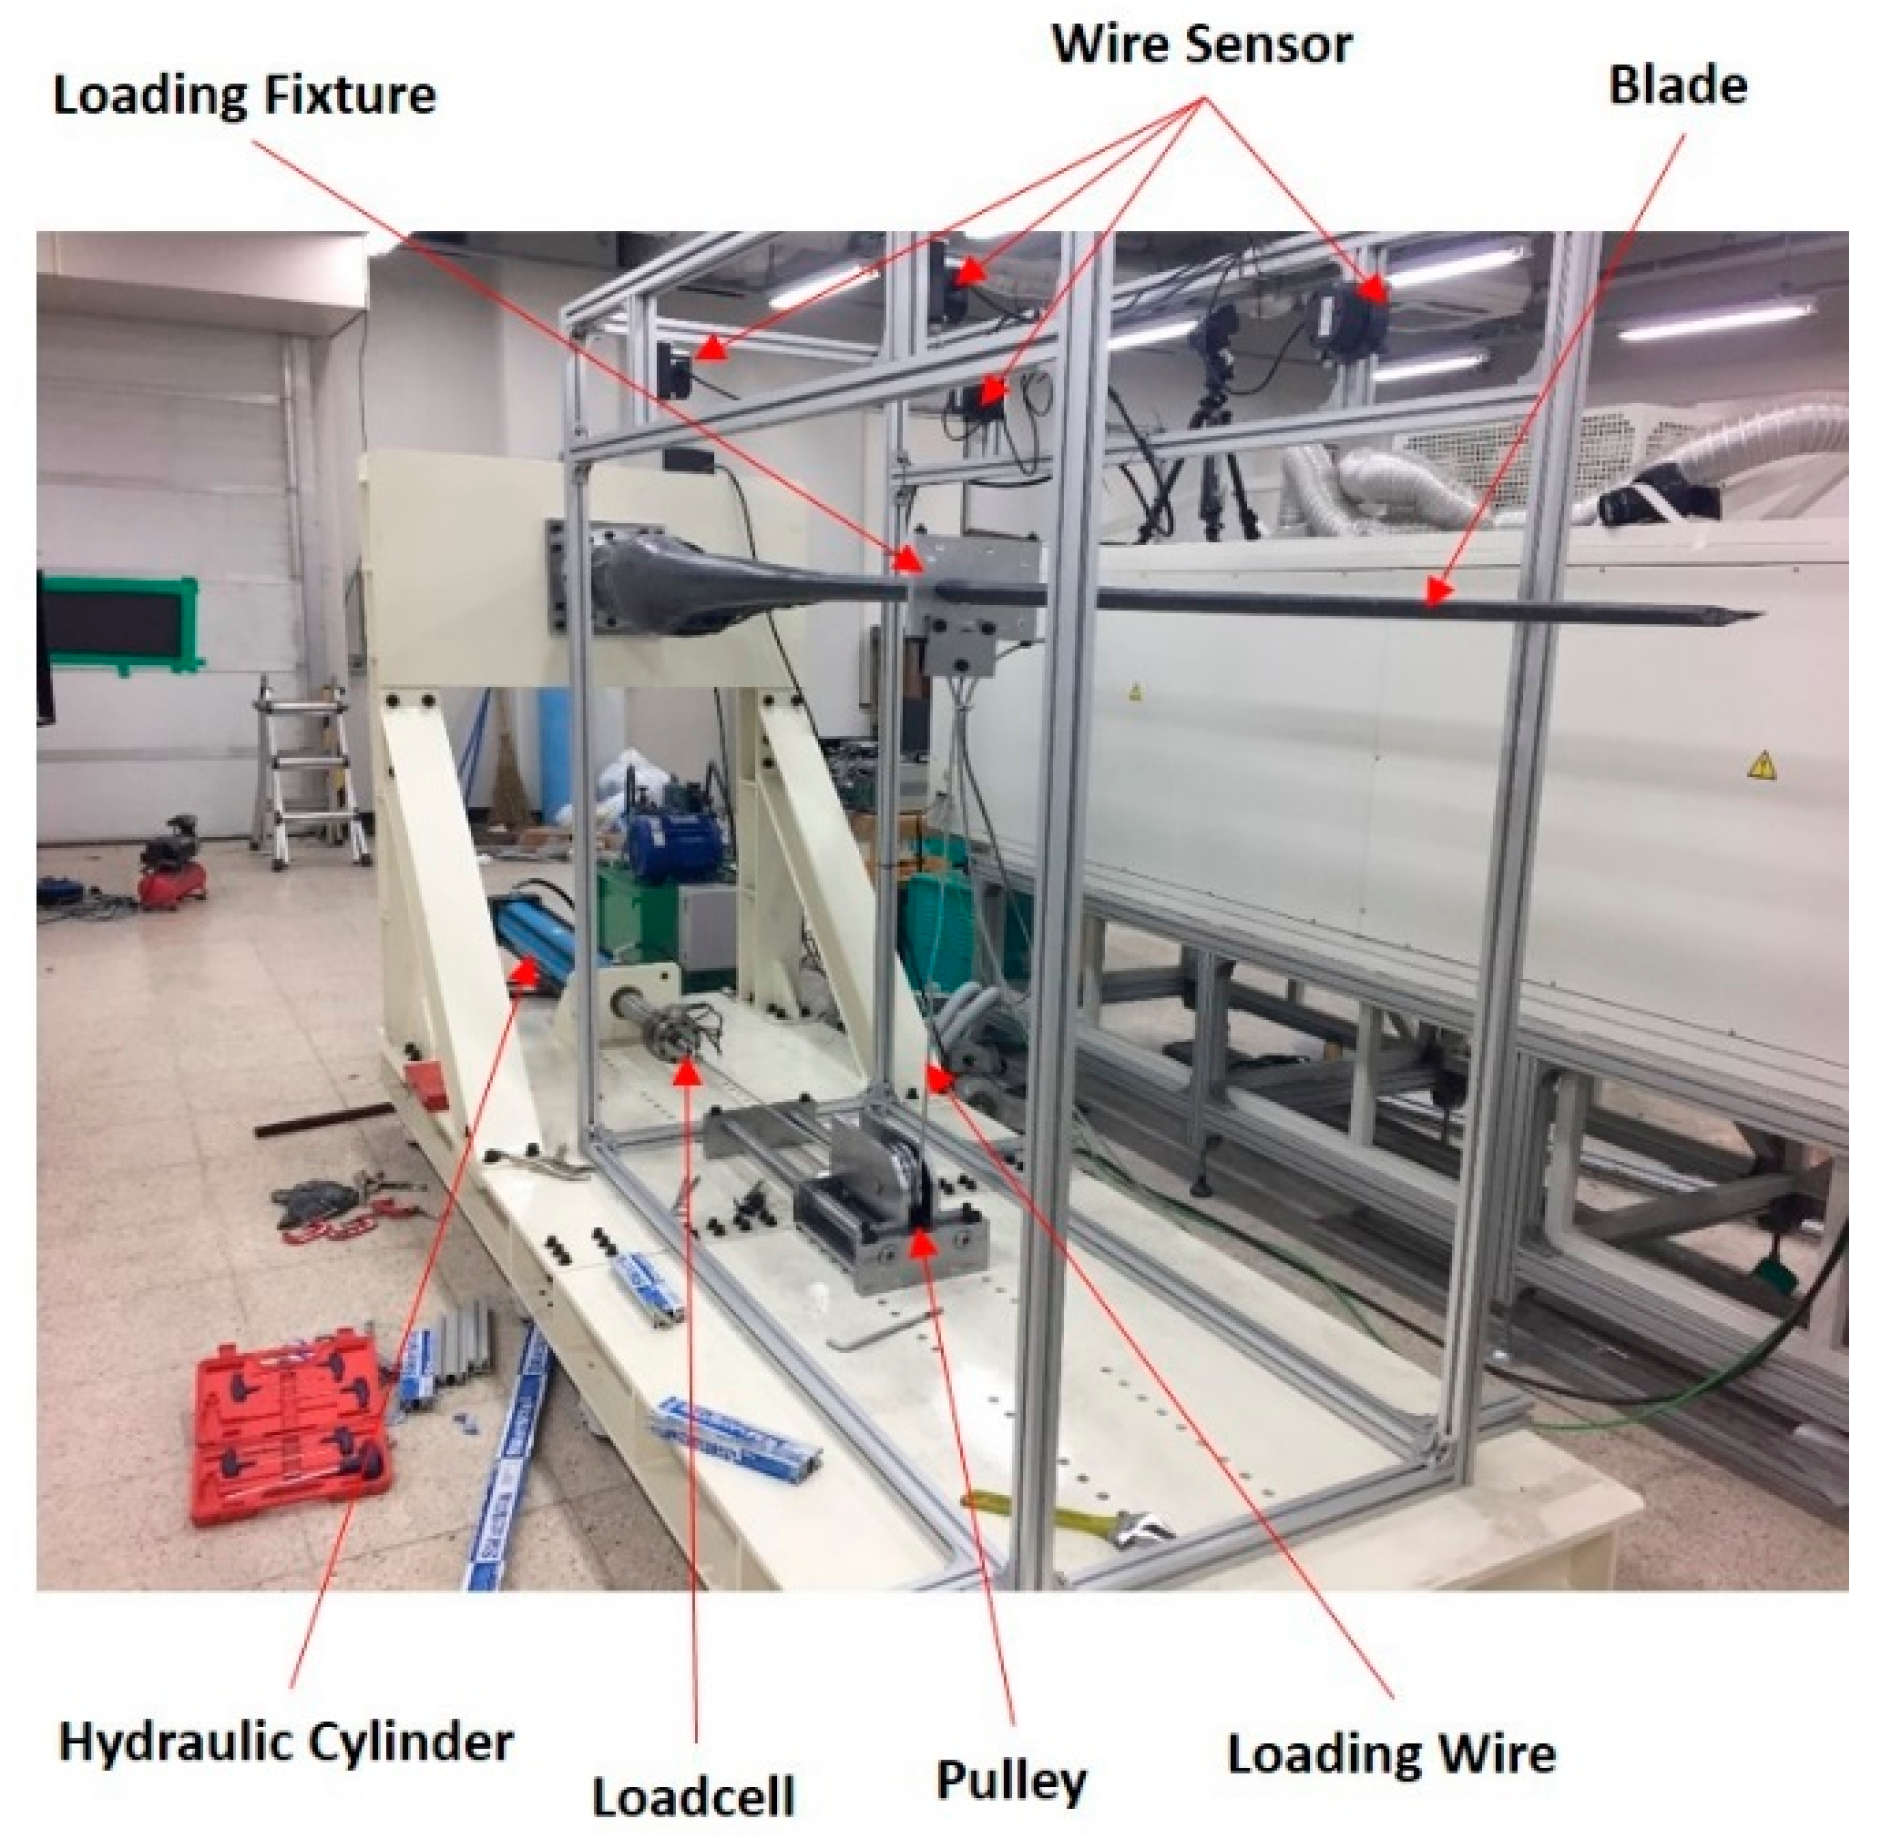
Figure 13.
The static structural testing equipment configuration.
Figure 13.
The static structural testing equipment configuration.
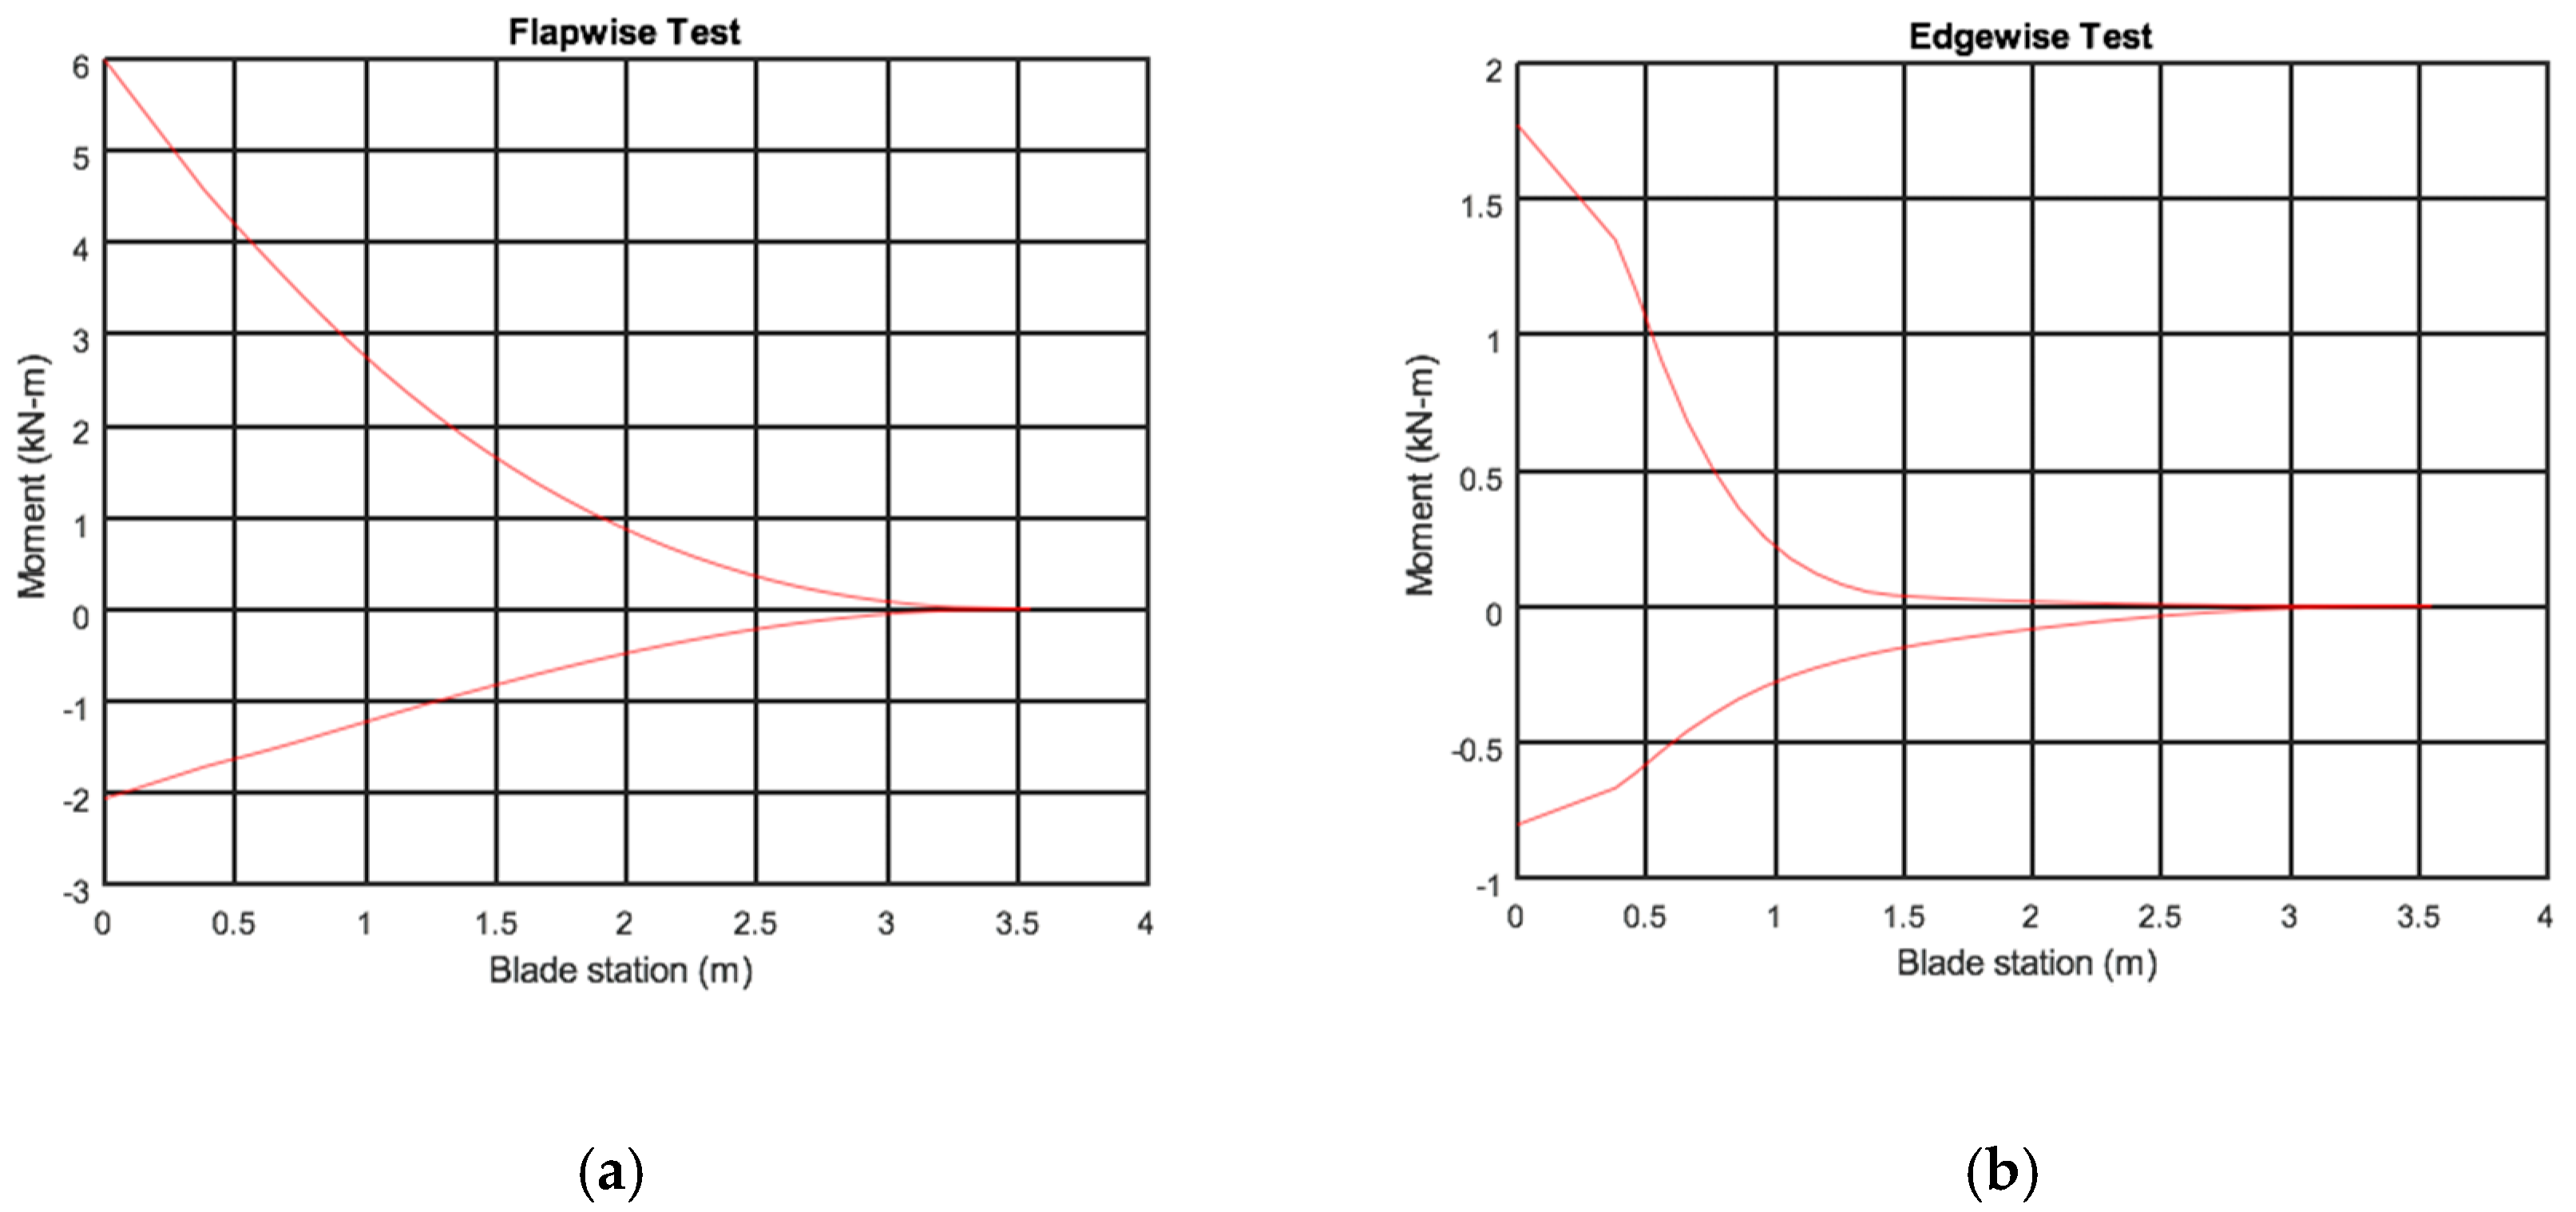
Figure 14.
The test loads: (a) flapwise direction and (b) edgewise direction.
Figure 14.
The test loads: (a) flapwise direction and (b) edgewise direction.
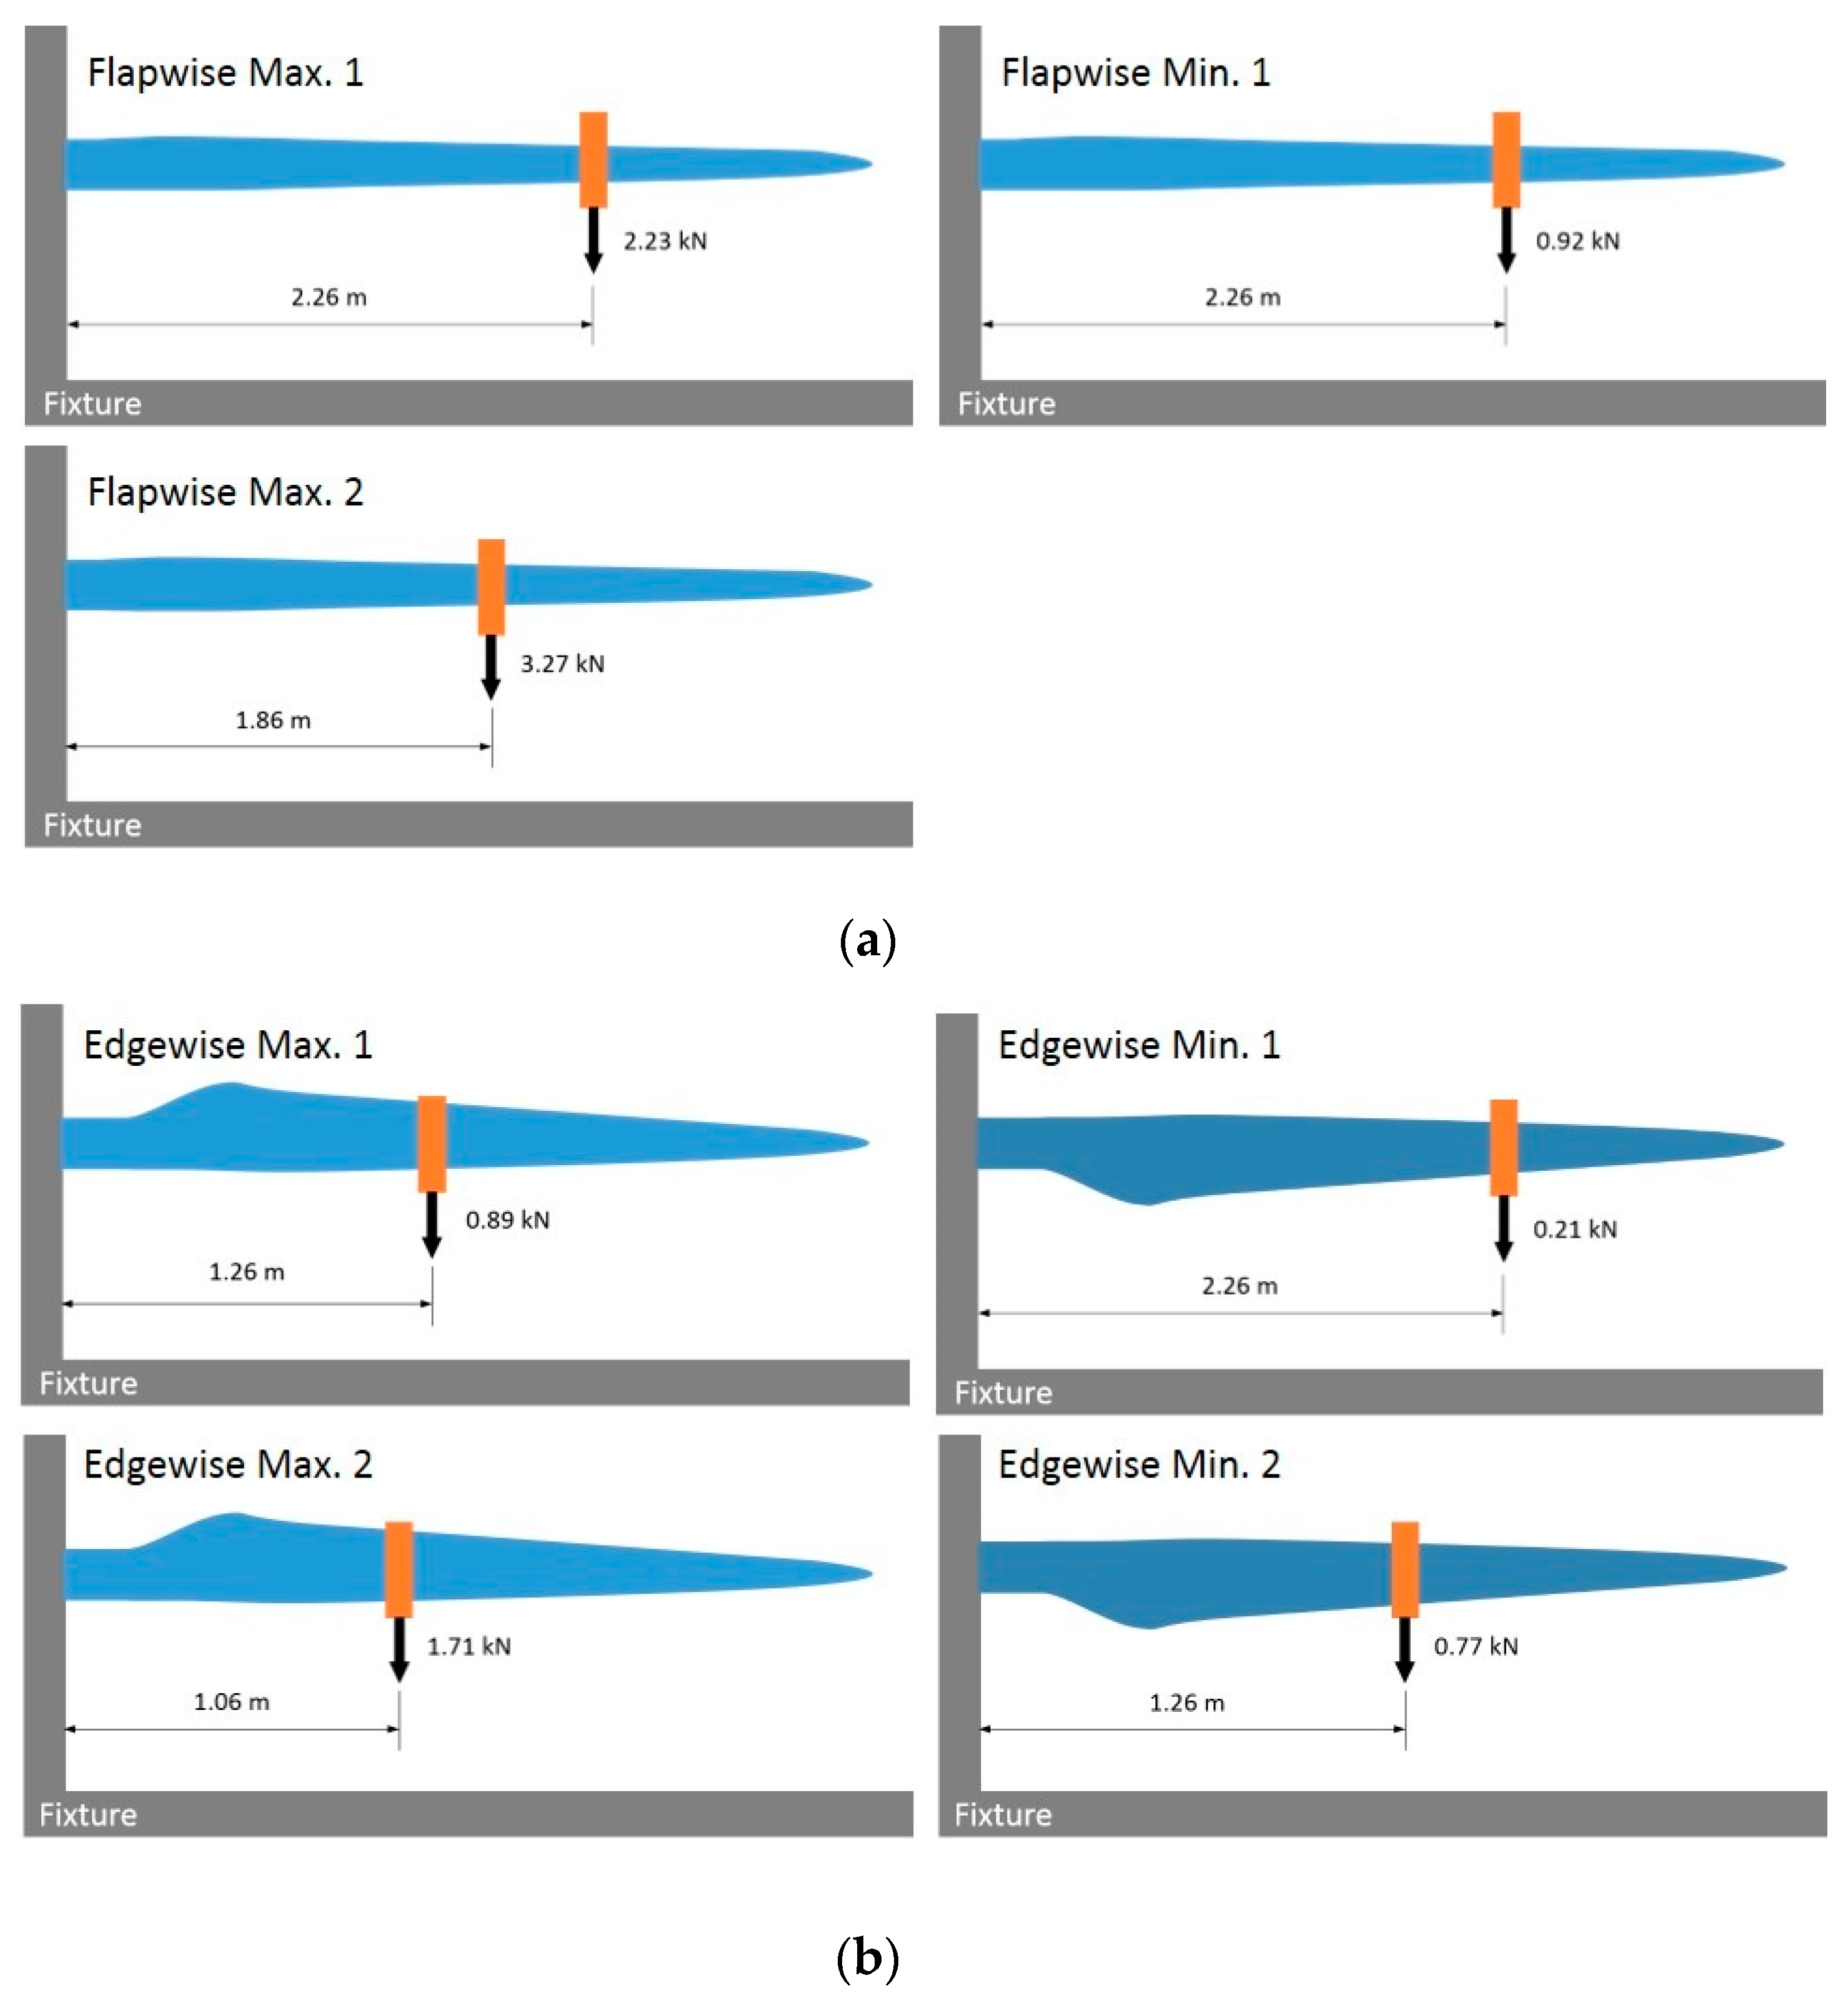
Figure 15.
The test cases with testing loads at loading position: (a) flapwise direction and (b) edgewise direction.
Figure 15.
The test cases with testing loads at loading position: (a) flapwise direction and (b) edgewise direction.
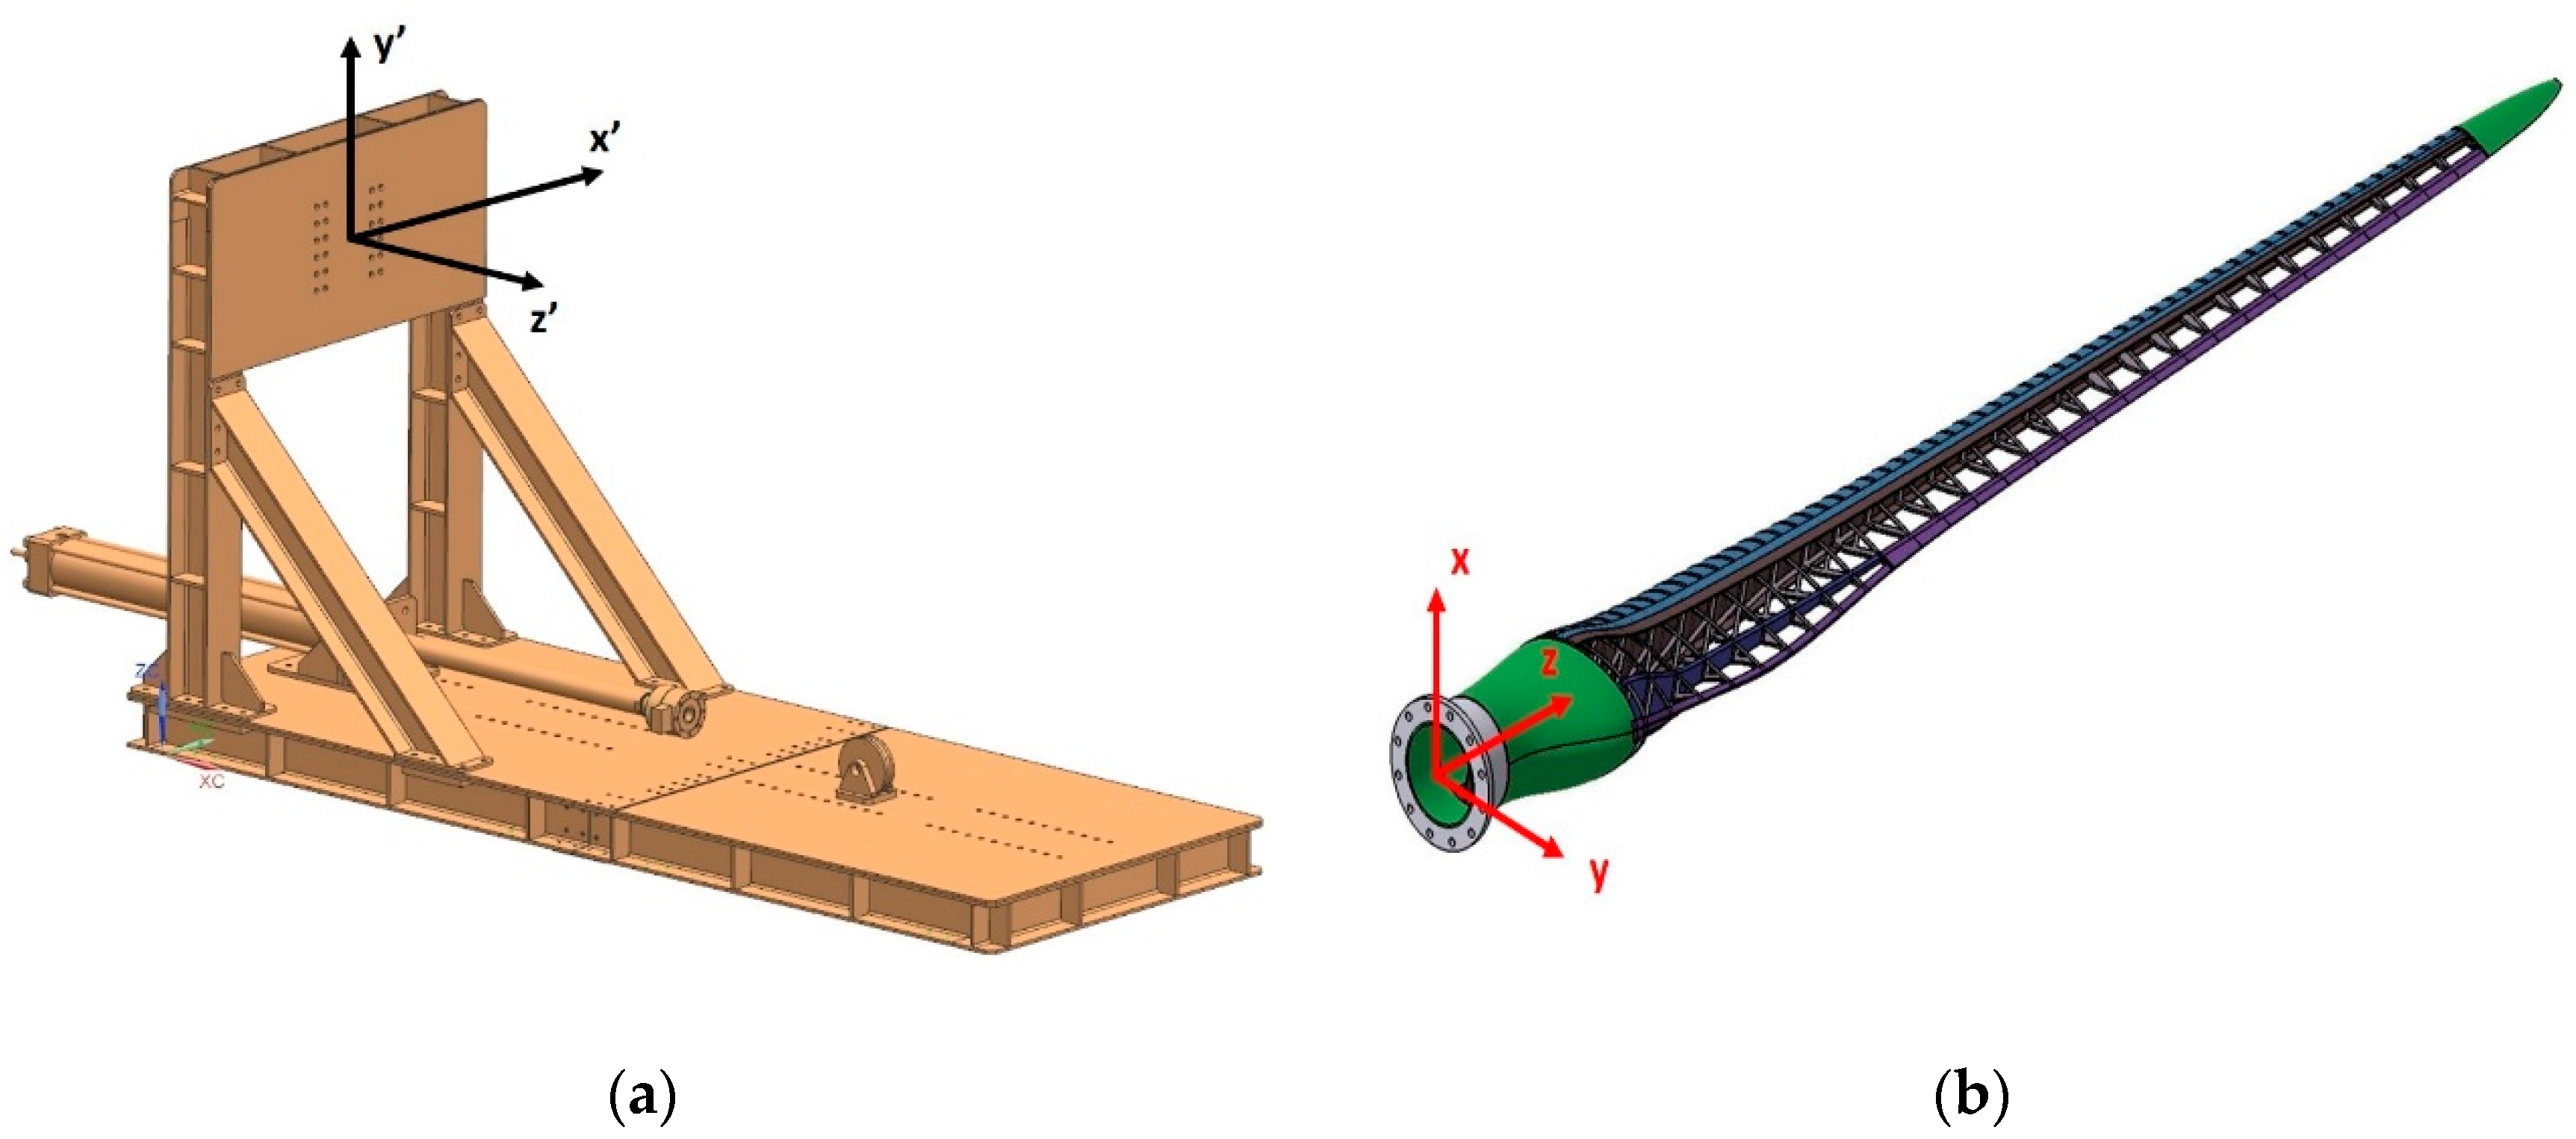
Figure 16.
The coordinate system: (a) the global coordinate system and (b) the blade coordinate system.
Figure 16.
The coordinate system: (a) the global coordinate system and (b) the blade coordinate system.
Figure 17.
The test setup.
Figure 17.
The test setup.
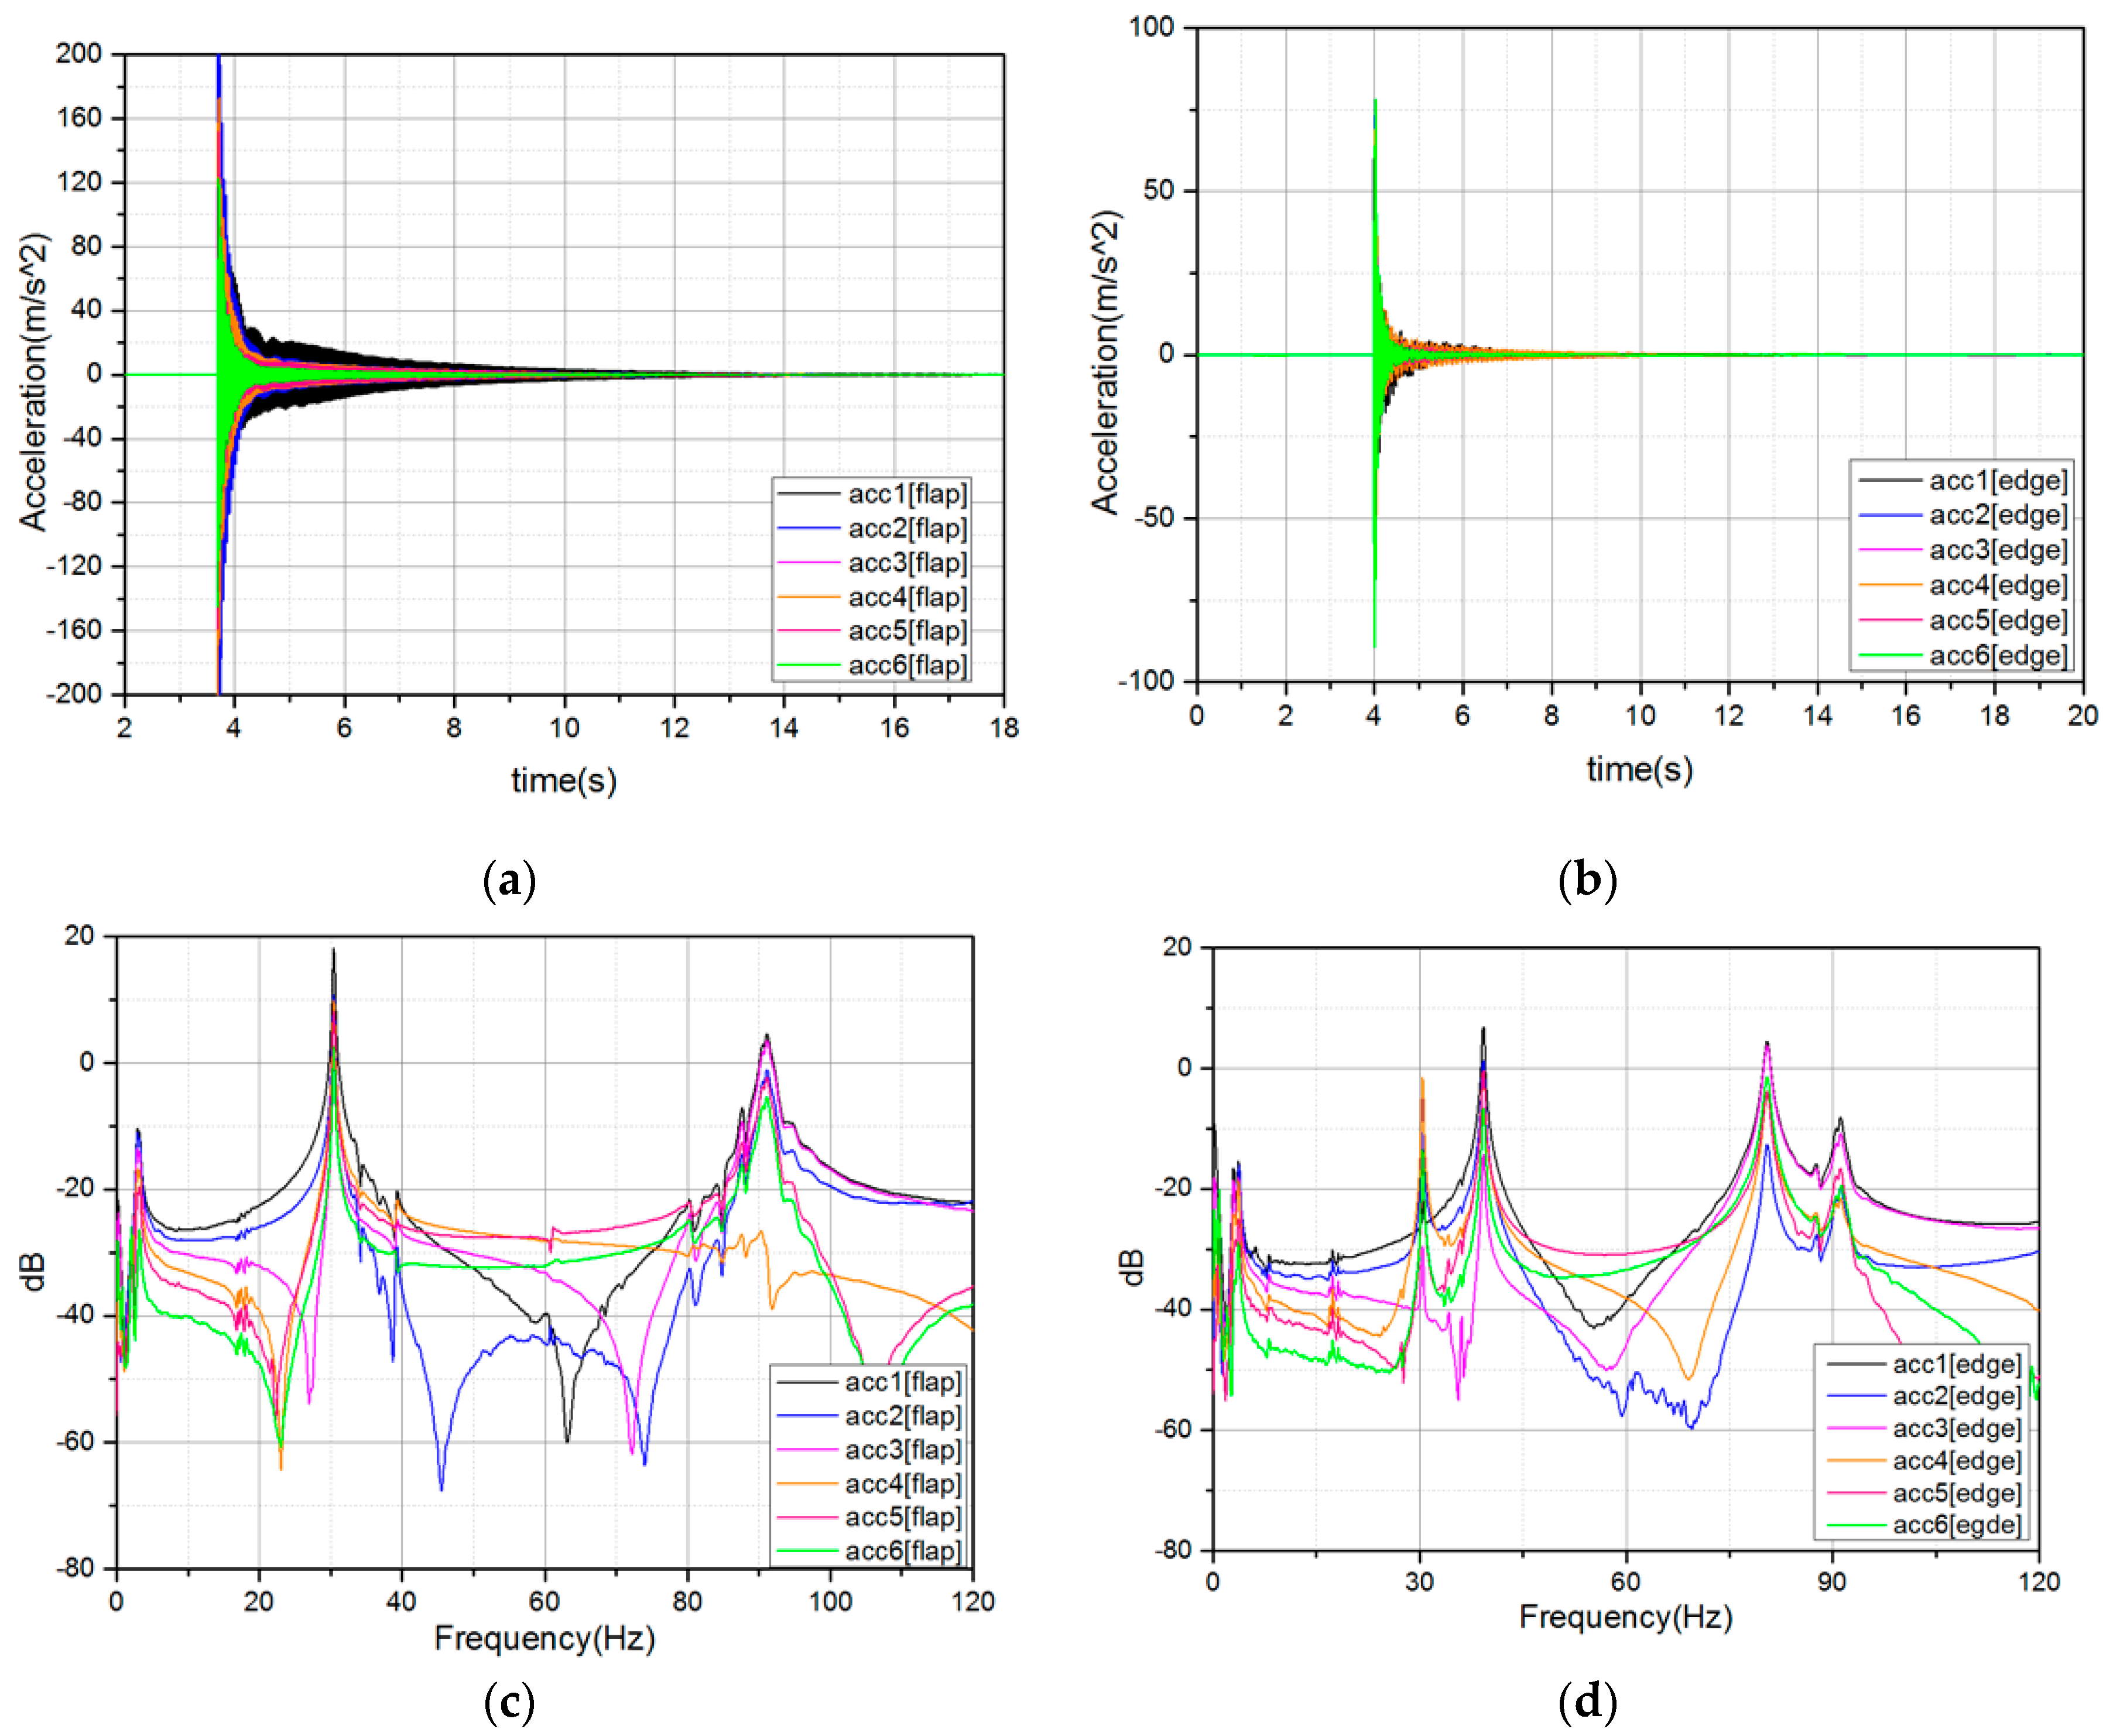
Figure 18.
Modal testing results: (a) time signal(flapwise), (b) time signal(edgewise), (c) frequency response(flapwise), and (d) frequency response(edgewise).
Figure 18.
Modal testing results: (a) time signal(flapwise), (b) time signal(edgewise), (c) frequency response(flapwise), and (d) frequency response(edgewise).
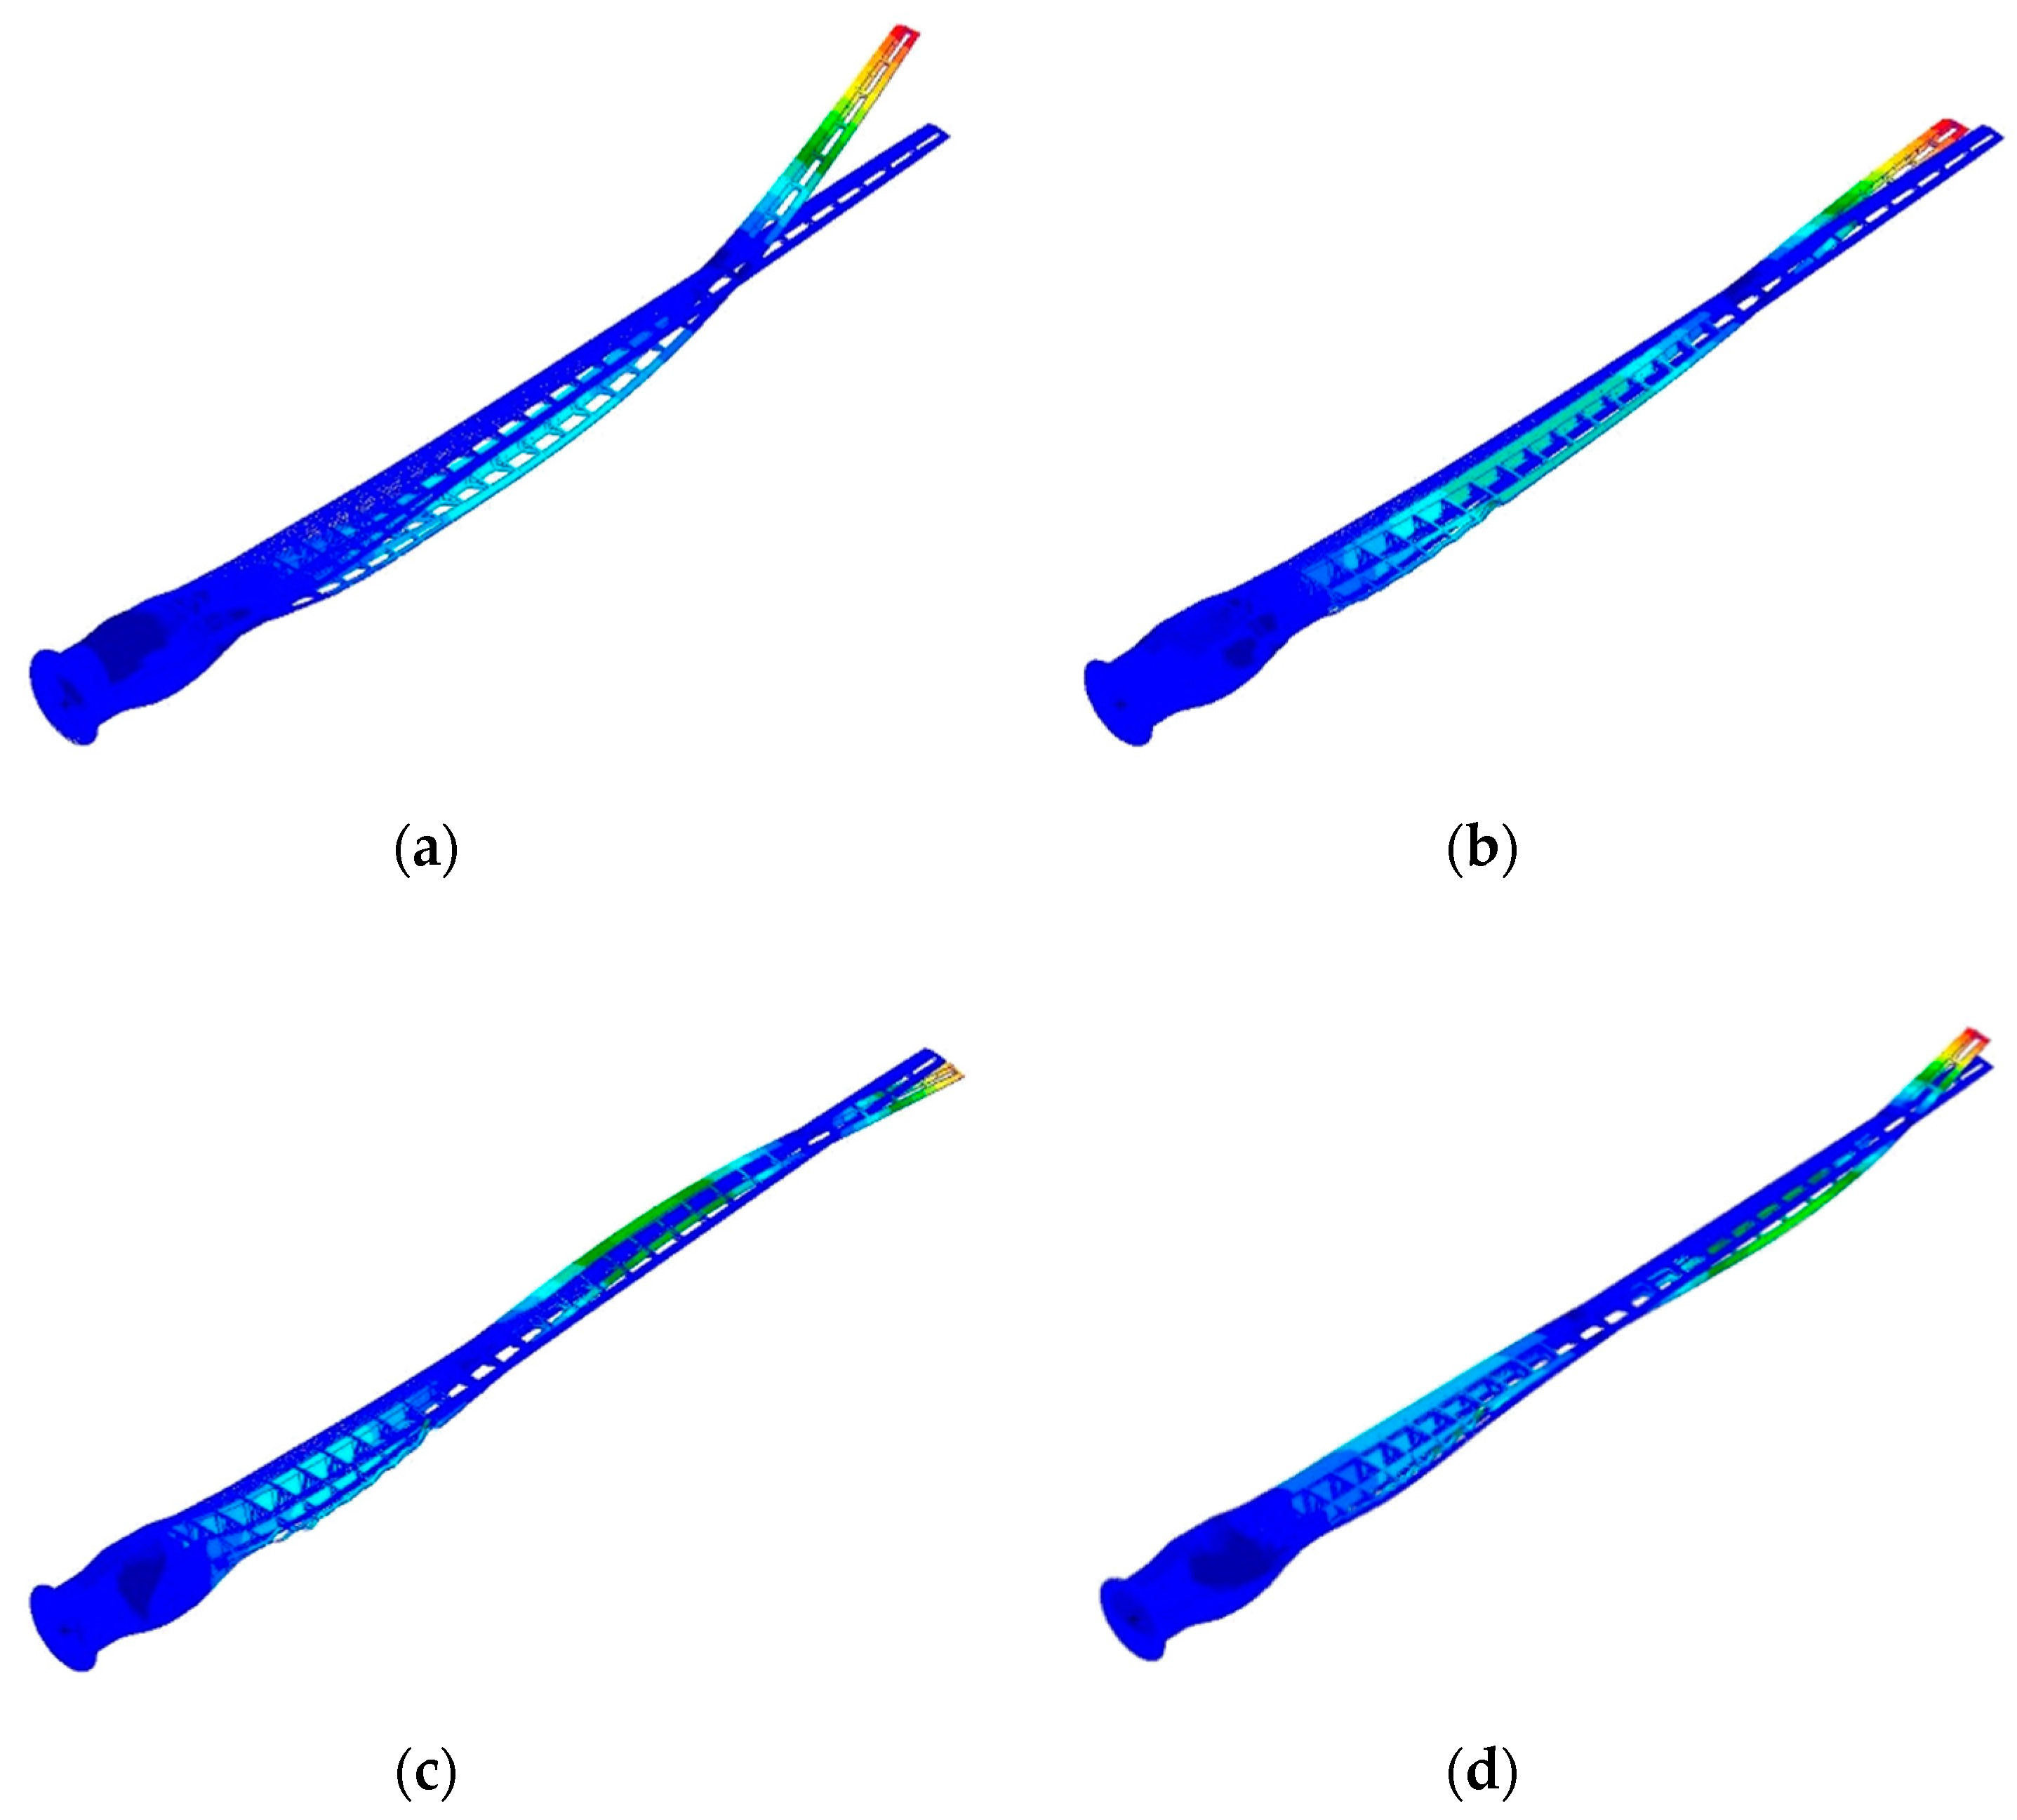
Figure 19.
The mode shapes: (a) first mode, (b) second mode, (c) third mode, and (d) fourth mode.
Figure 19.
The mode shapes: (a) first mode, (b) second mode, (c) third mode, and (d) fourth mode.
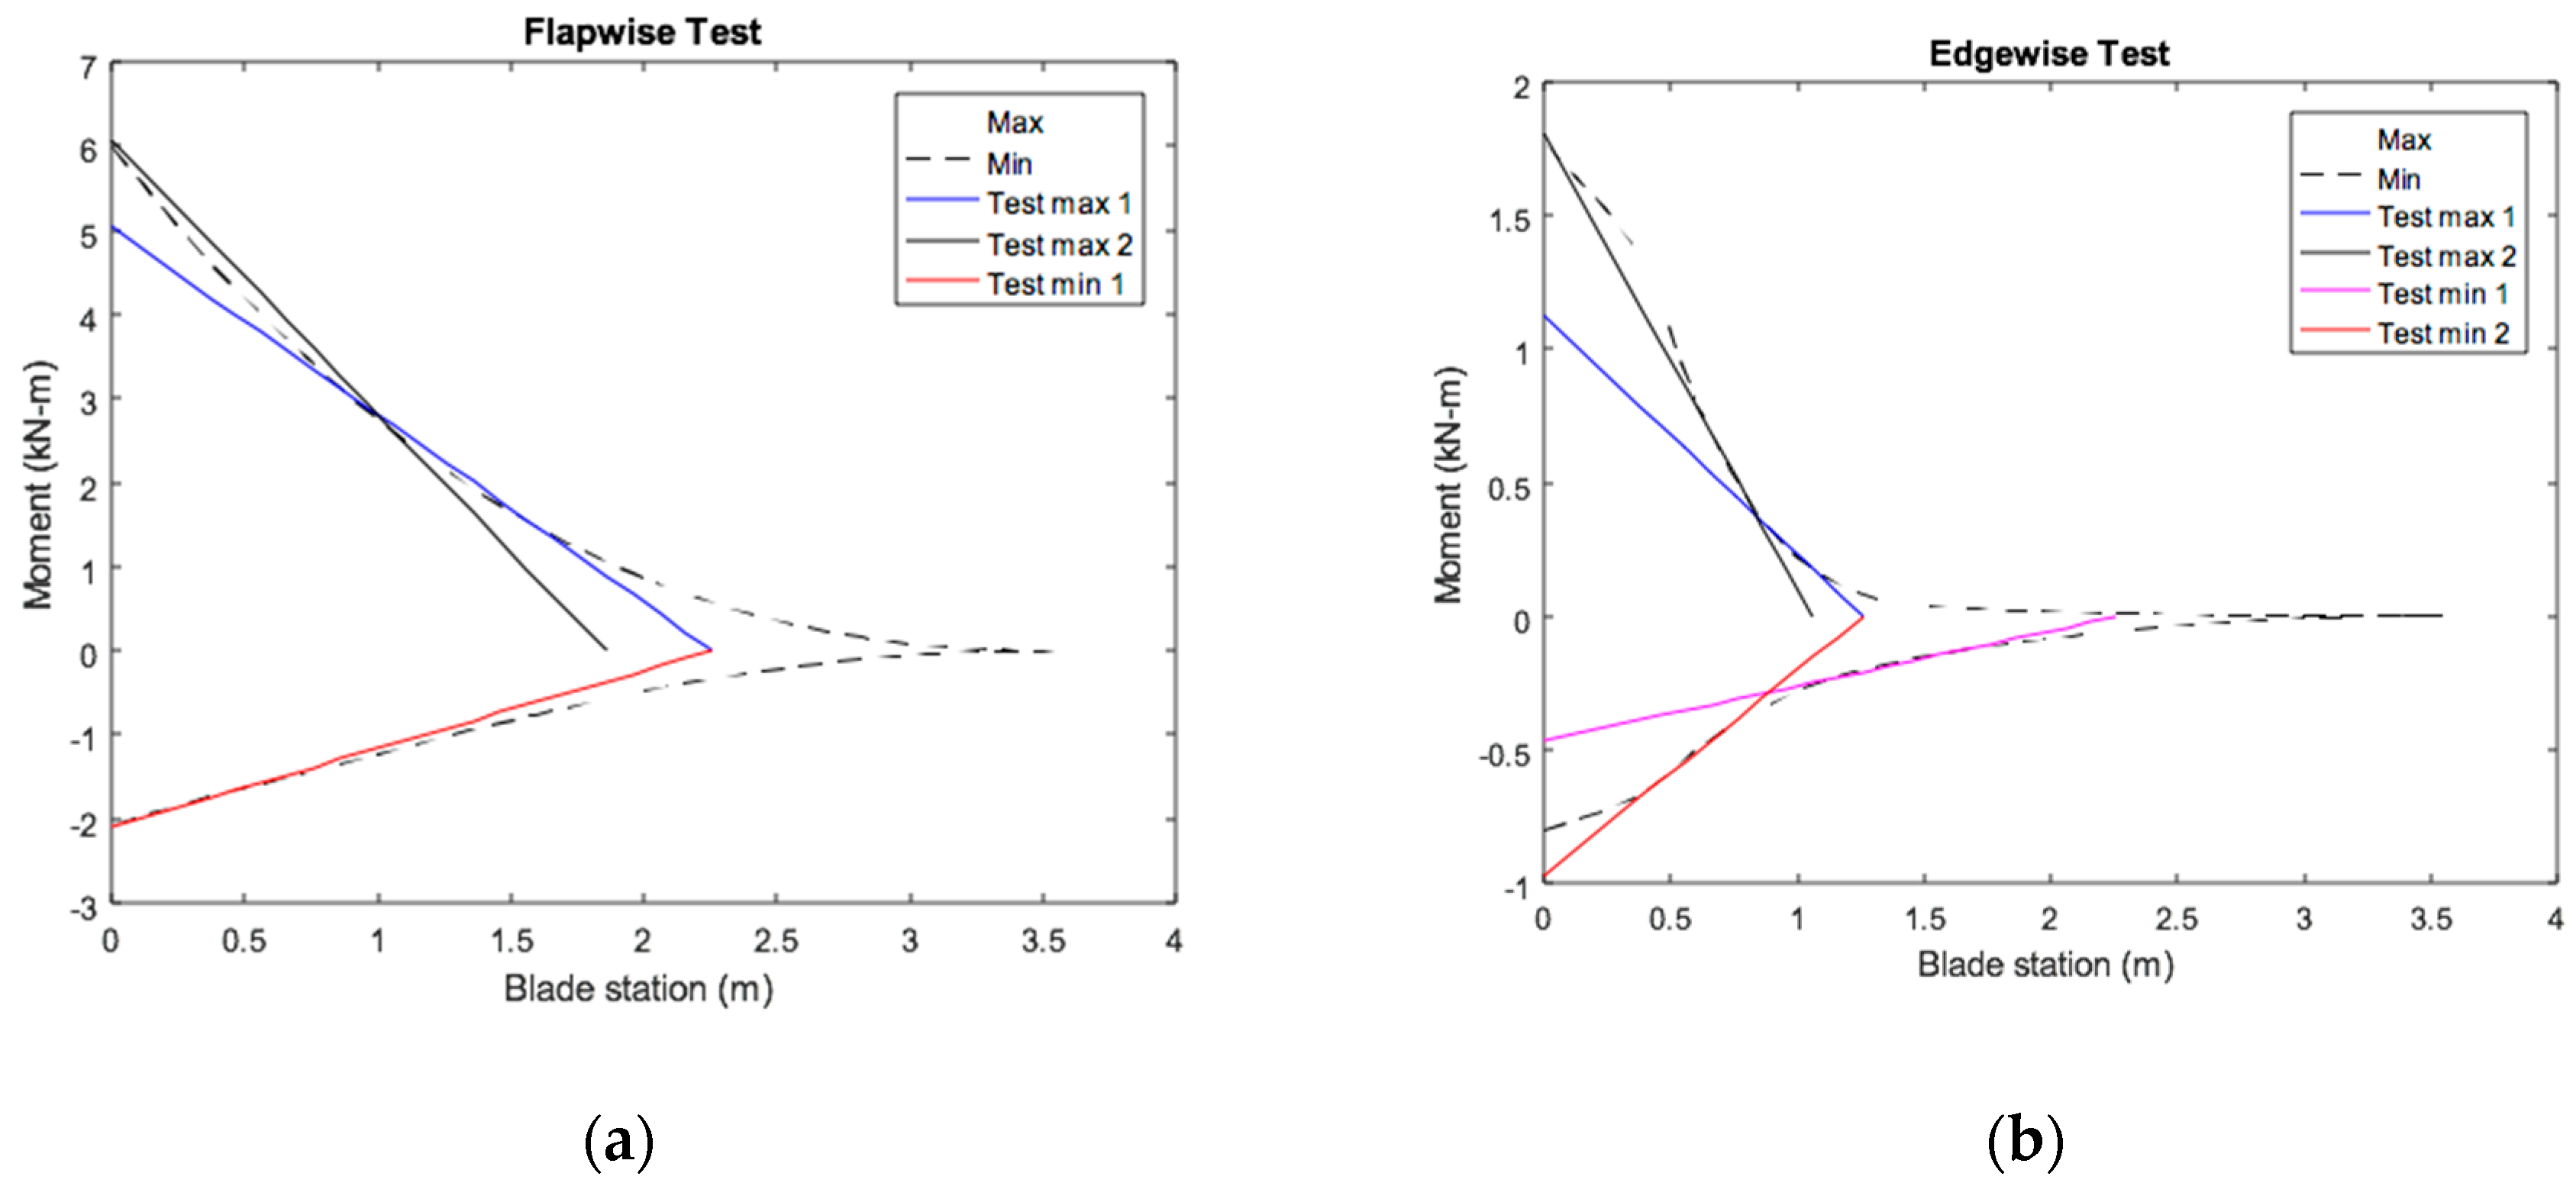
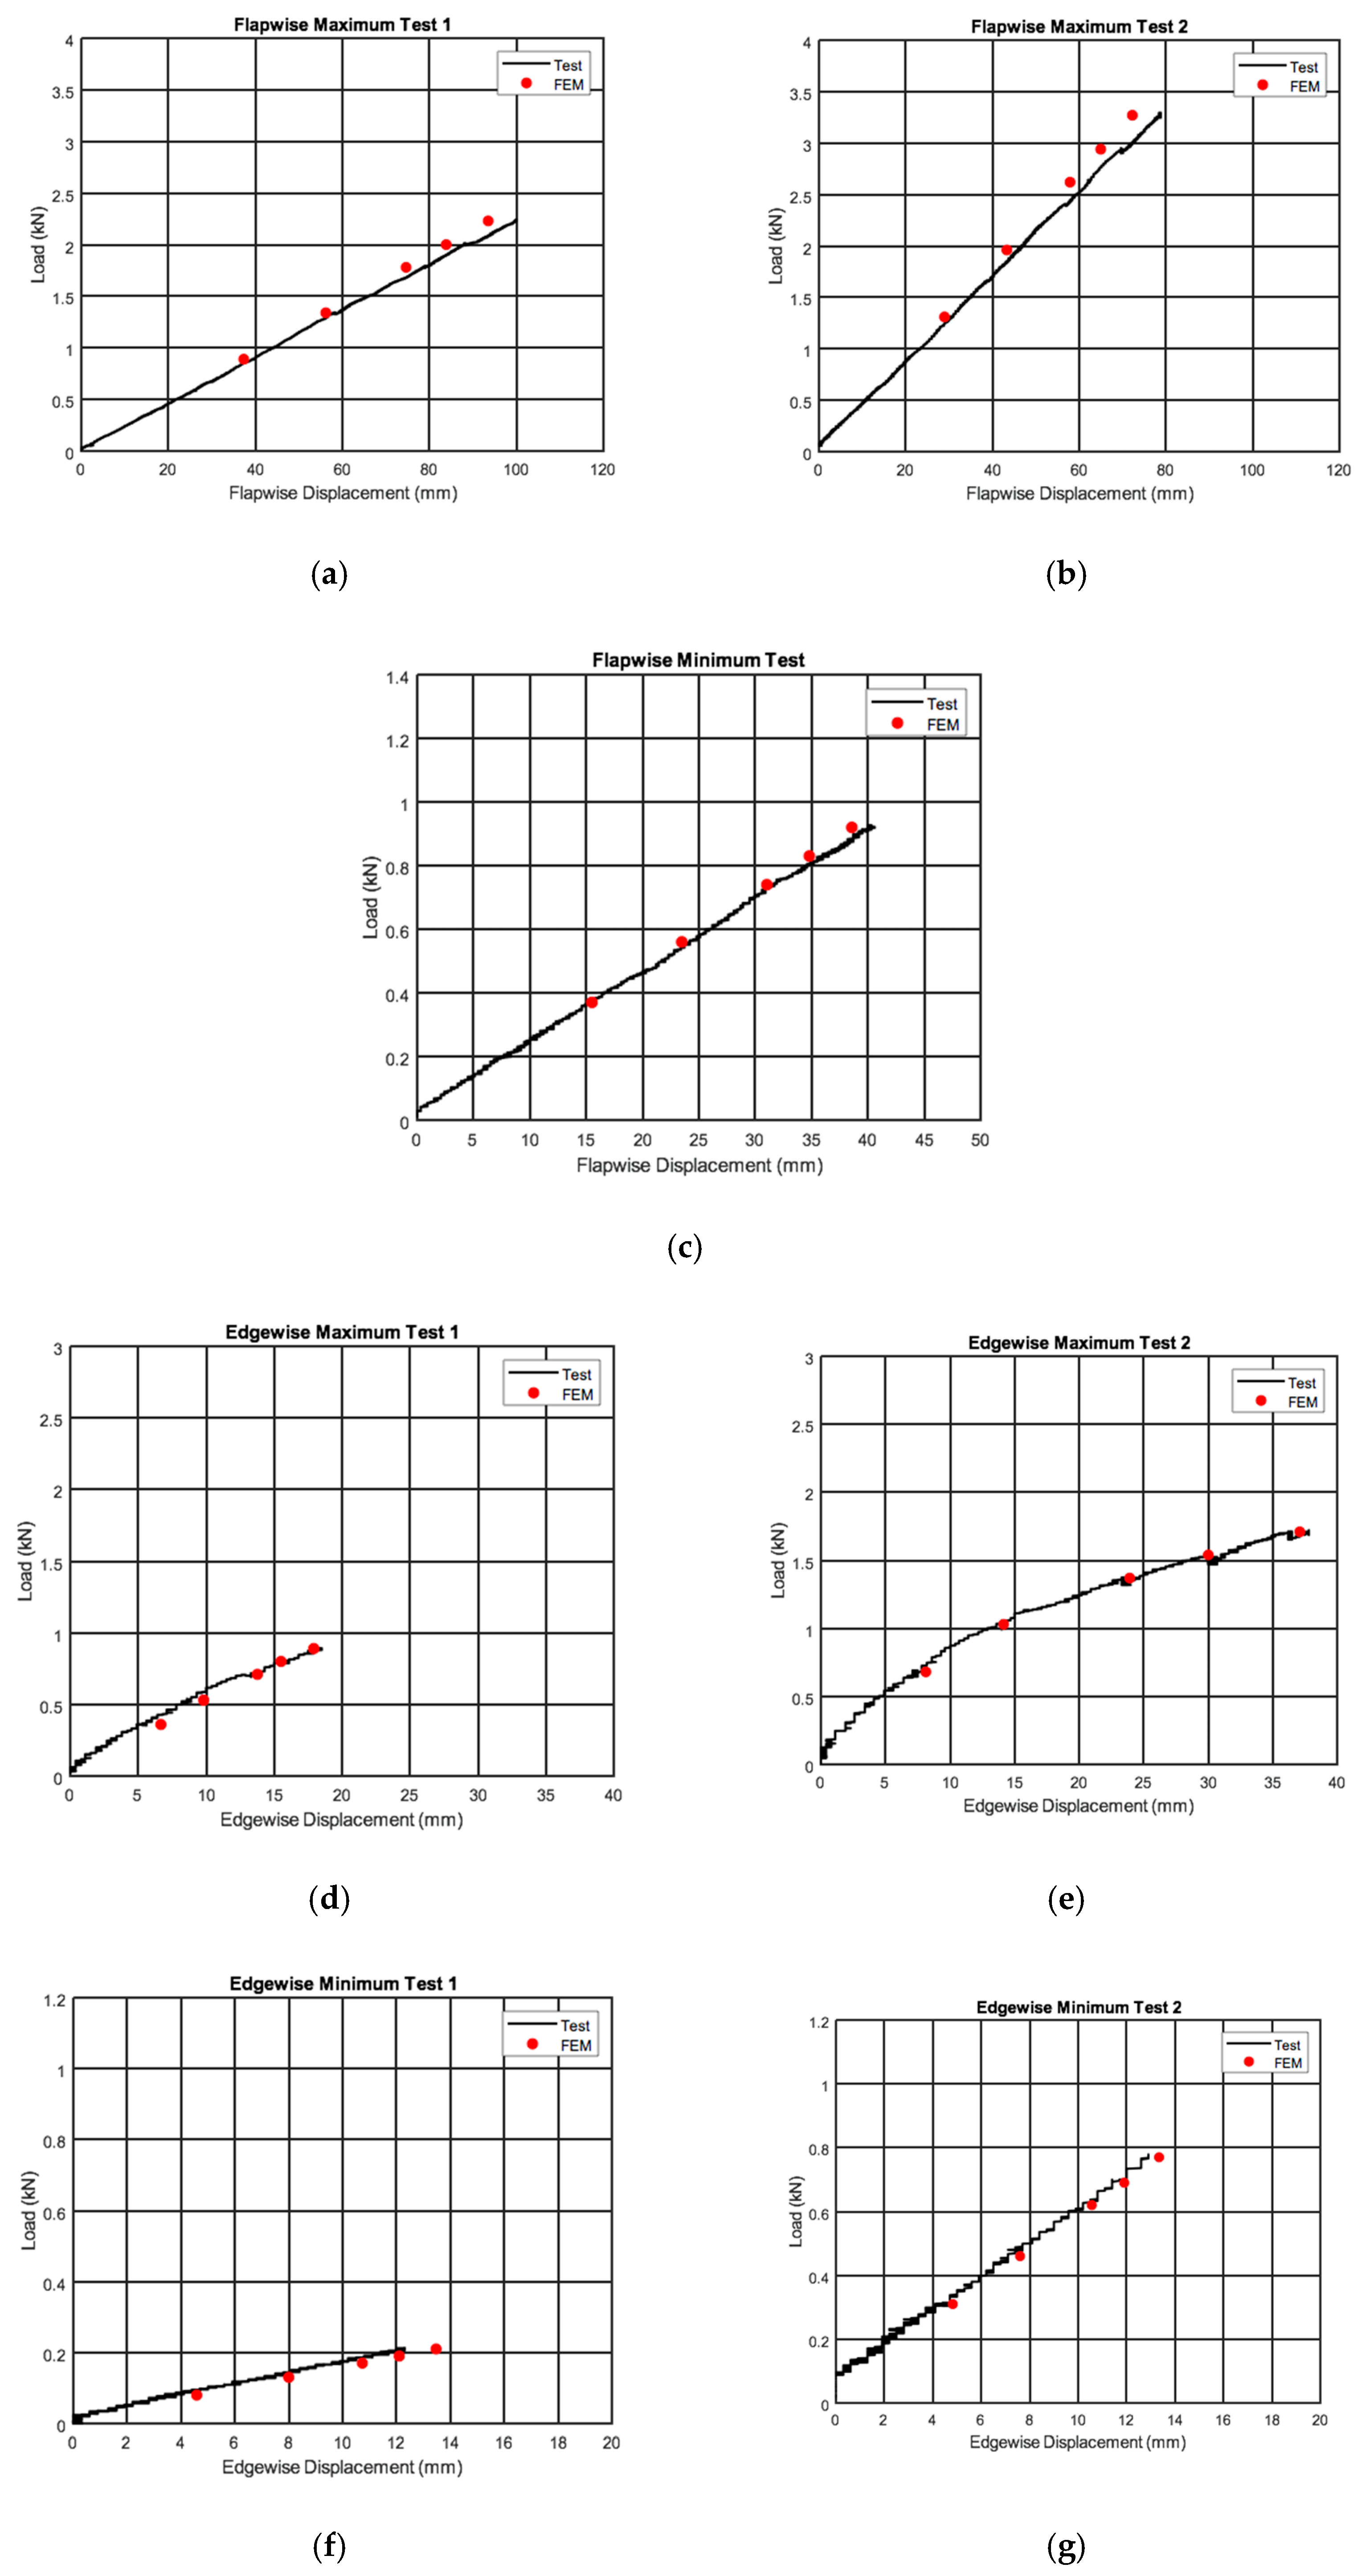
Figure 20.
The structural testing and analysis results: (a) case 1, (b) case 2, (c) case 3, (d) case 4, (e) case 5, (f) case 6, and (g) case 7.
Figure 20.
The structural testing and analysis results: (a) case 1, (b) case 2, (c) case 3, (d) case 4, (e) case 5, (f) case 6, and (g) case 7.
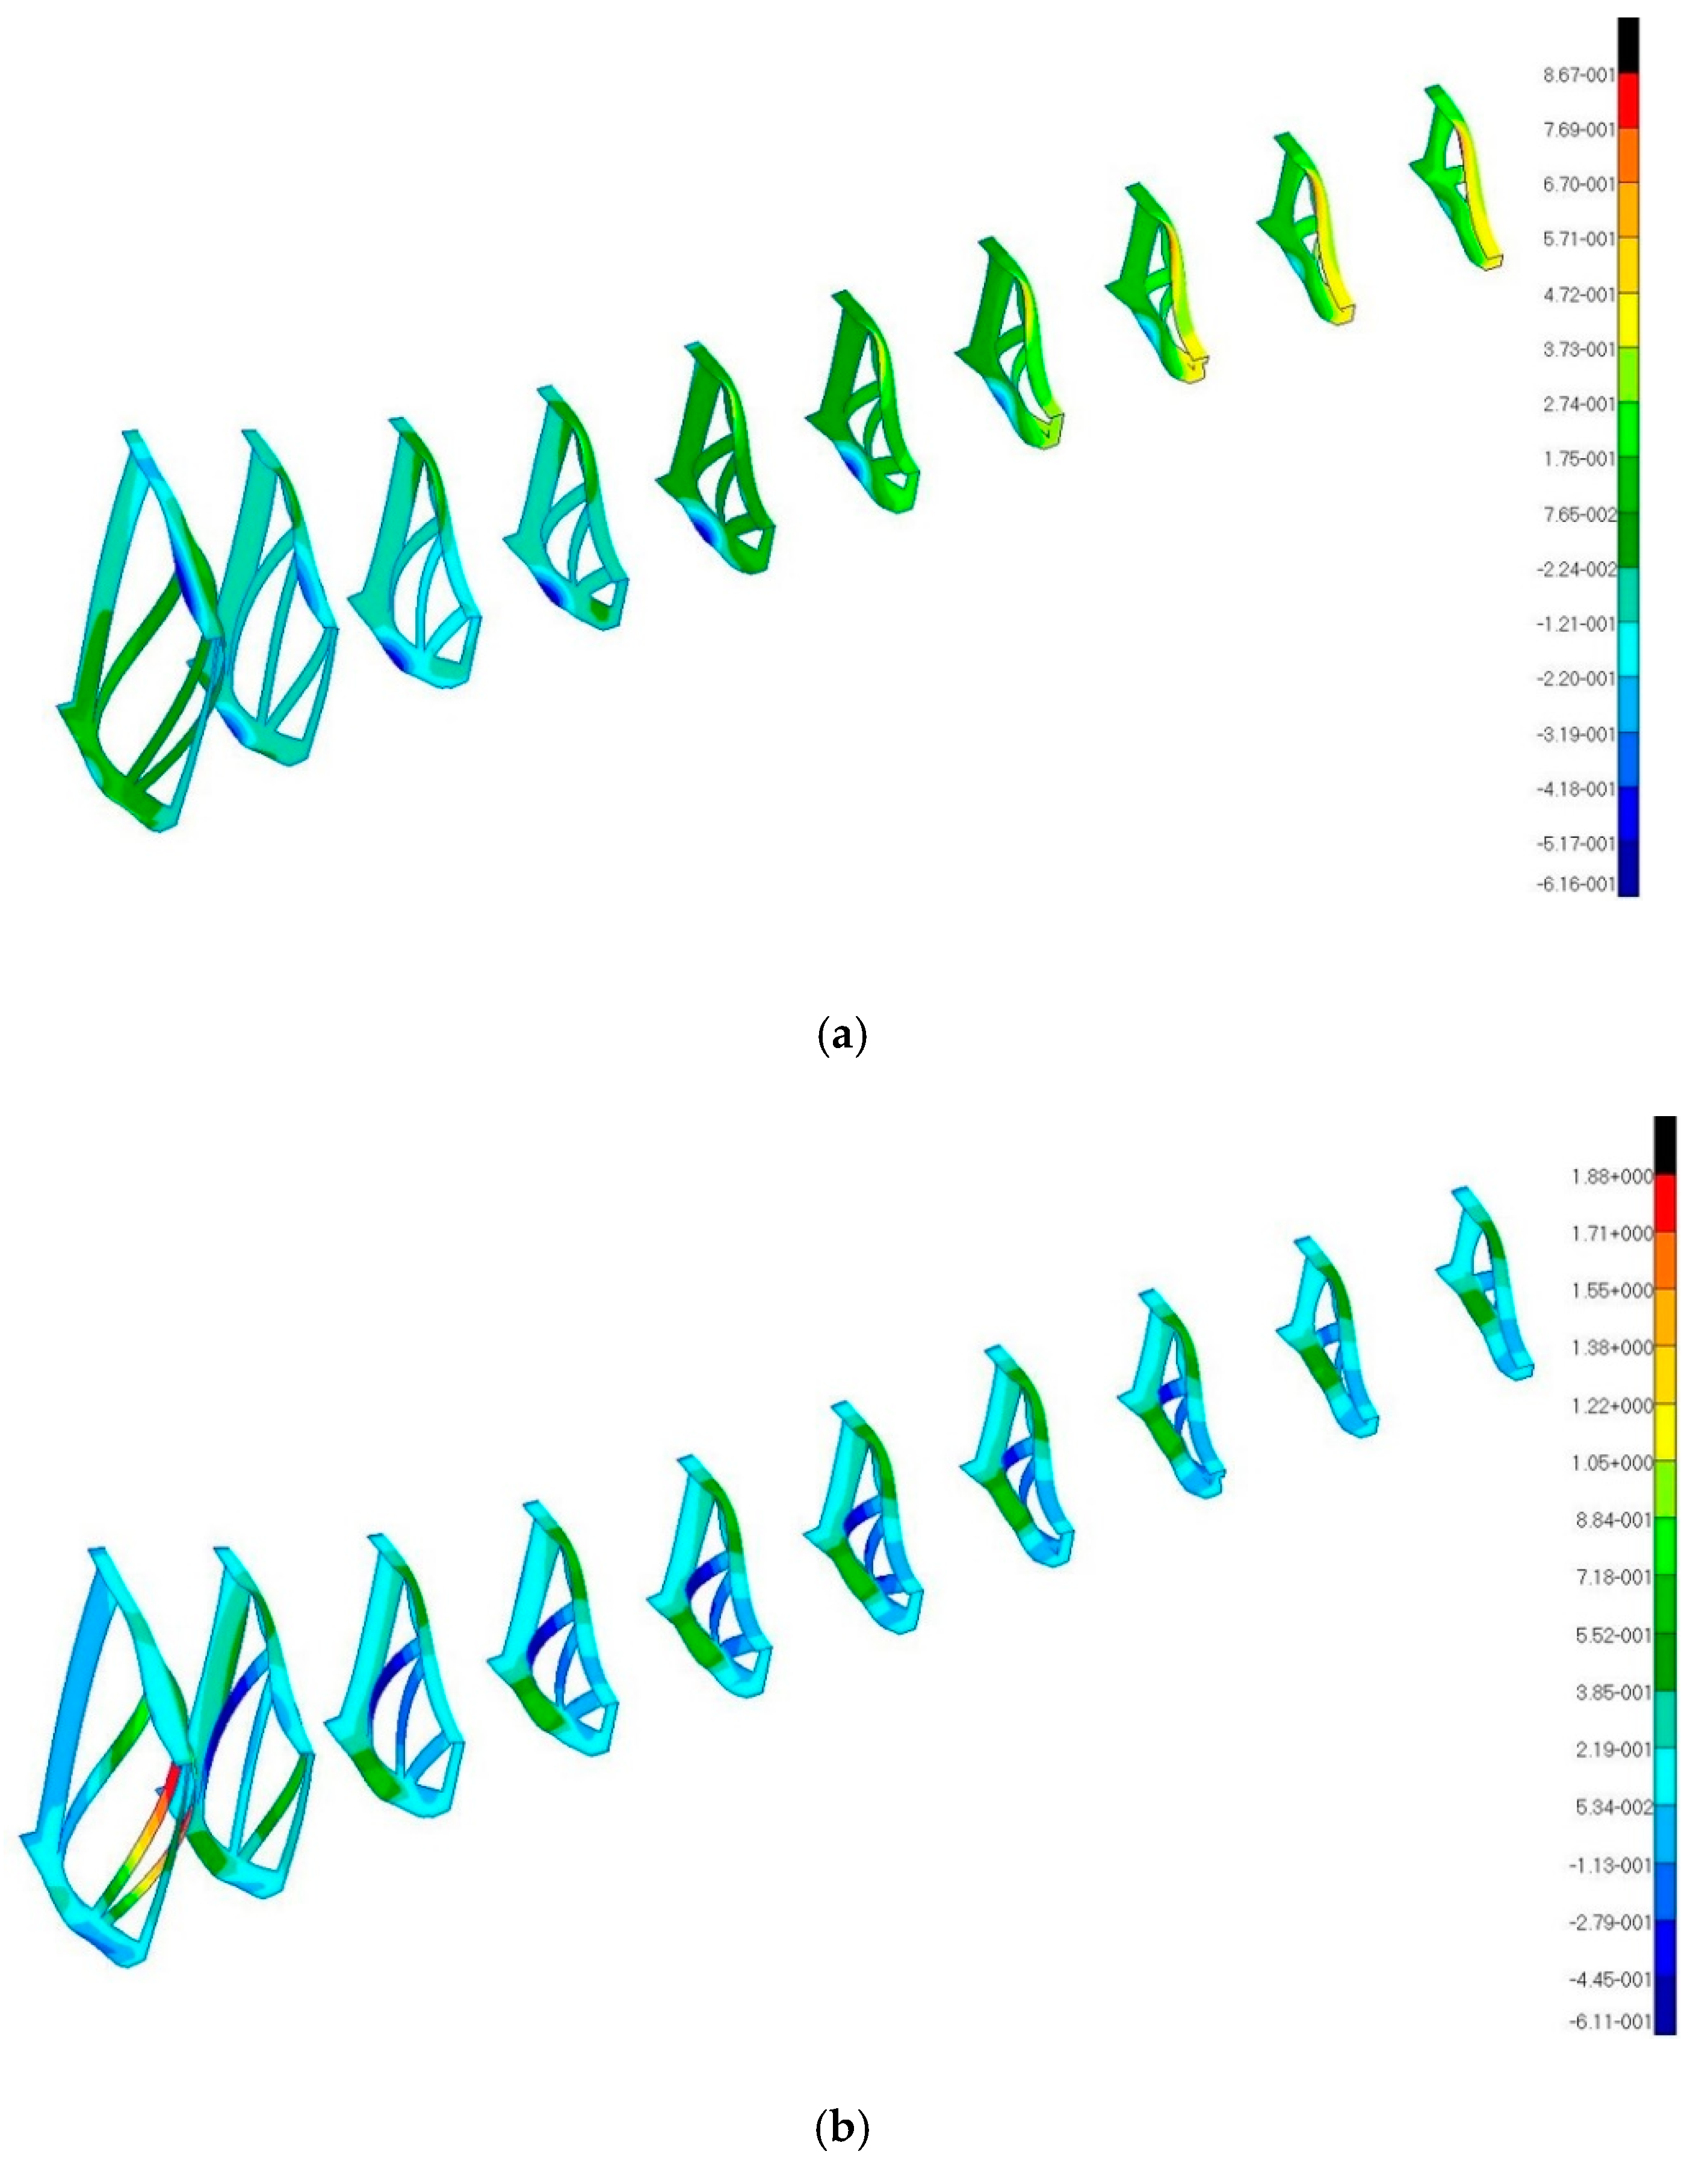
Figure 21.
The rib deflection on the edgewise maximum load: (a) x-direction fringe and (b) z-direction fringe.
Figure 21.
The rib deflection on the edgewise maximum load: (a) x-direction fringe and (b) z-direction fringe.
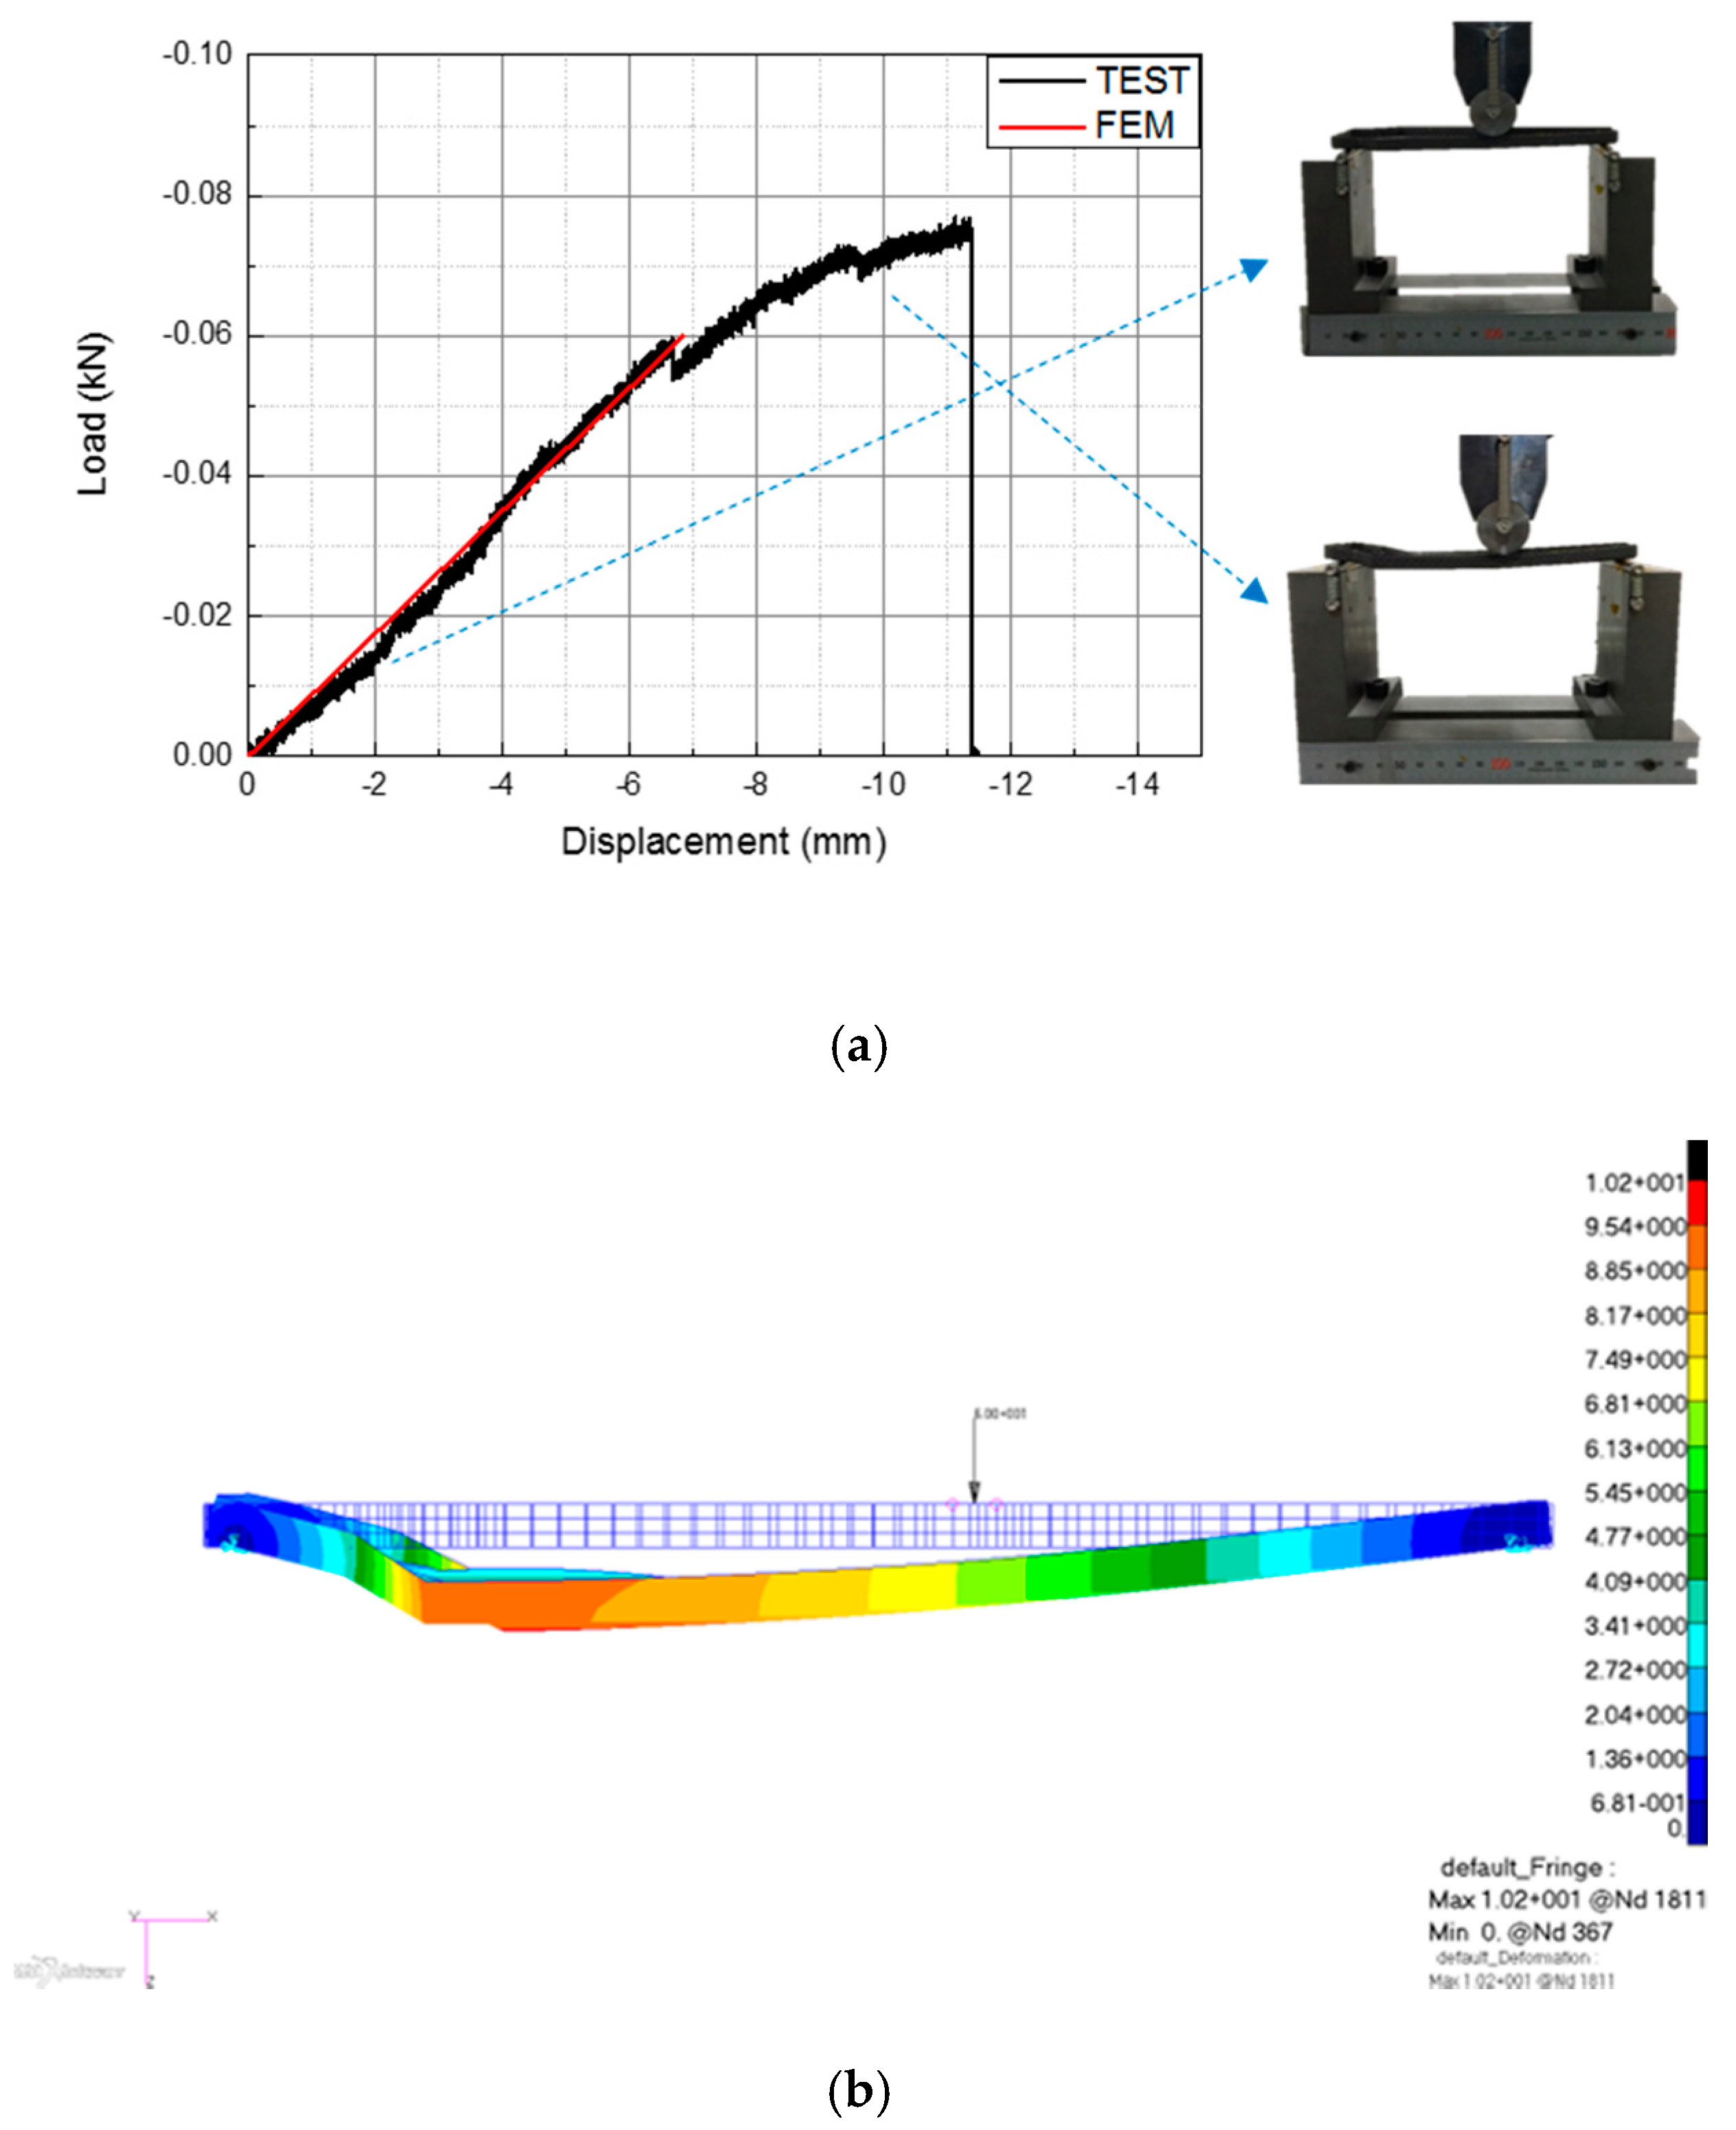
Figure 22.
The rib bending test and analysis results: (a) testing results and (b) numerical results.
Figure 22.
The rib bending test and analysis results: (a) testing results and (b) numerical results.
Table 1.
The components’ mass of the fabric-covered blade.
Table 1.
The components’ mass of the fabric-covered blade.
| Component | C-Spar | Main Spar | Rear Spar | Ribs | Root | Stringer | Adhesive (Estimated) | Total |
|---|
| Mass (kg) | 0.34 | 2.21 | 0.20 | 0.53 | 4.08 | 0.06 | 0.38 | 7.80 |
Table 2.
Design load cases.
Table 2.
Design load cases.
| Design Situation | DLC | Wind Condition |
|---|
| Power production | 1.1 | NTM Vin < Vhub < Vout |
| 1.3 | ETM Vin < Vhub < Vout |
| 1.4 | ECD Vhub = Vr ± 2 m/s |
| 1.5 | EWS Vin < Vhub < Vout |
| Normal shut down | 4.2 | EOG Vhub = Vr ± 2 m/s and Vout |
| Emergency shut down | 5.1 | NTM Vhub = Vr ± 2 m/s and Vout |
| Parked | 6.1 | EWM 50-year recurrence period |
Table 3.
Properties of the carbon composite materials.
Table 3.
Properties of the carbon composite materials.
| LCU250NS | CF3327 |
|---|
| E1 (GPa) | 118.0 | 54.90 |
| E2 (GPa) | 8.3 | 57.95 |
| G12 (GPa) | 3.85 | 3.30 |
| ν12 (-) | 0.33 | 0.065 |
| XT (MPa) | 2005 | 566.8 |
| YT (MPa) | 39 | 579.4 |
| XC (MPa) | 978 | 414.4 |
| YC (MPa) | 162 | 410.8 |
| Shear Strength (MPa) | 85 | 99.1 |
Table 4.
The equipment list for modal testing.
Table 4.
The equipment list for modal testing.
| Equipment | Specification |
|---|
| Acceleration sensor | Uniaxial type |
| Impact hammer | B&K 8206 |
| DAQ system | dSPACE 1103 |
Table 5.
The equipment list for the static structural testing.
Table 5.
The equipment list for the static structural testing.
| Equipment | Specification |
|---|
| Test stand | - |
| Loadcell | DACELL 1 ton |
| Wire displacement sensor | 1.2 m range |
| Winch system | Hydraulic cylinder |
| Loading fixture | - |
| DAQ system | NI PCI-6014 |
Table 6.
The test cases.
| Case | Quantity Description |
|---|
| Case 1 | Flapwise maximum load 1 (loading 2.23 kN at 2.26 m) |
| Case 2 | Flapwise maximum load 2 (loading 3.27 kN at 1.86 m) |
| Case 3 | Flapwise minimum load (loading 0.92 kN at 2.26 m) |
| Case 4 | Edgewise maximum load 1 (loading 0.89 kN at 1.26 m) |
| Case 5 | Edgewise maximum load 2 (loading 1.71 kN at 1.06 m) |
| Case 6 | Edgewise minimum load 1 (loading 0.21 kN at 2.26 m) |
| Case 7 | Edgewise minimum load 2 (loading 0.77 kN at 1.26 m) |
Table 7.
The experimental and numerical modal frequencies.
Table 7.
The experimental and numerical modal frequencies.
| Mode | Experiment (Hz) | Numerical (Hz) | Error (%) | Mode Shape |
|---|
| 1 | 30.52 | 32.77 | 7.37 | first flapwise bending |
| 2 | 39.31 | 39.90 | 1.50 | first edgewise bending |
| 3 | 80.57 | 83.10 | 3.14 | first edgewise bending |
| 4 | 91.31 | 94.73 | 3.75 | second flapwise bending |


