Article

On-Line Partial Discharge Monitoring System for Power Transformers Based on the Simultaneous Detection of High Frequency, Ultra-High Frequency, and Acoustic Emission Signals

1
Institute of Electric Power Engineering, Poznan University of Technology, 60-965 Poznan, Poland
2
Mikronika, 60-001 Poznan, Poland
*
Author to whom correspondence should be addressed.
Energies 2020, 13(12), 3271; https://doi.org/10.3390/en13123271
Submission received: 5 June 2020 / Revised: 17 June 2020 / Accepted: 22 June 2020 / Published: 24 June 2020
(This article belongs to the Special Issue Condition Monitoring and Diagnosis of Electrical Machines)

Abstract

:
The article presents a novel on-line partial discharge (PD) monitoring system for power transformers, whose functioning is based on the simultaneous use of three unconventional methods of PD detection: high-frequency (HF), ultra-high frequency (UHF), and acoustic emission (AE). It is the first monitoring system equipped in an active dielectric window (ADW), which is a combined ultrasonic and electromagnetic PD sensor. The article discusses in detail the process of designing and building individual modules of hardware and software layers of the system, wherein the most attention was paid to the PD sensors, i.e., meandered planar inverted-F antenna (MPIFA), high-frequency current transformer (HFCT), and active dielectric window with ultrasonic transducer, which were optimized for detection of PDs occurring in oil-paper insulation. The prototype of the hybrid monitoring system was first checked on a 330 MVA large power transformer during the induced voltage test with partial discharge measurement (IVPD). Next, it was installed on a 31.5 MVA substation power transformer and integrated according to the standard IEC 61850 with SCADA (Supervisory Control and Data Acquisition) system registering voltage, active power, and oil temperature of the monitored unit. The obtained results showed high sensitivity of the manufactured PD sensors as well as the advantages of the simultaneous use of three techniques of PD detection and the possibility of discharge parameter correlation with other power transformer parameters.

1. Introduction

Power transformers are very important devices of public and industry use, requiring high capital investment. Their reliable operation ensures continuity of electrical energy supply and stability of the power energy system. A serious global problem is a high share of power transformers, for which the designed lifetime (usually estimated at 30–35 years) expired [1,2,3]. However, considering the high cost of purchase, transportation, and insurance as well as very long delivery time (even over a year), power transformers are not, at the moment of expiring their lifetime, immediately replaced with new ones. The majority of distribution companies adopt a management strategy based on the use of the old units as long as it is possible, which unfortunately increases the risk of a catastrophic failure [4]. The report of the CIGRE working group A2.37 indicates that dielectric (partial discharge, tracking, arcing, flashover) and electrical failures (open circuit, short circuit, poor joint/contact, ground deterioration, floating potential) were nearly half (49.3%) the cause of the serious damages of power transformers in Europe [1]. The dynamics of the defect development caused by the activity of partial discharges depends on a variety of factors, including the type of the discharge itself and its energy, location of the defect, degree of aging and moisture content of the insulation system, varying load affecting the oil temperature changes as well as moisture migration process. In some cases, the defect may develop over many years of power transformer operation not leading it to damage. In other cases, the defect may develop extremely rapidly, mostly as a consequence of a random event, such as overvoltage or a sudden increase in oil temperature caused by overloading of a unit or malfunction of the cooling system [1,5,6,7]. Very often the dynamics of the defect development grow in its final stage, shortly before the damage itself [8]. For that reason, currently, the monitoring online systems have gained popularity, since they have the advantage over periodic tests allowing for instant detection of sudden growth of partial discharges activity [9,10,11,12,13]. Additionally, in combination with the SCADA (supervisory control and data acquisition) system, which is installed on the majority of substations, they allow to find the correlation between PD intensity and power transformer parameters, e.g., voltage or oil temperature [14,15]. It increases the credibility of insulation system condition assessment and enables the introduction of current limitations of power transformer exploitation, assuming that its condition is not critical, and it does not require an immediate shutdown.
At present, the acoustic emission method (AE), electromagnetic methods (high-frequency (HF), very-high frequency (VHF), and ultra-high frequency (UHF)), and dissolved gas analysis (DGA) are some of the most important PD detection methods adjusted to operating in online monitoring mode [16,17,18,19,20,21,22,23,24,25]. The last technique is indirect and because of its limitations, such as long time intervals between successive measurements, the sensitivity depending on the dimensions of transformer tank and distance of the gas sensor from the PD source as well as complex and non-standardized methods of DGA results interpretation, it is not capable to detect very quickly developing defects. The acoustic emission method and electromagnetic methods have both strengths and weaknesses, therefore none of them may be recognized as more efficient or universal. For this reason, in the context of power transformers diagnostics, the possibility of elaborating a hybrid system combining at least two measurement methods is suggested more and more often. The main advantage of such a system application is increase in PD detection reliability. This is because the individual methods are based on different physical phenomena (detection of electromagnetic and acoustic waves) and different coupling methods (inductive, capacitive, or acoustic), therefore each of them is sensitive to another type of disturbance. For instance, in the AE method, an ultrasonic transducer may register core magnetostriction noise (Barkhausen effect), pumped oil and fans noise, environmental noises (thunderstorms, rain, hail, etc.), tap changer operation, and other random signals [26]. In the high-frequency method, sensor HFCT is installed outside the transformer tank, therefore, it may register external electromagnetic interferences (EMI) occurring on the substation, such as corona discharge from HV transmission lines and signals accompanying switching operations. In turn, in the UHF method, the antenna may receive a radio signal emitted by FM radio stations, aerial navigation systems, civilian and military aviation, transmitters of civil services, DVB-T digital television, and GSM operators [27]. Therefore, when a hybrid monitoring system, e.g., registers numerous UHF pulses and none of AE signals, it may be assumed that the source of the signal is external EMI. In turn, when the system registers pulses simultaneously by all methods and the fluctuations of their intensity are similar, then with high probability one may assume that they are generated by partial discharges. As it was mentioned before, the credibility of the diagnosis may be increased by finding a correlation between PD parameters and power transformer parameters registered by the SCADA system. Those parameters that may affect the partial discharge occurrence are voltage and oil temperature levels.
Other researchers also point to the benefits of combining two PD detection methods. Cavallini et al. [28] believe that a combination of AE and UHF sensors can be successfully used as a tool to highlight the presence of PD phenomena and can be used conveniently for monitoring and trending. Similar conclusions were formulated by Witos and Gacek [29], who indicated that simultaneous registration of PDs by two diagnostic techniques gives the possibility to elaborate new PD descriptors, which increase the efficiency of defects recognition. Fuangsoongnern et al. [30] proved that a combination of the AE and HF methods allows eliminating the diagnostic errors and simultaneously indicate if the problem is caused by partial discharge, mechanical faults, arcing, or loose parts inside the transformer. Combining PD detection methods allows obtaining of additional monitoring system functionalities. For instance, simultaneous registration of UHF and AE improves the accuracy of PD sources localization with trilateration technique [31,32,33].
The presented in the article novel on-line partial discharge (PD) monitoring system is based on simultaneous UHF, HF, and AE signal registration. It is a world first system equipped in active dielectric windows, which are a new concept of combined acoustic emission and electromagnetic partial discharge detector for power transformers. Each elaborated prototype PD detector, i.e., meandered planar inverted-F antenna, active dielectric window with built-in ultrasonic transducer as well as high-frequency current transformer (HFCT) were specially optimized to the detection of the partial discharges occurring in oil-paper insulation. Thanks to the implementation of new PD sensor concepts, a significant improvement in sensitivity was achieved for individual partial discharge detection methods. The article shows that the combination of different methods—in this case, electromagnetic and acoustic—increases the reliability of partial discharge detection.
The paper is structured as follows: the assumptions and structure of the hybrid monitoring system as well as the process of designing and PD detectors testing are presented in Section 2. The results of the prototype system evaluation conducted on a new 330 MVA large power transformer during the induced voltage test, and on the exploited 31.5 MVA power transformer are discussed in detail in Section 3. General conclusions and further plans linked to the development of the produced system are included in Section 4.

2. Design and Implementation of On-Line PD Monitoring System

2.1. General Structure of On-Line PD Monitoring System

In Figure 1, the schematic diagram of the general structure of the developed on-line partial discharges monitoring system is shown, whose unique feature is the possibility of simultaneous registration of PD pulses with the use of three different diagnostic techniques, i.e., high-frequency, ultra-high frequency, and acoustic emission.
High-frequency current transformer (labeled in the system as sensor ISO-002-HF) and active dielectric windows (ADW) with built-in acoustic emission sensor and mounted UHF antenna (the set was labeled as sensor ISO-002-ADW/UHF) were employed as PD detectors. Each PD detector has an additional housing, in which there is a signal conditioning module and analog-to-digital (A/D) signal processing module. A module for fiber-optic signal transmission was included as well. This type of transmission allows to minimize the influence of external EMI occurring on substations. The transmitted digital data is received by the multi-channel data concentrator labeled as MPD-001. It is a specialized modular device, prepared for operation in a substation environment, equipped with multi-port network communication cards. It performs the initial integration of data frames received from many PD sensors into a form that facilitates their transmission to the server and performing more advanced calculations (e.g., phased-resolved partial discharge patterns or data trend analysis).
The process of designing and producing PD sensors and main elements of the monitoring system, i.e., module for conditioning and digital processing of PD pulses, data concentrator, and modules of server software are discussed in detail later in the article.

2.2. Partial Discharge Detectors

2.2.1. Active Dielectric Window

The active dielectric window (ADW), installed in the revision hole of the power transformer, was elaborated for the detection of AE and UHF pulses generated by partial discharges. The previously conducted research demonstrated that ADW assures over five-times higher AE pulses detection sensitivity compared to commonly used contact transducer type PAC R15 [33]. It results from the fact that ADW is placed inside the power transformer tank and registers acoustic signal propagating directly in oil, whereas a conventional AE sensor is mounted on the outer wall of the tank. For that reason, it only registers a small part of the acoustic wave energy generated by partial discharge. The remaining energy is lost in the result of the processes of the acoustic wave reflection and absorption by the steel wall of the transformer tank.
The active dielectric window consists of a specially formed bowl-shaped ceramic element, in which all ultrasonic transducer components were built-in, i.e., piezoelectric crystal with electrodes and electric wires as well as matching and backing layer (Figure 2). The bowl-shape of the ADW enables mounting-in of the UHF antenna and detection of radio signals generated by PDs.
The dielectric window was produced from high-density alumina ceramics, which is characterized by high thermal, mechanical, and chemical resistance (it does not oxidize and does not react with mineral oils and esters). The main parameters of the used ceramic material are listed in Table 1.
Regarding the specific environment of the ultrasonic transducer operation, which is mineral oil, the matching layer is a very important element. Its proper manufacturing assures high transducer sensitivity. So that the acoustic energy transmission from mineral oil to piezoelectric crystal could be carried out lossless (without reflections), the acoustic impedance of the matching layer should be the geometric mean of the mineral oil impedance (Zoil = 1.28 MRayl at 25 °C) and used piezoelectric ceramics type PZT-5A (ZPZT = 31 MRayl). The matching layer was made of epoxy/alumina composite with 0.3825 volume fraction of alumina, which allowed for obtaining the required value of acoustic impedance i.e., 6.3 MRayl. For the preparation of the composite, the epoxy resin of low viscosity (200 mPa·s at 25 °C) and high purity alumina powder with a grain thickness of 1 µm was used. The backing layer was made of composite material as well. In this case, epoxy/tungsten composite with 0.08 volume fraction of tungsten of acoustic impedance 4.56 MRayl was used. The optimal values of acoustic impedance and geometric dimensions of all components of the ultrasonic transducer (PZT crystal, matching, and backing layer), which affect the shape of the frequency response curve were designed based on the simulations performed with the model of Krimholtz, Leedom, and Matthaei (KLM) [34]. In turn, proper proportions of epoxy, alumina, and tungsten for the elaborated composite materials were selected using the Devaney and Levine model, which is based on a self-consistent formulation of multiple-scattering theory [35]. In the final effect, the transducer with relatively flat frequency response in the range between 120 and 270 kHz and with first resonance frequency totaling 134 kHz was elaborated. The transducer frequency parameters are a compromise between high PD detection sensitivity and the resistance to core magnetostriction noise. The remaining parameters of the elaborated ultrasonic transducer are listed in Table 2, whereas detailed information on the design, modeling, and production processes were discussed in [33]. Figure 3 presents a photograph of the front and back sides of the active dielectric window with visible components of the built-in ultrasonic transducer.

2.2.2. Ultra-High Frequency Antenna

In the power transformers, the registration of the radio signals in the VHF/UHF band generated by the partial discharges is carried out with the use of antennas mounted in special dielectric windows [36,37] or antennas put in the tank interior through oil valves [38,39]. There are also new solutions known, in which, antennas are placed outside the tank and detect the leakage of electromagnetic waves through the gap (insulation gasket between the upper or lower ladle cover and the main tank) [40] or bushing taps [41]. Antennas placed in the dielectric windows usually allow to obtain the highest sensitivity in PD detection. The obstacle in the global popularization of this solution is the fact that the new power transformers are still very rarely equipped with dielectric windows. The factory installation of the interior UHF antennas takes place exclusively on demand of the purchaser. Additionally, the exchange of the revision hatches in the transformer being exploited to mount dielectric windows and antennas is an expensive, time-consuming, and complicated operation, both regarding technical and logistic issues. Unfortunately, the remaining solutions, i.e., antennas placed in the tank interior through oil valves and external antennas, regarding numerous limitations are not a valuable alternative [39]. The first ones are simple monopole antennas of weak amplification and a very narrow transmission band. Additionally, the shielding effect of the oil drain valve and unfavorable placement inside the tank (usually it is a sidewall of the tank, near the bottom), have a negative impact of their efficiency, because they may hamper the registration of the radio signals generated by PDs [42]. In turn, the external antennas are vulnerable to the influence of external electromagnetic disturbances, mainly corona from HV transmission lines. A significant problem is also the fact that the signal registered by the antenna may have very low energy because of the EM wave attenuation on the way from the PD source to the antenna [40]. To minimize the problem, it is necessary to apply advanced algorithms of signals denoising, filtration, and recognition. It is worth mentioning that only a small part of the useful signal gets out through gaps (if they are present in the given tank construction at all) and bushing insulators—outside the transformer tank. Having considered all advantages and disadvantages of the available methods of UHF signals registration, finally, it was decided that for the needs of the monitoring system the antenna adjusted to installation in the dielectric window would be elaborated. High EM signals detection sensitivity, which directly translates into high effectiveness of the PD monitoring system operation, determined its choice.
In the work of [21] the complex review of antennas applied for PD detection in the VHF/UHF band was presented. Among the commercial solutions, circular plate antenna (also called UHF disk sensor) prevails, since it has a simple construction and because it may be easily adjusted to the dimensions of the dielectric window, which usually is round-shaped. A disadvantage of this construction is a narrow bandwidth and the possibility to regulate the resonant frequency practically only by changing the diameter d of the circular plate (d = λ/4 where λ is the wavelength). Therefore, in many research centers, the works on the elaboration of the antenna not only of compact dimensions but also of high gain and wide bandwidth, which covers the frequency band of the EM signals generated by PD in oil-paper insulation system are carried out. Among the most common wideband antenna constructions proposed by researchers, dedicated to PD detection are meander-line antenna [43], logarithmic spiral antenna [44], different types of Archimedean spiral antennas [45,46], Vivaldi antenna [47], microstrip patch antennas [48,49,50], bio-inspired antennas [51,52], and fractal antennas such as Hilbert curve fractal antenna [53,54], H-fractal antenna [55], Peano fractal antenna [56], or Minkowski fractal antenna [57].
From the viewpoint of efficient PD detection in a power transformer, the key antenna parameter is properly adjusted bandwidth. The research results presented in [58] showed that PDs in oil-immersed power transformers generate EM pulses of frequencies from 150 to 700 MHz, wherein most of their energy was transmitted in a band of lower frequencies (up to 400 MHz). In turn, in [59] the authors registered EM signals simultaneously with the use of three ultra-wideband antennas, which jointly covered a wide measurement band from 20 MHz up to 18 GHz. The research results showed that the main PD types in paper-oil insulation (PD in oil, PD in gas bubbles in oil, inter-turn discharges, surface discharges and creeping sparks on pressboard) generate EM pulses, for which the majority of the energy is transmitted in the band from 250 to 390 MHz. For that reason, it was decided that the designed antenna would be optimized to operate in this band.
In search of the most efficient and scalable antenna design, the authors tested different constructions of wideband antennas, among others logarithmic spiral antenna, circular-cross antenna, H-fractal antenna, Hilbert curve fractal antenna, and broadband planar inverted-F antenna (PIFA) [53,55]. The results of tests and simulations showed that the highest performance and possibility of relatively easy bandwidth regulation is offered by the modified constructions of a conventional PIFA. It is currently the most popular antenna in the world applied in mobile devices [60,61,62]. This is due to its numerous advantages such as compact size compared to monopole antenna, high gain in both vertical and horizontal states of polarization, close to omnidirectional radiation pattern, and low manufacturing cost. 
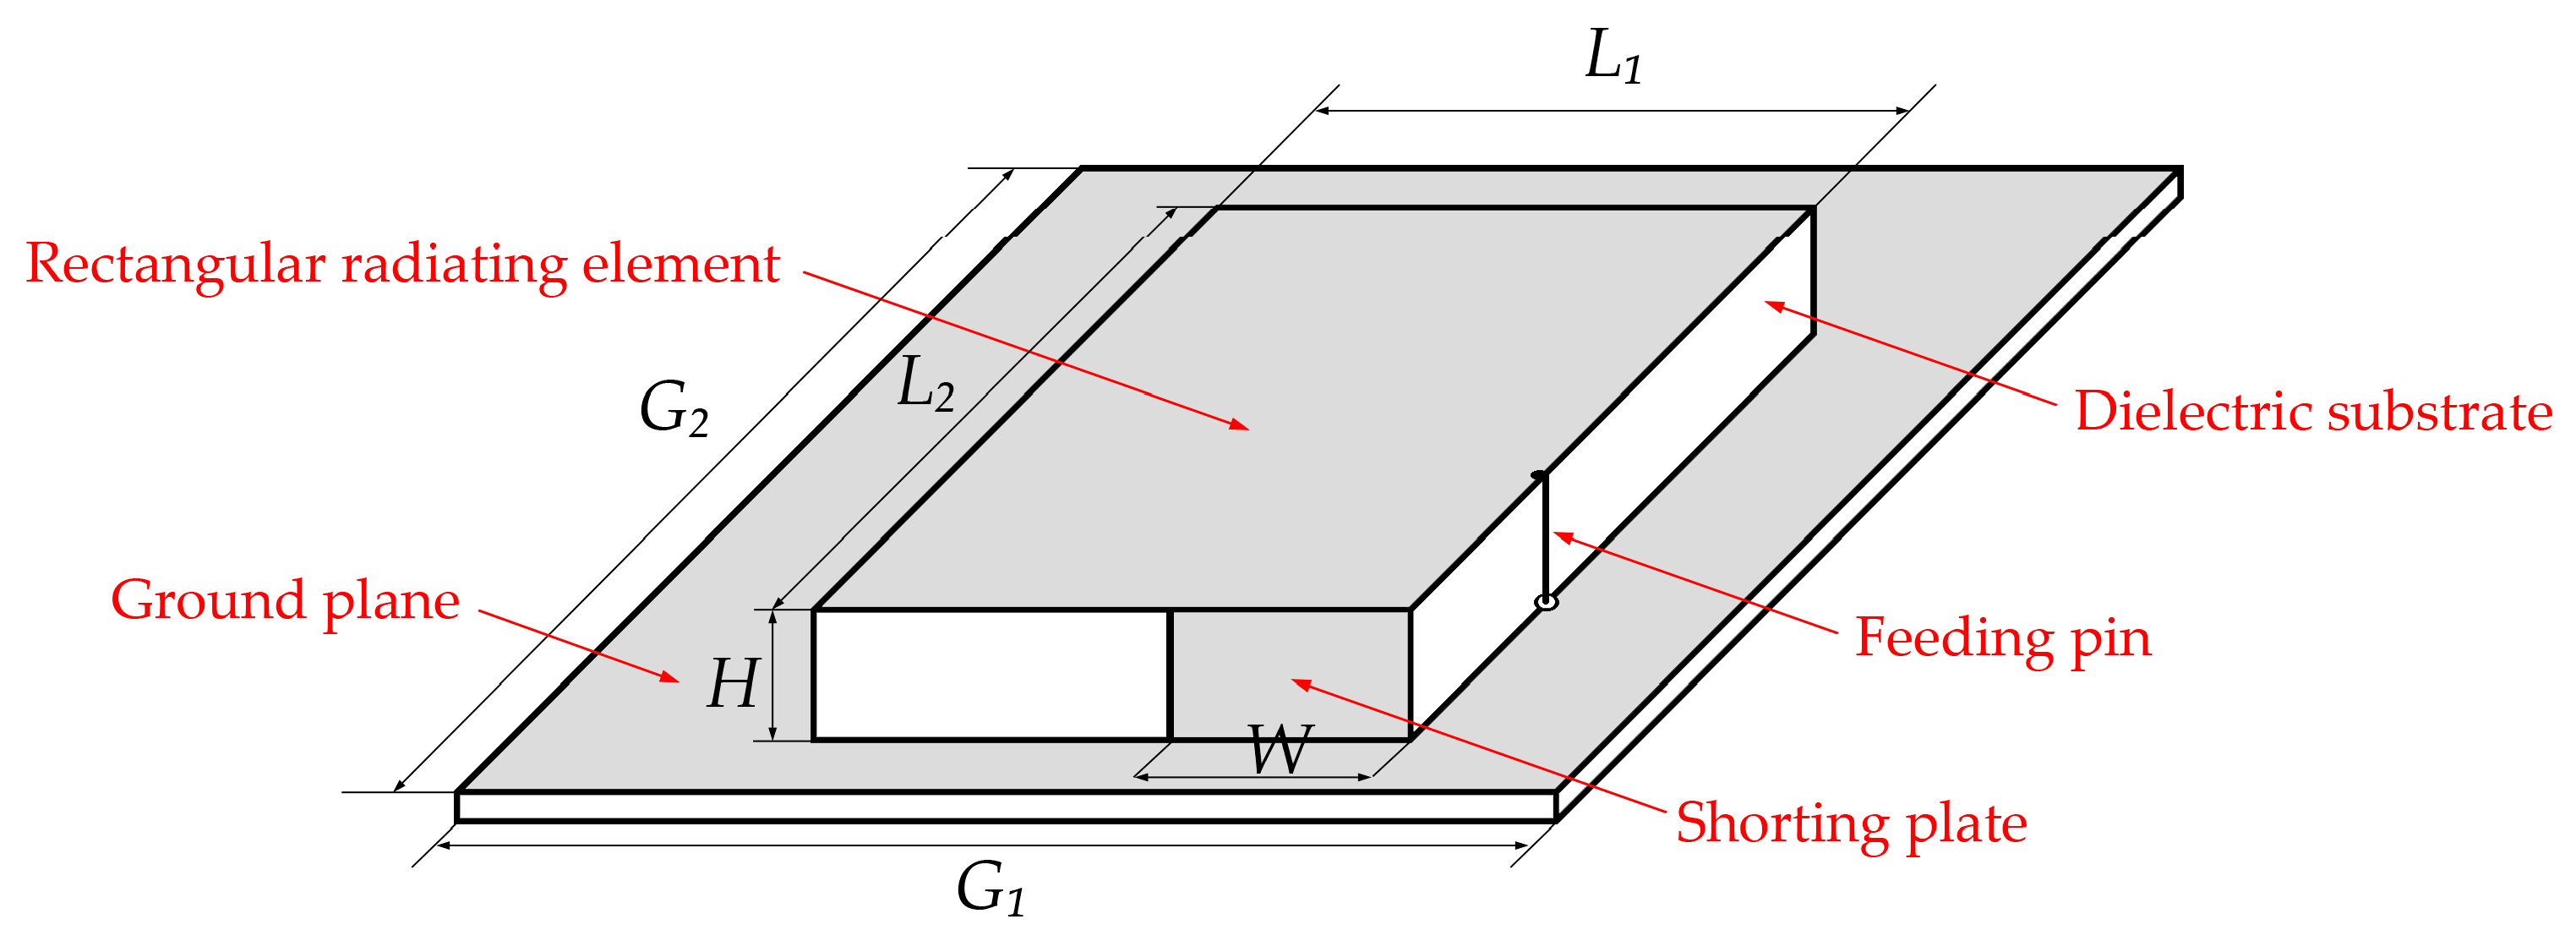
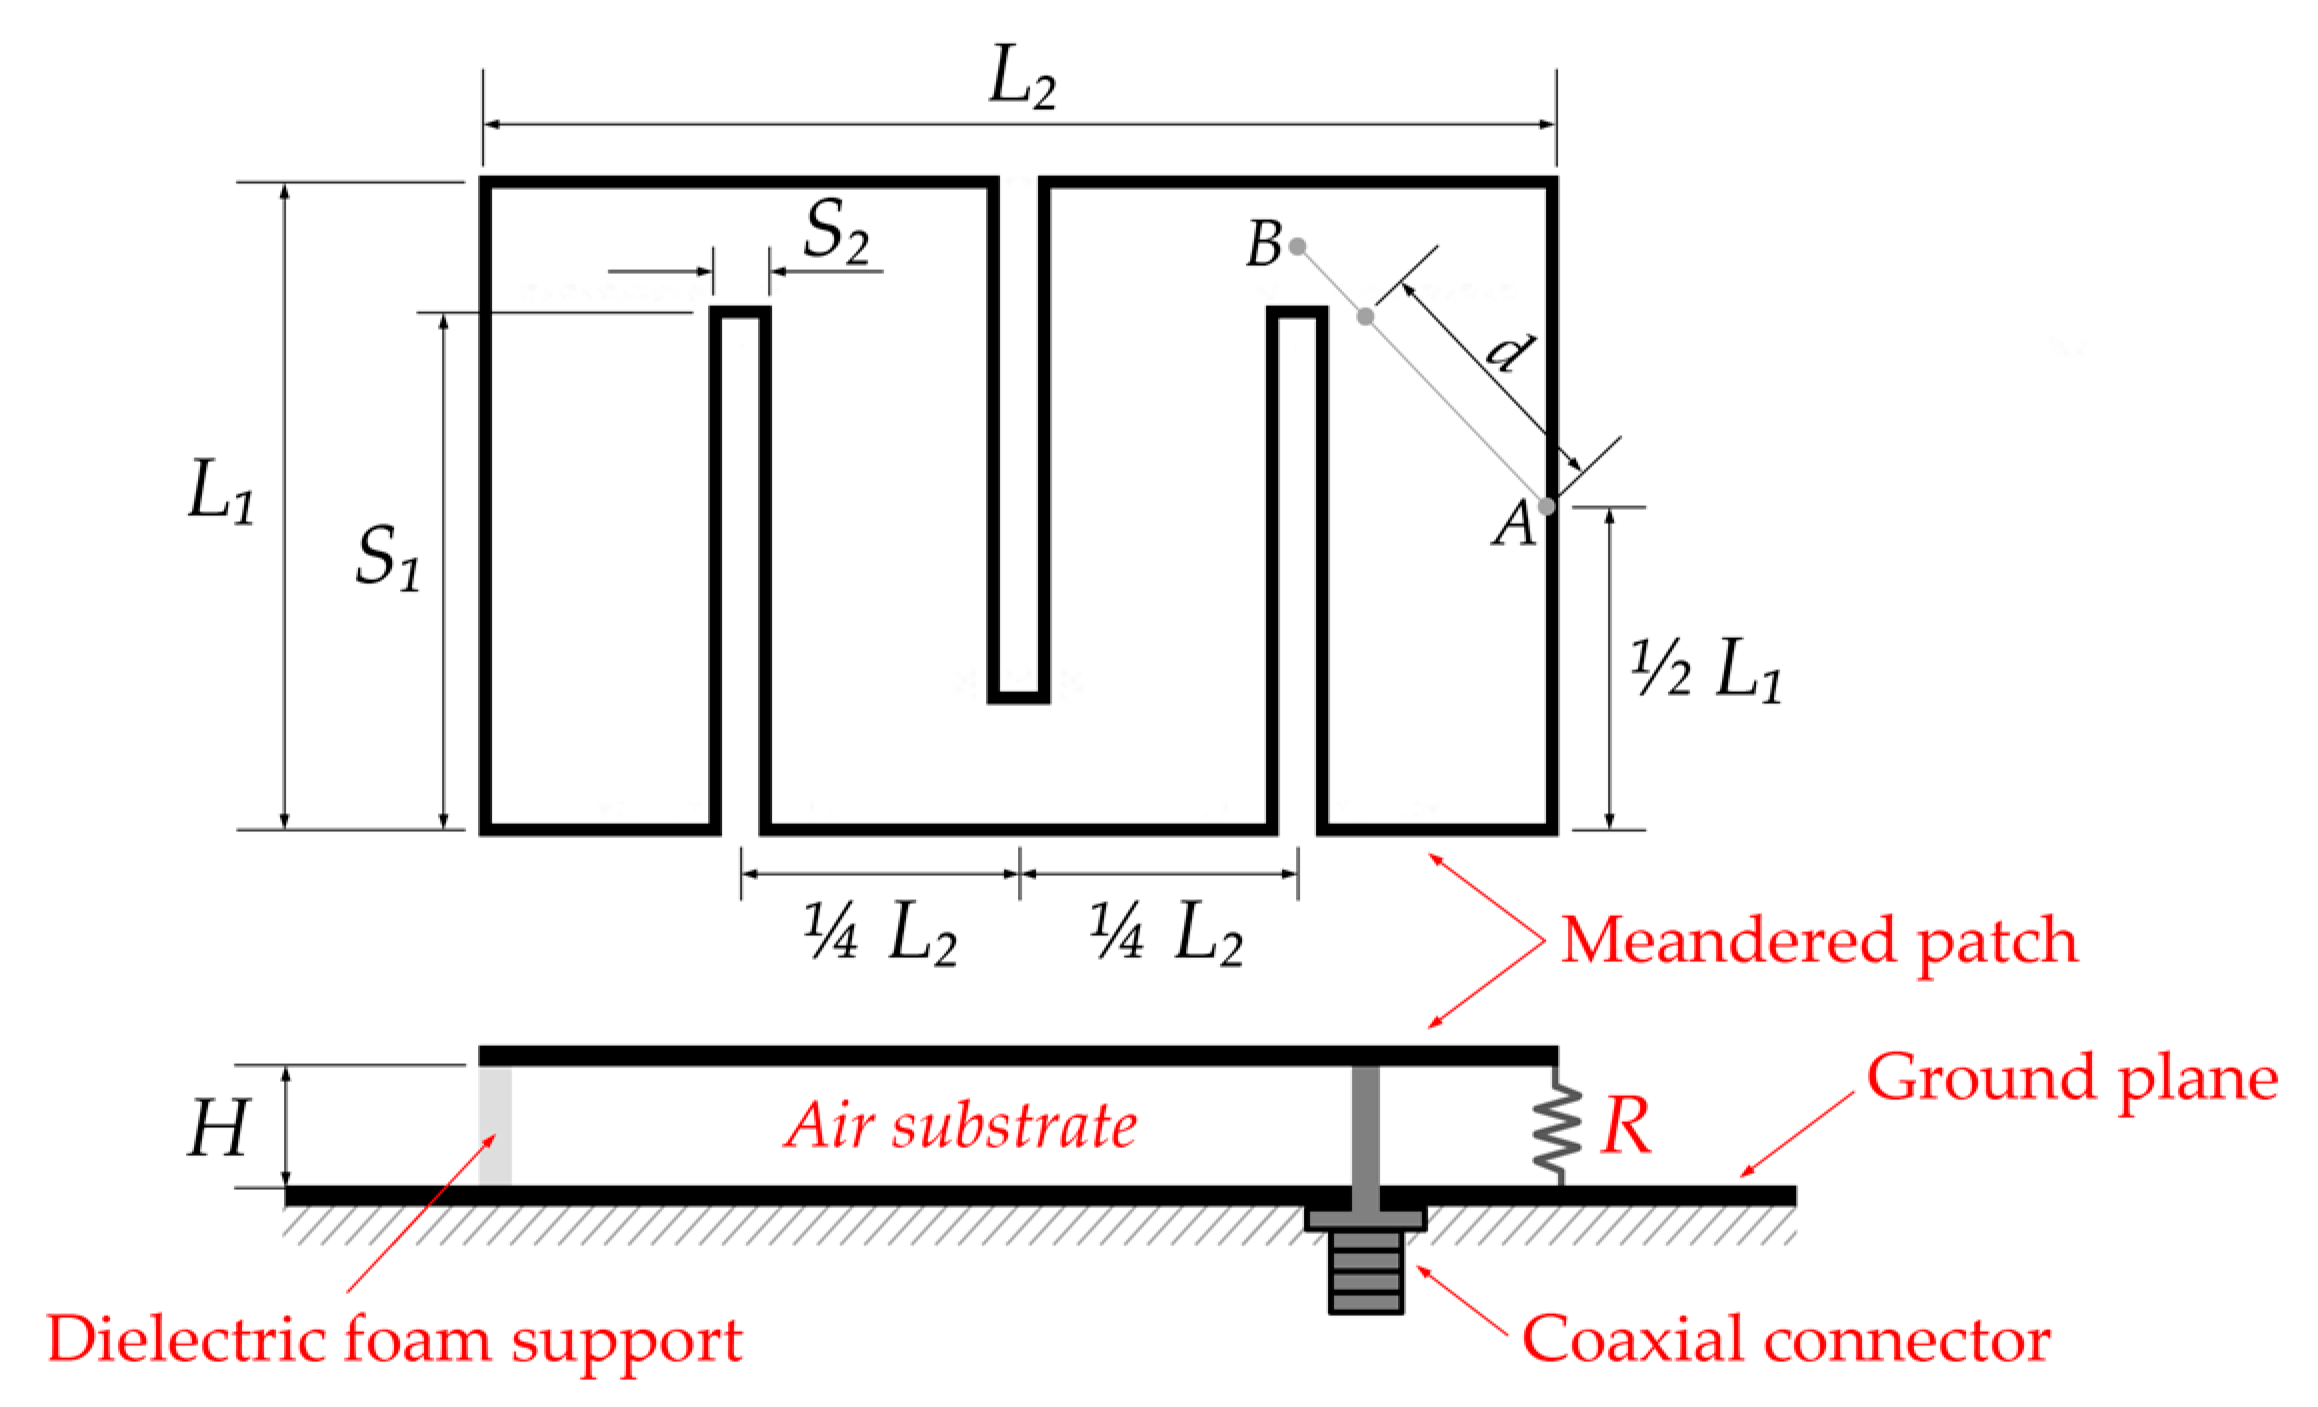
Figure 4 presents a schematic diagram of the conventional PIFA, which consists of a ground plane, a rectangular radiating element of length equal to the quarter-wave, feeding pin and shorting plate (or pin) to connect the ground plane with the top patch.
Resonant frequency fr of conventional PIFA may be approximately estimated with the use of Equation (1), in which c is the speed of light in vacuum, εeff is the effective permittivity of the dielectric substrate, L1 and L2 are the width and length of the rectangular radiating element, H is the thickness of the substrate, and W is the width of shorting plate, assuming that L1 > W > 0 [63,64]. In order to more accurately estimate the resonant frequency of PIFA, some authors propose more complex formulas [65].
f r = c 4 ε eff ( L 1 + L 2 + H - W )
The major limitation of standard PIFA is the narrow bandwidth. Simple methods for widening the bandwidth of PIFA are based on reducing the size of the ground plane and the use of a substrate with the low value of dielectric constant [64]. Another technique is the employment of specially designed slits in front patch [66,67,68,69,70], ground plane [71], or in both these structures [72,73,74]. A more advanced method of bandwidth widening is based on the use of stacked patches, often also equipped in slits [75,76,77,78,79]. Other tuning techniques are based on varying the position of feeding pin, changing the capacitance value of the shorting plate, or changing the widths of feed and shorting plates [80,81]. By applying a properly selected chip resistor or chip capacitor load in place of the shorting plate one may reduce the resonant frequency of the antenna [82].
For the needs of the monitoring system, it was decided to apply PIFA construction with the meandered radiating structure loaded with chip resistor [83]. Meandering the radiating patch allows to reduce the dimensions of the conventional PIFA and obtain large gain [84,85,86,87,88]. In turn, applying the chip resistor causes not only lowering of the resonant frequency but also widens the bandwidth (even several times compared to standard PIFA) [83]. A schematic diagram of a meandered PIFA is presented in Figure 5.
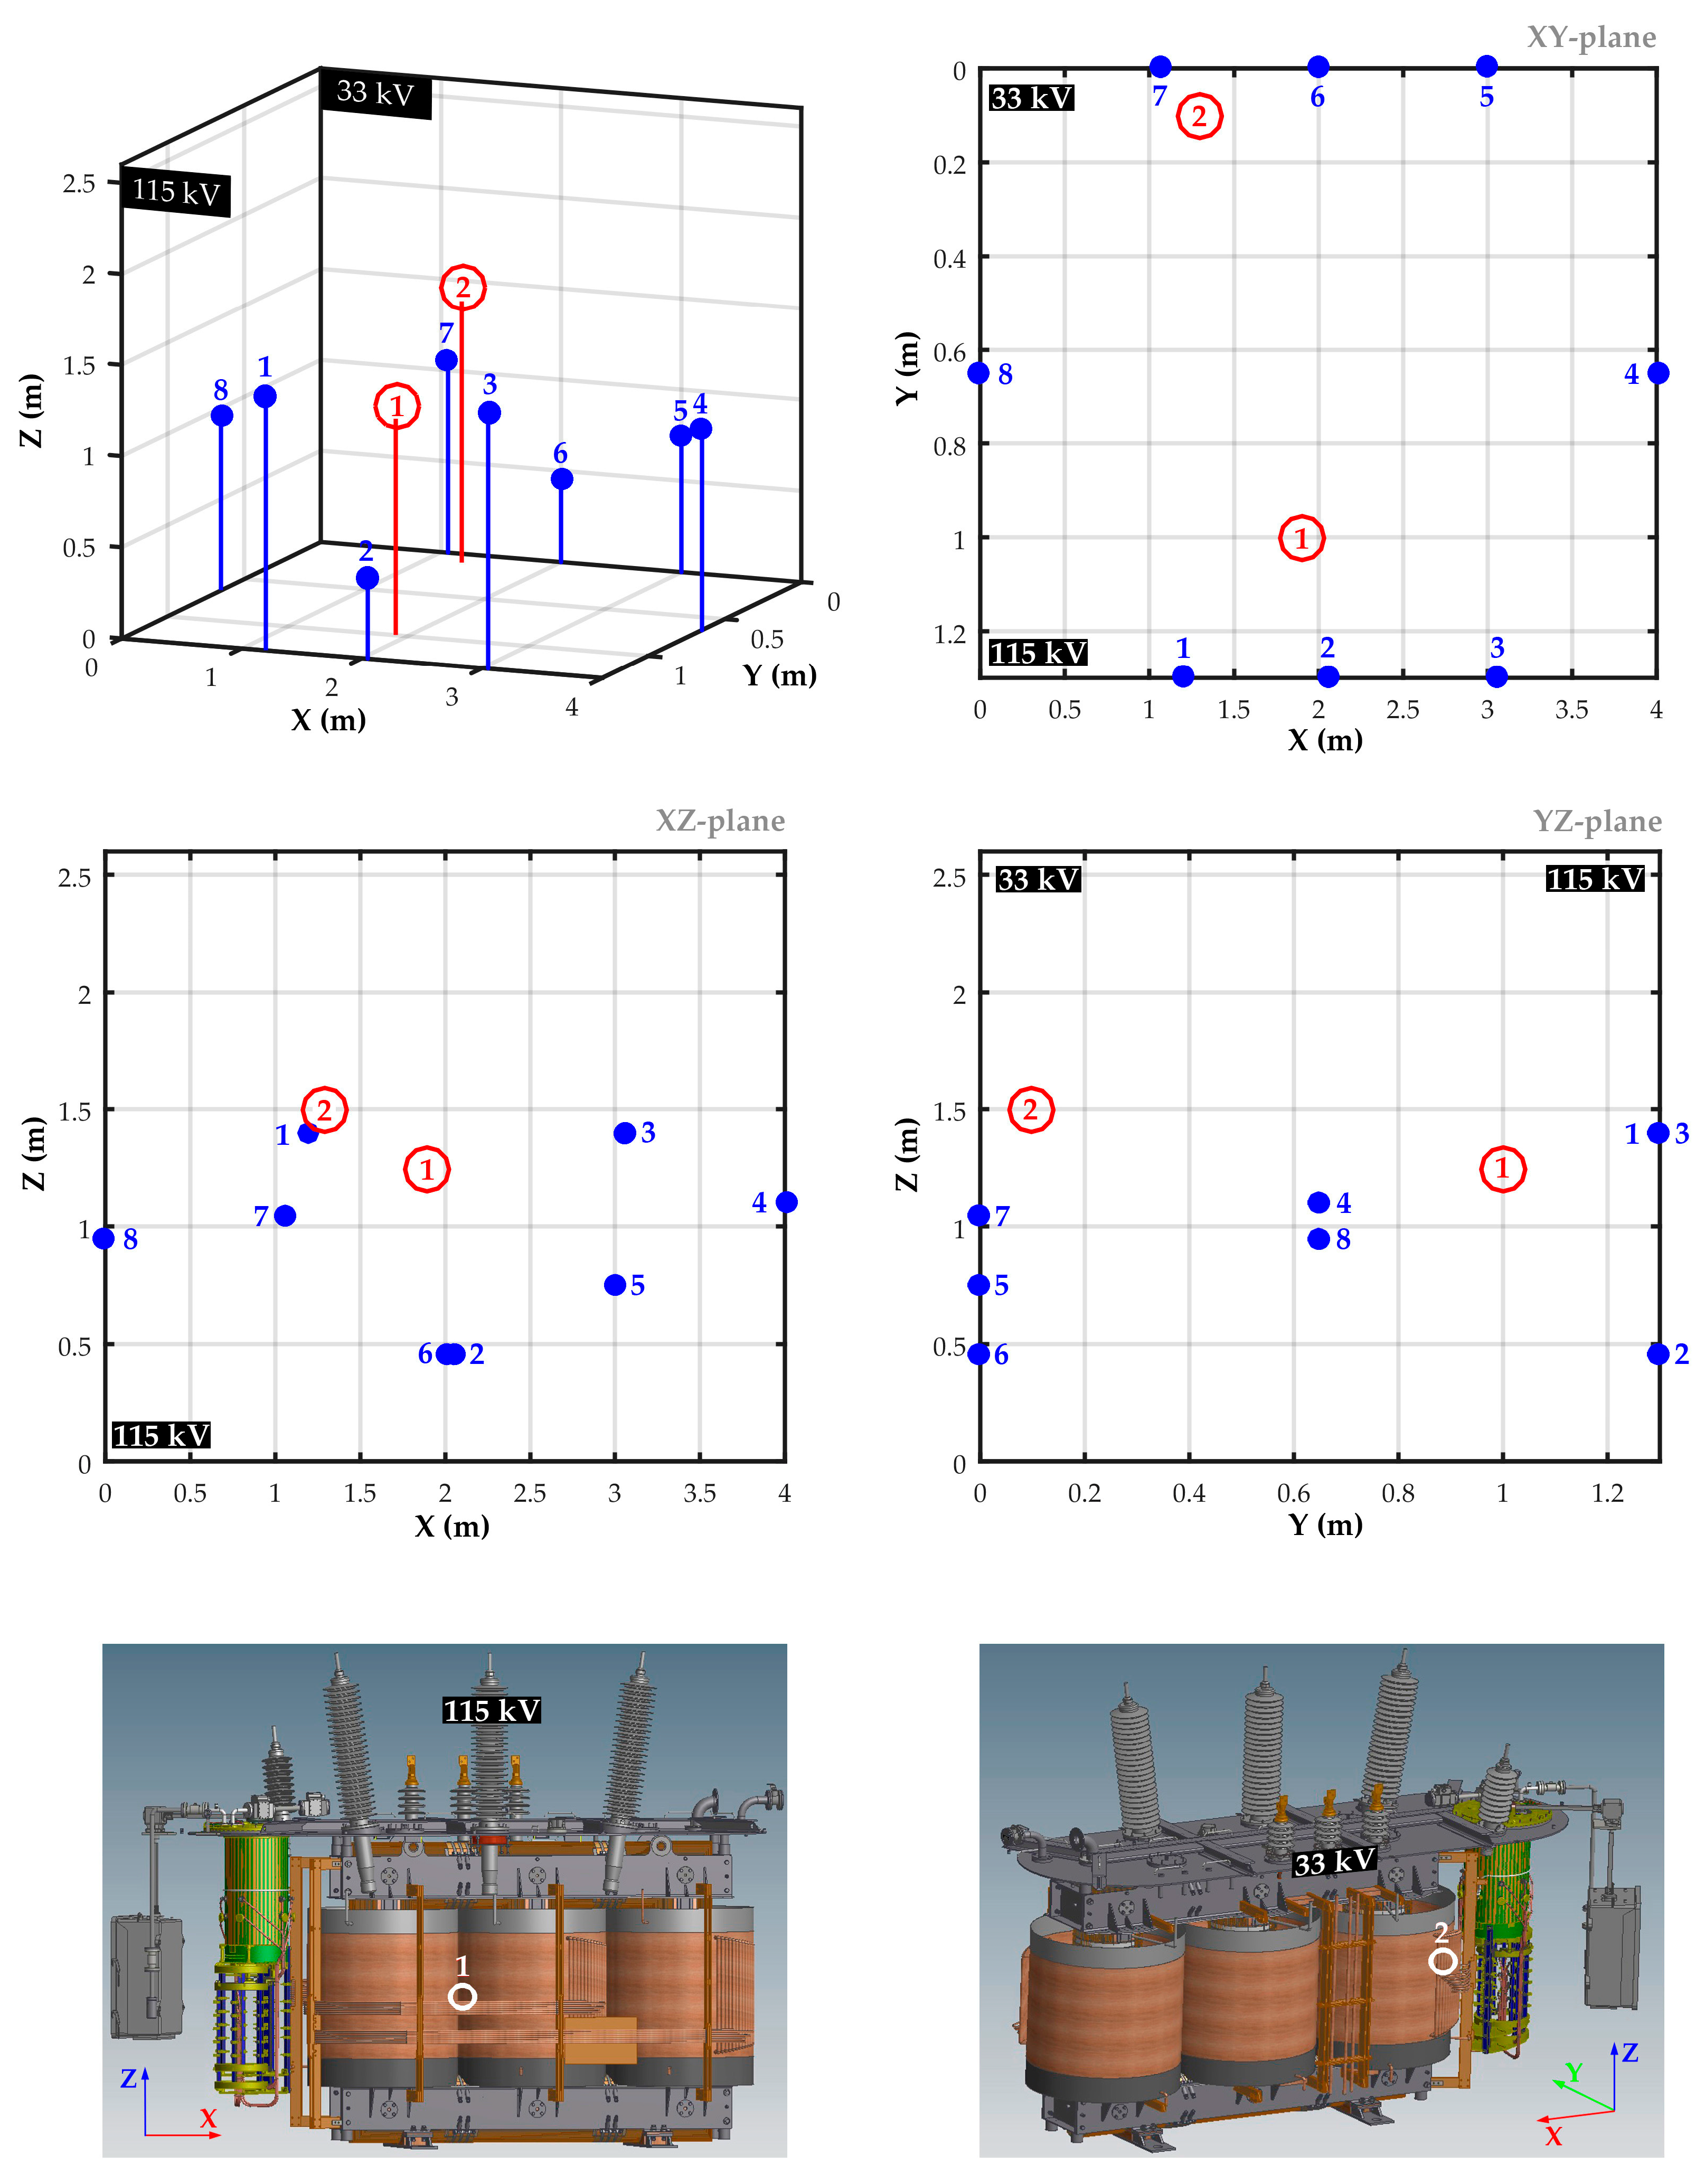
In the initial stage of designing, the necessity to adjust the antenna to the dielectric window dimensions was taken into account (Figure 2) of internal diameter equal to 15 cm and the need to equip the antenna in a protective housing. Since the gain of PIFA increases as the ground plane size increases [89], it was assumed that the largest possible diameter equaled 14 cm. The remaining dimensions of the prototype meandered PIFA (Table 3) were optimized through iterative simulations performed in CST Microwave Studio 2016 (Dassault Systèmes SE, Vélizy-Villacoublay, France).
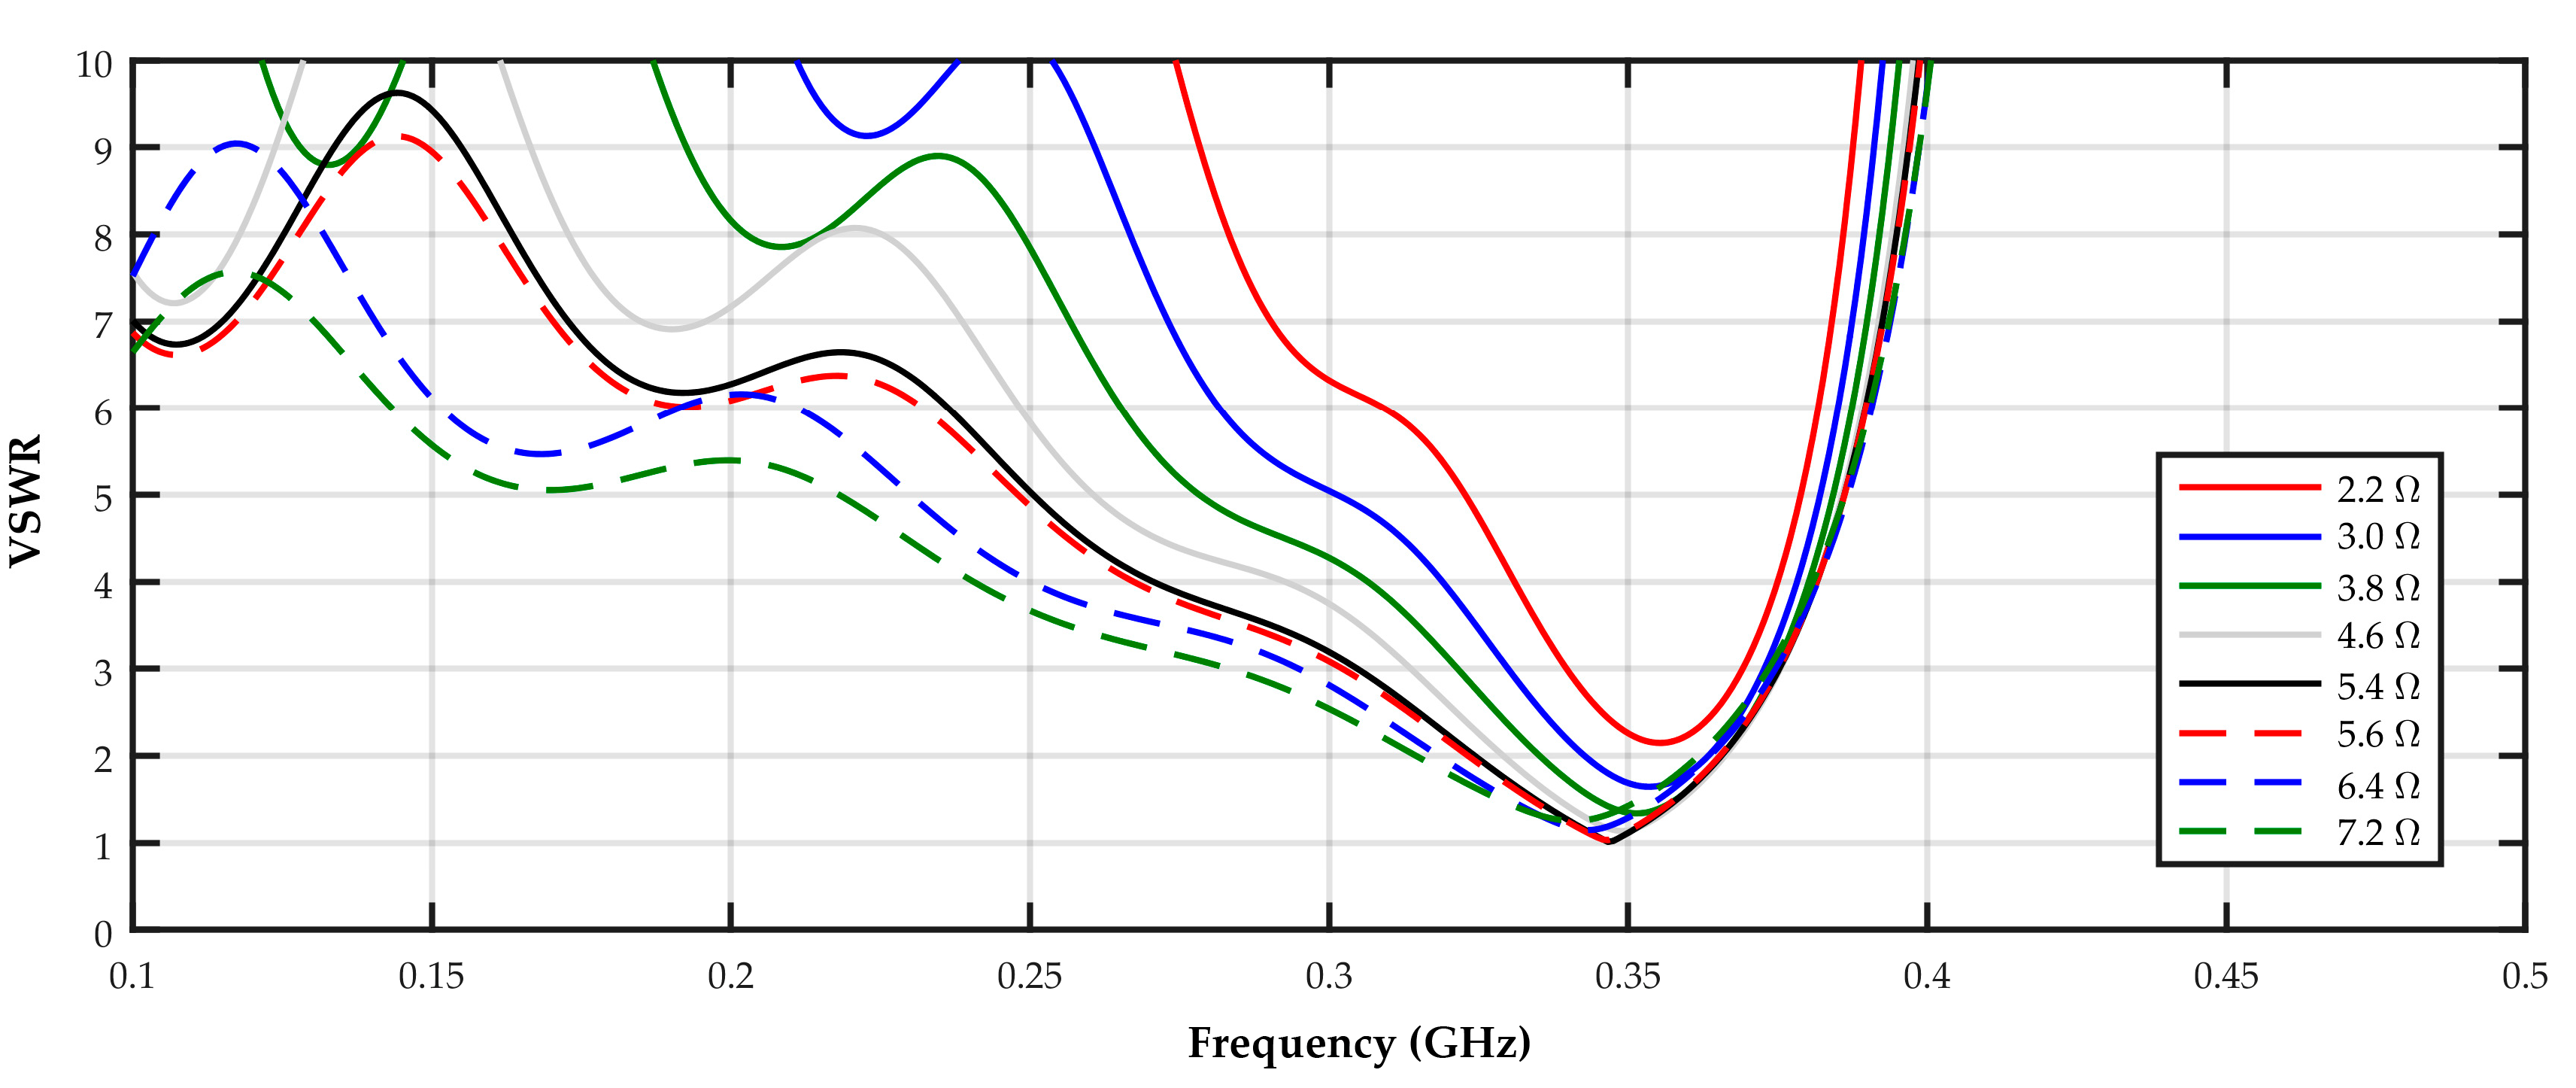
The results of the simulation proved that the application of chip-resistor in place of the shorting pin allows to increase the bandwidth (
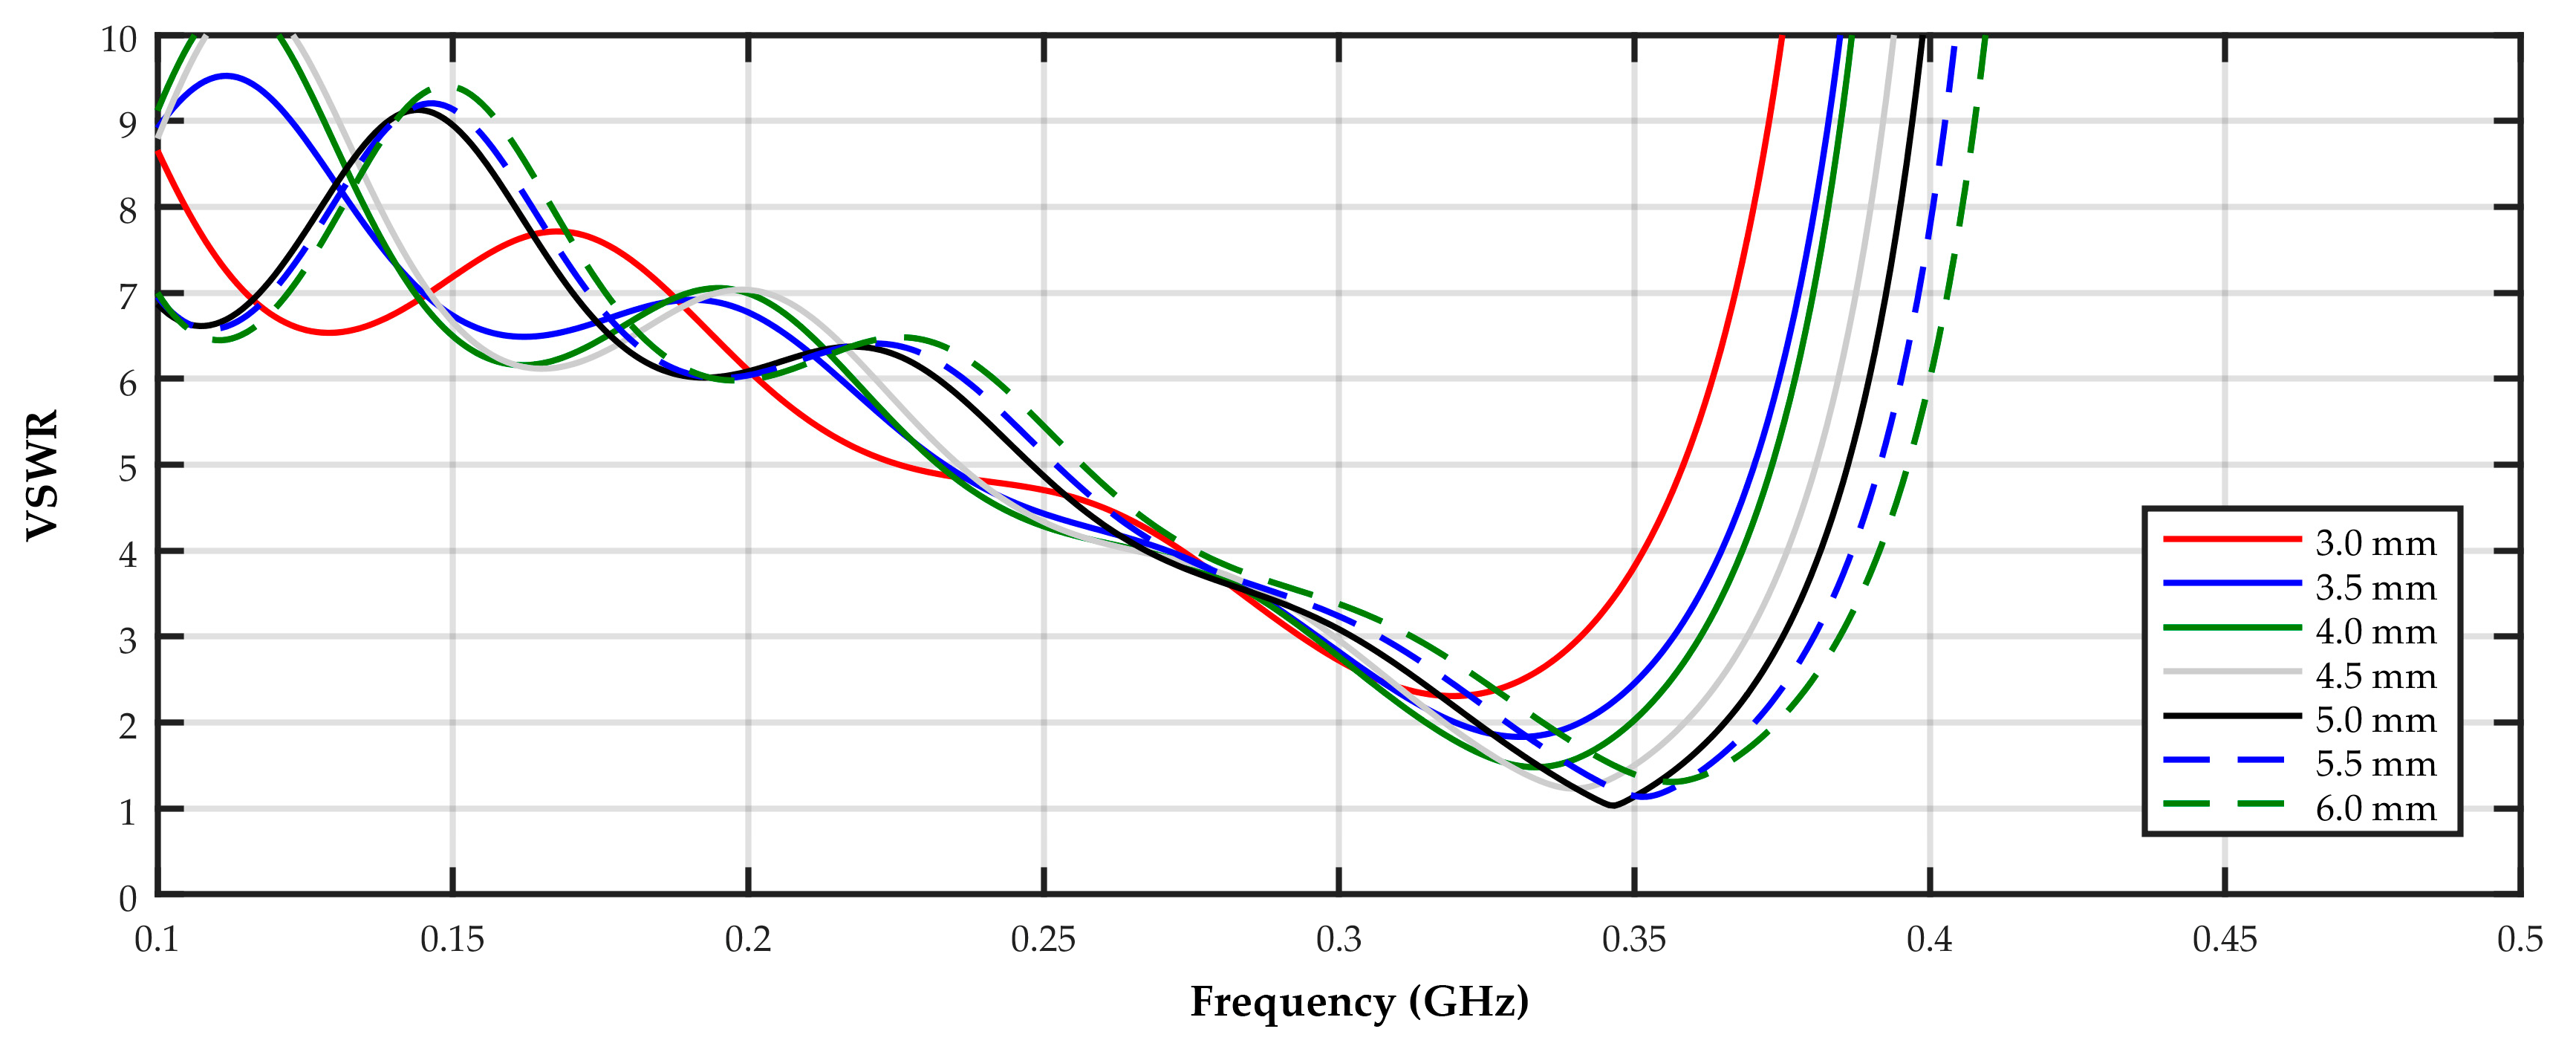
Figure 6), whereas by changing the distance between the patch and ground plane one may regulate the resonant frequency of the antenna (Figure 7). Satisfying results were obtained for chip-resistor with resistance R = 5.4 Ω and distance H = 5 mm, for which the simulated voltage standing wave ratio was VSWR = 1.038 (S11 = -36.34 dB), resonant frequency fr = 347 MHz, and the −6 dB bandwidth was 73 MHz. The use of chip-resistor of higher resistance allows to widen the bandwidth even more (e.g., for R = 7.2 Ω, the −6 dB bandwidth grew to 90 MHz). Unfortunately, it is at the expense of VSWR growth and a slight change of resonant frequency fr, which is shifted to the lower frequencies. In turn, change in distance H between the patch and ground plane influences the resonant frequency to a greater extent than the bandwidth. The results of the simulation proved that for H = 3 mm the resonant frequency was 319 MHz, and for H = 6 mm it increased to 357 MHz, wherein −6 dB bandwidth was, respectively, equal to 47 and 56 MHz.
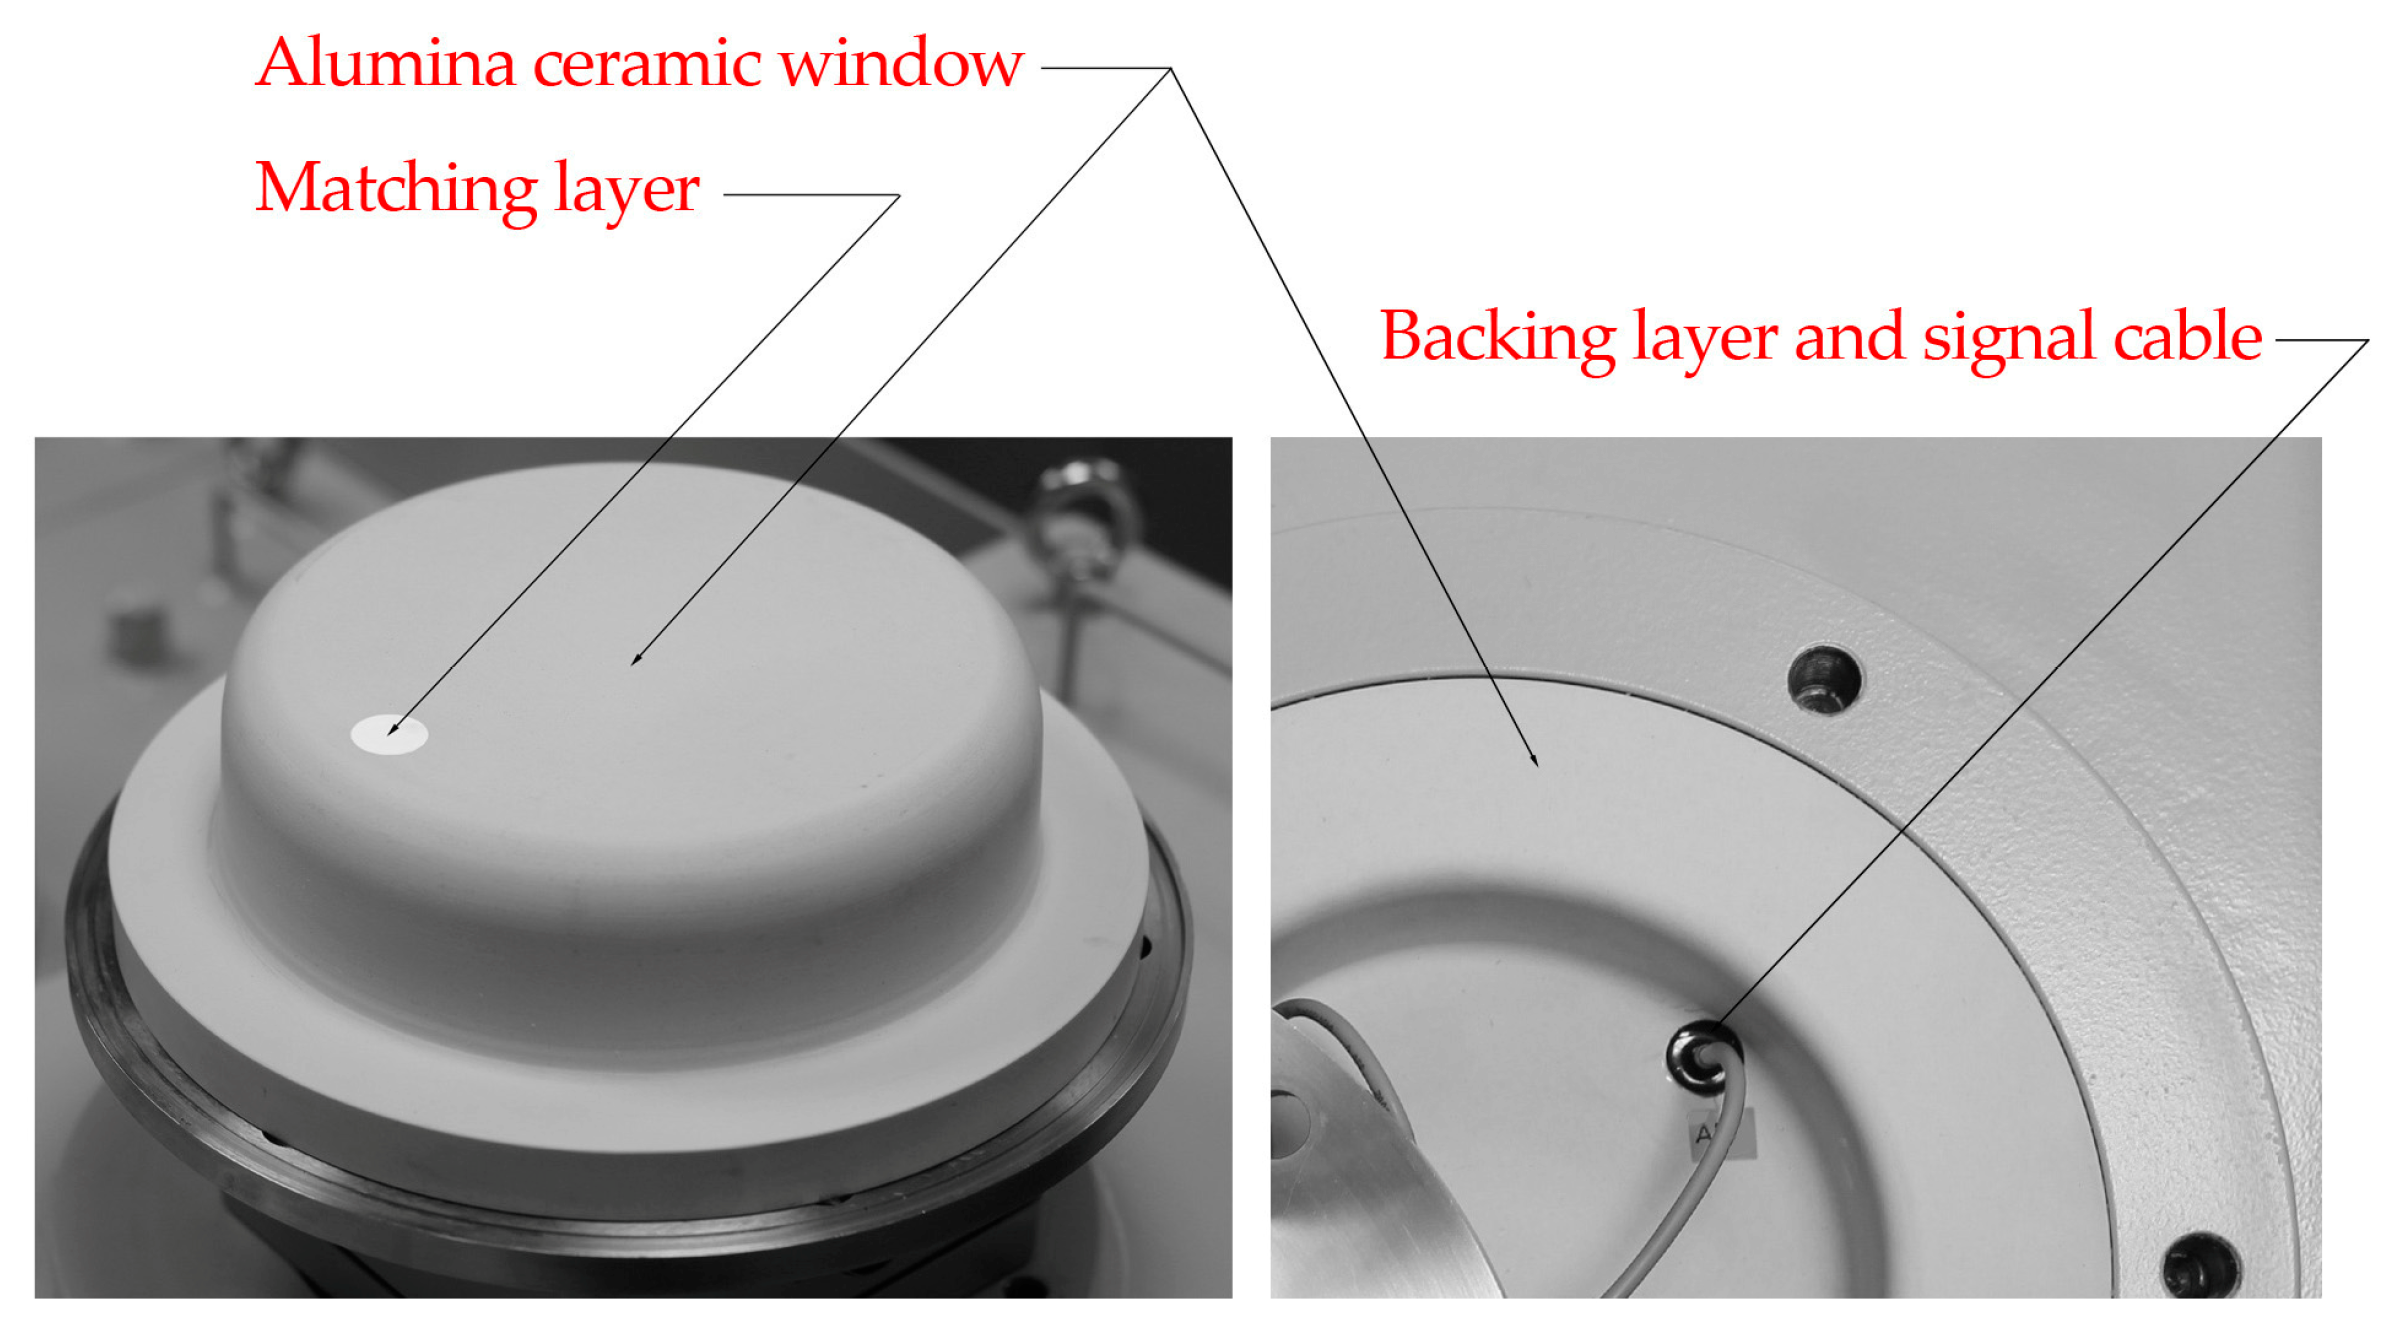
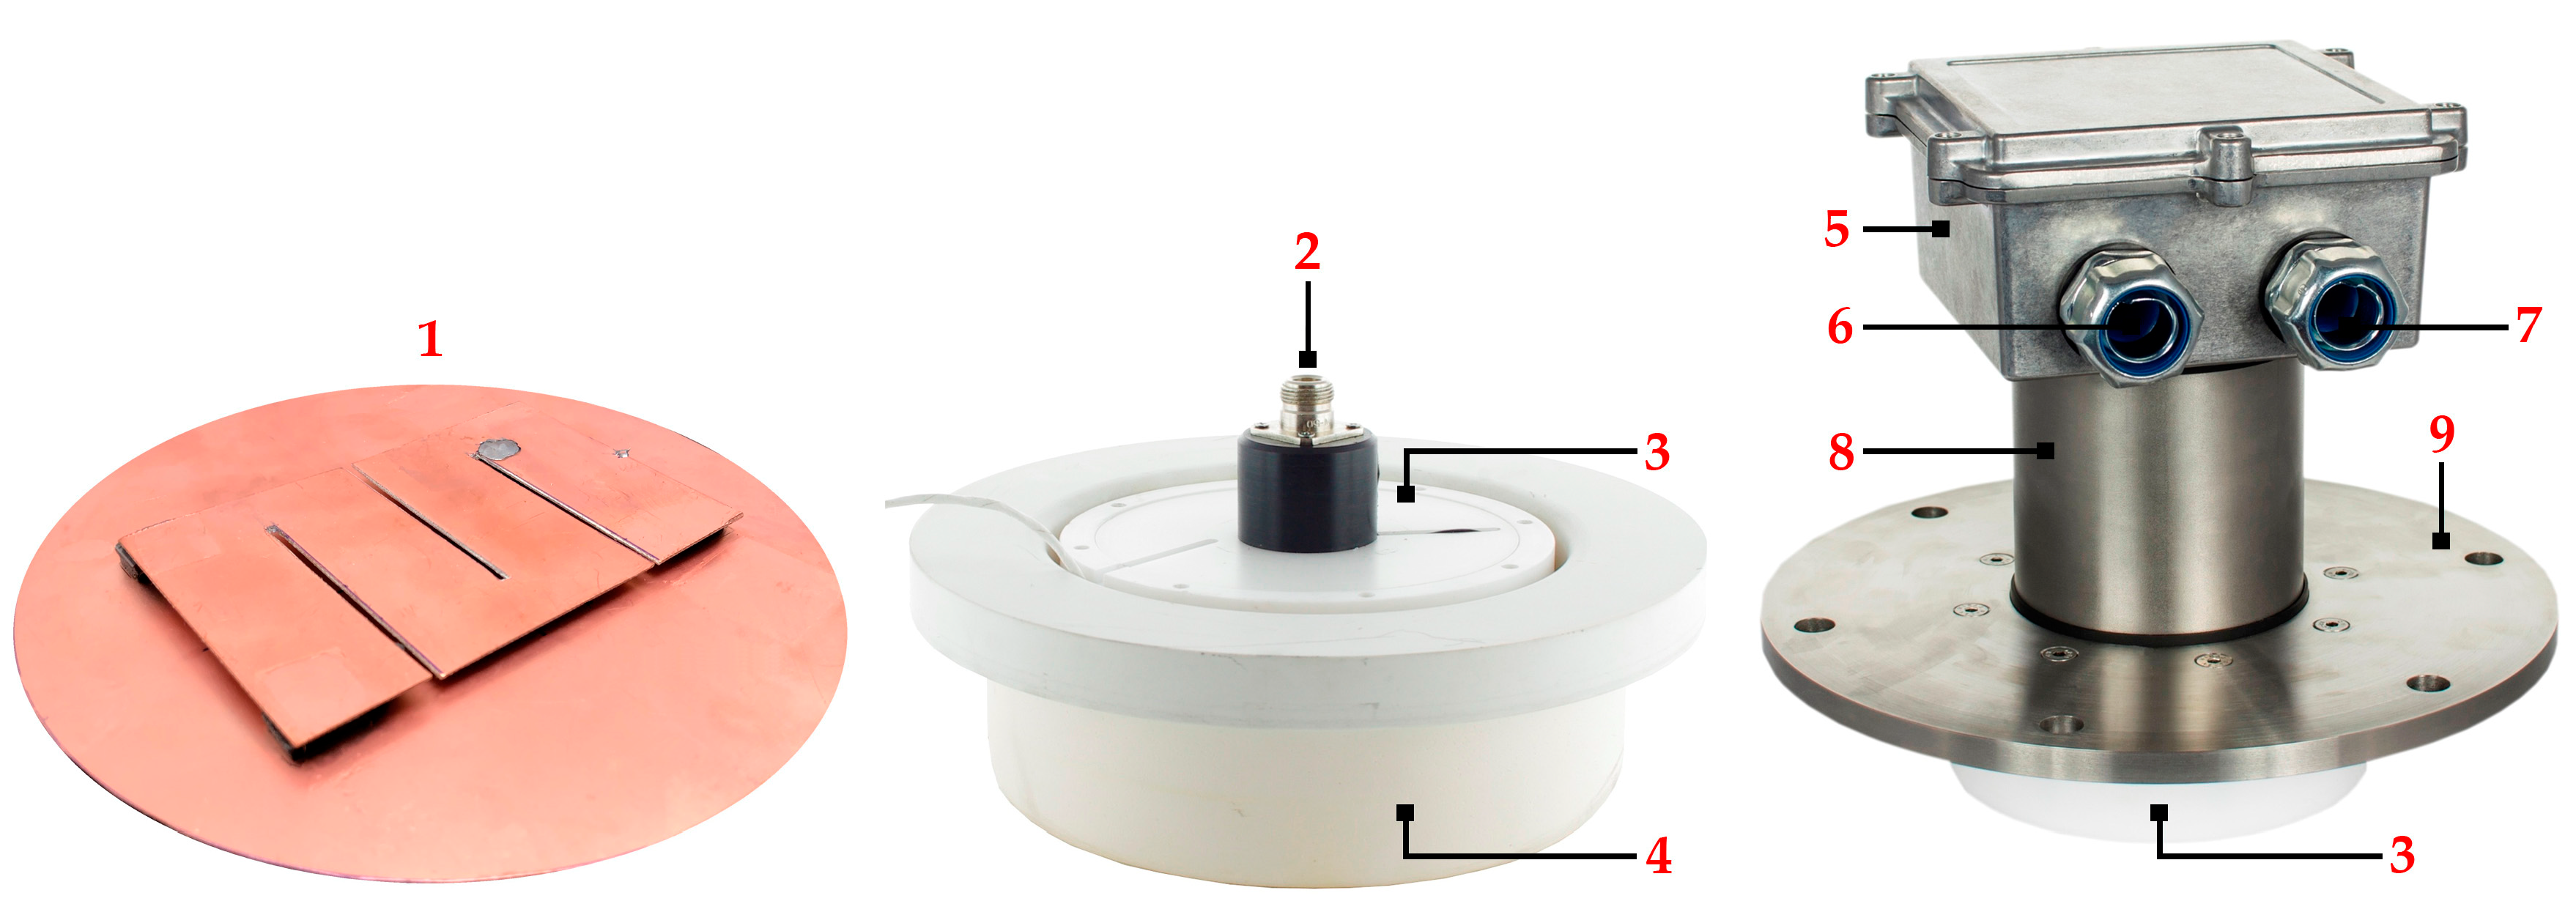
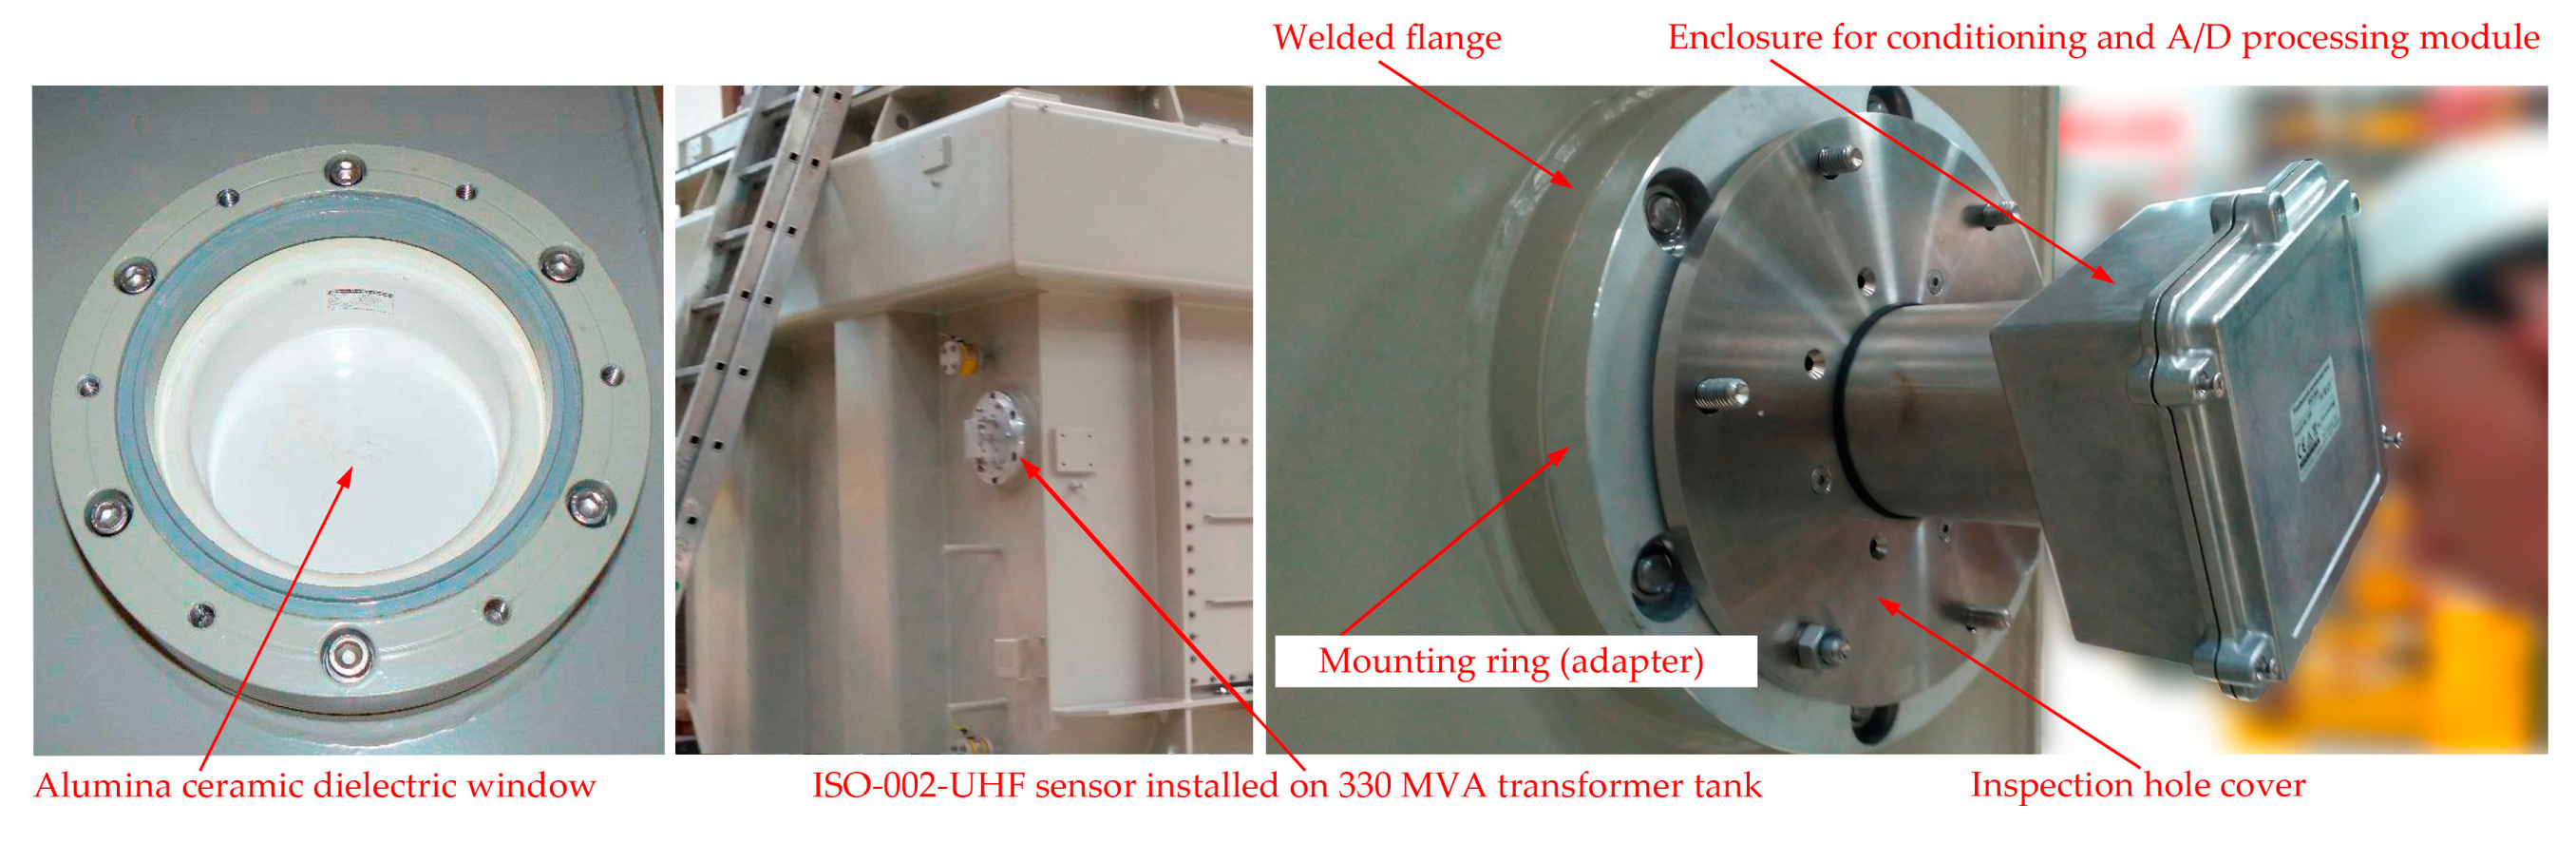
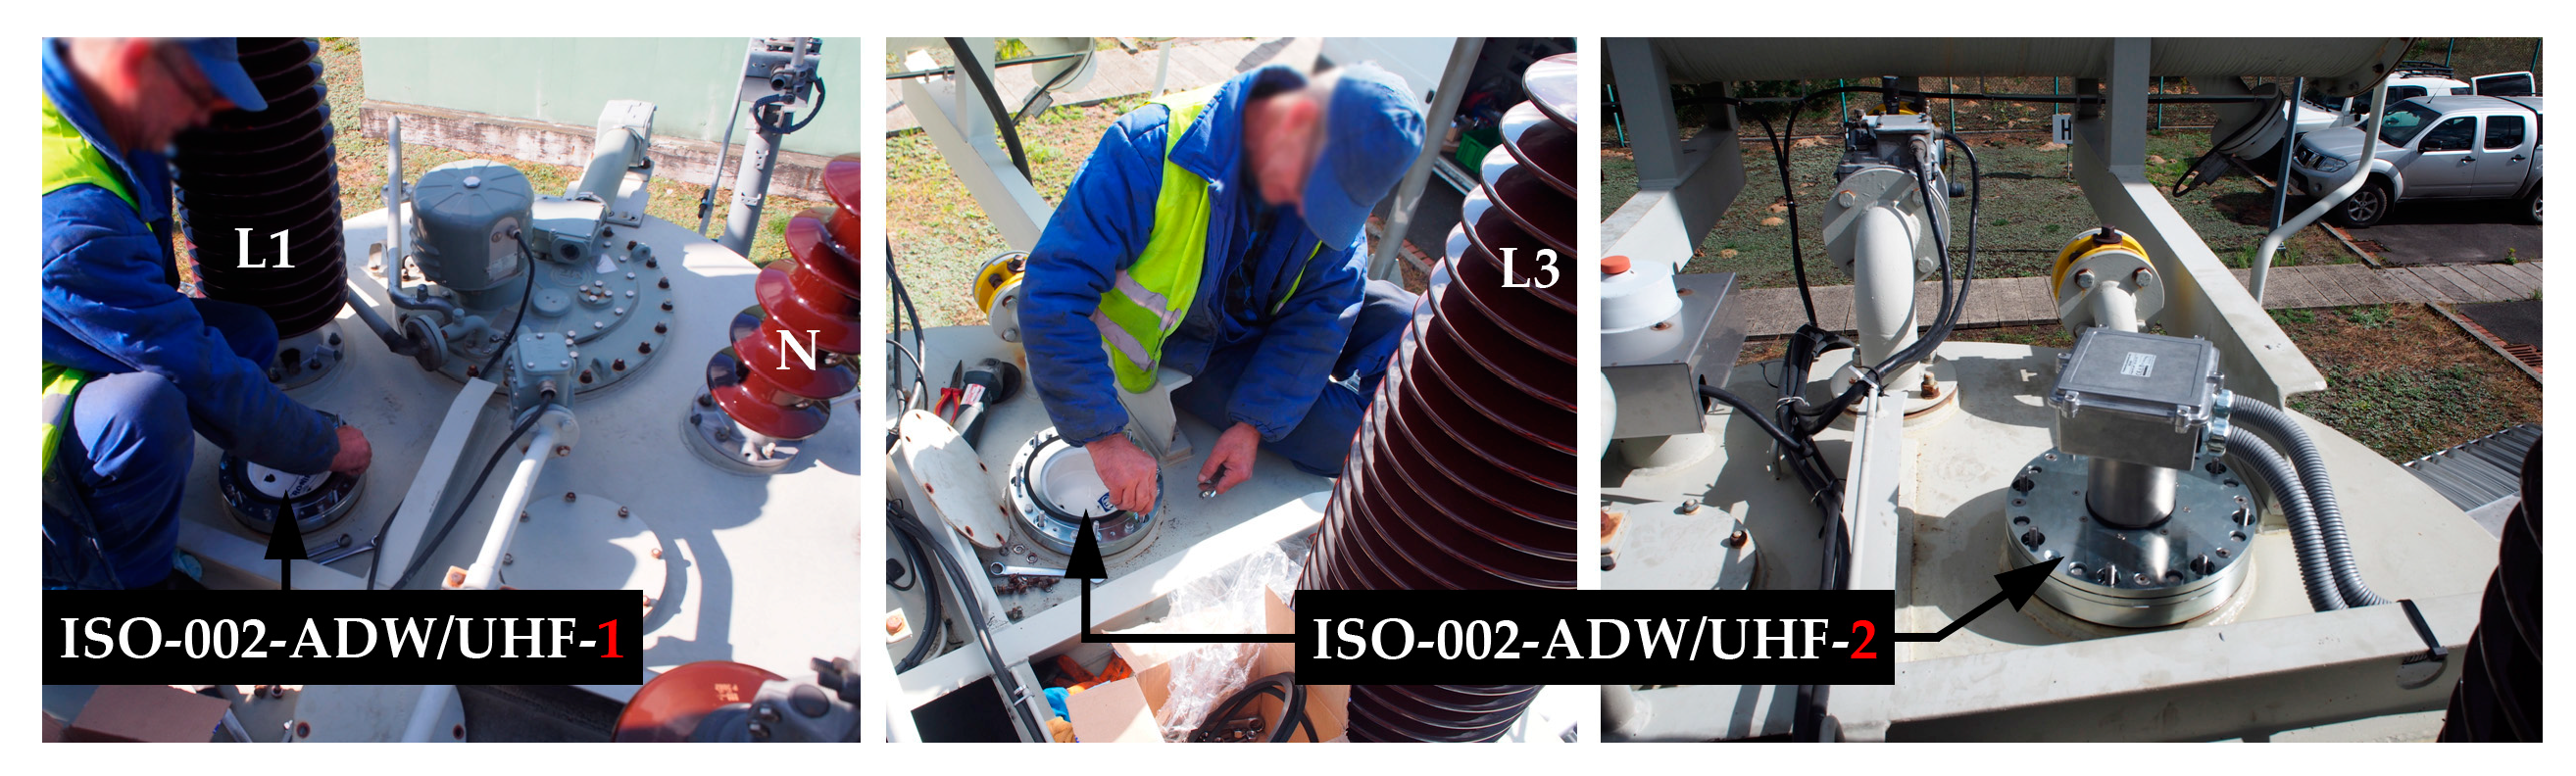
Based on the simulation results, the prototype construction of meandered PIFA of dimensions presented in Table 3 was manufactured. The antenna was equipped in cylindrical protective housing made from polytetrafluoroethylene (PTFE) and matched to the cavity of the active dielectric window. The antenna with the active dielectric window, inspection hole cover, and the module for conditioning and digital processing of PD pulses constitutes a complete PD sensor labeled as ISO-002-ADW/UHF (Figure 8).
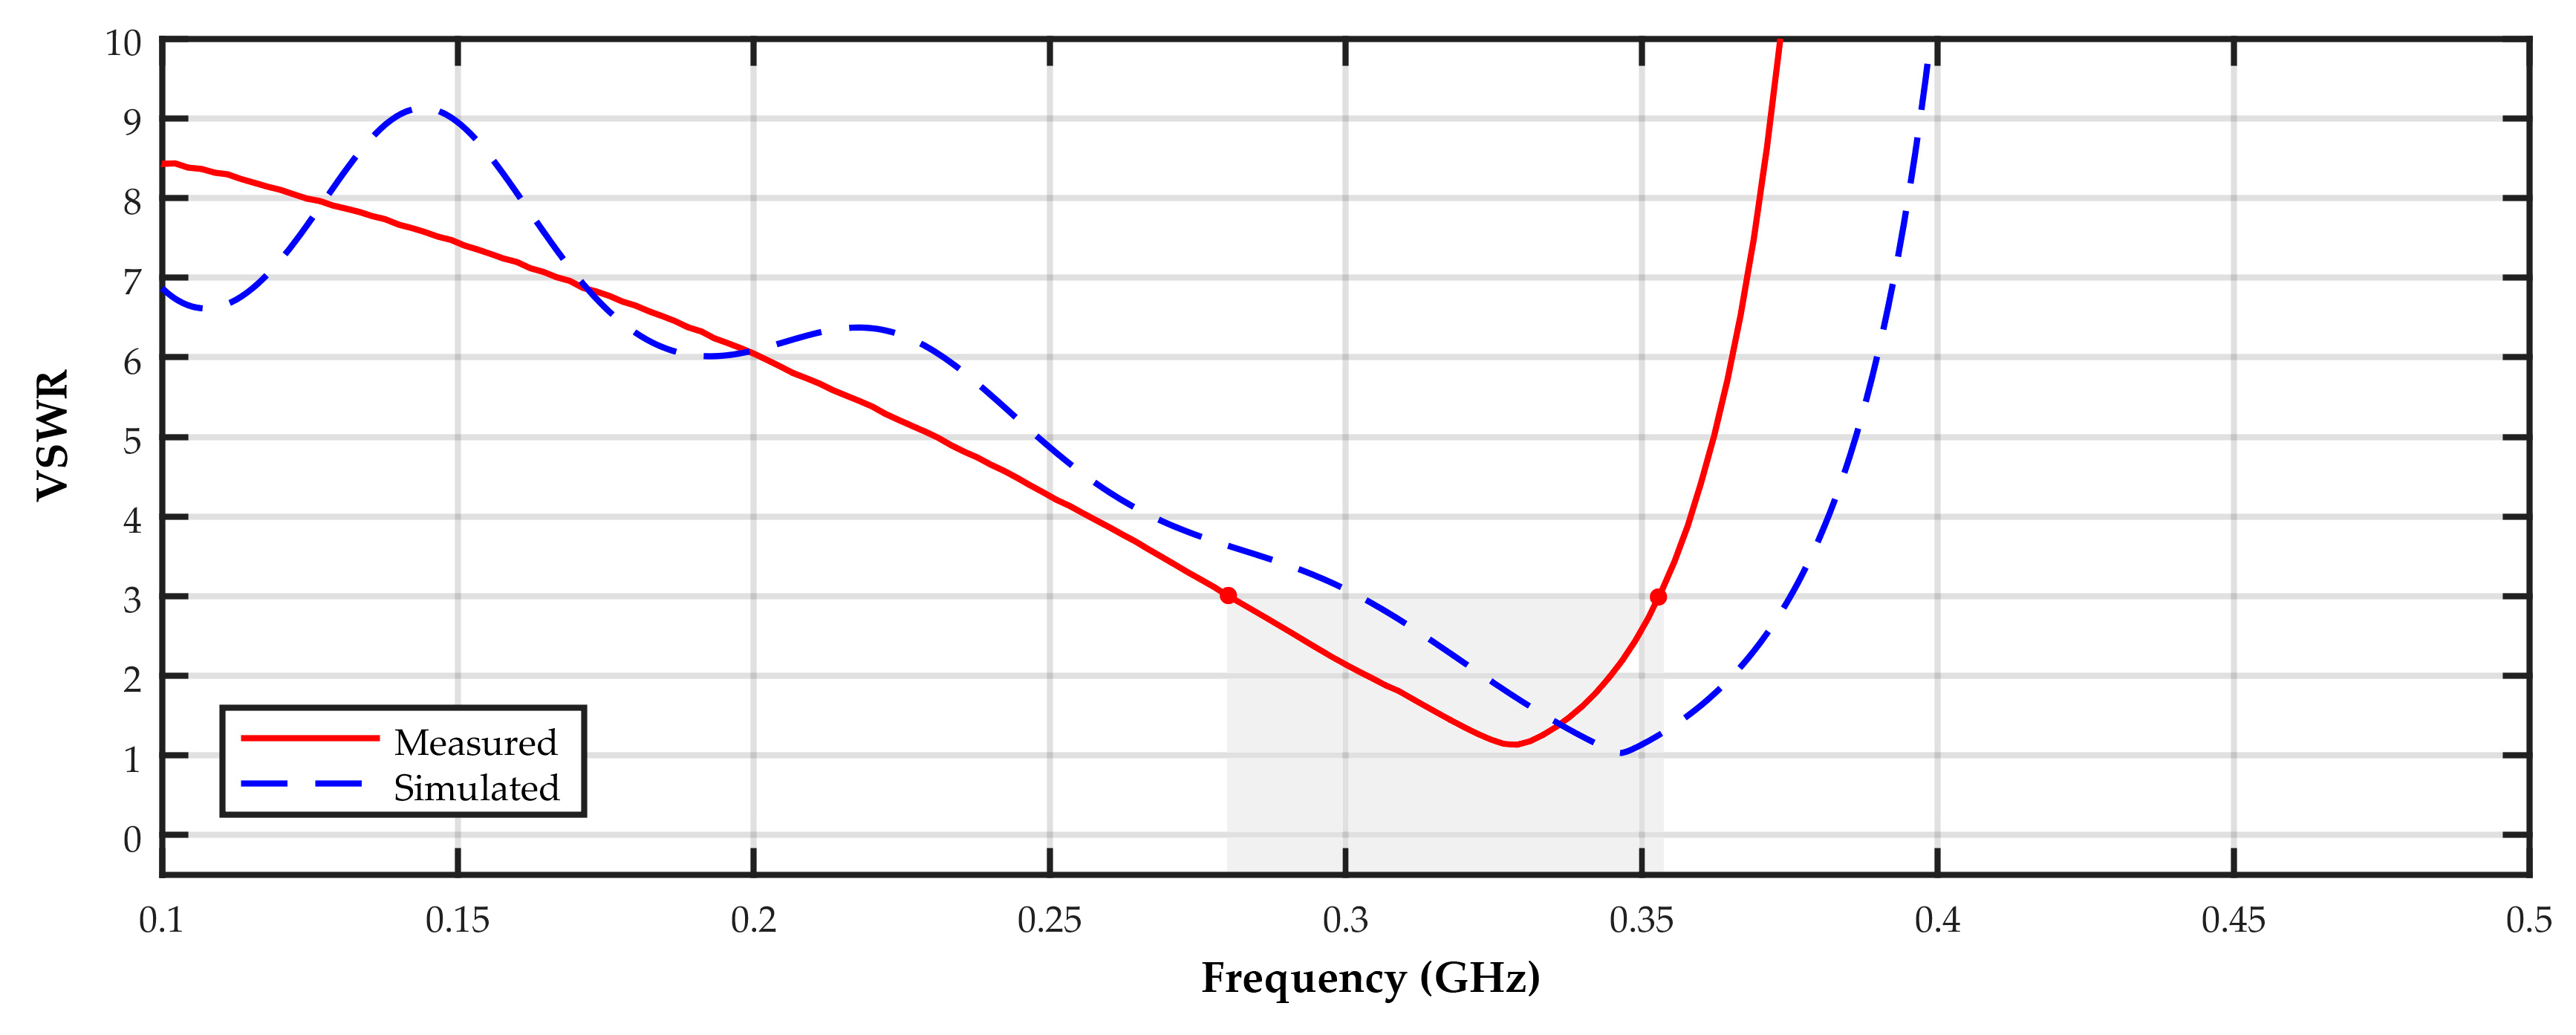
Having installed the antenna in the active dielectric window, the VSWR characteristic was measured using a vector network analyzer type KC901S+ (Deepace, Guangdong, China). The measurements showed that compared to the simulation results, the VSWR curve is slightly shifted towards lower frequencies (Figure 9). It is probably an effect of the antenna surroundings influence, i.e., metal transformer tank and inspection hole cover, which were not taken into account in the simulations. The measured resonant frequency of the antenna was equal to 329 MHz (VSWR = 1.13; S11 = −24.3 dB), and −6 dB bandwidth equal to 73 MHz (from 280 to 353 MHz).
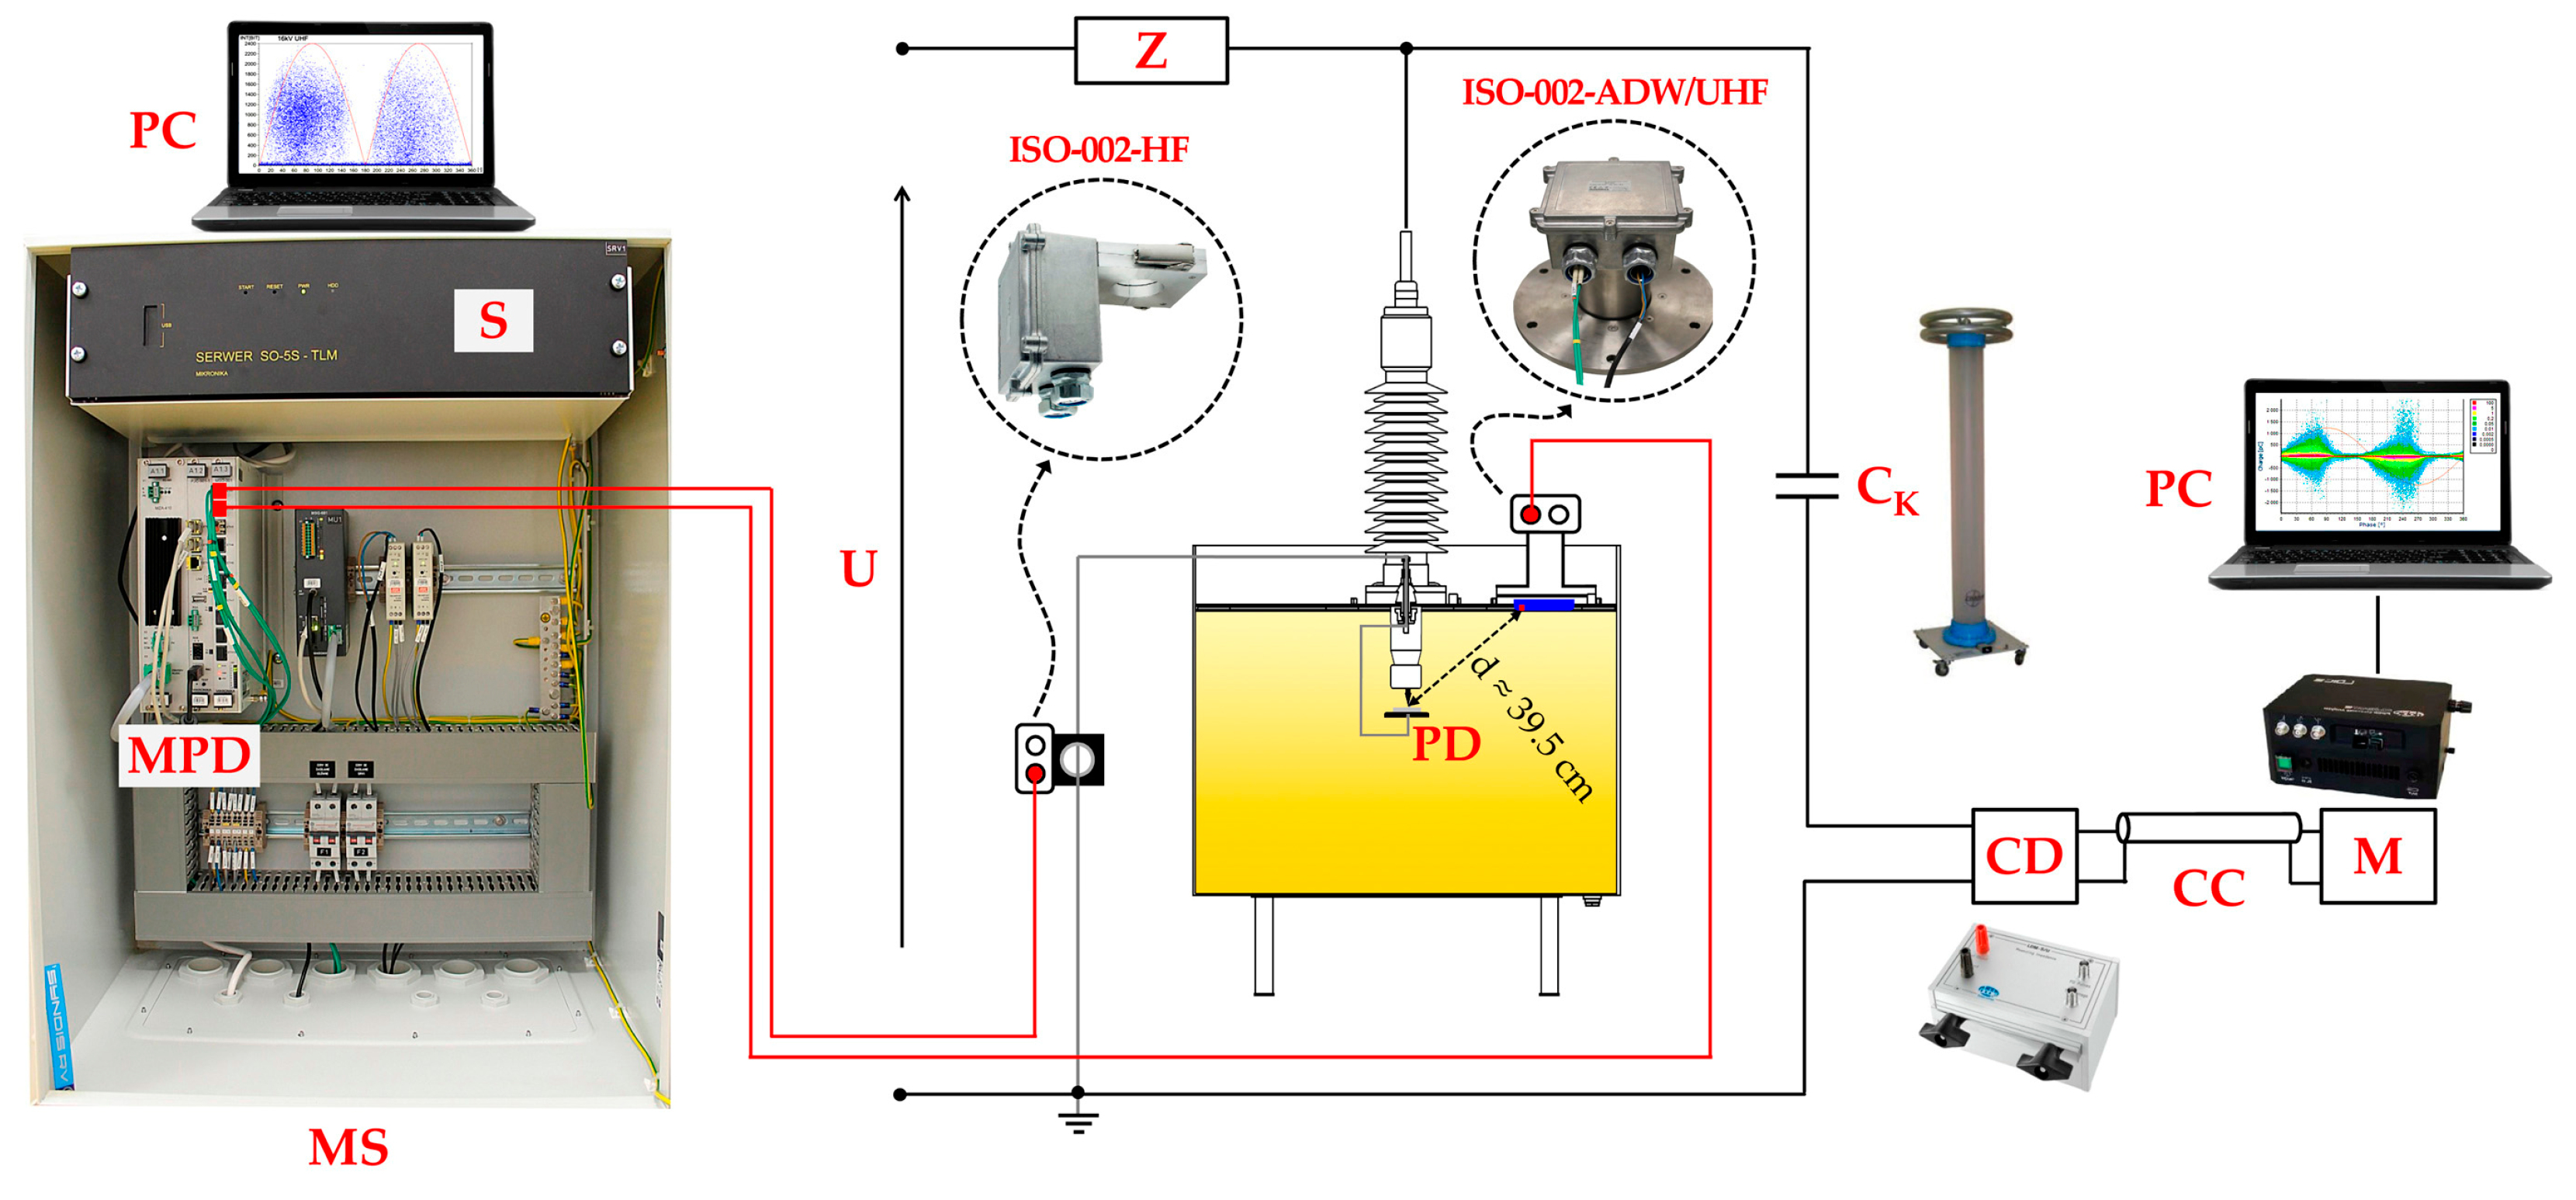
In order to check the performance of meandered PIFA, comparative research was conducted, in which a commercial UHF disk sensor with a diameter of 15 cm and measured resonant frequency 
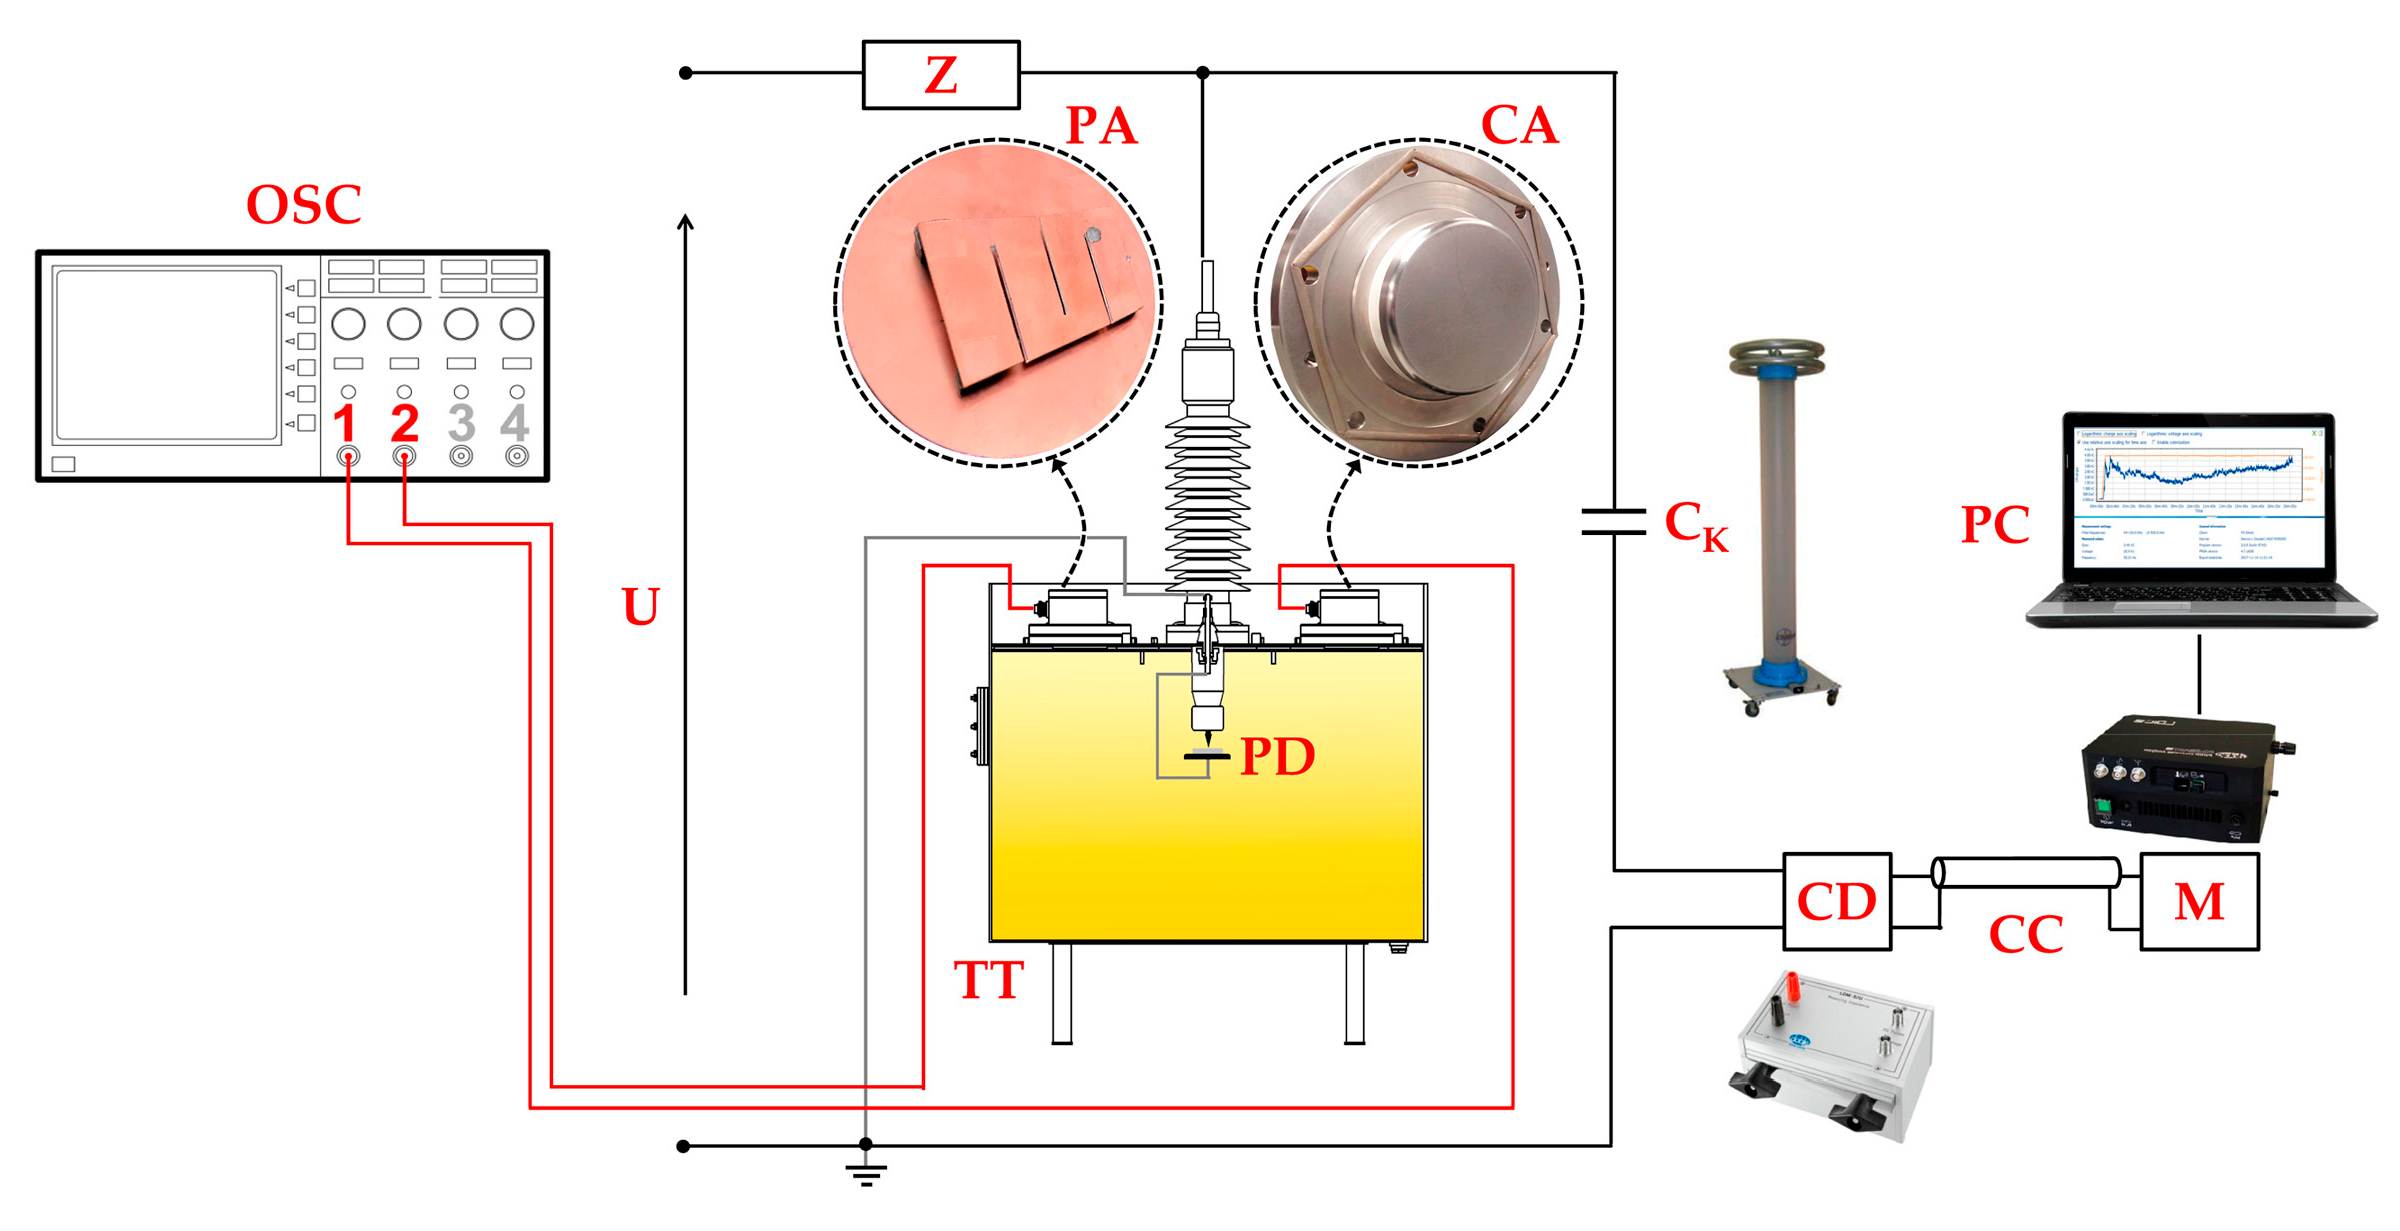
fr = 475 MHz was used as a reference antenna. Both sensors were installed in an oil-filled transformer tank of dimensions 1200 × 800 × 750 mm, equipped in two ceramic dielectric windows and an electrode system for generating surface discharges on the pressboard sample. The distance between the PD source and the central point of the antenna, in the case of both sensors, was the same and equal to about 45 cm. The pulses were registered with a four-channel oscilloscope type Tektronix MDO 3104 with a sampling frequency of 5 GS/s. The level of the apparent charge of the generated partial discharges was monitored by the use of the standard measurement set compliant with the IEC 60270 standard [90] (Figure 10).
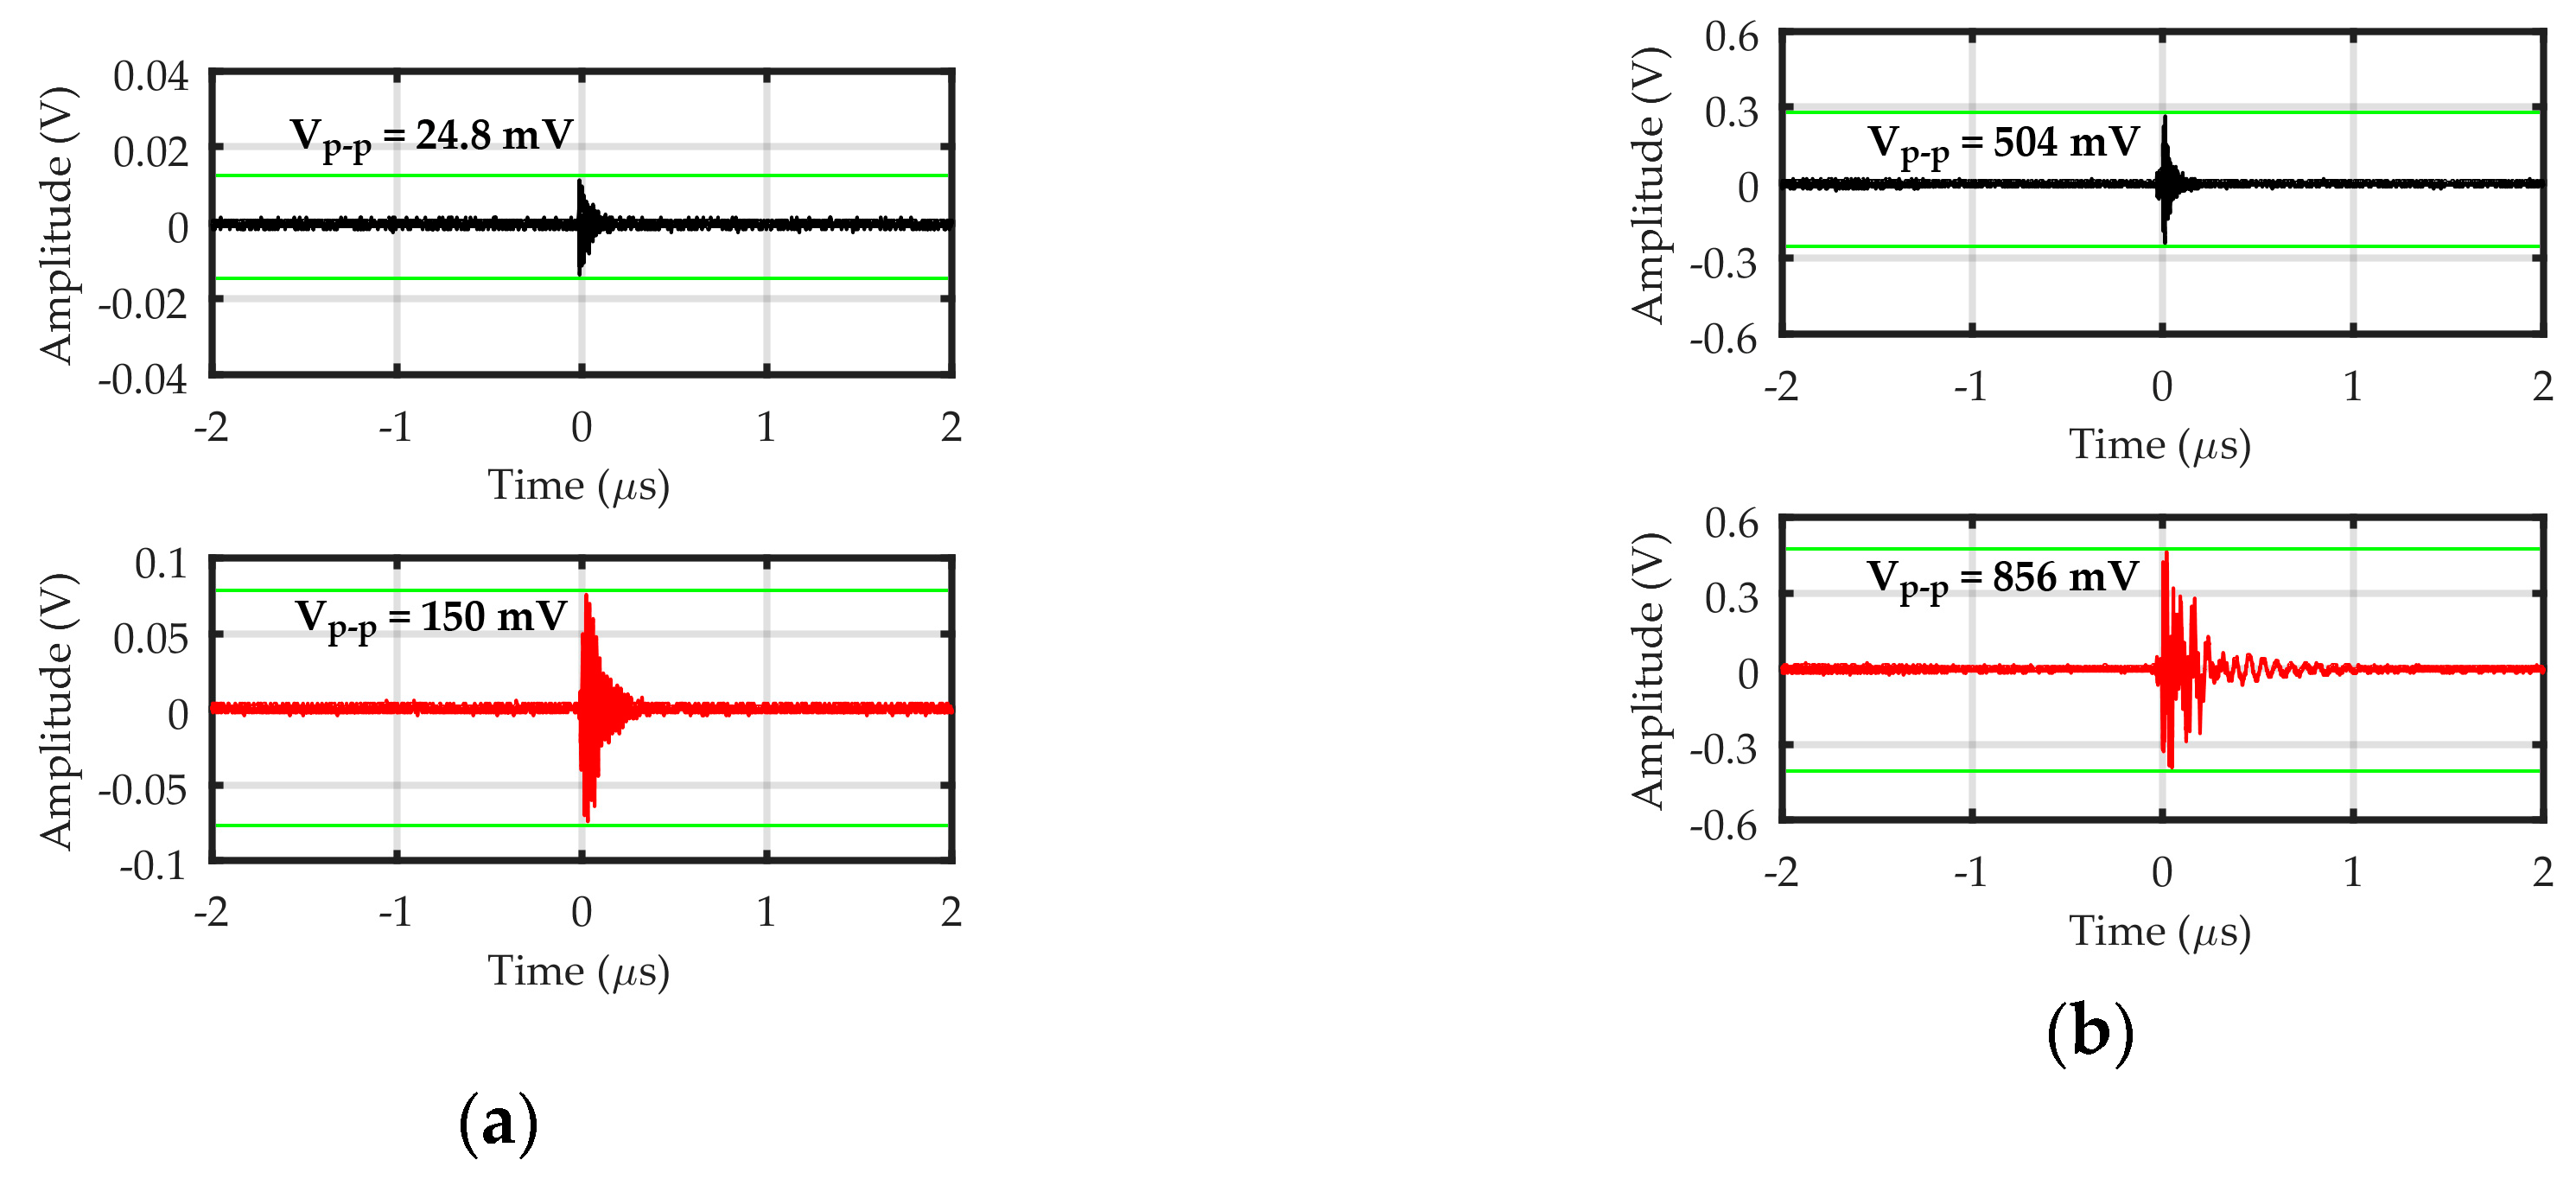
The research results confirmed the high sensitivity of the prototype antenna. For the initial form of the surface discharges of the average apparent charge equal to qavg = 895 pC, the growth of the amplitude of the registered UHF pulses compared to the disk antenna by 7.80 ± 0.9 times on average was found. In turn, in case of high energy creeping sparks with an average apparent charge equal to 
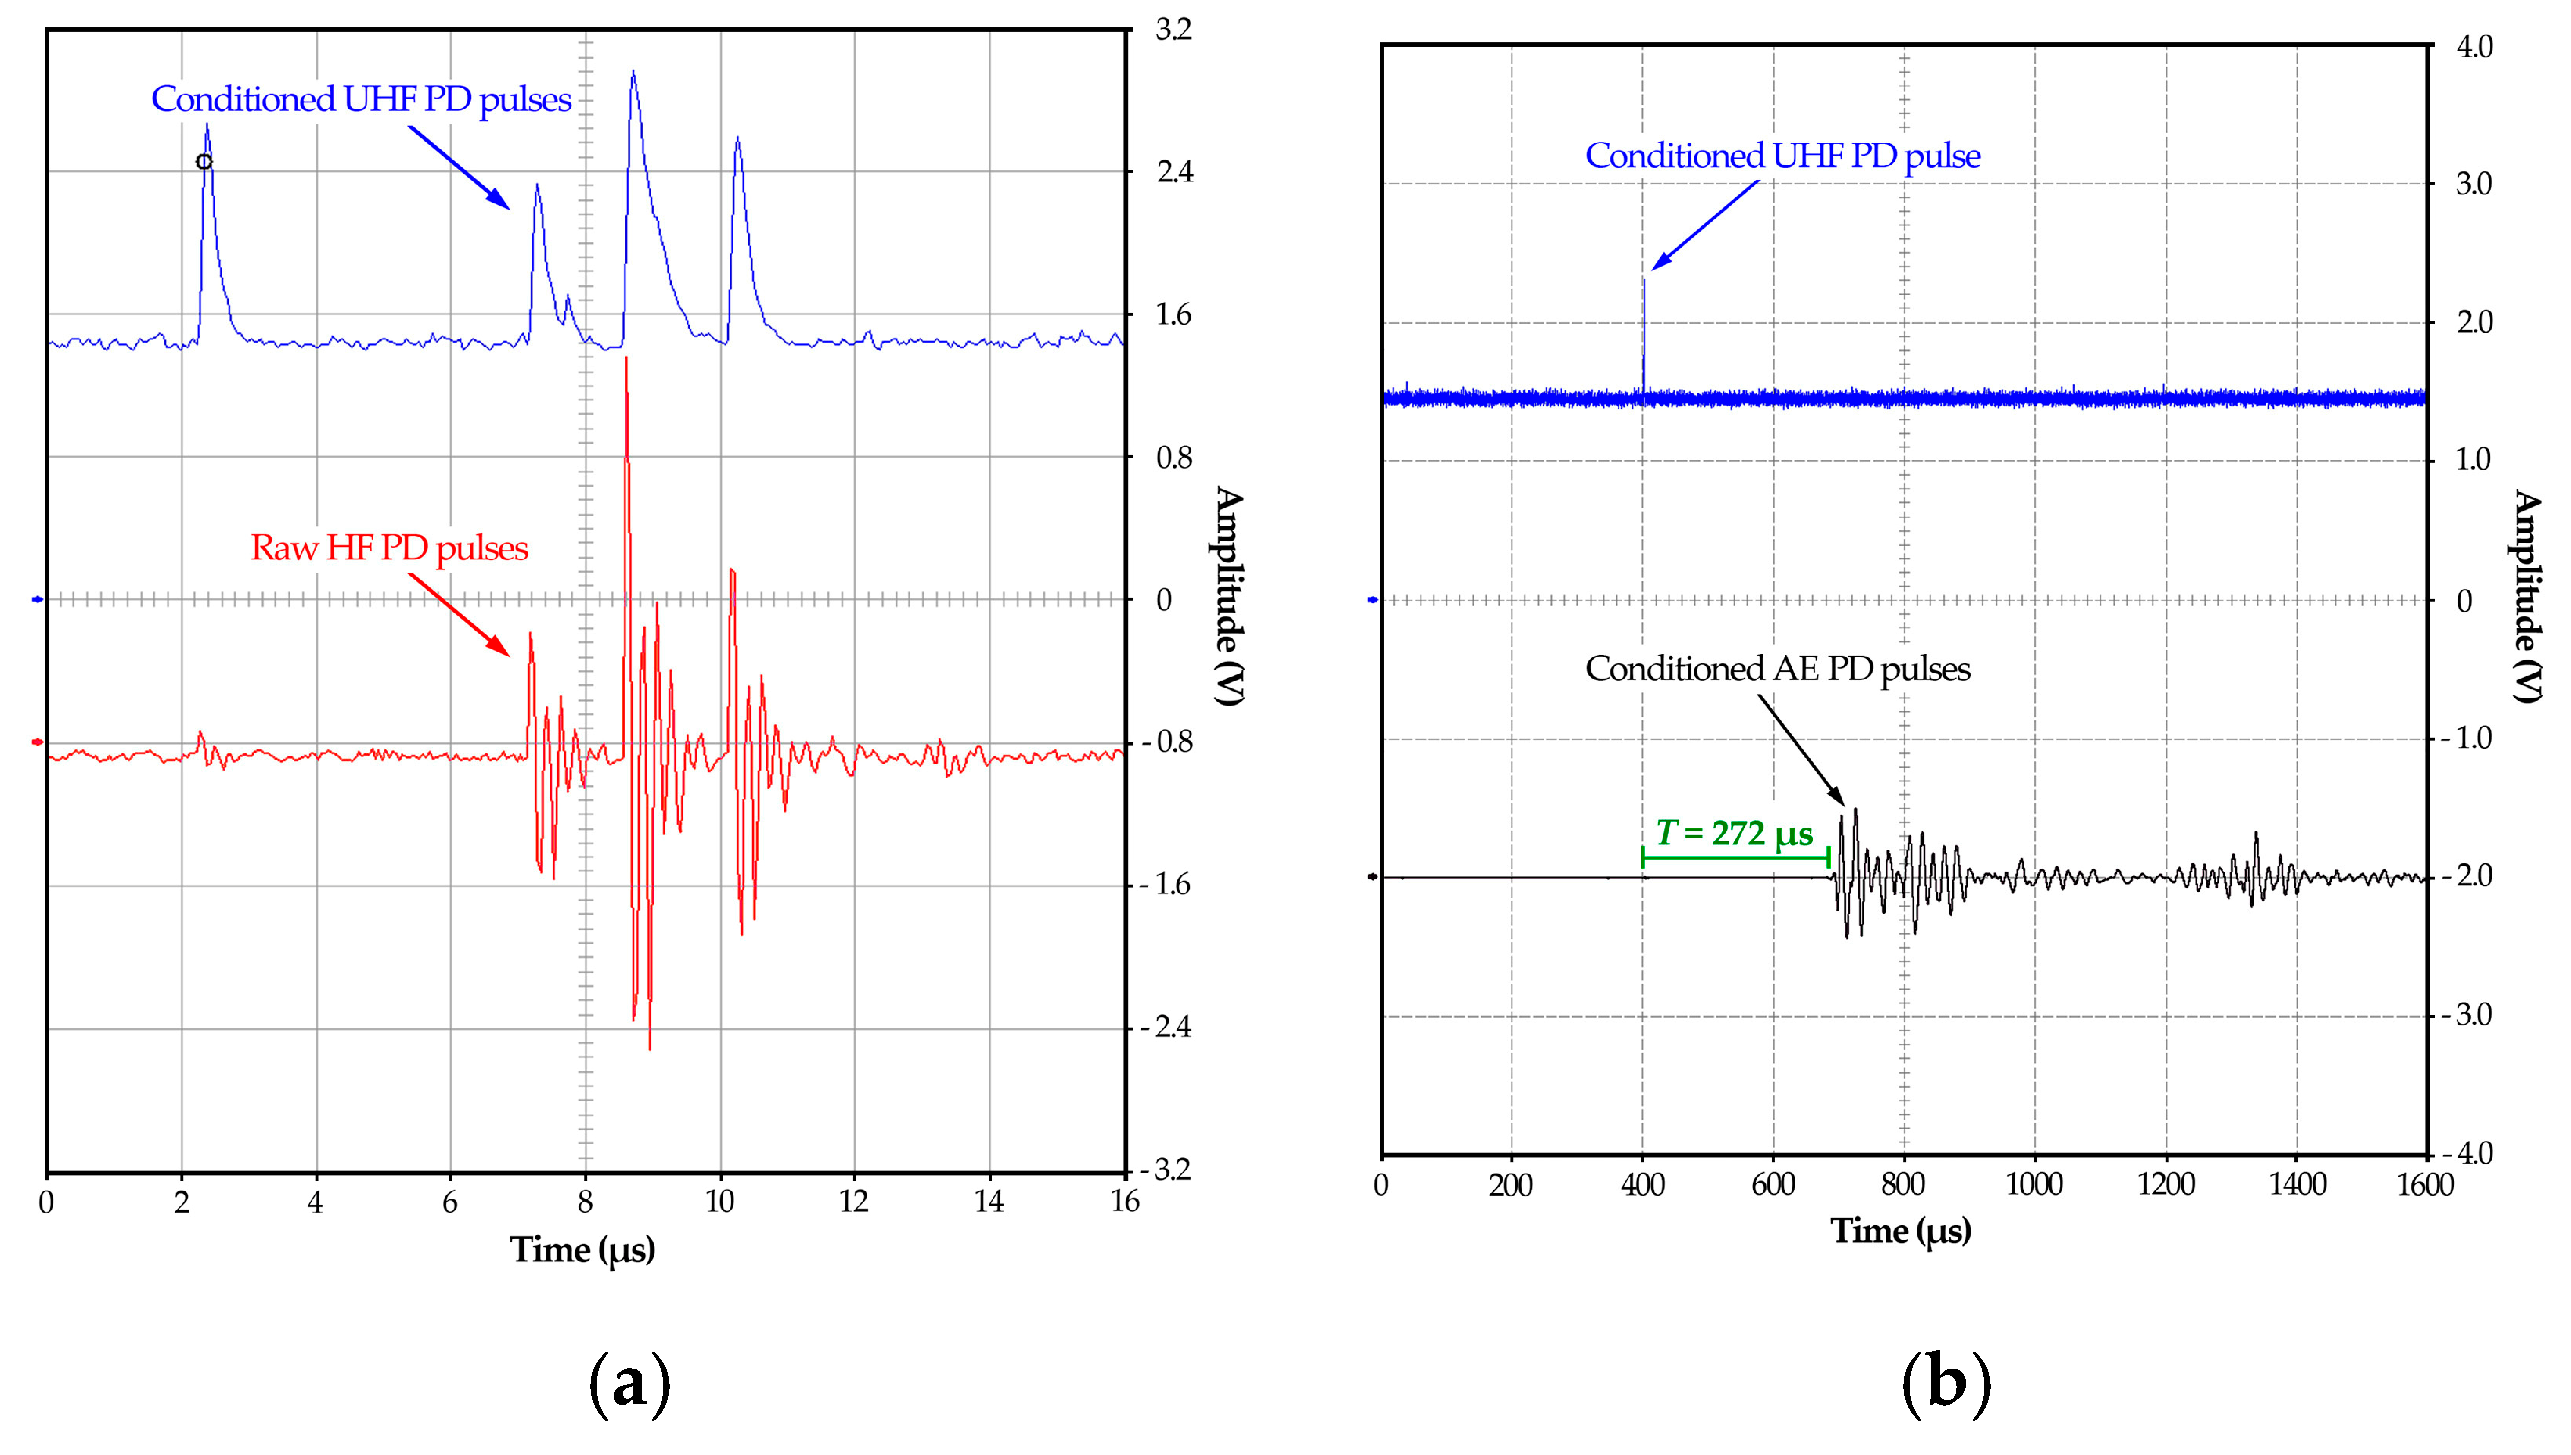
qavg = 5990 pC, lower growth of the amplitude, equal to 1.75 ± 0.7 times on average was observed. The comparison of the exemplary time waveforms of the PD pulses registered by the prototype antenna and commercial disk antenna is demonstrated in Figure 11.

2.2.3. High-Frequency Current Transformer

The high-frequency current transformer is an inductive PD detector, which is usually installed on the wire grounding the investigated high voltage device. That wire is simultaneously a primary winding of the current transformer. A typical sensor HFCT consists of toroidal ferrite core, on which from several to over a dozen turns (secondary winding) are wound-up. This winding is terminated with a low-inductance sense resistor. A current pulse of high frequency flowing through the grounding wire (primary winding) causes the occurrence of a time-varying magnetic field, which passes through the secondary winding and induces a voltage across the sense resistor. 
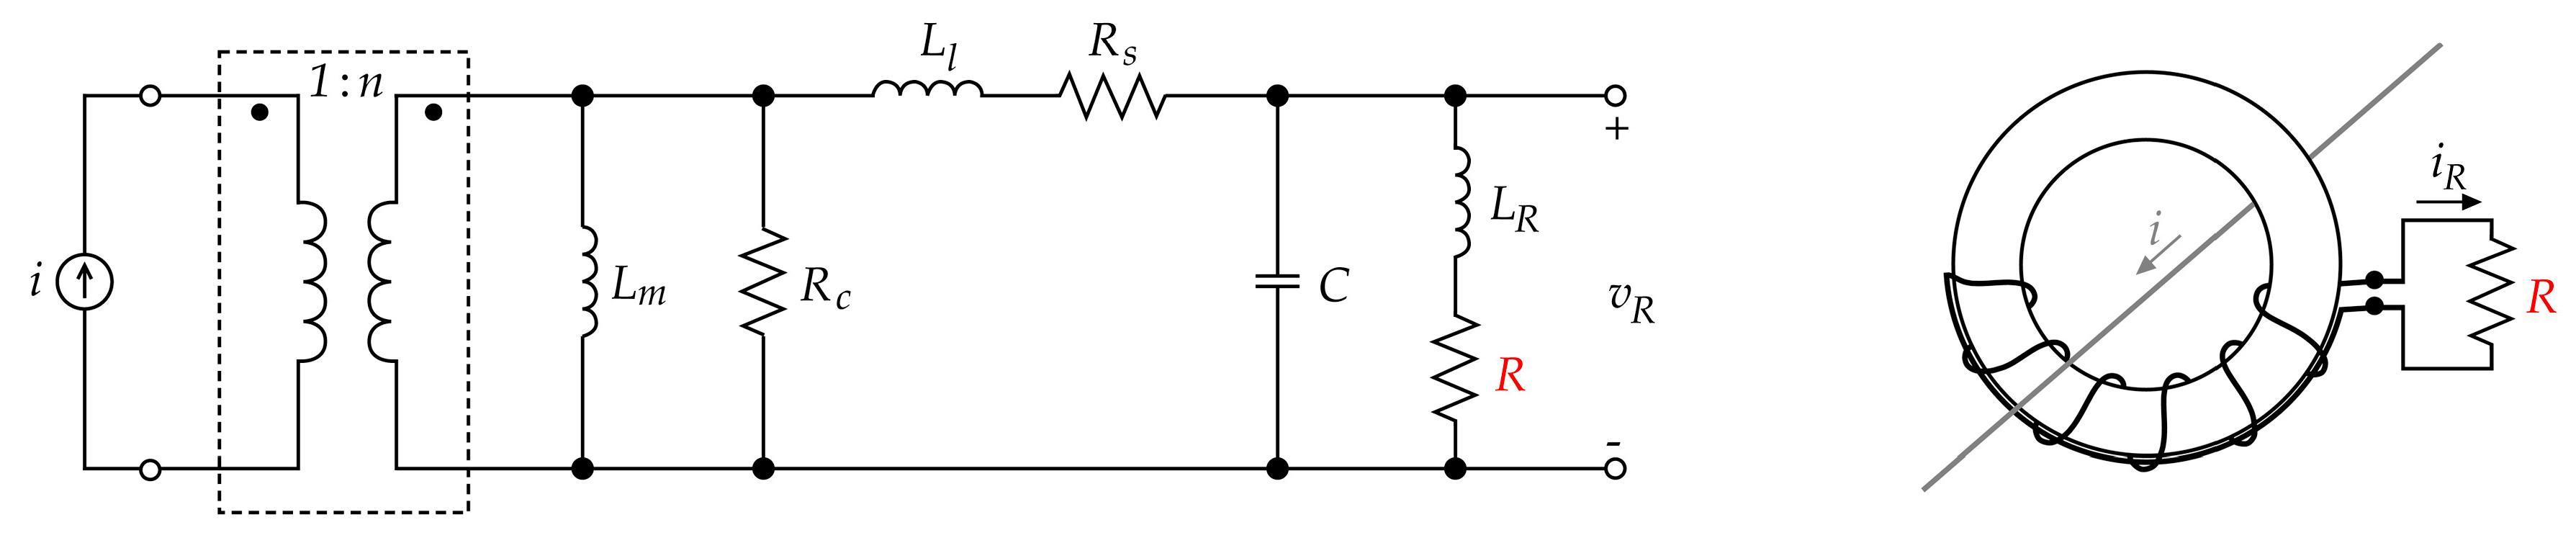
Figure 12 presents a model and equivalent circuit of the HFCT sensor, where i is the current flowing through the primary winding, R is the sense resistor, VR an induced voltage in the secondary winding, Lm is the magnetizing inductance of the current transformer, Rc is the core parallel equivalent resistance, Ll and Rs are the leakage inductance and series resistance of the secondary winding, respectively. The remaining parasitic components included in the model are stray capacitance C and inductance LR of the sense resistor [91].
The HFCT sensors are applied in the diagnostics of high-voltage power cables, power generators, metal-enclosed switchgears, and gas-insulated systems (GIS) [92,93,94]. In the case of power transformers, the HFCT sensor may be installed on a grounding wire of the tank, on a grounded measuring tap of the bushing insulator, or a grounding of the neutral point of the transformer winding. The last option assures the highest detection sensitivity of the PDs occurring in the power transformer main insulation system.
The toroidal HFCT sensor core is most commonly made from soft ferrite. This material is ferromagnetic and consists of iron oxides mixed with oxides of manganese and zinc (MnZnFe2O4), or nickel and zinc (NiZnFe2O4). Manganese-zinc soft ferrites have high relative permeability (µr ≈ 350–20,000 at 10 kHz), medium saturation flux density (Bs ≈ 320−545 mT at 1200 A/m), operating frequency range from a few kilohertz to 4 MHz, and low resistivity ρ (from 10 Ωm at 10 kHz to 0.01 Ωm at 100 MHz). In turn, nickel-zinc soft ferrites are characterized by low relative permeability (µr ≈ 15−2000 at 10 kHz), slightly lower saturation flux density (Bs ≈ 220−380 mT at 1200 A/m), much higher maximum operating frequency (up to about 200 MHz), and much higher resistivity ρ (from 105 Ωm at 10 kHz to 103 Ωm at 100 MHz) [95].
The clamp-type HFCT sensor devoted to PD monitoring in power transformers should have high sensitivity, wide bandwidth, closer to the constant line frequency response characteristics, and be equipped in enclosure shielding from external electromagnetic interferences. The sensitivity S of the HFCT sensor depends on resistance value R and the number of windings N, as shown in Equation (2).
S = R N
The lower −3 dB cutoff frequency of HFCT sensor is given by
f L = R c | | ( R + R s ) 2 π L m   R 2 π L m
where Lm is the magnetizing inductance. The HFCT sensors are mostly loaded with non-inductive resistor R = 50 Ω, in order to assure a good impedance matching with the transmission line (usually it is a standard 50-ohm coaxial cable) and with the analog input of signal acquisition unit. Therefore, to achieve a low value of the cutoff frequency fL, the magnetizing inductance should be possibly the highest. The magnetizing inductance Lm on the secondary side is given by
L m = μ r μ 0 N 2 A c l c
where μ0 is the vacuum permeability (magnetic constant), Ac is the core cross-sectional area, and lc is the toroidal mean length. Equation (4) shows that the high value of the magnetizing inductance Lm may be obtained the easiest using a large number of turns N. Unfortunately, with increasing the number of turns, the sensor sensitivity is reduced. The other way is a choice of a core made of a material with high relative permeability µr (e.g., MnZn soft ferrites) and possibly the smallest toroidal mean length lc [95,96].
In turn, the higher –3 dB cutoff frequency of the HFCT sensor mainly depends on stray capacitance C and the leakage inductance Ll (Equation (5)). To obtain a high value of fH, both parameters should be reduced.
f H = 1 2 π ( R C ) 2 + ( L l R c ) 2
The stray capacitance C consists of several capacitive couplings, which are present in high-frequency current transformer, i.e., turn-to-turn capacitance, winding-to-core capacitance, winding-to-shielded enclosure capacitance, and primary-to-secondary winding capacitance. The stray capacitance can be minimized by reducing the number of turns N, increasing the insulation layer of core and secondary winding (using a material with low dielectric constant εr), increasing the distance between turns, and using a Faraday electrostatic shield [95].
The reduction of the number of turns N is also favorable from the viewpoint of leakage inductance Ll minimizing. Additionally, the secondary winding should be made wide and have a small thickness.
As one may notice, the factors which have the greatest influence on the sensitivity and width of the HFCT sensor band, are the number of windings N and the type of material, which the toroidal core is made from. The cores made from MnZn and NiZn soft ferrites were selected for the tests. The physical parameters of the materials are listed in Table 4.
The dimensions of the applied ferrite cores were selected so that, after equipping them in shielding enclosure, they could be easily installed on the wire grounding the transformer tank or the neutral point of the star windings. Since the width of the grounding wire/rail of power transformer usually does not exceed 40 mm, it was decided to choose toroidal cores with an internal diameter equal to 65 mm.
The external diameter MnZn ferrite core was 107 mm, and its height was 18 mm. For NiZn ferrite core they were, respectively, 103 and 16 mm. To reduce the skin effect, for manufacturing of the secondary winding, the high-frequency Litz-wire with a diameter of 0.48 mm and external insulation with a thickness of 0.02 mm made from natural silk of dielectric constant εr = 2.6 was used.
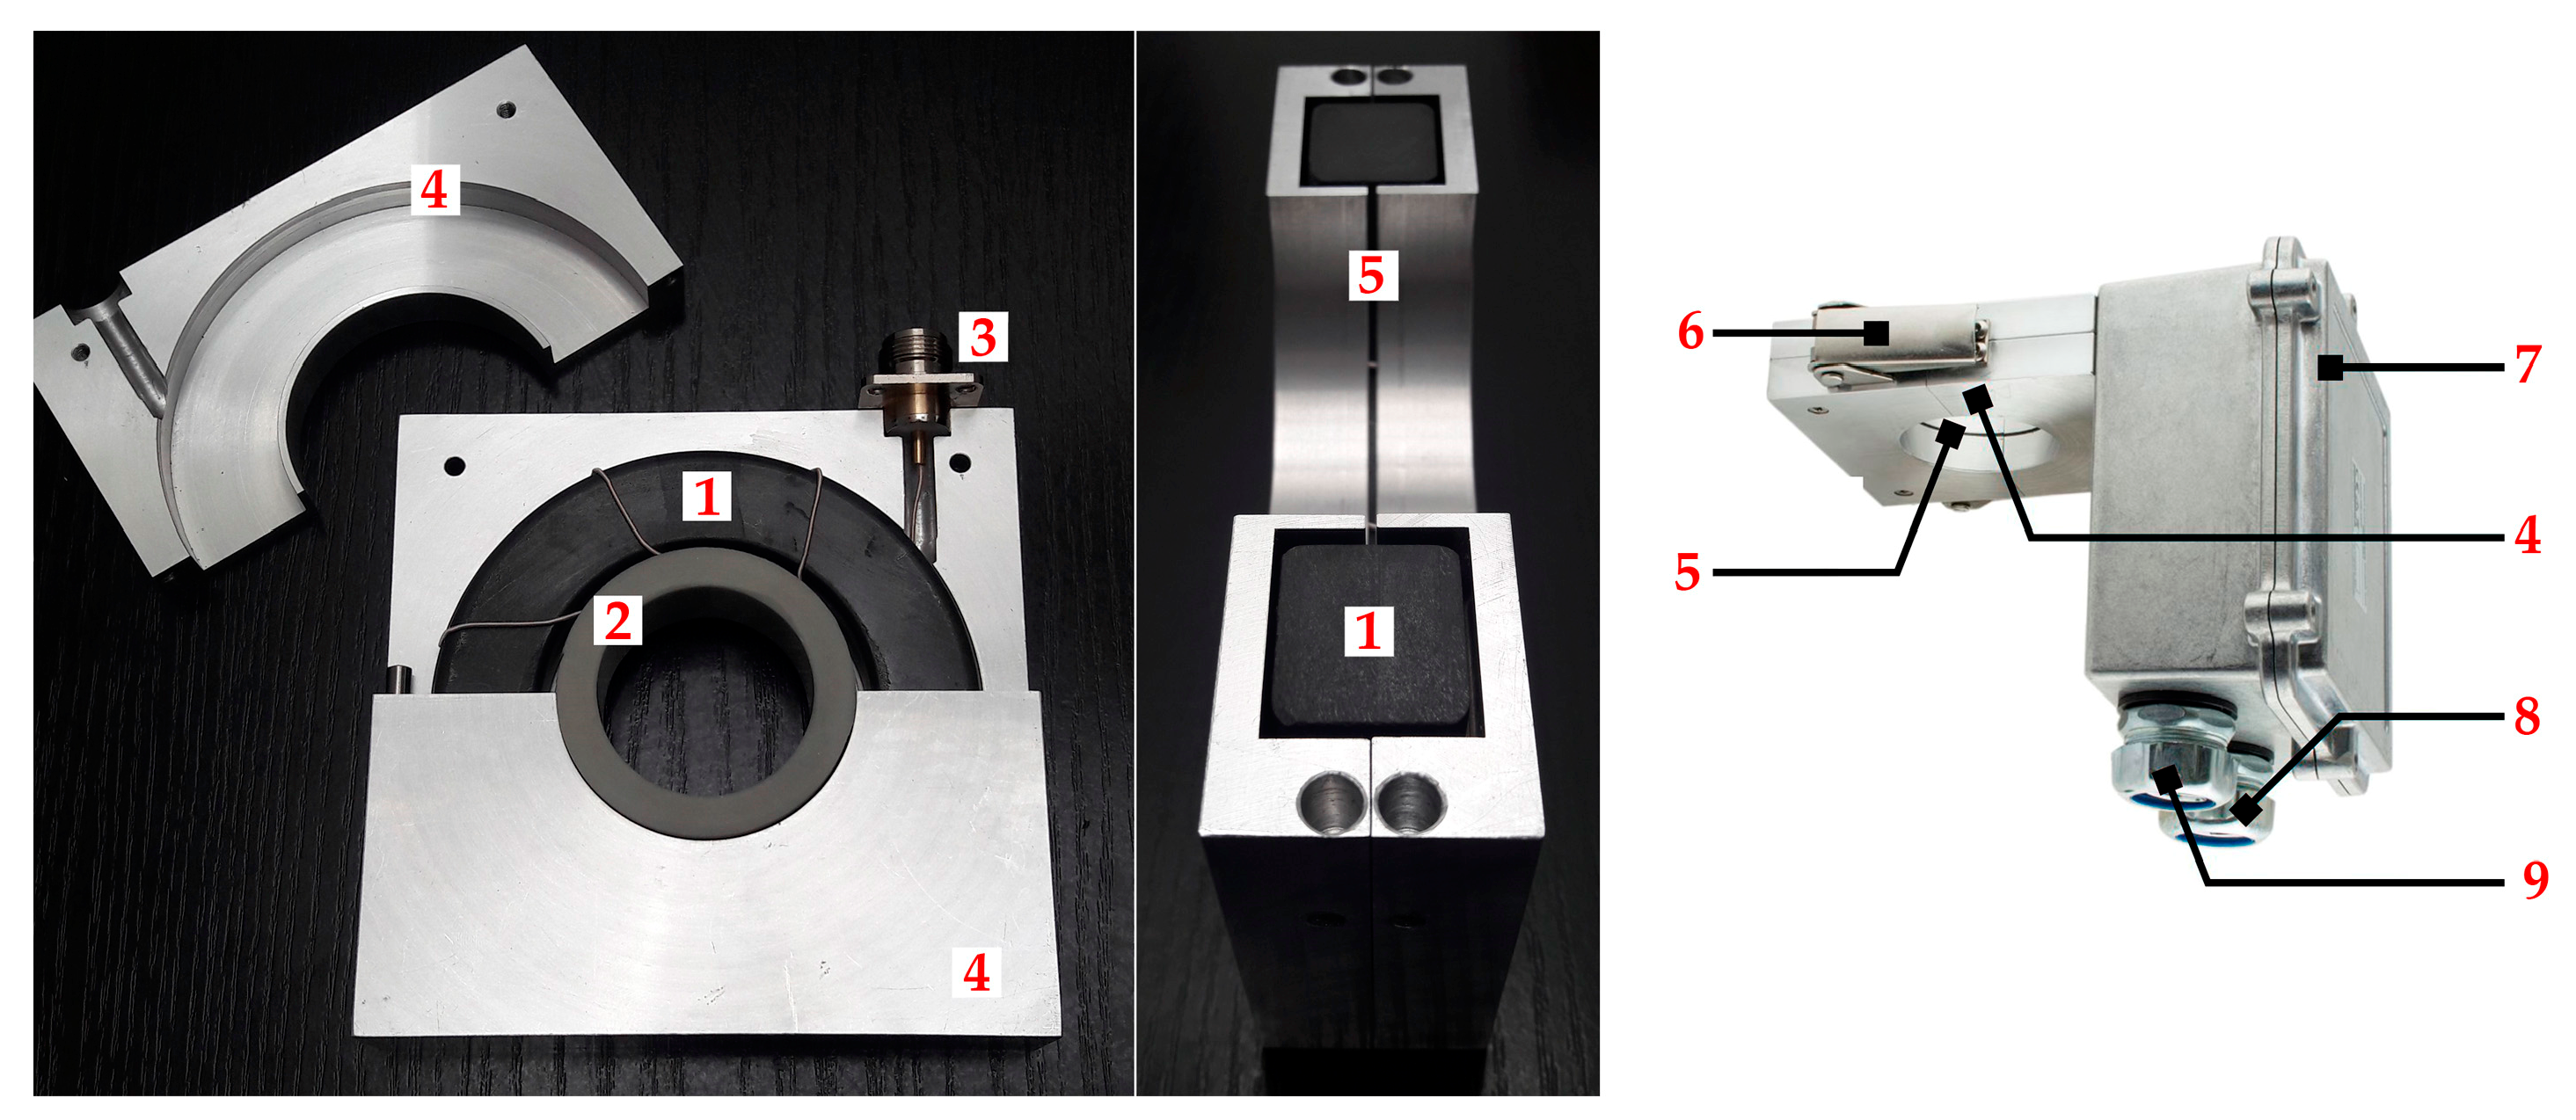
Litz-wire consists of 920 strands insulated electrically from each other, wherein a diameter of a single wire is 0.016 mm (AWG54). The cores were split in half using a diamond cutting disc. The secondary winding with a counter-wound compensation turn was applied to one of the core halves. To reduce the stray capacitance (or more precisely, the turn-to-turn capacitances), the distance between individual turns was maximized. The enclosure of HFCT sensor was made from aluminum with a thickness of 2 mm to attenuate radiofrequency electromagnetic interferences and improved performance in an electrically noisy substation environment. It was equipped with a 1 mm slit for better magnetic coupling between primary and secondary winding [
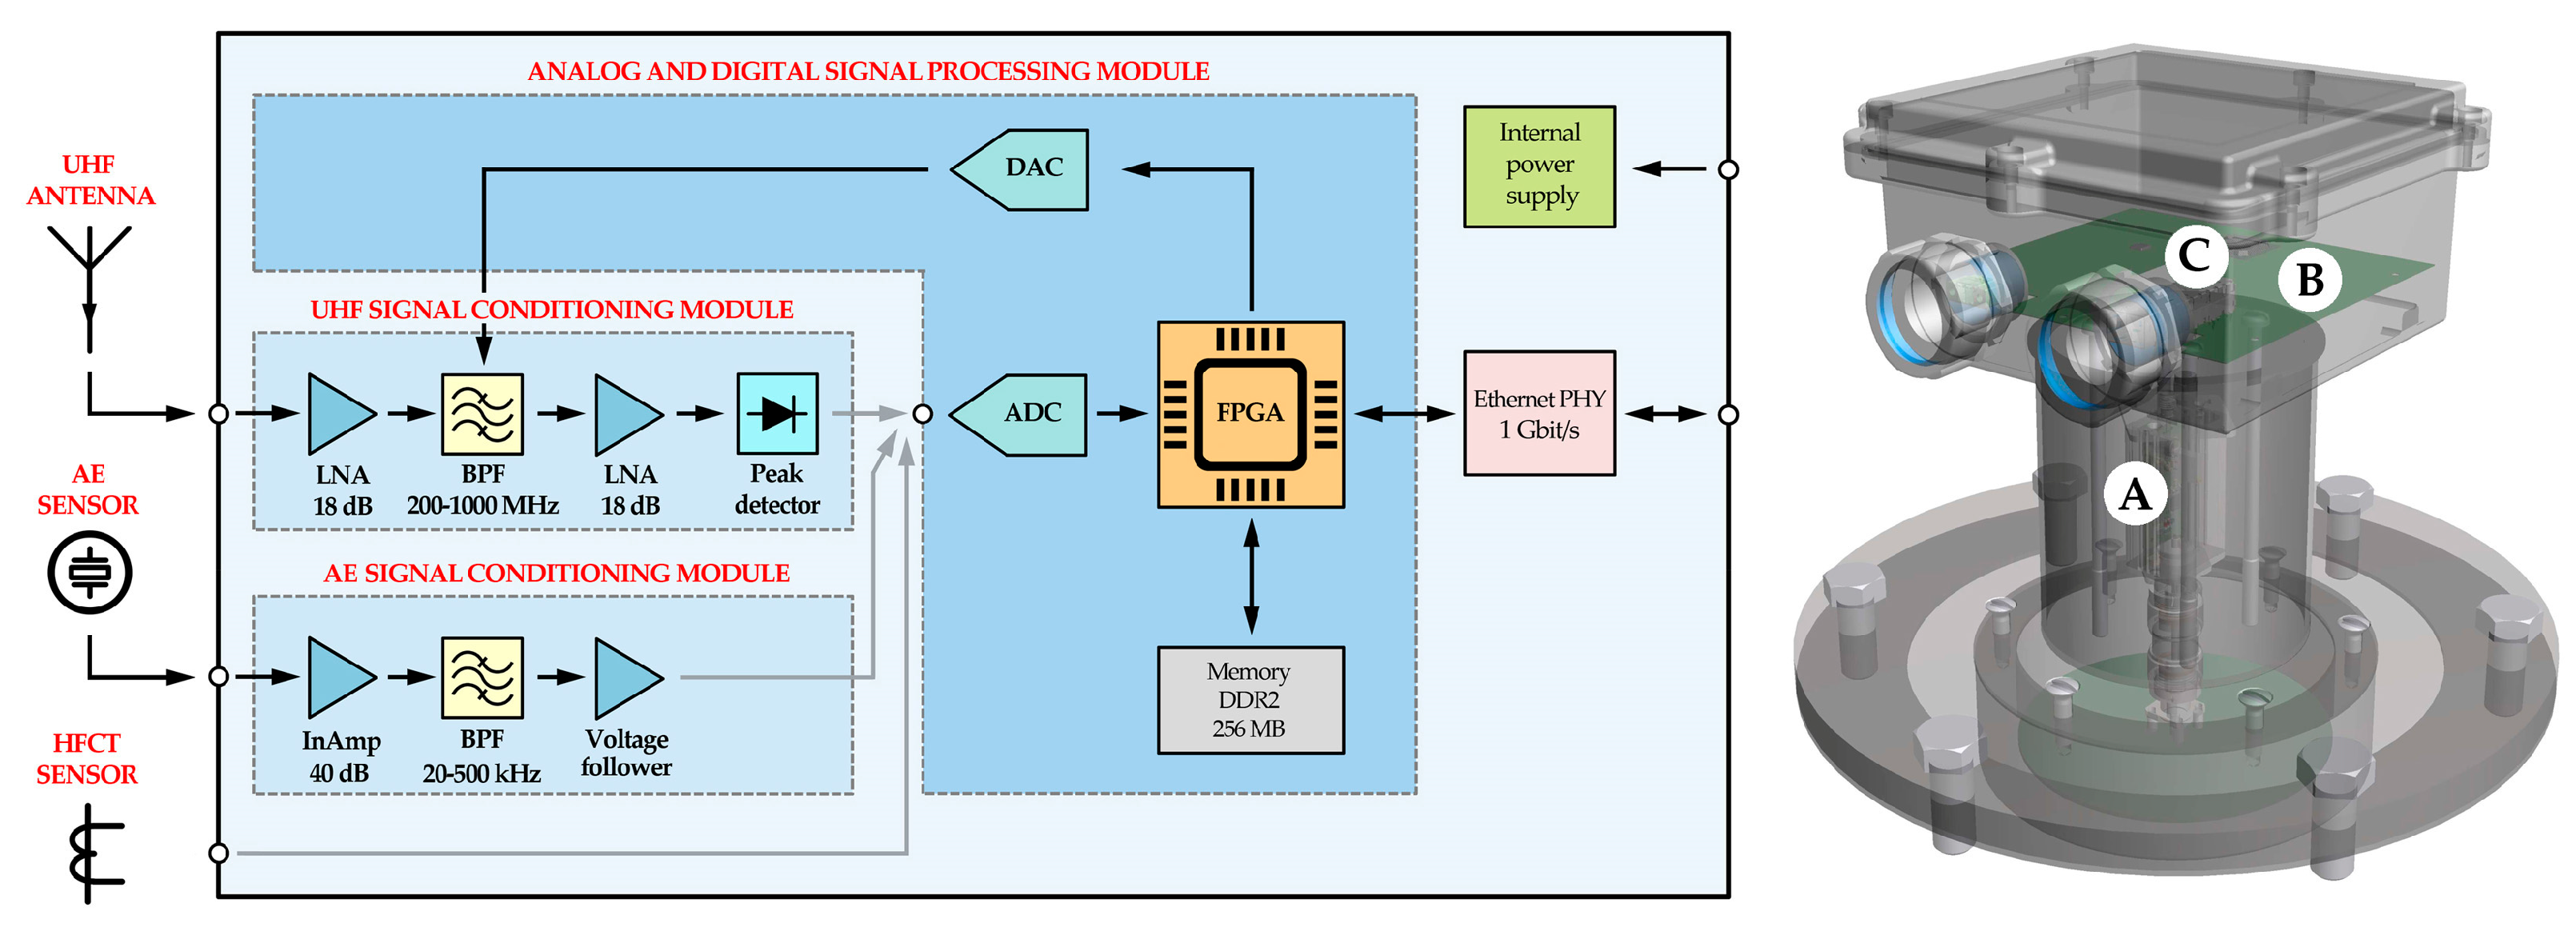
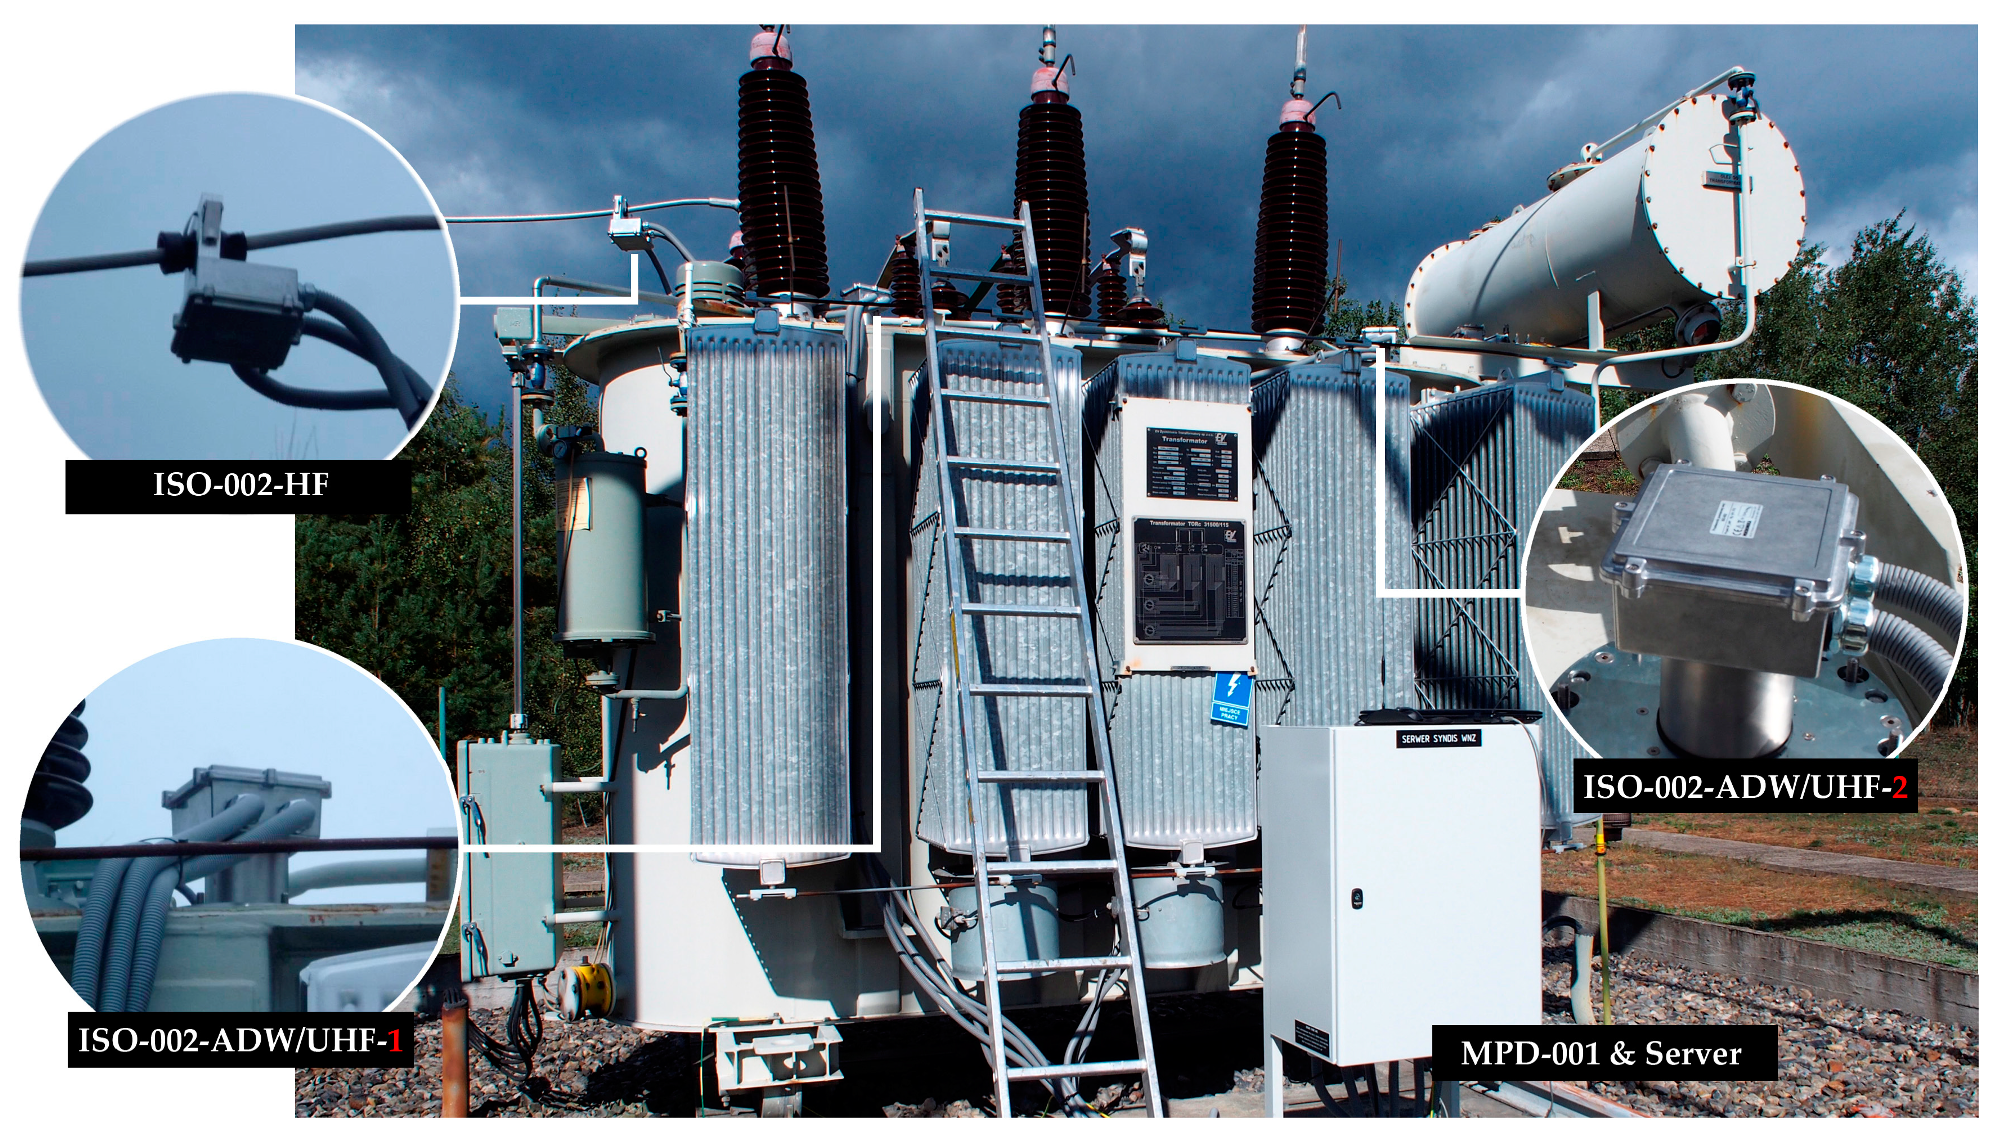
97]. The sensor HFCT housing and the housing of the conditioning and A/D processing module were integrated and jointly are a complete sensor ISO-002-HF with the function of fiber optic signal transmission (Figure 13).
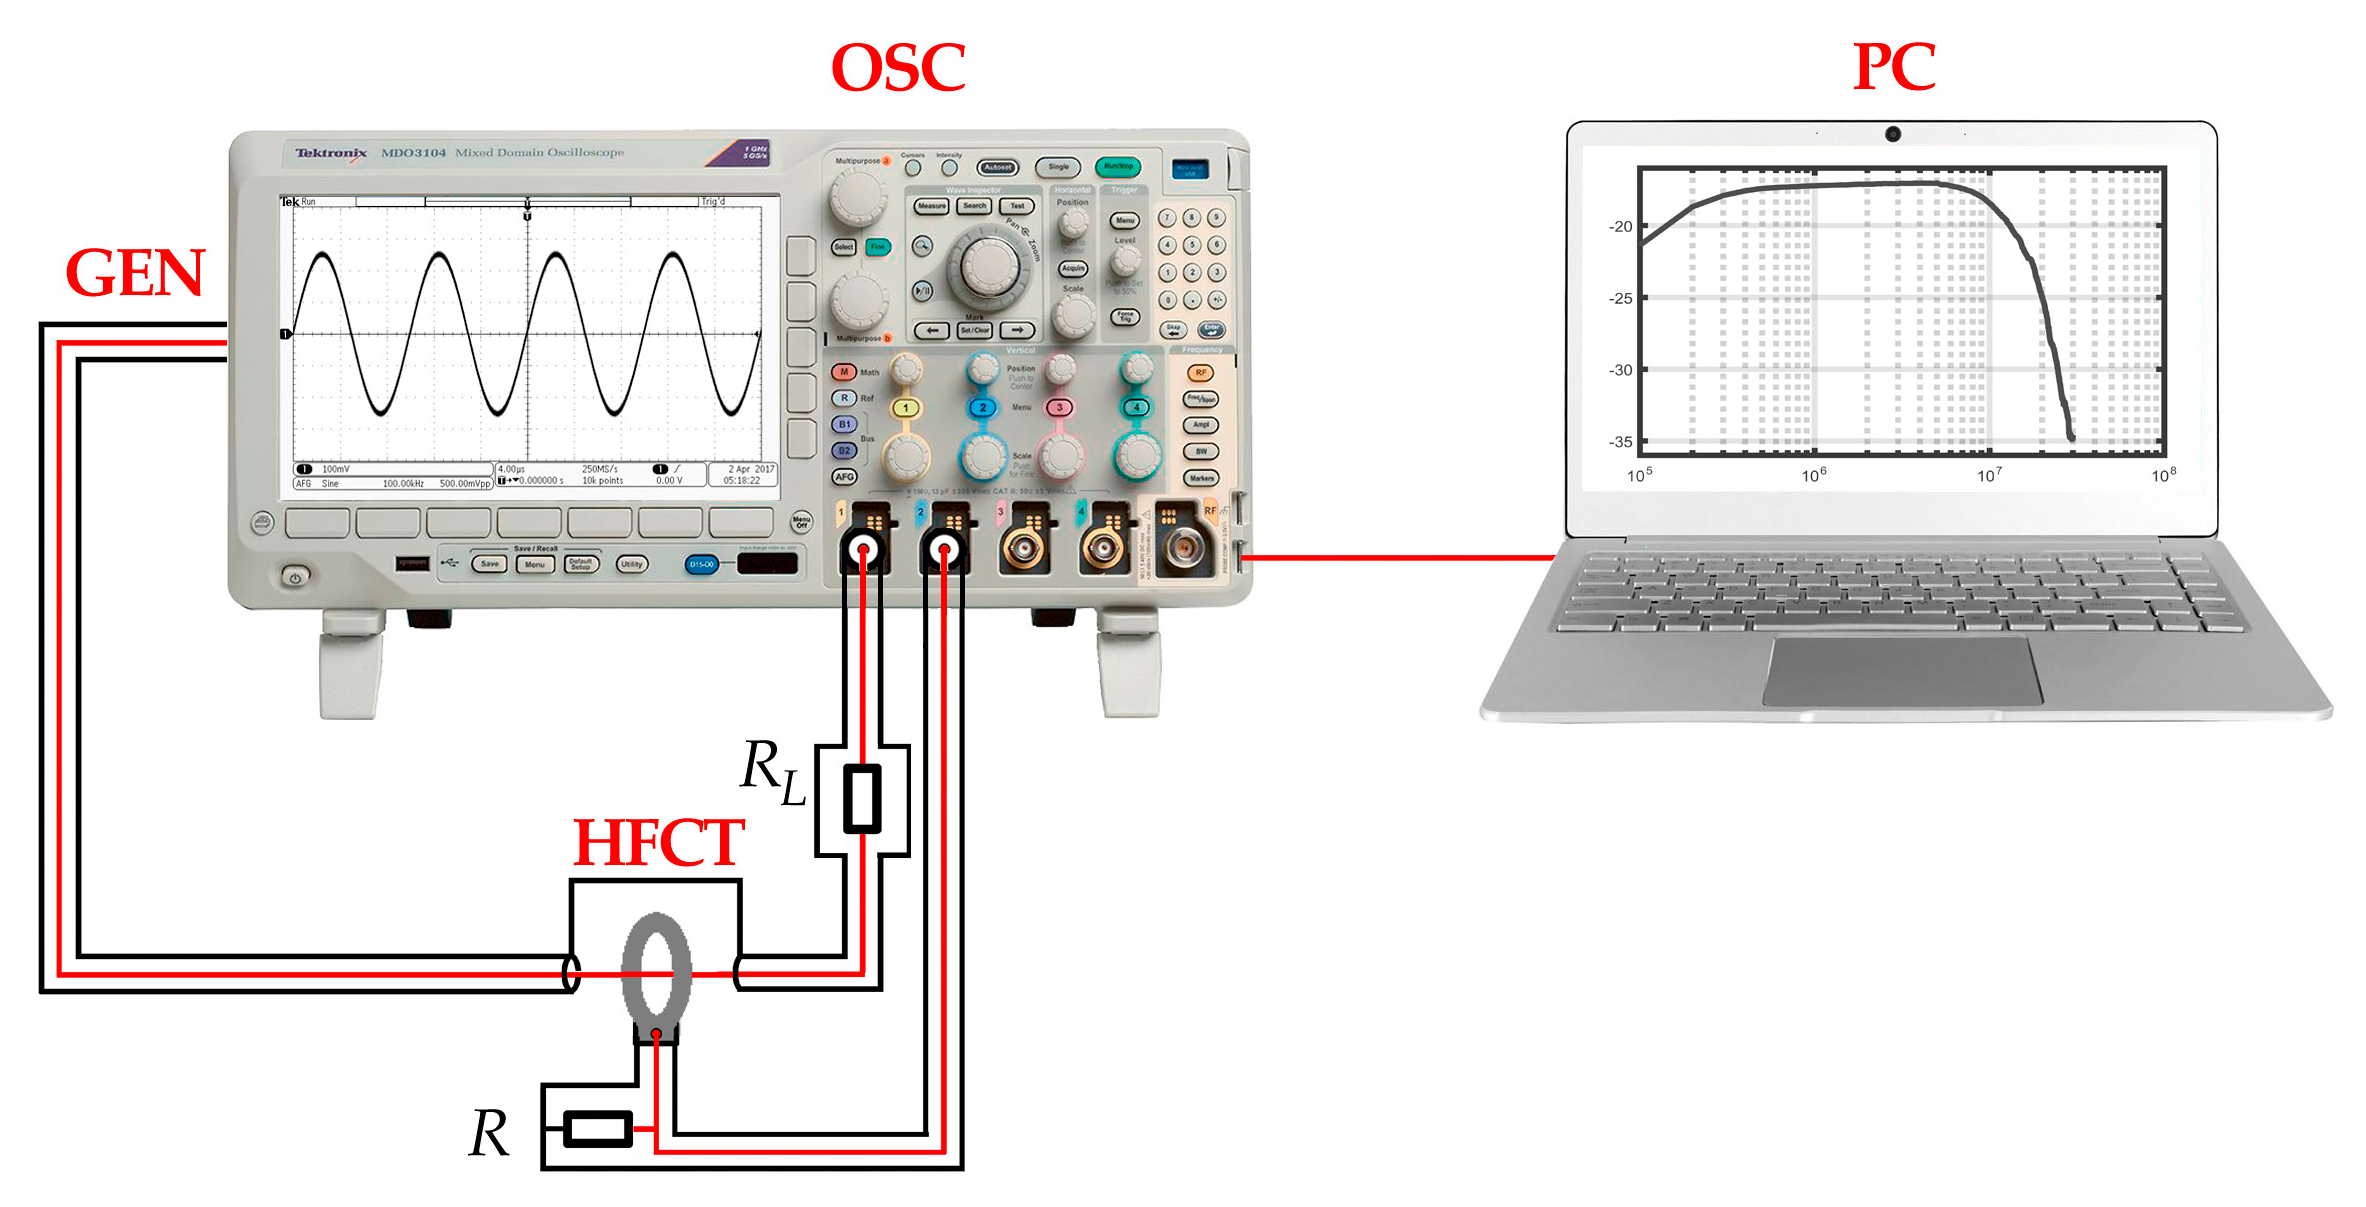
The investigation on the influence of the number of turns N and material of the used core on the frequency response of the prototype HFCT sensors was performed using the measurement setup presented in Figure 14. The measurement setup consisted of the oscilloscope Tektronix MDO 3104 with the sampling frequency of 5 GS/s, 1 GHz bandwidth, and built-in signal generator. The sinusoidal signal was generated in the frequency range from 100 kHz to 30 MHz with a step frequency of 100 kHz. It allowed to cover the full range of high-frequency (HF) band, i.e., 3–30 MHz. The current flow in the primary winding was forced by using a 50 Ω noninductive resistor RL in series. The same resistor was connected in parallel with the secondary winding of the HFCT sensor.
The measurement of the frequency response was automatically realized by the application implemented in LabVIEW environment and launched on a computer connected to the oscilloscope. The individual points of the frequency response curve FRHFCT(f) were calculated as
F R H F C T ( f ) = 20 · log V R ( f ) V GEN ( f ) ,
where VR(f) is the RMS value of voltage measured on the output of the HFCT sensor at frequency f, VGEN(f) is the RMS value of voltage measured on the output of signal generator at frequency f.
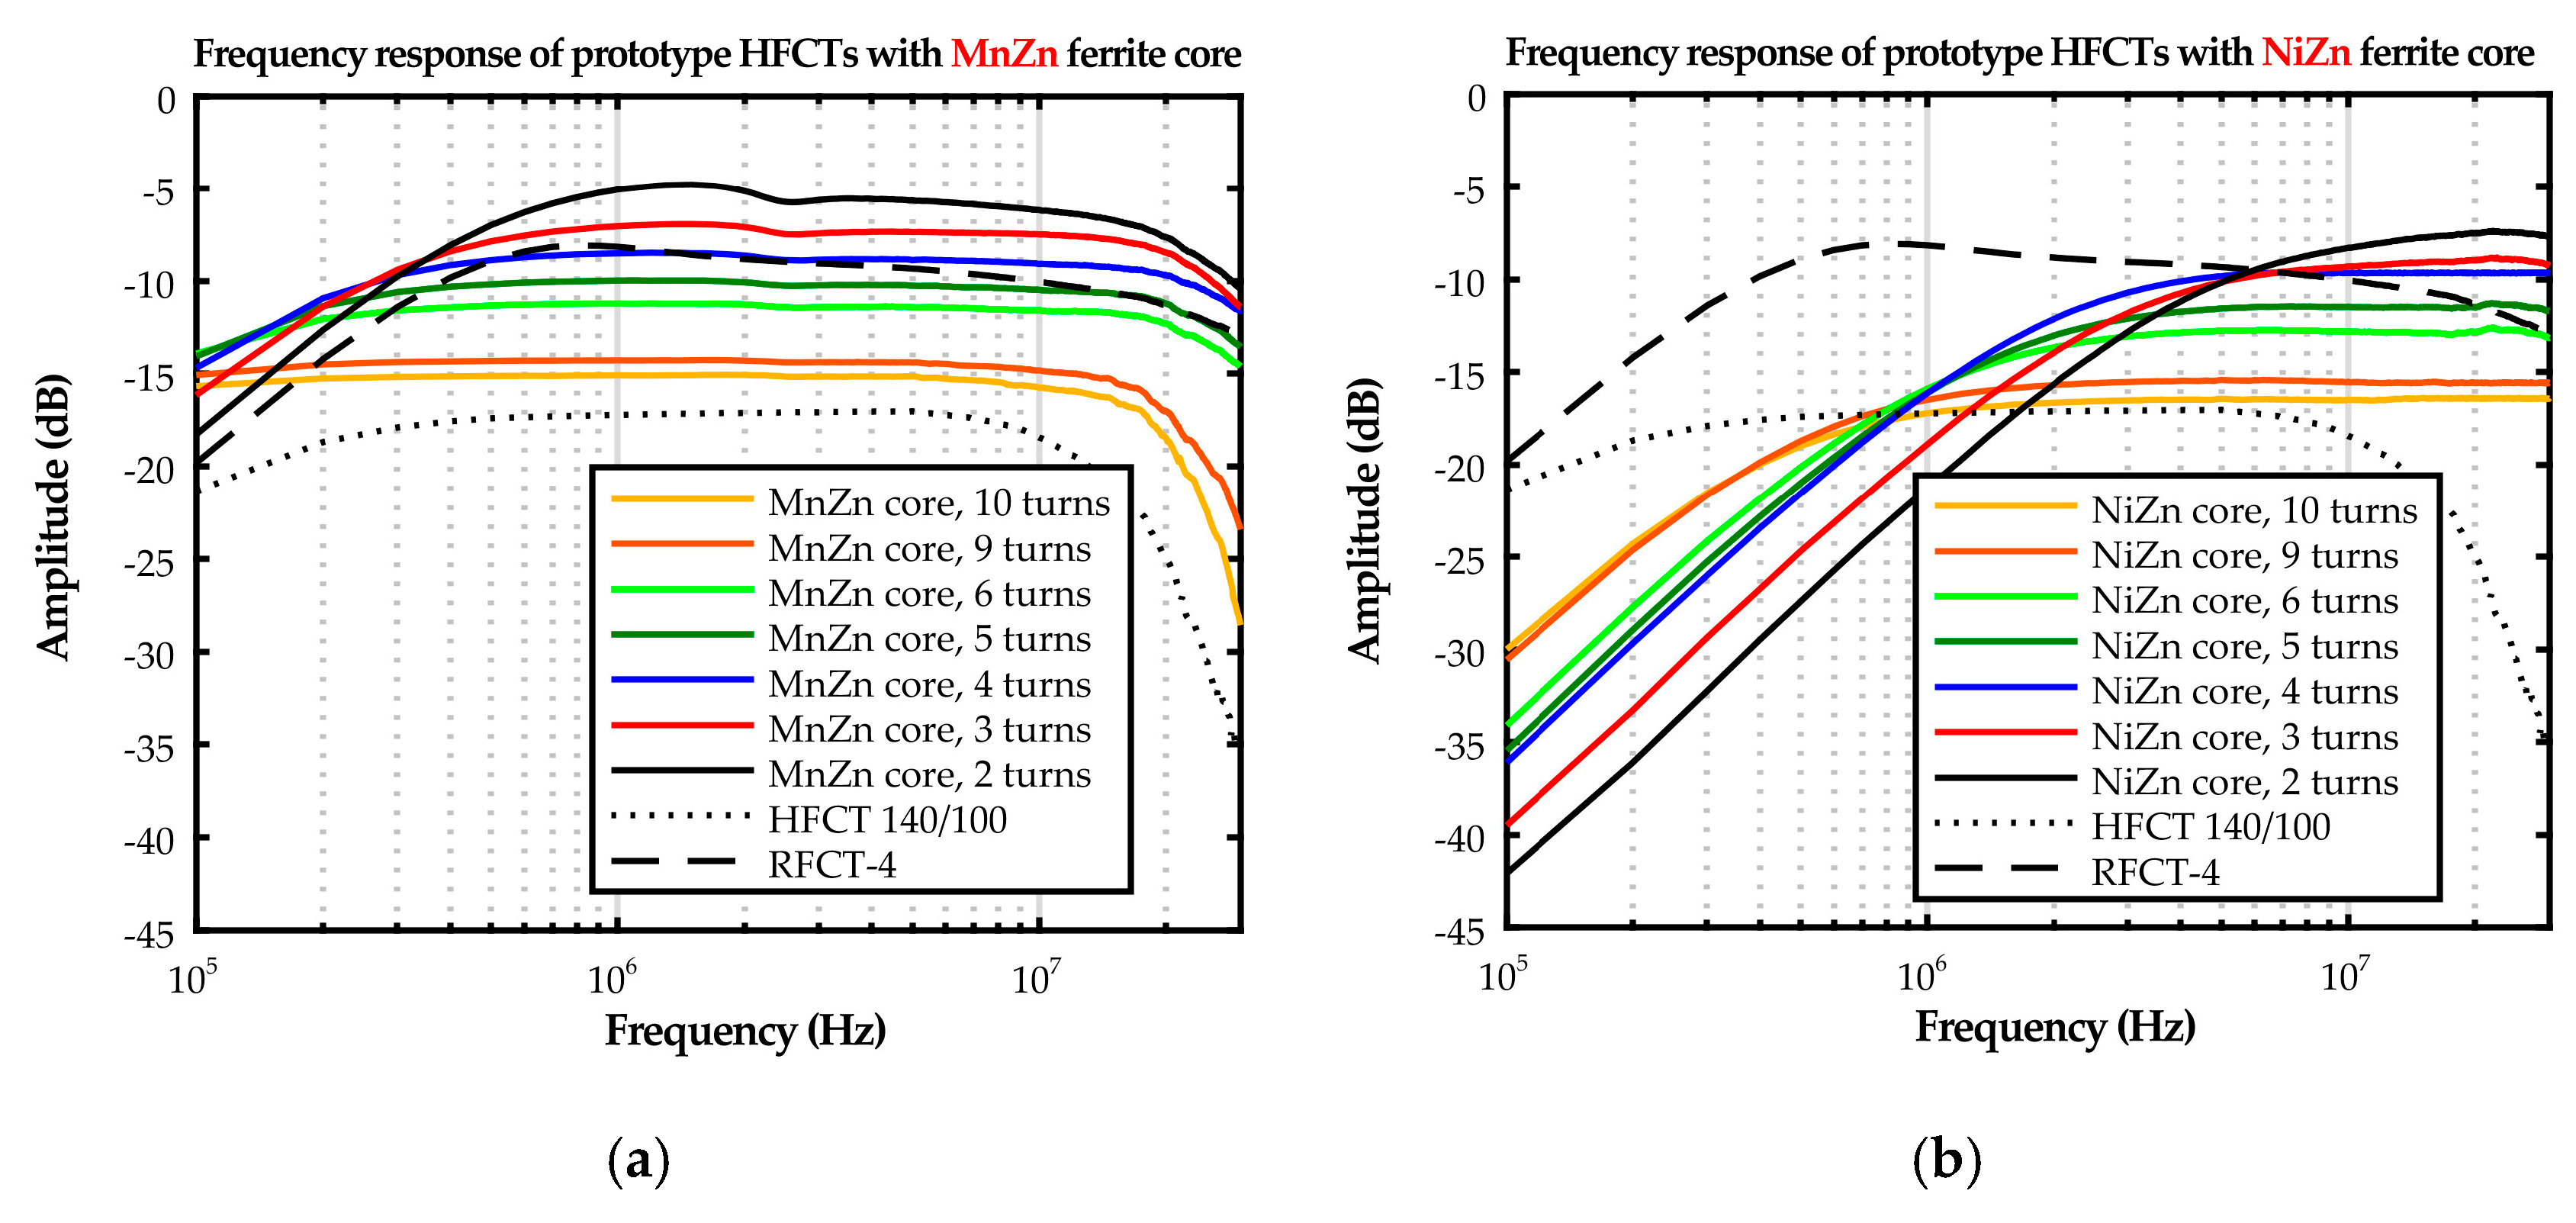
Figure 15 presents the frequency response curves of the prototype HFCT sensors. As one may notice, simultaneously with the increase in the number of turns, the sensor sensitivity decreases. It results from the fact that the values of that parameter depend directly proportional to the load resistance R (which in this case was constant and equal to 50 Ω) and inversely proportional to the number of turns N. Increasing the number of turns raises the magnetizing inductance Lm, which causes the reduction of lower −3 dB cutoff frequency fL of the HFCT sensor. This effect is even more visible for sensors with MnZn soft ferrite core, whose magnetizing inductance is high regarding the high value of permeability µ at low frequencies. For comparison, the value fL for current transformer with MnZn ferrite core and 10 turns is lower than 100 kHz, in turn, for a current transformer with NiZn ferrite core with the same number of turns, fL equals 450 kHz. For a lower number of turns, the differences are even more clear. For instance, fL for HFCT sensor with MnZn ferrite core and N = 3 is also very low and equals 250 kHz. The current transformer of the same construction, but with the ferrite core NiZn, has fL equal to even 3 MHz. It should be emphasized that for the HFCT sensors devoted to PD detection, the more important parameter than the fL is higher −3 dB cutoff frequency fH, since the discharges in oil-paper insulation emit high-frequency waves mainly in the range between approx. 2 and 20 MHz [98]. In this case, it is more favorable to apply a lower number of turns. It allows to obtain high sensitivity S of the HFCT sensor and high value of the parameter fH, which improves the performance of the sensor in the range of higher frequencies (> 1 MHz). One may notice in Figure 14, that the positive effect resulting from reduction of the number of turns is more for sensors with the core made from NiZn soft ferrite since permeability µ of the applied material is a practically constant value in the wide range between 1 MHz and approx. 50 MHz.
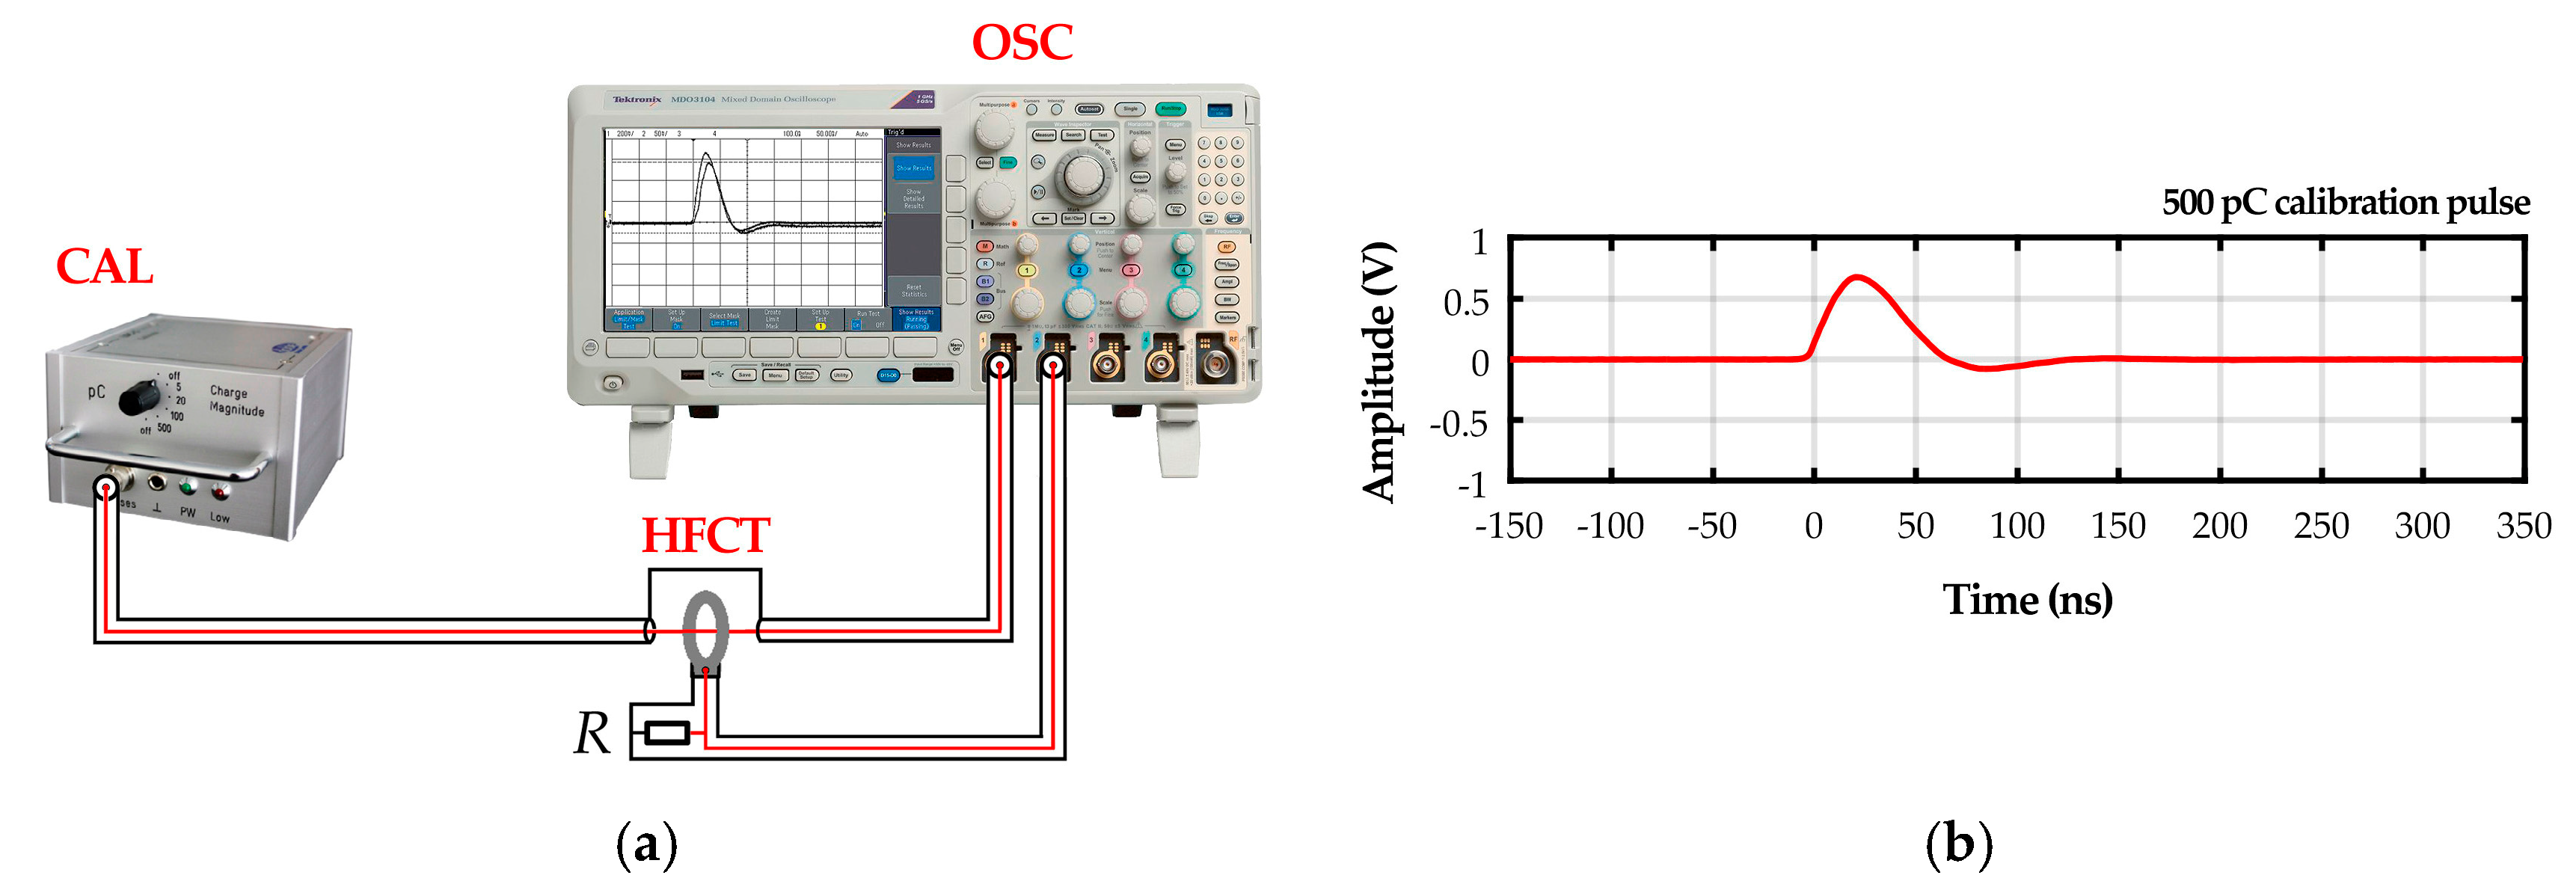
Based on the analysis of the measured frequency response curves, for further research, the two prototype HFCT sensors were selected. The first of the chosen sensors was manufactured from ferrite core MnZn with the three-turn secondary winding. The main advantages of that construction are a very high sensitivity (higher than popular commercial sensors), wide bandwidth (250 kHz–25.5 MHz), and relatively flat frequency response curve. The second from the selected constructions was built from ferrite core NiZn with four turns. It is characterized by slightly lower sensitivity (≤ 2.67 dB) than the transformer with MnZn core, but its frequency response curve is almost ideally flat in a wide band between 1.8 and 30 MHz. In the first stage of the laboratory tests, measurements of the impulse response of the selected prototype HFCT sensors were conducted. For this purpose, a standard LDC-5 PD calibrator (dDoble Engineering Company, Marlborough, USA) was used, which allowed to inject pulses with an apparent charge of 500 pC and duration of 50 ns into the primary circuit. The waveforms of the calibration pulses induced in the secondary circuit of the HFCT sensor were registered using an oscilloscope (Figure 16).
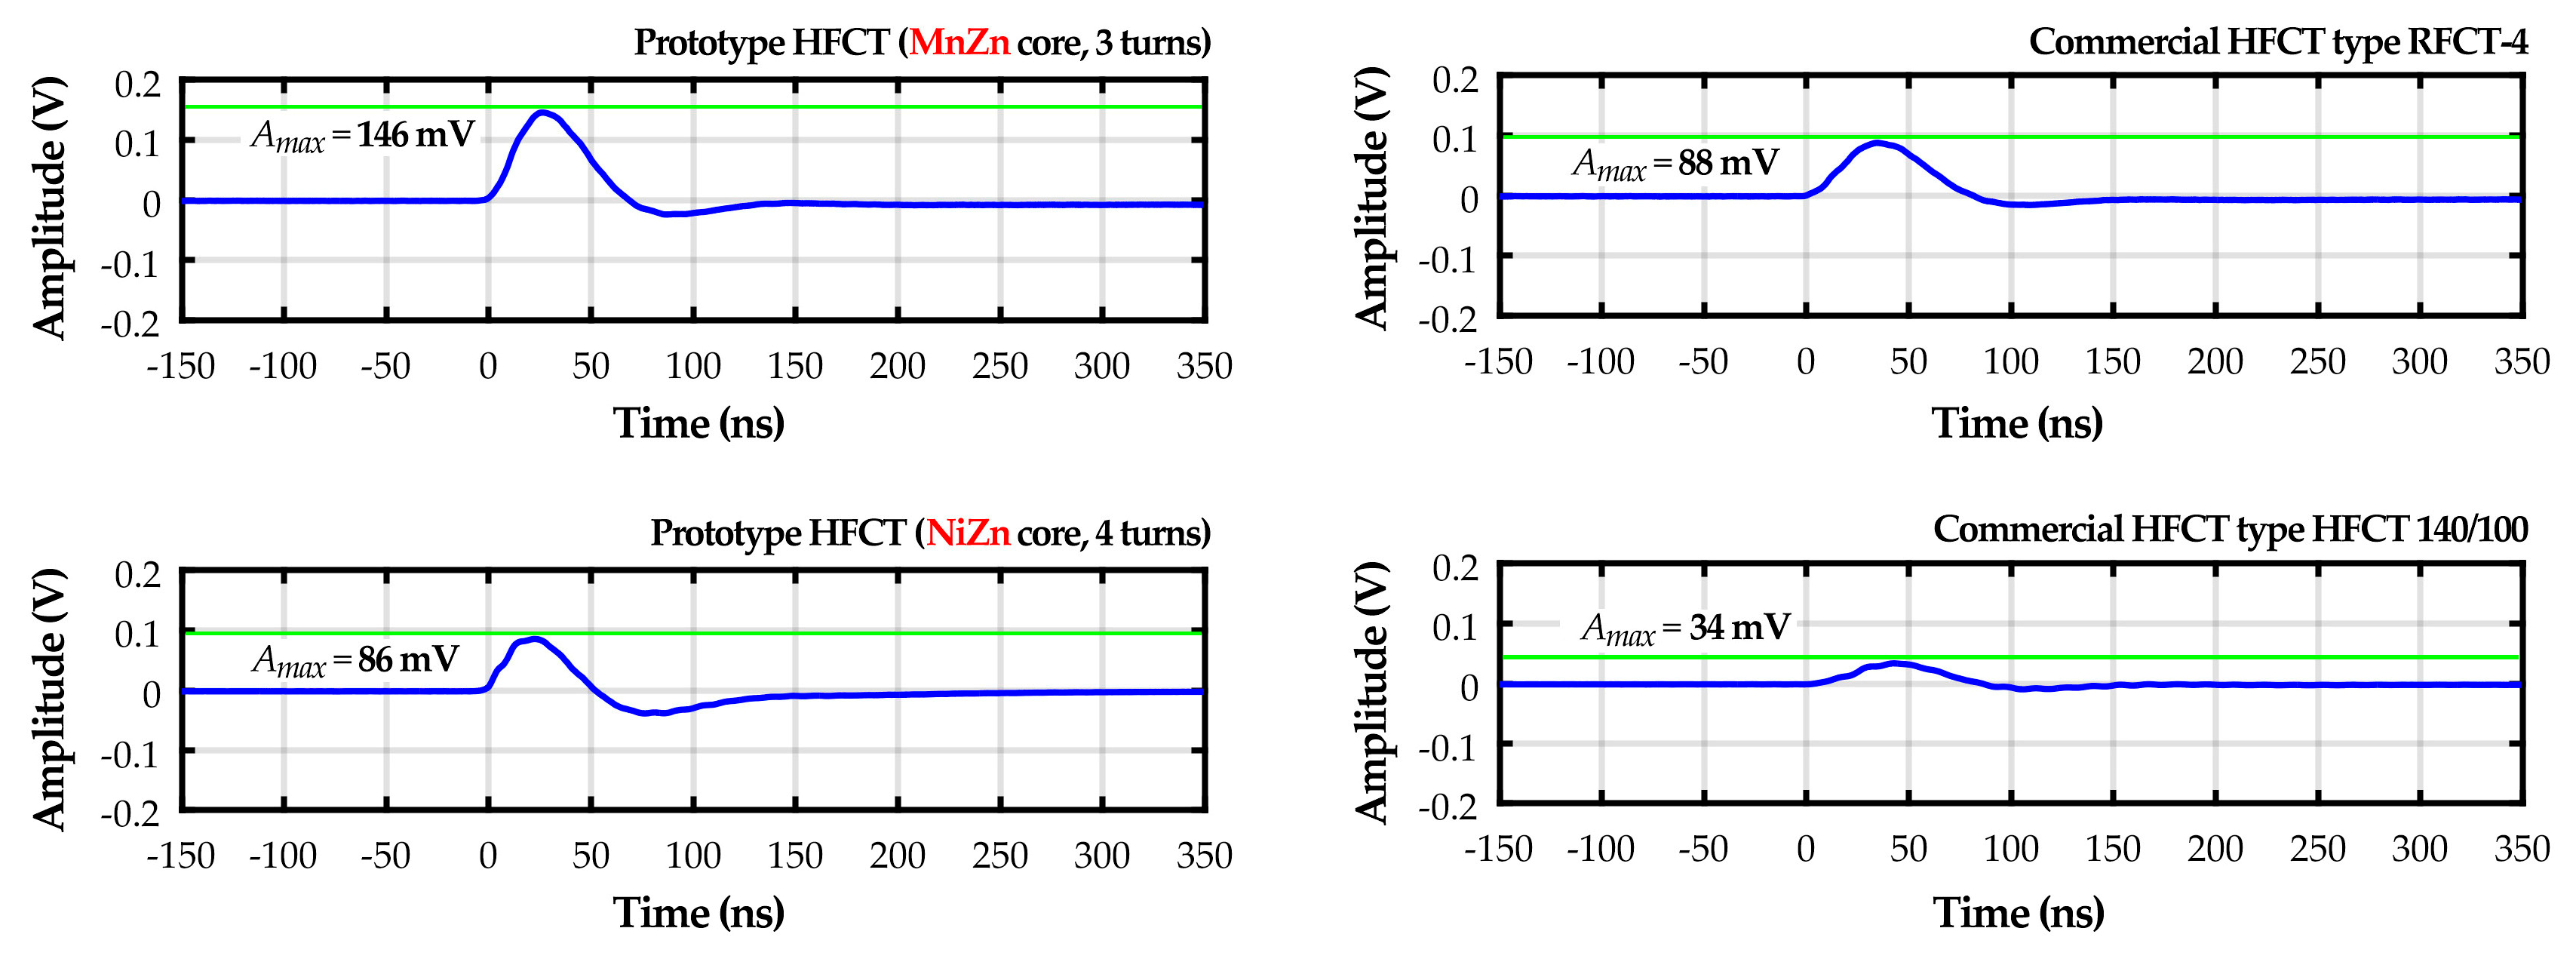
Figure 17 shows the recorded waveforms of the impulse response of the tested HFCT sensors. The highest detection sensitivity of the pulse of apparent charge 500 pC was shown by the prototype current transformer made from MnZn ferrite core with three turns. At the output of this current transformer, the pulses of amplitude Amax = 146 mV were registered, which means that its sensitivity was by about 70% higher than the prototype sensor made from NiZn ferrite core (Amax = 86 mV) and commercial HFCT sensor type RFCT-4 (Amax = 88 mV).
Time parameters of the pulses generated by standard PD calibrator are optimized for the conventional method IEC 60270, in which case the registration of PD pulses is performed in a relatively low frequency band (100–500 kHz). For that reason, the tests with the use of the PD calibrator do not allow unambiguous statement that the prototype HFCT sensor with core MnZn is an optimal construction of the detector of high-frequency PD pulses. Nevertheless, measurements with the use of calibrator showed that due to the lowest lower −3 dB cutoff frequency (fL = 250 kHz) among the tested HFCT sensors, it may be successfully employed both in the standardized frequency range according to IEC 60270 as well as at higher frequencies up to 25.5 MHz.
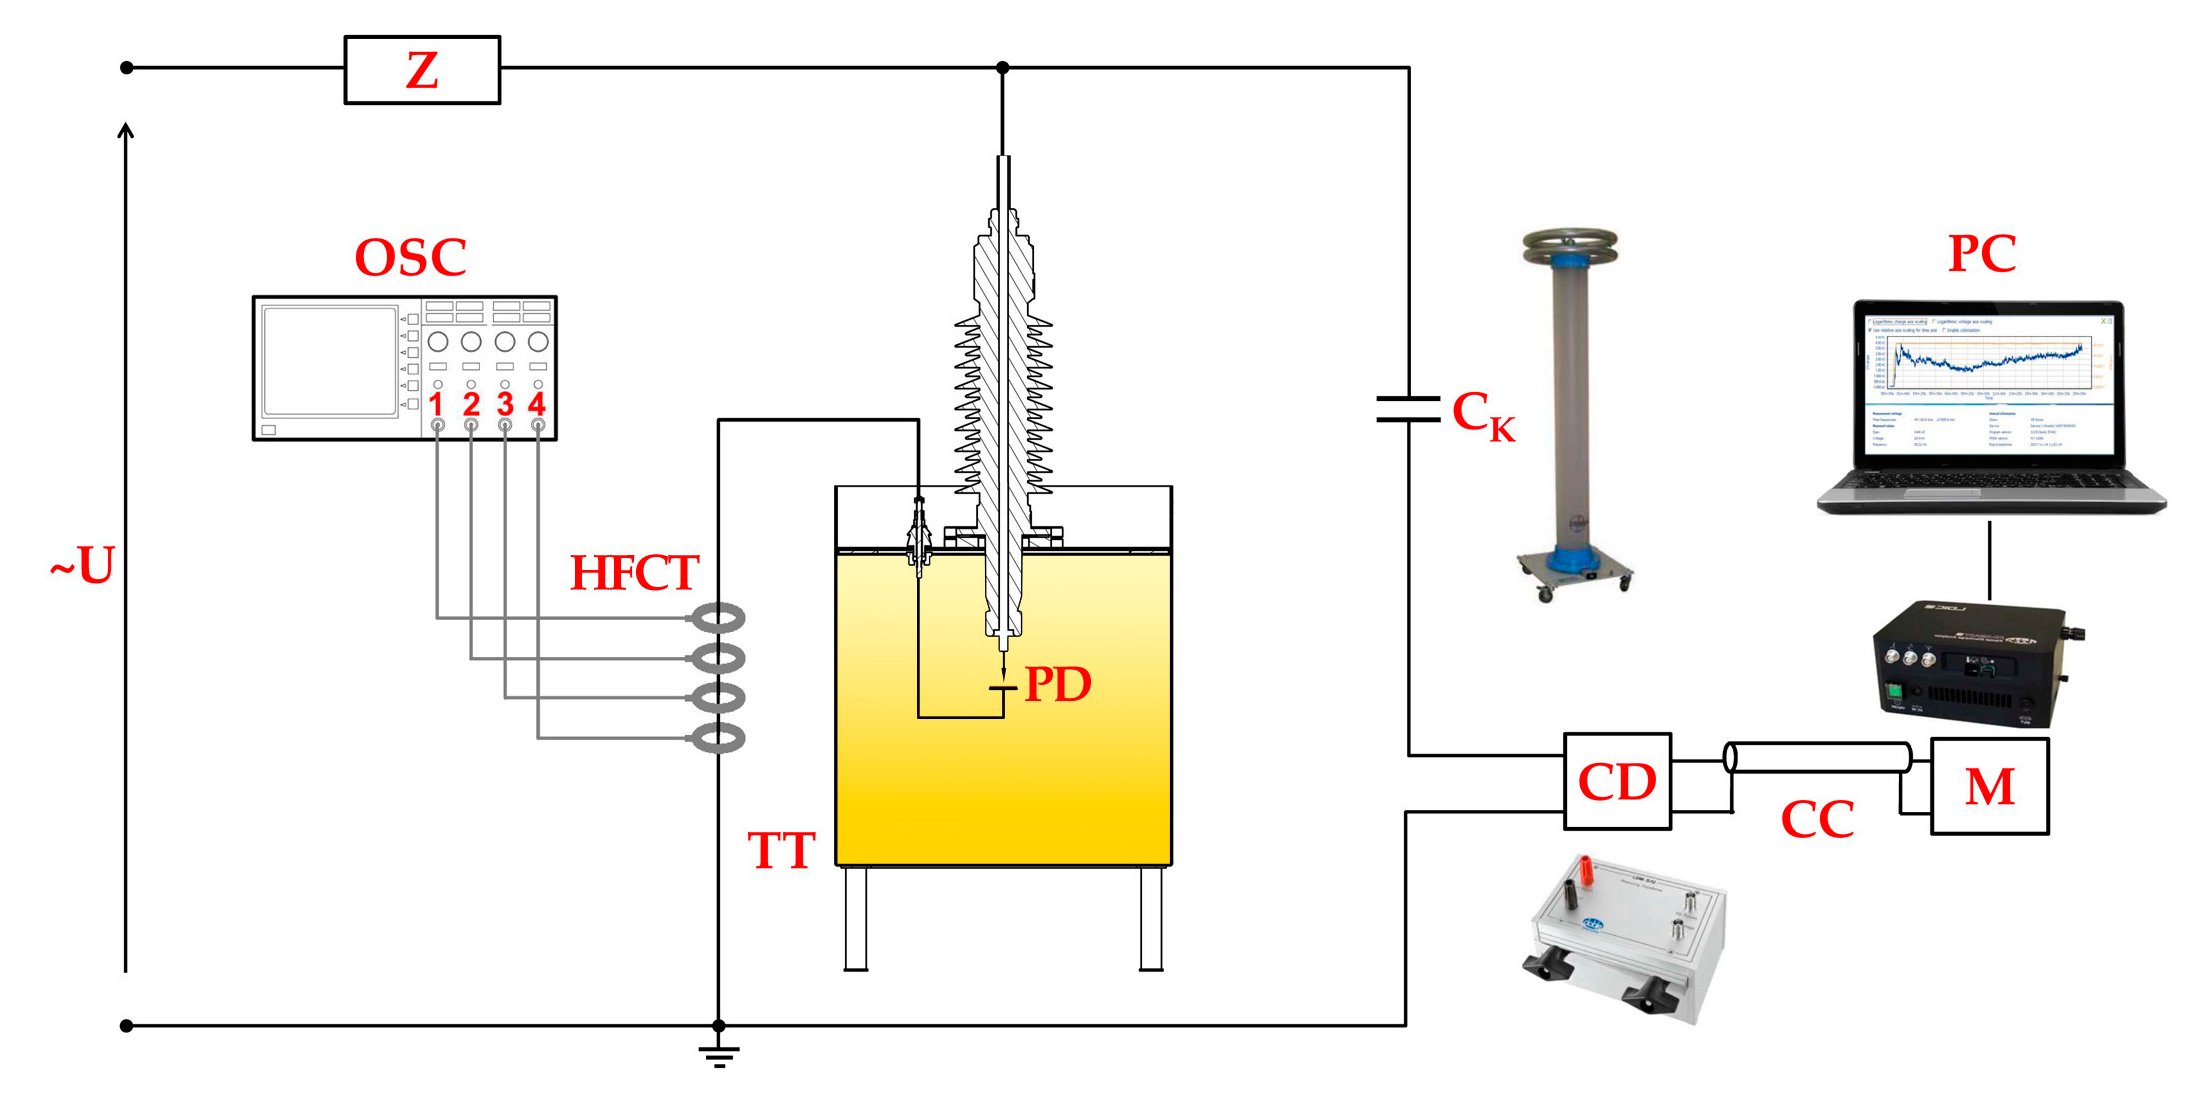
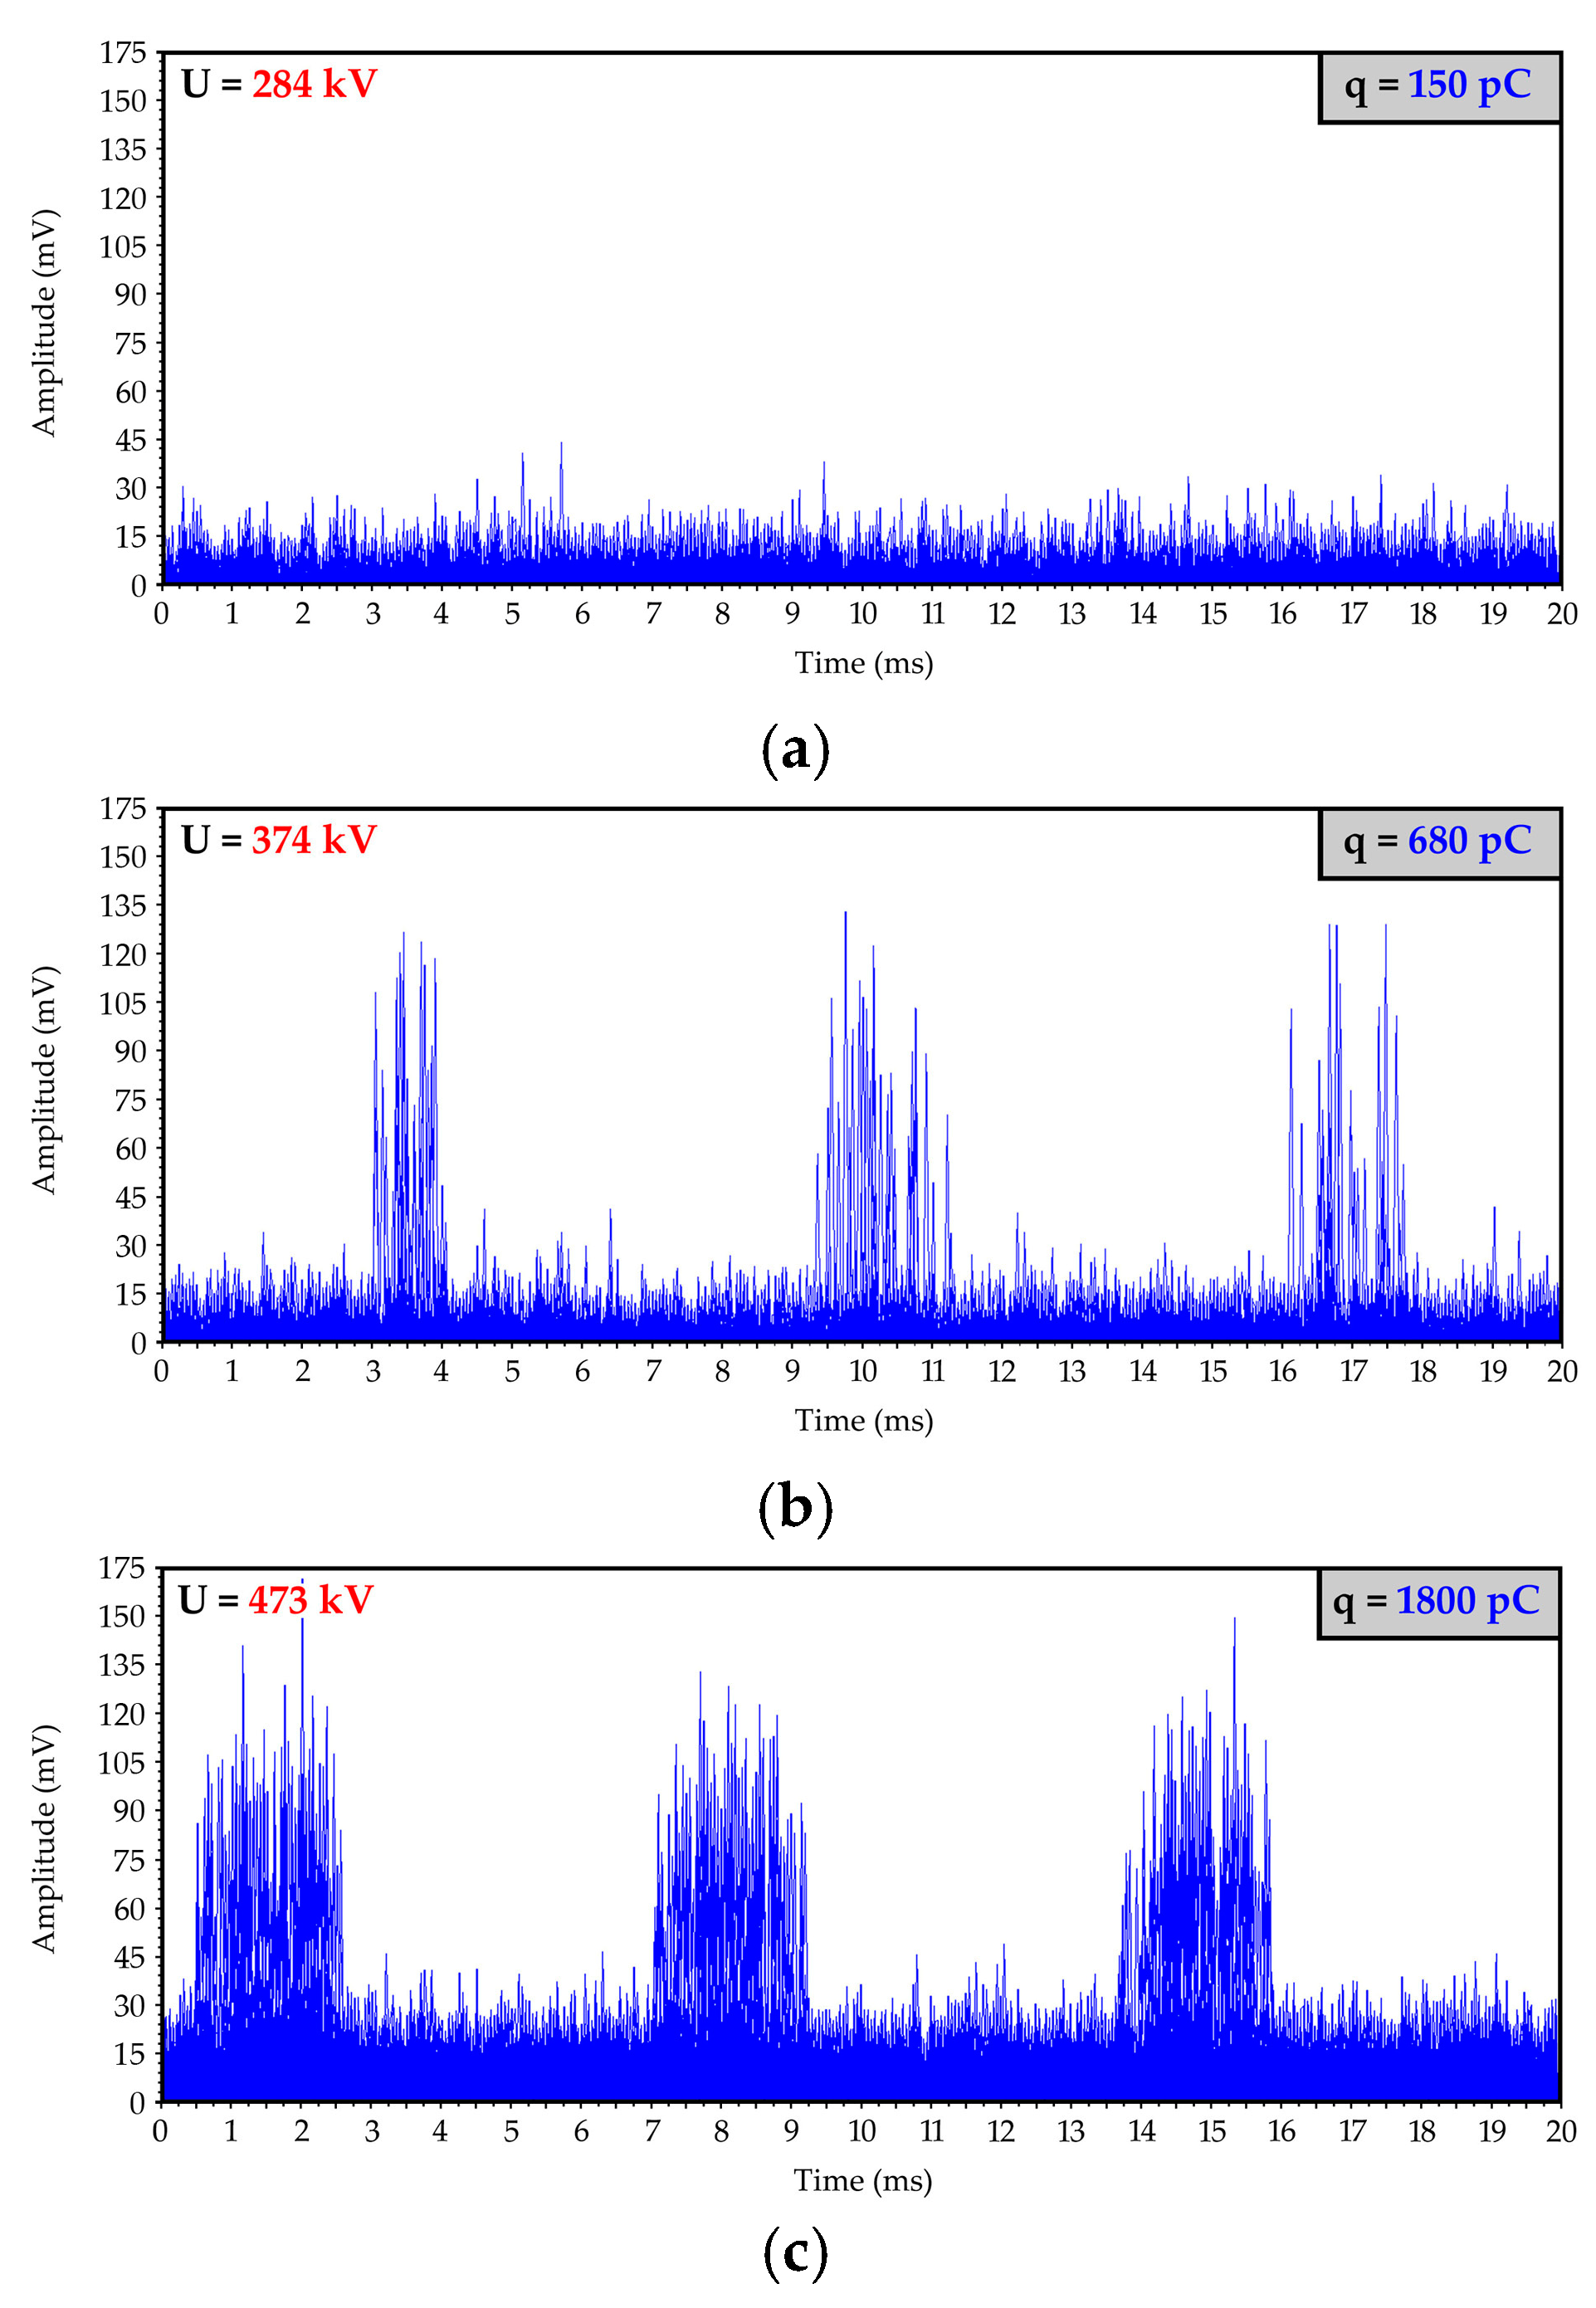
In the second stage of the laboratory research, the detection sensitivity of PD pulses generated in oil-paper insulation was tested, which were simultaneously registered by four HFCT sensors (two prototype and two commercial). The research was conducted with the use of a transformer tank filled with mineral oil. The electrode systems devoted to generating PD in oil and surface PD on the pressboard sample were put inside the tank. Detailed information concerning the geometry of the applied electrode systems was presented in [24]. The HFCT sensors were installed on grounding wire going out of the tank through the ceramic bushing insulator. The PD pulses were registered with the use of a four-channel oscilloscope Tektronix MDO3104 with the sampling frequency of 5 GS/s. Additionally, the standard IEC 60270 measurement setup was applied to control the level of the PD apparent charge (
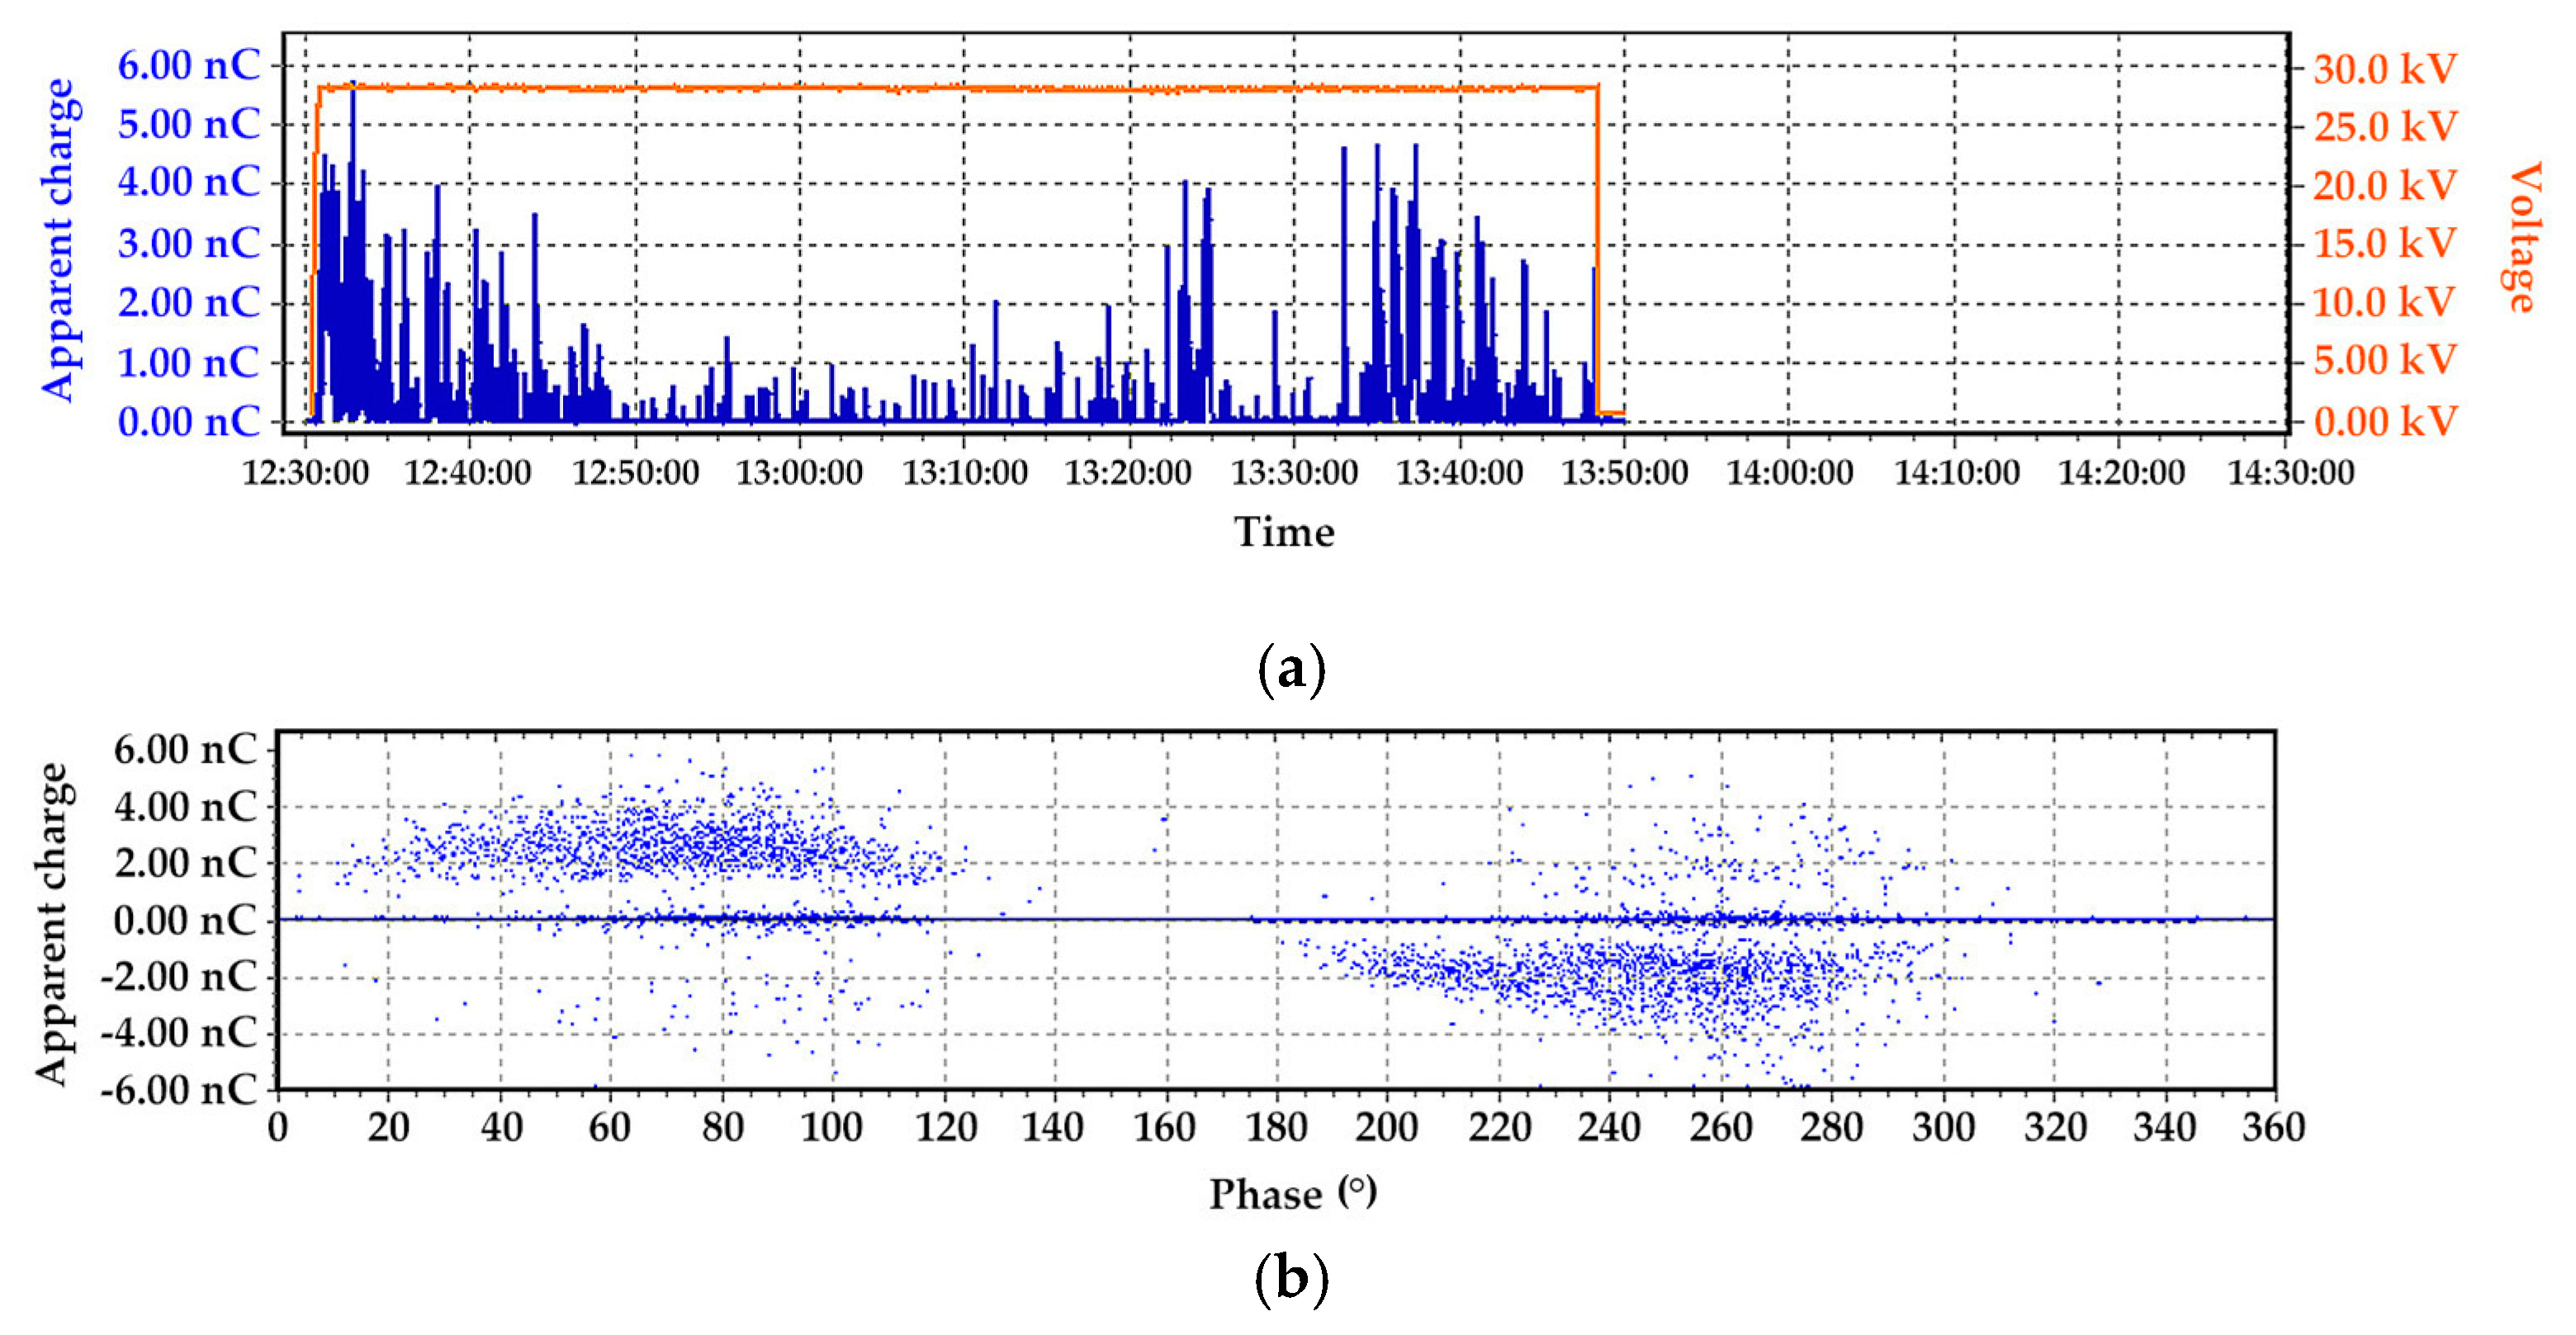
Figure 18). Discharges in oil of apparent charge in the range between about 200 and 850 pC were generated at 29 kV. In turn, the surface discharges had a significantly higher intensity and apparent charge (q = 450–5100 pC). This type of discharge was generated by a voltage of 15.4 kV.
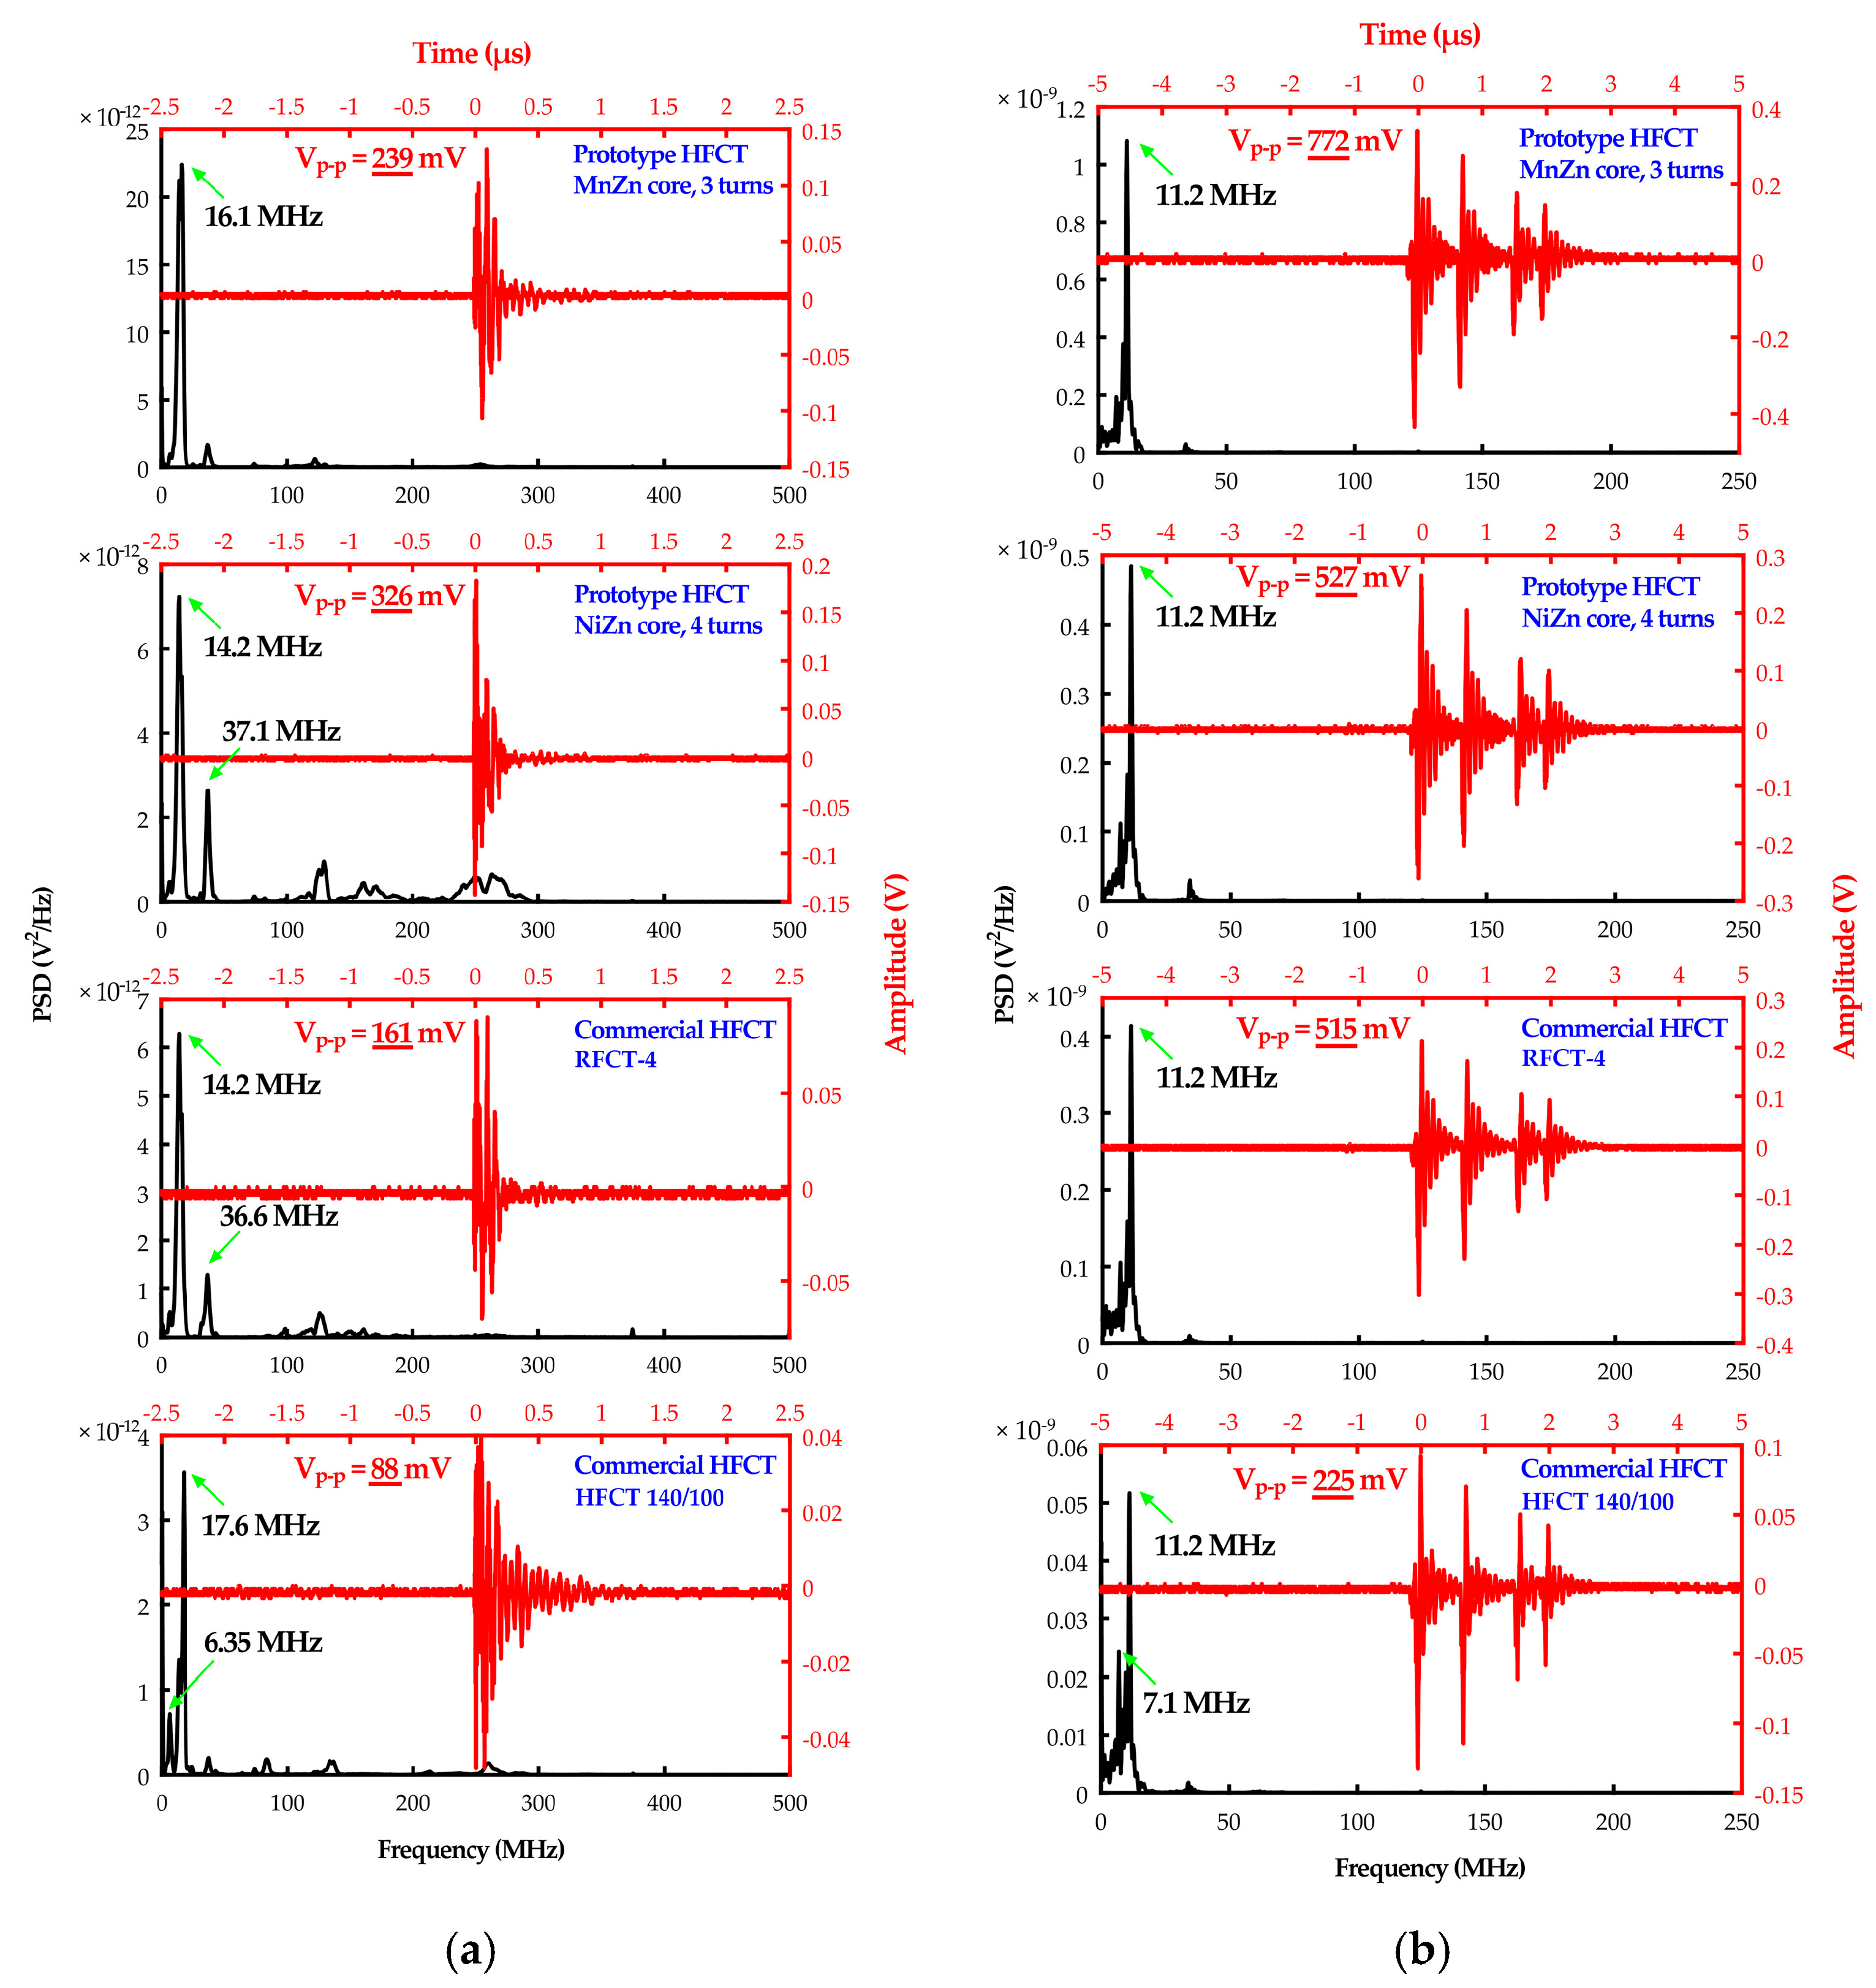
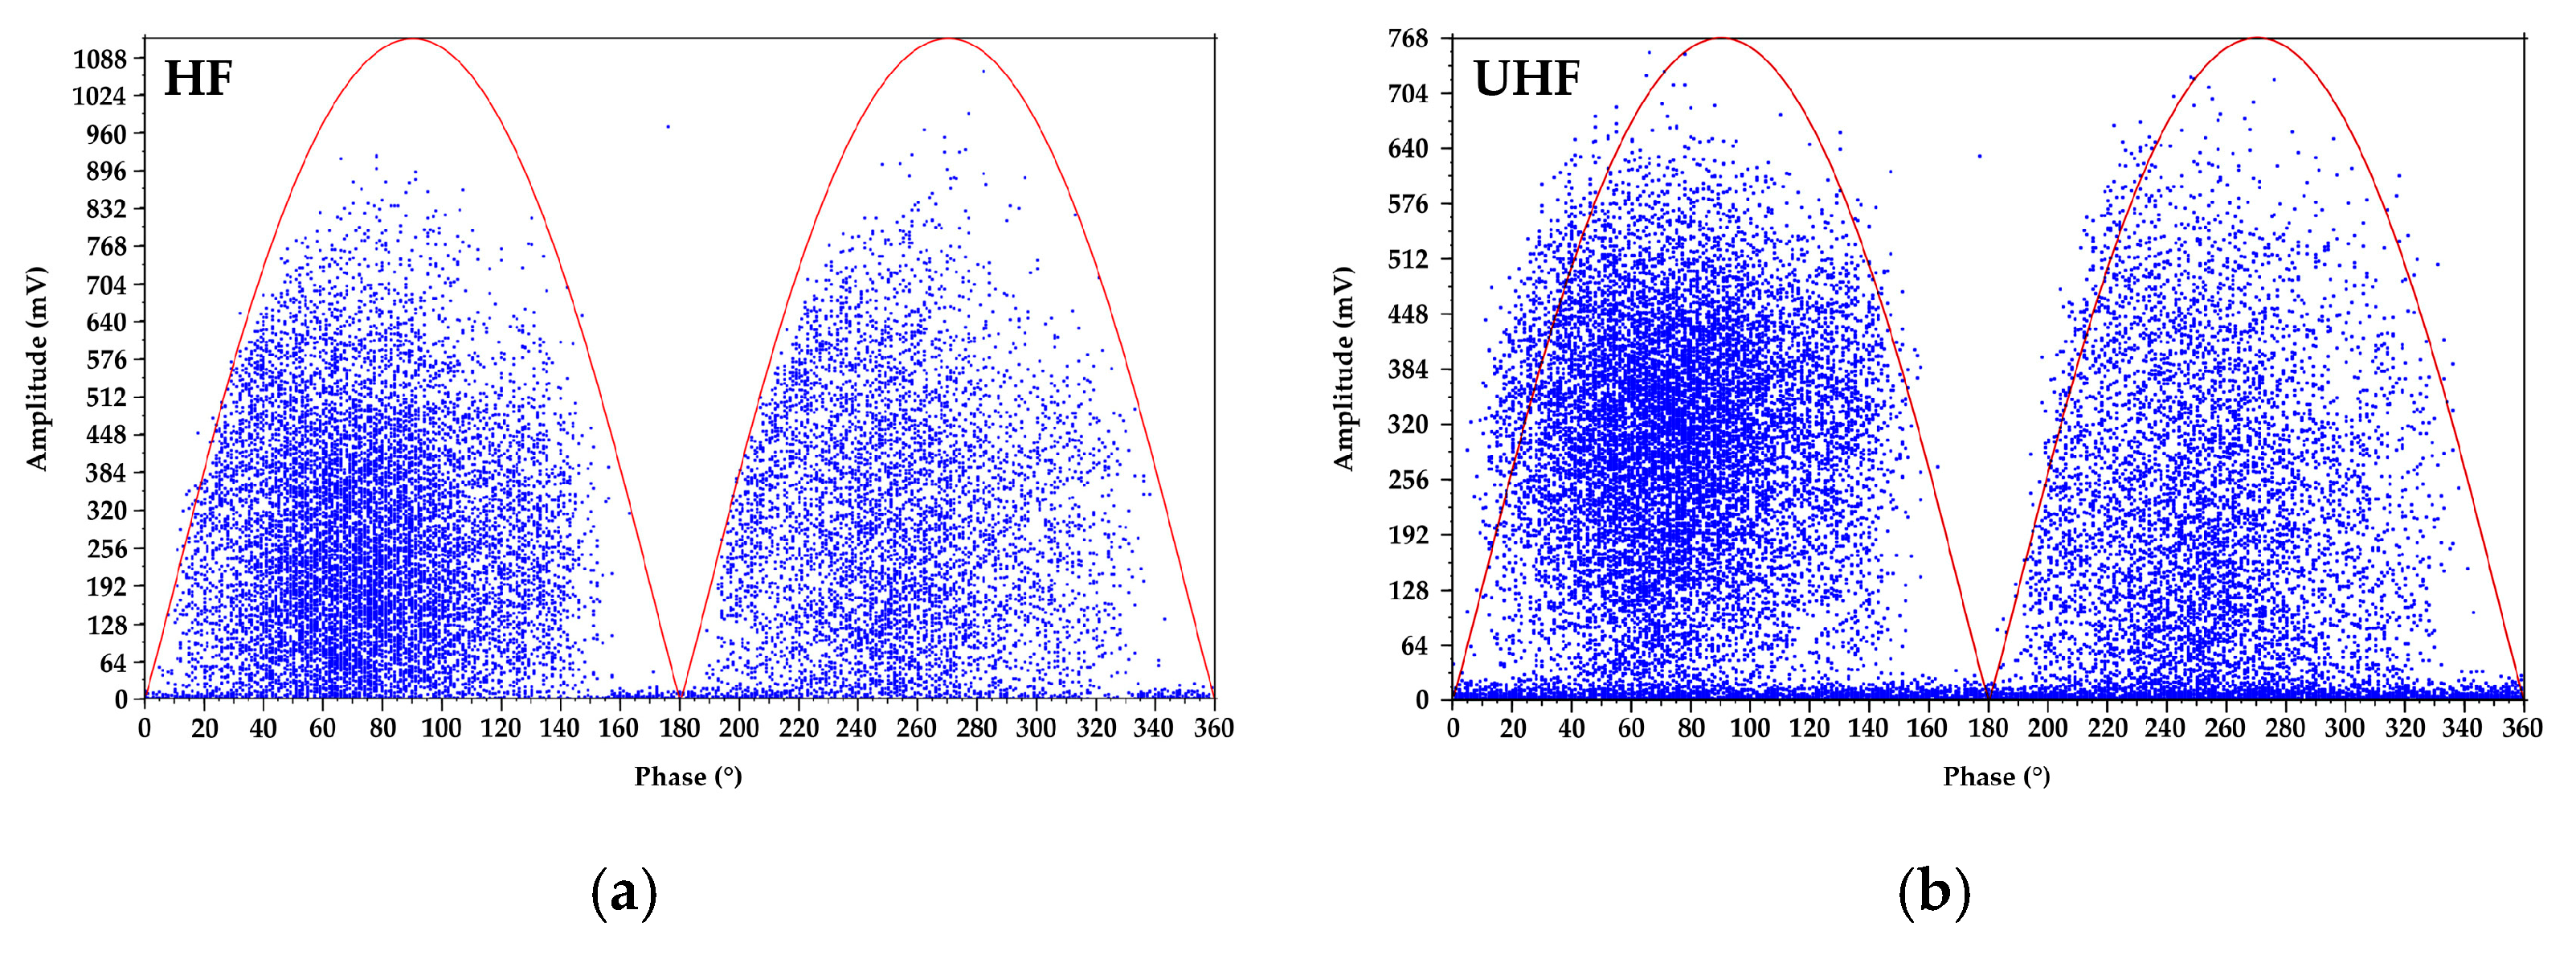
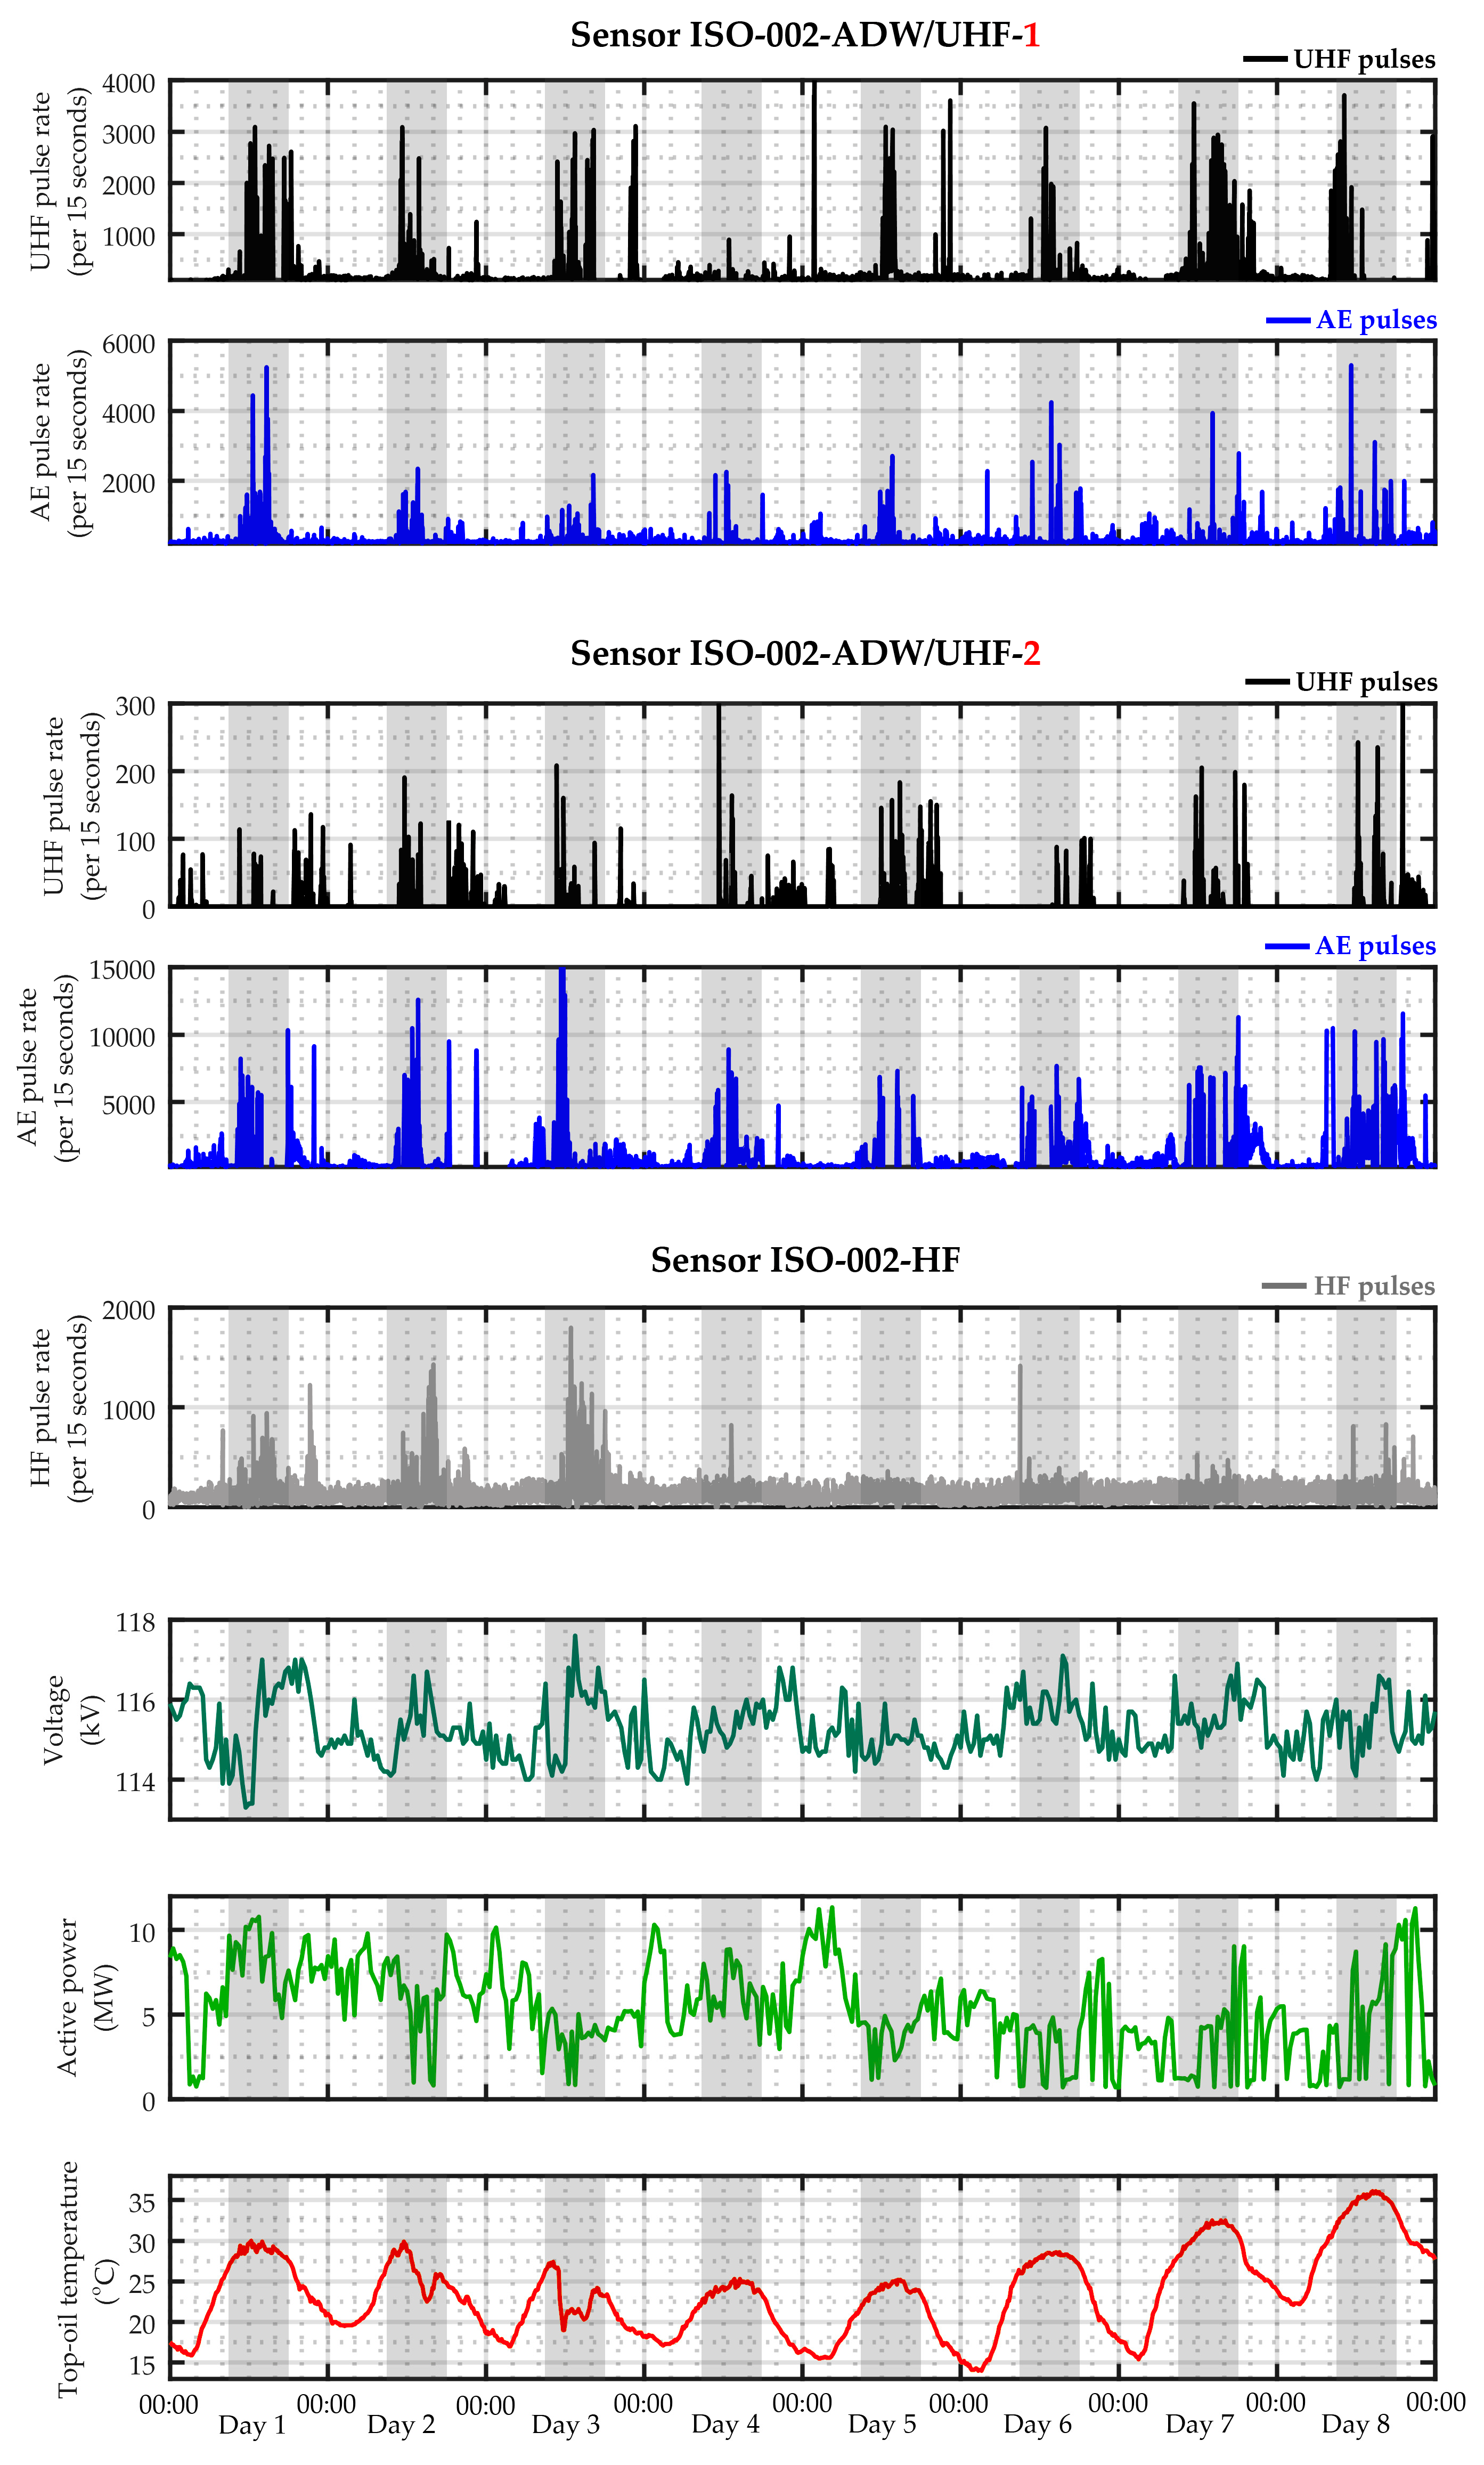
Figure 19 presents typical partial discharge time waveforms and power spectral density (PSD) characteristics registered with the use of HFCT sensors. The results of frequency analysis showed that PDs in oil generated pulses of high frequency in the band between 12.4 and 18.3 MHz, whereas surface PD generated pulses in a narrow band between 10.8 and 11.6 MHz. The PD detection sensitivity of both prototypes was higher than commercial sensors. In the case of discharges in oil, the highest sensitivity was observed for the prototype HFCT sensor with four turns and NiZn soft ferrite core. Its sensitivity was 36% higher on average than the sensors from MnZn soft ferrite with three turns. On the other hand, the construction based on the MnZn core showed higher sensitivity in the detection of surface discharges on the pressboard sample. The average growth in sensitivity compared to the prototype with NiZn core was 46%. The detection possibility of surface discharges is very important from the viewpoint of the performance and effectiveness of the monitoring system operation. It is one of the most energetic and destructive types of partial discharges. Therefore, for the designed monitoring system, finally, the HFCT sensor with MnZn core was selected.

2.3. Module for Conditioning and Analog-to-Digital Signal Processing of PD Pulses

The schematic diagram of electronic modules for conditioning and analog-to-digital processing of PD pulses is presented in Figure 20. Conditioning of the UHF signals is realized in an electronic circuit consisting of two low noise RF amplifiers basing on a chipset SPF5043Z of maximal amplification of G = 18 dB at 900 MHz, tunable bandpass filter, and a system of peak detector based on multistage demodulating logarithmic amplifier type AD8313. Application of a peak detector circuit (also called frequency converter or envelope detector) is a common practice in the case of the registration of UHF pulses because it allows to significantly reduce the sampling frequency [99,100]. Due to that, it is possible to process the PD pulses and determine their parameters in real-time. Unfortunately, this is done at the expense of losing information on time-domain parameters (e.g., rise and fall time) of individual pulses. The AE signals conditioning module consists of a low-noise preamplifier (with 40 dB gain) based on high-speed instrumentation amplifier AD8421BRZ, active bandpass filter (20–500 kHz) based on Sallen–Key architecture and voltage follower (based on AD813ARZ op-amp) to buffer the output. Since the PD pulses registered with the use of sensitive HFCT sensor may reach the amplitude of even a few volts, it was decided to give up on the dedicated conditioning system and to process the raw HF signals. At the input of the analog-to-digital signal processing module, there is A/D converter type AD9266BCPZ-40 with 40 MS/s sampling rate and 16-bit resolution. To each PD sensor, a separate A/D converter was allocated.
Figure 21 shows exemplary time waveforms of conditioned AE and UHF pulses and raw HF pulses registered during laboratory tests of the signal conditioning modules and A/D signal processing module. During the tests, in the oil-filled transformer tank, the surface discharges on a pressboard sample were generated. Their apparent charge was in the range between 400 and 5300 pC. As one can see in Figure 21a, the application of the peak detector circuit at a relatively low sampling frequency equal to 40 MS/s allows to effectively detect the UHF pulses. A comparative analysis of the results obtained with the HF method demonstrated that the UHF module detected all PD pulses and it confirmed the high sensitivity of the ISO-002-HF sensor. Despite the resignation from the HF signal conditioning module, pulses registered with the high-frequency current transformer had on average 1.8 times higher amplitude than the strongly amplified UHF pulses. The placement of the HFCT sensor on the ground wire of the electrode system, nearby the PD source, certainly had a high influence on obtaining such a good result.
In the case of the AE method, the pulses of comparable to the UHF amplitude were registered. In Figure 21b the visible time differences (T = 272 µs) in UHF and AE signal arrival result from the different velocity of EM wave propagation (approx. 2/3 speed of light in vacuum) and acoustic wave in oil (1400–1500 m/s). The piezoelectric transducer built in the ADW was placed about 39.5 cm from the PD source, which means that the acoustic wave velocity in the transformer tank filled with oil was 1452 m/s.
Digital signals from the A/D converter then go to the FPGA (Field-Programmable Gate Array) type Intel 10M50DAF256I7G with 256 MB cache memory type DDR2. In that logic circuit, two operating modes were implemented: basic (monitoring mode) and extended (diagnostic mode).
In the monitoring mode, for HF and UHF method, separate data frames of duration time 55.5 µs were analyzed. Such data frame length was selected for two reasons. First, it is the time corresponding to the angle 1° of voltage period (20 ms per 360° which is approximately 55.5 µs per 1°), which enables determination of phase-resolved partial discharge patterns (PRPD). Second, the duration time of a single UHF PD pulse usually amounts to less than 2 µs. It allows to minimize the risk that the UHF PD pulse would not be detected by the monitoring system. In the case of the AE method, the data frames are aggregated in one-second records. It is caused by the fact that the AE pulses of the high-energy partial discharges (e.g., creeping sparks or interturn discharges), which are registered with resonant piezoelectric transducer may have a time duration of even over a dozen milliseconds [24].
The algorithm implemented in the FPGA for each data record (55 µs for the HF and UHF method, and 1 s for the AE method) determines the following parameters:
  • the number of pulses detected (n),
  • the maximal amplitude of the pulses (Amax),
  • the maximal energy of the pulses (Emax),
  • the average amplitude of the pulses (Amean),
  • the average energy of the pulses (Emean).
In the diagnostic mode, the FPGA does not do the calculations. Data frames are sent via a fiber-optic Ethernet cable to the multi-channel data concentrator, and afterward to the monitoring system server. The 1-Gigabit Ethernet physical layer (PHY) was made using the Marvell Alaska 88E1512 chip. That system supports Synchronous Ethernet (SyncE) and Precise timing control protocol (PTP) time stamping, which is based on IEEE1588 [101] and IEEE802.1AS [102] standards. The 88E1512 system on the first side is connected using the RGMII interface to the FPGA chip and on the second it is connected using SERDES interface to the small form-factor pluggable (SFP) optical transceiver.

2.4. Multi-Channel Data Concentrator Module

Measurement data is sent to the multi-channel data concentrator (labeled as MPD-001 module) using protocol elaborated based on the so-called Process Bus (PB) according to the guidelines of the international substation automation standard IEC 61850-9-2 [103]. As it was mentioned before, the fiber-optic cables allow to effectively reduce the influence of external electromagnetic interferences occurring on the substation. The schematic diagram and photograph of the MPD-001 module are demonstrated in Figure 22.
The data into the MPD-001 module are entered through an integrated, specialized MSO-001 network card containing up to eight fiber-optic interfaces (ISO). The MSO-001 network card transmits the measurement data via the PCX/1 bus to the PJC-900 module based on the E660T ATOM processor. Individual data streams are decoded by the FPGA type CYCLONE V implemented in the PJC-900 module. The FPGA also supports the following external network transmission channels:
  • the basic channel of the Ethernet network in standard FX1000 used for data transmission, warning signals, download the parameterization from the server,
  • configuration channel in TX100 standard dedicated to programming, local parameterization, and service,
  • synchronizing channel in 1PPS or IRIGB standard.
The PCX/2 bus is used to transfer data streams from FPGA to the embedded PC (EPC) computer module. As with the signal processing module, MPD-001 can work in the monitoring or diagnostic mode. In the monitoring mode, based on the data sent from the analog-to-digital signal processing module, the embedded PC calculates for three different time intervals (one minute, fifteen minutes, and one hour) parameters such as the number of PD pulses, maximum and average pulse amplitude, as well as maximum and average pulse energy. In diagnostic mode, the computer prepares data for PRPD patterns. For this purpose, it aggregates 1-s data frames with a duration of 55.5 µs. The data prepared in this way is sent to the server. If necessary, data from the MPD-001 module can be transferred to other local or remote SCADA systems using the DNP-3.0 or IEC 61850 protocol.
The module MPD-001 is powered with the use of the 220 V AC/DC power supply type MZA-502, in which the voltage level is supervised by the PJC-900 module.
After manufacturing the complete prototype of MPD-001 module, the EMC properties of the housing ports and power ports were tested in accordance with IEC 60255-26 standard [104].

2.5. Modules of Server Software

In the firmware of the monitoring system server, the following software modules were implemented: virtual data concentrator (VDC), analytic module, the module of graphic data presentation, and reporting module. In the monitoring mode, the VDC module receives from the MPD-001 concentrator notifications of the PD pulse occurrence. This causes that information about the event with calculated partial discharge parameters (number of pulses, their energy, and amplitude) is saved to the database on the server. In turn, in the diagnostic mode, VDC enables direct access to the transmitted data frames, including the preview in real-time the PD waveforms of the registered in particular channels. This functionality also enables gathering the samples to perform further, more advanced analysis, including the elaboration of PRPD patterns.
Based on the data gathered in the database parameters, the analytical module regularly checks if the threshold values of the PD parameters have not been exceeded. Additionally, using the least square method, a linear trend estimation is conducted for the data from the last week and the last month. All information is shared with the user through the module of the graphic data presentation, which displays in the application window, i.e.,
  • the number of detected PD pulses and the average value of their energies and amplitudes,
  • the result of self-diagnosis of measurement channels,
  • warning or alarm state after exceeding the threshold values for the sum of registered pulses, their average energy, and amplitude for various time intervals: 15 min, 60 min, 24 h, and 30 days,
  • the warning or alarm state when the values of PD parameters collected during last week and last month show a rising trend.
The functions of the reporting module enable elaborating summary reports or details for the PD parameters registered in the database and events description.
As it was mentioned before, the system in the diagnostic mode functions as a multichannel partial discharges detector allowing to observe the PD waveforms or PRPD pattern images. PRPD images are created based on the 20 ms aggregation of data frames from HFCT and UHF sensors and voltage sine wave registered by the current/voltage transformer (CVT) on the substation.
The system also provides the possibility to wirelessly measure the high voltage in a power transformer, which is realized with the use of a special capacity probe. The structure of the probe and assumptions of the measuring method is discussed in detail in [105]. The signal from the probe is registered with an additional, A/D converter of sampling frequency equal to 4 MS/s dedicated exclusively for this task. This converter is placed in the circuit of every analog-to-digital signal processing module.
The angular resolution of the created PRPD patterns is 1°, whereas the amplitude resolution equals 16 bits for the output voltage range equal to 0–3.6 V. The software function responsible for preparing PRPD patterns was tested in the laboratory conditions. For this purpose, the comparative research, during which PRPD patterns were simultaneously registered with a standard partial discharges detector type Doble PD-Smart and monitoring system under test. A schematic diagram of the measurement setup was presented in Figure 23.
The PRPD images obtained during the research were the effect of about 60–90 min registrations of the partial discharges pulses. In this case, instead of pressboard samples, glass samples with a thickness of 6 mm were used. This change was caused by the fact that the pressboard samples quickly degraded under the influence of the action of high-intensity surface discharges with the apparent charge of a few nC. This, in turn, led to PD extinction or breakdown.
In Figure 24 the exemplary results of the 80-min registration of the surface discharges of average apparent charge qmean = 283 pC and maximal qmax = 5702 pC are presented. A typical PRPD distribution for surface discharges was obtained. The most PD pulses were registered in the first (0–90°) and third quarter (180–270°) of a sine wave of test voltage.
The results obtained by the prototype monitoring system (Figure 25) confirmed the properly implemented functions of PRPD pattern creation. In this case, also most of the pulses were registered in the first and third quarters of the voltage sine wave. However, compared to the IEC 60270 method (where the number of pulses did not depend clearly on the voltage polarization), both electromagnetic methods registered more pulses of positive polarization.
Currently, there is work conducted on equipment of the analytical module in the function of automatic recognition of PD type based on the analysis of the PRPD patterns.

3. Tests of the Developed PD Monitoring System on Power Transformers

3.1. Test of the Monitoring System During Induced Voltage Test of 330 MVA Power Transformer

After successfully finished laboratory tests, it was decided to check the effectiveness of the system operation on a real power transformer. First such measurement was carried out during the induced voltage test with partial discharge measurement (IVPD) on a power transformer of 330 MVA. The tank of the investigated transformer, already at the production stage, was equipped in two ceramic dielectric windows placed in side-walls of the tank, i.e., near the L1 phase (Figure 26) and the L3 phase. This unfortunately prevented the active dielectric window with the built-in acoustic emission sensor (ISO-002-AWD/UHF) from installation and testing. The induced voltage test was carried out strictly according to the scheme described in the IEC 60076-3 standard [106] and taking into account the strict internal safety regulations in the high voltage laboratory. Due to these restrictions, the installation of the high-frequency current transformer (ISO-002-HF sensor) on the grounding of the neutral point was not allowed. Therefore, the registration of the PD pulses was performed using two UHF antennas, whereas the employees of the HV test station conducted the measurement of apparent charge (according to IEC 60270 standard) using multichannel digital PD detector type DDX 9121b (Haefely, Basel, Switzerland).
The time sequence for the application of test voltage for induced voltage test with partial discharge measurement (IVPD) is shown in Figure 27. In the first stage, the voltage was increased to the level of (0.4 × Ur)/√3, which for a transformer with rated voltage of a winding Ur = 410 kV corresponded to the value Um = 94.7 kV. At that voltage level, the background noise (q = 3.5 pC) was registered. Then, the voltage was increased for 1 min to the level of (1.2 × Ur)/√3 = 284 kV, at which partial discharge pulses of the apparent charge from a several dozen to 150 pC were registered occasionally. According to the scheme of the IVPD test, the voltage was increased to the 1-h PD measurement voltage level (Um = 374 kV). This voltage level was held for 5 min. During that time stable PD pulses of apparent charge q = 600–700 pC were registered. Then the voltage was raised to the enhancement voltage level (Um = 473.4 kV) and held there for 1 min. At this test stage, the apparent charge grew to approx. 1500–1800 pC.
For the IVPD test, the monitoring system was configured to the operation in a diagnostic mode, which enabled the observation and registration of UHF time waveforms in real-time. In Figure 28 the exemplary time waveforms of duration 20 ms were presented, which were registered for three main IVPD test voltage levels, i.e., 284, 374, and 473 kV. PD pulses were detected by the UHF probe installed near the phase L3. The probe installed on the opposite side of the tank, near phase L1, independently from the level of the test voltage, registered only background noise (about 20–30 mV). This means that the PD source was probably in phase L3 or its neighborhood. For the partial discharges of low intensity and low apparent charge (max. 150 pC), the UHF probe registered pulses, however, their amplitude did not exceed 45 mV (approx. 1.5–2 times higher than the background noise). In turn, by Um = 374 kV, for partial discharges of apparent charge equal to 600–700 pC, the UHF pulses of definitely higher amplitude (120–135 mV) were registered. For the enhancement voltage level (473.4 kV), PD pulses of apparent charge 1500–1800 pC corresponded to the UHF pulses of maximal amplitude 175 mV. The obtained measurement results during the IVPD test of power transformer 330 MVA showed the correct design and implementation of the sensor ISO-002-UHF mechanics and high sensitivity of the UHF antenna, which enabled detection of partial discharges with relatively low apparent charge (100–150 pC).

3.2. Test of the System on 31.5 MVA Power Transformer

The next object, on which the PD monitoring system was tested was a transformer with a rated power of 31.5 MVA and voltage of 115/33 kV. Before the prototype system installation, the localization of PD sources was carried out by the trilateration technique. For this purpose, eight piezoelectric AE sensors type PAC R15α and 8-channel AE system type DiSP (Physical Acoustic Corporation, Princeton, NJ, USA) were used. The coordinates of the AE sensors mounted on the transformer tank of dimensions 4 × 1.3 × 2.6 m are listed in Table 5.
The amplitude of the registered signals was relatively low and equal to 30–45 dB ref 100 µV (peak at around 66 dB). The results of the localization obtained with the trilateration technique showed that in the investigated power transformer there are two sources of partial discharges. The first source was detected on the high voltage side (115 kV), between phases L1 and L2 (coordinates: x = 1.9 m, y = 1.0 m, z = 1.25 m). In turn, the second PD source was detected on the low voltage side (33 kV), at the point of LV connections (coordinates: x = 1.3, y = 0.1 m, z = 1.5 m). The graphic results of the PD source localization are presented in Figure 29.
After performing the measurements which showed the existence of partial discharge sources, the works preceding the prototype system installation were carried out. First, the power transformer was turned off and disconnected from the HV transmission lines. Then, the oil excess was drained to the level enabling opening the revision hole in the upper tank cover. After opening the revision hole, the active dielectric windows and the remaining elements of the ISO-002-ADW/UHF sensors were immediately installed, in order to minimize the time of contact of the oil with humid air (Figure 30).
The investigated power transformer was equipped in two sensors ISO-002-ADW/UHF and one sensor ISO-002-HF installed on the grounding wire of the neutral point of the HV winding (Figure 31). The optic fiber and power supply cables were protected by putting them into the corrugated PCV pipes with a diameter of 25 mm. A waterproof enclosure of the monitoring system with data concentrator module MPD-001, server, and power supply was placed opposite to the power transformer. The last stage of the installation works was configuring the data transmission between the PD monitoring system and SCADA substation system type SYNDIS ES (Mikronika, Poznan, Poland), which registered basic operation parameters, such as voltage, load, and oil temperature.
After filling the power transformer tank with oil and checking the tightness of revision holes, the power transformer was turned on and the partial discharges monitoring system was started. Figure 32 presents the characteristics of PD intensity (pulse rate per 15 s), active power, voltage, and top-oil temperature obtained within 8-days-operation of the PD monitoring system.
The conducted data analysis proves that in the monitored power transformer:
  • Partial discharges were registered every day, and their activity was the highest mainly for hours from 8:45 a.m. to 5:45 p.m. (these time intervals are indicated in Figure 32 as grey bands). The sum of PD pulses from this time intervals constitutes 68.9% of all registered pulses.
  • The peak intensity of partial discharges occurred between 1:00 p.m. and 3:00 p.m. In this short period, almost one-quarter (24.4 %) of all PD pulses were detected.
  • The Pearson correlation coefficient between the hourly distribution of the UHF and AE pulses for sensor ISO-002-ADW/UHF-1 was r = 0.87 with significance p = 0.001 (very strong positive correlation), and for sensor ISO-002-ADW/UHF-2 it was r = 0.45 with significance p = 0.027 (moderate positive correlation). Both hourly distributions of the UHF and AE pulses are presented in Figure 33.
  • The hourly distribution of the PD pulses registered with the high-frequency current transformer ISO-002-HF was correlated the most with the distribution obtained for the AE transducer (r = 0.68, p < 0.001) and the UHF antenna (r = 0.62; p = 0.001) of the sensor ISO-002-ADW/UHF-1. In the case of the sensor ISO-002-ADW/UHF-2 the correlation was lower at the level of r = 0.44 with significance p = 0.029 for the distribution obtained for the AE transducer and r = 0.22 with significance p = 0.031 for the distribution obtained for the UHF antenna.
  • The voltage value was changing in a narrow range from 113.3 to 117.6 kV, wherein the average, variance, and standard deviation were, respectively, equal to M = 115.3 kV, s2 = 0.47, and SD = 0.69. Due to the small voltage variation, it was decided not to investigate its influence on partial discharges intensity.
  • During the 8-days-operation of the system, the power transformer was loaded with relatively low power from only 0.68 to 11.34 MVA, which constituted, respectively, 2.15% and 36.00% of its rated power. The average value of the load was equal to M = 5.31 MVA, variance s2 = 6.16, and standard deviation SD = 2.48.
  • The oil temperature was changing in a wide band from 14.0 to 36.1 °C. It was observed that daily “hills” and local peaks of the oil temperature curve overlap the period of higher activity of partial discharges. (from 8:45 a.m. to 5:45 p.m.) (see Figure 32). In turn, for daily “valleys” of the oil temperature curve, a clear reduction or complete disappearance of the partial discharges activity was observed. In order to test the hypothesis relating to the influence of the level of oil temperature on partial discharges intensity in the monitored power transformer, it was decided to conduct a one-way analysis of variance (ANOVA) for independent samples. One of the main assumptions of the ANOVA is that the independent variable consists of two or more categorical, independent, and equinumerous groups. The categorization of the daily oil temperature values (independent variable) was carried out using tertiles, in order to obtain three equinumerous groups. The “low” temperature category was ascribed to lower tertile, whereas “moderate” and “high” temperature categories to middle and higher tertiles, respectively. Since the assumption of homogeneity of variance was violated (Levene’s test for equality of variances was statistically significant), therefore the Brown–Forsythe and Welch F-ratios are reported. The results of both robust tests of equality of means are listed in Table 6. The results of the analysis showed that the compared groups differ from one another statistically, which means that the oil temperature level differentiates the number of PD pulses. Figure 34 illustrates the value of the average number of the AE, UHF, and HF pulses between particular oil temperature levels (low, moderate, and high), which indicate a strong causal relationship between these variables. Figures obtained for the sensors ISO-002-ADW/UHF1 and ISO-002-ADW/UHF2 show that the higher the oil temperature level was, the higher was the number of the registered AE and UHF pulses. The exception is the high-frequency current transformer ISO-002-HF sensor, for which the highest average number of HF pulses was registered for the average oil temperature level. To investigate which compared groups are statistically significantly different from one another, the Gamesa–Howell post hoc test, which is recommended in the situation when the assumption of homogeneity of variance in the compared groups was violated. The post hoc comparisons revealed statistically significant differences (p < 0.0005) between all groups (oil temperature levels) except the groups “moderate” and “high” temperature for the UHF pulses registered with the sensor ISO-002-ADW/UHF-2 (Table 7). The highest differences in the number of PD pulses were observed between groups “low” and “high” temperature. As it was mentioned before, the voltage value variability was low. Therefore, while interpreting the obtained results it may be concluded that in the monitored power transformer, the oil temperature growth is a significant factor inducing partial discharges. This hypothesis is in line with the research results, which showed that the temperature growth in combination with an increased moisture content of the oil-paper insulation system may induce the activity growth of partial discharges [107,108,109,110]. Additionally, the presence of water molecules in oil as a result of the moisture migration process, as well as the effect of gas bubbles exuding from cellulose insulation, may significantly influence the intensification of the PD phenomenon [15,111,112,113,114,115,116].

4. Conclusions

The article presents a prototype, hybrid on-line PD monitoring system. Its unique feature is a combination of the functionality of three methods of PD detection (AE, HF, and UHF) and integrating them into one complementary system. Another important function of the system is the possibility of its integration using IEC 61850 protocol with remaining substation automation devices, but first of all with SCADA system. Due to that, the monitoring system can analyze in real-time the PD parameters registered using various detectors as well as the basic transformer parameters that affect the phenomenon of partial discharges, i.e., voltage and oil-temperature. Tests conducted on 31.5 MVA power transformer showed that in its case partial discharges ignited in particular times of day (from approx. 8:45 a.m. to 5:45 p.m.), and their increased activity was observed during daily “hills” and local peaks of the oil temperature curve. The results of the statistical analysis of the HF, UHF, and AE signals presented in the paper allow to conclude with a high probability that in these periods, the partial discharge phenomenon was the source of the majority of pulses registered by detectors.
Laboratory tests of partial discharge detectors developed for the monitoring system have confirmed their high performance. The active dielectric window with built-in ultrasound transducer assures on average 5.80 times higher sensitivity than the popular contact AE sensor type PAC R15D. Such high sensitivity was obtained because the ultrasonic transducer is located inside the oil-filled transformer tank and is equipped with a specially designed matching layer that facilitates the transfer of acoustic energy from mineral oil to a piezoelectric crystal. In turn, the prototype HFCT sensor with MnZn ferrite core showed—in comparison to the commonly used RFCT-4 sensor—on average 1.48 times higher sensitivity of PD in oil detection and on average 1.50 times higher detection sensitivity of surface PD. Additionally, very good results were obtained for the prototype construction of the meandered planar inverted-F antenna. The antenna bandwidth (280–353 MHz) was optimized for the detection of PDs typical for oil-paper insulation. Tests performed in a shielded laboratory and with the use of a power transformer tank equipped in the dielectric windows showed that the prototype meandered PIFA compared to standard disk antenna is on average 7.80 times more sensitive in the detection of low-radiating PD (an initial form of surface PD with apparent charge below 1 nC) and on average 1.75 more sensitive in the detection of high energy creeping sparks with apparent charge about 6 nC.
Future research will focus primarily on the development of the system’s software layer, including development and implementation of an algorithm for identifying the type of partial discharge pulses based on PRPD patterns (for HF and UHF method) and implementation of the FFT (Fast Fourier Transform) algorithm in the FPGA for the acoustic emission channel, which will create the ability to identify the type of PDs based on selected frequency domain features and artificial neural network (ANN) based classification. In the case of the hardware layer, research works are underway to adapt the system to diagnose power equipment other than transformers. The first successful implementations of the prototype monitoring system on 110 kV gas-insulated switchgear are described in [117].

Author Contributions

Conceptualization, W.S., K.W. and W.G.; methodology, W.S, K.W. and W.G.; software, W.G., W.S. and K.W.; validation, W.S., W.G. and K.W.; formal analysis, W.S.; investigation, W.S, W.G., C.S., K.W.; resources, W.S and W.G; data curation, W.S.; writing—original draft preparation, W.S.; writing—review and editing, W.S., K.W., W.G. and C.S.; visualization, W.S.; supervision, W.S.; project administration, W.S. and W.G.; funding acquisition, W.S., W.G and K.W. All authors have read and agreed to the published version of the manuscript.

Funding

This work was supported by the Polish National Centre for Research and Development, within the Applied Research Programme, grant No. PBS3/A4/12/2015.

Conflicts of Interest

The authors declare no conflict of interest.

References

  1. Tenbohlen, S.; Jagers, J.; Vahidi, F.; Bastos, G.; Desai, B.; Diggin, B.; Fuhr, J.; Gebauer, J.; Krüger, M.; Lapworth, J.; et al. Transformer Reliability Survey; Technical Brochure 642; CIGRE: Paris, France, 2015. [Google Scholar]
  2. Foros, J.; Istad, M. Health Index, Risk and Remaining Lifetime Estimation of Power Transformers. IEEE Trans. Power Deliv. Early Access 2020, 7. [Google Scholar] [CrossRef] [Green Version]
  3. Ortiz, F.; Fernandez, I.; Ortiz, A.; Renedo, C.J.; Delgado, F.; Fernandez, C. Health indexes for power transformers: A case study. IEEE Electr. Insul. Mag. 2016, 32, 7–17. [Google Scholar] [CrossRef] [Green Version]
  4. Krüger, M.; Koch, M.; Kraetge, A.; Rethmeier, K.; Energy, O.; Dierks, A.A. Diagnostic measurements on power transformers. Energetyka 2009, 5, 299–305. [Google Scholar]
  5. Hori, M.; Nishioka, M.; Ikeda, Y.; Noguchi, K.; Kajimura, K.; Motoyama, H.; Kawamura, T. Internal winding failure due to resonance overvoltage in distribution transformer caused by winter lightning. IEEE Trans. Power Deliv. 2006, 21, 1600–1606. [Google Scholar] [CrossRef]
  6. Metwally, I.A. Failures, monitoring and new trends of power transformers. IEEE Potentials 2011, 30, 36–43. [Google Scholar] [CrossRef]
  7. Kassi, K.S.; Fofana, I.; Meghnefi, F.; Yeo, Z. Impact of local overheating on conventional and hybrid insulations for power transformers. IEEE Trans. Dielectr. Electr. Insul. 2015, 22, 2543–2553. [Google Scholar] [CrossRef]
  8. Paoletti, G.; Golubev, A. Partial discharge theory and applications to electrical systems. In Proceedings of the Conference Record of 1999 Annual Pulp and Paper Industry Technical Conference (Cat. No. 99CH36338), Seattle, WA, USA, 21–25 June 1999; pp. 124–138. [Google Scholar] [CrossRef]
  9. Sikorski, W.; Walczak, K. PDtracker–system monitoringu wyładowań niezupełnych w transformatorze energetycznym. Prz. Elektrotechniczny 2014, 10, 45–49. [Google Scholar]
  10. Badicu, L.V.; Broniecki, U.; Koltunowicz, W.; Körber, S.; Krüger, M.; Voegel, E. Prevention of transformer failure through continuous monitoring. In Proceedings of the XIXth International Symposium on High Voltage Engineering (ISH), Pilsen, Czech Republic, 23–28 August 2015. Paper Number 274. [Google Scholar]
  11. Gockenbach, E.; Borsi, H. Condition monitoring and diagnosis of power transformers. In Proceedings of the 2008 International Conference on Condition Monitoring and Diagnosis, Beijing, China, 21–24 April 2008; pp. 894–897. [Google Scholar] [CrossRef]
  12. Mondal, M.; Kumbhar, G.B. Detection, measurement, and classification of partial discharge in a power transformer: Methods, trends, and future research. IETE Tech. Rev. 2018, 35, 483–493. [Google Scholar] [CrossRef]
  13. IEEE Guide for Application for Monitoring Equipment to Liquid-Inmersed Transformers and Components; IEEE: Piscataway, NJ, USA, 2012.
  14. Zhao, W.B.; Zhang, G.J.; Sun, Y.; Yan, Z.; Xu, D.K. Online Multisensor Monitoring System For Insulation Condition Of Oil-Immersed Power Transformer. In Proceedings of the IEEE International Symposium on Electrical Insulation, Indianapolis, IN, USA, 19–22 September 2004; pp. 89–92. [Google Scholar] [CrossRef]
  15. Sikorski, W.; Walczak, K.; Przybylek, P. Moisture migration in an oil-paper insulation system in relation to online partial discharge monitoring of power transformers. Energies 2016, 9, 1082. [Google Scholar] [CrossRef] [Green Version]
  16. Sikorski, W.; Walczak, K.; Moranda, H.; Gil, W.; Andrzejewski, M. Partial discharge on-line monitoring system based on acoustic emission method—Operational experiences. Prz. Elektrotechniczny 2012, 88, 117–121. [Google Scholar]
  17. Castro, B.; Clerice, G.; Ramos, C.; Andreoli, A.; Baptista, F.; Campos, F.; Ulson, J. partial discharge monitoring in power transformers using low-cost piezoelectric sensors. Sensors 2016, 16, 1266. [Google Scholar] [CrossRef] [Green Version]
  18. Tenbohlen, S.; Beltle, M.; Siegel, M. PD monitoring of power transformers by UHF sensors. In Proceedings of the International Symposium on Electrical Insulating Materials (ISEIM), Toyohashi, Japan, 12–15 September 2017; Volume 1, pp. 303–306. [Google Scholar] [CrossRef]
  19. Judd, M.D.; Yang, L.; Hunter, I.B. Partial discharge monitoring of power transformers using UHF sensors. Part I: Sensors and signal interpretation. IEEE Electr. Insul. Mag. 2005, 21, 5–14. [Google Scholar] [CrossRef]
  20. Judd, M.D. Experience with UHF partial discharge detection and location in power transformers. In Proceedings of the Electrical Insulation Conference (EIC), Annapolis, MD, USA, 5–8 June 2011; pp. 201–205. [Google Scholar] [CrossRef]
  21. Chai, H.; Phung, B.T.; Mitchell, S. Application of UHF sensors in power system equipment for partial discharge detection: a review. Sensors 2019, 19, 1029. [Google Scholar] [CrossRef] [Green Version]
  22. Braunlich, R.; Hassig, M.; Fuhr, J.; Aschwanden, T. Assessment of insulation condition of large power transformers by on-site electrical diagnostic methods. In Proceedings of the IEEE International Symposium on Electrical Insulation, Anaheim, CA, USA, 2–5 April 2000; pp. 368–372. [Google Scholar] [CrossRef]
  23. International Electrotechnical Commission (IEC). High Voltage Test Techniques—Measurement of Partial Discharges by Electromagnetic and Acoustic Methods; IEC TS 62478:2016; International Electrotechnical Commission (IEC): Geneva, Switzerland, 2016. [Google Scholar]
  24. Sikorski, W. Development of acoustic emission sensor optimized for partial discharge monitoring in power transformers. Sensors 2019, 19, 1865. [Google Scholar] [CrossRef] [PubMed] [Green Version]
  25. Mackenzie, E.A.; Crossey, J.; DePablo, A.; Ferguson, W. On-line monitoring and diagnostics for power transformers. In Proceedings of the IEEE International Symposium on Electrical Insulation, San Diego, CA, USA, 6–9 June 2010; pp. 1–5. [Google Scholar] [CrossRef]
  26. IEEE Guide for the Detection, Location and Interpretation of Sources of Acoustic Emissions from Electrical Discharges in Power Transformers and Power Reactors; IEEE Std C57.127-2018 (Revision of IEEE Std C57.127-2007); IEEE 2019. Available online: https://ieeexplore.ieee.org/document/8664690 (accessed on 24 June 2020). [CrossRef]
  27. Cavallini, A.; Ramos, C.G.A.; Montanari, G.C.; Saad, H.; Tozzi, M. UHF detection of PD in power transformers: The influence of disturbances. In Proceedings of the Conference on Electrical Insulation and Dielectric Phenomena (CEIDP), Cancun, Mexico, 16–19 October 2011; pp. 436–439. [Google Scholar] [CrossRef]
  28. Cavallini, A.; Rubio Serrano, J.; Azcarraga Ramos, C.G.; Garcia Souto, J.A.; Montanari, G.C. Comparison of ultrasonic, electrical and UHF characteristics of partial discharge emission in oil/paper insulation systems. In Proceedings of the Conference on Electrical Insulation and Dielectric Phenomena (CEIDP), Cancun, Mexico, 16–19 October 2011; pp. 440–443. [Google Scholar] [CrossRef]
  29. Witos, F.; Gacek, Z. Application of the joint electro-acoustic method for partial discharge investigations within a power transformer. Eur. Phys. J. Spec. Top. 2008, 154, 1951–6401. [Google Scholar] [CrossRef]
  30. Fuangsoongnern, U.; Plueksawan, W. A measurement technique to identify and locate partial discharge in transformer with AE and HFCT. Int. J. Eng. Res. Appl. 2014, 4, 51–58. [Google Scholar]
  31. Coenen, S.; Müller, A.; Beltle, M.; Kornhuber, S. UHF and acoustic partial discharge localisation in power transformers. In Proceedings of the XVII International Symposium on High Voltage Engineering, Hannover, Germany, 22–26 August 2011. [Google Scholar]
  32. Markalous, S.M.; Tenbohlen, S.; Feser, K. Detection and location of partial discharges in power transformers using acoustic and electromagnetic signals. IEEE Trans. Dielectr. Electr. Insul. 2008, 15, 1576–1583. [Google Scholar] [CrossRef]
  33. Sikorski, W. Active Dielectric Window: A new concept of combined acoustic emission and electromagnetic partial discharge detector for power transformers. Energies 2019, 12, 115. [Google Scholar] [CrossRef] [Green Version]
  34. Krimholtz, R.; Leedom, D.A.; Matthaei, G.L. New equivalent circuits for elementary piezoelectric transducers. Electron. Lett. 1970, 6, 398–399. [Google Scholar] [CrossRef]
  35. Devaney, A.J.; Levine, H. Effective elastic parameters of random composites. Appl. Phys. Lett. 1980, 37, 377–379. [Google Scholar] [CrossRef]
  36. Meijer, S.; Gulski, E.; Smit, J.J.; Reijnders, H.F. Sensitivity check for UHF PD detection on power transformers. In Proceedings of the Conference Record of the 2004 IEEE International Symposium on Electrical Insulation, Indianapolis, IN, USA, 19–22 September 2004; pp. 58–61. [Google Scholar] [CrossRef]
  37. Judd, M.D.; Farish, O.; Pearson, J.S.; Hampton, B.F. Dielectric windows for UHF partial discharge detection. IEEE Trans. Dielectr. Electr. Insul. 2001, 8, 953–958. [Google Scholar] [CrossRef]
  38. Siegel, M.; Beltle, M.; Tenbohlen, S.; Coenen, S. Application of UHF sensors for PD measurement at power transformers. IEEE Trans. Dielectr. Electr. Insul. 2017, 24, 331–339. [Google Scholar] [CrossRef]
  39. Jahangir, H.; Akbari, A.; Werle, P.; Szczechowski, J. UHF PD measurements on power transformers-advantages and limitations. IEEE Trans. Dielectr. Electr. Insul. 2017, 24, 3933–3940. [Google Scholar] [CrossRef]
  40. Zhang, X.; Zhang, G.; Li, Y.; Zhang, J.; Huang, R. On the feasibility of gap detection of power transformer partial discharge UHF signals: Gap propagation characteristics of electromagnetic waves. Energies 2017, 10, 1531. [Google Scholar] [CrossRef] [Green Version]
  41. Wang, H.; Cheng, J.; Ding, D.; Liu, W.; Liang, H. A feasibility study on bushing tap UHF sensing method for partial discharge in transformer. In Proceedings of the VIIth International Conference on Condition Monitoring and Diagnosis (CMD), Perth, Australia, 23–26 September 2018. [Google Scholar]
  42. Coenen, S.; Tenbohlen, S. Location of PD sources in power transformers by UHF and acoustic measurements. IEEE Trans. Dielectr. Electr. Insul. 2012, 19, 1934–1940. [Google Scholar] [CrossRef]
  43. Li, M.; Guo, C.; Peng, Z. Design of meander antenna for UHF partial discharge detection of transformers. Sens. Transducers 2014, 171, 232–238. [Google Scholar]
  44. Li, T.; Rong, M.; Zheng, C.; Wang, X. Development simulation and experiment study on UHF Partial Discharge Sensor in GIS. IEEE Trans. Dielectr. Electr. Insul. 2012, 19, 1421–1430. [Google Scholar] [CrossRef]
  45. Khosronejad, M.; Gentili, G.G. Design of an archimedean spiral UHF antenna for pulse monitoring application. In Proceedings of the Loughborough Antennas and Propagation Conference (LAPC), Loughborough, UK, 2–3 November 2015; pp. 1–4. [Google Scholar]
  46. Wu, Q.; Liu, G.; Xia, Z.; Lu, L. The study of archimedean spiral antenna for partial discharge measurement. In Proceedings of the IVth International Conference on Intelligent Control and Information Processing (ICICIP), Beijing, China, 9–11 June 2013; pp. 694–698. [Google Scholar] [CrossRef]
  47. Robles, G.; Albarracín, R.; Vázquez-Roy, J.L.; Rajo-Iglesias, E.; Martínez-Tarifa, J.M.; Rojas-Moreno, M.V.; Ardila-Rey, J. On the use of vivaldi Antennas in the detection of partial discharges. In Proceedings of the IEEE International Conference on Solid Dielectrics (ICSD), Bologna, Italy, 30 June–4 July 2013; pp. 302–305. [Google Scholar] [CrossRef]
  48. Sarkar, B.; Mishra, D.K.; Koley, C.; Roy, N.K. Microstrip patch antenna based UHF Sensor for detection of partial discharge in high voltage electrical equipments. In Proceedings of the 2014 Annual IEEE India Conference (INDICON), Pune, India, 11–13 December 2014; pp. 1–6. [Google Scholar] [CrossRef]
  49. Polak, F.; Sikorski, W.; Siodla, K. Location of partial discharges sources using sensor arrays. Proceedings of 2014 ICHVE International Conference on High Voltage Engineering and Application, Poznan, Poland, 8–11 September 2014; pp. 1–4. [Google Scholar] [CrossRef]
  50. Ju, T.; Zhongrong, X.; Xiaoxing, Z.; Caixin, S. GIS partial discharge quantitative measurements using UHF microstrip antenna sensors. In Proceedings of the 2007 Annual Report-Conference on Electrical Insulation and Dielectric Phenomena, Vancouver, BC, Canada, 14–17 October 2007; pp. 116–119. [Google Scholar] [CrossRef]
  51. Nobrega, L.A.M.M.; Xavier, G.V.R.; Aquino, M.V.D.; Serres, A.J.R.; Albuquerque, C.C.R.; Costa, E.G. Design and development of a bio-inspired UHF sensor for partial discharge detection in power transformers. Sensors 2019, 19, 653. [Google Scholar] [CrossRef] [Green Version]
  52. Cruz, J.N.; Serres, A.J.R.; de Oliveira, A.C.; Xavier, G.V.R.; de Albuquerque, C.C.R.; da Costa, E.G.; Freire, R.C.S. Bio-inspired printed monopole antenna applied to partial discharge detection. Sensors 2019, 19, 628. [Google Scholar] [CrossRef] [Green Version]
  53. Sikorski, W.; Szymczak, C.; Siodła, K.; Polak, F. Hilbert curve fractal antenna for detection and on-line monitoring of partial discharges in power transformers. Eksploat. I Niezawodn. – Maint. Reliab. 2018, 20, 343–351. [Google Scholar] [CrossRef]
  54. Li, J.; Jiang, T.; Wang, C.; Cheng, C. Optimization of UHF Hilbert antenna for partial discharge detection of transformers. IEEE Trans. Antennas Propag. 2012, 60, 2536–2540. [Google Scholar] [CrossRef]
  55. Szymczak, C.; Sikorski, W. Design and optimization of UHF antennas for partial discharge monitoring in power transformer. Prz. Elektrotechniczny 2016, 92, 75–79. [Google Scholar]
  56. Li, J.; Li, X.; Du, L.; Cao, M.; Qian, G. An intelligent sensor for the ultra-high-frequency partial discharge online monitoring of power transformers. Energies 2016, 9, 383. [Google Scholar] [CrossRef] [Green Version]
  57. Wang, F.; Bin, F.; Sun, Q.; Fan, J.; Liang, F.; Xiao, X. A novel UHF Minkowski fractal antenna for partial discharge detection. Microw. Opt. Technol. Lett. 2017, 59, 1812–1819. [Google Scholar] [CrossRef]
  58. Jahangir, H.; Akbari, A.; Werle, P.; Akbari, M.; Szczechowski, J. UHF characteristics of different types of PD sources in power transformers. In Proceedings of the Iranian Conference on Electrical Engineering (ICEE), Tehran, Iran, 2–4 May 2017. [Google Scholar] [CrossRef]
  59. Szymczak, C.; Sikorski, W.; Siodla, K.; Grabia, M. Construction UHF antenna PIFA type for partial discharges monitoring in power transformer. Prz. Elektrotechniczny 2018, 94, 138–142. [Google Scholar]
  60. Palantei, E.; Madika, R.S.; Baharuddin, M.; Syarif, S. Design of reconfigurable planar inverted-F antenna for 5g implementation. In Proceedings of the IEEE International Conference on Communication, Networks and Satellite (Comnetsat), Makassar, Indonesia, 1–3 August 2019; pp. 41–46. [Google Scholar] [CrossRef]
  61. El Halaoui, M.; Asselman, H.; Kaabal, A.; Ahyoud, S. Design and simulation of a planar inverted-F antenna (PIFA) for Wi-Fi and LTE Applications. Int. J. Innov. Appl. Stud. 2014, 9, 1048. [Google Scholar]
  62. Wong, H.; Luk, K.M.; Chan, C.H.; Xue, Q.; So, K.K.; Lai, H.W. Small antennas in wireless communications. Proc. IEEE 2012, 100, 2109–2121. [Google Scholar] [CrossRef]
  63. Khan, N. Design of planar Inverted-F antenna. Int. J. Adv. Technol. Eng. Sci. 2014, 2, 20–31. [Google Scholar]
  64. Jean-Charles, Y.T.; Ungvichian, V.; Barbosa, J.A. Effects of substrate permittivity on planar inverted-F antenna performances. J. Comput. 2009, 4, 610–614. [Google Scholar] [CrossRef] [Green Version]
  65. Chattha, H.T.; Huang, Y.; Zhu, X.; Lu, Y. An empirical equation for predicting the resonant frequency of planar inverted-F antennas. IEEE Antennas Wirel. Propag. Lett. 2009, 8, 856–860. [Google Scholar] [CrossRef]
  66. Khan, M.M.; Abbasi, Q.H.; Ashique, R.H. Comprehensive design and propagation study of a compact dual band antenna for healthcare applications. J. Sens. Actuator Netw. 2015, 4, 50–66. [Google Scholar] [CrossRef] [Green Version]
  67. Luhaib, S.W.; Quboa, K.M.; Abaoy, B.M. Design and simulation dual-band PIFA antenna for GSM systems. In Proceedings of the International Multi-Conference on Systems, Signals and Devices, Chemnitz, Germany, 20–23 March 2012; pp. 1–4. [Google Scholar] [CrossRef]
  68. AbuTarboush, H.F.; Nilavalan, R.; Budimir, D.; Al-Raweshidy, H.S. Compact planar inverted-F antenna (PIFA) for WiMAX application. In Proceedings of the 2009 IEEE Antennas and Propagation Society International Symposium, North Charleston, SC, USA, 1–5 June 2009; pp. 1–4. [Google Scholar] [CrossRef] [Green Version]
  69. Lawan, A.M.; Su, H.T.; Then, Y.L.; Zhang, J. Parallel dual-slot PIFA for 2.45 GHz rectenna applications. In Proceedings of the 2018 IEEE Sensors Applications Symposium (SAS), Seoul, Korea, 12–14 March 2018; pp. 1–4. [Google Scholar] [CrossRef]
  70. Fakih, M.A.; Diallo, A.; Le Thuc, P.; Staraj, R.; Mourad, O.; Rachid, E.A. Optimization of efficient dual band pifa system for MIMO half-duplex 4G/LTE and full-duplex 5G communications. IEEE Access 2019, 7, 128881–128895. [Google Scholar] [CrossRef]
  71. Gomez-Villanueva, R.; Linares-y-Miranda, R.; Tirado-Mendez, J.A.; Jardon-Aguilar, H. Ultra-wideband planar inverted-F antenna (PIFA) for mobile phone frequencies and ultra-wideband applications. Prog. Electromagn. Res. 2013, 43, 109–120. [Google Scholar] [CrossRef] [Green Version]
  72. Gómez-Villanueva, R.; Jardón-Aguilar, H.; Linares-y-Miranda, R. Broadband PIFA antenna for mobile communications terminals. In Proceedings of the XIth International Conference on Electrical Engineering, Computing Science and Automatic Control (CCE), Campeche, Mexico, 29 September–3 October 2014; pp. 1–6. [Google Scholar] [CrossRef]
  73. Anguera, J.; Sanz, I.; Mumbrú, J.; Puente, C. Multiband handset antenna with a parallel excitation of PIFA and slot radiators. IEEE Trans. Antennas Propag. 2009, 58, 348–356. [Google Scholar] [CrossRef] [Green Version]
  74. Naji, D.K.; Abdul-kareem, A. A dual-band U-slot PIFA antenna with ground slit for RFID applications. J. Emerg. Trends Comput. Inf. Sci. 2013, 4, 213–219. [Google Scholar]
  75. Mohammad, T.I.; Md. Amanath, U.; Touhidul, A.; Mandeep, J.S.; Mengu, C. Microwave imaging sensor using low profile modified stacked type planar inverted-F Antenna. Sensors 2018, 18, 2949. [Google Scholar] [CrossRef] [Green Version]
  76. Garbaruk, M.; Mieczynska, M. Design and characteristics of multilayer PIFA antenna for GPS and Bluetooth systems. Prz. Elektrotechniczny 2018, 94, 91–94. [Google Scholar]
  77. Liu, W.C.; Yeh, F.M.; Ghavami, M. Miniaturized implantable broadband antenna for biotelemetry communication. Microw. Opt. Technol. Lett. 2008, 50, 2407–2409. [Google Scholar] [CrossRef]
  78. Lee, C.M.; Yo, T.C.; Luo, C.H.; Tu, C.H.; Juang, Y.Z. Compact broadband stacked implantable antenna for biotelemetry with medical devices. Electron. Lett. 2007, 43, 660–662. [Google Scholar] [CrossRef]
  79. Nayeri, P.; Lee, K.F.; Elsherbeni, A.Z.; Yang, F. Dual-band circularly polarized antennas using stacked patches with asymmetric U-slots. IEEE Antennas Wirel. Propag. Lett. 2011, 10, 492–495. [Google Scholar] [CrossRef]
  80. Panayi, P.K.; Al-Nuaimi, M.; Ivrissimtzis, L.P. Tuning techniques for the planar inverted-F antenna. In Proceedings of the IEE National Conference on Antennas and Propagation, York, UK, 1 April–March 1999. [Google Scholar] [CrossRef] [Green Version]
  81. Chattha, H.T.; Huang, Y.; Lu, Y. PIFA bandwidth enhancement by changing the widths of feed and shorting plates. IEEE Antennas Wirel. Propag. Lett. 2009, 8, 637–640. [Google Scholar] [CrossRef]
  82. Wong, K.L. Compact and Broadband Microstrip Antennas; John Wiley & Sons: Hoboken, NJ, USA, 2004. [Google Scholar]
  83. Wong, K.L.; Yang, K.P. Modified planar inverted-F antenna. Electron. Lett. 1998, 34, 7–8. [Google Scholar] [CrossRef]
  84. Verma, A.; Raghava, N.S. Compact slotted meandered PIFA antenna for wireless applications. J. Adv. Res. Dyn. Control. Syst. 2017, 9, 28–34. [Google Scholar]
  85. Karilainen, A.O.; Ikonen, P.M.; Simovski, C.R.; Tretyakov, S.A.; Lagarkov, A.N.; Maklakov, S.A.; Starostenko, S.N. Experimental studies on antenna miniaturisation using magneto-dielectric and dielectric materials. Iet Microw. Antennas Propag. 2011, 5, 495–502. [Google Scholar] [CrossRef] [Green Version]
  86. Tang, I.T.; Lin, D.B.; Chen, W.L.; Horng, J.H.; Li, C.M. Compact five-band meandered PIFA by using meandered slots structure. In Proceedings of the IEEE Antennas and Propagation Society International Symposium, Honolulu, HI, USA, 9–15 June 2007; pp. 653–656. [Google Scholar] [CrossRef]
  87. Chen, H.T.; Wong, K.L.; Chiou, T.W. PIFA with a meandered and folded patch for the dual-band mobile phone application. IEEE Trans. Antennas Propag. 2003, 51, 2468–2471. [Google Scholar] [CrossRef]
  88. Verma, A.; Saini, G. Design of meandered PIFA antenna for wireless application. Int. J. Adv. Commun. Technol. 2014, 1, 27–29. [Google Scholar]
  89. Azremi, A.A.H.; Saidatul, N.A.; Ahmad, R.B.; Soh, P.J. A parametric study of broadband planar inverted F antenna (PIFA) for WLAN application. In Proceedings of the International Conference on Electronic Design, Penang, Malaysia, 1–3 December 2008; pp. 1–6. [Google Scholar] [CrossRef]
  90. International Electrotechnical Comission (IEC). High-Voltage Test Techniques—Partial Discharge Measurements; IEC 60270:2000+AMD1:2015 CSV; IEC: Geneva, Switzerland, 2015. [Google Scholar]
  91. Kondrath, N.; Kazimierczuk, M.K. Bandwidth of current transformers. IEEE Trans. Instrum. Meas. 2008, 58, 2008–2016. [Google Scholar] [CrossRef]
  92. Álvarez, F.; Garnacho, F.; Ortego, J.; Sánchez-Urán, M.Á. Application of HFCT and UHF sensors in on-line partial discharge measurements for insulation diagnosis of high voltage equipment. Sensors 2015, 15, 7360–7387. [Google Scholar] [CrossRef] [Green Version]
  93. Albarracín-Sánchez, R.; Álvarez-Gómez, F.; Vera-Romero, C.A.; Rodríguez-Serna, J.M. Separation of partial discharge sources measured in the high-frequency range with HFCT sensors using PRPD-teff patterns. Sensors 2020, 20, 382. [Google Scholar] [CrossRef] [Green Version]
  94. Rodrigo, M.A.; Castro Heredia, L.C.; Munoz, F.A. A Novel Approach for partial discharge measurements on GIS using HFCT sensors. Sensors 2018, 18, 4482. [Google Scholar] [CrossRef] [Green Version]
  95. Kazimierczuk, M.K. High-Frequency Magnetic Components; John Wiley & Sons: Hoboken, NJ, USA, 2009. [Google Scholar]
  96. Zhu, J.; Yang, L.; Jia, J.; Zhang, Q. The design of Rogowski coil with wide band using for partial discharge measurements. In Proceedings of the International Symposium on Electrical Insulating Materials (ISEIM), Kitakyushu, Japan, 5–9 June 2005; Volume 2, pp. 518–521. [Google Scholar] [CrossRef]
  97. Zachariades, C.; Shuttleworth, R.; Giussani, R.; MacKinlay, R. Optimization of a high-frequency current transformer sensor for partial discharge detection using finite-element analysis. IEEE Sens. J. 2016, 16, 7526–7533. [Google Scholar] [CrossRef] [Green Version]
  98. Kunicki, M. Comparison of capacitive and inductive sensors designed for partial discharges measurements in electrical power apparatus. In Proceedings of the E3S Web of Conferences, EDP Sciences, Polanica-Zdrój, Poland, 13–15 September 2017; Volume 19, p. 01035. [Google Scholar]
  99. Vedral, J.; Kříž, M. Signal processing in partial discharge measurement. Metrol. Meas. Syst. 2010, 7, 55–64. [Google Scholar] [CrossRef] [Green Version]
  100. Baker, P.C.; Judd, M.D.; McArthur, S.D.J. A frequency-based RF partial discharge detector for low-power wireless sensing. IEEE Trans. Dielectr. Electr. Insul. 2010, 17, 133–140. [Google Scholar] [CrossRef] [Green Version]
  101. IEEE Instrument and Measurement Society. IEEE Standard for a Precision Clock Synchronization Protocol for Networked Measurement and Control Systems. IEEE 1588–2008 Standard. Available online: https://ieeexplore.ieee.org/document/4579760 (accessed on 24 June 2020).
  102. IEEE Standard for Local and Metropolitan Area Networks—Timing and Synchronization for Time-Sensitive Applications. P802.1AS-Rev. Available online: https://ieeexplore.ieee.org/document/5741898 (accessed on 24 June 2020).
  103. International Electrotechnical Comission (IEC). Communication Networks and System for Utility Automation—Part 1: Introduction and Overview, 2nd ed.; IEC 61850-1; IEC: Geneva, Switzerland, 2012. [Google Scholar]
  104. International Electrotechnical Comission (IEC). Measuring Relays and Protection Equipment—Part 26: Electromagnetic Compatibility Requirement; IEC 60255-26:2013; IEC: Geneva, Switzerland, 2013. [Google Scholar]
  105. Walczak, K. Zdalny pomiar napiecia na stanowisku probierczym w laboratorium wysokich napiec. Prz. Elektrotechniczny 2008, 84, 207–209. [Google Scholar]
  106. International Electrotechnical Comission (IEC). Power Transformers—Part 3: Insulation Levels, Dielectric Tests and External Clearances in Air; IEC 60076-3:2013; IEC: Geneva, Switzerland, 2013. [Google Scholar]
  107. Wang, H.; Li, C.; He, H. Influence of temperature to developing processes of surface discharges in oil-paper insulation. In Proceedings of the IEEE International Symposium on Electrical Insulation (ISEI), San Diego, CA, USA, 6–9 June 2010. [Google Scholar] [CrossRef]
  108. Lia, R.; Hao, J.; Chen, G.; Ma, Z.; Yang, L. A comparative study of physicochemical, dielectric and thermal properties of pressboard insulation impregnated with natural ester and mineral oil. IEEE Trans. Dielectr. Electr. Insul. 2011, 18, 1626–1637. [Google Scholar] [CrossRef] [Green Version]
  109. Buerschaper, B.; Kleboth-Lugova, O.; Leibfried, T. The electrical strength of transformer oil in a transformerboard-oil system during moisture non-equilibrium. In Proceedings of the Conference on Electrical Insulation and Dielectric Phenomena, Albuquerque, NM, USA, 19–22 October 2003; pp. 269–272. [Google Scholar] [CrossRef]
  110. Niasar, M.G. Partial Discharge Signatures of Defects in Insulation Systems Consisting of Oil and Oil-impregnated Paper. Ph.D. Thesis, KTH Royal Institute of Technology, Stockholm, Sweden, 2012. [Google Scholar]
  111. Borsi, H.; Schroder, U. Initiation and Formation of partial discharges in mineralbased insulating oil. IEEE Trans. Dielectr. Electr. Insul. 1994, 1, 419–425. [Google Scholar] [CrossRef]
  112. Dai, J.; Wang, Z.D.; Jarman, P. Moisture and aging effect on the creepage discharge characteristics at the oil/transformer-board interface under divergent field. In Proceedings of the Conference on Electrical Insulation Dielectric Phenomena, Quebec, QC, Canada, 26–29 October 2008. [Google Scholar] [CrossRef]
  113. Partial Discharges in Transformer Insulation-CIGRE Task Force 15.01.04. Paris. 2000. Available online: https://e-cigre.org/publication/676-partial-discharges-in-transformers (accessed on 24 June 2020).
  114. Przybylek, P. Water saturation limit of insulating liquids and hygroscopicity of cellulose in aspect of moisture determination in oil-paper insulation. IEEE Trans. Dielectr. Electr. Insul. 2016, 23, 1886–1893. [Google Scholar] [CrossRef]
  115. Gielniak, J.; Graczkowski, A.; Moranda, H.; Przybylek, P.; Walczak, K.; Nadolny, Z.; Moscicka-Grzesiak, H.; Feser, K.; Gubanski, S.M. Moisture in cellulose insulation of power transformers-statistics. IEEE Trans. Dielectr. Electr. Insul. 2013, 20, 982–987. [Google Scholar] [CrossRef]
  116. Przybylek, P.; Nadolny, Z.; Moscicka-Grzesiak, H. Bubble effect as a consequence of dielectric losses in cellulose insulation. IEEE Trans. Dielectr. Electr. Insul. 2010, 17, 913–919. [Google Scholar] [CrossRef]
  117. Gil, W.; Maslowski, W.; Wronek, P.; Jechorek, E.; Sikorski, W.; Walczak, K. Development and Implementation of Partial Discharges On-Line Monitoring Module in GIS 110kV Switchgears; CIGRE Session 2020; CIGRE: Paris, France, 2020; accepted for printing. [Google Scholar]
Figure 1. Schematic diagram of the general structure of the developed on-line partial discharges monitoring system for power transformers.
Energies 13 03271 g001
Figure 2. Technical drawing of the active dielectric window.
Energies 13 03271 g002
Figure 3. Photographs of the active dielectric window produced.
Energies 13 03271 g003
Figure 4. Schematic diagram of the conventional planar inverted-F antenna (PIFA).
Energies 13 03271 g004
Figure 5. Schematic diagram of the meandered PIFA.
Energies 13 03271 g005
Figure 6. Simulated VSWR for meandered PIFA with various loading chip resistors and constant H = 5.0 mm.
Energies 13 03271 g006
Figure 7. Simulated VSWR for prototype meandered PIFA with various distances H between patch and ground plane and with the same loading chip resistor with resistance R = 5.4 Ω.
Energies 13 03271 g007
Figure 8. Components of the ISO-002-ADW/UHF sensor: 1 = meandered PIFA, 2 = N-type connector, 3 = cylindrical PTFE-housing, 4 = active dielectric window, 5 = enclosure for partial discharge (PD) pulses conditioning module and analog-to-digital processing module, 6 = fiber optic cable gland, 7 = cable gland for power supply, 8 = shielding tube for signal cables, 9 = inspection hole cover.
Energies 13 03271 g008
Figure 9. Simulated and measured VSWR of the prototype meandered PIFA.
Energies 13 03271 g009
Figure 10. Schematic diagram of the measurement setup in which PD detection sensitivity of the prototype UHF antenna was tested: U = high-voltage supply, Z = short-circuit current limiting resistor, OSC = four-channel oscilloscope, TT = oil-filled transformer tank, PD = electrode system for surface partial discharge generation, PA = prototype meandered PIFA, CA = commercial UHF disk antenna as reference, CK = coupling capacitor, CD = coupling device (measuring impedance), CC = connecting cable, M = conventional partial discharge detector, PC = computer.
Energies 13 03271 g010
Figure 11. The comparison of the exemplary UHF pulses registered by the commercial UHF disk antenna and prototype meandered PIFA for (a) surface PD of an apparent charge of q = 625 pC, (b) creeping spark of apparent charge of q = 4670 pC.
Energies 13 03271 g011
Figure 12. High-frequency current transformer model with parasitic components.
Energies 13 03271 g012
Figure 13. The components of sensor ISO-002-HF: 1 = MnZn ferrite core with secondary winding, 2 = insulation, 3 = N-type connector, 4 = high-frequency current transformer (HFCT) sensor housing, 5 = slit in metallic housing, 6 = adjustable latch, 7 = waterproof enclosure for electronics, 8 = cable gland for power supply, 9 = fiber optic cable gland.
Energies 13 03271 g013
Figure 14. Schematic diagram of the measurement setup for measuring the frequency response of the HFCT sensor; OSC = oscilloscope type Tektronix MDO3104, GEN = built-in arbitrary function generator, PC = computer, HFCT = high-frequency current transformer under test.
Energies 13 03271 g014
Figure 15. Frequency response of the prototype HFCT sensors depending on the number of turns N and the core material used: (a) MnZn soft ferrite, (b) NiZn soft ferrite, compared with frequency response of commercial HFCT sensors (RFCT-4 and HFCT 140/100).
Energies 13 03271 g015
Figure 16. Examination of HFCT sensors: (a) Schematic diagram of the measurement setup for measuring the impulse response of the HFCT sensor using standard PD calibrator: OSC = oscilloscope Tektronix MDO3104, HFCT = high-frequency current transformer under test, CAL = partial discharge calibrator type Doble LDC-5; (b) time waveform of PD calibration pulse with an apparent charge of 500 pC.
Energies 13 03271 g016
Figure 17. Impulse response of the prototype (MnZn ferrite core with three turns, NiZn ferrite core with four turns) and commercial HFCT sensors to partial discharge calibration impulse with an apparent charge of 500 pC.
Energies 13 03271 g017
Figure 18. Schematic diagram of the measurement setup for generating partial discharges in oil-paper insulation and assessing the sensitivity of high-frequency PD pulses detection by prototype and commercial HFCT sensors: U = high-voltage supply, Z = short-circuit current limiting resistor, OSC = four-channel oscilloscope, HFCT = high-frequency current transformers under test, TT = oil-filled transformer tank, PD = electrode system for partial discharge generation, C = coupling capacitor, CD = coupling device (measuring impedance), CC = connecting cable, M = conventional partial discharge detector, PC = computer.
Energies 13 03271 g018
Figure 19. Comparison of typical partial discharge time waveforms and power spectral density (PSD) characteristics registered for (a) PD in oil, and (b) surface PD with the use of selected prototype and commercial (RFCT-4, HFCT 140/100) HFCT sensors.
Energies 13 03271 g019
Figure 20. Schematic diagram of PD signal conditioning modules and A/D signal processing module and 3D drawing showing the mechanics of these modules: A = signal conditioning boards, B = analog-to-digital signal processing board, C = internal power supply module.
Energies 13 03271 g020
Figure 21. Exemplary time waveforms registered during laboratory tests of the PD signal conditioning modules: (a) conditioned UHF PD pulses and raw HF PD pulses, (b) conditioned single UHF PD pulse and conditioned acoustic emission (AE) PD pulses.
Energies 13 03271 g021
Figure 22. Schematic diagram and photograph of developed multi-channel data concentrator module MPD-001.
Energies 13 03271 g022
Figure 23. Schematic diagram of the measurement setup in which the monitoring system software module for performing PRPD patterns was tested: MS = partial discharge monitoring system, MPD = multichannel signal concentrator, S = server, PC = computer, U = high-voltage supply, Z = short-circuit current limiting resistor, TT = oil-filled transformer tank; PD = electrode system for partial discharge generation, C = coupling capacitor, CD = coupling device (measuring impedance), CC = connecting cable, M = conventional partial discharge measuring instrument.
Energies 13 03271 g023
Figure 24. Measurement results obtained with conventional electric method: (a) instantaneous value of apparent charge q, (b) PRPD pattern.
Energies 13 03271 g024
Figure 25. PRPD patterns obtained in a monitoring system for partial discharges pulses registered in a measurement channel: (a) of high frequency, (b) of ultra-high frequency.
Energies 13 03271 g025
Figure 26. The installation of the UHF antenna (ISO-002-UHF sensor) in the dielectric window of the 330 MVA power transformer.
Energies 13 03271 g026
Figure 27. Time sequence for the application of test voltage for induced voltage test with partial discharge measurement (IVPD).
Energies 13 03271 g027
Figure 28. Exemplary UHF PD pulses registered for different voltage levels during the IVPD test: (a) 284 kV, (b) 374 kV, (c) 473 kV.
Energies 13 03271 g028
Figure 29. Graphic presentation of the localization results of two partial discharges sources by the trilateration technique and the distribution of the eight AE sensors (blue dots).
Energies 13 03271 g029
Figure 30. The installation of the active dielectric windows with UHF antennas (ISO-002-ADW/UHF-1 and ISO-002-ADW/UHF-2) in the revision holes of the upper cover of the 31.5 MVA power transformer tank.
Energies 13 03271 g030
Figure 31. Photograph of the PD on-line monitoring system installed on 31.5 MVA substation power transformer.
Energies 13 03271 g031
Figure 32. Partial discharges intensity characteristics, voltage, load, and oil temperature characteristics registered during 8-days-operation of the monitoring system on the 31.5 MVA substation power transformer.
Energies 13 03271 g032
Figure 33. Hourly distribution of the UHF and AE pulses for sensor: (a) ISO-002-ADW/UHF-1 and (b) ISO-002-ADW/UHF-2.
Energies 13 03271 g033
Figure 34. Estimated marginal means of PD pulses.
Energies 13 03271 g034
Table 1. Properties of the high-strength aluminous porcelain used to construct the dielectric window.
ParameterSymbolValueUnit
Apparent (bulk) density 1ρb2500kg/m3
Flexural strength 1σ140MPa
Fracture toughness 1K2.0MPa·m1/2
Young’s modulus 1E100GPa
Abrasion resistance (volume loss)WV172mm3
Dielectric strength 1VB20kV/mm
Resistivity 1ρ1013Ω·cm
Thermal shock resistance 1Tc150K
1 Minimum values.
Table 2. Parameters of piezoelectric transducer components.
ComponentParameterSymbolValueUnit
Matching layer 1Thicknessd5.05mm
Densityρ2079kg/m3
Longitudinal velocityVL3029m/s
Shear velocityVS1640m/s
Bulk modulusK11.62GPa
Shear modulusG5.59GPa
Acoustic impedanceZM6.3MRayl
Piezoelectric ceramics
(PZT-5A disc)
Thicknessd6.2mm
Radiusr6.35mm
AreaA126.61mm2
Acoustic impedanceZ031.0MRayl
Backing layer 2Thicknessd8.8mm
Densityρ2546kg/m3
Longitudinal velocityVL1790m/s
Shear velocityVS845m/s
Acoustic impedanceZB4.56MRayl
Bulk modulusK5.74GPa
Shear modulusG1.82GPa
1 epoxy/alumina composite with 0.3825 volume fraction of alumina; 2 epoxy/tungsten composite with 0.08 volume fraction of tungsten.
Table 3. Dimensions of the prototype meandered PIFA.
ParameterIndicationValue (mm)
Width of the patchL162.5
Length of the patchL2100
Length of the slitS150
Width of the slitS22
Distance between patch and ground planeH5
Diameter of the circular ground planeD14
Distance between feeding point and resistord26.3
Table 4. Specifications of soft ferrite materials used in the study.
Ferrite Type ParameterSymbolValueUnitConditions
MnZn Initial permeabilityµi900 ± 20%25 °C; ≤ 10 kHz; 0.25 mT
Amplitude permeabilityµa≈ 1700100 °C; 25 kHz; 200 mT
Magnetic flux densityB≈ 410mT25 °C; 10 kHz; 1200 A/m
Specific power lossPv≈ 130kW/m3100 °C; 1 MHz; 30 mT
Loss factortann/a
Resistivityρ≈ 10ΩmDC; 25 °C
Curie temperatureTc≥ 220°C
DensityD≈ 4700kg/m3
NiZnInitial permeabilityµi125 ± 20%25 °C; ≤ 10 kHz; 0.25 mT
Amplitude permeabilityµan/a
Magnetic flux densityB≈ 380mT25 °C; 10 kHz; 3000 A/m
Specific power lossPvn/a
Loss factortan≤ 80 × 10-625 °C; 3 MHz; 0.25 mT
Resistivityρ≈ 105ΩmDC; 25 °C
Curie temperatureTc≥ 350°C
DensityD≈ 4500kg/m3
Table 5. Coordinates of AE sensors.
Sensor IndexX (m)Y (m)Z (m)
11.201.401.30
22.050.451.30
33.051.401.30
44.001.100.65
53.000.750.00
62.000.450.00
71.061.050.00
80.000.950.65
Table 6. Results of robust tests of equality of means.
PD Sensor LabelPulsesTestStatistics 1df1df2p
ISO-002-ADW/UHF-1UHFWelch289.93228,969.85< 0.0005
Brown–Forsythe371.11232,492.03< 0.0005
AEWelch149.51224,644.93< 0.0005
Brown–Forsythe176.34220,351.35< 0.0005
ISO-002-ADW/UHF-2UHFWelch60.18225,693.85< 0.0005
Brown–Forsythe39.05235,227.18< 0.0005
AEWelch1772.95223,518.60< 0.0005
Brown–Forsythe977.32232,563.54< 0.0005
ISO-002-HFHFCTWelch1486.10225,652.90< 0.0005
Brown–Forsythe914.83226,939.20< 0.0005
1 Asymptotically F distributed.
Table 7. Results of multiple comparisons of mean PD pulses within groups using post hoc Games–Howell test.
PD Sensor LabelPulsesTemperature GroupsMean Differencep
ISO-002-ADW/UHF-1UHFLow vs. Moderate−18.60 *< 0.0005
Low vs. High−79.08 *< 0.0005
Moderate vs. High−60.49 *< 0.0005
AELow vs. Moderate−4.95 *< 0.0005
Low vs. High−22.10 *< 0.0005
Moderate vs. High−17.15 *< 0.0005
ISO-002-ADW/UHF-2UHFLow vs. Moderate−0.74 *< 0.0005
Low vs. High−1.00 *< 0.0005
Moderate vs. High−0.260.154
AELow vs. Moderate−386.96 *< 0.0005
Low vs. High−534.64 *< 0.0005
Moderate vs. High−147.68 *< 0.0005
ISO-002-HFHFCTLow vs. Moderate−39.46 *< 0.0005
Low vs. High−25.98 *< 0.0005
Moderate vs. High13.48 *< 0.0005
* The mean difference is significant at the 0.05 level.

