Author Contributions
Investigation, N.S.S., M.H.A.H. and N.A.M.A.; Resources, W.F.H.W.Z.; Validation, M.F.M.D., A.R.A.R. and J.W.; Writing—original draft, N.S.S.; Writing—review & editing, N.S.S. and M.F.M.D. All authors have read and agreed to the published version of the manuscript.
Figure 1.
Reports on the breakdown voltage performance of nanofluids [
4,
6].
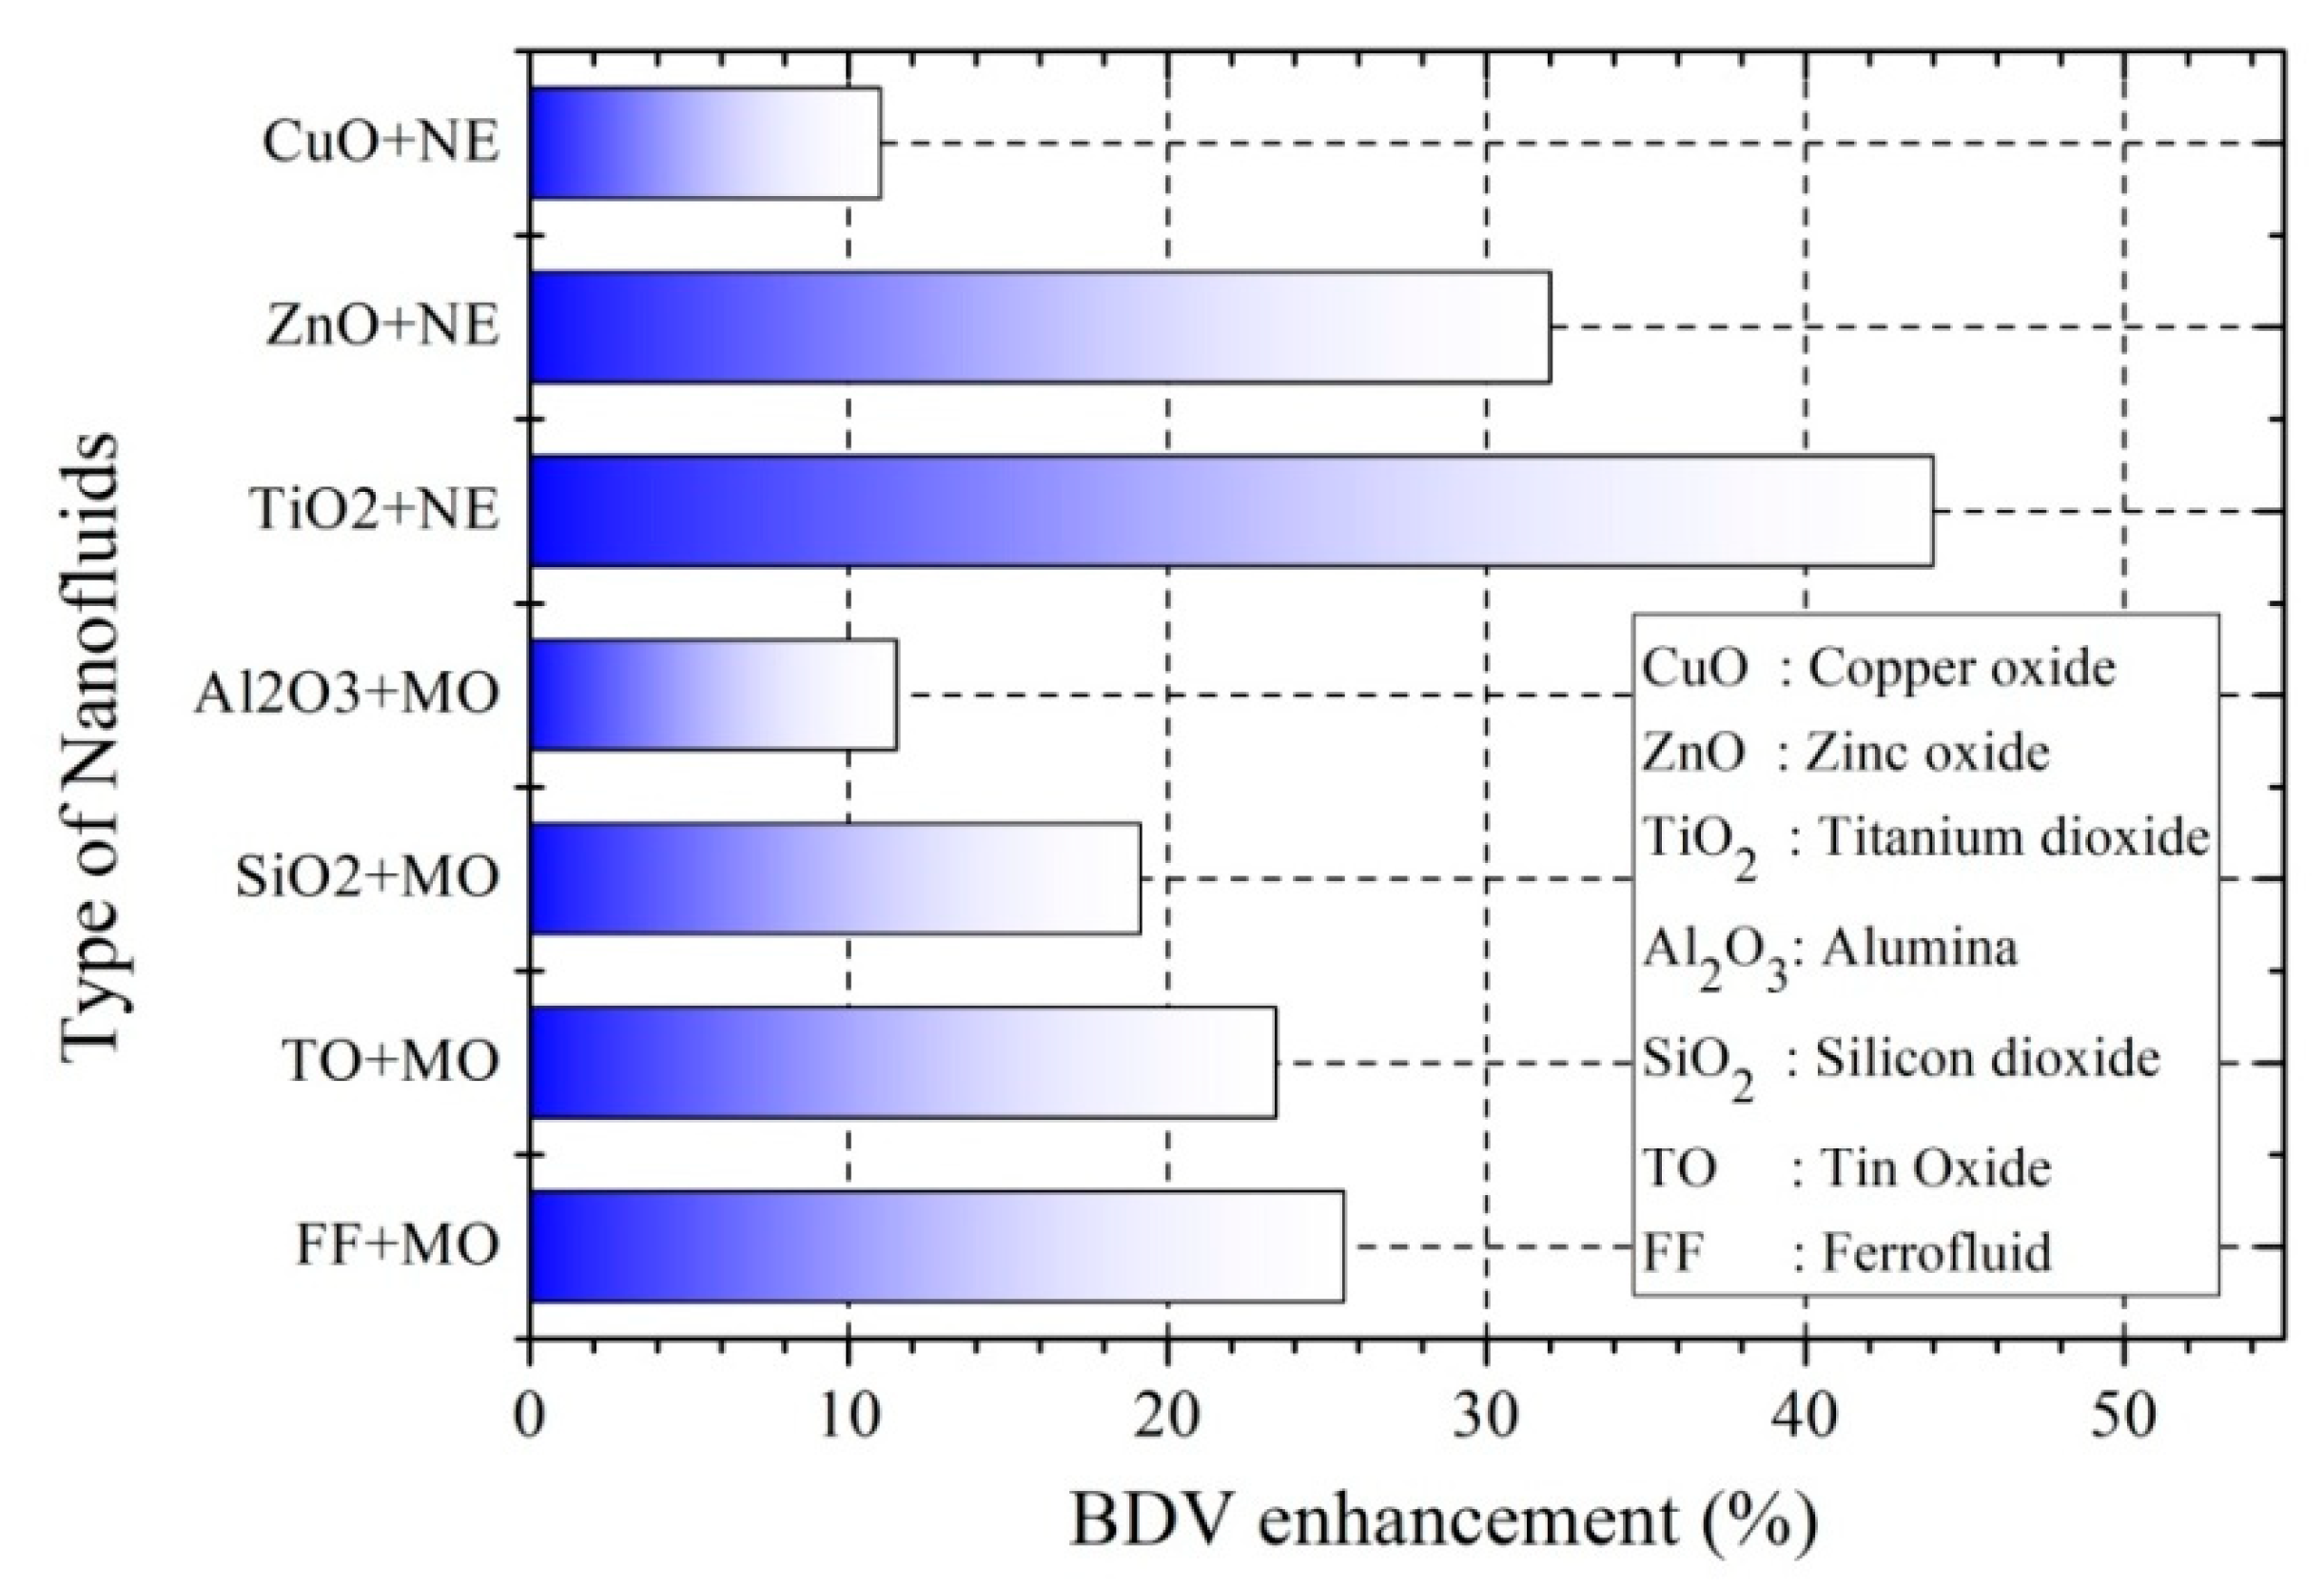
Figure 1.
Reports on the breakdown voltage performance of nanofluids [
4,
6].
Figure 2.
Reports on the LI performance of nanofluids [
6,
7].
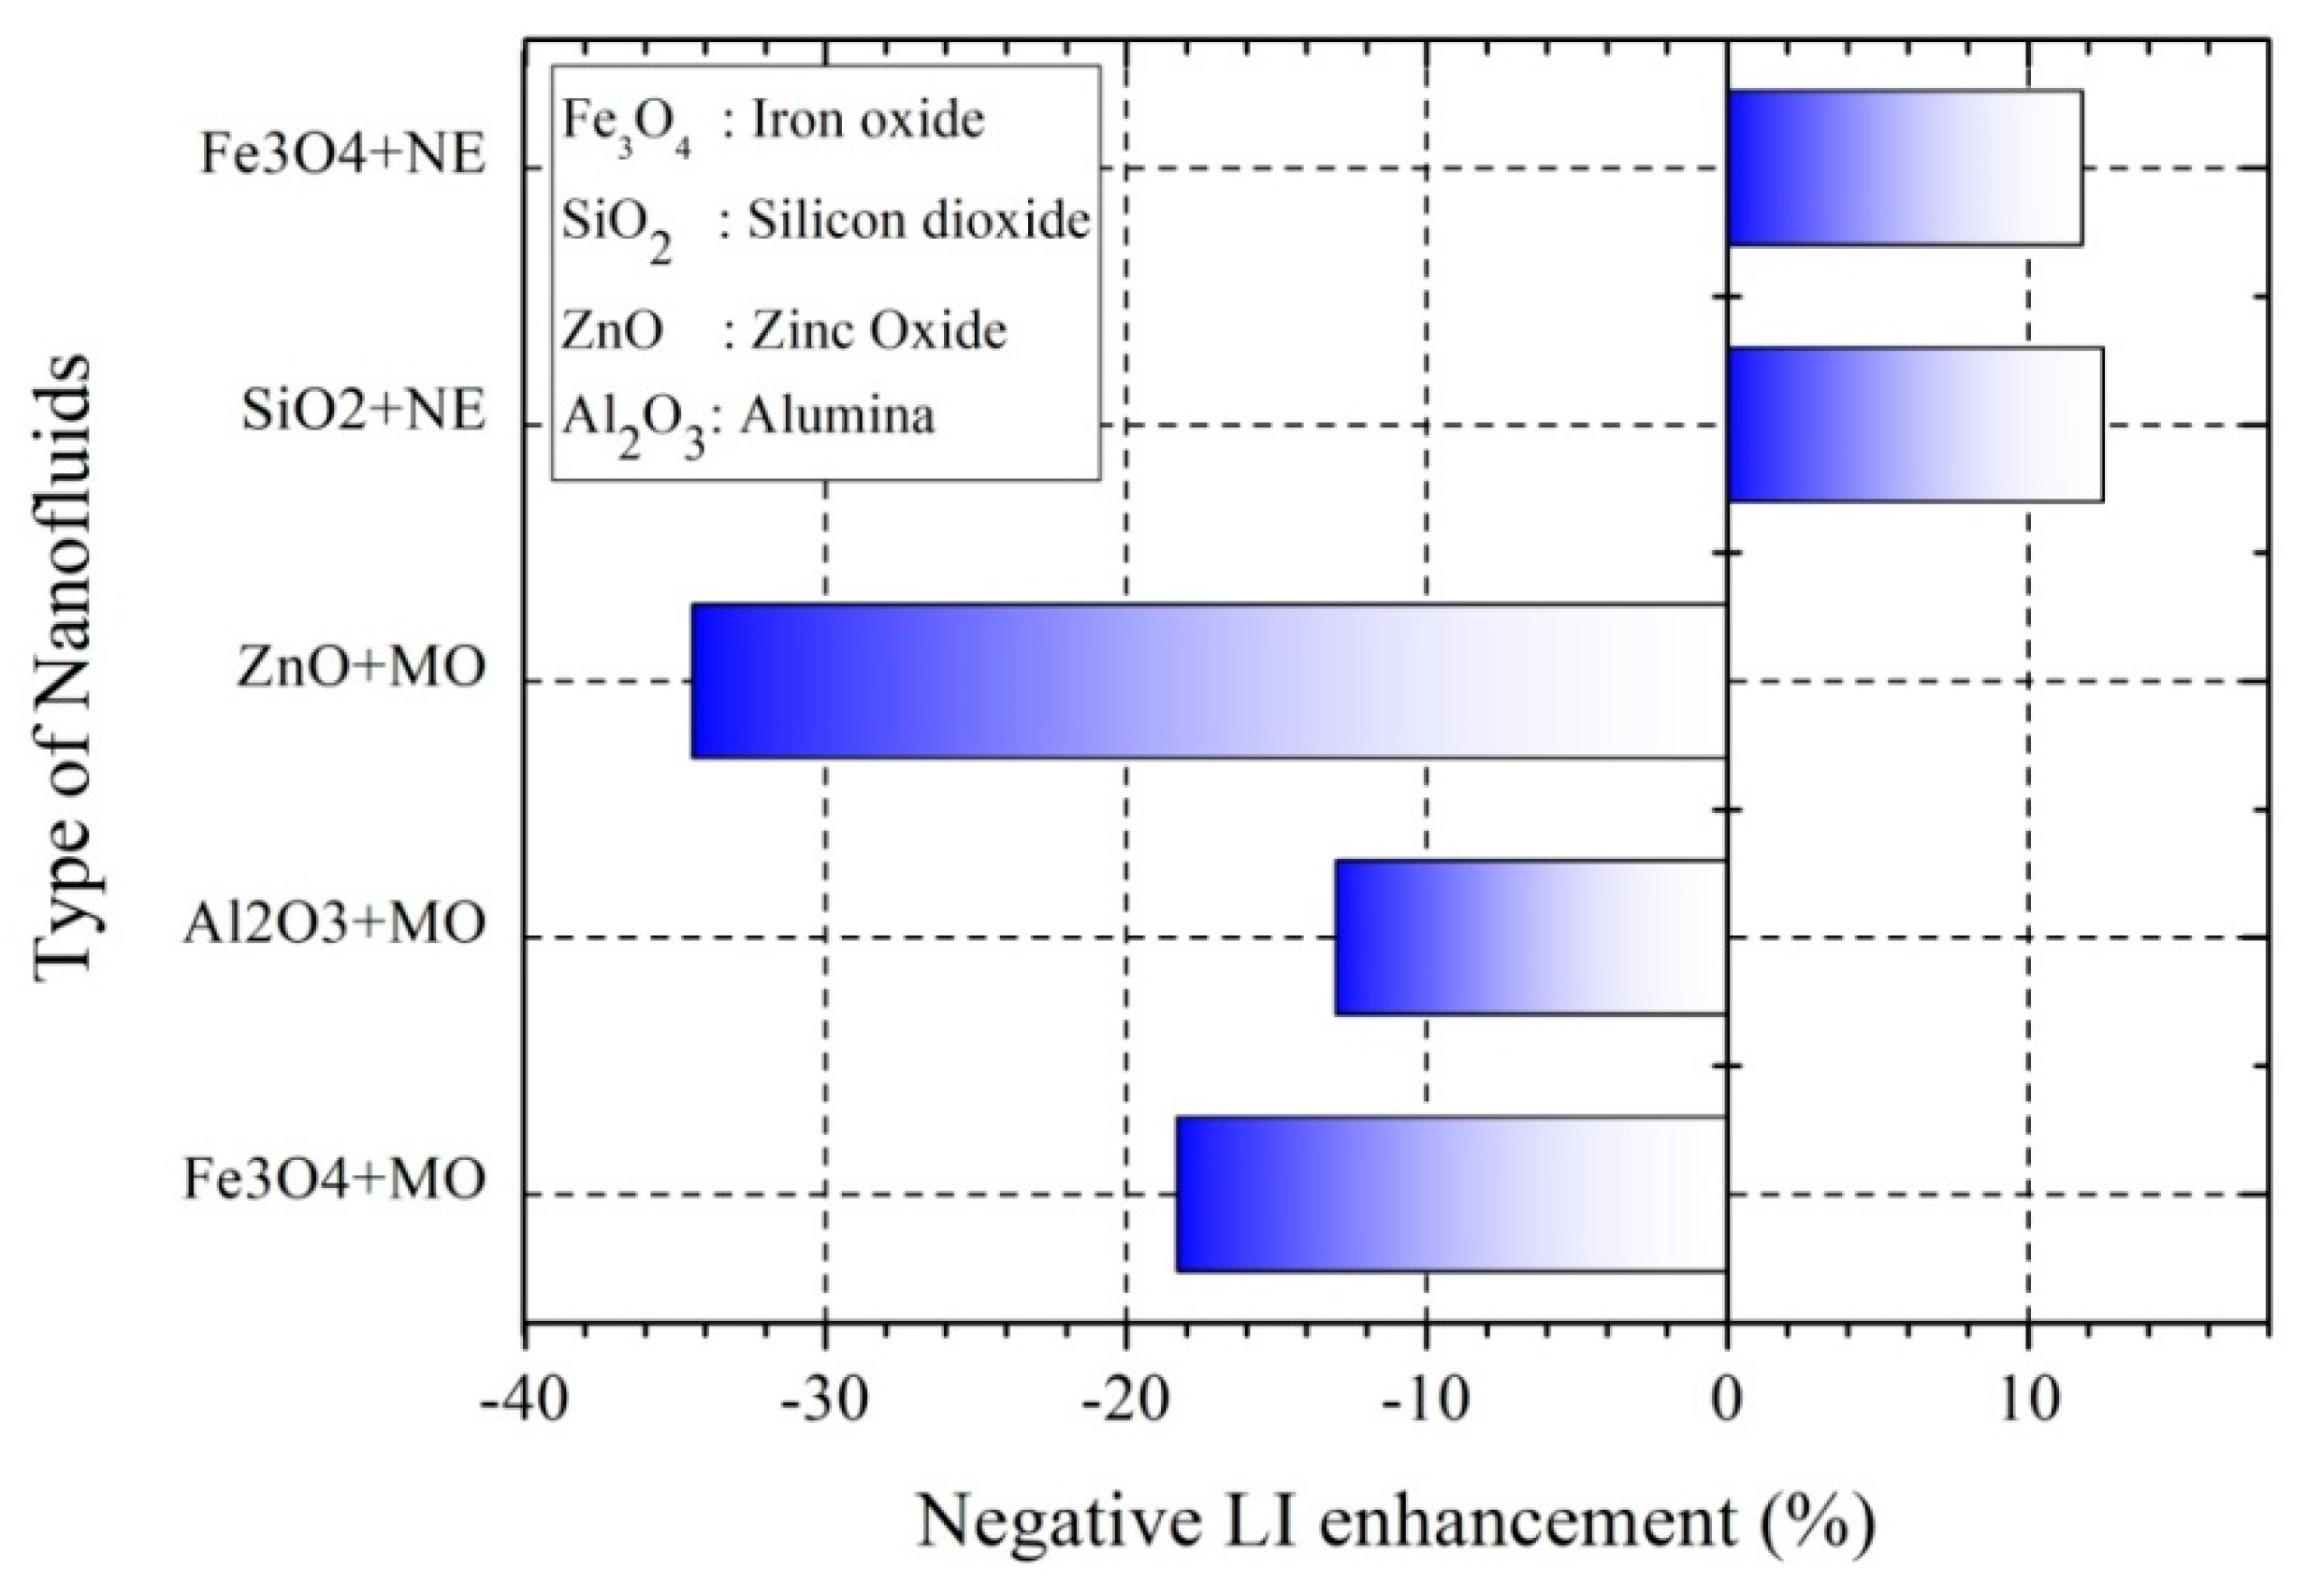
Figure 2.
Reports on the LI performance of nanofluids [
6,
7].
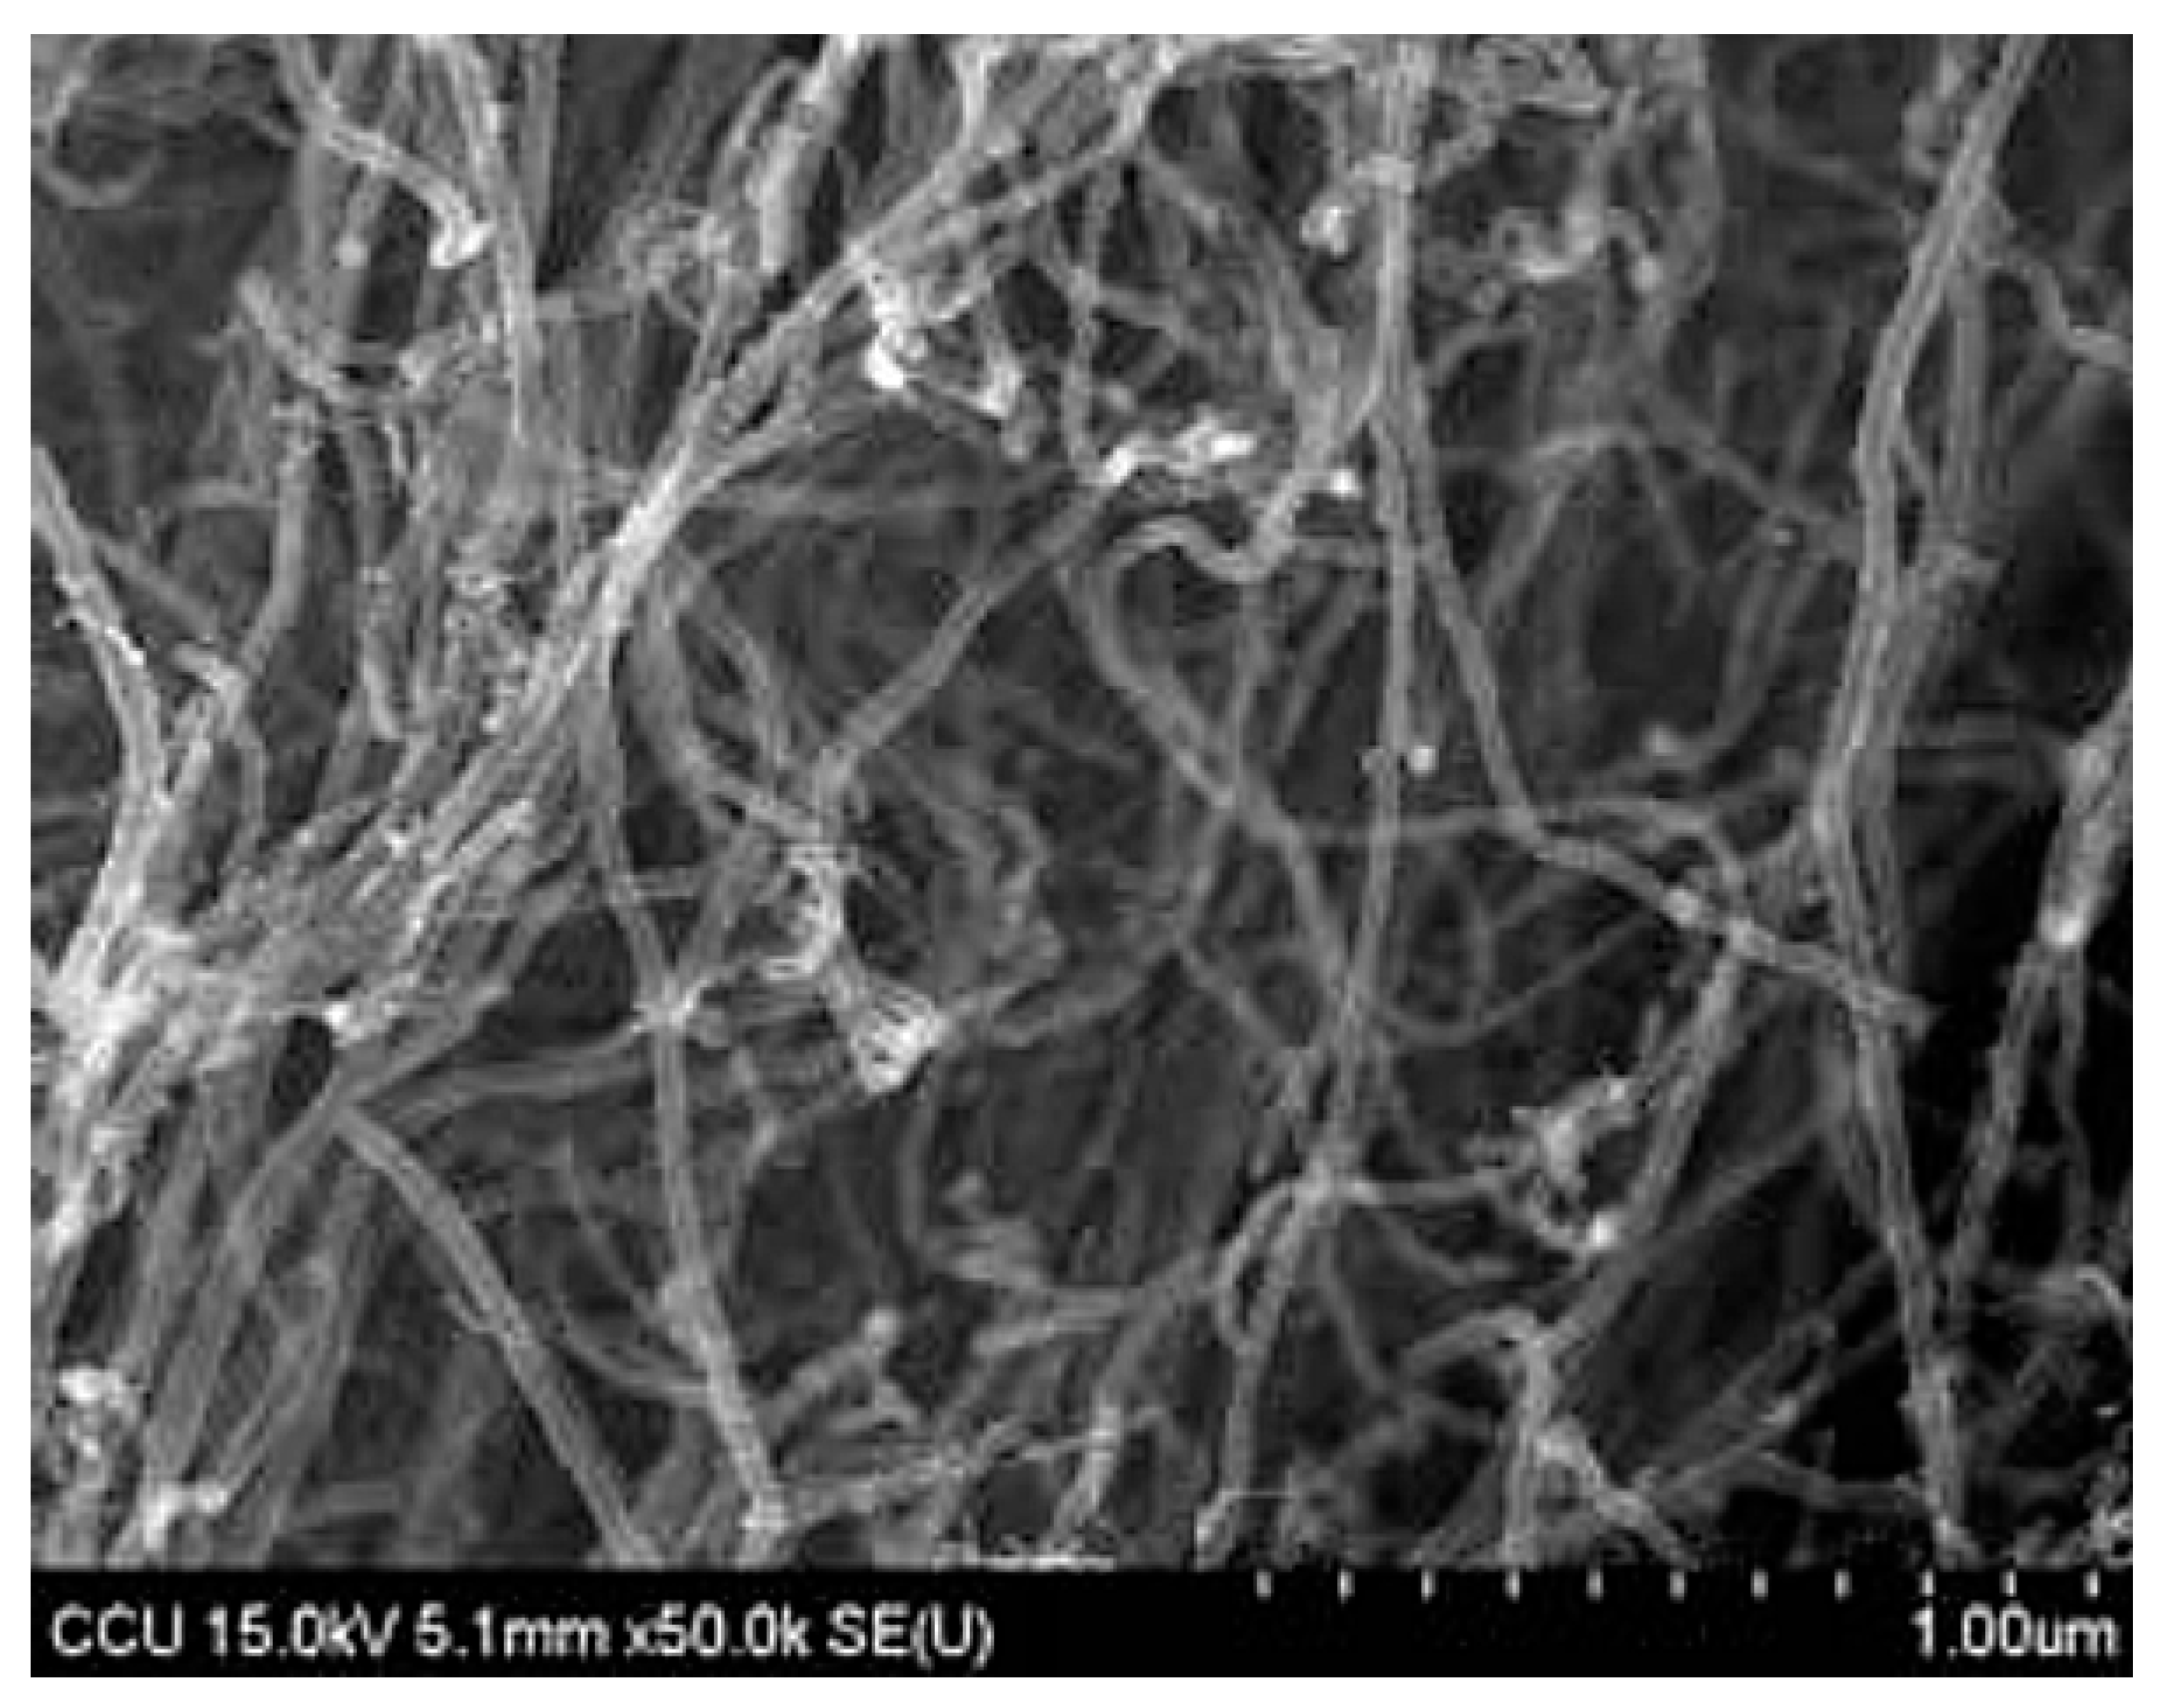
Figure 3.
Scanning Electron Microscopy (SEM) image of Multi-walled Carbon Nanotube.
Figure 3.
Scanning Electron Microscopy (SEM) image of Multi-walled Carbon Nanotube.
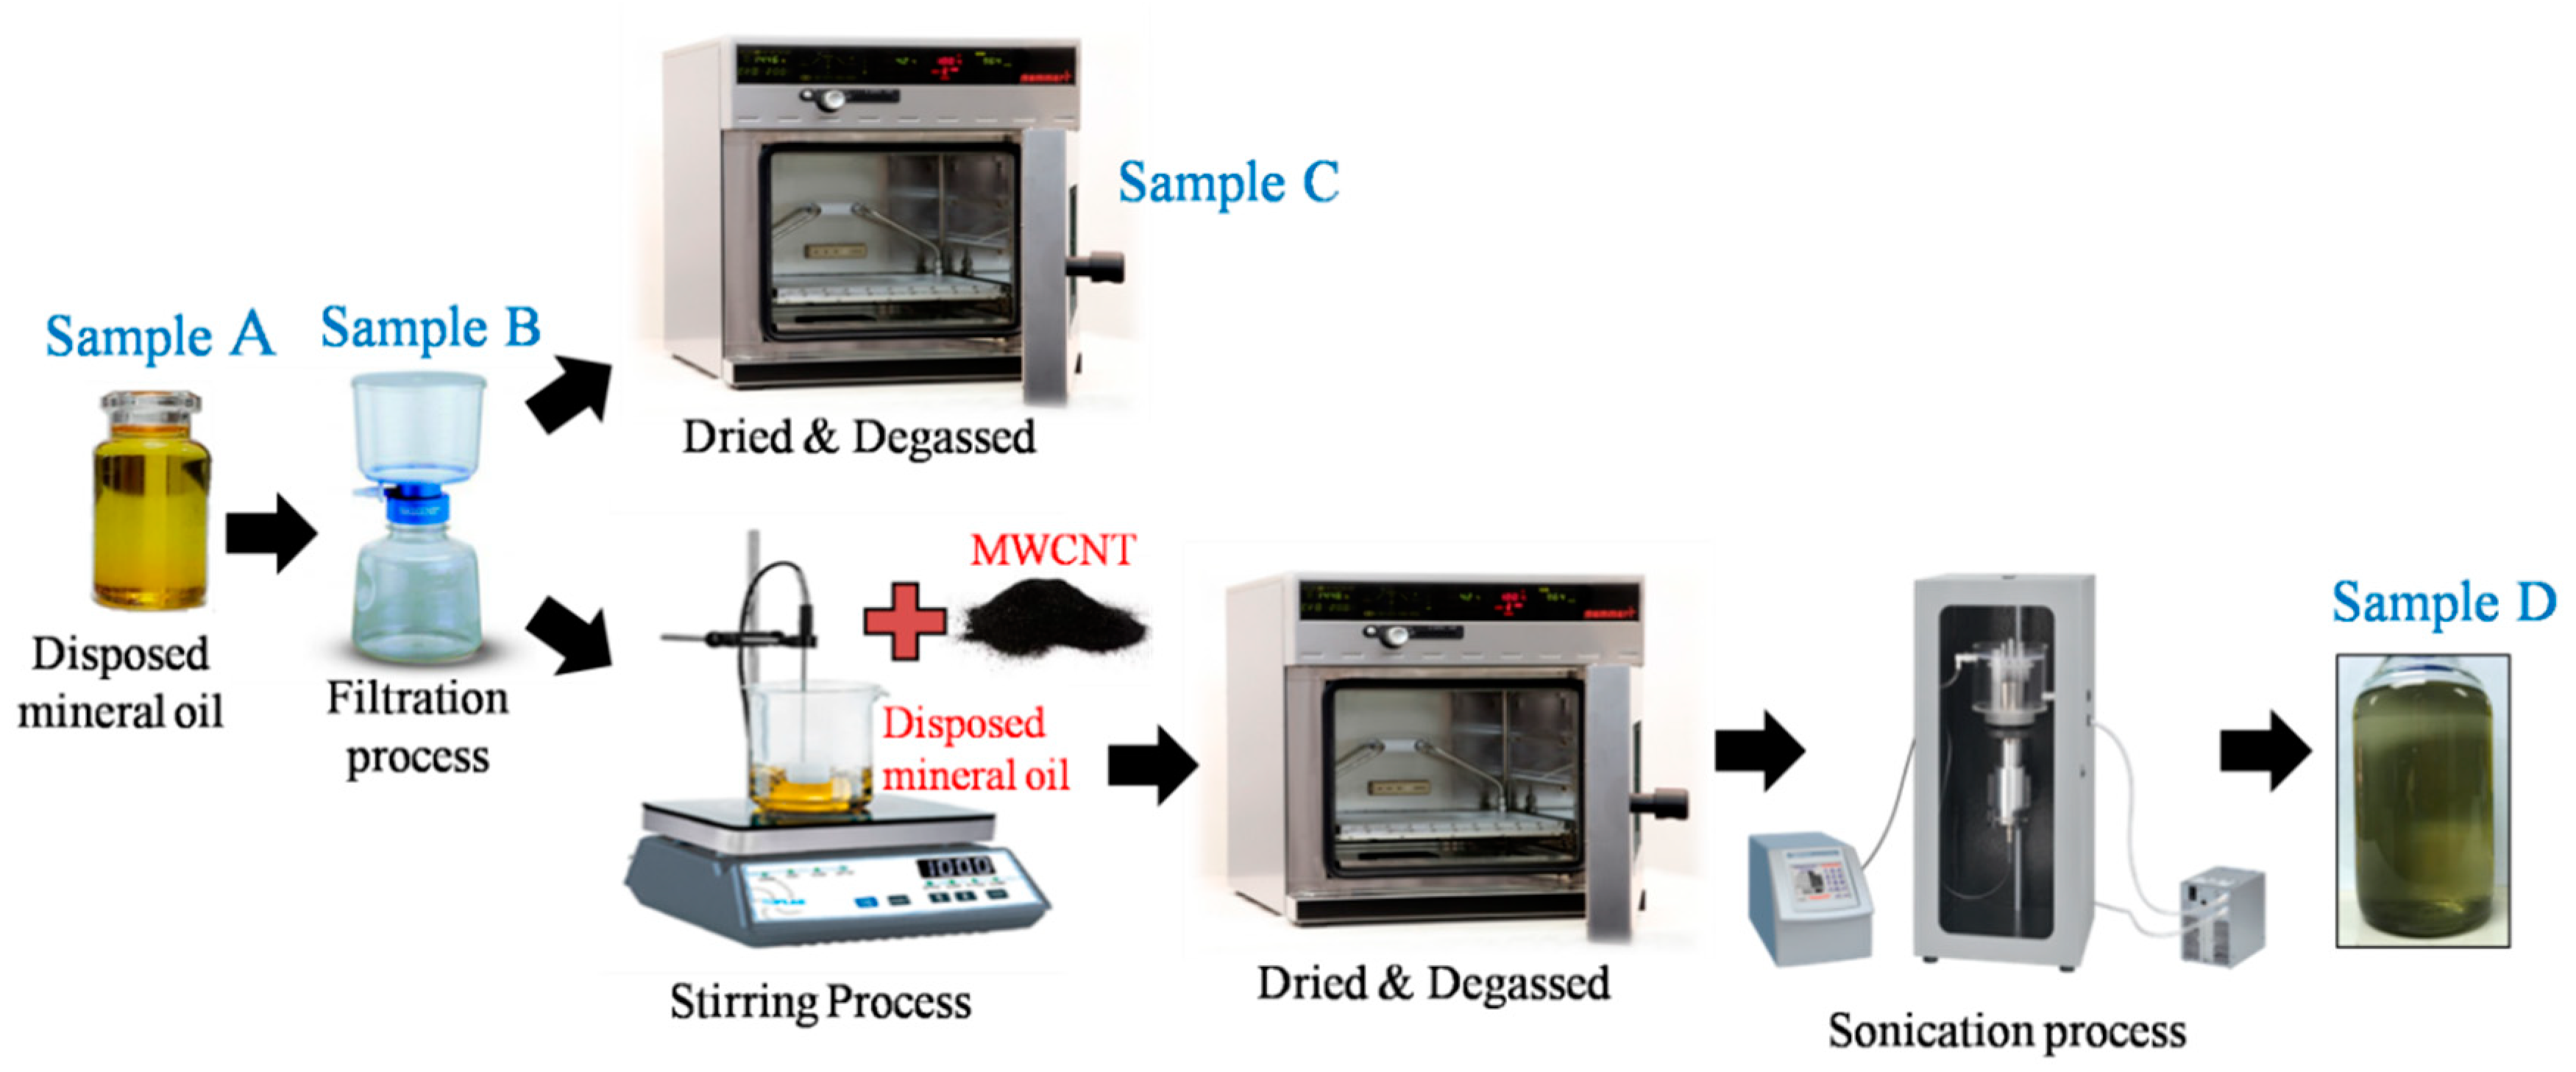
Figure 4.
Preparation process of MWCNT nanofluid.
Figure 4.
Preparation process of MWCNT nanofluid.
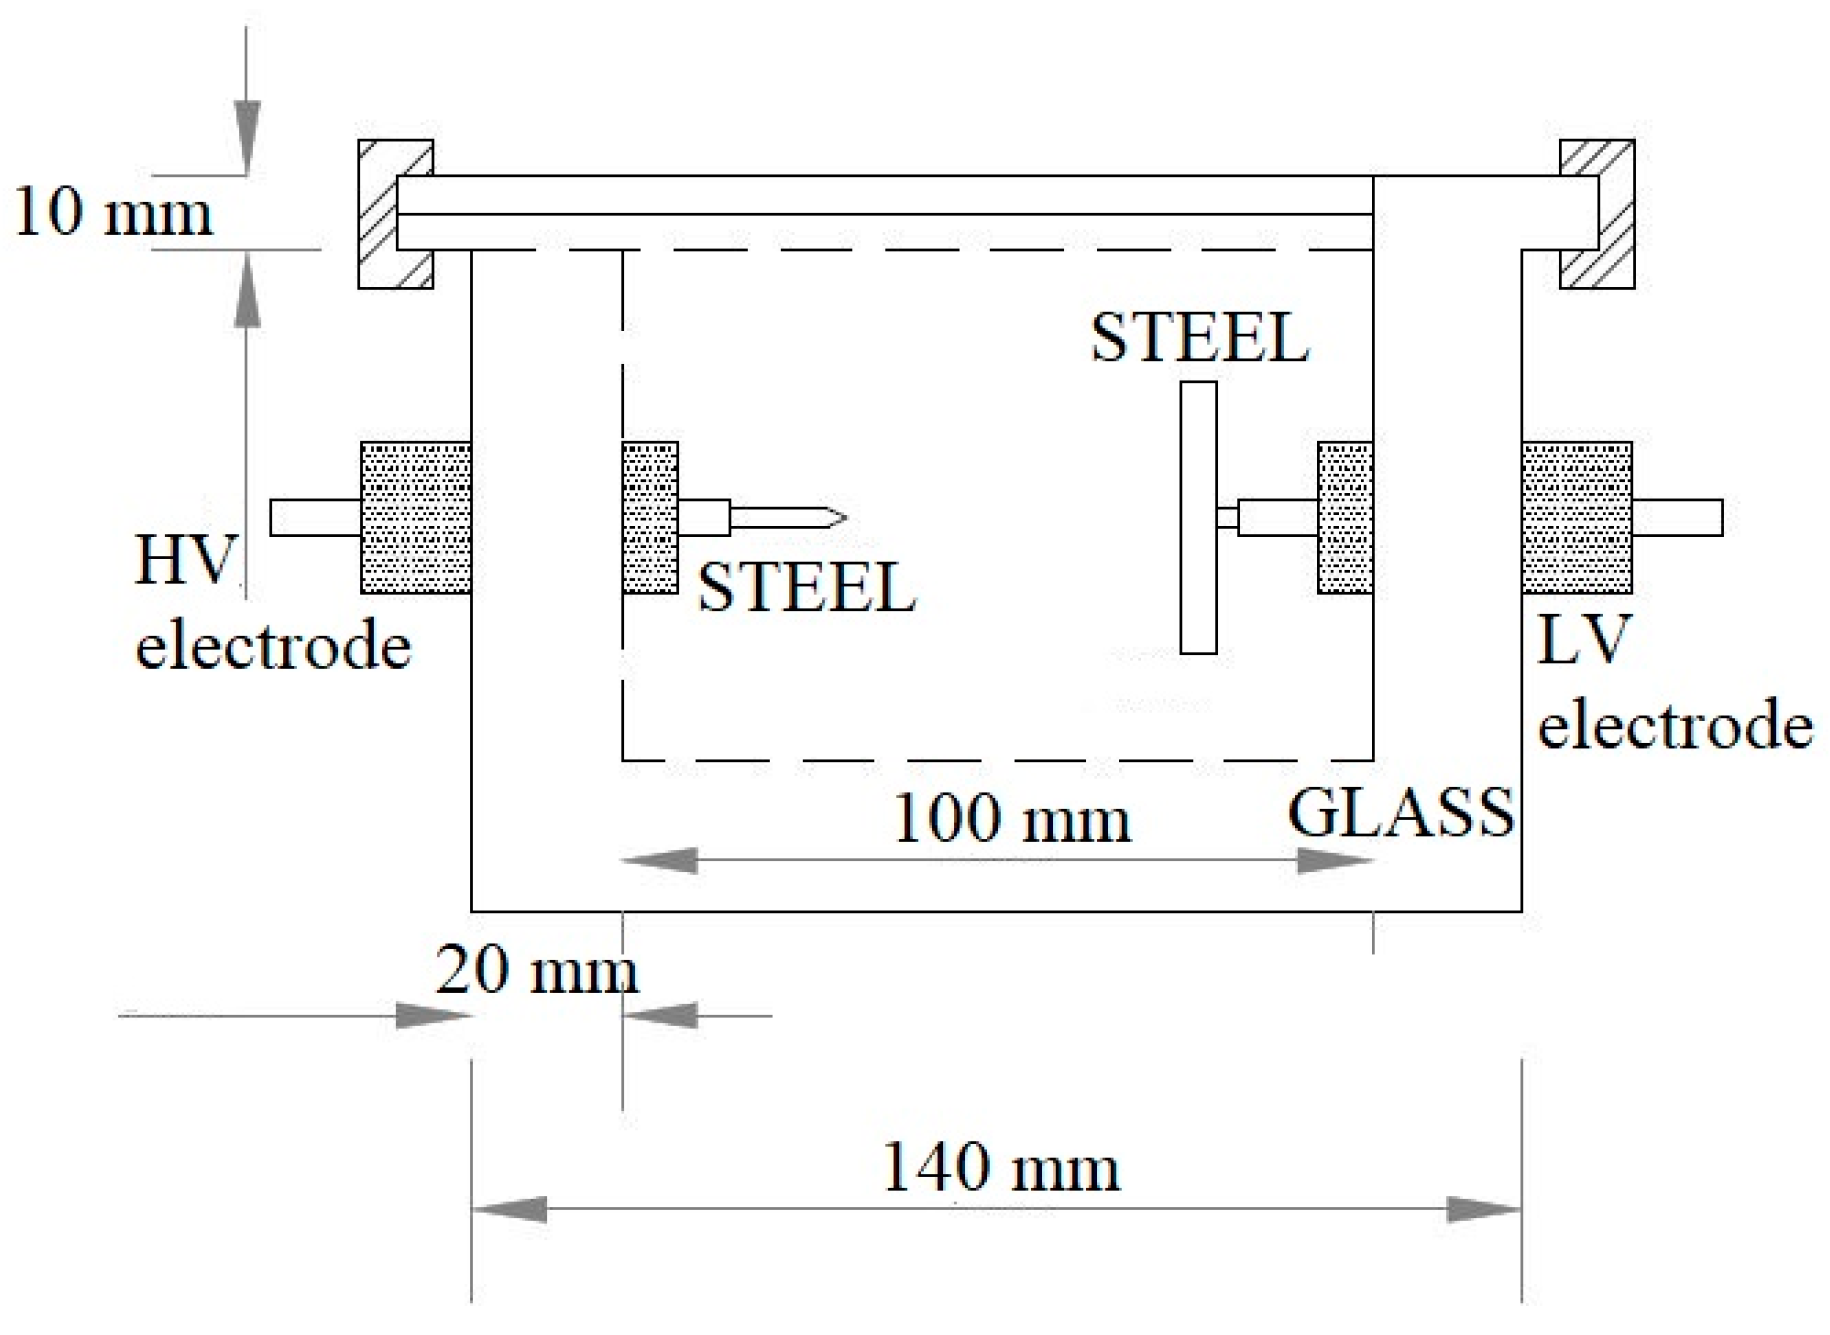
Figure 5.
Self-designed transparent test oil container for testing oil samples in the lightning impulse test.
Figure 5.
Self-designed transparent test oil container for testing oil samples in the lightning impulse test.
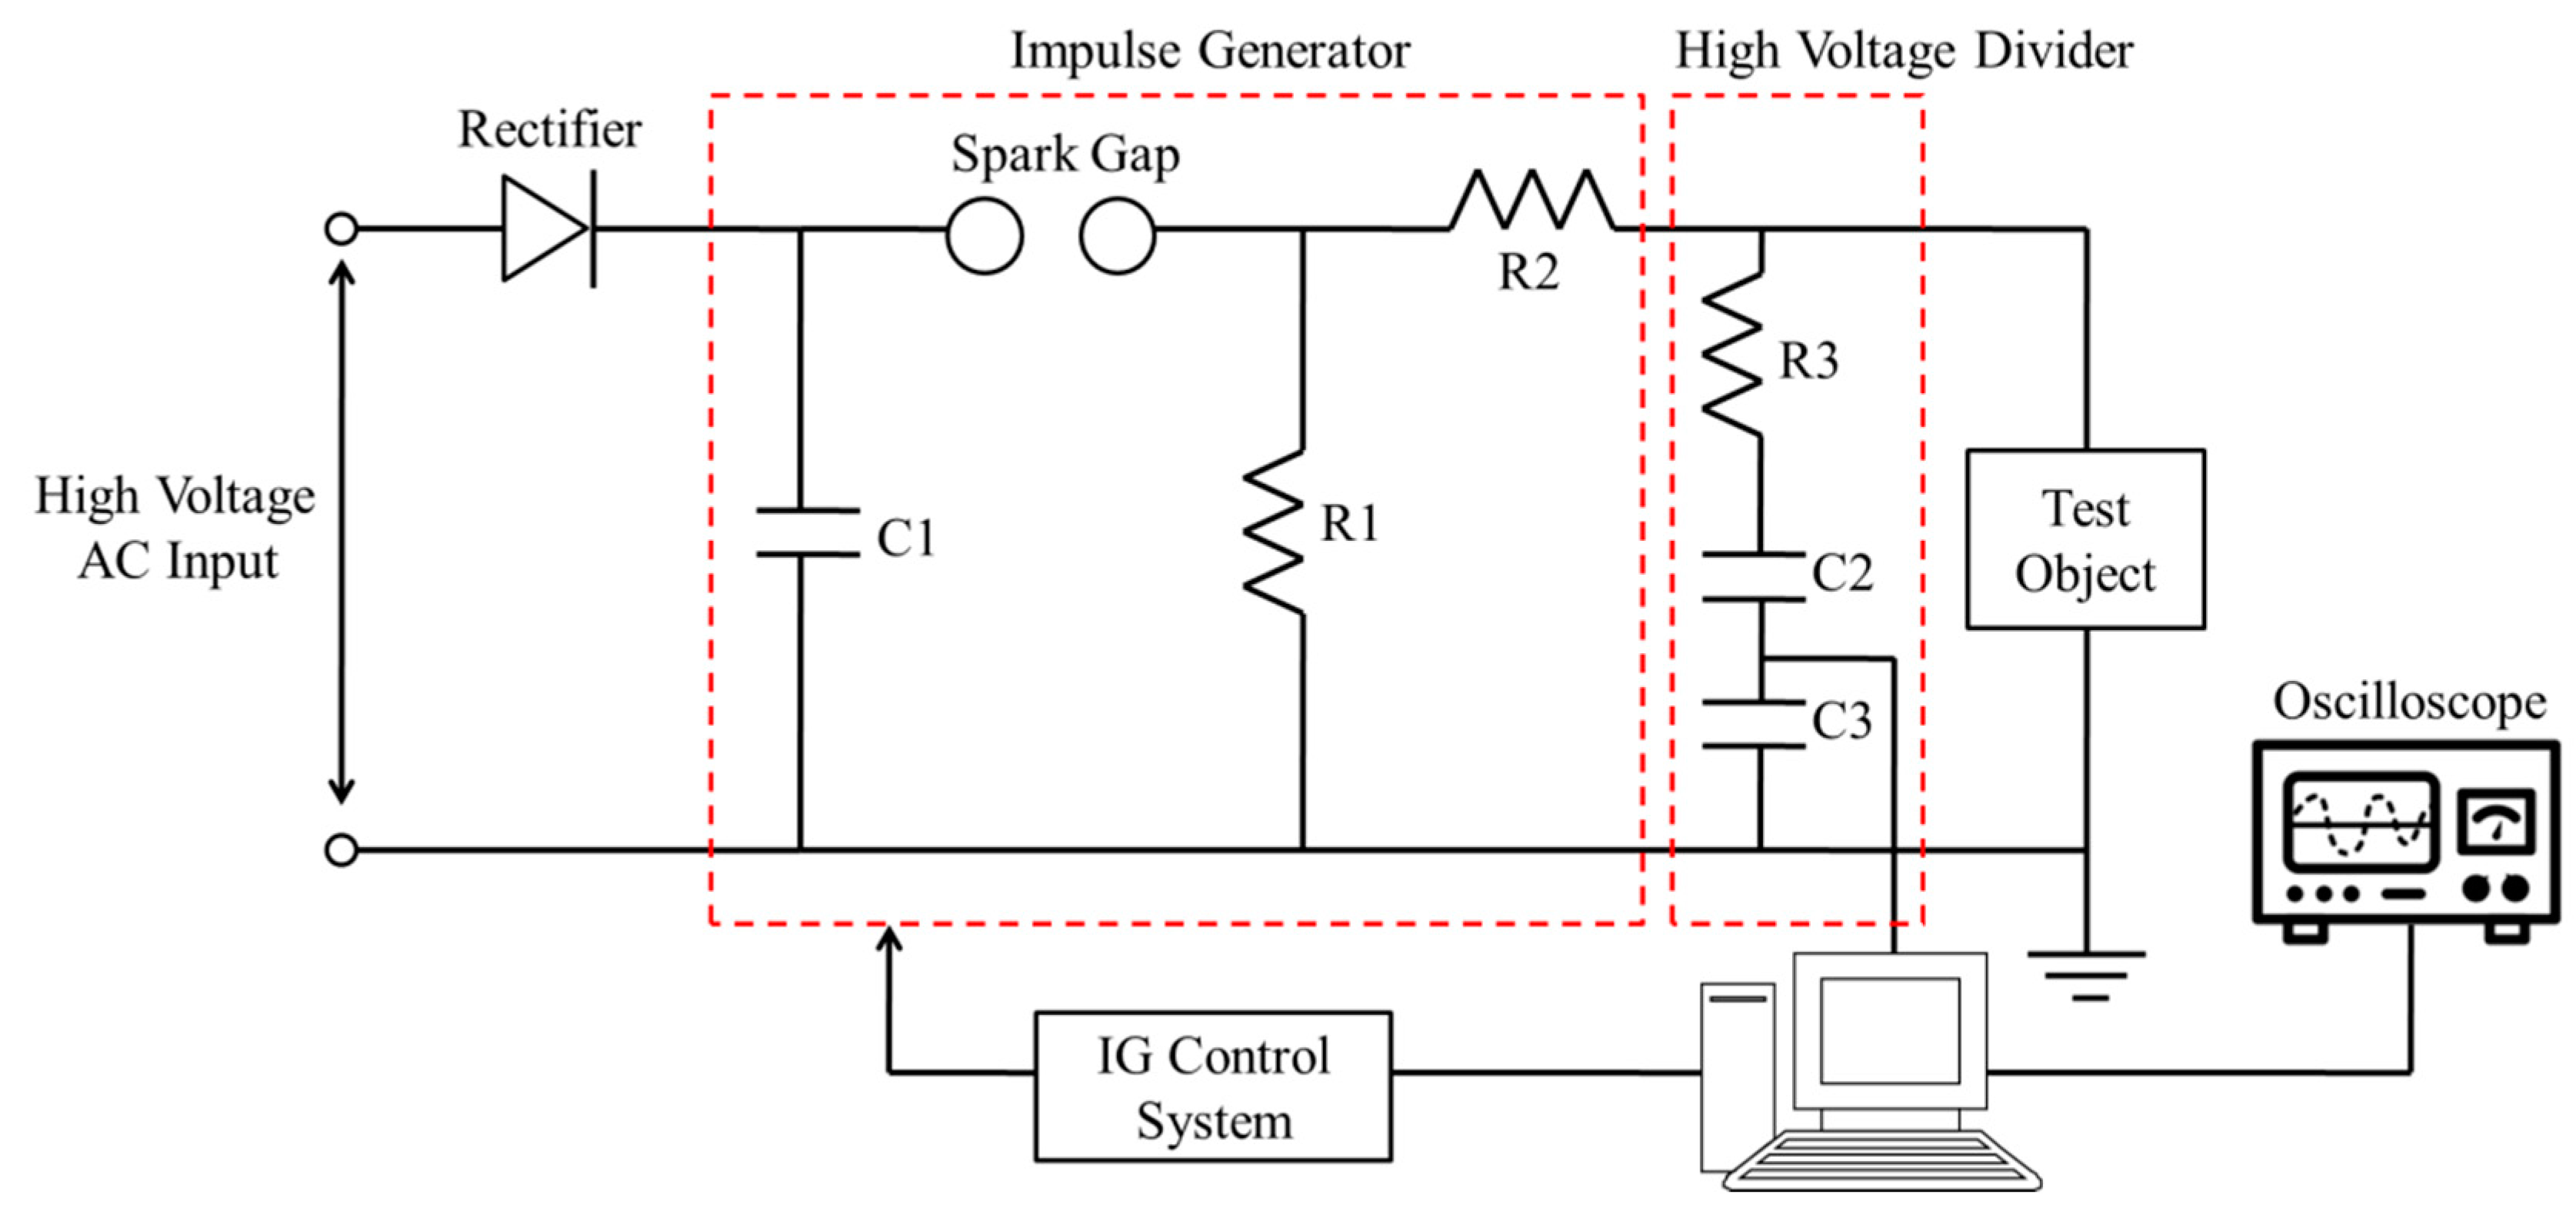
Figure 6.
Schematic of lightning impulse measurement.
Figure 6.
Schematic of lightning impulse measurement.
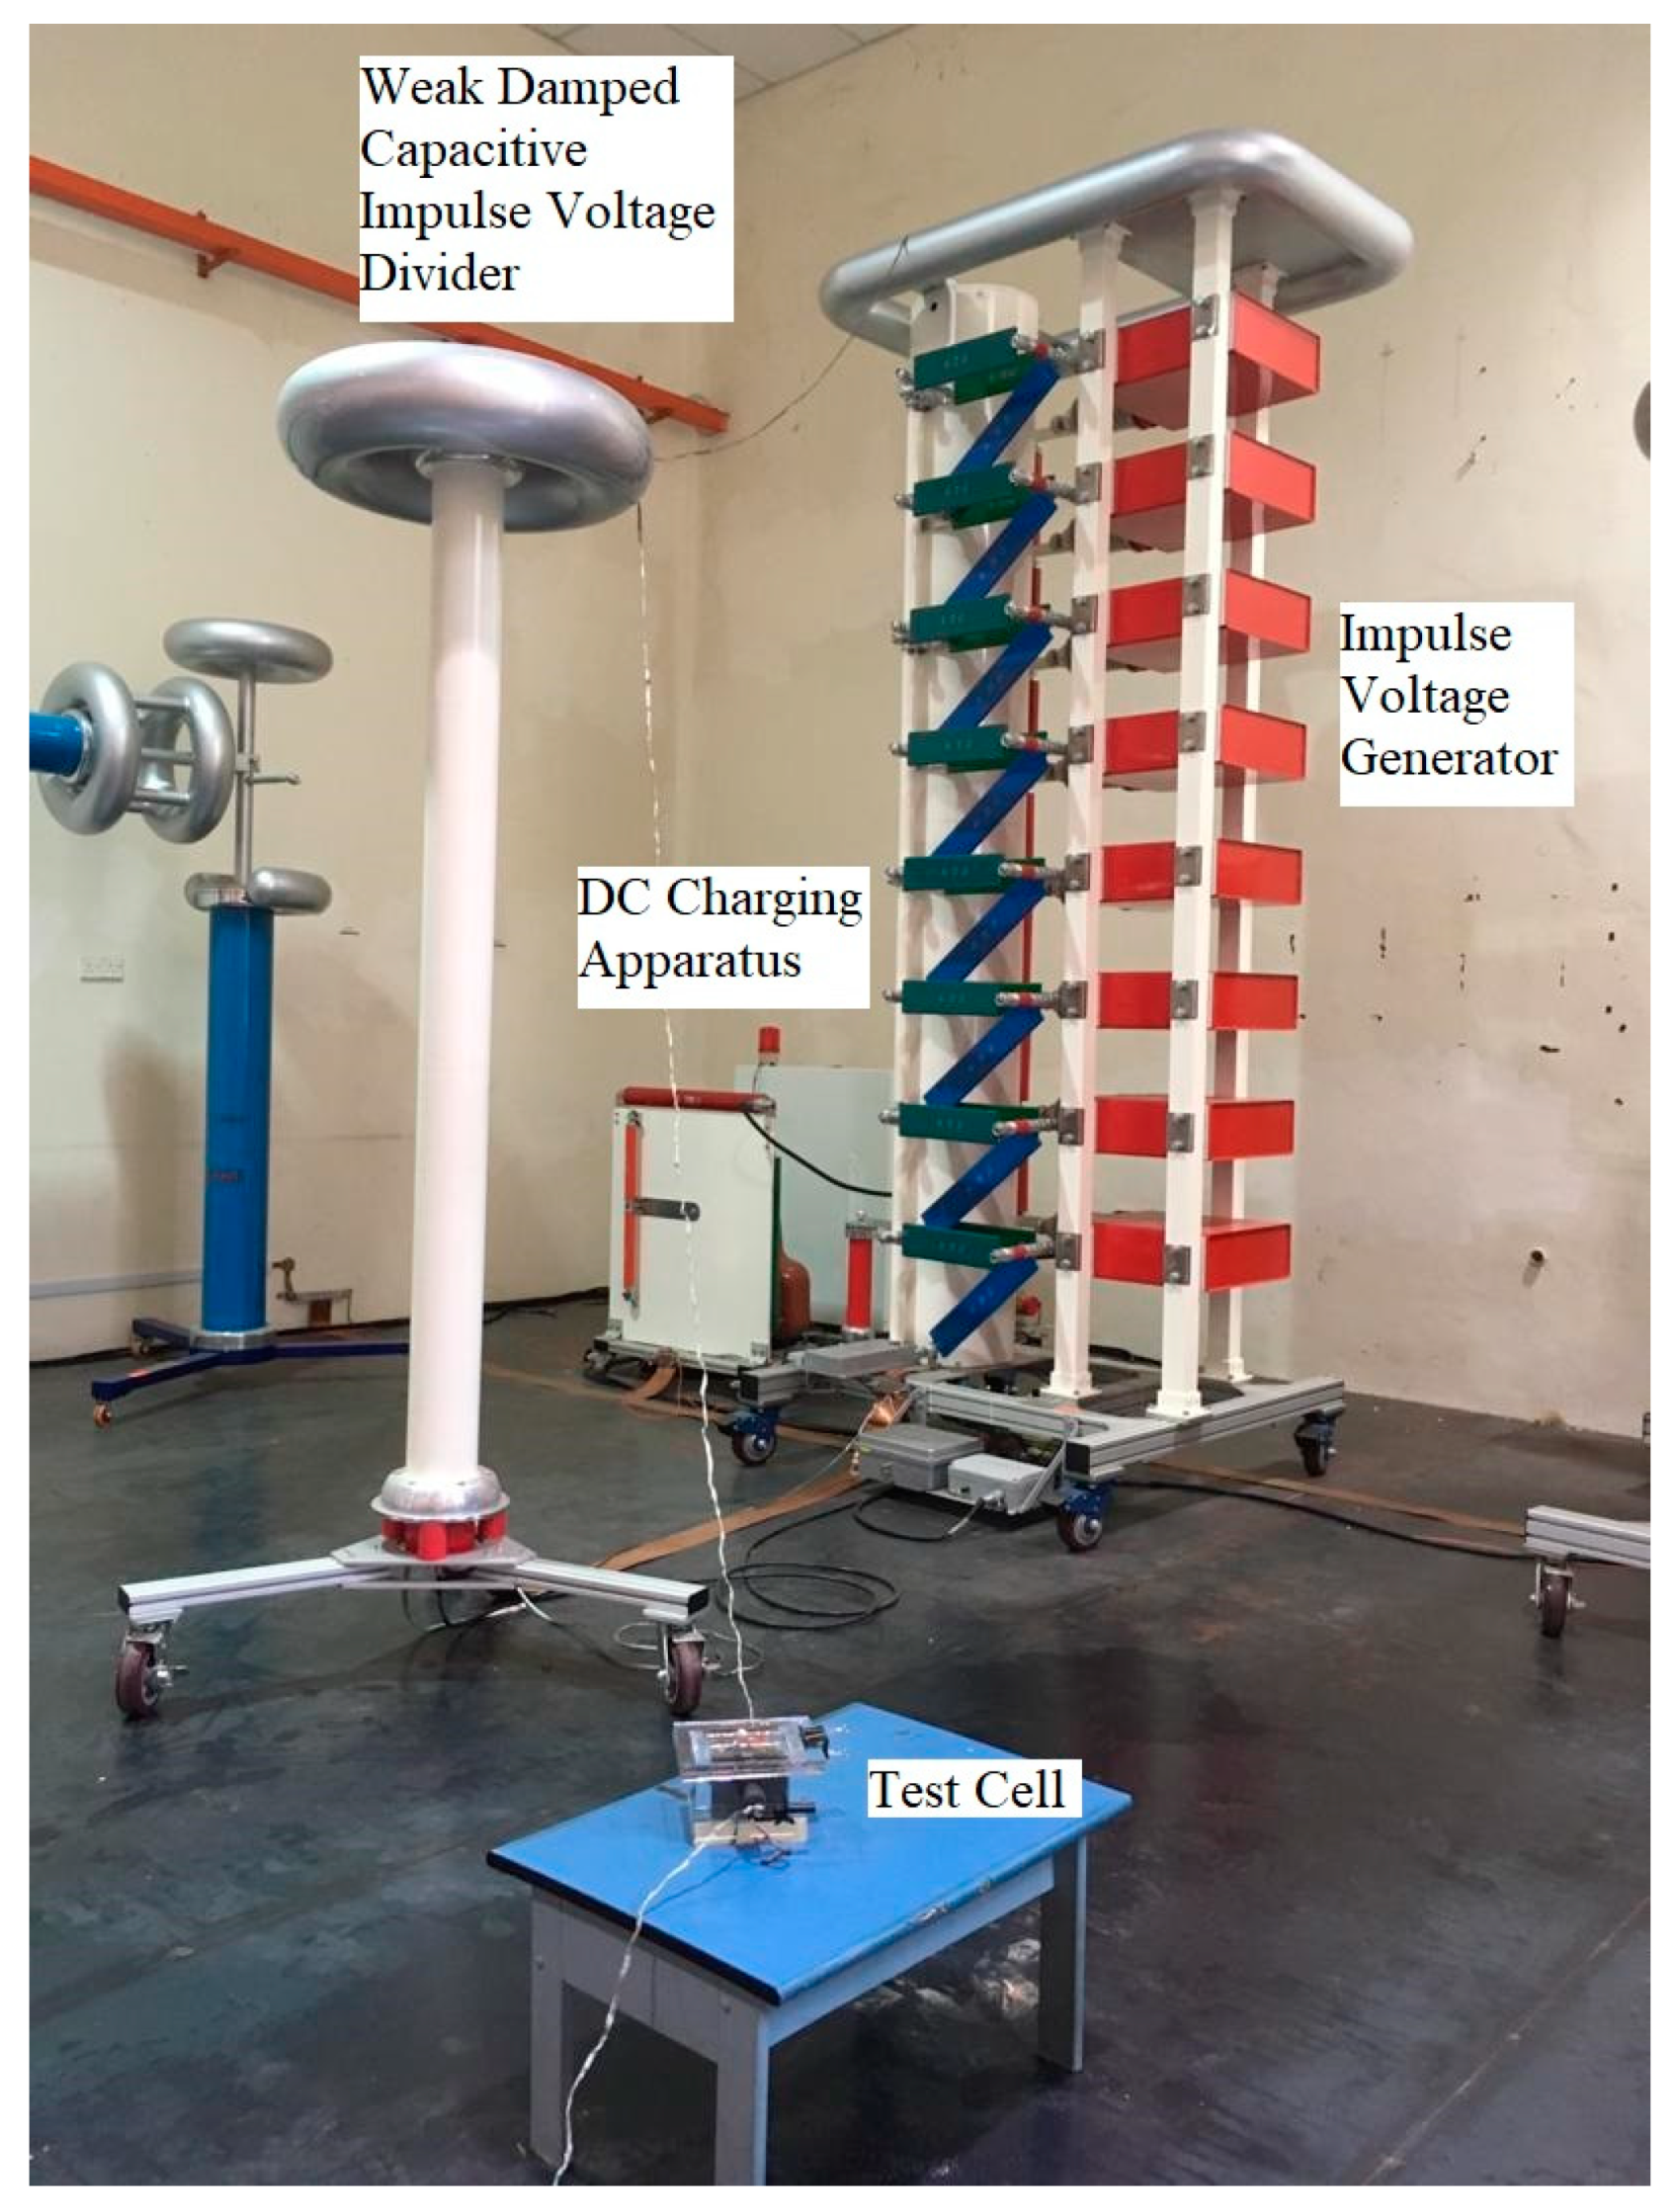
Figure 7.
Lightning impulse laboratory setup.
Figure 7.
Lightning impulse laboratory setup.
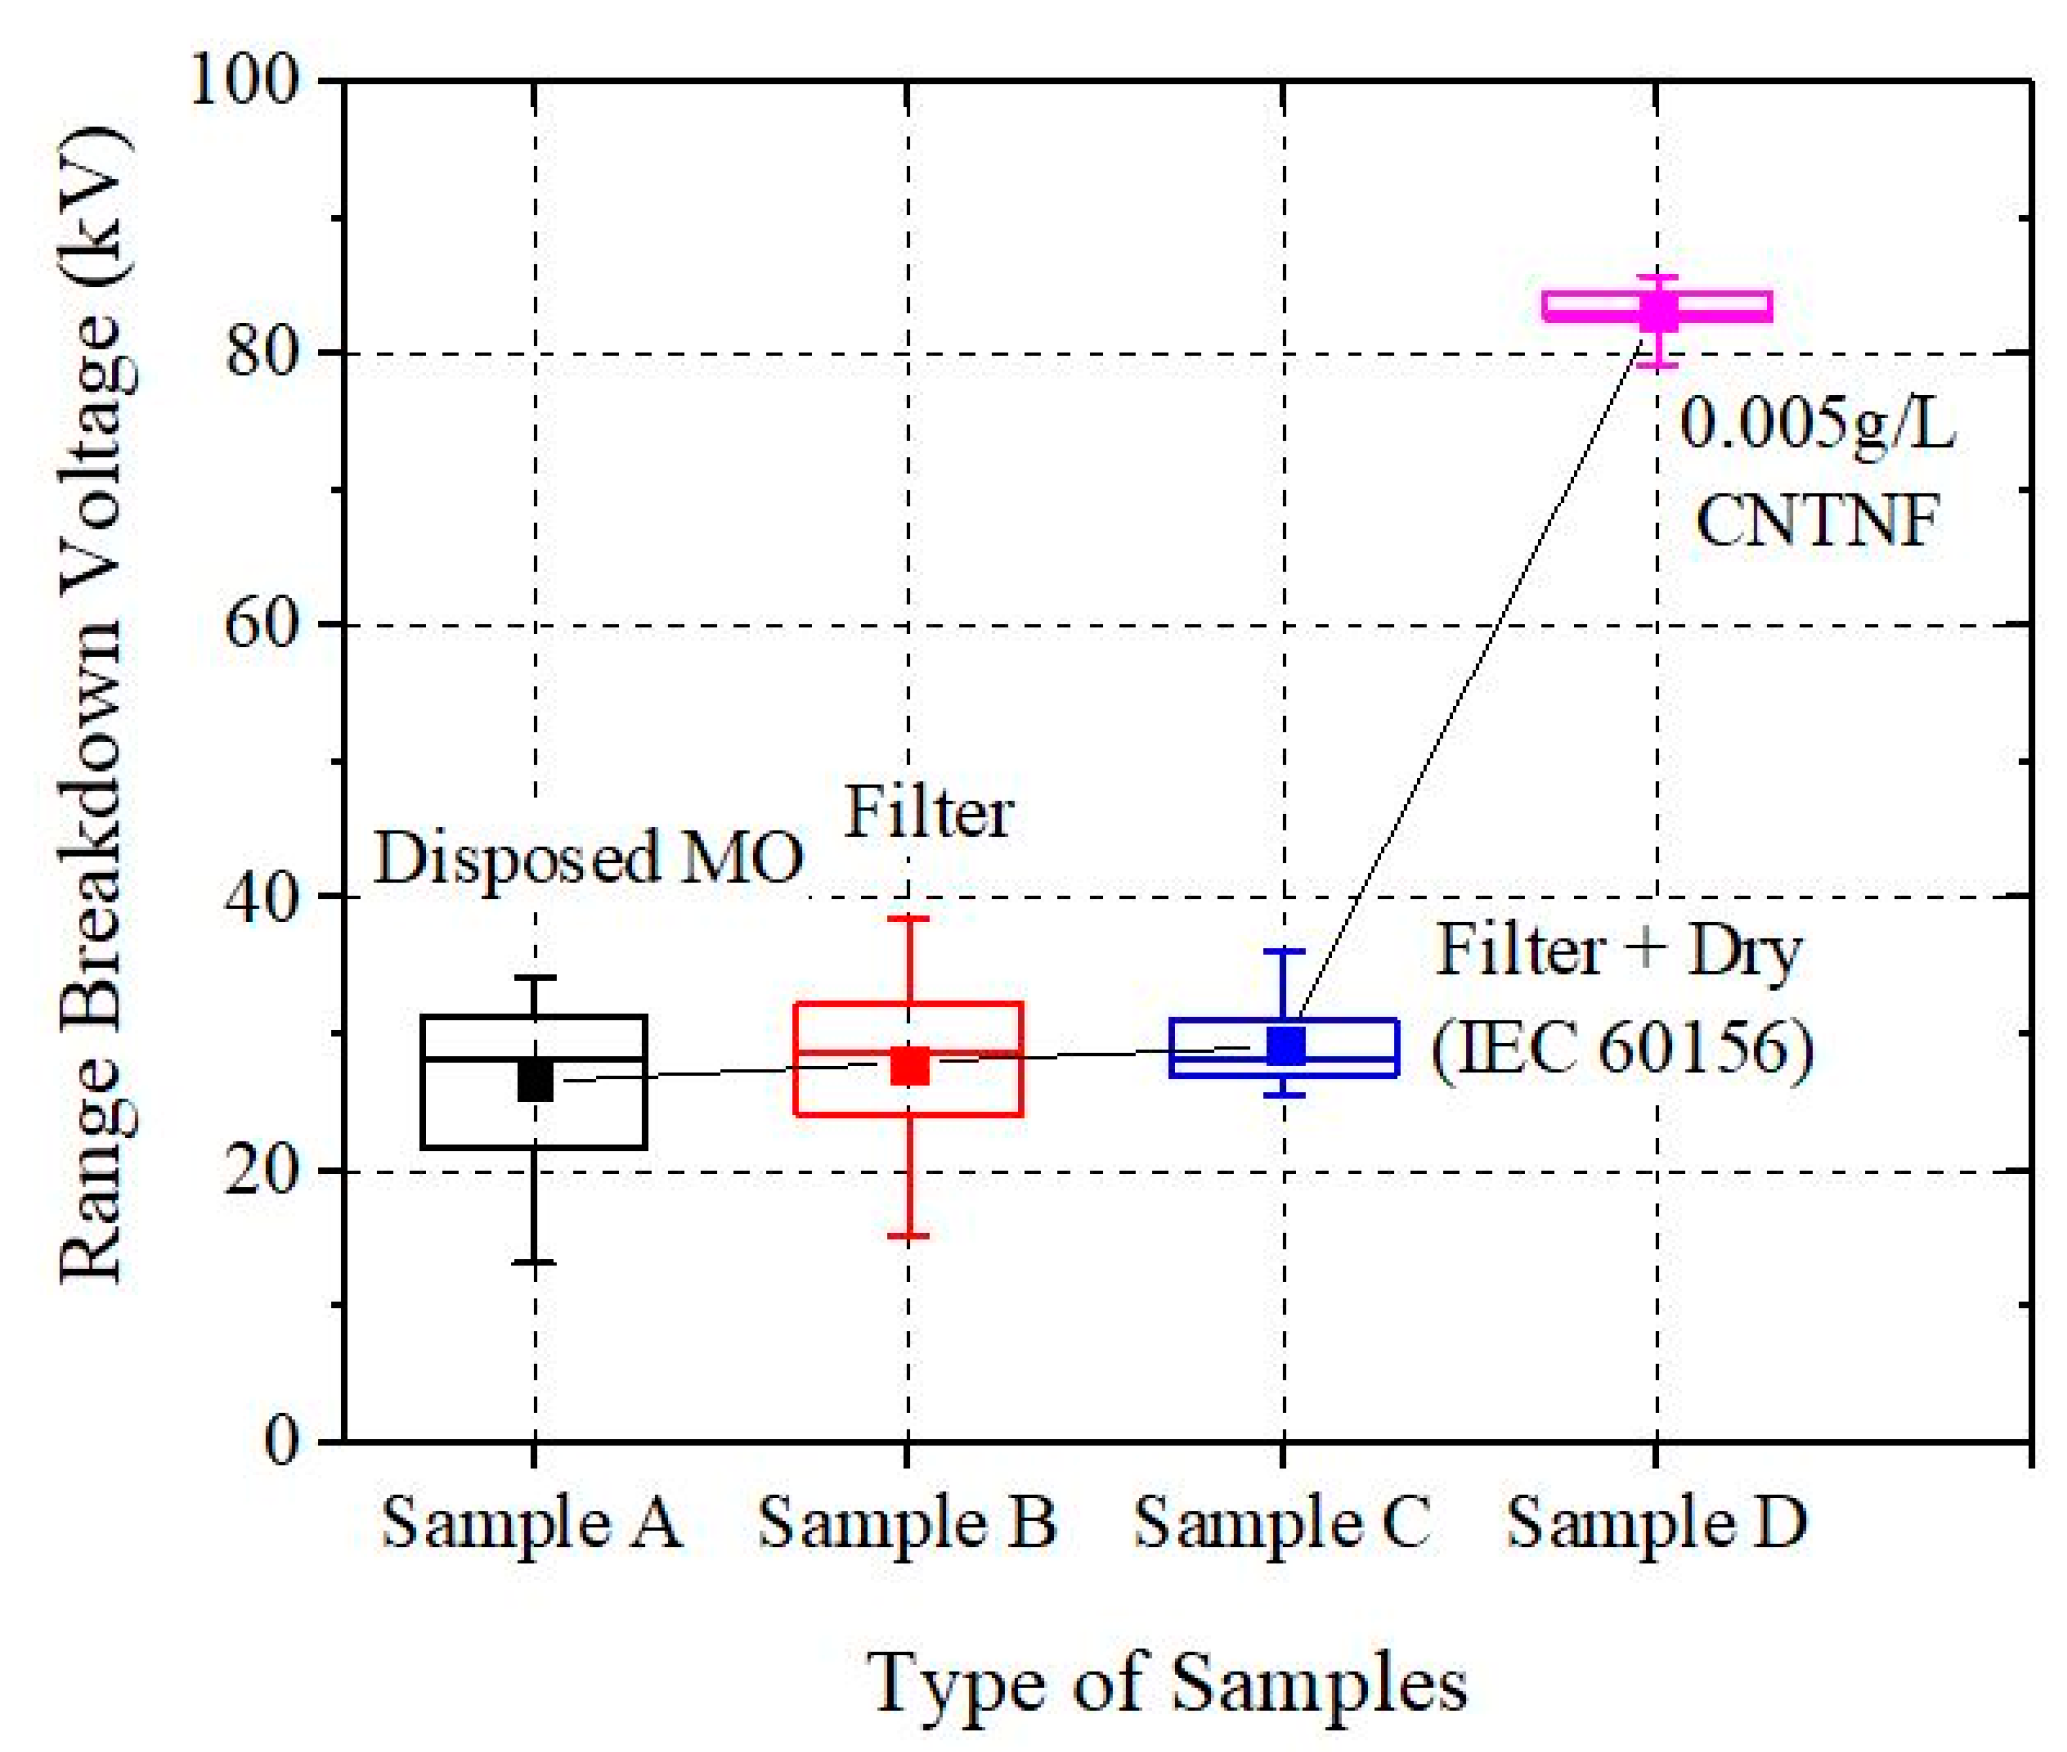
Figure 8.
Box chart of breakdown voltage measurements for all types of oil samples.
Figure 8.
Box chart of breakdown voltage measurements for all types of oil samples.
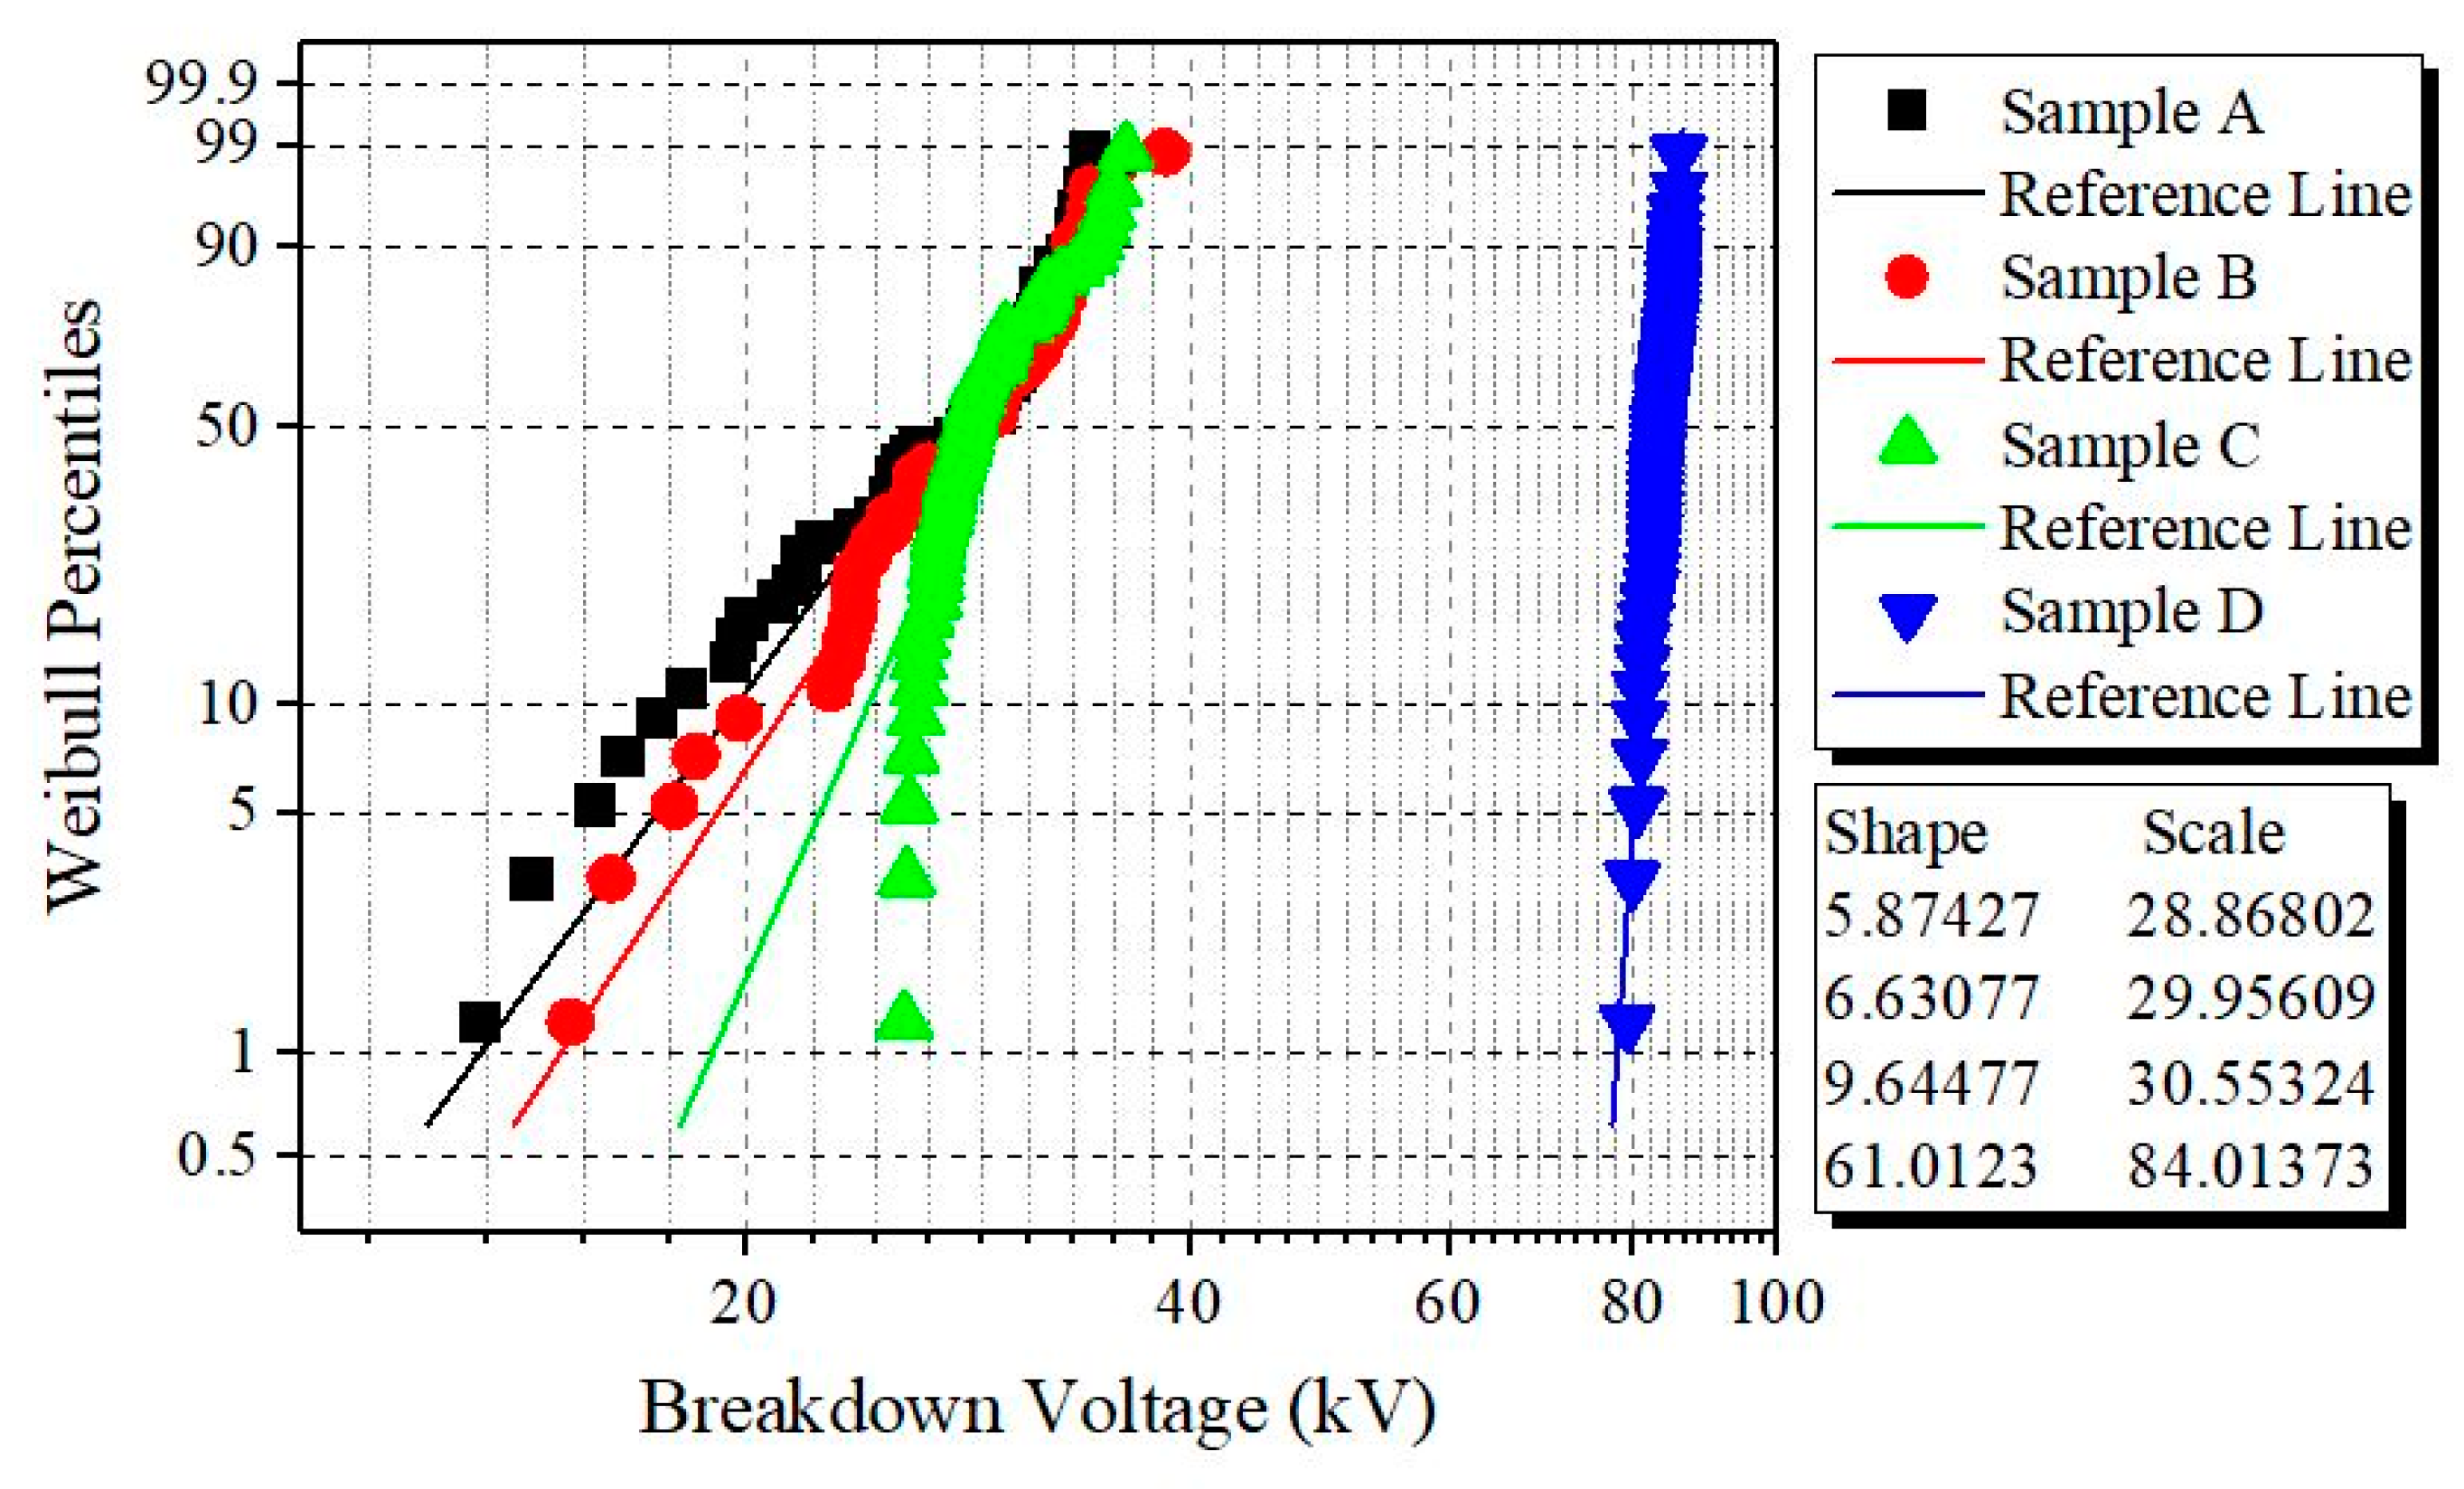
Figure 9.
Weibull distribution results of fifty breakdown voltage data at various sample method preparations.
Figure 9.
Weibull distribution results of fifty breakdown voltage data at various sample method preparations.
Figure 10.
Box chart of lightning impulse measurements for all types of oil samples.
Figure 10.
Box chart of lightning impulse measurements for all types of oil samples.
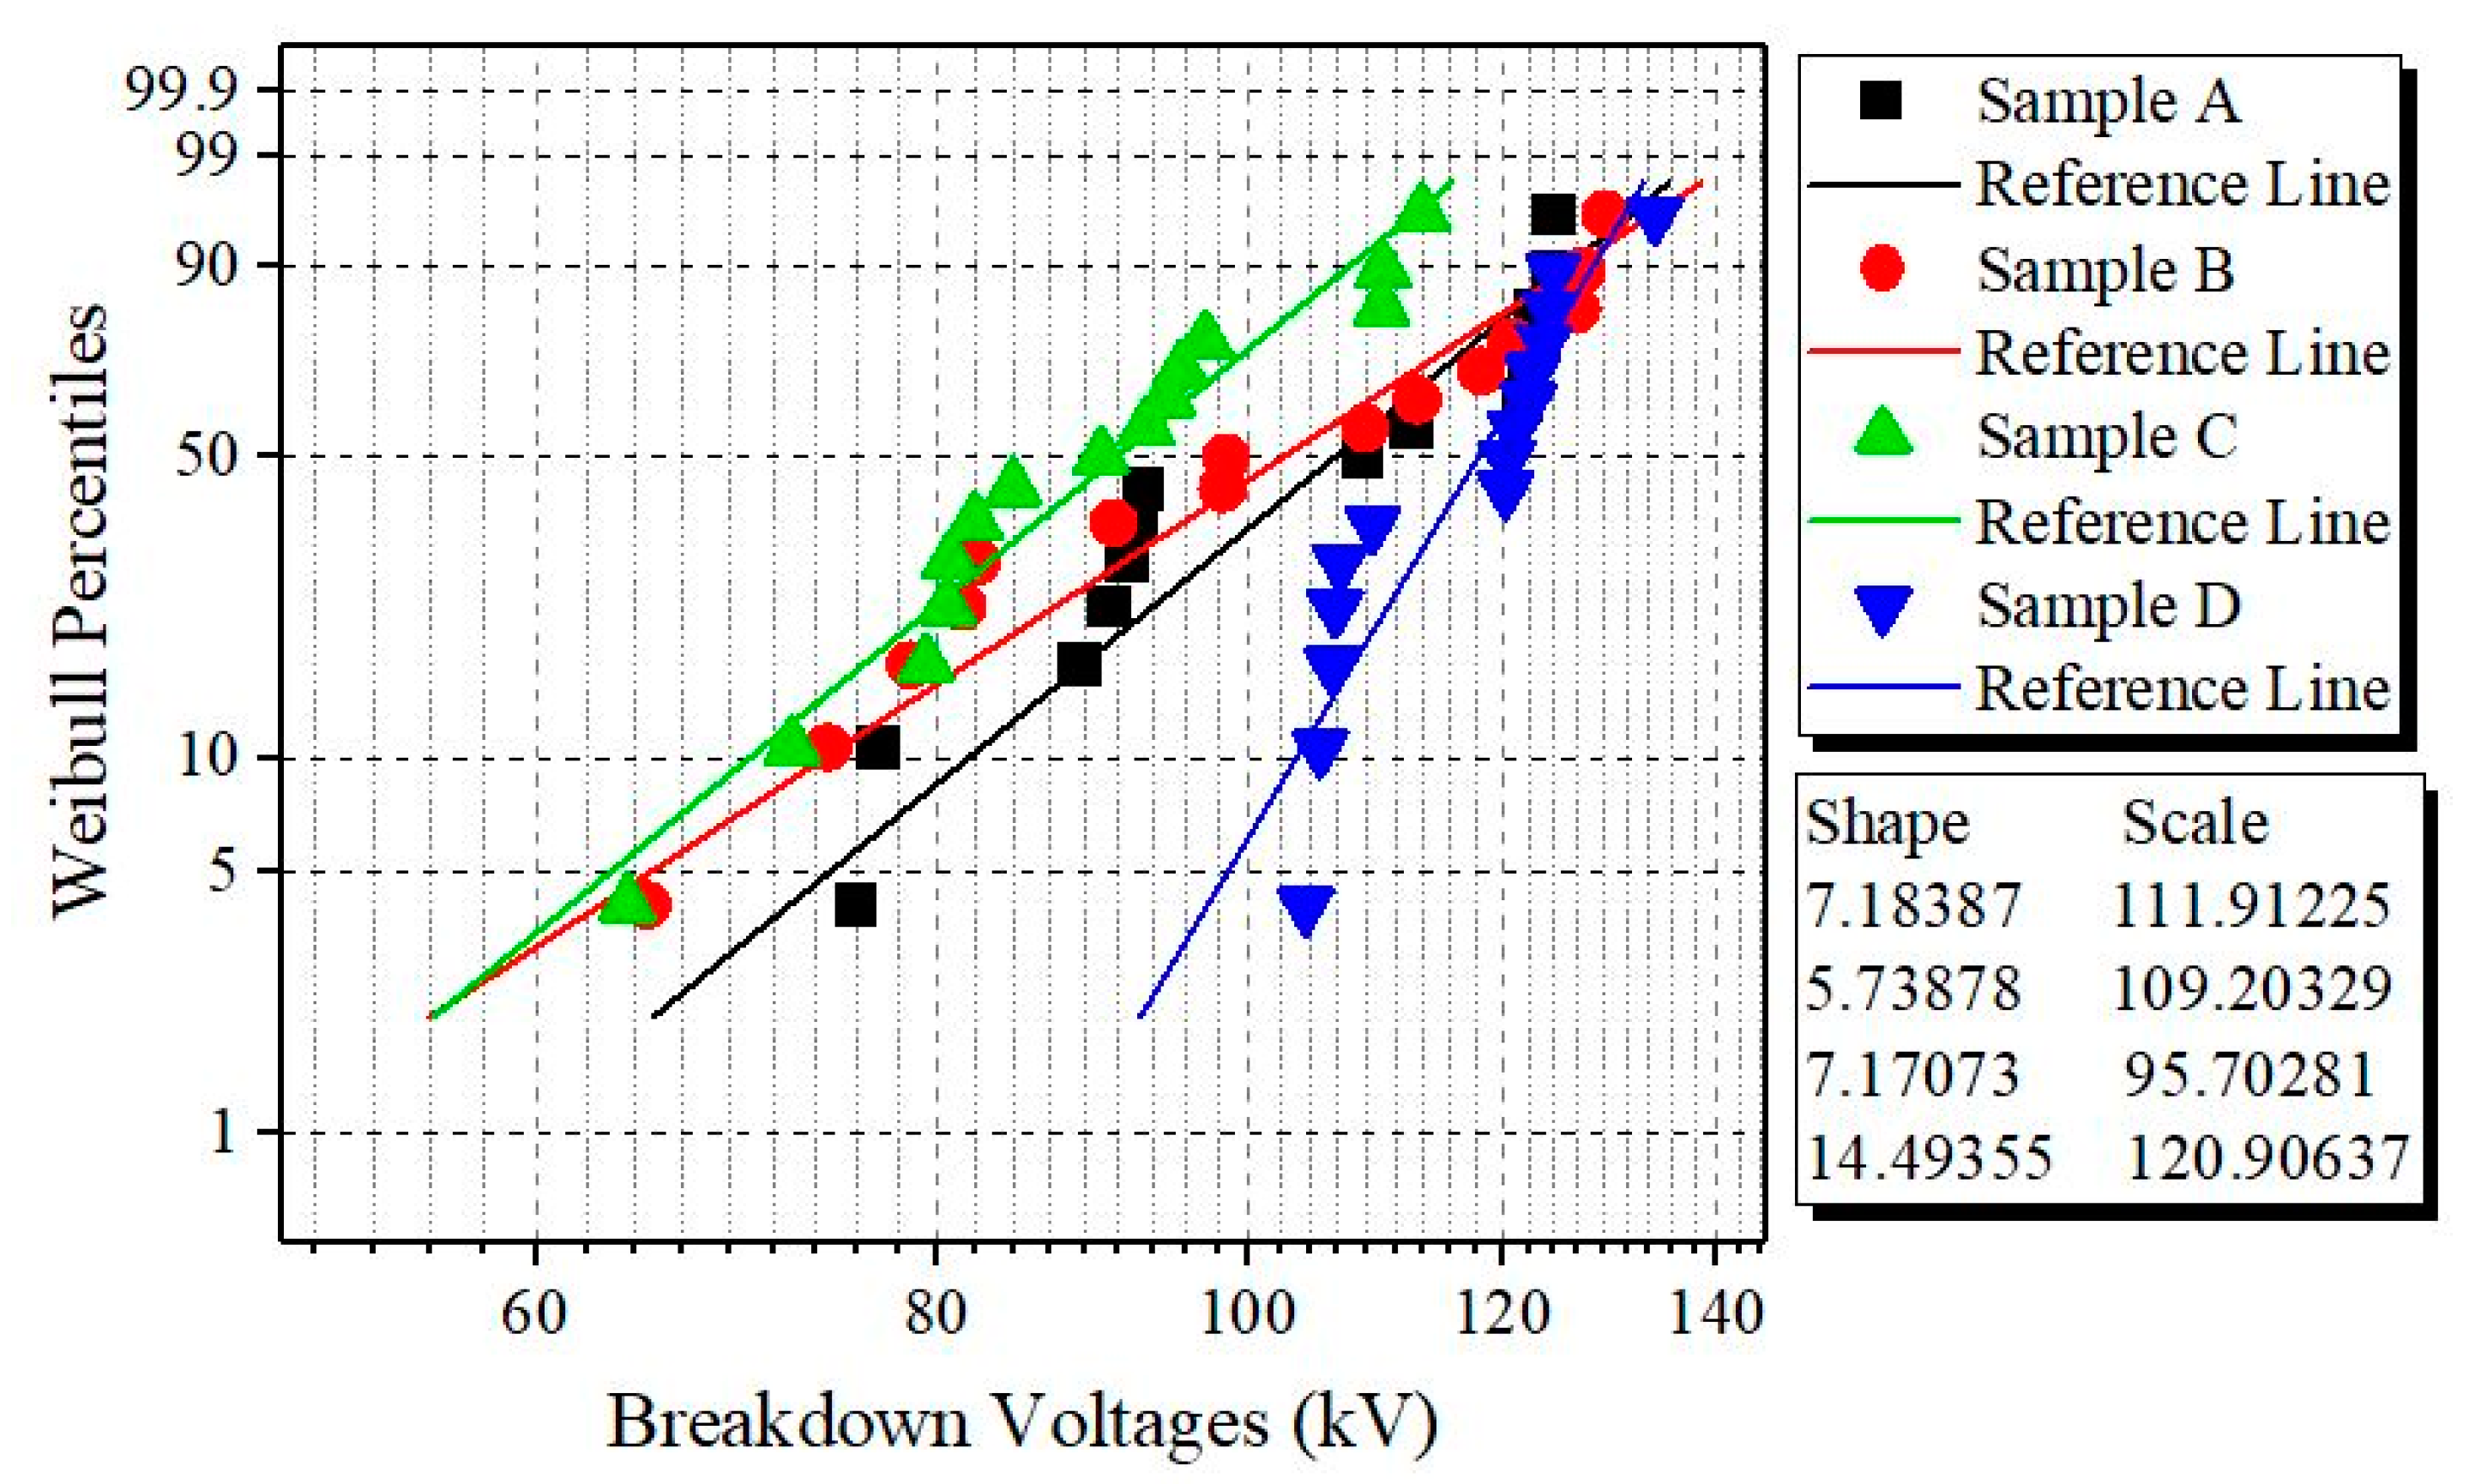
Figure 11.
Weibull distribution results of fifteen lightning impulse breakdown data at various sample method preparations.
Figure 11.
Weibull distribution results of fifteen lightning impulse breakdown data at various sample method preparations.
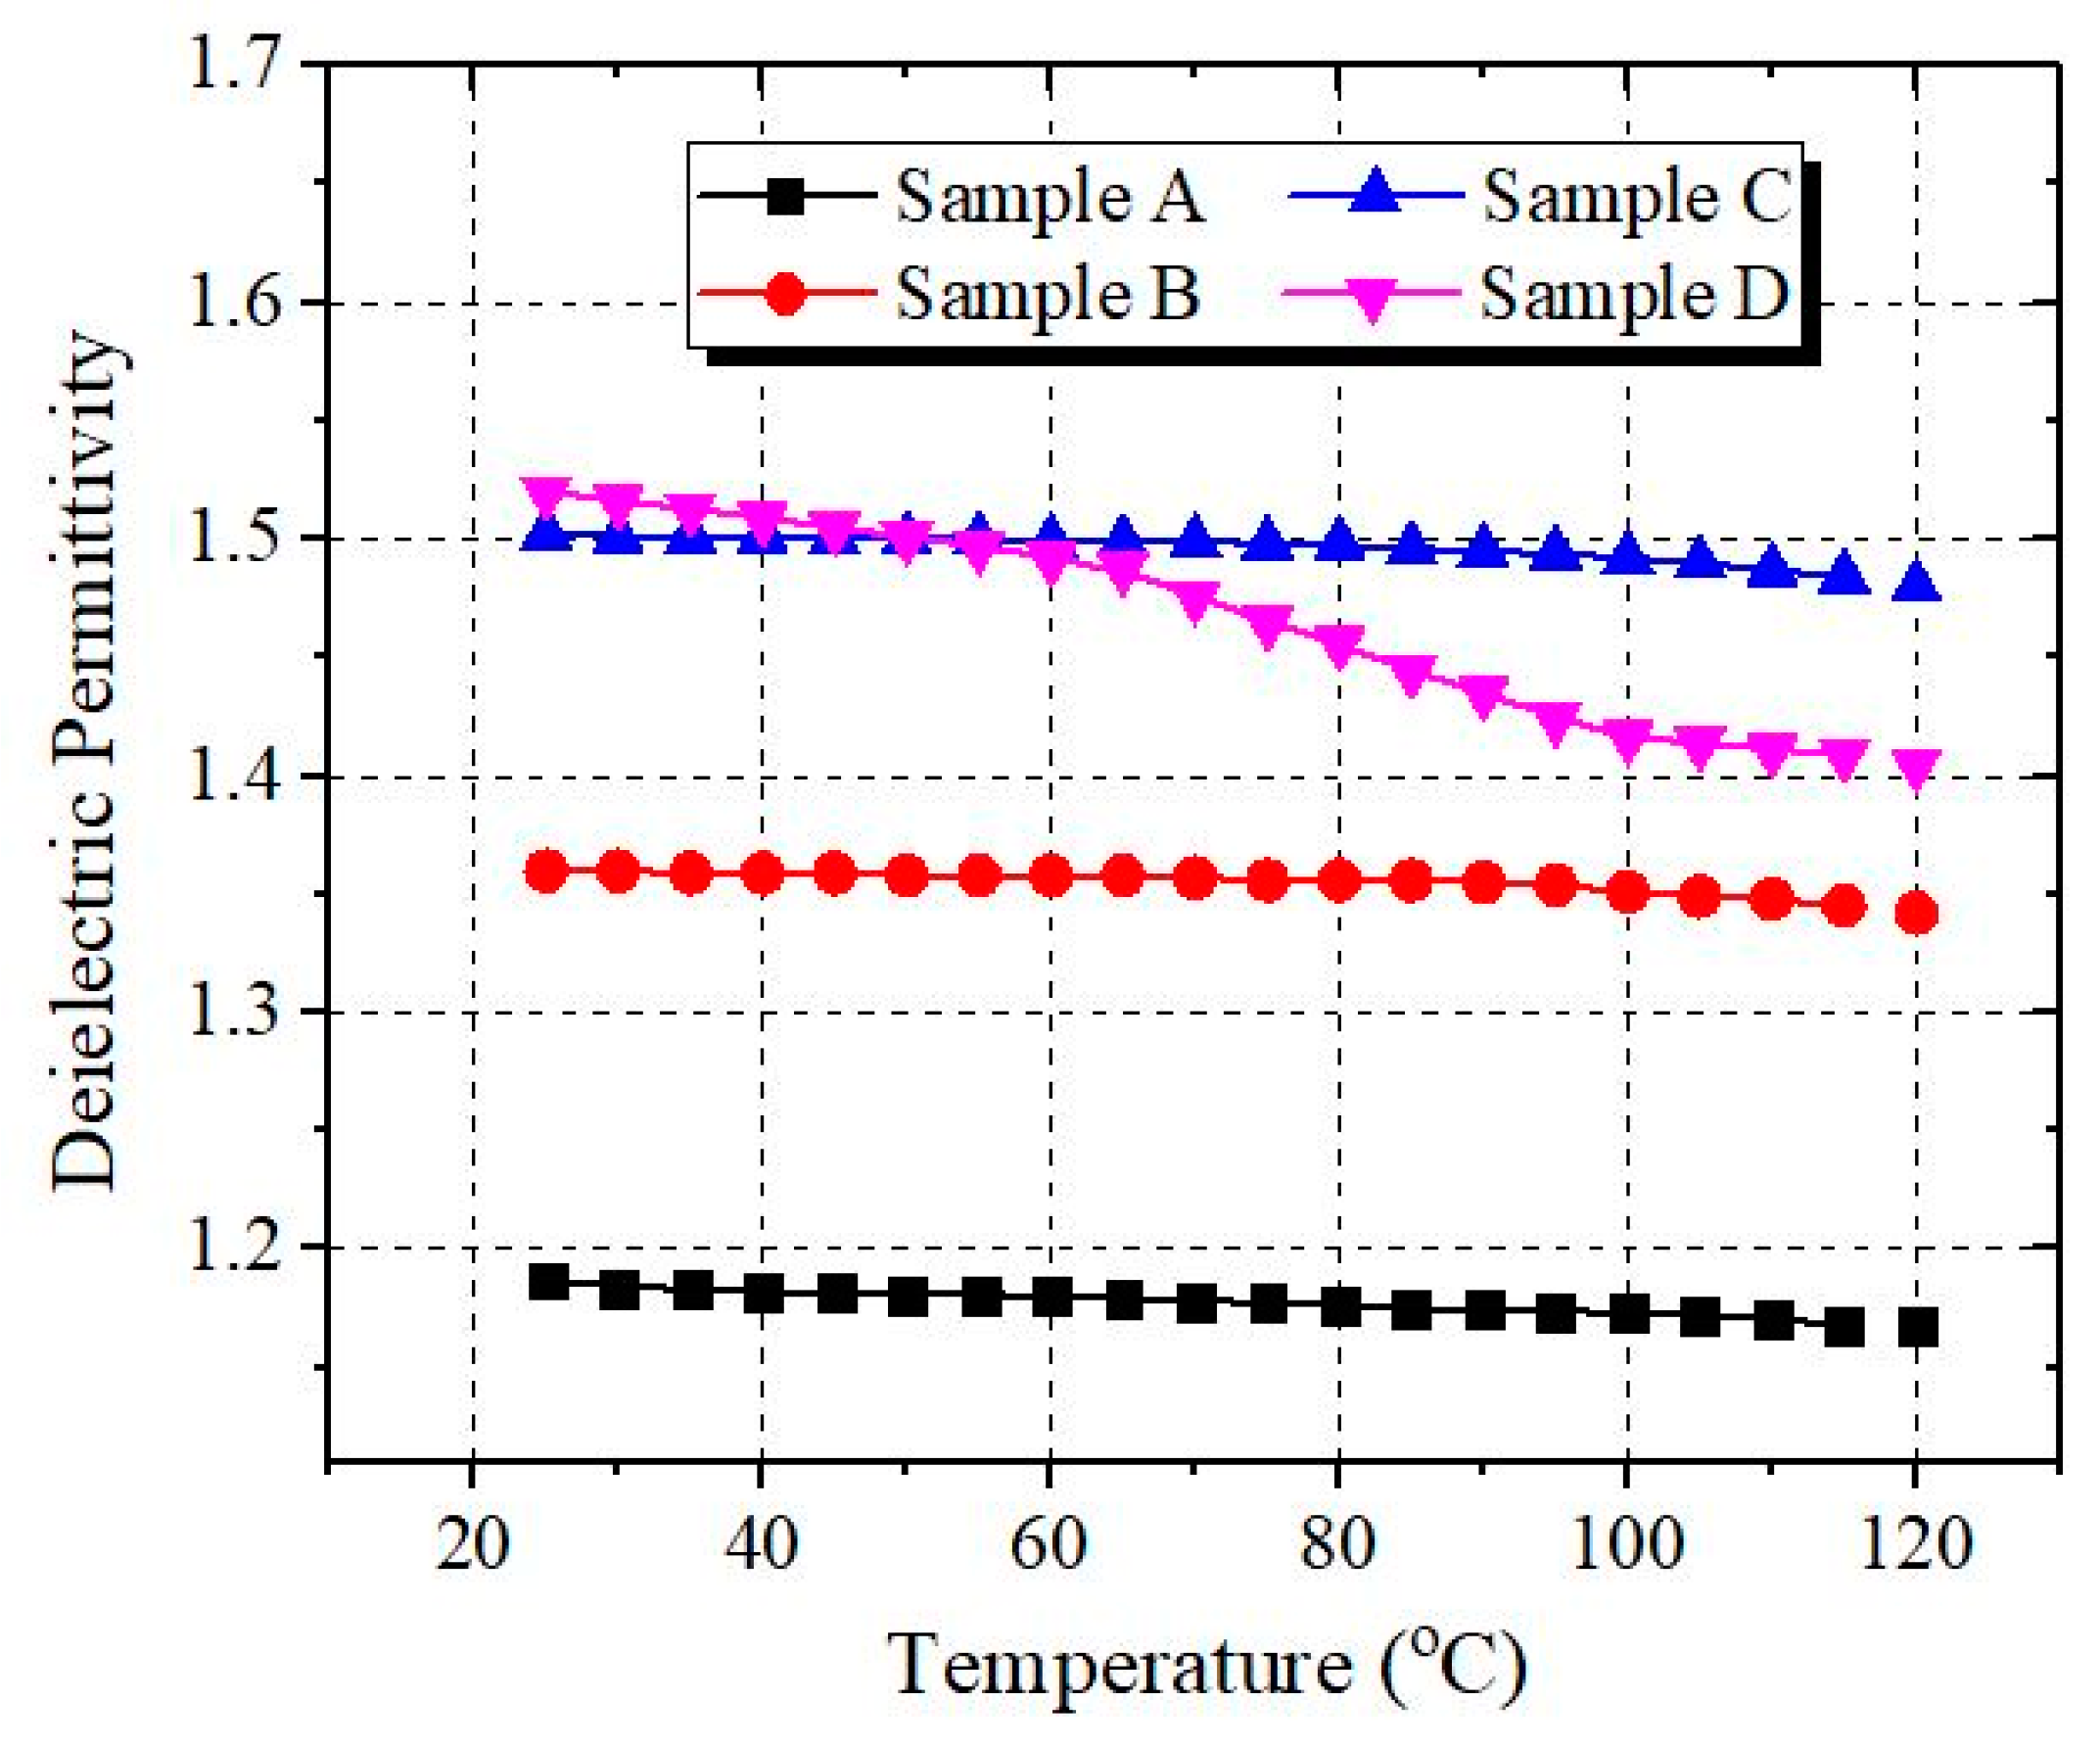
Figure 12.
Permittivity of oil samples at various temperatures.
Figure 12.
Permittivity of oil samples at various temperatures.
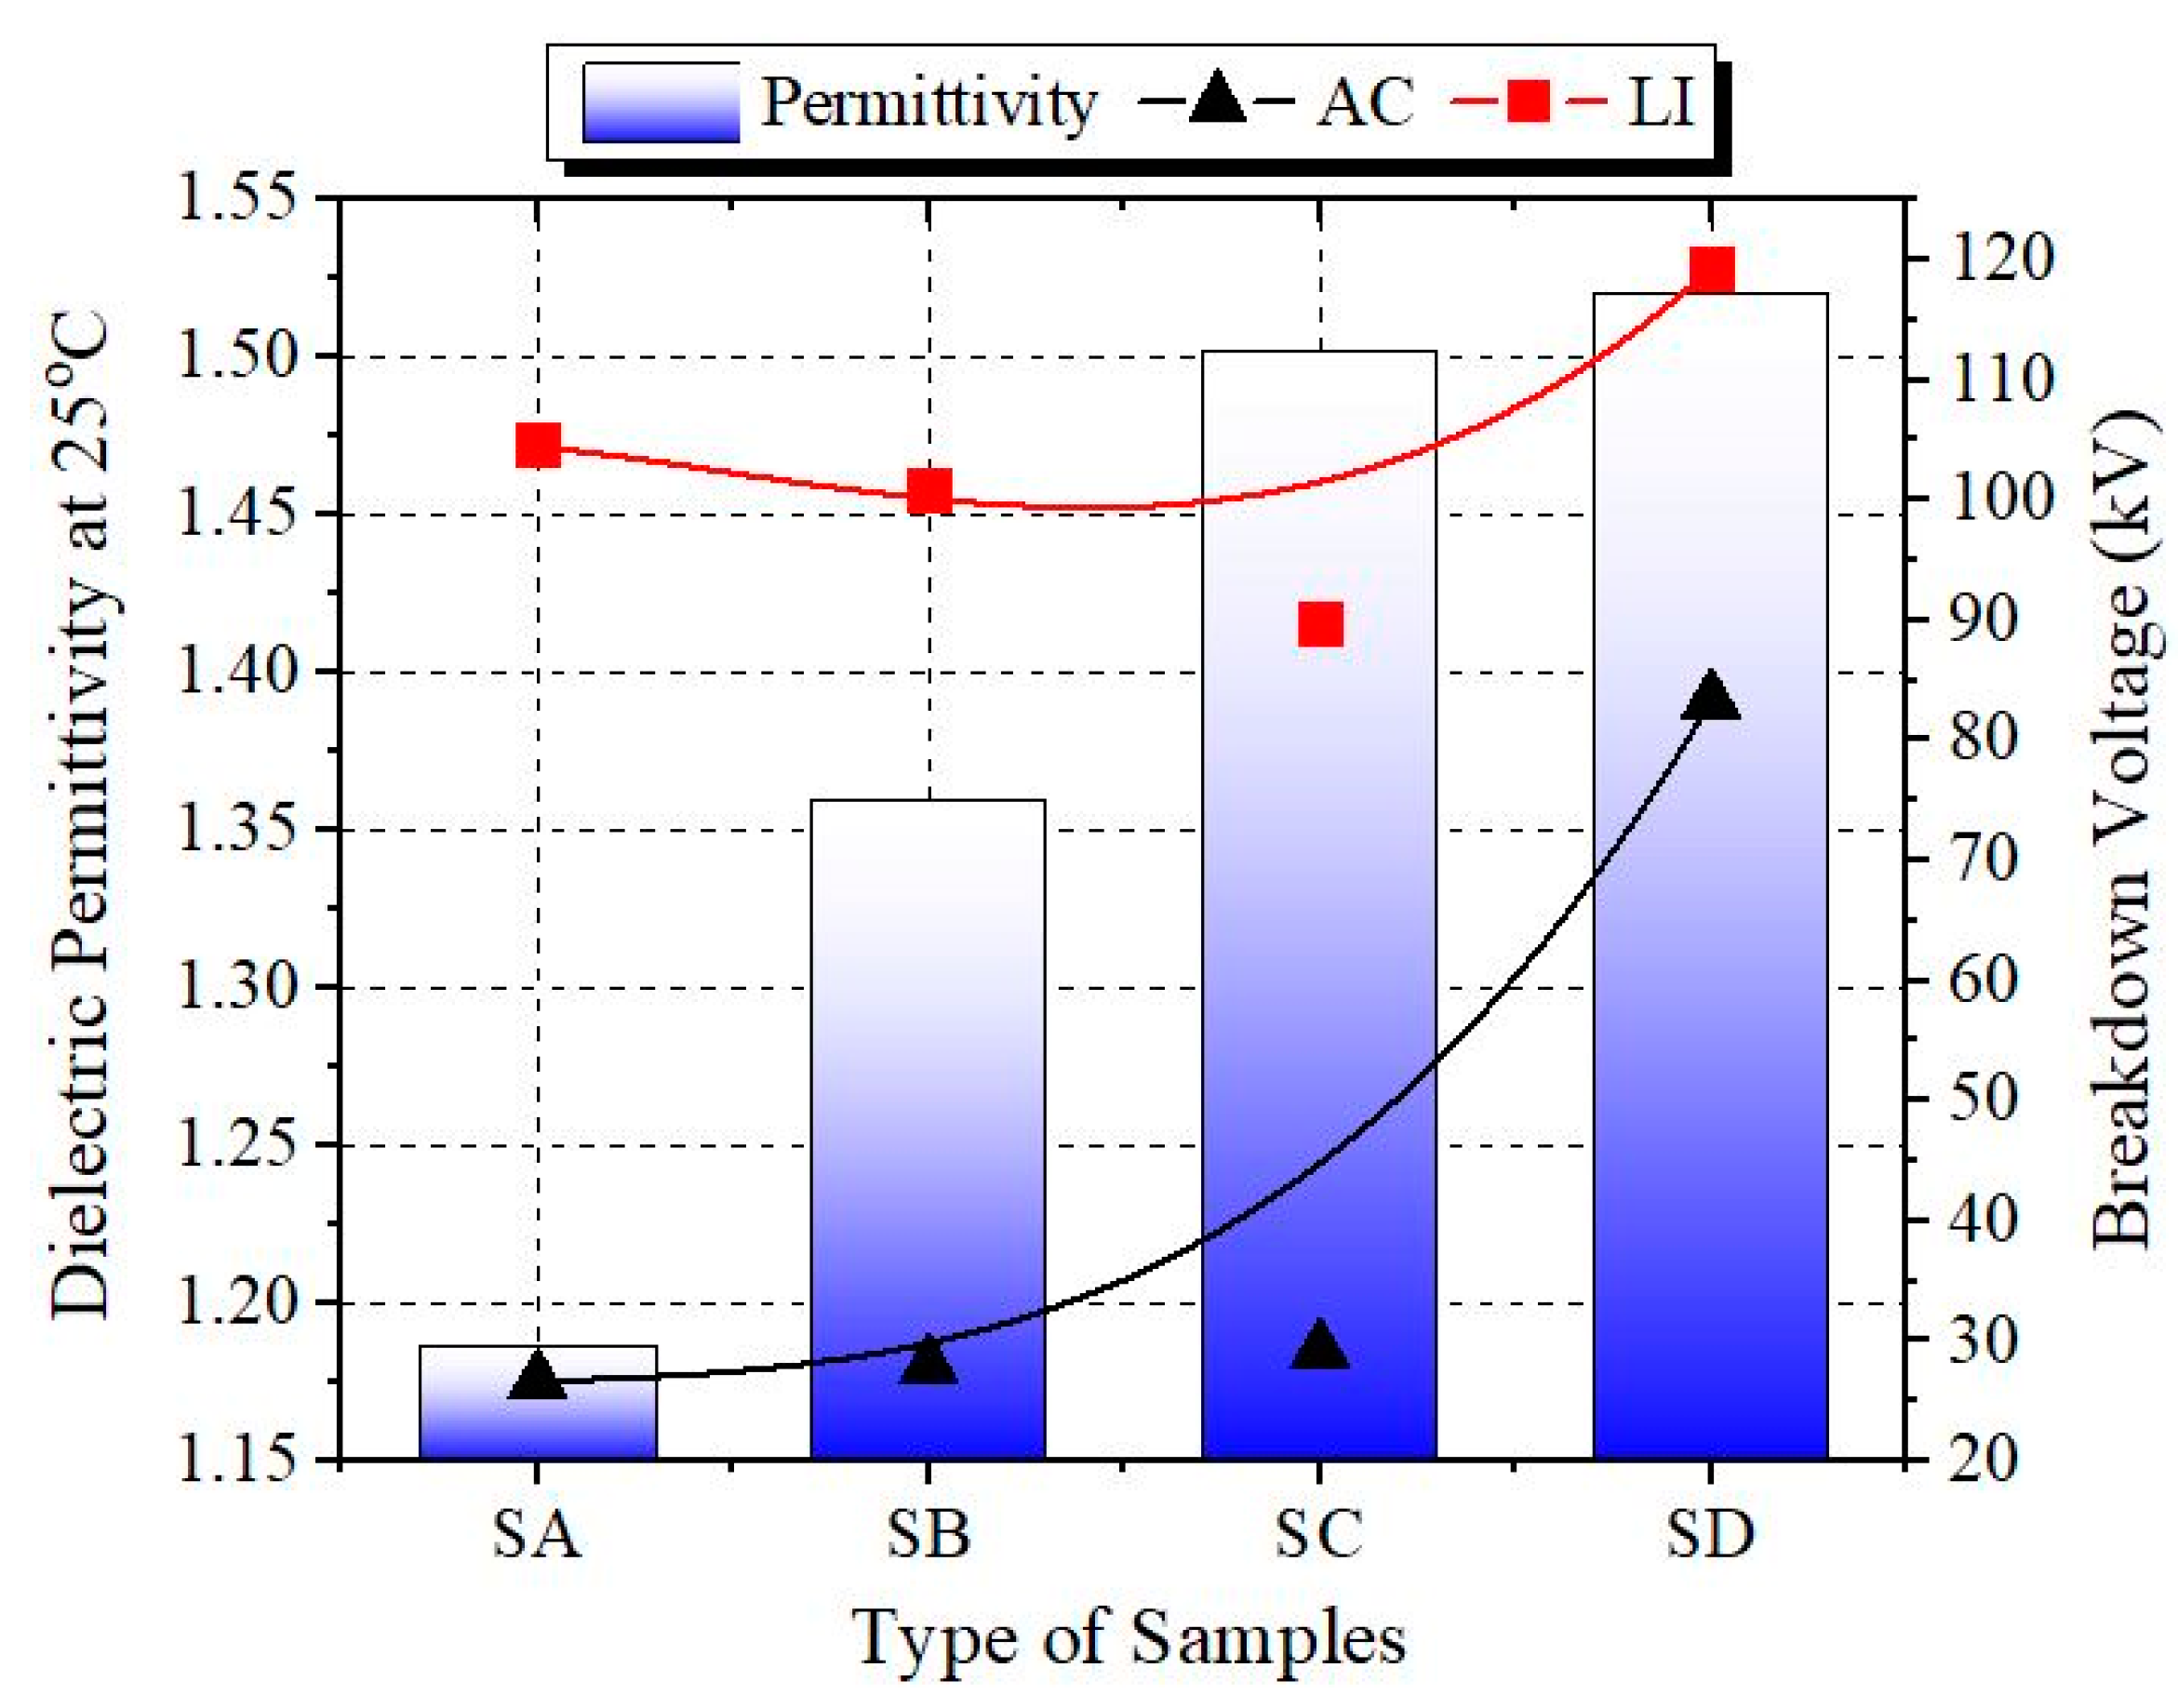
Figure 13.
Influence permittivity of oil samples towards breakdown voltage (BDV) and lightning impulse (LI) measurements at ambient temperature.
Figure 13.
Influence permittivity of oil samples towards breakdown voltage (BDV) and lightning impulse (LI) measurements at ambient temperature.
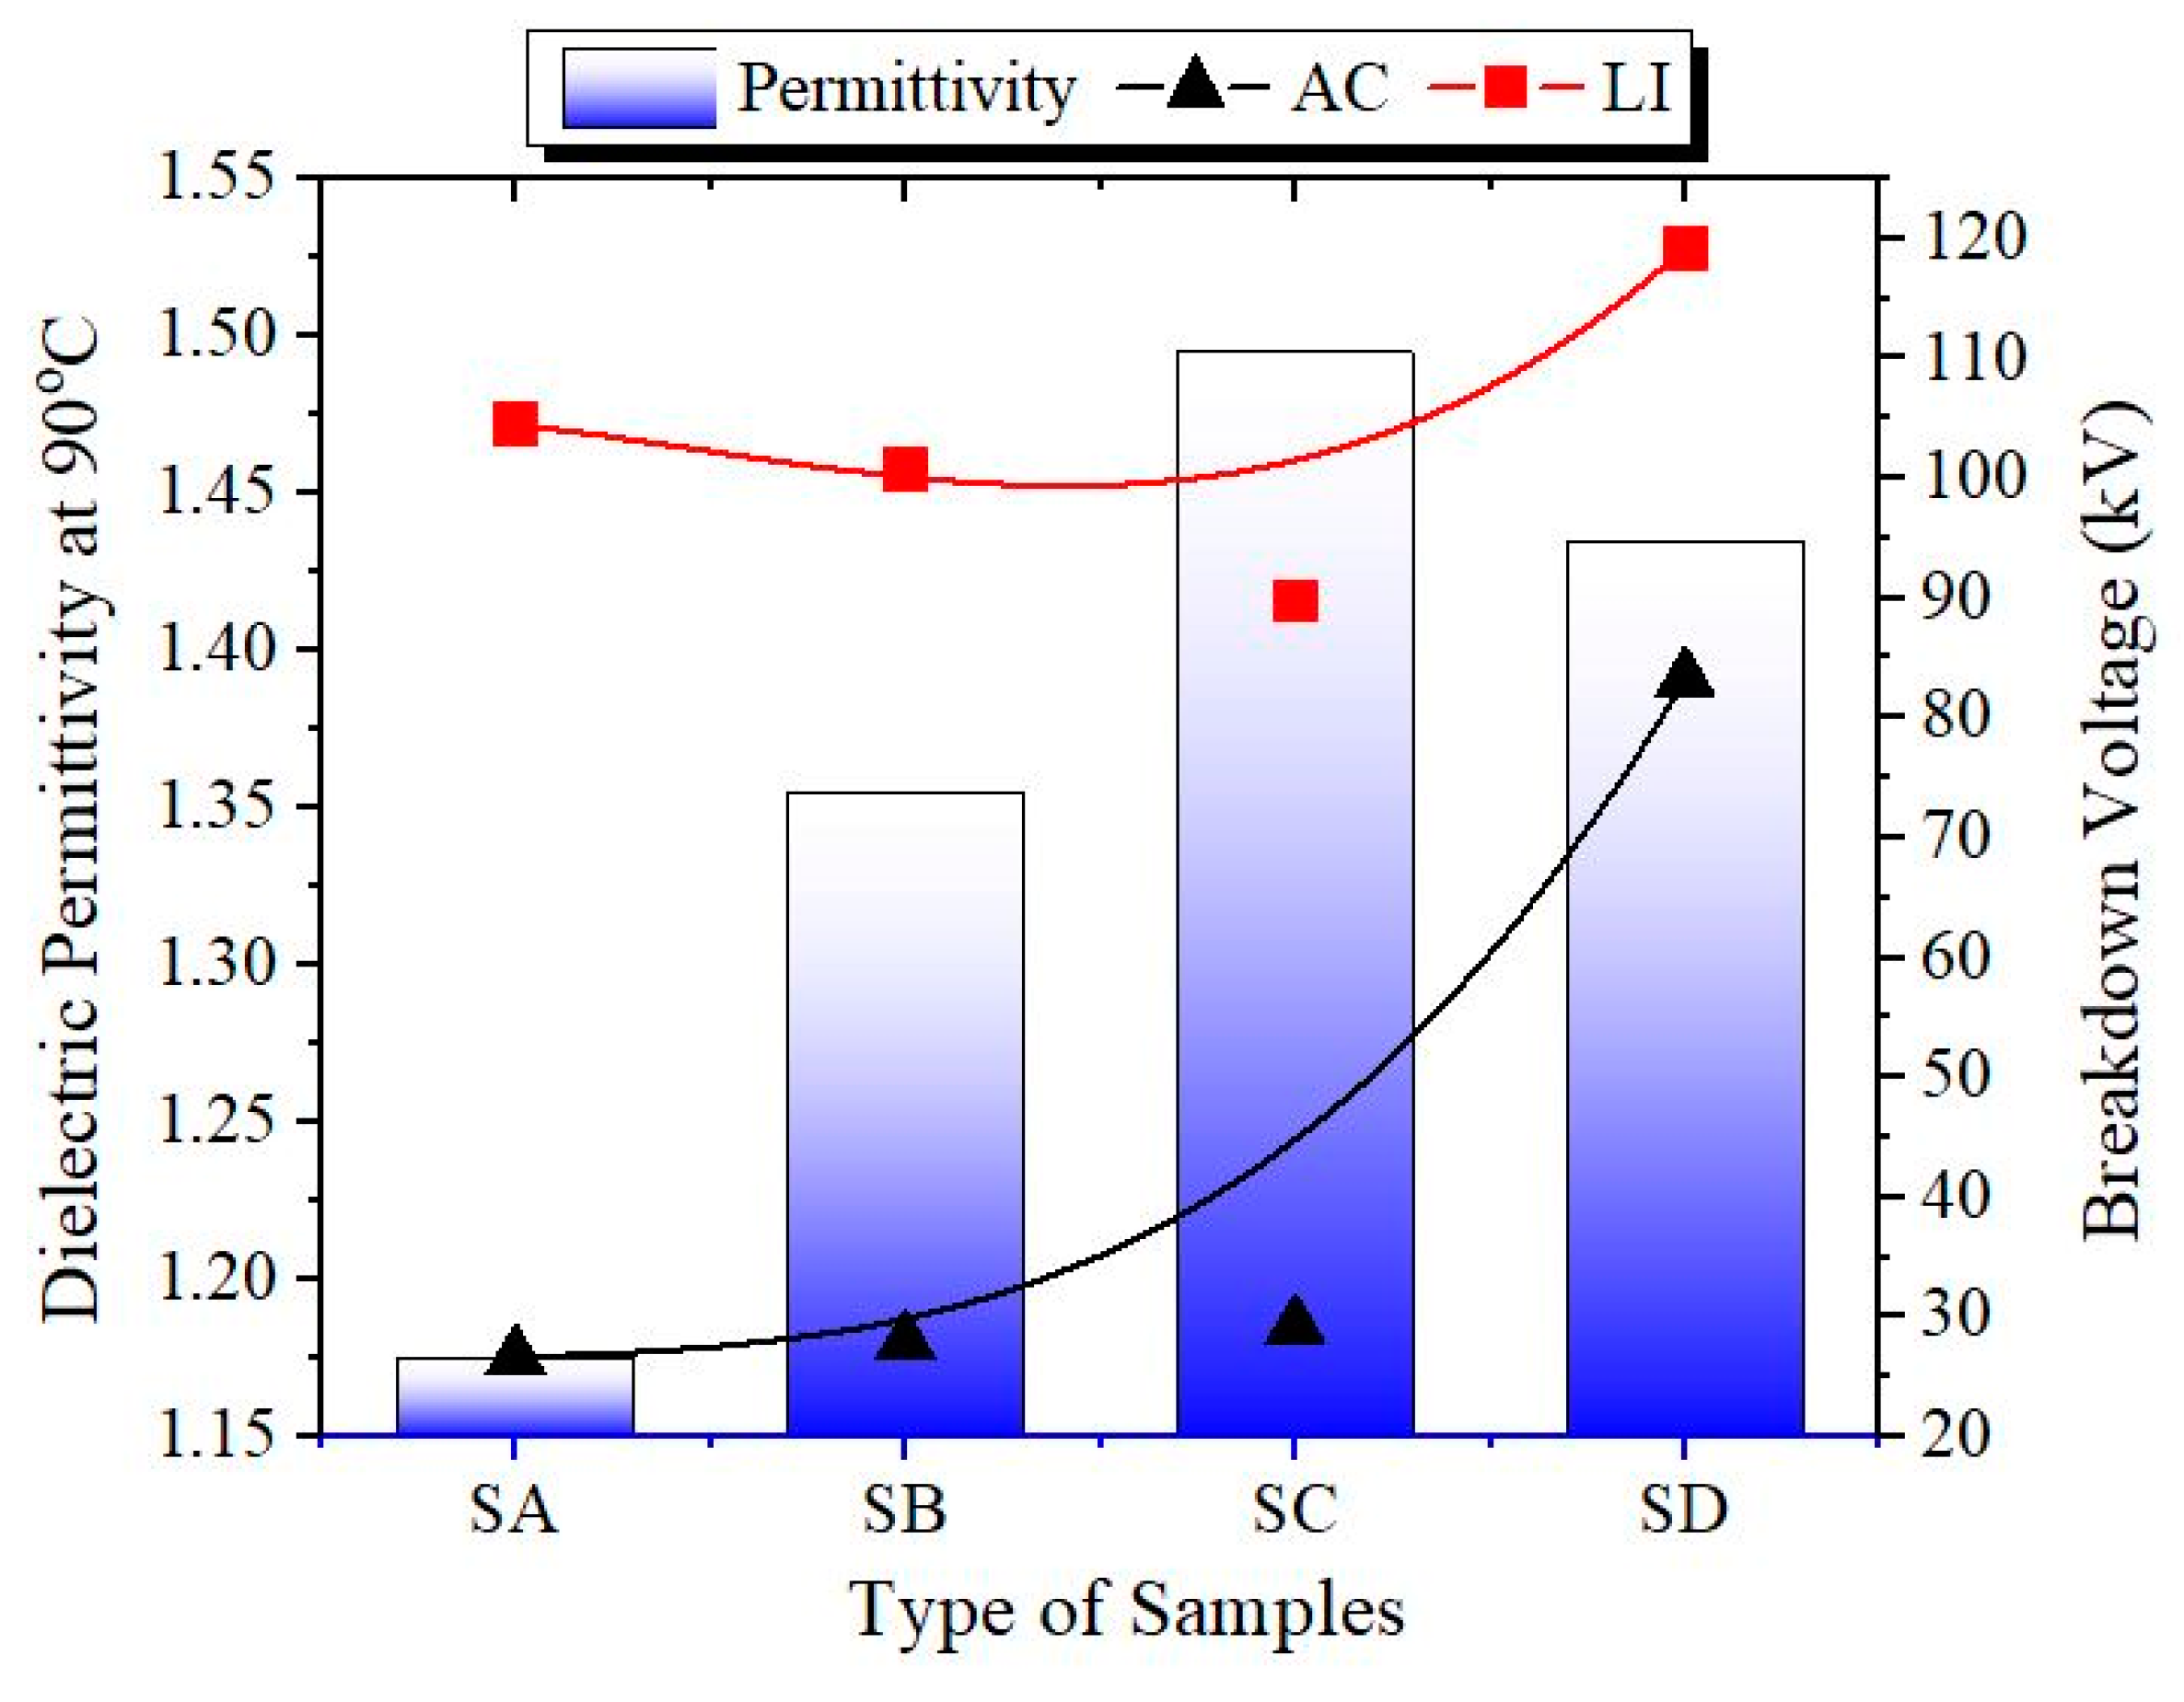
Figure 14.
Influence permittivity of oil samples towards BDV and LI measurements at full-load transformer conditions.
Figure 14.
Influence permittivity of oil samples towards BDV and LI measurements at full-load transformer conditions.
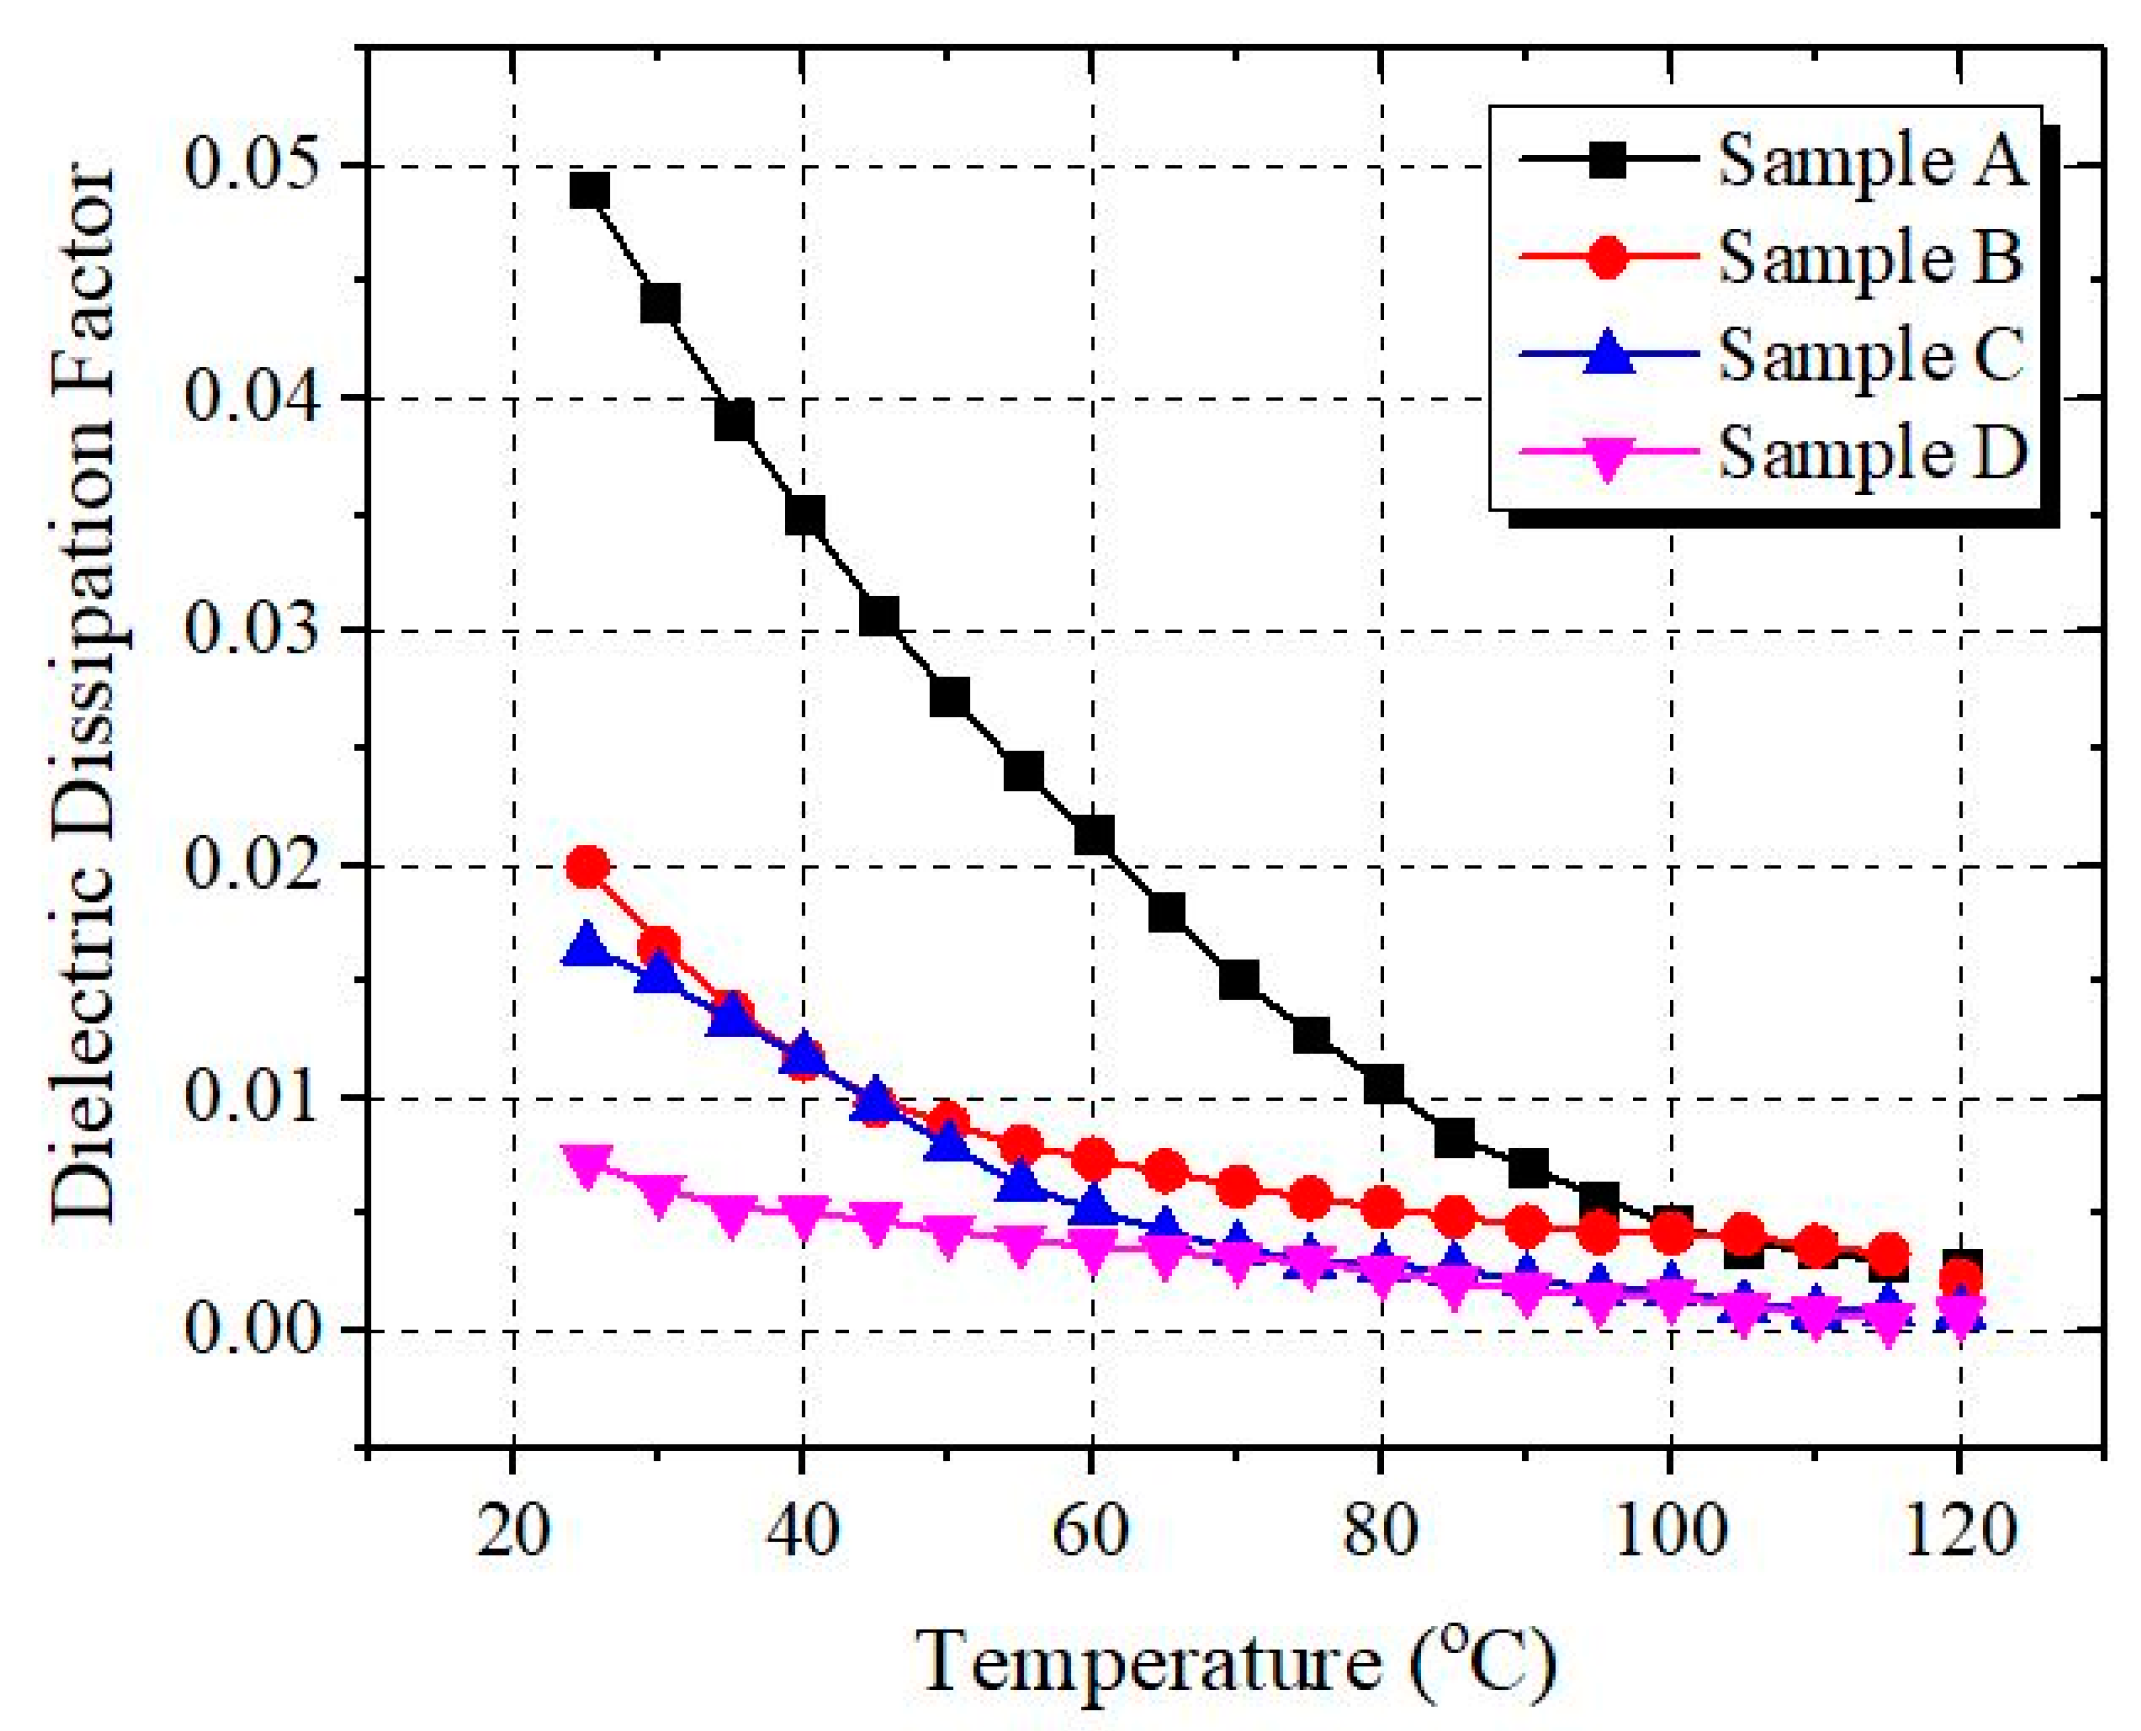
Figure 15.
Dielectric dissipation factor of oil samples at various temperatures.
Figure 15.
Dielectric dissipation factor of oil samples at various temperatures.
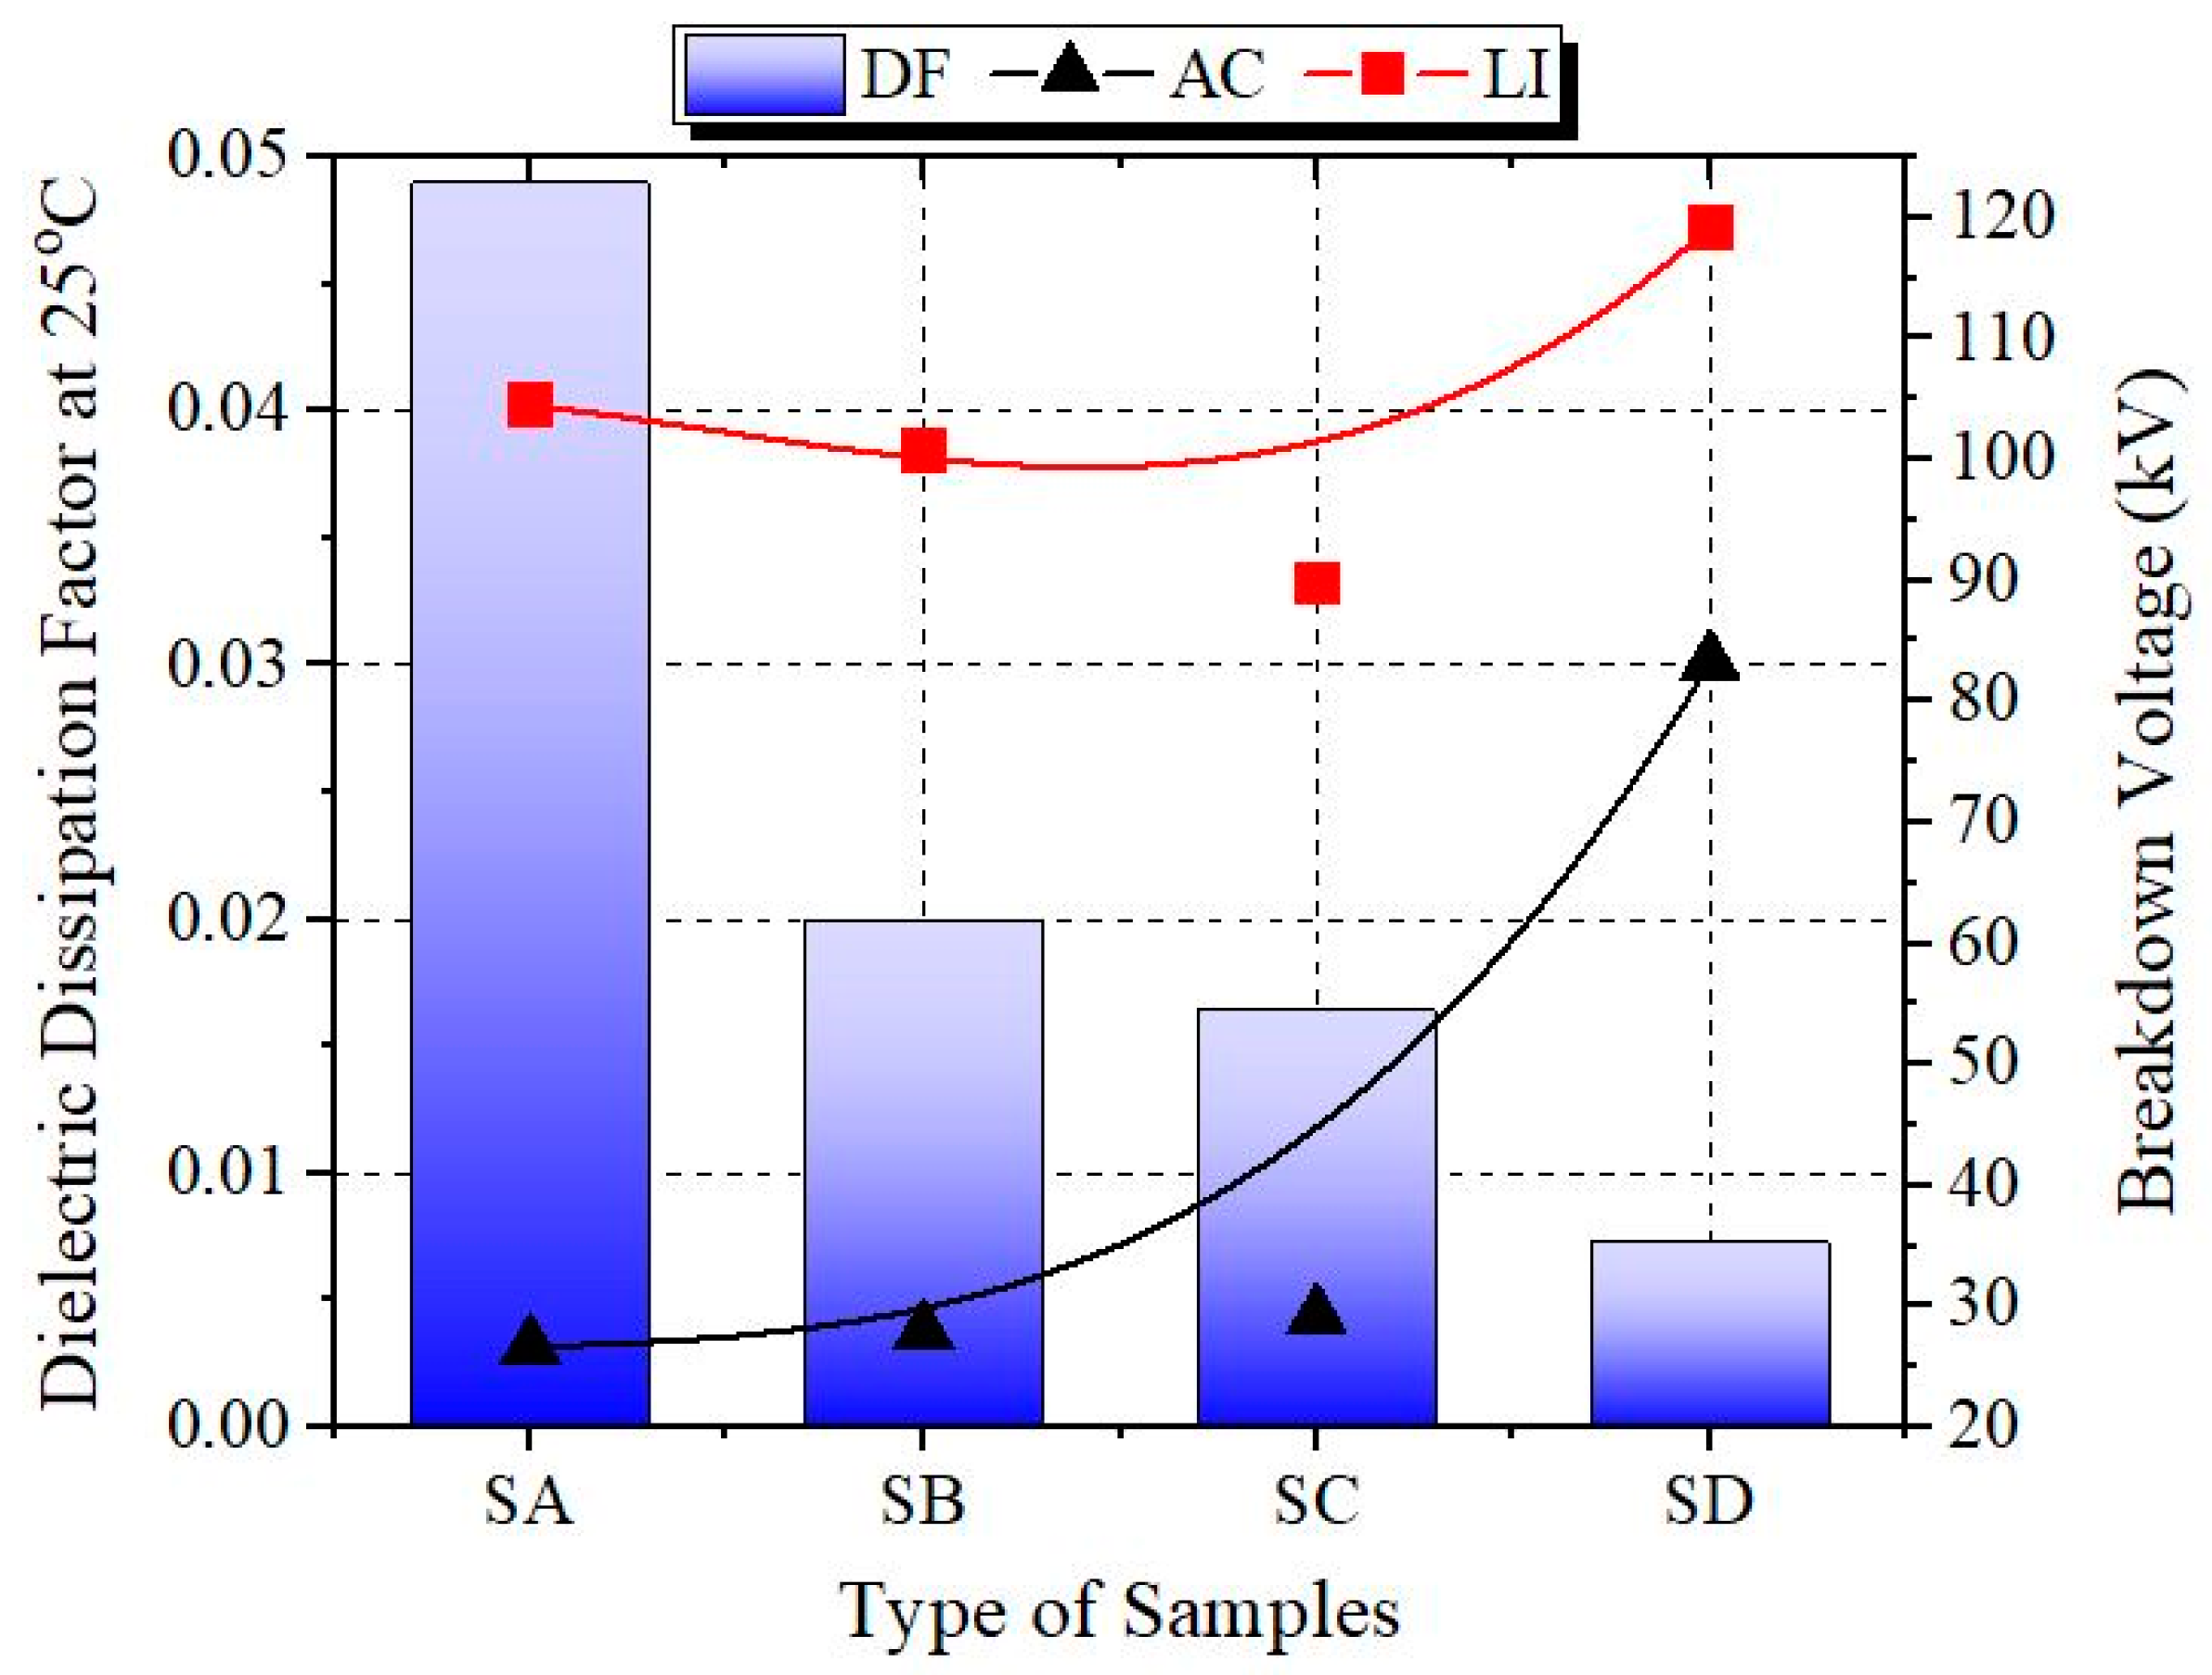
Figure 16.
Influence dissipation factor of oil samples towards AC breakdown voltage and lightning impulse measurement at an ambient temperature.
Figure 16.
Influence dissipation factor of oil samples towards AC breakdown voltage and lightning impulse measurement at an ambient temperature.
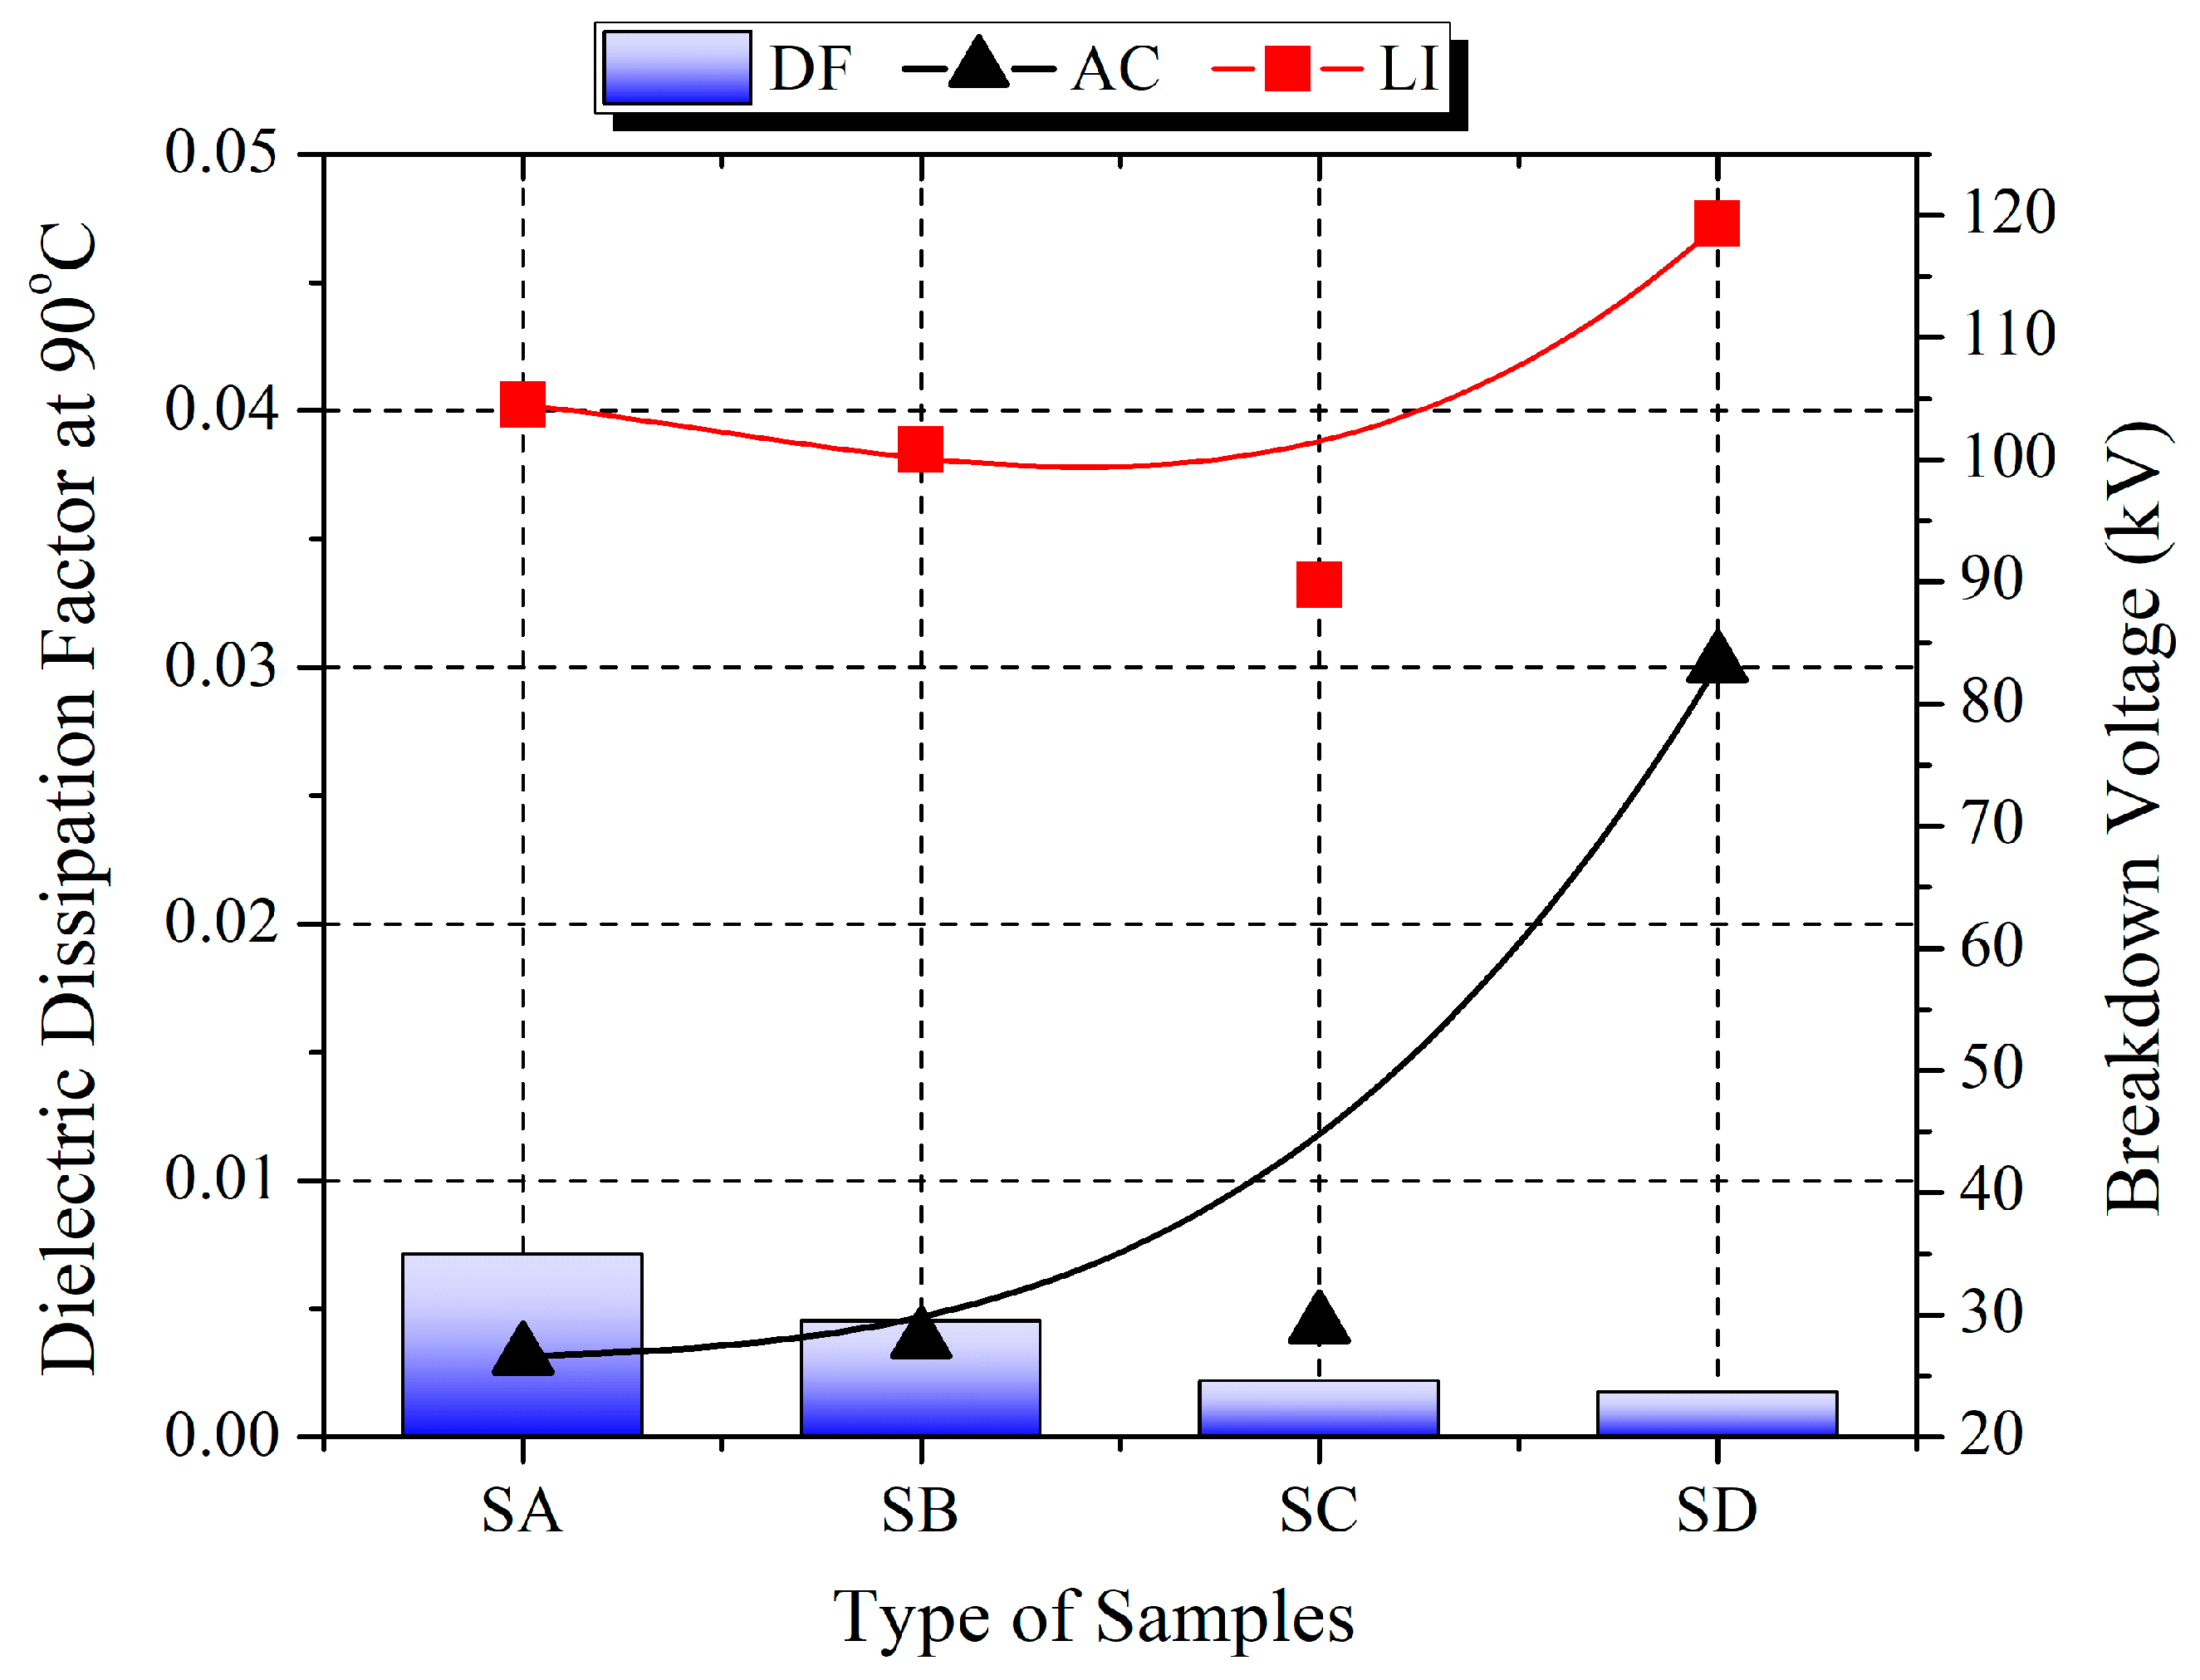
Figure 17.
Influence dissipation factor of oil samples towards AC breakdown voltage and lightning impulse measurement at full-load transformer conditions.
Figure 17.
Influence dissipation factor of oil samples towards AC breakdown voltage and lightning impulse measurement at full-load transformer conditions.
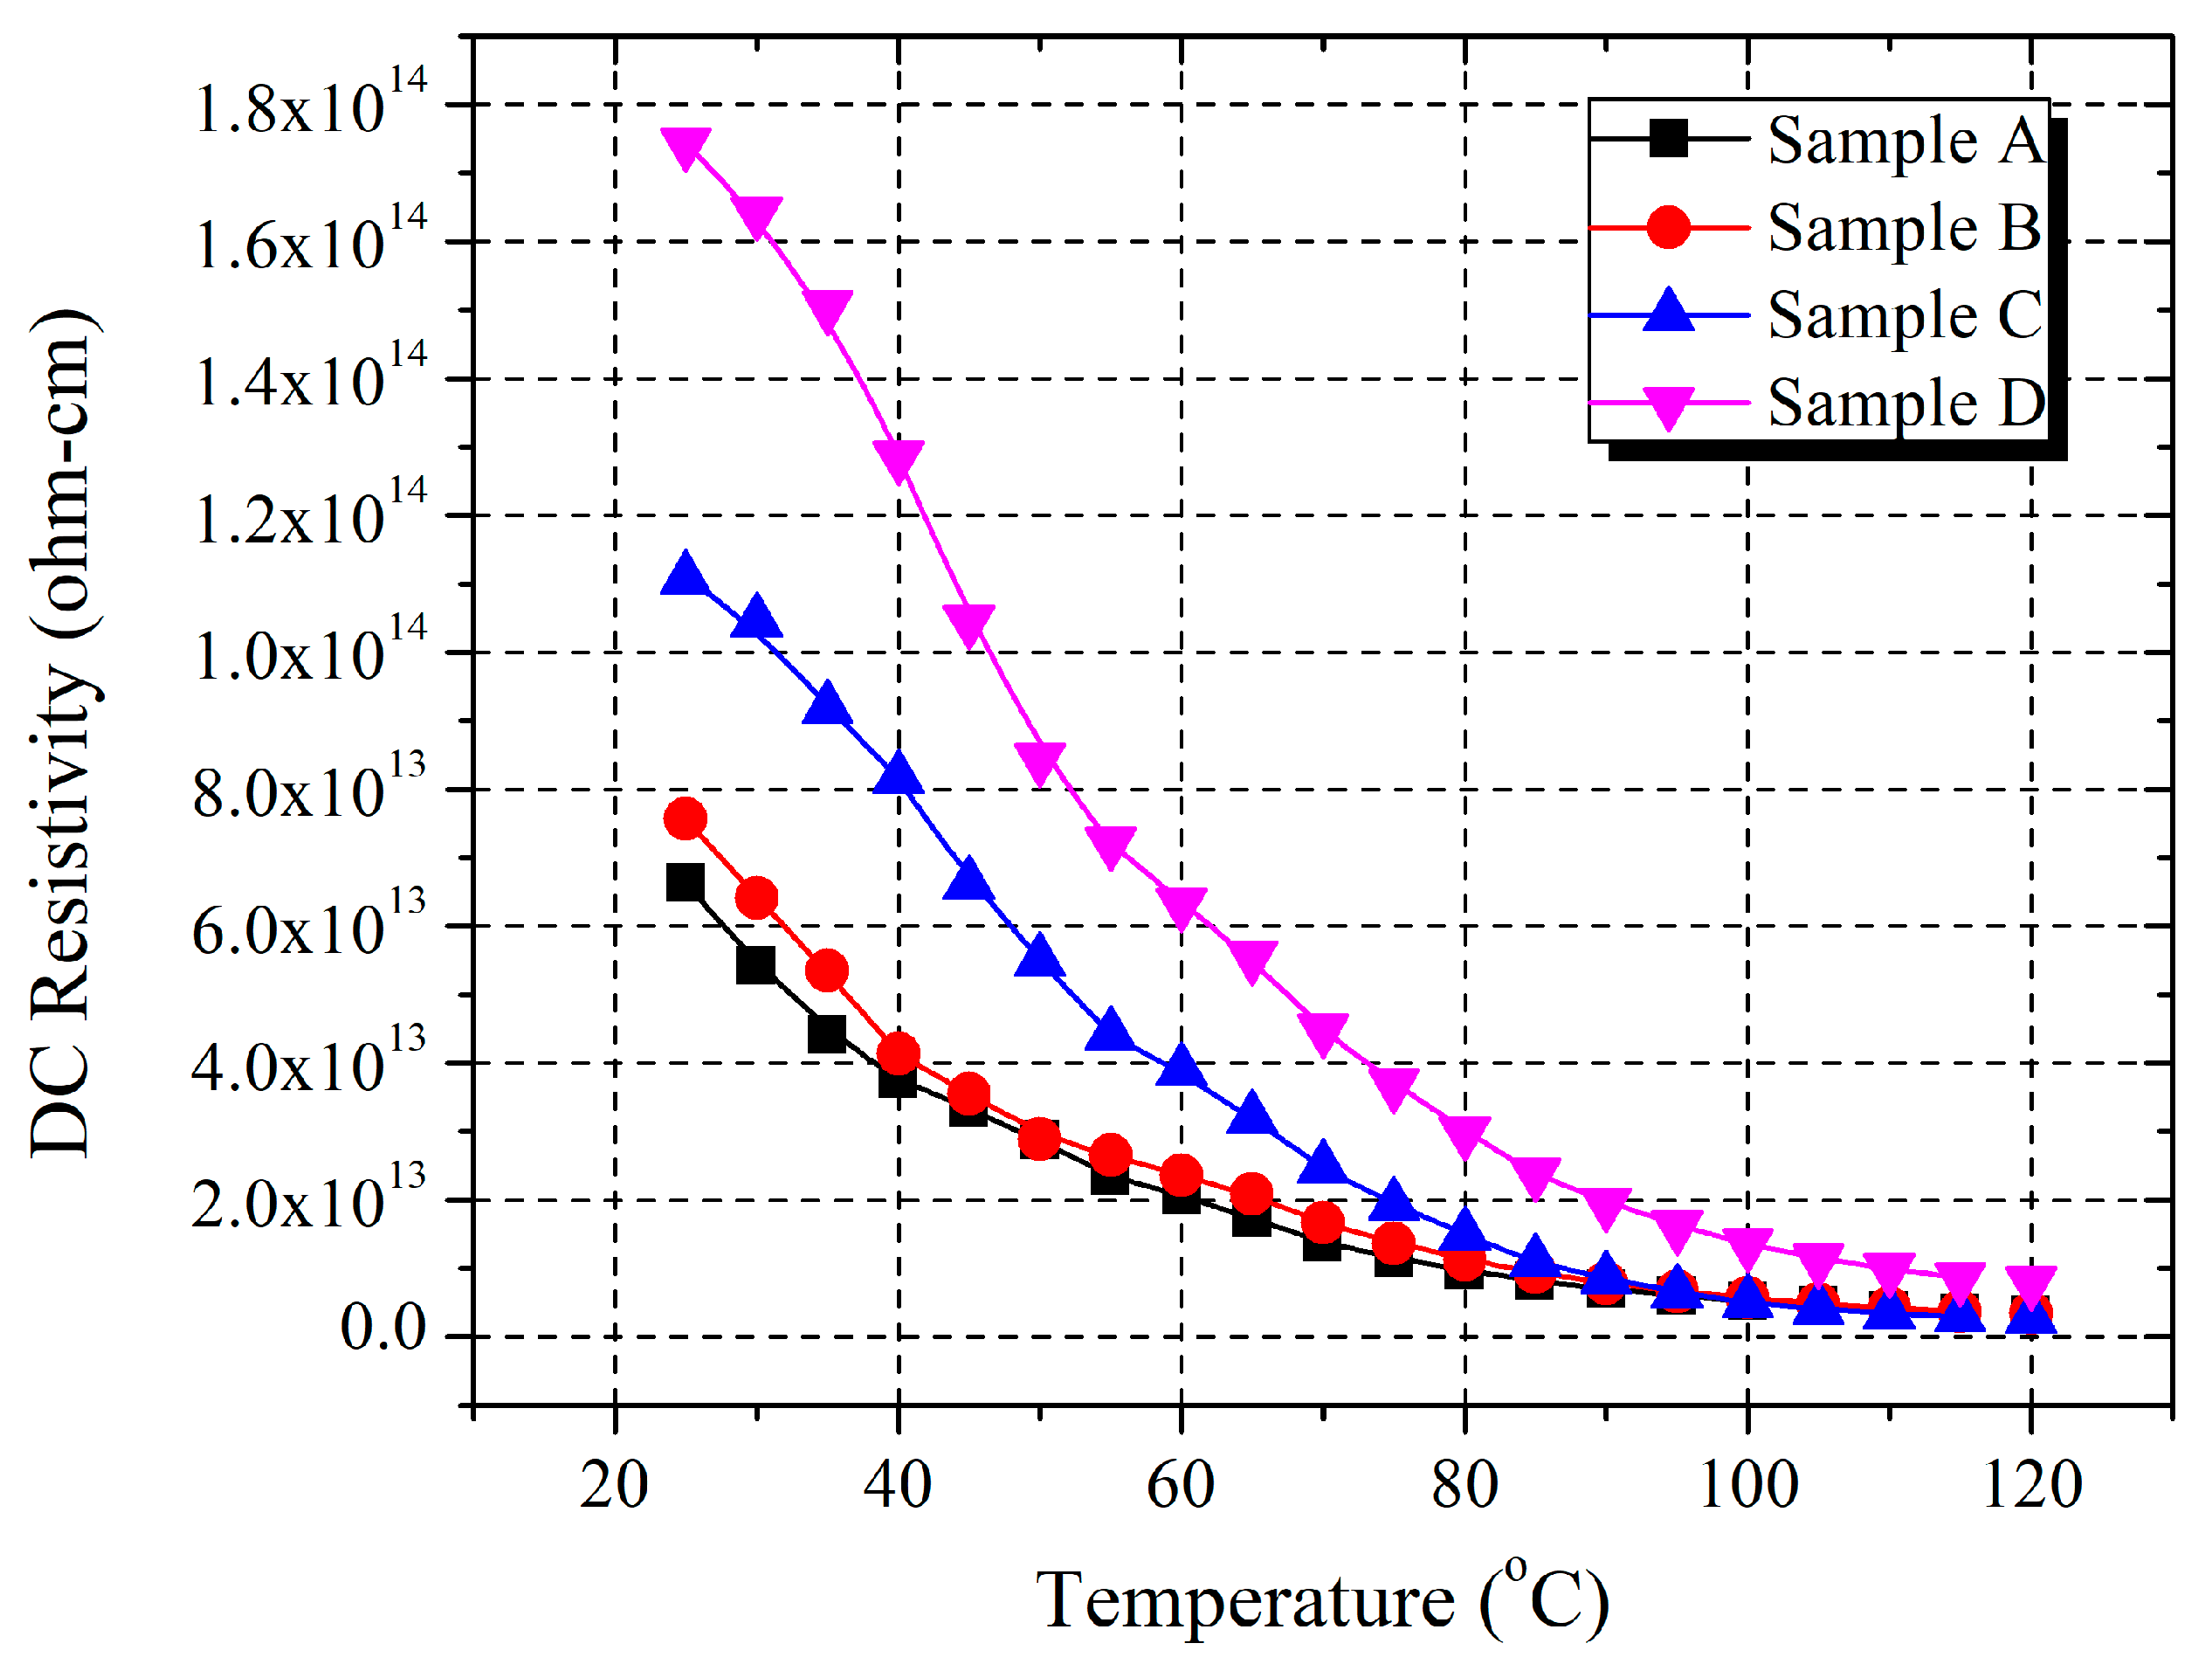
Figure 18.
DC resistivity of oil samples at various temperatures.
Figure 18.
DC resistivity of oil samples at various temperatures.
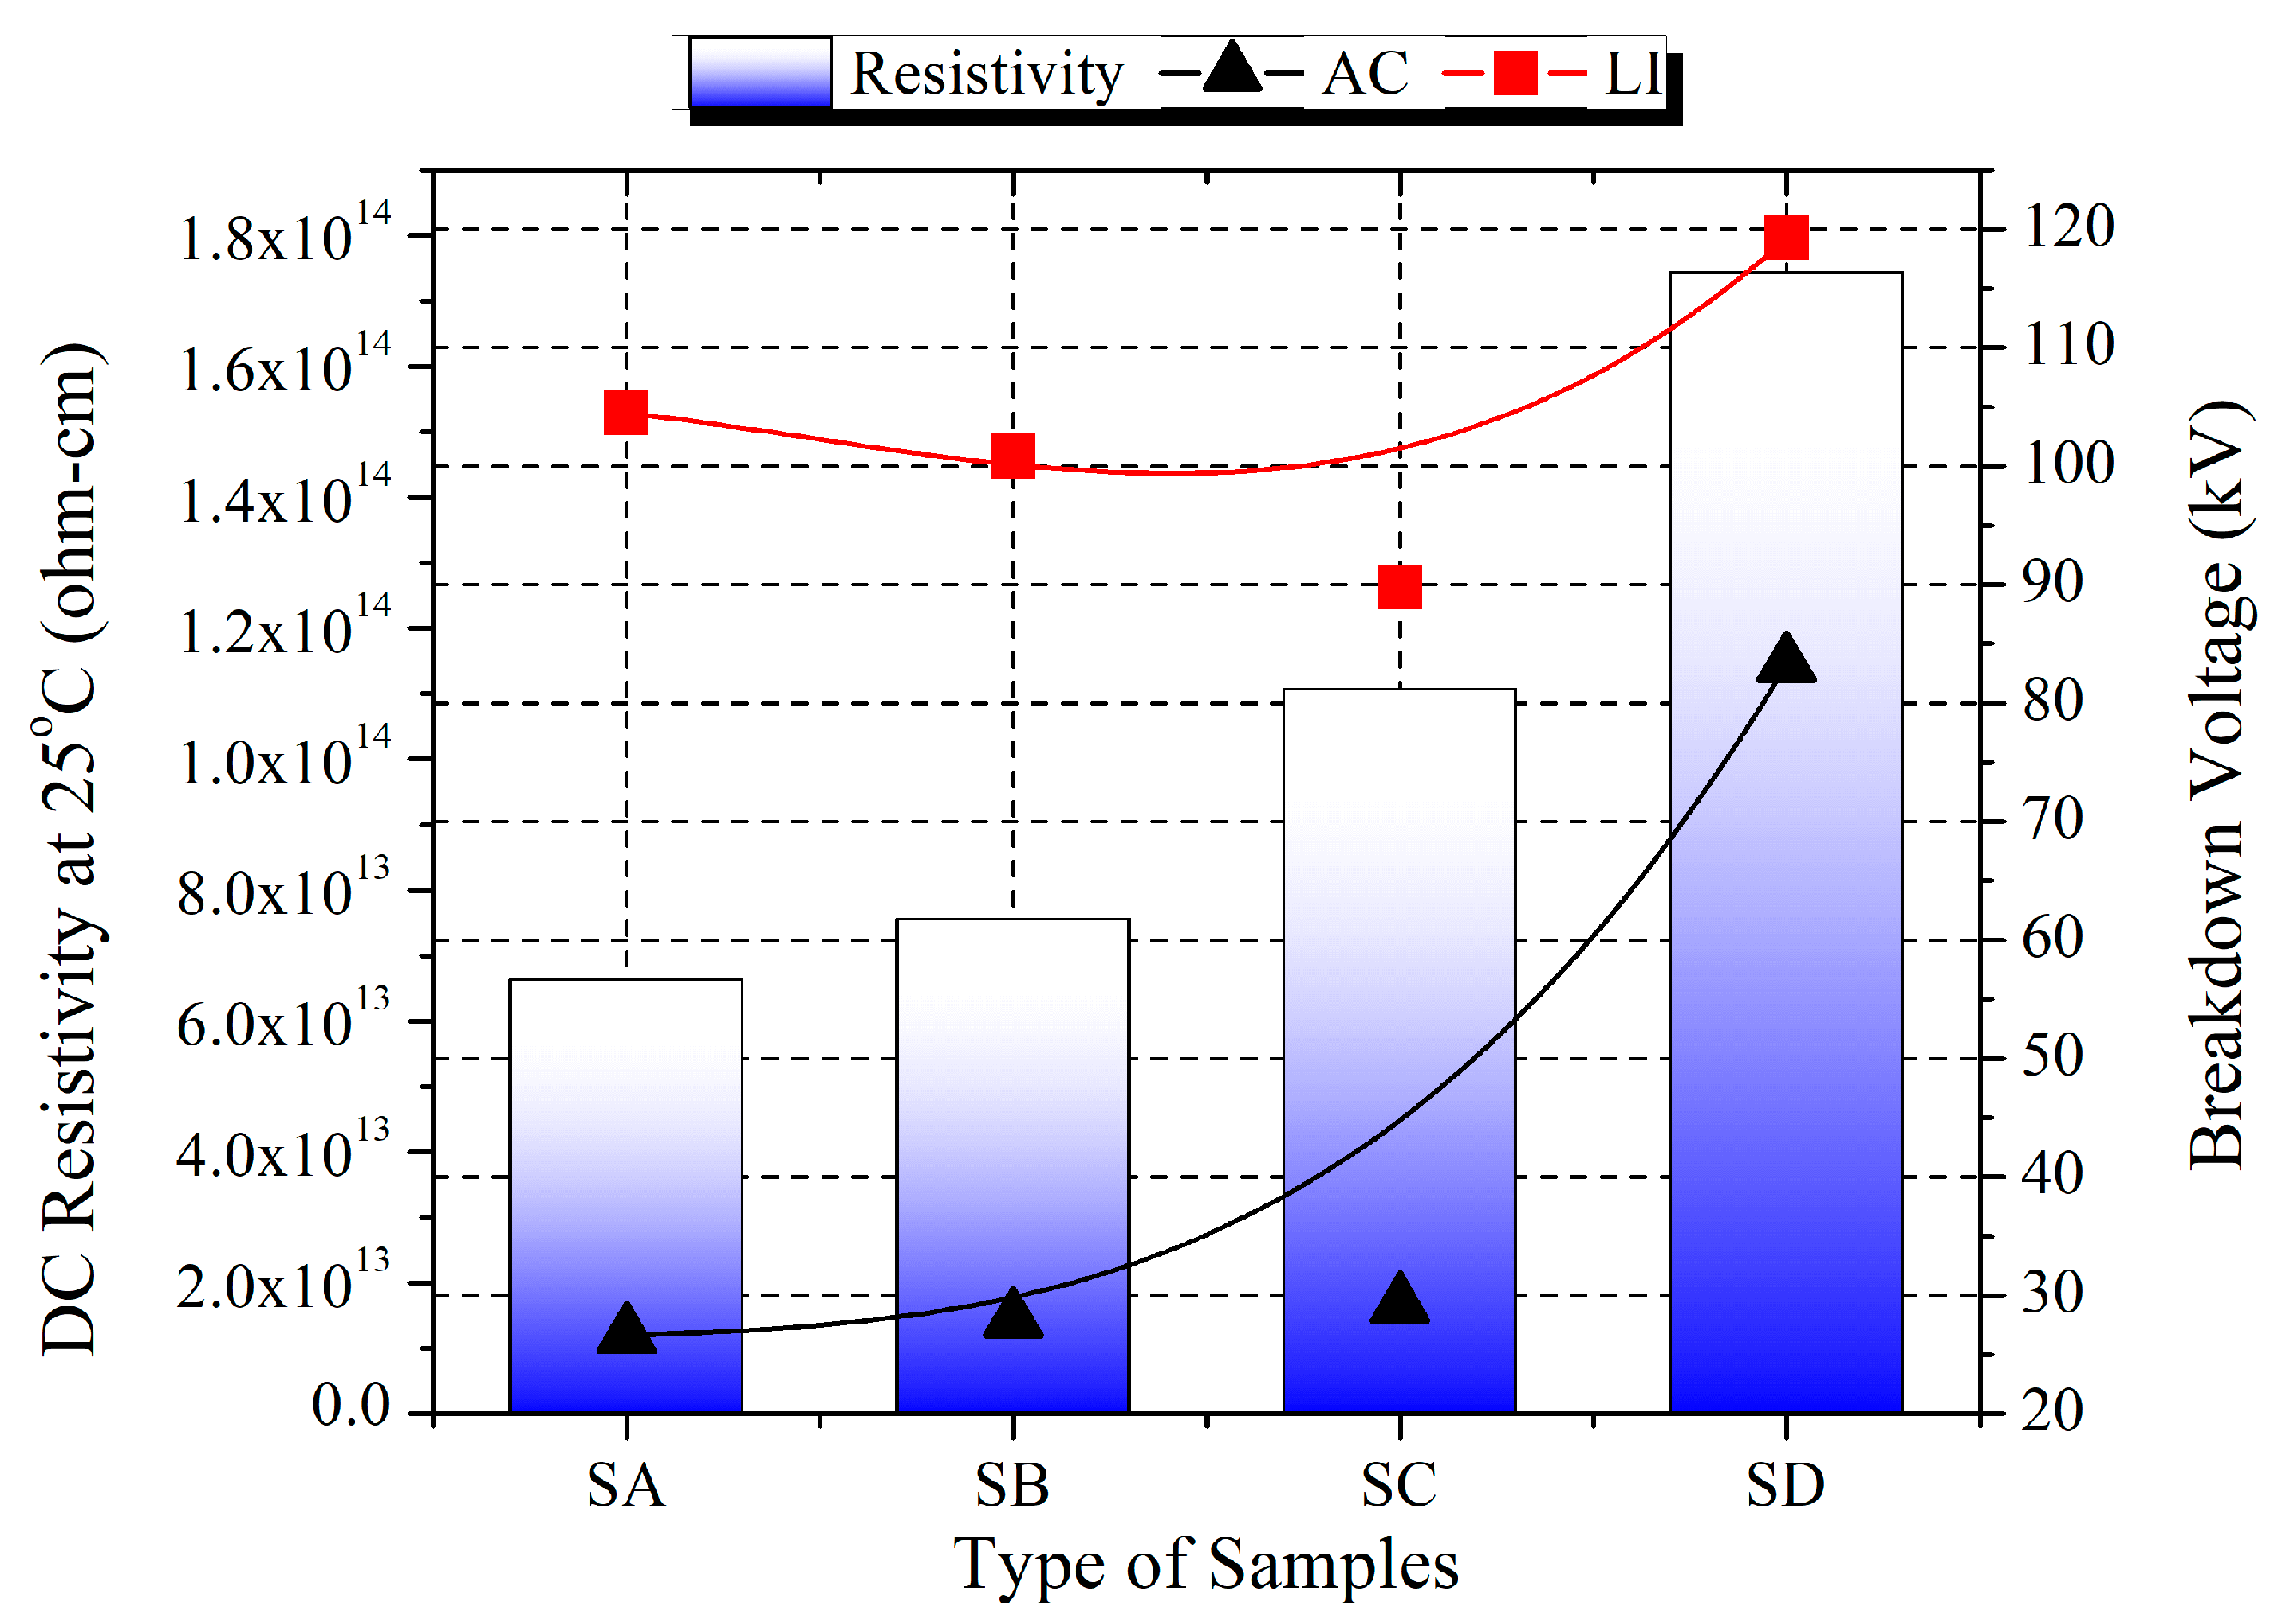
Figure 19.
Influence DC resistivity of oil samples towards breakdown voltage and lightning impulse measurements at ambient temperature.
Figure 19.
Influence DC resistivity of oil samples towards breakdown voltage and lightning impulse measurements at ambient temperature.
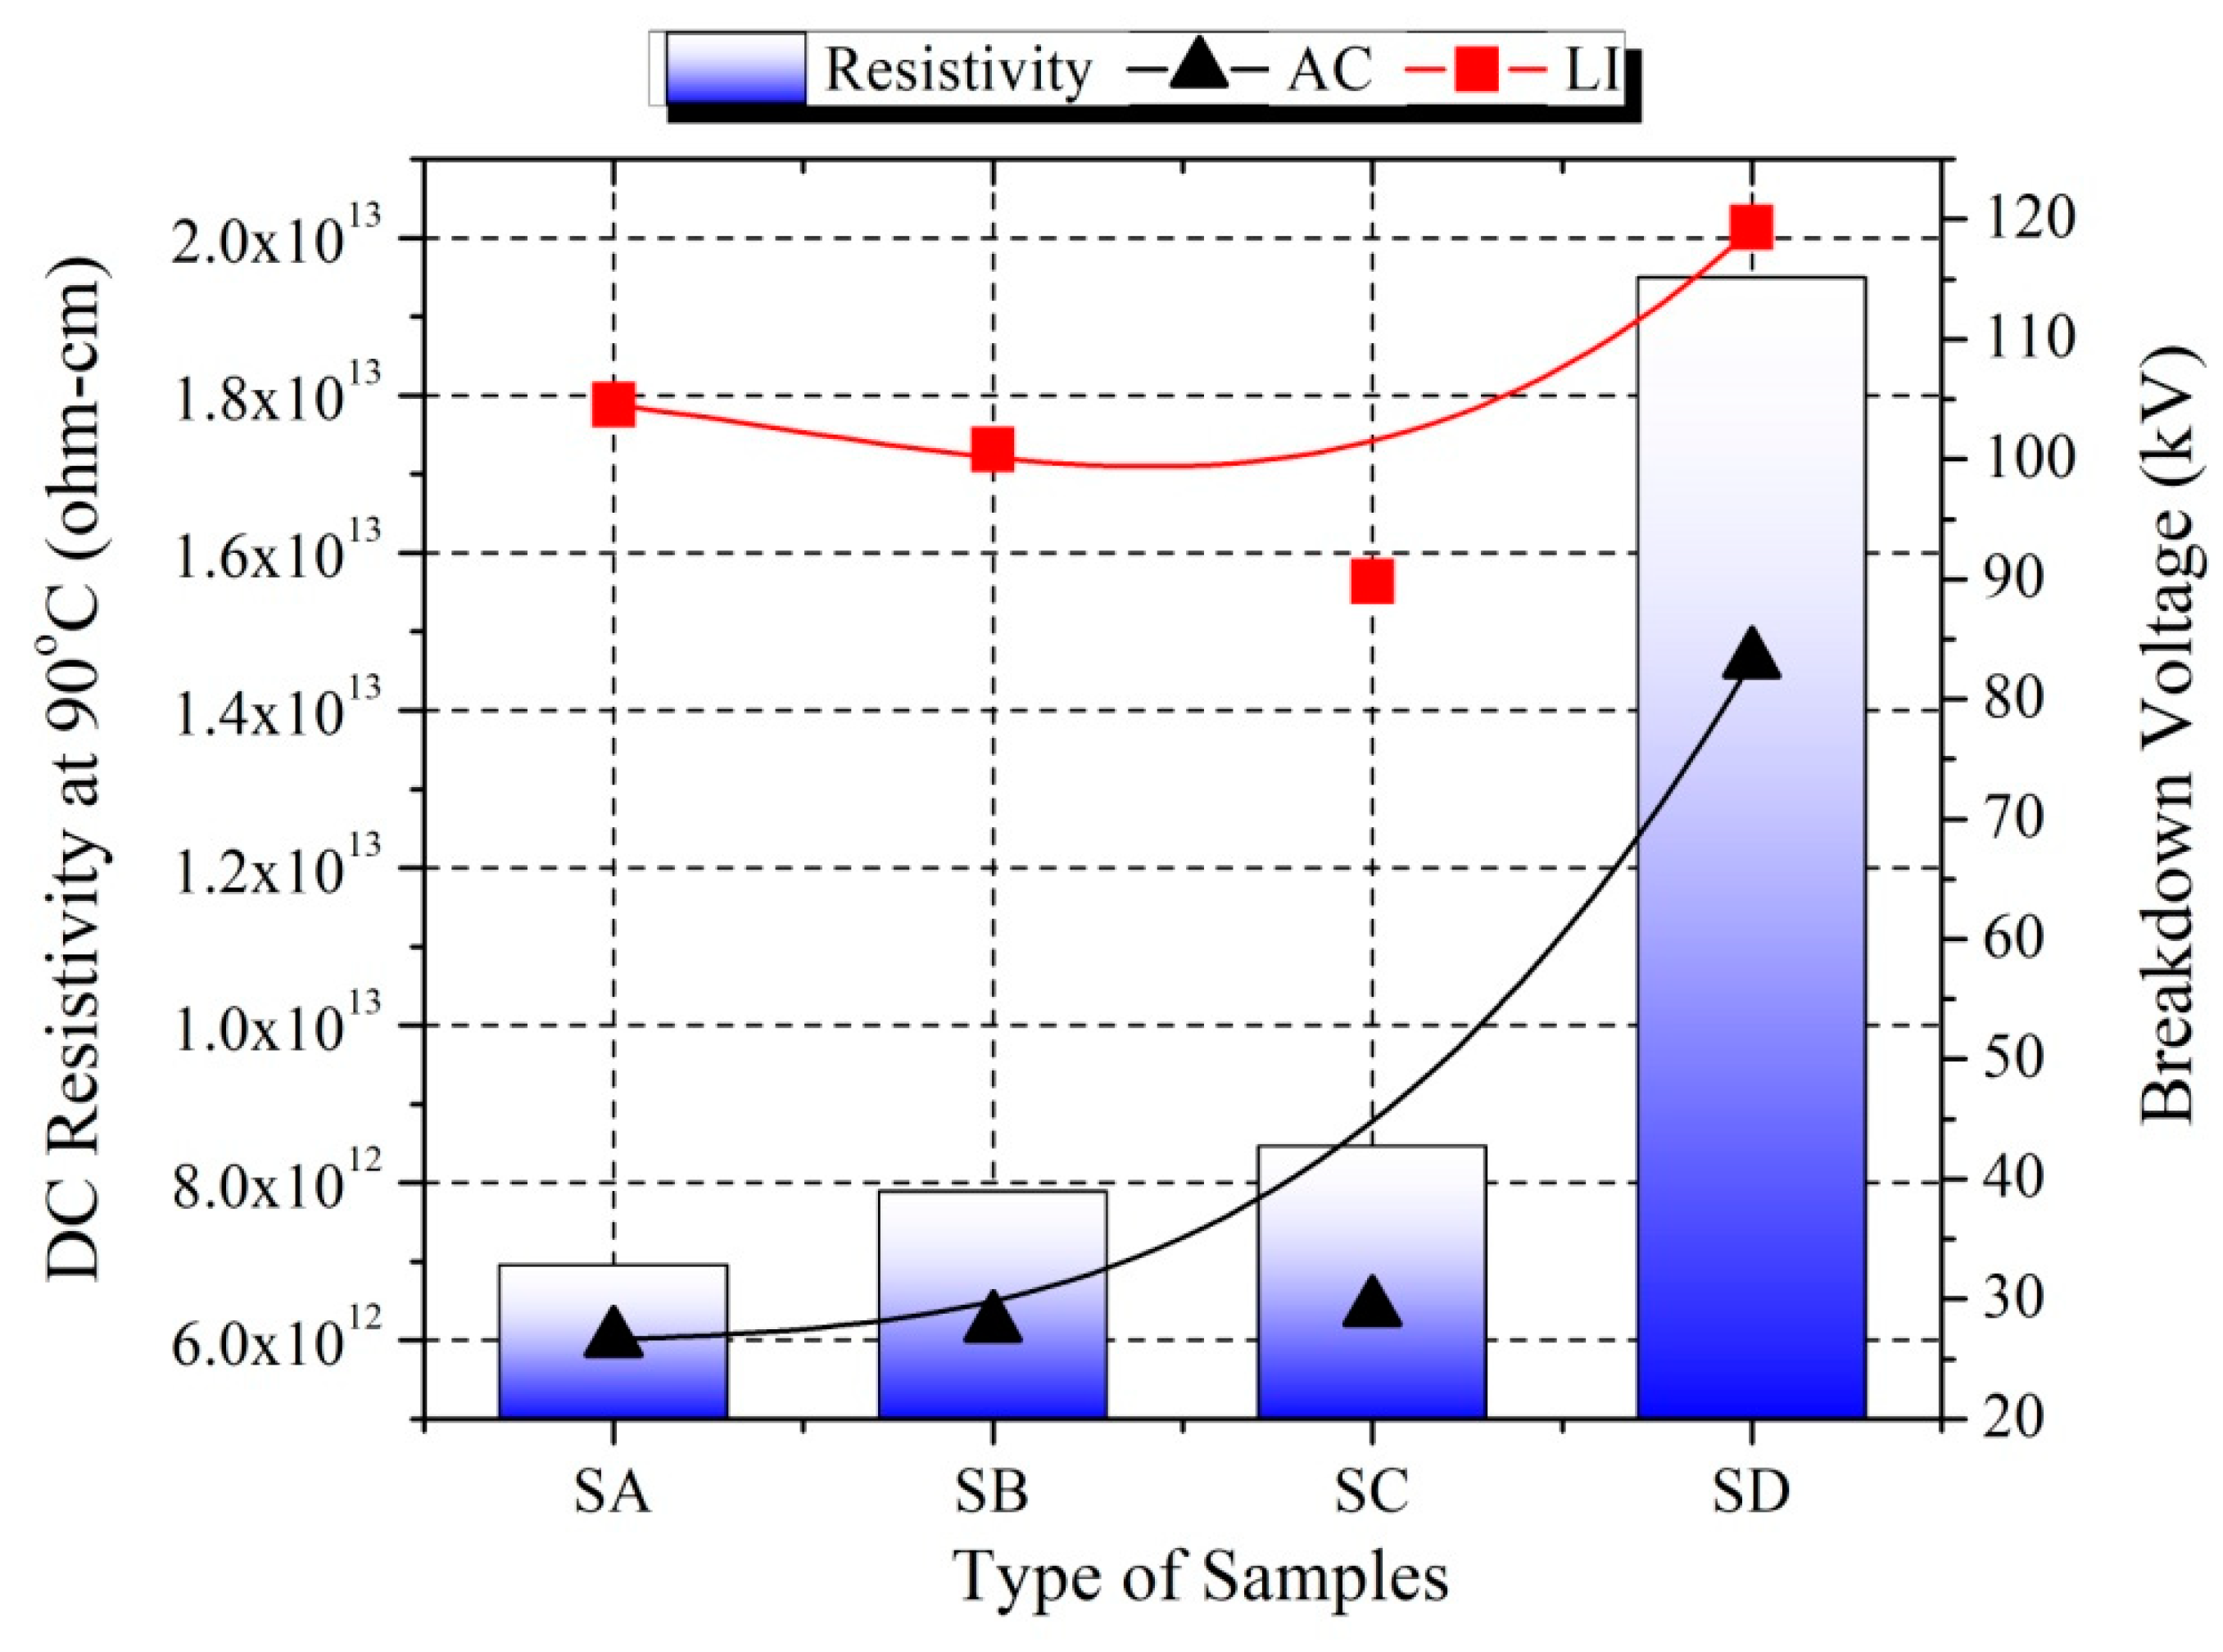
Figure 20.
Influence DC resistivity of oil samples towards breakdown voltage and lightning impulse measurements at full-load transformer condition.
Figure 20.
Influence DC resistivity of oil samples towards breakdown voltage and lightning impulse measurements at full-load transformer condition.
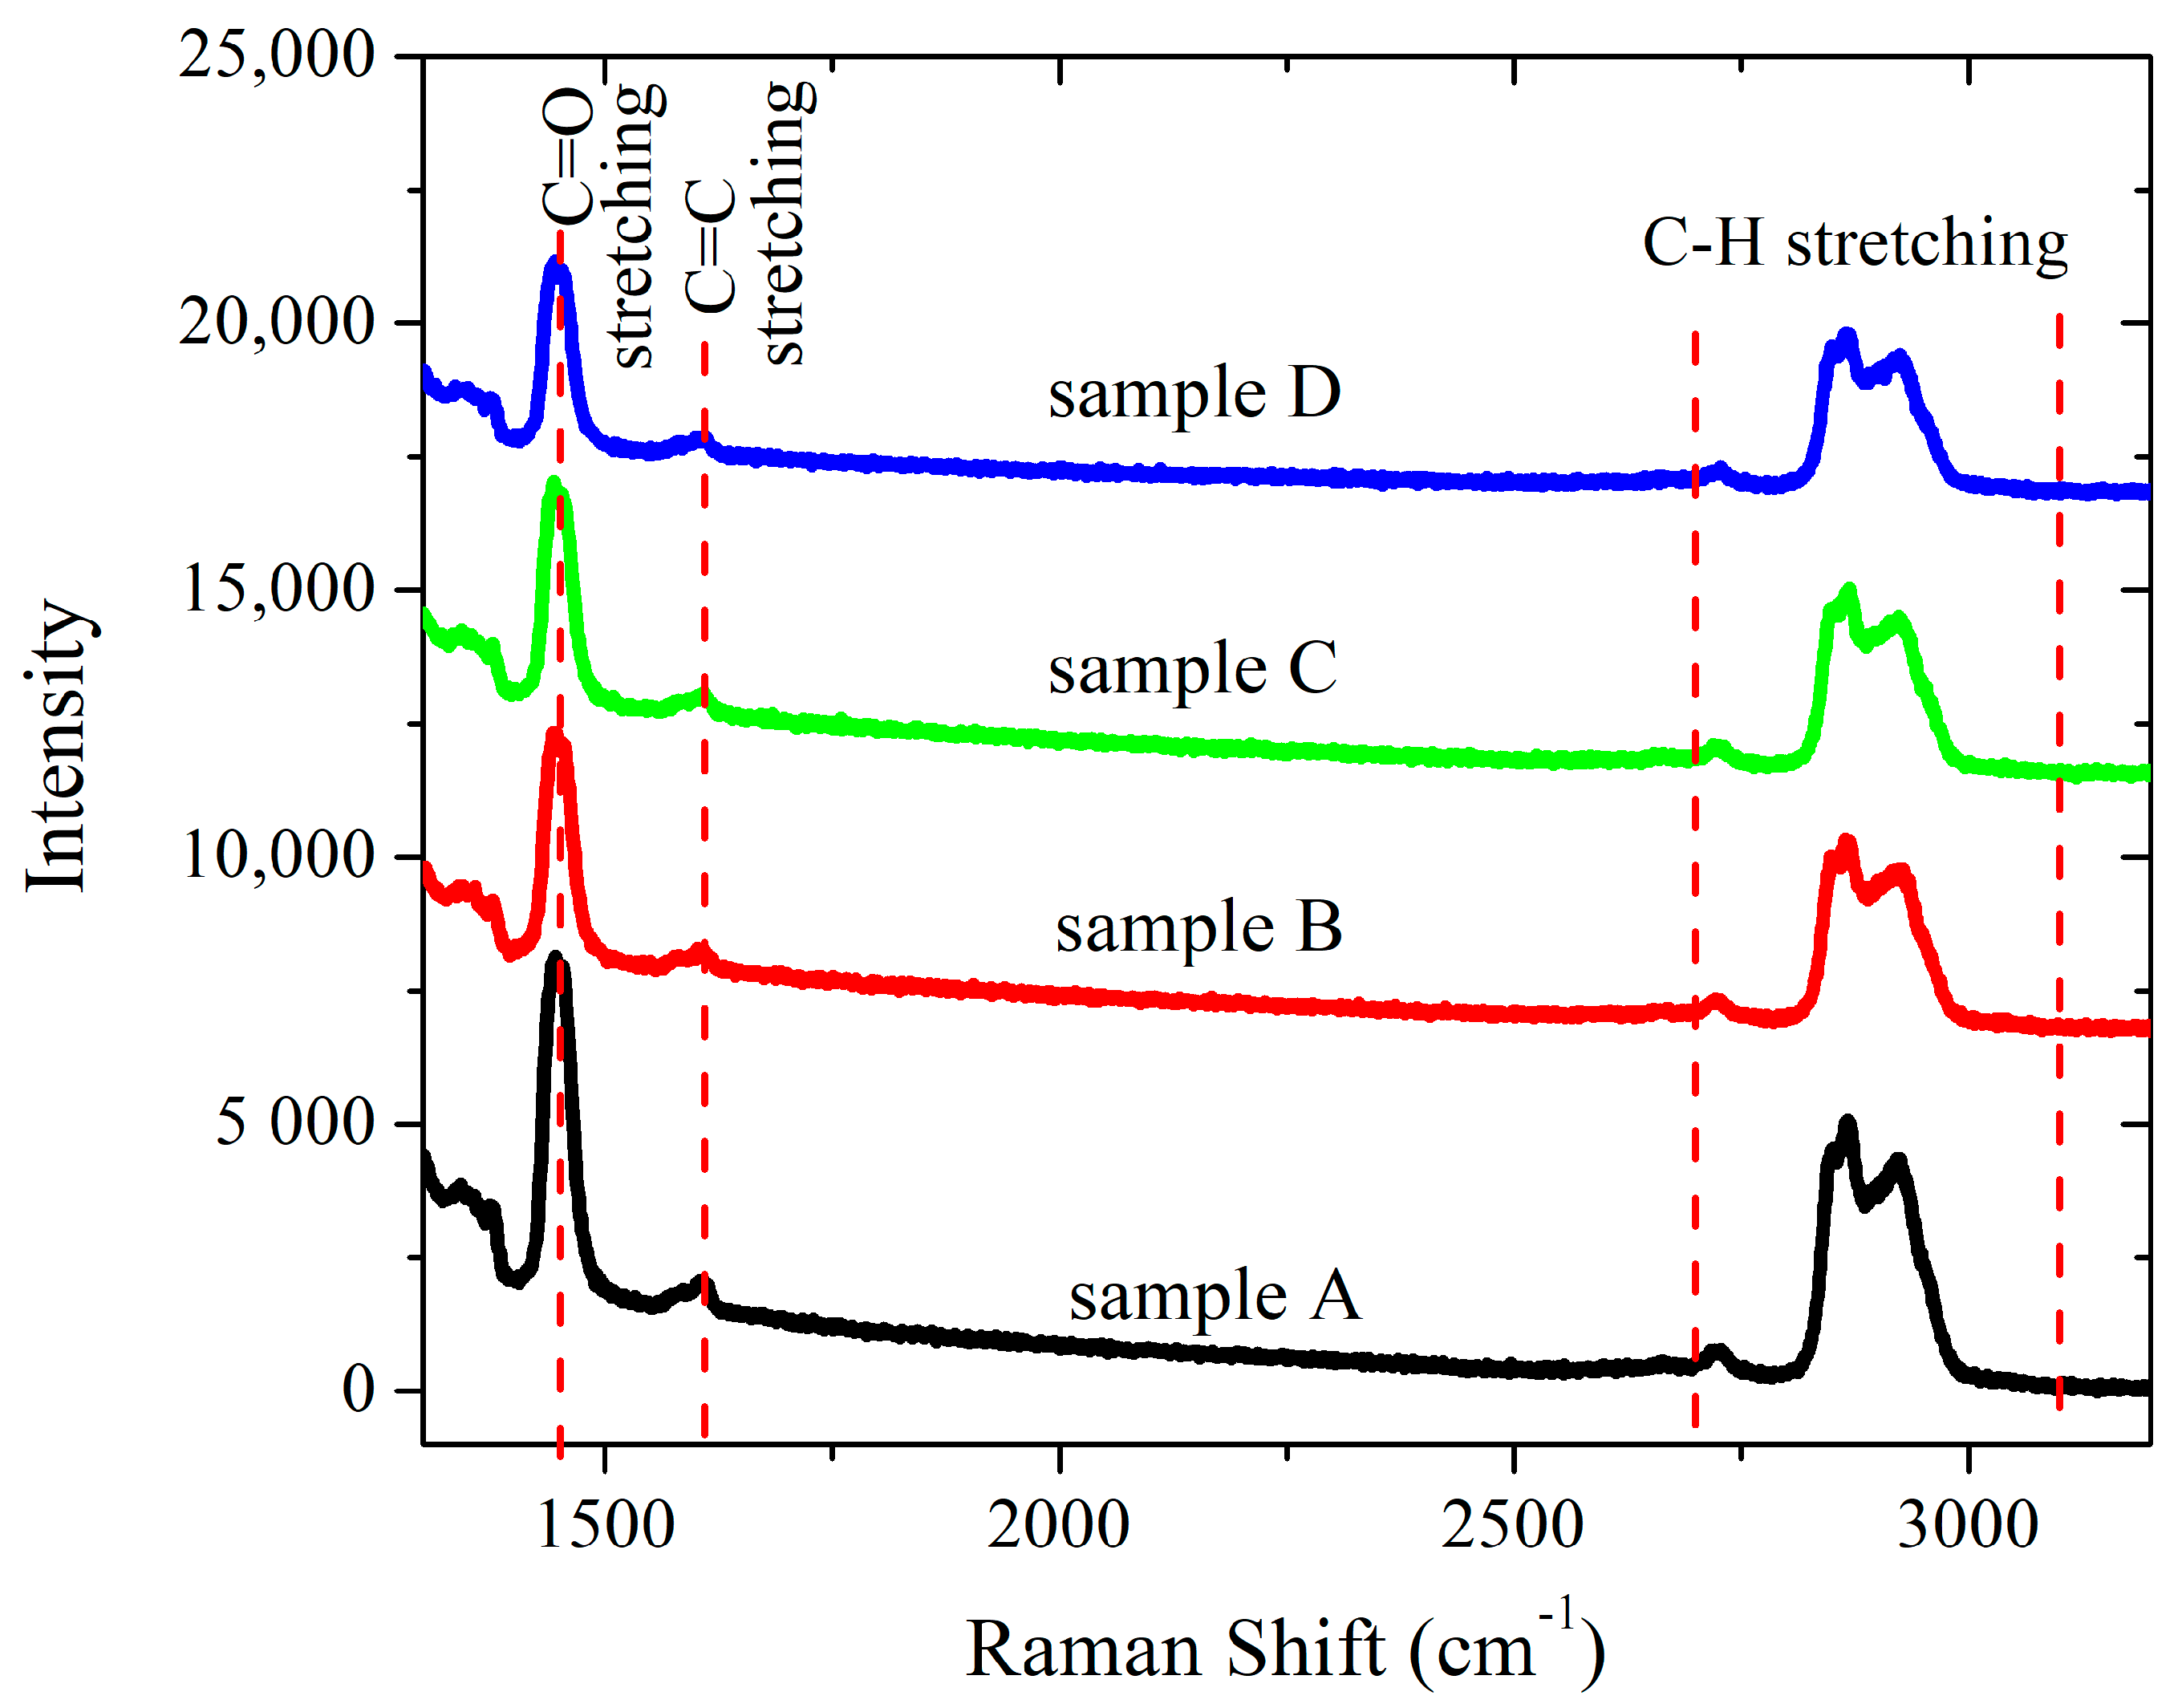
Figure 21.
Raman structure of oil samples between 1300 cm−1 to 3200 cm−1 Ramanshifts.
Figure 21.
Raman structure of oil samples between 1300 cm−1 to 3200 cm−1 Ramanshifts.
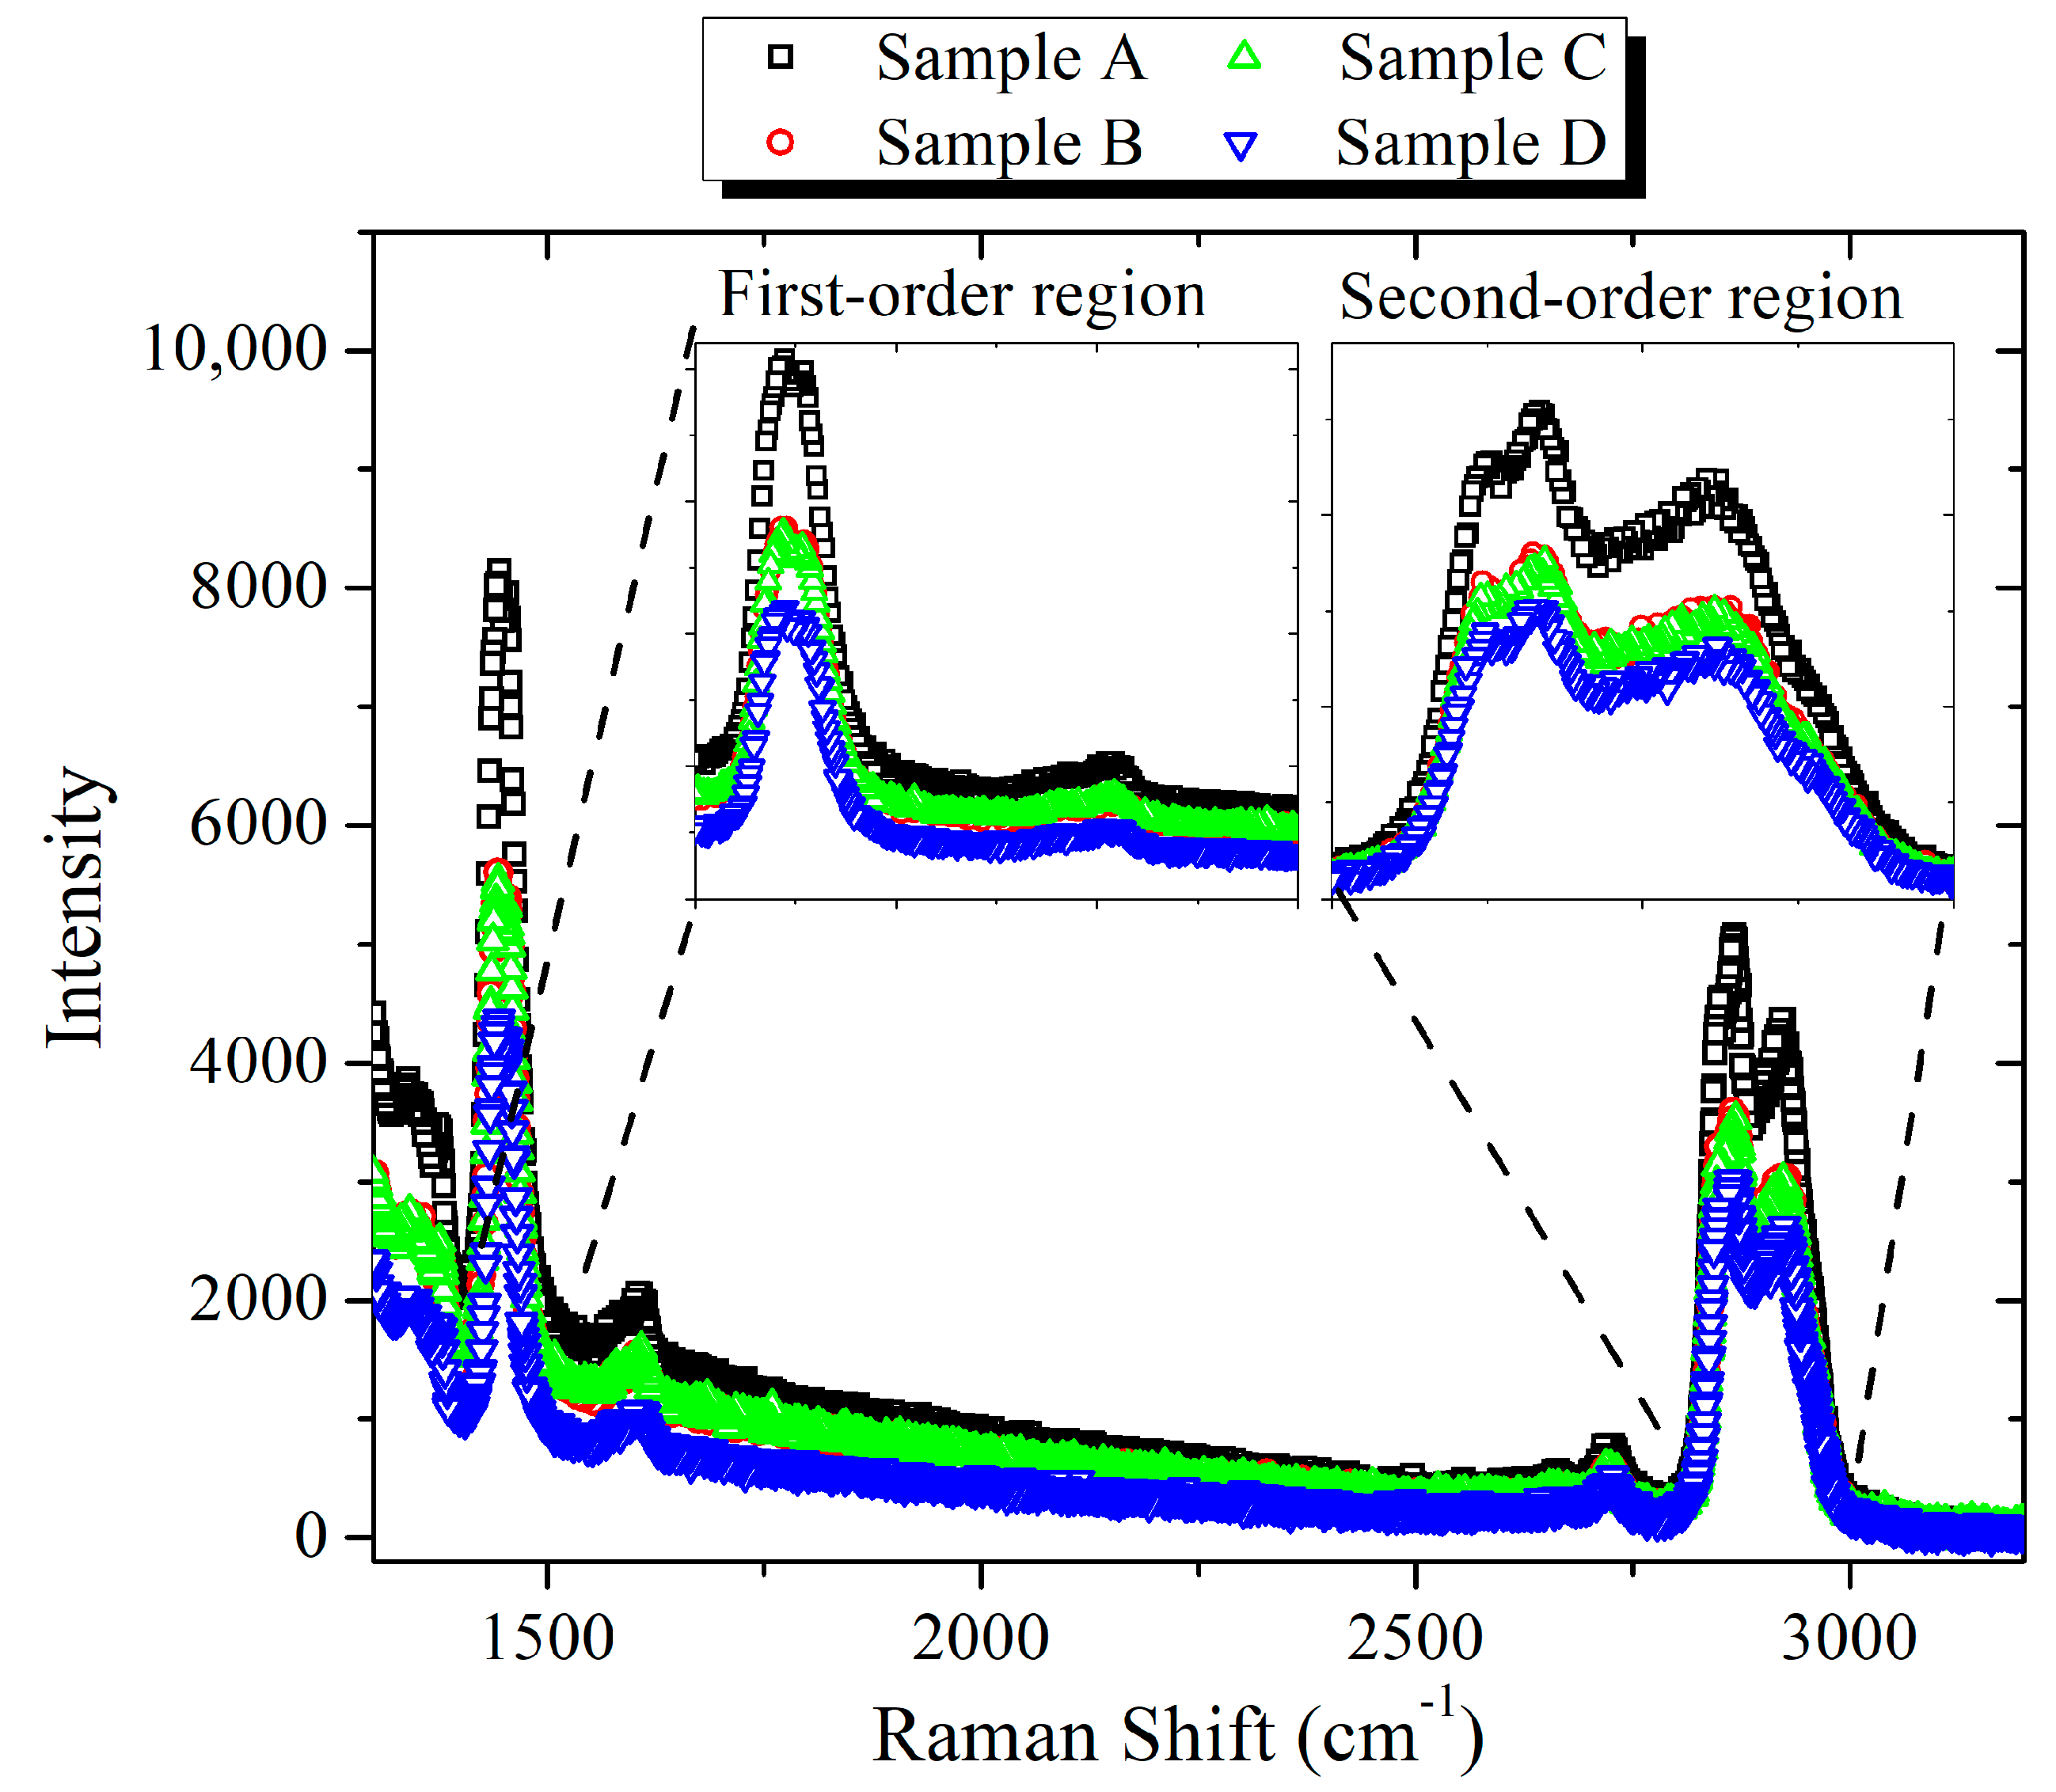
Figure 22.
First order and second order region of Raman structure.
Figure 22.
First order and second order region of Raman structure.
Table 1.
Properties of Multi-walled Carbon Nanotubes (MWCNTs) involved in this work.
Table 1.
Properties of Multi-walled Carbon Nanotubes (MWCNTs) involved in this work.
| Property | Unit | MWCNT |
|---|
| Outer Diameter | nm | 5–15 |
| Inner Diameter | nm | 2–5 |
| Length | µm | 10–30 |
| Purity | % | 95 |
| Specific Surface Area | m2/g | 220–300 |
| Tap Density | g/cm3 | 0.27 |
| True Density | g/cm3 | ~2.1 |
| Electrical Conductivity | s/cm | >100 |
| Making Method | - | CVD |
Table 2.
Types of specimen involved in this work.
Table 2.
Types of specimen involved in this work.
| Samples | Description of Samples |
|---|
| Sample 1 (SA) | Disposed mineral oil (base oil) |
| Sample 2 (SB) | After filtration process |
| Sample 3 (SC) | After filtration, thermal and degassed process |
| Sample 4 (SD) | Mineral oil with 0.005g/L CNT Nanofluid |
Table 3.
Descriptive statistic of fifty AC breakdown voltage values for different oil samples.
Table 3.
Descriptive statistic of fifty AC breakdown voltage values for different oil samples.
| Details | Sample A | Sample B | Sample C | Sample D |
|---|
| Average BDV (kV) | 26.63 | 27.90 | 29.17 | 83.24 |
| Increment (%) | 0 | 4.55 | 9.54 | 212.58 |
| SD (kV) | 5.79209 | 5.13499 | 2.92297 | 1.65383 |
| Minimum | 13.20 | 15.20 | 25.60 | 79.20 |
| Median | 28.25 | 28.60 | 28.30 | 83.10 |
| Maximum | 34.20 | 38.50 | 36.20 | 85.80 |
| Q1 | 21.80 | 24.20 | 27.00 | 82.50 |
| IQ | 9.6 | 8.1 | 4 | 2.1 |
| Q3 | 31.40 | 32.30 | 31.00 | 84.60 |
| Range | 21 | 23.3 | 10.6 | 6.6 |
Table 4.
Probability of 1%, 50% and 90% breakdown voltage values of various oil samples with different treatments.
Table 4.
Probability of 1%, 50% and 90% breakdown voltage values of various oil samples with different treatments.
| Oil Samples | V1% | Increment (%) | V50% | Increment (%) | V90% | Increment (%) |
|---|
| A | 13.19 | 0 | 27.12 | 0 | 33.27 | 0 |
| B | 14.99 | 13.65 | 28.34 | 4.50 | 33.31 | 0.12 |
| C | 18.98 | 43.90 | 29.42 | 8.48 | 33.97 | 2.10 |
| D | 77.91 | 490.67 | 83.52 | 207.96 | 85.17 | 155.99 |
Table 5.
Descriptive statistic of fifteen lightning impulse breakdown voltages values for different oil samples.
Table 5.
Descriptive statistic of fifteen lightning impulse breakdown voltages values for different oil samples.
| Details | Sample A | Sample B | Sample C | Sample D |
|---|
| Average BDV (kV) | 104.48 | 100.78 | 89.75 | 119.27 |
| Increment (%) | 0 | −3.54 | −14.09 | +14.16 |
| SD (kV) | 18.27079 | 21.38632 | 14.20893 | 11.40815 |
| Minimum | 75.46 | 64.96 | 64.03 | 104.18 |
| Median | 108.54 | 98.40 | 89.98 | 121.06 |
| Maximum | 124.53 | 129.14 | 113.25 | 144.87 |
| Q1 | 90.52 | 81.47 | 80.54 | 106.44 |
| IQ | 32.13 | 39.33 | 16.41 | 17.72 |
| Q3 | 122.65 | 120.80 | 96.95 | 124.16 |
| Range | 49.07 | 64.20 | 49.22 | 40.69 |
Table 6.
Probability of 1%, 50% and 90% lightning impulse breakdown voltage values of various oil samples with different treatments.
Table 6.
Probability of 1%, 50% and 90% lightning impulse breakdown voltage values of various oil samples with different treatments.
| Oil Samples | V1% | Increment (%) | V50% | Increment (%) | V90% | Increment (%) |
|---|
| A | 59.12 | 0 | 106.25 | 0 | 125.77 | 0 |
| B | 48.58 | −17.83 | 102.37 | −3.65 | 125.50 | −0.22 |
| C | 50.64 | +1.45 | 91.03 | −14.32 | 107.60 | −14.45 |
| D | 88.42 | +49.56 | 117.91 | +10.97 | 128.15 | +1.89 |

 ,
, 


