1. The Object of the Analysis: The CFM56 Engine
1.1. Aeronautical Propulsion System: The Engine
The latest airliners use turbofan systems because of their high thrust and excellent fuel efficiency. A turbofan engine is technically like a turbojet, but with the big difference in that a large fan is positioned at the engine inlet to supply the right amount of air to the engine. The fan is one of the biggest factors responsible for the lower fuel consumption and therefore for the increase in engine efficiency. Turbofan engines are divided into two categories: turbofans with low bypass and turbofans with high bypass.
1.2. The CFM 56 Engine
The CFM56 series of engines [
1] have been made to power short-, medium-, and long-range commercial and military aircrafts since the first CFM56-1 entered service in 1974. The CFM 56 engine is a high-bypass turbofan engine with two rotating shafts, one high-pressure and one low-pressure, and each is powered by its own turbine section. The fan and booster evolved over the different iterations of the engine, as did the compressor, combustor, and turbine sections. The CFM56-5A series was designed for short- to medium-range flights. The CFM56-5B was the first engine to introduce the advanced technology of double annular combustor (DAC): this upgrade allowed the reduction in the emissions of NOx (oxides of nitrogen) by as much as 45% and achieved significant improvements in fuel consumption, emissions levels, and relative maintenance costs.
1.2.1. The Upgrades of the CFM 56-5B/P Engine Version
The CFM 56-5B/P is designed for use in subsonic aircraft: this type of engine is a dual rotor, high bypass ratio turbofan engine incorporating a dual schedule variable stator high pressure compressor, an air-cooled core engine single stage turbine, a coaxial front fan with advanced aero profile and a four-stage advanced technology high flow booster driven by a four and a half stage low-pressure turbine. The engine can be installed either with a separate or a confluent flow exhaust system. The CFM56-5B/P includes air cooled full authority digital engine control (FADEC) with dual channels.
Table 1 lists the updates introduced in the CFM56-5B/P engine [
1].
1.2.2. The Upgrades of the CFM 56-5B/3 (Tech Insertion) 2007
With this upgrade CFM is introducing some key Tech56 technologies into the CFM56-5B/P and CFM56-5B/2P engine models [
1], adding customer value through lower cost of ownership:
New engine exhaust gas temperature (EGT) margin improved by 5 °C and Specific Fuel Consumption (SFC) by 0.5%.
Reduced HP compressor deterioration equivalent to 10°C EGT margin (increased time on wing).
Improved durability.
Compliance to latest Emissions Standard CAEP/6 (CAEP/4—12% NOx) for Single-Annular Combustor (SAC).
SAC Tech Insertion Flow Path Changes.
- 5.1.
High Pressure Compressor (HPC) Improved Performance Retention Compressor.
Redesigned R1-9 blades to improve HPC efficiency with both new and deteriorated clearances.
- 5.2.
High Pressure Turbine (HPT) Blade.
Low-shock contour with platform to tip chord taper to lower bulk stresses and lower interaction losses between HPT and LPT resulting in reduced fuel burn.
- 5.3.
Improved NOx SAC.
Current SAC combustor with modified dilution and improved cooling profile to reduce NOx emissions and meet CAEP6 for high thrust-5B engines.
SAC Tech Insertion Durability Changes.
- 6.1.
HPC Bushings.
Reduced wear on variable vane stages with improved material couples.
- 6.2.
LPTN1.
Changes to inner and outer bands modified cooling.
- 6.3.
HPT Shroud.
Improved cooling for HPT shroud.
- 6.4.
The 20K Cycle Core LLP.
A 20k cycles ultimate life for all technology insertions with modifications to rotating parts.
2. Aeronautical Engines Maintenance Planning Concepts
Figure 1 shows that maintenance costs represent approximately 20–25% of an airline’s operating expenses, of which 35–40% are engine related (
Figure 2) [
2].
2.1. Engine Shop Maintenance Elements
Engine shop maintenance (
Figure 3) is made up of two main elements:
Performance restoration: inside the performance restoration, the core module is always dismounted and airfoils (rotors and stators) are checked, balanced, and fixed or replaced, as necessary. In such a visit, the service bulletins and airworthiness directives are often annexed.
Life-limited part replacements: parts known as critical life-limited parts (LLPs) are designed to have a limited operating time, in which the probability that damage will occur is very low, at the end of which the parts must be changed and not used again. This replacement constitutes a large part (more than 20%) of the complete cost of maintenance of the engine.
Figure 3 shows in detail the complete cycle of the breakdown of an engine during a shop visit. The most significant costs refer to material cost (60–70% of the total of bill). If LLPs need to be replaced, the cost of material will go up further [
2].
Principally, the largest part of the cost of material is imputable to airfoils—blades and guide vanes. Each vane segments in the turbine modules have a price around USD 10,000, while the cost of turbine blades is estimated around USD 8000 each. A completely shipset for HP Turbine (HPT) blades (it consists of 60–80 blades) could cost USD 400,000–700,000. Thanks to condition-monitoring of engines, many aspects of maintenance management have been improved and developed.
2.2. Engine On-Condition Monitoring
In the past, engines were dismounted and overhauled after a fixed time interval. The principal issue related to this approach is that engines with a good operation score, e.g., a healthy and safe working condition, were serviced ahead of the potential deadline.
The current habit is to perform engine maintenance through continuous life monitoring: as soon as any LLP part reaches its life limit, the engine is put into service.
This may also happen if any of the performance indicators raise a flag, stating that a part of the engine is working outside its control boundaries.
The Workscope Planning Guide (WPG) is a list of technical and maintenance advice which each engine manufacturer provides to the customer: key indicators describing the suggested maintenance schedule of each part, along with up-to-date service bulletins, are available in this manual.
Three layers of workscope are provided by engine manufacturers as shown below:
- (1)
Minimum Level
- (2)
Performance Level
- (3)
Full Overhaul Level.
The main purpose of any WPG is to bring any engine component back to an acceptable level of performance. Also, it recommends best practices concerning each engine rebuild phase, aiming at minimizing long-term engine direct maintenance cost, or cost per flying hour.
Such approaches show some practicality drawbacks as they involve a large variety of components which have specific characteristics and different ageing rates.
2.3. The Engine Workscope Planning
Boundaries defining—and even discouraging—planned engine maintenance often deal with operator’s financial health and business considerations [
2].
Operators running with limited economic resources might decide not to opt for an optimized workscope, as the cost related to this business area might not be considered as a future investment: they would instead choose to scale down the engine build specifications to a lower standard, in order to minimize their liability (
Figure 4).
2.4. Service Bulletins
According to expert maintenance providers, airplane owners can easily follow the compliance requirements and clearly evaluate the benefits (also in term of expenses) related to being compliant.
Despite the non-mandatory nature of the service bulletin, Federal Aviation Regulations (FARs) do generally require that an aircraft and its components follow the manufacturer’s maintenance manual.
3. Typical Performance Parameters
Engine performance parameters are a representative parameter to evaluate medium- to long-term changes in engine state [
3]. Typically, performance data are monitored to detect changes such as blade fouling which occur after many flight cycles. Vibration data, on the other hand, tend to respond to quick changes in the propulsor’s characteristic behavior. This work studies the tendency of performance parameters of development engine from the run-up to an event. A comparison is made with engine’s vibration monitoring.
3.1. Speed
N1-speed is the fan-calculated speed in rpm and is usually represented like a percentage of design RPM. Rapidly fluctuating N1 can be related to the engine stalling, whereas as low N1-speed can be a sign of a flameout. N1-speed is also one the most useful parameters for measuring an engine’s thrust. Instead, the N2-speed (or N3-speed in case of the three spool engine version) represented the rotation of the high or intermediate pressure compressor and is also expressed as a percentage of its design RPM.
3.2. Exhaust Gas Temperature (EGT)
Exhaust gas temperature (EGT), indicated in degrees Celsius, identifies the temperature that we can see exhaust side and is used to measure an engine’s capacity to achieve the designed thrust. The higher the EGT is, the heavier the propulsor’s wear and deterioration will be. A high value of EGT could be an indication of the degraded performance of the engine. An excess in EGT limits could lead to instant engine part damages or/and a significant life reduction of elements of the engine. It becomes immediately clear that it is convenient to maintain the EGT at a level as low as possible for as long as possible.
3.3. EGT Margin
Typically, during the phase of take-off, the EGT reaches its maximum value, or just after lift-off. The gap between the maximum permissible EGT (line in red) and the EGT peak value during the phase of takeoff is nominated as the “EGT Margin”. This margin is influenced by changes in the outside air temperature (OAT).
3.4. Vibrations
The vibrations of an engine are caused by a center of gravity that does not falls on the axis of rotation [
4]. In this mode, the center of gravity is under centrifuge solicitation, which produces the vibratory phenomenon. The vibrations are detected by a pick-up, this sensor is collocated in the radial direction, so it can perceive the radial component of vibrations (in terms of accelerations or speeds). The radial component of a uniform circular motion is a harmonic motion, so the component detected by pick-up will have a sinusoidal pattern. The acceleration that is detected by the pick-up on the on-board systems is integrated in half period and is shown on the indicator as a value of the speed peak (IPS). The limits of vibrations are expressed in MILS (inch/1000) but on the on-board systems they are expressed in IPS (inch/sec) or UNIT (IPS × 2).
3.5. Data Record
All engines assembled on aircrafts, from when they are turned on until they are turned off, transmit the engine monitoring data to the original equipment manufacturer (OEM). In accordance with the type of the engine and according to the OEM, these data are recorded more or less frequently within a flight cycle.
The aircraft’s cycle is made up by the composition of these phases: 1) Parked, 2) Taxi, 3) Takeoff and Departure, 4) Climb, 5) Cruise, 6) Descent, 7) Approach, 8) Landing and Taxi to gate. All the sensors on the aircraft are in continuous operation but only in phases 3, 4, 5 are the detected records sent to the OEM.
With the use of graphs, we can then make important considerations and/or we can see if there are anomalies.
Among the records collected by the manufacturer of the engine, it was possible to find the alert shown in
Figure 5. The graph shows high fan vibrations of engine 1 on aircraft I-EJGB (Airbus A330-200) in the date 05-02-2016.
All the values are inserted into the manufacturer’s neural network and then they are inserted into the alerts tab. According to the type of parameter and its variation, the neural network generates a specific error code, also considering its magnitude. The manufacturer then sends the alert to the flight operator to warn him and the customer notification report (CNR), in which, based on the OEM’s experience and data analysis, possible causes and solutions of the fault are suggested.
Another important and artificial intelligence function is the fault prediction, as the same data that are recorded by sensors to notify any faults are then graphed and, with the use of exponential smoothing (ES), the OEM and the operator can analyze the trend.
The purpose of ES is to eliminate random fluctuations and preserve the established structure of the time series. The ES method is useful if you must update hundreds or thousands of data—in a short time—when a new record is added. Such data, drawn consecutively, show a trend that may indicate whether the engine is approaching to a fault. With the use of the relevant alert database, General Electric (GE) notifies the operator of the risk of an impending fault and suggests the applicable corrective actions that may fix the observed problem.
4. Analytic Considerations on Airplanes Maintenance
The efficiency of the aircraft and all its parts must be controlled to maintain maximum safety. Modern maintenance is geared towards the prevention of failures, with studies and methodologies to improve the effectiveness of technical operations, with two application models [
5]:
- -
Maintenance (scheduled);
- -
Maintenance “on condition”.
The performance tests of the main on-board systems are repetitively and meticulously performed with the aid of test benches, able to highlight each minimum decay. These procedures are performed by certified operators, which at the conclusion of the work must complete the documentation and sign it. An example is the case of the flight controls or other special systems that, in addition to the regular tests, also undergo double additional controls, delegated to different people.
The basic parameter that determines the performance of the work consists of the accumulated flight hours or cycles. Each component or accessory is marked with a serial number that identifies it and allows its location not only during the use phase, but also during the storage permanence.
The life-cycle maintenance never stops because each caution is put in place to prevent disturbances to the phenomena of application phase of airplanes. The global use, in terms of human resources, is very high; the ratio of use of the aircraft hours and labor dedicated to it has a ratio of 1:20—that is to say, for each hour of flight, 20 hours of maintenance activities are needed.
An element or component of the aircraft is considered "significant" in terms of maintenance if it meets at least one of the following issues:
- -
The failure can have a negative effect on safety, both in flight and on the ground;
- -
The failure cannot be detected by the crew or by technicians during the inspection of aircraft operations;
- -
The onset of failure can have a significant economic/operational impact.
The drawbacks are identified and for each element a process is conducted with assumptions of potential failures of the component or of the plane. The analysis follows a logical path for any damage and its impact. The aim is to arrive at a judgment on the need and type of maintenance immediate action. First, the structural significant items (SSIs), whose failure can affect the structural integrity of the aircraft and, consequently, its safety, are identified. SSIs are attributed to categories according to the causes that favor the occurrence of failure, such as:
- -
Fatigue damage;
- -
Environmental degradation;
- -
Accidental damage.
The last phase of the analysis cycle regarding the timing of maintenance processes can be deduced from:
- -
Recommendations of the manufacturer;
- -
Experience gained directly from operator;
- -
Experience of other operators.
The continuous monitoring of the operating conditions and efficiency of the aircraft, its structure, its systems, components and the maintenance tasks is an essential condition for maintaining high reliability standards and aims to safeguard the value of the asset and to ensure their optimal use in satisfactory conditions and continuous efficiency, safety and operation and is mainly implemented in two modes.
4.1. Preventive, Programmable—Scheduled Maintenance
To prevent any unwanted faults or unplanned activity, tidy and organized preventive maintenance is the key for improving equipment life: the mis-organization of the activities will certainly lead to higher maintenance expenses and higher failure probability.
Except for life-limited parts called out by Airworthiness Directives (ADs), life limits are generally introduced by a Note on the Type Certificate, pointing to Chapter 5 of the applicable engine manual. The Type Certificate contains either specific reference to part numbers that must be replaced at a specific time, or refer us to a document that contains such information. Within the Type Certificate Data Sheet, all the criteria to define which parts are "life limited" for your aircraft are contained. The Regulation defines boundary conditions for describing the actual status of life limited components.
To estimate the actual status of LLCs, the following features are considered:
- -
LLC type;
- -
LLC part number;
- -
LLC life limits;
- -
LLC residual life.
From the graph in
Figure 6, it is immediately highlighted that from 2011 to date, the time interval of the first shop visits for LLP passes from a value of 15,000 to 20,000 cycles.
Inside the flight cycle, the take-off phase is the one where more stress loads the engine, because it is carried out at the level of maximum thrust, and the degradation speed of the engine itself how and other trends are heavily dependent on the type of engine.
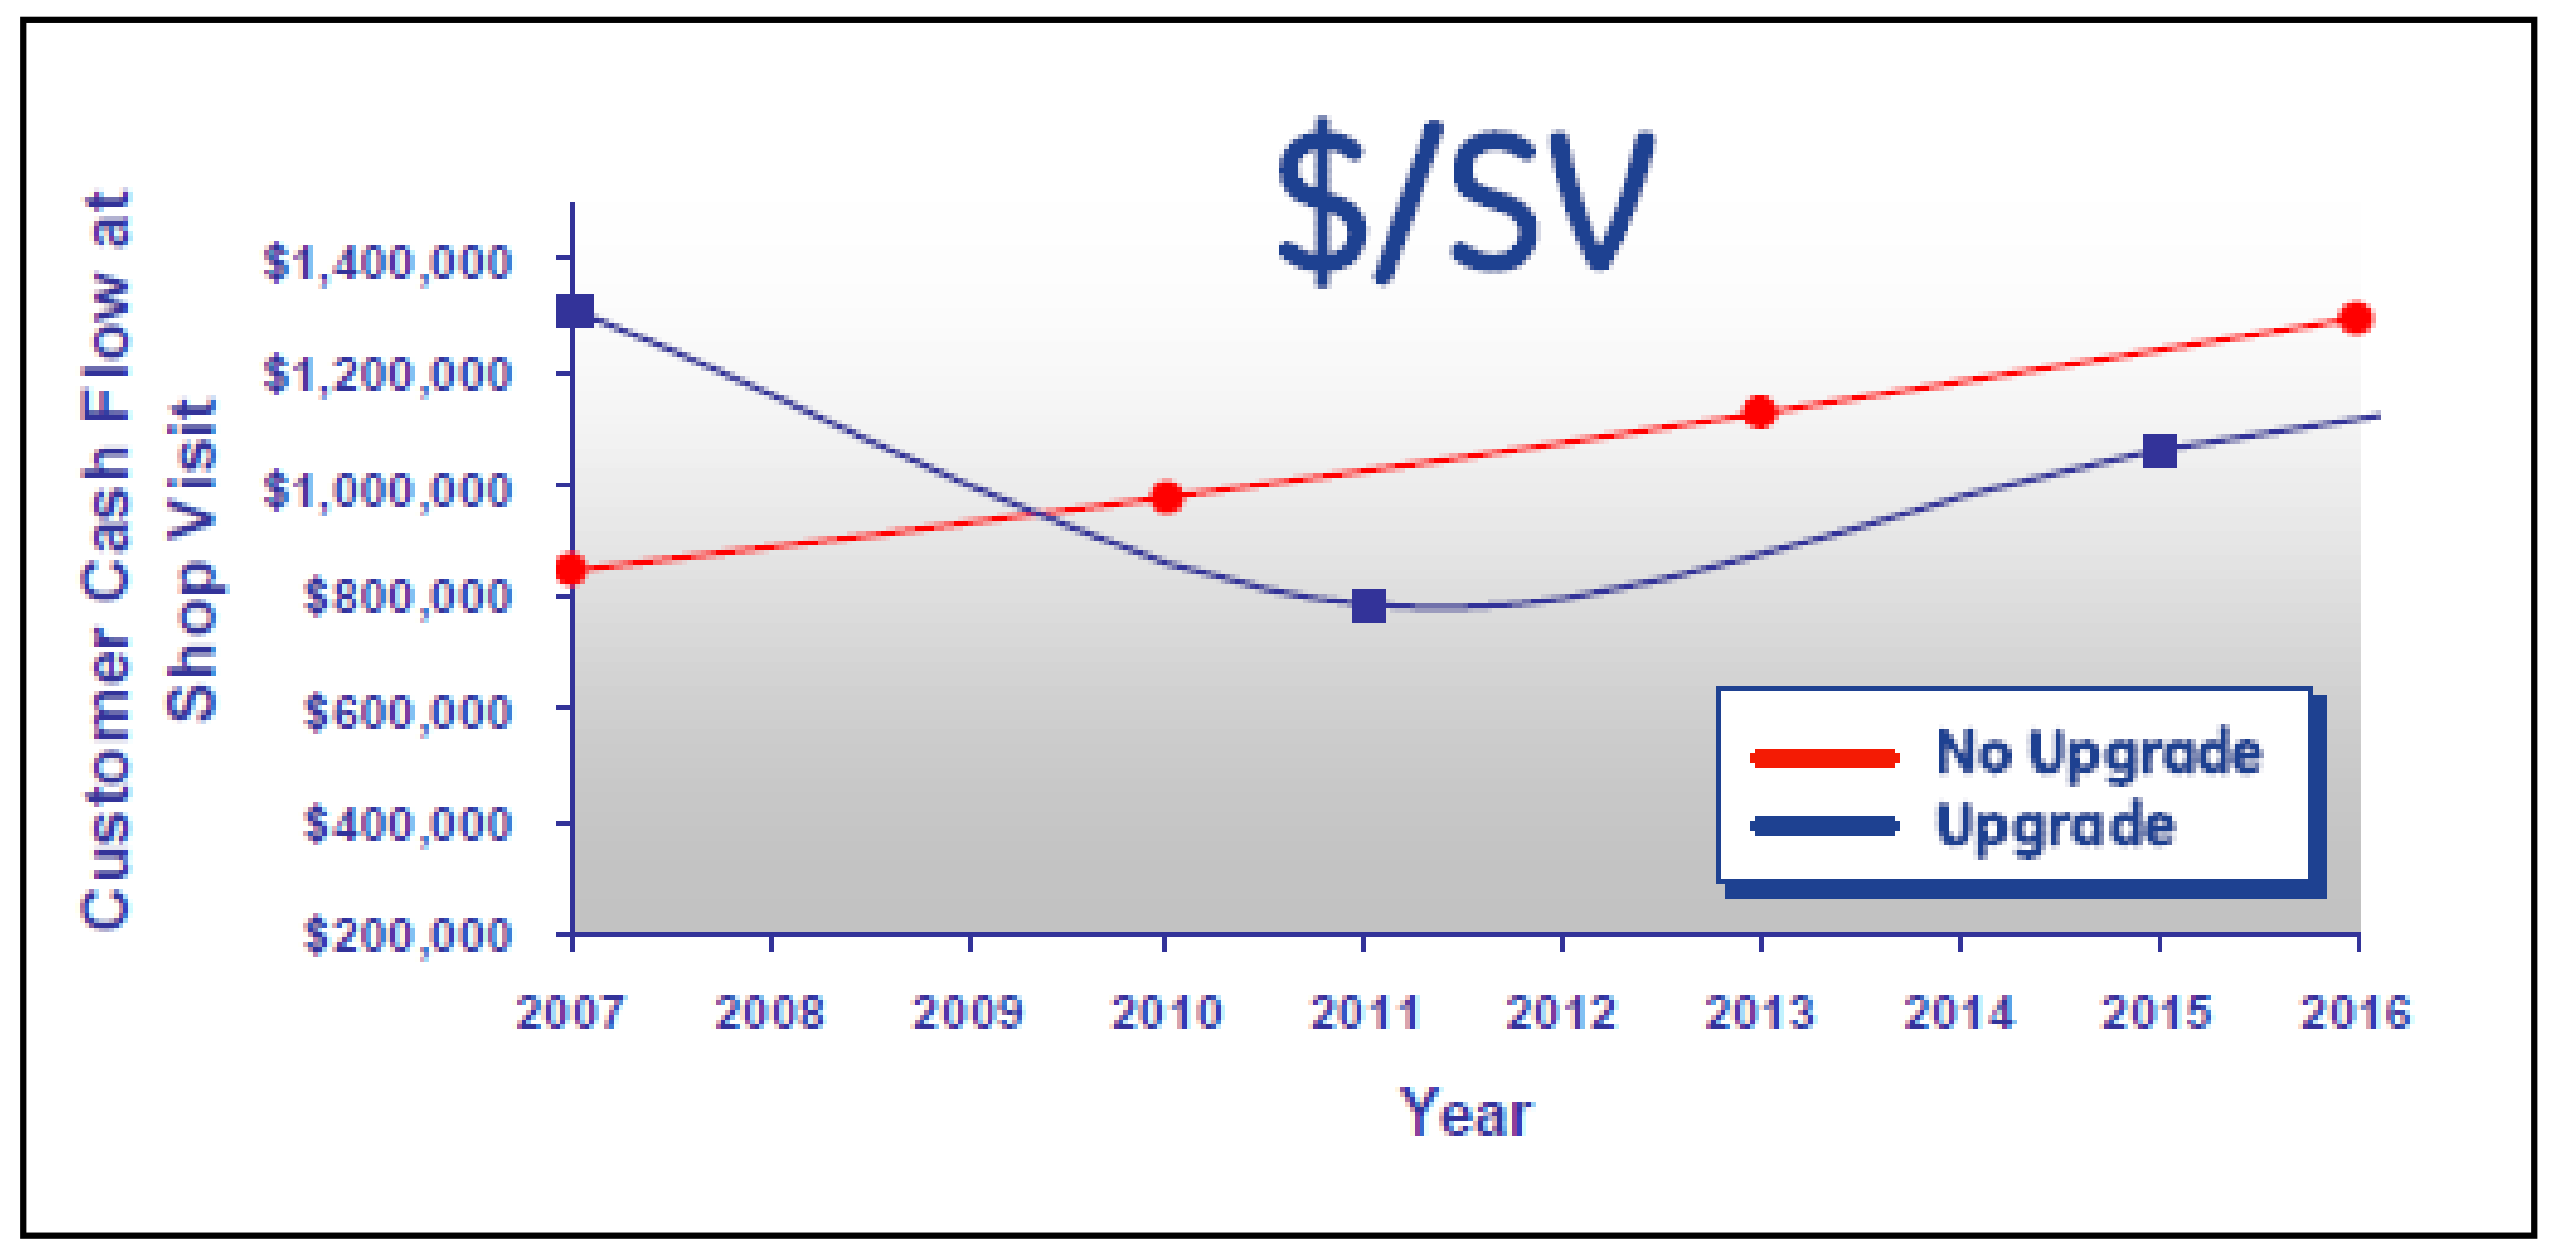
It is very interesting to compare the performance of the deterioration of the margin of the three upgrades with the advance of the fleet of motors at the Alitalia with the data supplied by the manufacturer (
Figure 7).
Note how for the first 5000 cycles, the upgrade /3 has a performance very close to that of /P. Cfm highlights from its graph a big jump in performance with its latest upgrade.
4.2. Reactive, Corrective—Unscheduled Maintenance
Ensuring the airworthiness of its fleet is indispensable, because an airline can thus operate in the civil and commercial transport sector. This implies a full compliance with the regulations, which guarantee the operation of the company in safety conditions. Such security, however, is not always possible to guarantee it in absolute terms, because of unforeseeable causes that disrupt safety.
Whenever an engine is landed by the plane and sent to a shop visit, it is issued with the engine removal report, in which there is salient information about the engine, on the motivations of the landing, the documentation to be considered for restoring the performance and all the operations necessary to do so. Over the years, each airline has created its own related unscheduled damage database of records that have occurred during the life of their engines. From analysis of these data, we have highlighted the main causes of removal that have occurred over the years for our type of engines and extracted all data, showing clearly which are the most frequent ones (
Figure 8).
On the abscissa axis, we can read the top three causes of removal that represent 15% of total causes but more than 70% of total removals. For this reason, the study was focused on these three causes that showed a higher frequency: 1) HPC damages; 2) HPT blades cracked; 3) EGT margin.
4.2.1. HPC Damages
Many factors reduce compressor lifespan margin [
6]. The list below gives some examples:
- -
Ingestion of foreign objects, as well as sand and dirt;
- -
Complete loss of surge capacity because of a bird strike: a bird or debris, passing through the compressor, can cause a blockage and airfoil damage;
- -
When the reverse thrust is used during low forward speed phase or landing, re-ingestion of hot turbulent air could occur;
The stall of symmetrical axial compressor is easily identifiable; some types of events may involve:
- -
an increase in exhaust gas temperature;
- -
an increase in rotor speed (due to reduced work on the stalled compressor);
- -
In the case of multi-engine aircraft, they may lead to having to handle unplanned yaws.
4.2.2. HPT Blades Cracked
The gas turbine is one of the most demanding environments: components like turbine blades must perform safely and efficiently in such harsh operating conditions. Some of these most critical conditions, such as high temperatures and mechanical and vibrational stress, may lead to a destructive failure, thus implying the complete loss of the turbine [
6].
Turbine blades are then designed to withstand such a hazardous environment. As turbine stages potentially run at speeds in the range of tens of thousands of revolutions per minute (rpm), blades have to work facing high levels of both centrifugal force and fluid forces: the usual failures that might occur include, for example, yielding, creeping or fractures.
In addition, the first stage, e.g., the section just downstream the combustor, of a modern turbine operates at 2000 °F (about 1370 °C), whereas earlier systems used to run at a drastically lower temperature range, typically 1500 °F (about 820 °C).
Exposure at such high temperatures for a long time would weaken the blades, making them fragile and at risk of creep or corrosion failures.
A key limiting factor in early jet engines was the available materials’ performance for the hot section (combustor and turbine) of the engine. Research has focused on exploiting novel manufacturing techniques and new, stronger alloys to make high-performance materials available: this effort has resulted in a wide variety of new materials and methods suitable for manufacturing high-performance turbine blades. Considering constant pressure, thermal efficiency increases as the maximum temperature increases: on the other hand, high temperatures might damage the engine as the blades withstand a certain centrifugal stress, thus weakening the materials, so turbine blade cooling is highly recommended.
4.2.3. EGT Margin
The EGT margin for the control of the efficiency of engine performance is obtained by comparing the measured takeoff EGT and EGT value of the red line (set by the manufacturer on the simulation of full thrust applied in the external temperature conditions “flat rate” [
7]. With the progress made in recent years in the field of maintenance, from the introduction of the service bulletin to a general increase in the efficiency of engines (they are approved by a much higher margin now), it is no longer required to disembark for zeroing the engine margin. Over time, the damage to unscheduled events were reduced by over 50% (
Figure 9).
4.2.4. Distribution Unscheduled Damages
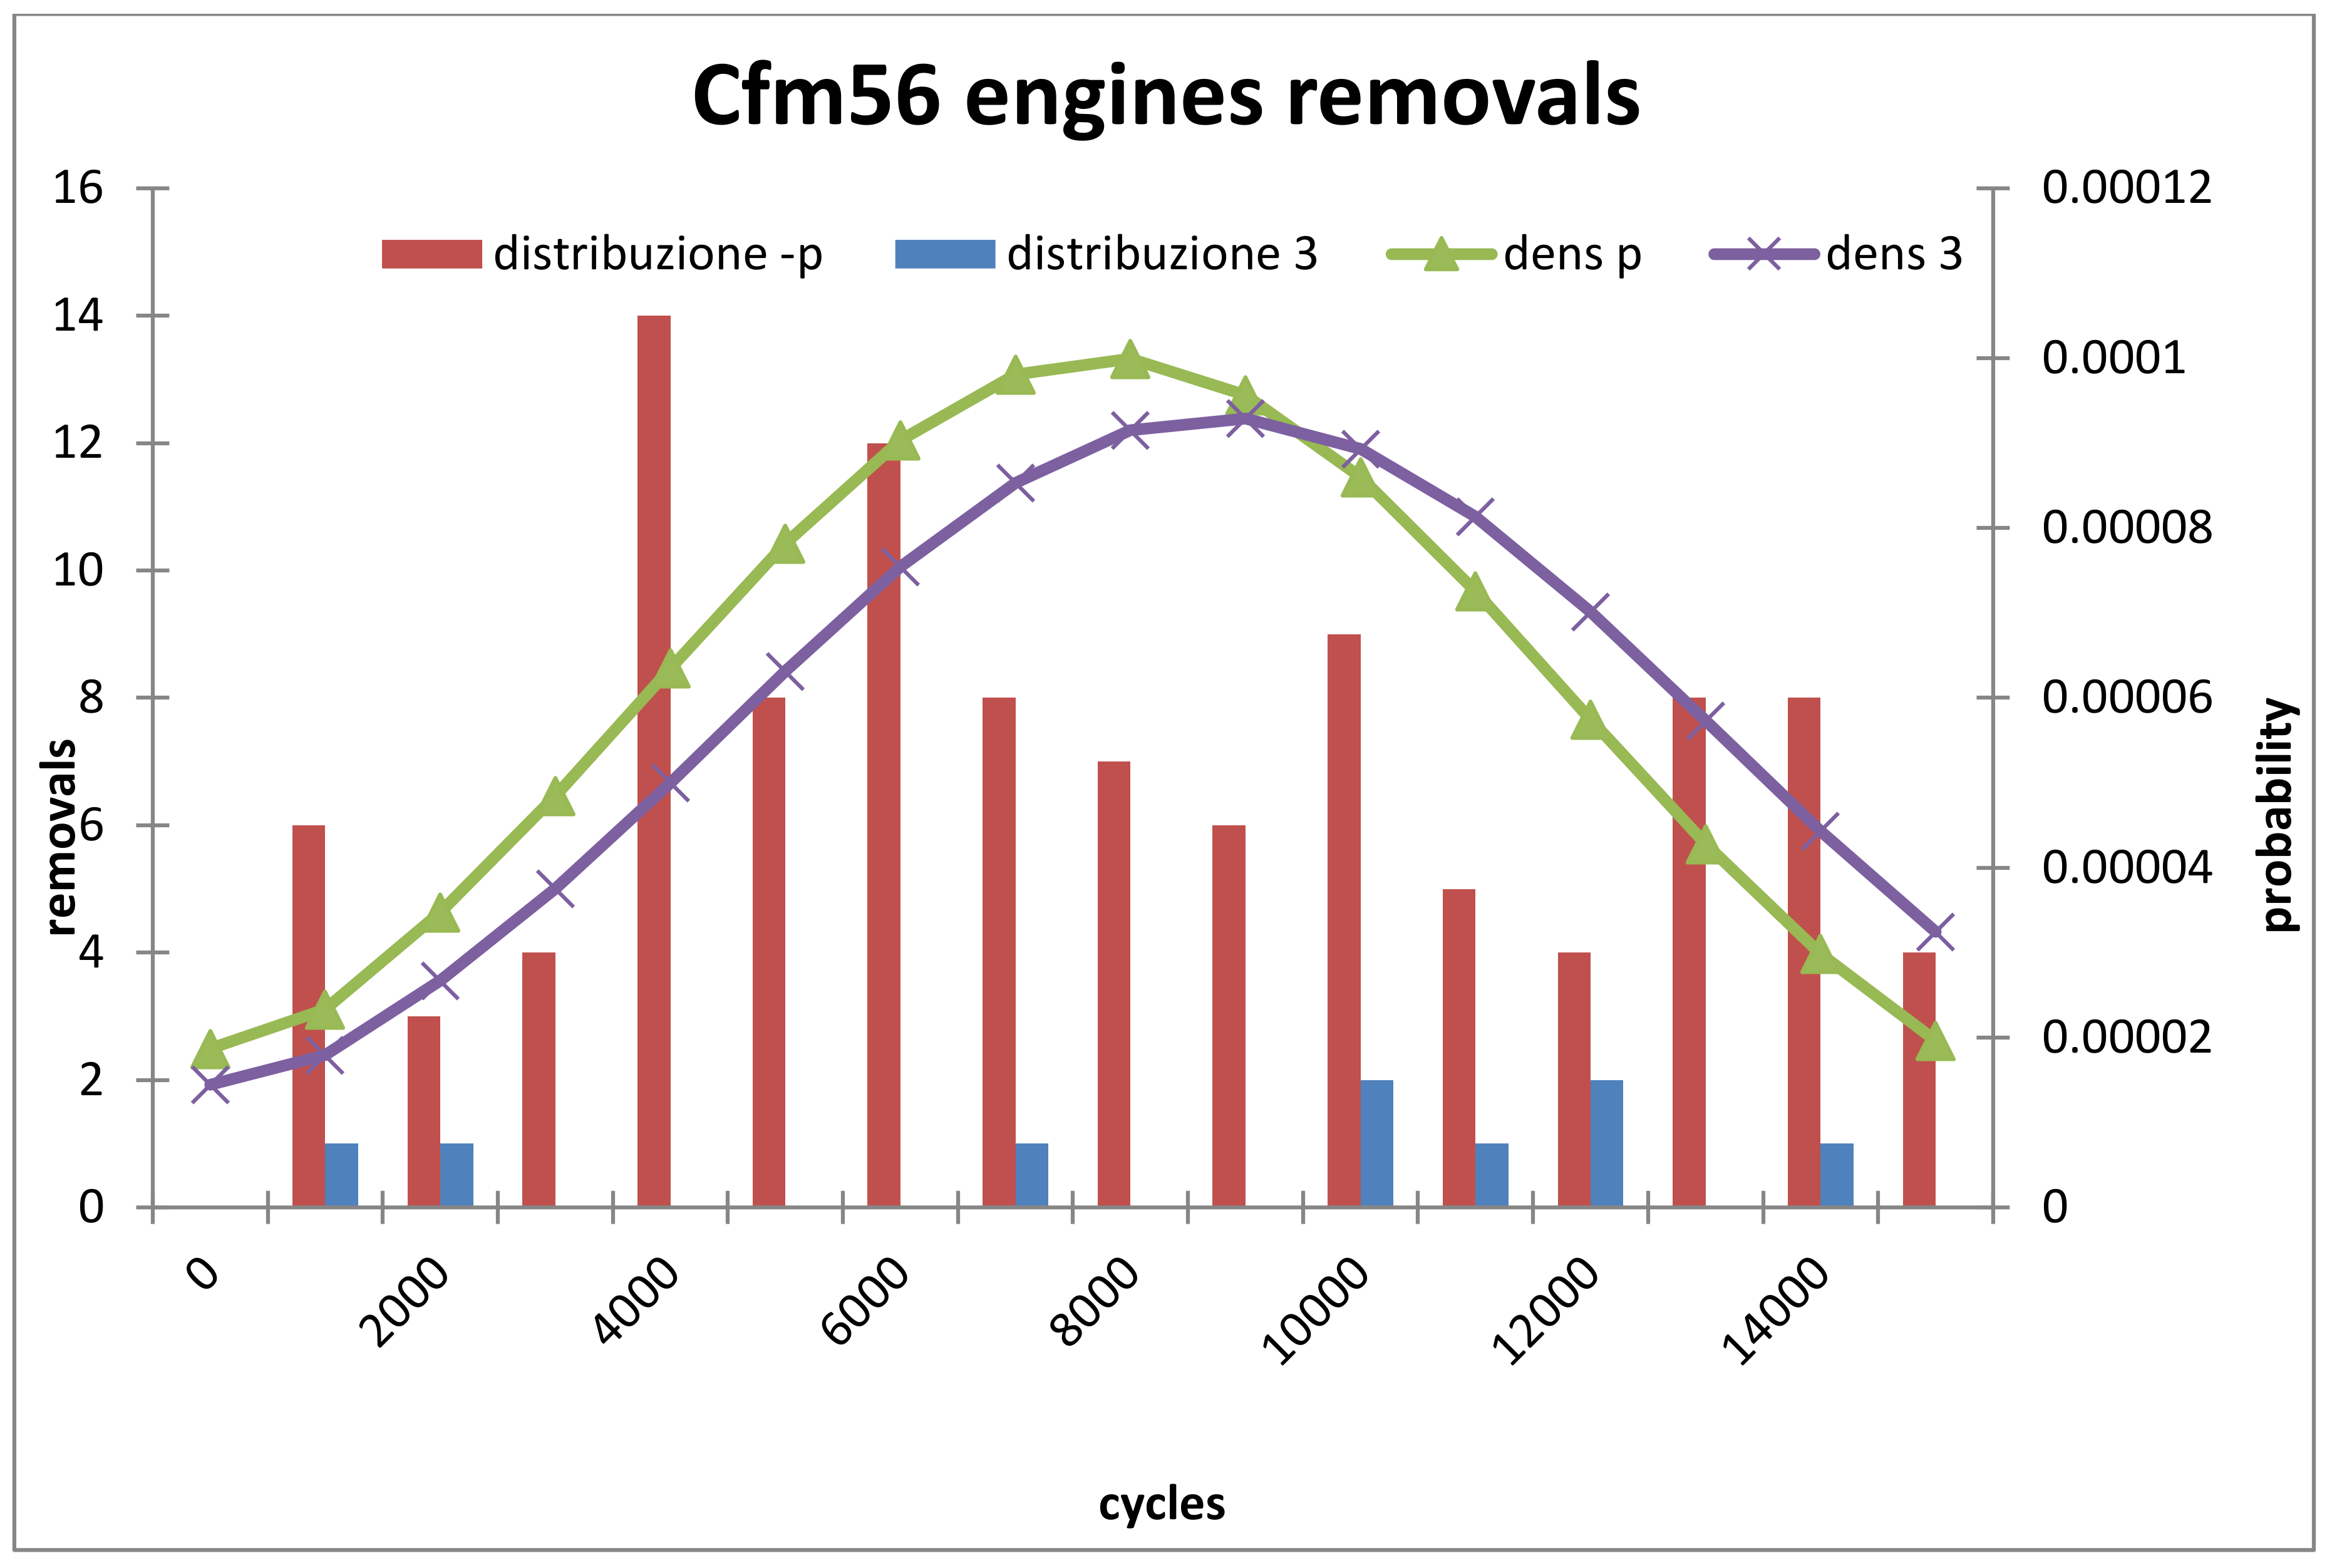
Using the same data derived from engine removal reports (
Figure 10), another analysis was also conducted, highlighting the distribution in time (calculated in cycles) of unscheduled damages to the three types of upgrades related to Cfm engines. The 3PIP, as a very recent upgrade, has been excluded from this discussion because since it joined the fleet, there was only one engine which required unscheduled removal.
In
Figure 11, the distribution of such data shows that for the types of upgrades here considered (in red and in blue the number of the removals of the two upgrades), the average distributions (in green and in purple for the two upgrades considered) have shifted towards a number of major cycles with the latest upgrades.
5. Managements Costs
5.1. General Concepts
Reducing costs by effectively managing engine fleets is a key aspect for any airliner [
8]. Keeping the fleet ready to use is a key aspect, as it recovers a large business portion in the highly competitive commercial airline segment. On average, 10% to 15% of an airliner’s costs are intended for fleet maintenance.
Engine predictive and preventive maintenance tasks are based on limited life factors such as high temperature and speed operation, component wear and tear, deterioration etc., which have an impact on any engine component. Also, external factors such as the ingestion of foreign bodies and non-orthodox flight profile operations have an impact on the overall estimation of residual life, thus also affecting maintenance planning schedules.
In addition, any maintenance task has to comply with the following paradigms:
- -
Off-wing predictive maintenance: mainly regarding the replacement of limited-life components and engine refurbishment
- -
On-wing preventive maintenance: focusing on engine real-time monitoring
Maintenance, repair and overhaul (MRO) activities are expensive and should be abolished: data analytics have become widely requested for efficient engine fleet management. The portion of the costs related to the management of these engines was analyzed.
This research addresses three key elements of the total operating cost of an airline. Each of these elements has a direct impact on engine operating cost and reliability:
- -
Engine maintenance cost (MC) can be viewed as a result of the product of shop visit rate and shop visit cost. Usually, 20% of all engine shop visit are not planned. This type of unplanned shop visit can be used as one measurement of engine reliability.
- -
Aircraft indirect operating cost (A/C IOC): almost half of the total IOC is the result of engine operating discrepancies, such as in-flight shut down and other discrepancies that cause delays and cancellations.
- -
Fleet fuel consumption (FC): changes result primarily from engine performance degradation (engine deterioration) and aircraft performance retention (aircraft rigging/trimming).
5.2. Power by Hour (PBH) Concepts
The conditions for paying a fixed maintenance material cost (MMC) or MC per engine flight hour varies with each contract [
9]. Ideally, when an operator is on a PBH contract, the probability of engine-related events (operational discrepancies) could be reduced by minimizing the mean time between shop visits. However, when lower MTBSVs are intentionally achieved under a PBH contract, the owner of the engine may end up with a higher maintenance material cost per engine flight hour (MMC/EFH). Therefore, both parties would need to work together to decide on the best time to remove engine (
Figure 12). Keeping the engine too long may result in higher cost to the operator if the engine is removed due to an event. It may also result in higher cost to the owner of the engine due to possible higher hot section MMC/EFH.
Optimizing engine time on-wing can be accomplished by optimizing the return-on-investment (ROI). An optimum ROI can be achieved by optimizing the key cost drives. Common cost drivers of direct and indirect EMC include:
- -
Engine and/or Fleet Reliability;
- -
Engine hot section durability;
- -
Engine on-wing performance;
- -
Engine test cell performance;
- -
Aircraft fuel consumption;
- -
Engine maintenance material cost per engine flight hour (MMC/EFH);
- -
Engine shop visit rate.
5.3. Costs for Shop Visit
Maintenance cost is monitored by the operators based on two different criteria [
9]:
The company to which here we refer works under a PBH contract. Because the contractual terms are sensitive, it cannot be published, but the conclusions are here reported. The cost of a shop visit is similar for each upgrade. Operator’s and manufacturer policies are to replace, during shop visits, damaged parts with new ones of the last compatible upgrade: with time, the engine changes and evolves. This because the pieces, indifferently by upgrade, have the same price and same labor time, and it is convenient to install the last upgrade’s pieces.
There is only one important difference in terms of the cost of a shop visit. With the release of the various service bulletins, the pieces of the engine are improved, particularly the HPT blades. The HPT for the /P was life limited, but that of /3 was not life limited. This change results, in terms of cost, in a decrease of USD 300,000 for each shop visit.
5.4. Fleet Fuel Consumption
The first aircraft were built using simple engines that were already used on cars. Today, aircraft are among the most complicated and sophisticated objects that man has ever built; in fact, the most advanced techniques in the world are used for their construction and design. Technical progress has led to the construction of increasingly efficient and fuel-efficient aircraft [
9].
The turbofans mainly evolved thanks to the introduction of two concepts: the second low-pressure turbine and a large fan mounted in front of the compressor. The correct flow of air necessary to the motor is guaranteed by the fan placed at the entrance of the motor.
Part of the flow passes through the various stages of the compressor and then reaches the combustion chamber. Another part of this flow instead passes through a bypass and goes directly to the exhaust line. The ratio between the flow entering the combustion chamber and the one passing through the bypass is called the bypass ratio.
The best way to reduce fuel consumption is to increase the bypass ratio. A high bypass ratio value means less air passing through the combustion chamber and therefore less fuel consumption.
Furthermore, a high bypass ratio considerably reduces noise pollution. This is possible because the cold air surrounding the discharge nozzle decreases the Db value of the sound produced.
The first commercial aircraft with a high bypass ratio had values around 5:1. Today, it is very common to find aircraft with bypass ratio engines of 11:1.
Moreover, the new engines can easily reach 115,000 pounds of thrust, a higher value that the thrust generated by the sum of four engines from the 1960s, consuming less and reducing emissions and noise.
The analysis was conducted on the study of fuel consumption using the AGS (Alliance Ground Surveillance NATO program) data (
Table 2 and
Figure 13).
In agreement with these data, a series of calculations for the Alitalia fleet are summarized in
Table 3,
Table 4 and
Table 5.
6. Conclusions
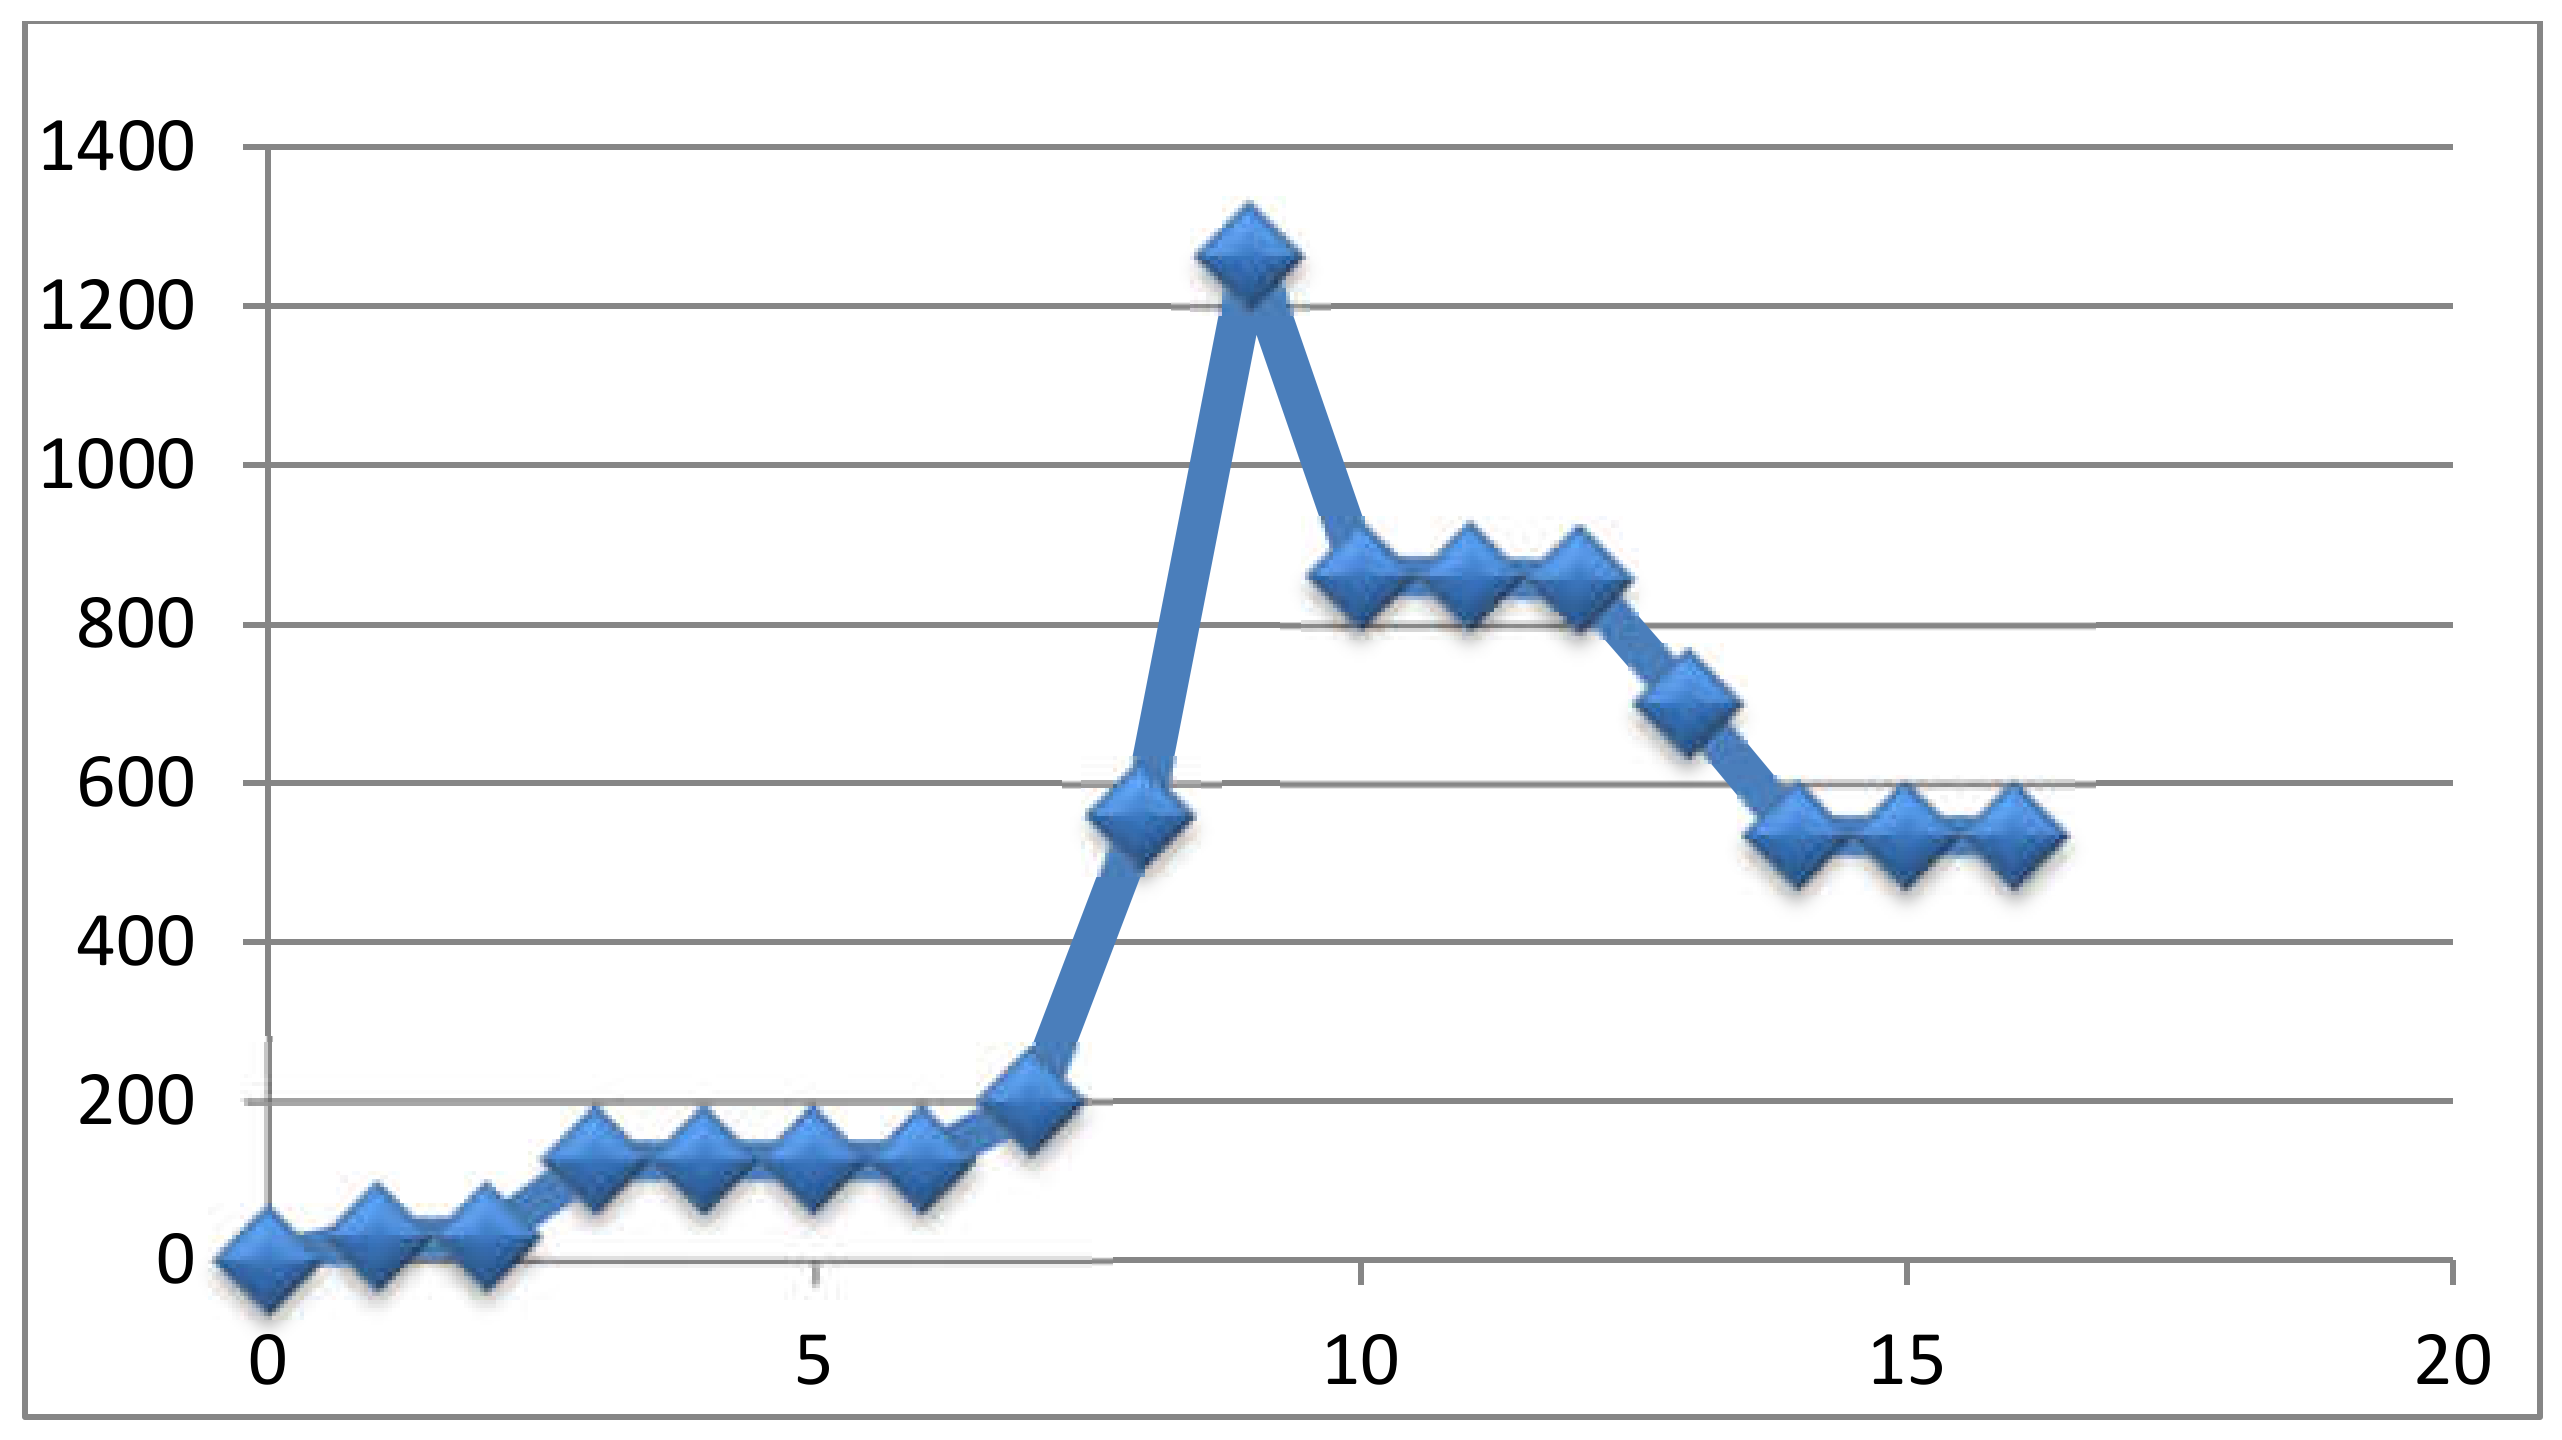
In this paper, the economic impact of the upgrades of a specific engine was analyzed within the operation of an airliner. Corrective maintenance was analyzed, paying attention to the unscheduled removals. These removals, with the new upgrades, with the introduction of new service bulletins, and with a better method of monitoring and more background, are decreased and the major causes of damages have been reduced significantly and, in some cases, even eliminated. We can see that the HPC damage is still on because the main cause is the FOD.
Overall, we can say that engines have improved their reliability and therefore also the fleet. Also, from the graph in
Figure 13, the trend of the two distributions shows us that the distribution of the unscheduled damages has moved to a higher number of cycles: another sign of increased reliability.
From this graph, we can make another consideration; if the reliability of engines is increased, then we can reform the management of spares, reducing them with less cost. Preventive maintenance data have been processed to assess how much the parts with limited lifespan (LLP), in particular HPT blades, achieved an increase in terms of useful life.
Translated in terms of costs, this means a further saving of 7.5% of total cost for each shop visit.
It was highlighted that the time to first shop visits, due to expiring LLP, has increased from 15,000 cycles (year 2011) to 20,000 cycles (year 2015), as shown in
Figure 6.
This was a direct consequence of the general improvement in maintenance.
The limit of 20,000 cycles on the first shop visit is a limit that the operator cannot increase due to a legal constraint on LLP parts. The limit of LLP must be respected, otherwise the aeronautical authorities withdraw the airworthiness certificate of the aircraft from the company.
The trend of EGT margin was also analyzed of the three upgrades during the first 5000 cycles.
The first consideration about that trend is the shape. For each motor, the trend is the same, even if the start values are different. The analysis also shows that the curves of the trends that the manufacturer provided are same as ours. A big improvement is made with the upgrades. This study also shows the trend towards a decrease in EGT margin is not a function of the thrust of the engine.
Regarding the fuel consumption, the part number /3 give us a saving in the order of 2.5% in comparison to the previous configuration, while the /3PIP provide a further saving of 0.5%.
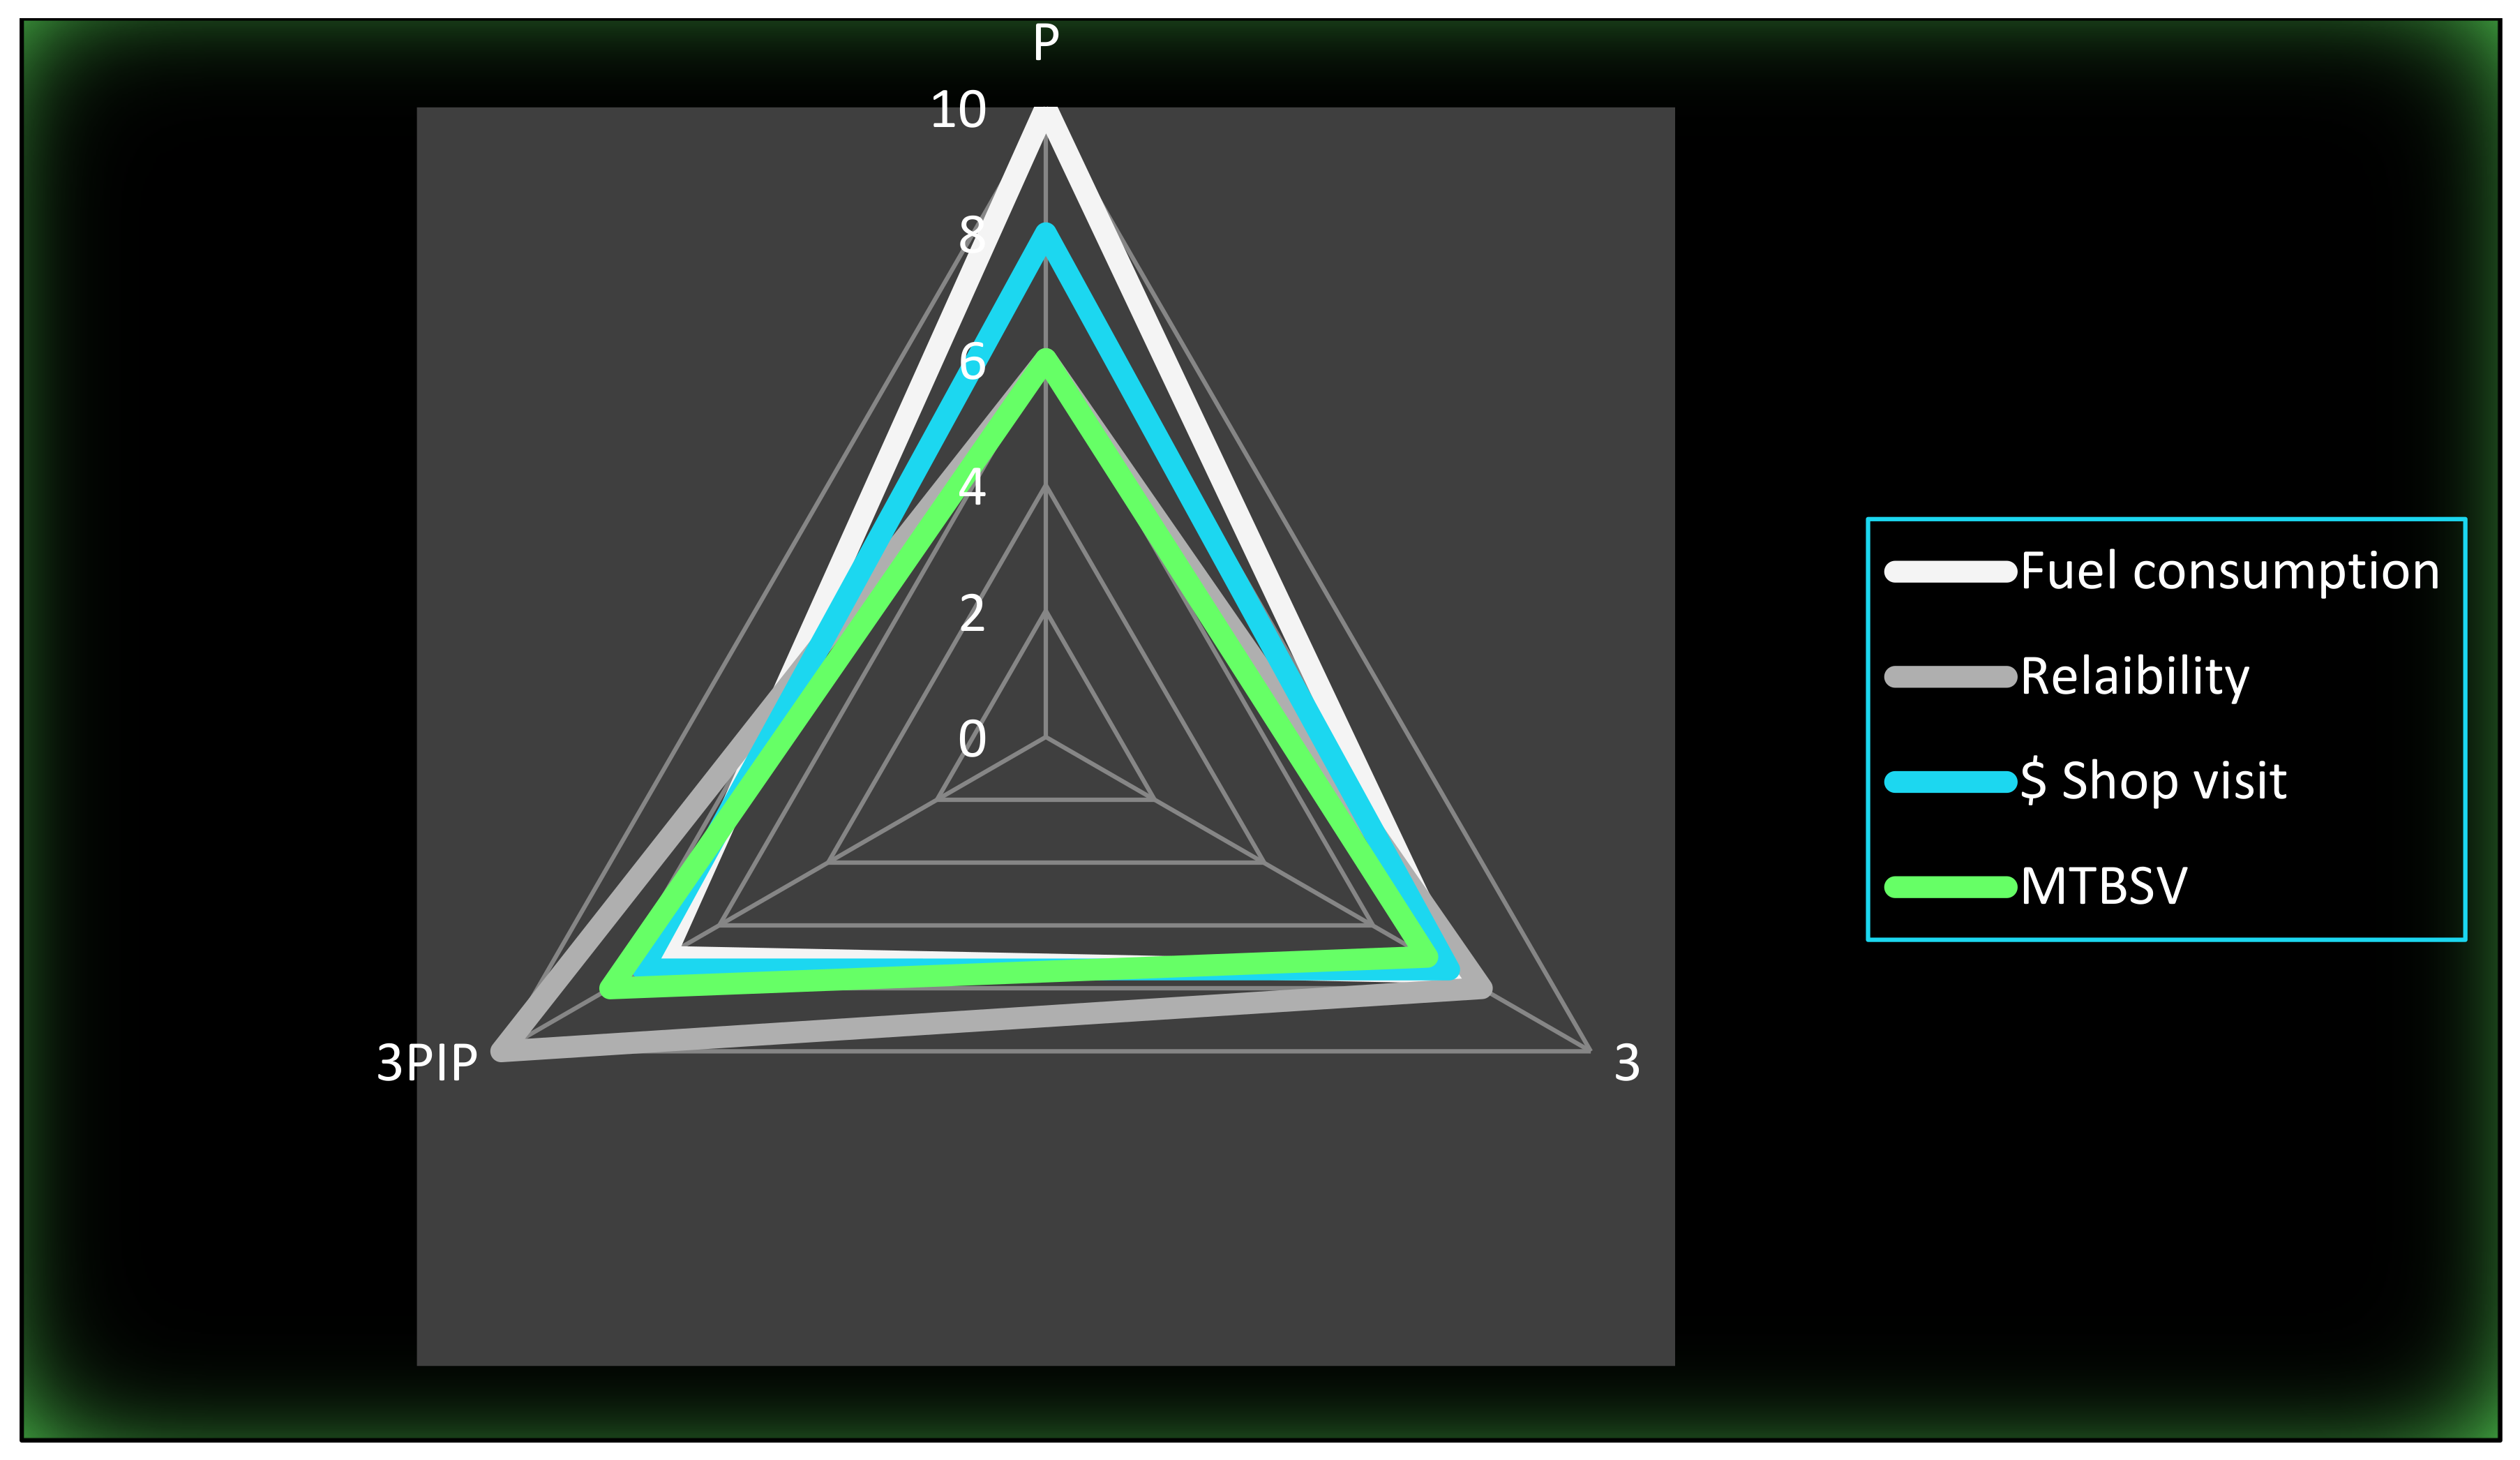
The graph below (
Figure 14) synthesizes all improvements in each field.


