Article

Adjacent Markets Influence Over Electricity Trading—Iberian Benchmark Study

1
Department of Electrical and Computer Engineering, INESC-ID, Instituto Superior Técnico-IST, Universidade de Lisboa, 1049-001 Lisbon, Portugal
2
GECAD—Research Group on Intelligent Engineering and Computing for Advanced Innovation and Development of the Polytechnic of Porto (ISEP/IPP), Rua Dr. António Bernardino de Almeida, 431, 4200-072 Porto, Portugal
*
Author to whom correspondence should be addressed.
Energies 2020, 13(11), 2808; https://doi.org/10.3390/en13112808
Submission received: 23 April 2020 / Revised: 22 May 2020 / Accepted: 26 May 2020 / Published: 1 June 2020
(This article belongs to the Section F: Electrical Engineering)

Abstract

:
This paper presents a study on the impact of adjacent markets on the electricity market, realizing the advantages of acting in several different markets. The increased use of renewable primary sources to generate electricity and new usages of electricity such as electric mobility are contributing to a better and more rational way of living. The investment in renewable technologies for the distributed generation has been creating new opportunities for owners of such technologies. Besides the selling of electricity and related services (ancillary services) in energy markets, players can participate and negotiate in other markets, such as the carbon/CO2 market, the guarantees of origin market, or provide district heating services selling of steam and hot water among others. These market mechanisms are related to the energy market, originating a wide market strategy improving the benefits of using distributed generators. This paper describes several adjacent markets and how do they complement the electricity market. The paper also shows how the simulation of electricity and adjacent markets can be performed, using an electricity market simulator, and demonstrates, based on market simulations using real data from the Iberian market, that the participation in various complementary markets can enable power producers to obtain extra profits that are essential to cover the production costs and facilities maintenance. The findings of this paper enhance the advantages for investment on energy production based renewable sources and more efficient technologies of energy conversion.

1. Introduction

Nowadays, electricity is one of the most import energy sources in developed countries. This tendency will increase in the future with the introduction of new electricity usages as well as with the need to reduce the greenhouse gas (GHG) emissions in the global economy. To achieve this goal, it is important to reduce the use of technologies based on fossil fuels reducing the emissions of carbon dioxide (CO2), methane, nitrous oxide and sulfur [1].
To increase the use of renewables it is important to promote the engagement of all society on this initiative. To empower the consumers, several initiatives have been undertaken such as the increase of efficient consumption, the development of demand-side programs or the renewable or citizen energy communities. It is also important to continue investing in the development of renewable technologies [2,3].
Distributed generation (DG), mainly wind and photovoltaic, are becoming very competitive when compared with fossil-fuel technologies. However, it is important to create direct and indirect incentives to increase even more the penetration of these technologies [4,5]. An interesting option for the DG owners is to participate in other markets besides the energy market. These markets, called adjacent markets in the present paper, can be the Carbon Market, the Guarantees of Origin certificates, or the selling of water steam and hot water (district heating), among others [6,7]. The opportunities are not limited to these markets. Other examples are the integration with industries such as livestock, the treatment of municipal solid waste (MSW), or cork, to significantly reduce investment and/or operation costs [8,9].
This paper presents a study on the adjacent and complementary markets to the energy market. Understanding the advantages and drawbacks of acting in several markets simultaneously allows the gathering of relevant information for good management of possible investments to be performed in different sectors, directly or indirectly related to energy production. The main goals of this paper are, therefore: (i) describing the structures and functions of several adjacent markets and how do they complement the electricity market; (ii) showing how the simulation of electricity and adjacent markets can be performed, using the Multi-Agent System for Competitive Electricity Markets electricity market (MASCEM) simulator [10,11]; and (iii) demonstrating the importance of investing in parallel markets, such as the Guarantees of Origin Market and the Carbon Market, rather than acting exclusively in a single market. The findings of this paper aim at enhancing the bet on energy production through renewable sources and more efficient technologies of energy conversion.
This paper presents a study on the adjacent and complementary markets to the energy market. Understanding the advantages and drawbacks of acting in several markets simultaneously allows the gathering of relevant information for good management of possible investments to be performed in different sectors, directly or indirectly related to energy production. The main goals of this paper are, therefore: (i) describing the structures and functions of several adjacent markets and how do they complement the electricity market; (ii) showing how the simulation of electricity and adjacent markets can be performed, using the Multi-Agent System for Competitive Electricity Markets electricity market (MASCEM) simulator [10,11]; and (iii) demonstrating the importance of investing in parallel markets, such as the guarantees of origin market and the carbon market, rather than acting exclusively in a single market. The findings of this paper aim at enhancing the bet on energy production through renewable sources and more efficient technologies of energy conversion.
Following a brief description of the guarantees of origin, the carbon market and the hot water and steam market in Section 2, Section 3 present an overview on the MASCEM simulator [10,11], that is used to assess the impact of parallel markets investment. Based on the constraints and opportunities offered by the several adjacent markets, approached in Section 2, some strategies are presented, to analyze how the investment in such parallel markets can reduce costs, therefore increasing the profits of a renewable energy producer. Section 4 presents the proposed strategies, and tests and validates them using the MASCEM simulator to perform realistic market simulations, using real data from energy markets. Finally, Section 5 presents the most relevant conclusions from the undertaken studies.

2. Adjacent Markets

This section presents a description of the most important aspects concerning the guarantees of origin market, the carbon market and the steam and hot water markets.

2.1. Guarantees of Origin Market

The European Union (EU)’s awareness of the need to promote electric energy production from renewable sources, to reduce the GHG emissions, and also due to the countless advantages that come from this type of energy sources. According to [12], the emissions from covered sectors will be 21% lower than in 2005. This value is higher than the established target of 20%. Nevertheless, this value is far of the target defined by the 2030 climate and energy framework that intends to achieve 43% reduction. Moreover, the European Commission is working in the definition of the goals to 2050 with the focus to achieve the carbon neutrality [13].
As most of these energy sources are still economically disadvantageous, not being able to compete with the conventional technologies under the paradigm of the conventional market, it becomes obligatory to promote electric energy produced from renewable energy sources. For that purpose, several economic and fiscal instruments have emerged, and in that scope, the Green Certificates Market arose. At the beginning of the 2010 decade, the Green Certificates Market changed to become the Guarantees of Origin market. However, in some works such as [7,14], the authors continue talking about green certificates. Figure 1 shows the general concept beyond the Guarantees of Origin Market [14].
The electrical energy production from renewable sources generates two distinct products, the electrical energy itself, and a set of environmental and social benefits taking the form of Guarantees of Origin certificates, which can be traded in a specific market, representing an additional source of revenue, other than the selling of the electrical energy. This way, renewable energy sources used to generate electricity (RES-E) producers can receive income from two independent markets, the electrical and the guarantees of origin certificates.
For each MWh of produced electrical energy, one guarantee of origin certificate is attributed to RES-E producer, which is used as proof of RES-E production, and that can be traded in the market. When Guarantees of Origin was bought, as documentation for the electricity delivered or consumed, the Guarantees of Origin are cancelled in the electronic certificate registry. Using this methodology, it is possible to track ownership ensuring that the certificates are sold only one-time avoiding duplication of certificates. Contracts offering “green” energy with Guarantee of Origin are becoming normal in the portfolio of retailers.
According to the Directive 2001/77/CE of European Commission, green certificates can be attributed to producers of solar energy, wind power, solar energy, wave & tidal energy, geothermal energy, biomass (biodegradable fraction), and the energy from mini-hydro. Figure 2 shows that the guarantees of origin certificates demand is determined by the number of certificates that are necessary to cover the RES-E quota, and that green certificates supply is determined by the cost of each RES-E technology. The intersection of the demand with the supply is defined as the marginal cost of RES-E production that satisfies the demand. The marginal price of green certificates is given by the difference between the marginal cost of production and the electricity market price.
Until point A of Figure 2, producers are not able to participate in the Guarantees of Origin market, for they can compete with the regular electrical energy producers, as their production cost is lower than the electric energy market. From point A on, RES-E producers present production costs that are higher than the electrical energy market price, therefore, an additional value is required to guarantees that the operation is profitable. That additional value is given by the guarantees of origin certificates.
The European Energy Certificate System (EECS) defines a certificate as “an electronic document which identifies the source and method of production of a unit of energy and relates to a specific purpose – such as energy source disclosure or compliance with an obligation.” [16]. Association of Issuing Bodies (AIB) is an international organization that comprises all the entities that are qualified to issue green certificates. Twenty-seven European countries are members of the AIB. According to [17], in 2018, 500 TWh of electricity from renewable sources, has been actively claimed by consumers within guarantees of origin from renewable sources.
As presented in Figure 3, the number of green certificates that were issued is higher than the redeemed ones. The electrical energy producer that benefits from the green certificates’ attribution will have the opportunity to commercialize them in the appropriate market.
The success of this market depends on the level of certificates demand. A positive index means a high level of green certificates redeemed, which bring an extra profit for the entities that are betting on a more efficient and renewable energy source. The level of redeemed certificates in Europe is currently located in only 48% of the issued ones [16].
A highly demanded guarantees of origin market can prove to be a good opportunity for the companies that are registered in the system to increase their profits and bet on the renewable energy production systems improvement. It is a bonus for being “environmentally friendly”. According to [17], the maximum price of Guarantees of Origin trading (EUR 1.0–2.5 for standard qualities) was achieved in 2018. The increase of prices and the increasing sensibilization of consumers to the use of “green energy” increased the interest in this market.

2.2. Carbon Emissions Market

The carbon market has acquired a truly unique growth potential [18,19]. European Commission intends to achieve the carbon neutrality until 2050. This challenge also represents a business opportunity for many GHG emitting companies, because by reducing their emissions, they can sell on the market the remaining allowances they were attributed. EU has created the “European Union’s Emission Trading Scheme” (EU-ETS), directed exclusively to companies, and has already traded over 3.5 billion Euros and 594 million tons of CO2 since it was institutionalized.
This market mechanism can help the industries reducing their CO2 emissions and contributing to the Paris Agreement. However, and despite the effort to reduce GHG emissions, and the bet on renewable power sources and more efficient forms of energy conversion, there has been an increase in the emissions level, which is higher than the expected. Hence, the potential for CO2 emission credits trading is high. If the market allowances offer is high, its price decreases, increasing the demand. EU accommodates authorities responsible for supervising the emissions from each company, to guarantees that there are no more license attributions than the necessary.
According to information from the European Environment Agency (EEA) [20], the projection scenarios reported by the EU Member States up until June 2018 under EU legislation, EU ETS stationary emissions are projected to continue decreasing, with existing measures in place, by 8.7% between 2015 and 2020, and by a further 6.4% between 2020 and 2030.
The GHG reduction allows not only to improve environmental conditions, but it can also be regarded as an economic incentive for companies betting on more efficient and less GHG emitting sources of energy production. A business entity that presents an emission reduction that places its level below the assigned value can proceed with the sale of their exceeding allowances to entities that require more certificates. The emission allowances sale is done through an auction procedure, regarding no free allowances to the national electricity sector.
The license trading is divided into two stages: the free allocation that encompasses all areas; and the auction of emissions, that is only applicable to all the sectors that are free from carbon leakage risk, including the electricity sector (see Figure 4). Carbon leakage risk sectors are subject to the international competition taking advantage of the status of economic disadvantage (inability to pass-through the CO2 costs) and relocated to countries not subject to CO2 reduction targets. Carbon Credits or Certified Emission Reductions (CERs) are certificates that are issued when a reduction of the emission of GHGs is verified. By standard, a tonne of CO2 corresponds to one carbon credit. This credit can be traded in the international market. Reducing emissions of other gases that contribute to the greenhouse effect can also be converted into carbon credits, using the concept of Carbon Equivalent.
As presented in Figure 5, the production of energy from various sources is associated to a certain amount of CO2 emissions per kWh of energy produced.

2.3. Hot Water and Steam Market

The production of steam and hot water is responsible for a large amount of energy consumption in industry and buildings. Primary energy sources are necessary to obtain steam and/or hot water, which allow obtaining it through specific processes, such as the ones undertaken by the cogeneration plants. With the increased quality of life, it became essential to use steam and/or hot water in the most simple and diverse processes of our day-by-day. From this point of view, the market for steam has a very high potential to progress, mainly in countries with high heating requirements.
Cogeneration (also combined heat and power, CHP) is the process that allows obtaining both thermal energy and mechanical energy (usually converted into electricity). To obtain this type of energy a source of fuel (biomass, fuel oil, natural gas, propane gas, industrial and municipal waste, etc.) is required. The heat generated by this type of energy conversion systems can be used directly in the industrial process, restored, and converted for use in space heating and water heating.
The CHP plant may be situated in a strategic point, for example near a factory of tires production, requiring huge amounts of steam, so the plant in addition to being able to sell the steam can inject the power that it produces into the transmission network.
Cogeneration plants have a higher efficiency than conventional power production plants. The efficiency is more than 80%, while in the most efficient conventional plants it rounds 50% to 60% [22]. Figure 6 shows a general comparison of CHP and normal processes efficiency.
The final cost of steam and/or hot water from the cogeneration plants will depend on the type of fuel used by boilers of the plant and the technology used. If another fuel is used, e.g. fuel oil, auxiliary systems are needed to produce energy [24].
The use of natural gas is a good energy option for the supply of industrial boilers (existing or new) due to the economic advantages (lower cost per energy unit) and also the technological advantages of natural gas. Compared with the fuel oil, the use of natural gas allows obtaining an overall efficiency of an industrial boiler (average real income observed in normal operation) superior in around 3% to 6%.

3. MASCEM—A Multi-Agent Electricity Market Simulator

To study electricity markets operation, MASCEM simulator will be used. It is constantly evolving, increasing its amplitude in terms of ability to simulate different scenarios, considering as many different market models and player types as possible [10,11]. MASCEM can be used for different purposes such short/medium term decision-support and simulation tool or to long-term decision support tool to be used, for example, by regulators. The use of MASCEM will provide to the users a competitive advantage in market participation.
MASCEM intends to contribute to the decrease in the cost of electricity through intelligent participation in the markets. For that, this system takes advantage of several market structure models that exist. The electricity market is typically organized in a pool and bilateral contracts negotiation [25,26].
A Pool is a marketplace where producers, traders and aggregators can submit production bids and consumer and retailers companies submit consumption bids originating the market price. The pool is regulated and managed by a Market Operator. Market Operator should use a tool or platform to determine the market-clearing process in each period, defining the market price and the accepted production and consumption bids [27]. One of the examples of market-clearing tool for Pools is the auction mechanism. Other option to negotiate energy, are the Bilateral Contracts. In this type of negotiation, agreements between two traders are established independently of the market. However, a technical validation considering all the results of the pool and the bilateral contracts should be realized.
To achieve its goals of contributing to an intelligent competition within decentralized electricity markets, it is needed to gain insights into the ways that competition occurs. MASCEM implements the referred negotiation mechanisms, through the modelling of market players considering their characteristics and offering strategic behaviour. The agents, simulated in MASCEM, can integrate several algorithms based on optimization, machine learning, game theory or scenarios analysis to influence the offering strategy [28,29]. Unlike other simulation tools, MASCEM integrates several decision options considering different objective functions. These objectives are different according to the players profiles and the adjacent markets that can participate. As each agent implemented in MASCEM represents independent entities, each one can define its decision rules and goals.
Several entities are involved in the market and bilateral negotiations. All of these entities and their relationship can be modelled and represented in the multi-agent simulator. MASCEM multi-agent model includes a Market Facilitator Agent, Seller Agents, Buyer Agents, Virtual Power Player (VPP) agents, a Market Operator Agent and a System Operator Agent [10].
The Market Facilitator is the coordinator of the market. To participate in the market, each agent should be registered at the Market Facilitator, specifying its market role and services. So, the Market Facilitator has information about all agents. With this information, the Market Facilitator can regulate and manage the negotiation process assuring that the market is working according to the defined rules. Figure 7 presents the MASCEM global structure, considering the most important agent roles and their information exchange.
The agents representing the Sellers and Buyers two key players in the multi-agent platform. Sellers agents represent entities with the role of sell electricity or other type of services and products in the market. Buyers agents represent electricity consumers or aggregation of consumers such as fleet operators or energy communities. The user can specify the number of sellers and buyers and their characteristics and strategies. Sellers and buyers will compete in the market trying to optimize their benefits. This means to maximize the incomes for sellers and to minimize the outcomes for buyers always satisfying their energy needs.
In bilateral negotiations, sellers and buyers can cooperate to establish some agreements to reduce the risk associated with the market negotiation. Taking this assumption in mind, it is possible to think that energy markets are a very rich domain where it is possible to propose and test algorithms and negotiation mechanisms for both cooperation and competition [31]. VPPs are a special kind of players that represent coalitions of smaller players and negotiate for them in the market. They also require internal negotiations, with the members of the coalition, or applicants to join the aggregation [10].
The System Operator Agent is responsible for analysing the technical feasibility of every established contract considering the network characteristics and defined operation points. For that, all the transactions, either through Bilateral Contracts or through the Pool, must be validated by Transmission System Operator and in some cases, by Distribution System Operator. The Market Operator Agent is responsible for the Pool mechanism. This agent is not necessary for bilateral negotiations since the sellers and buyers negotiate directly. In the Pool, the Market Operator is responsible to receive and validate all the offers from Sellers and Buyers. The Market Operator Agent is also responsible for the determination of the market-clearing price (MCP).
The simulation capabilities of MASCEM allow studying different aspects of the electricity market. Section 4 of this paper presents some simulations performed using the MSCEM simulator, as the basis for an adequate study of the influence of the complementary markets approached in the previous sections.

4. Case Study

This section aims to test the influence of the participation of a producer in several complementary energy markets, rather than acting exclusively in the electricity market. Several strategies are tested in MASCEM simulator using real energy markets’ data for the definition of the scenarios, to guarantee the realism and validity of the presented tests and results. Each seller and buyer can adopt a different strategy to profit of different market opportunities. To optimise their strategies, the agents implemented in MASCEM use the AlBidS tool presented in [28]. This tool disposes of a set of methods to optimise the agent’s strategies according to their characteristics and previous results.
The following proposed strategies are directed to the behaviour of one only seller and were tested through simulations based on the study values presented in [10].
This simulation involves 6 buyers and 5 sellers: 3 “normal” sellers and 2 VPPs. VPP 1 aggregates 3 wind farms; VPP 2 aggregates 4 producers (1 photovoltaic, 1 wind farm, 1 CHP and 1 mini-hydro). The data used in this case study has been based on real data from the Iberian market (https://www.omie.es/). Each agent’s behaviour on the electricity market is based on a different strategy (see Table 1).

4.1. Strategy 1: Participation in the Guarantees of Origin Market

The previous study regarding Guarantees of Origin raises a relevant question. Does the sale of Guarantees of Origin certificates contribute to the achievement of considerable monetary value, able to compensate for a strategic decrease in the required price for the electricity market?
Since the subject agent, Seller 2 represents a producer of energy from renewable energy sources (mini-hydro, a wind farm or even a solar plant), an installed capacity of 100 MW will be considered. This value is fixed for all periods of the day to facilitate the comparison and exhibition of the results. To quantify the revenue obtained by the redemption of allowances allocated to each producer that entered the market of Guarantees of Origin, it was necessary to use a benchmark of EU countries, represented in 
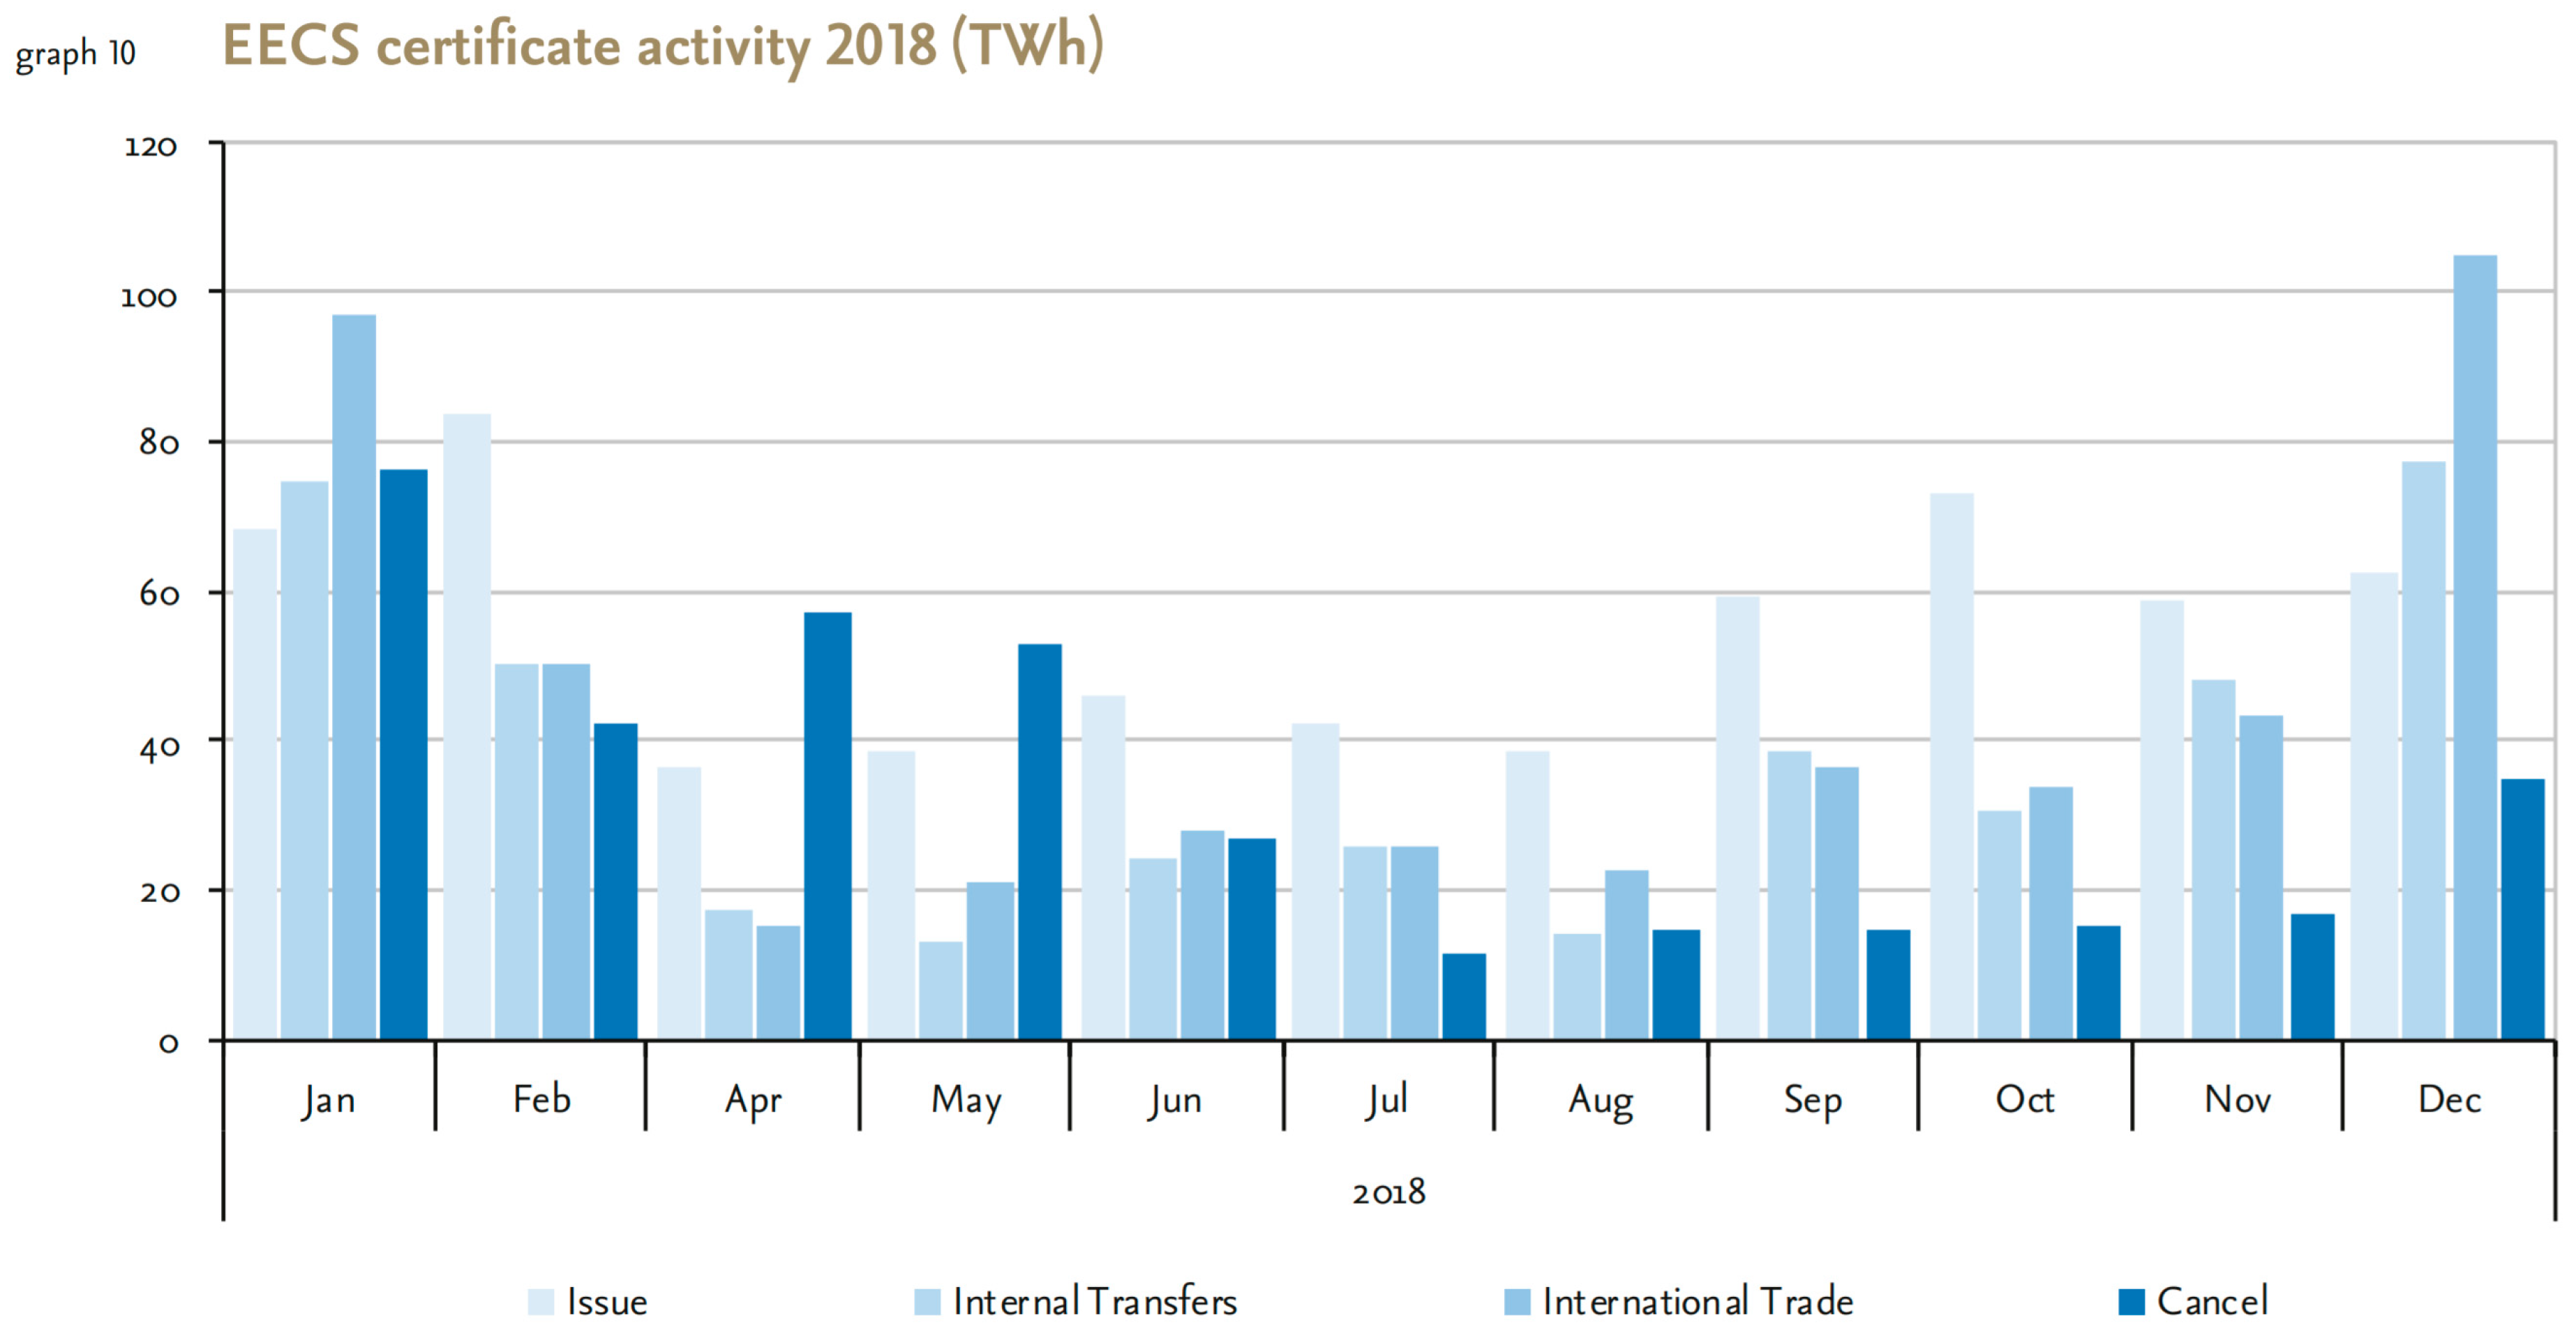
Figure 3 of this paper. This figure indicates 48.82% of redeemed certificates from the total of issued certificates. Given the reference values in Portugal, presented in Table 1, which set the base values to pay for each certificate issued and redeemed, we get a reference value for the sale of such certificates: 4.8165 c€/MWh, obtained by multiplying the issue price of 10 c€/MWh by 48.82%. For each kWh produced from renewable energy sources, the observed gain in the Guarantees of Origin certificates market corresponds to 0.0048165 c€, a much lower value than the gains obtained by acting on the carbon market.
This strategy consists in presenting the bids for the electricity market, as the value obtained by subtracting the value gained by the sale of guarantees of origin certificates to the initial price proposed by Seller 2. To test this strategy, we present two simulations undertaken using MASCEM. In the first simulation are considered the values obtained from MIBEL, where Seller 2 original bid prices were kept constant, and the supply of energy production is set at 100 MWh. The second simulation considers the same scenario, however, this time Seller 2 bid prices are defined by the strategy mentioned before: subtracting the income from the participation in the Guarantees of Origin certificates market to the original bid price. 
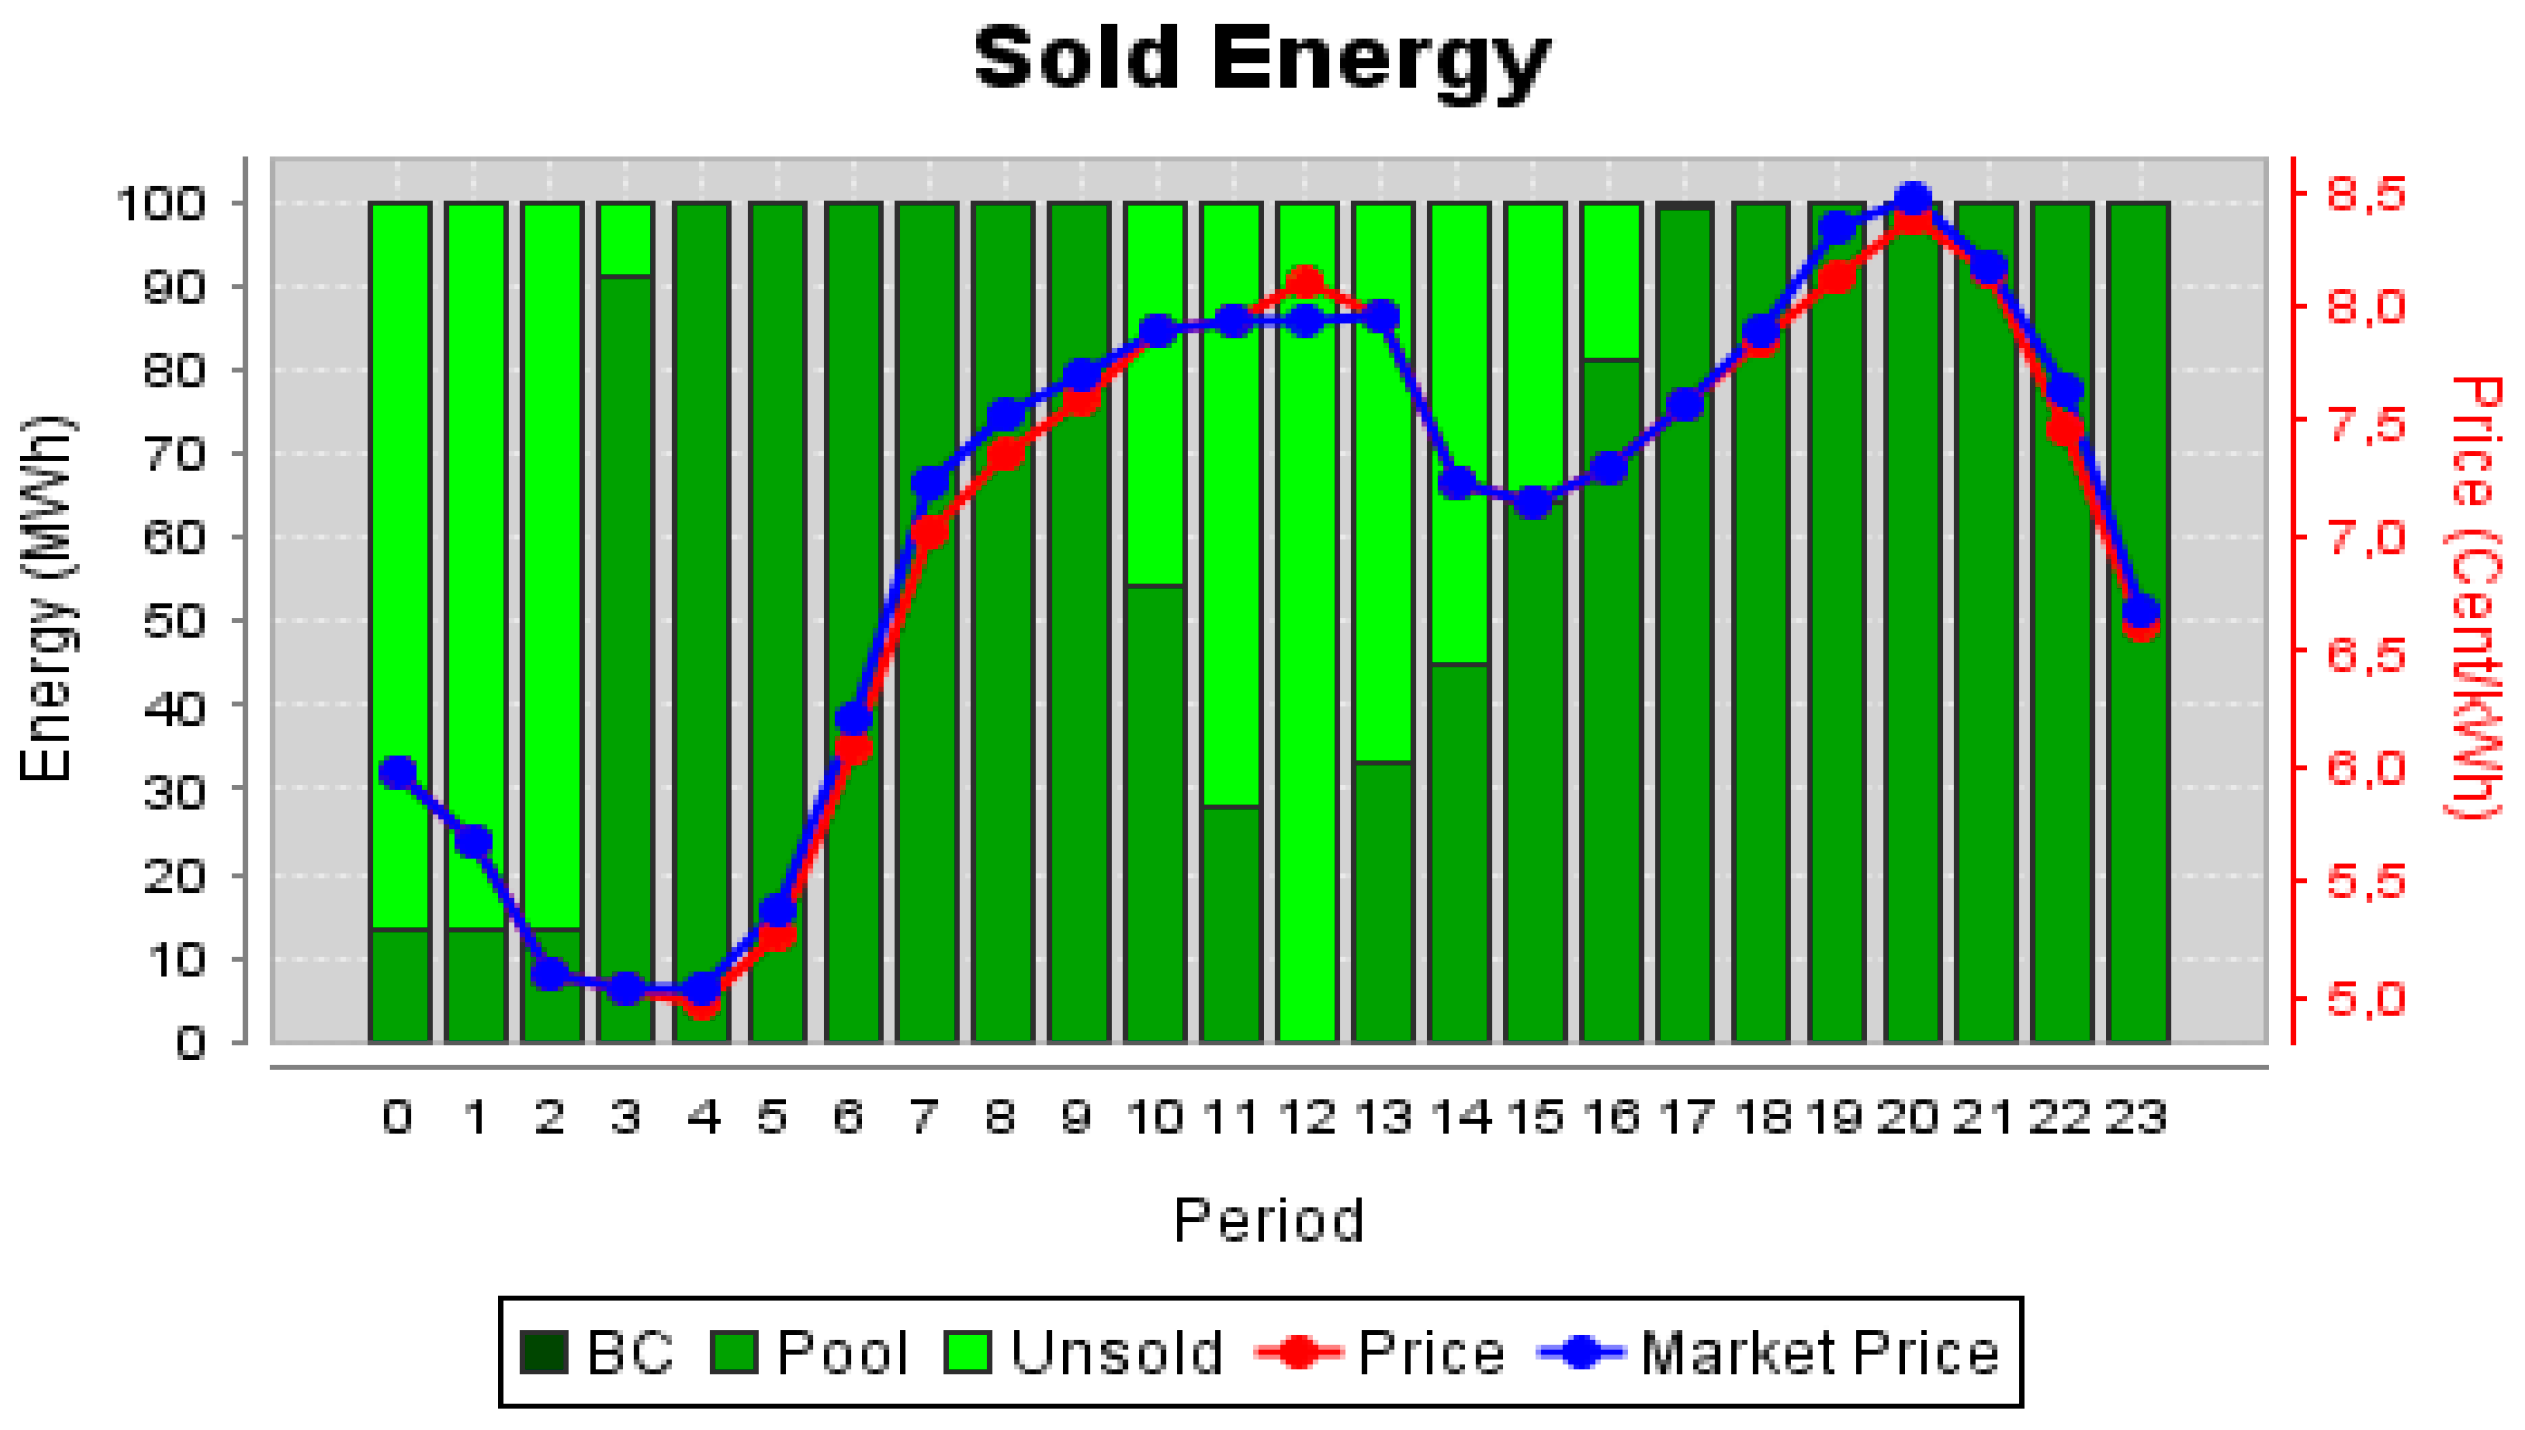
Figure 8 presents the market results for Seller 2, in the case of not participating in the Guarantees of Origin certificates market.
From Figure 8 one can observe that the Seller 2 managed to sell most of the available energy. There were only a few periods when this player could not sell some energy, being period 12 the only one when the value proposed by this player was above the market price, implying that it has not sold any energy in that period. This means that the offers did by this seller have an important influence in the market prices in most of the periods.
The success or failure in selling depends on the competitiveness of the bid price proposed by the player. A seller that can present low bid prices has much higher chances of selling than a player that is forced to present high prices. However, it must be noted that a player must always present bids that allow it to cover its expenses (fixed and variable) and still obtain some profit. Therefore, for a player to be able to present lower proposals than its competitors it must get a strategic advantage somehow, e.g. from entering parallel markets, which allow the achievement of extra ordinal incomes. 
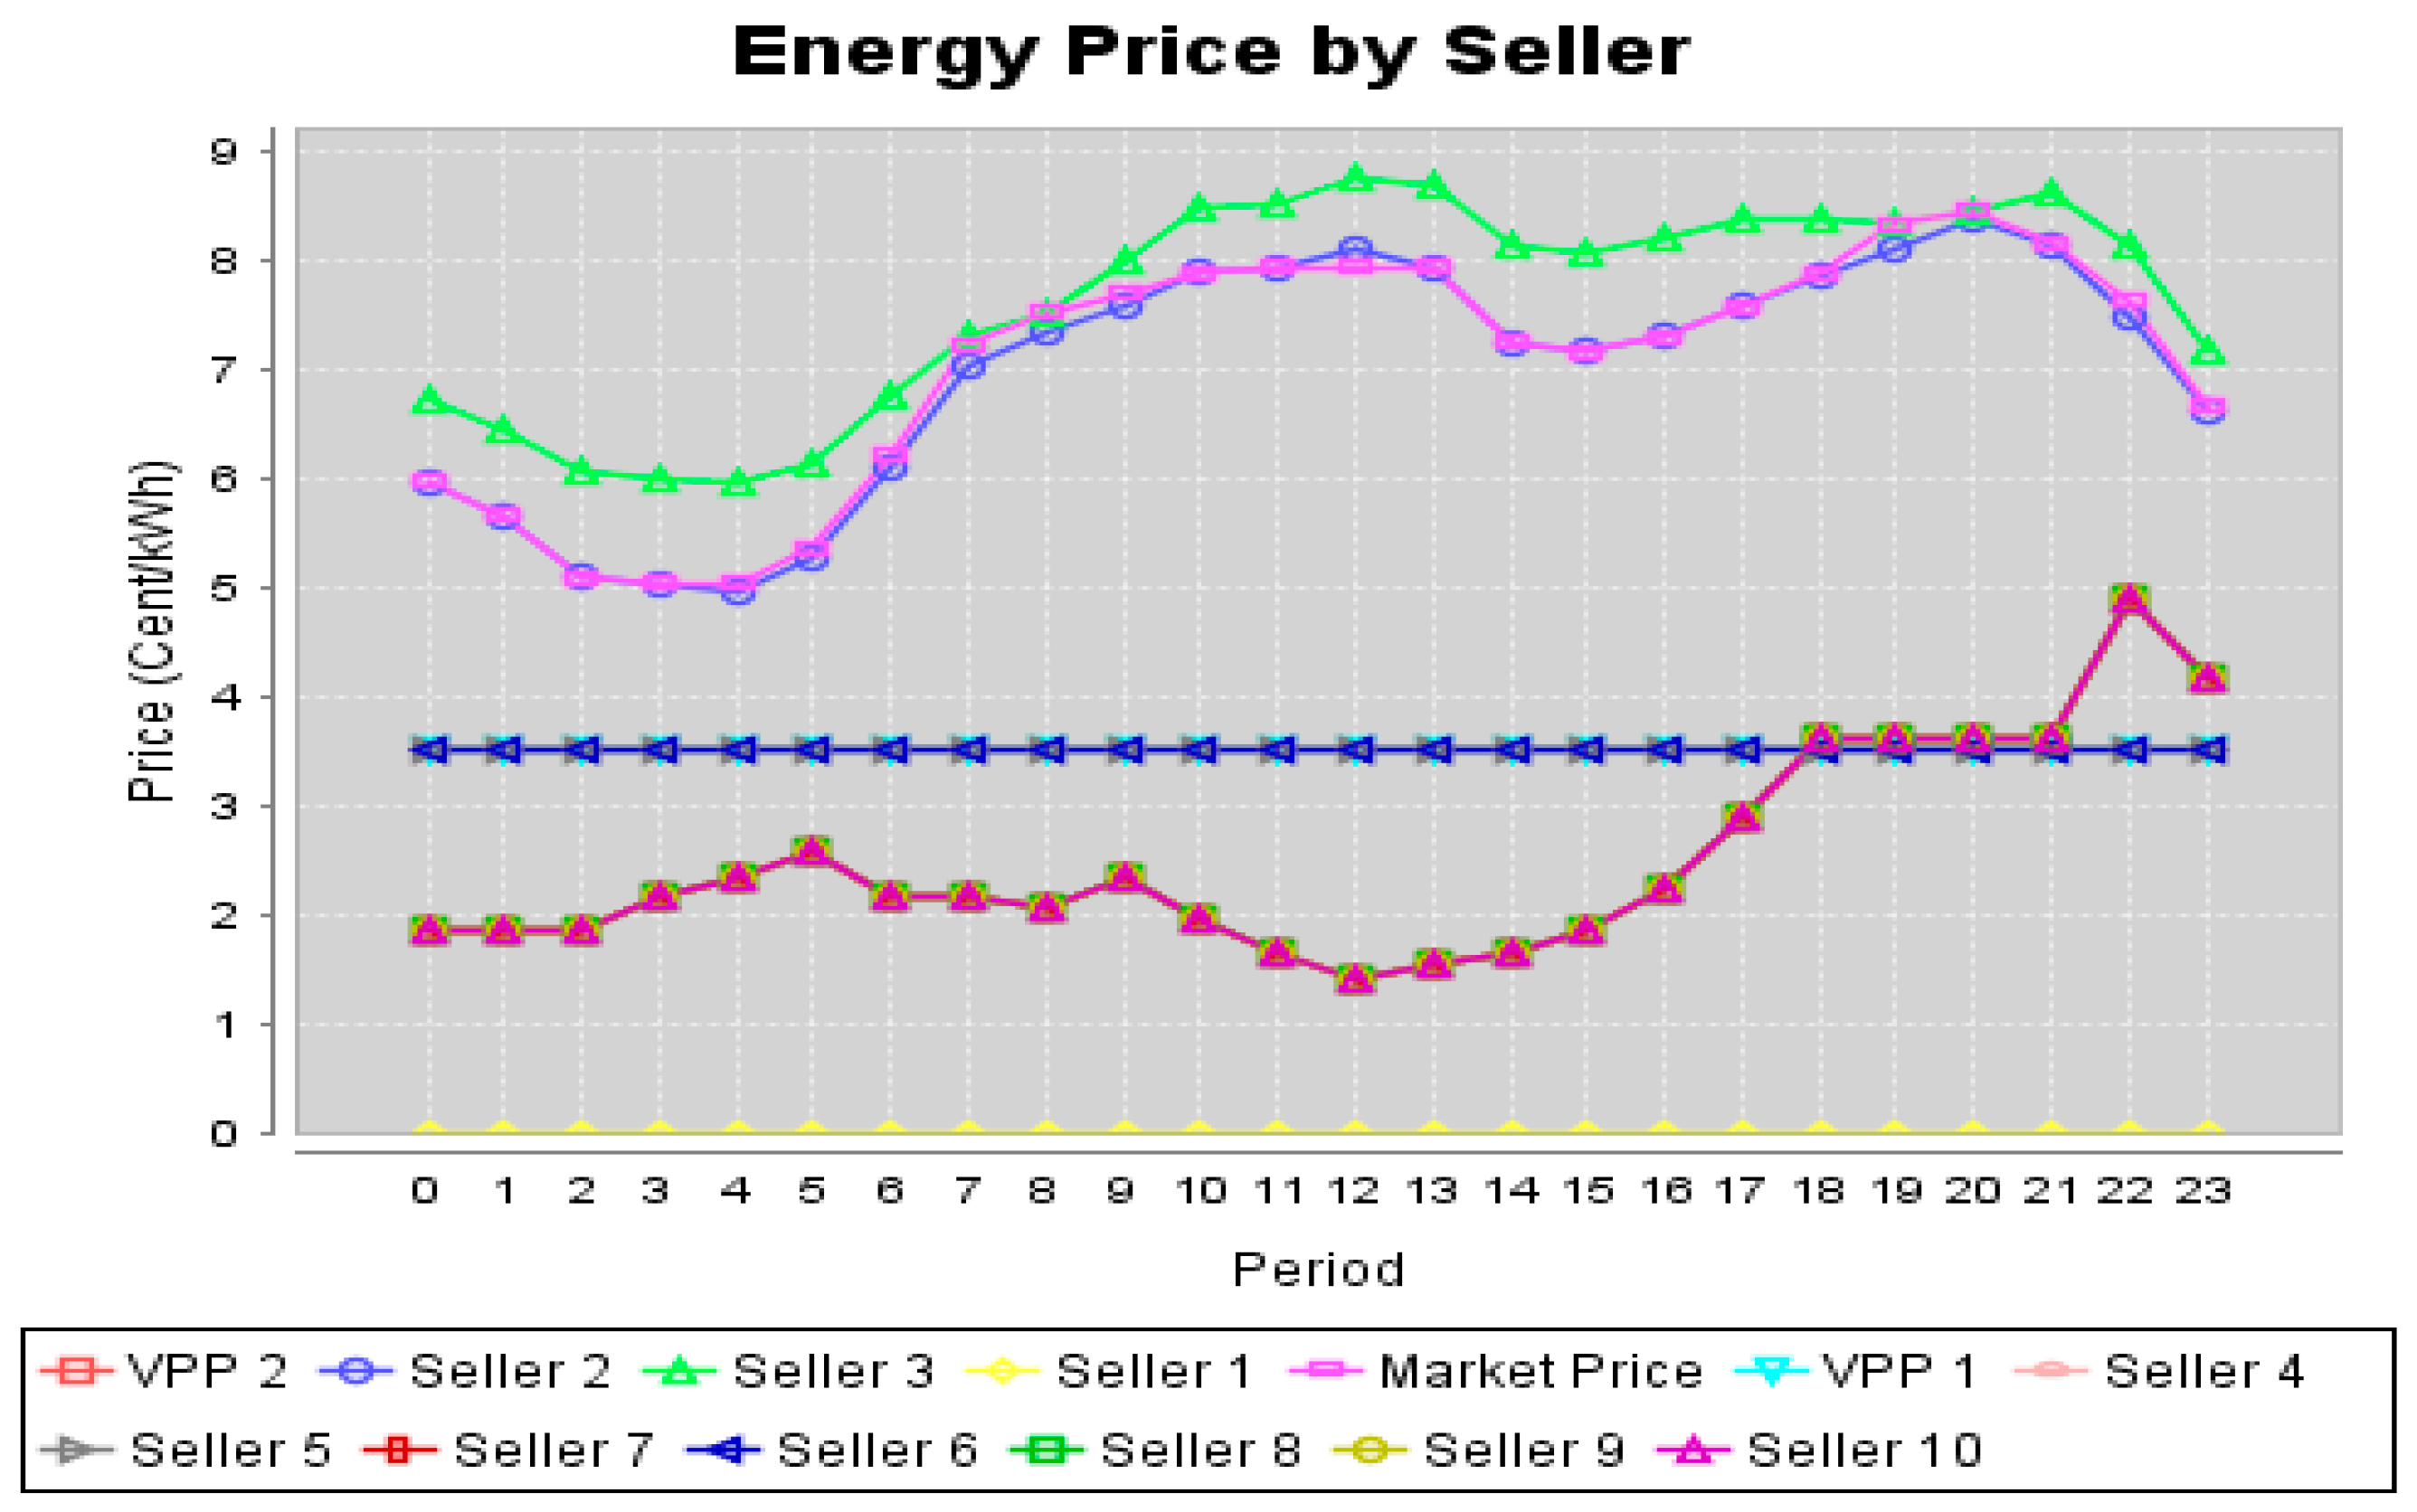
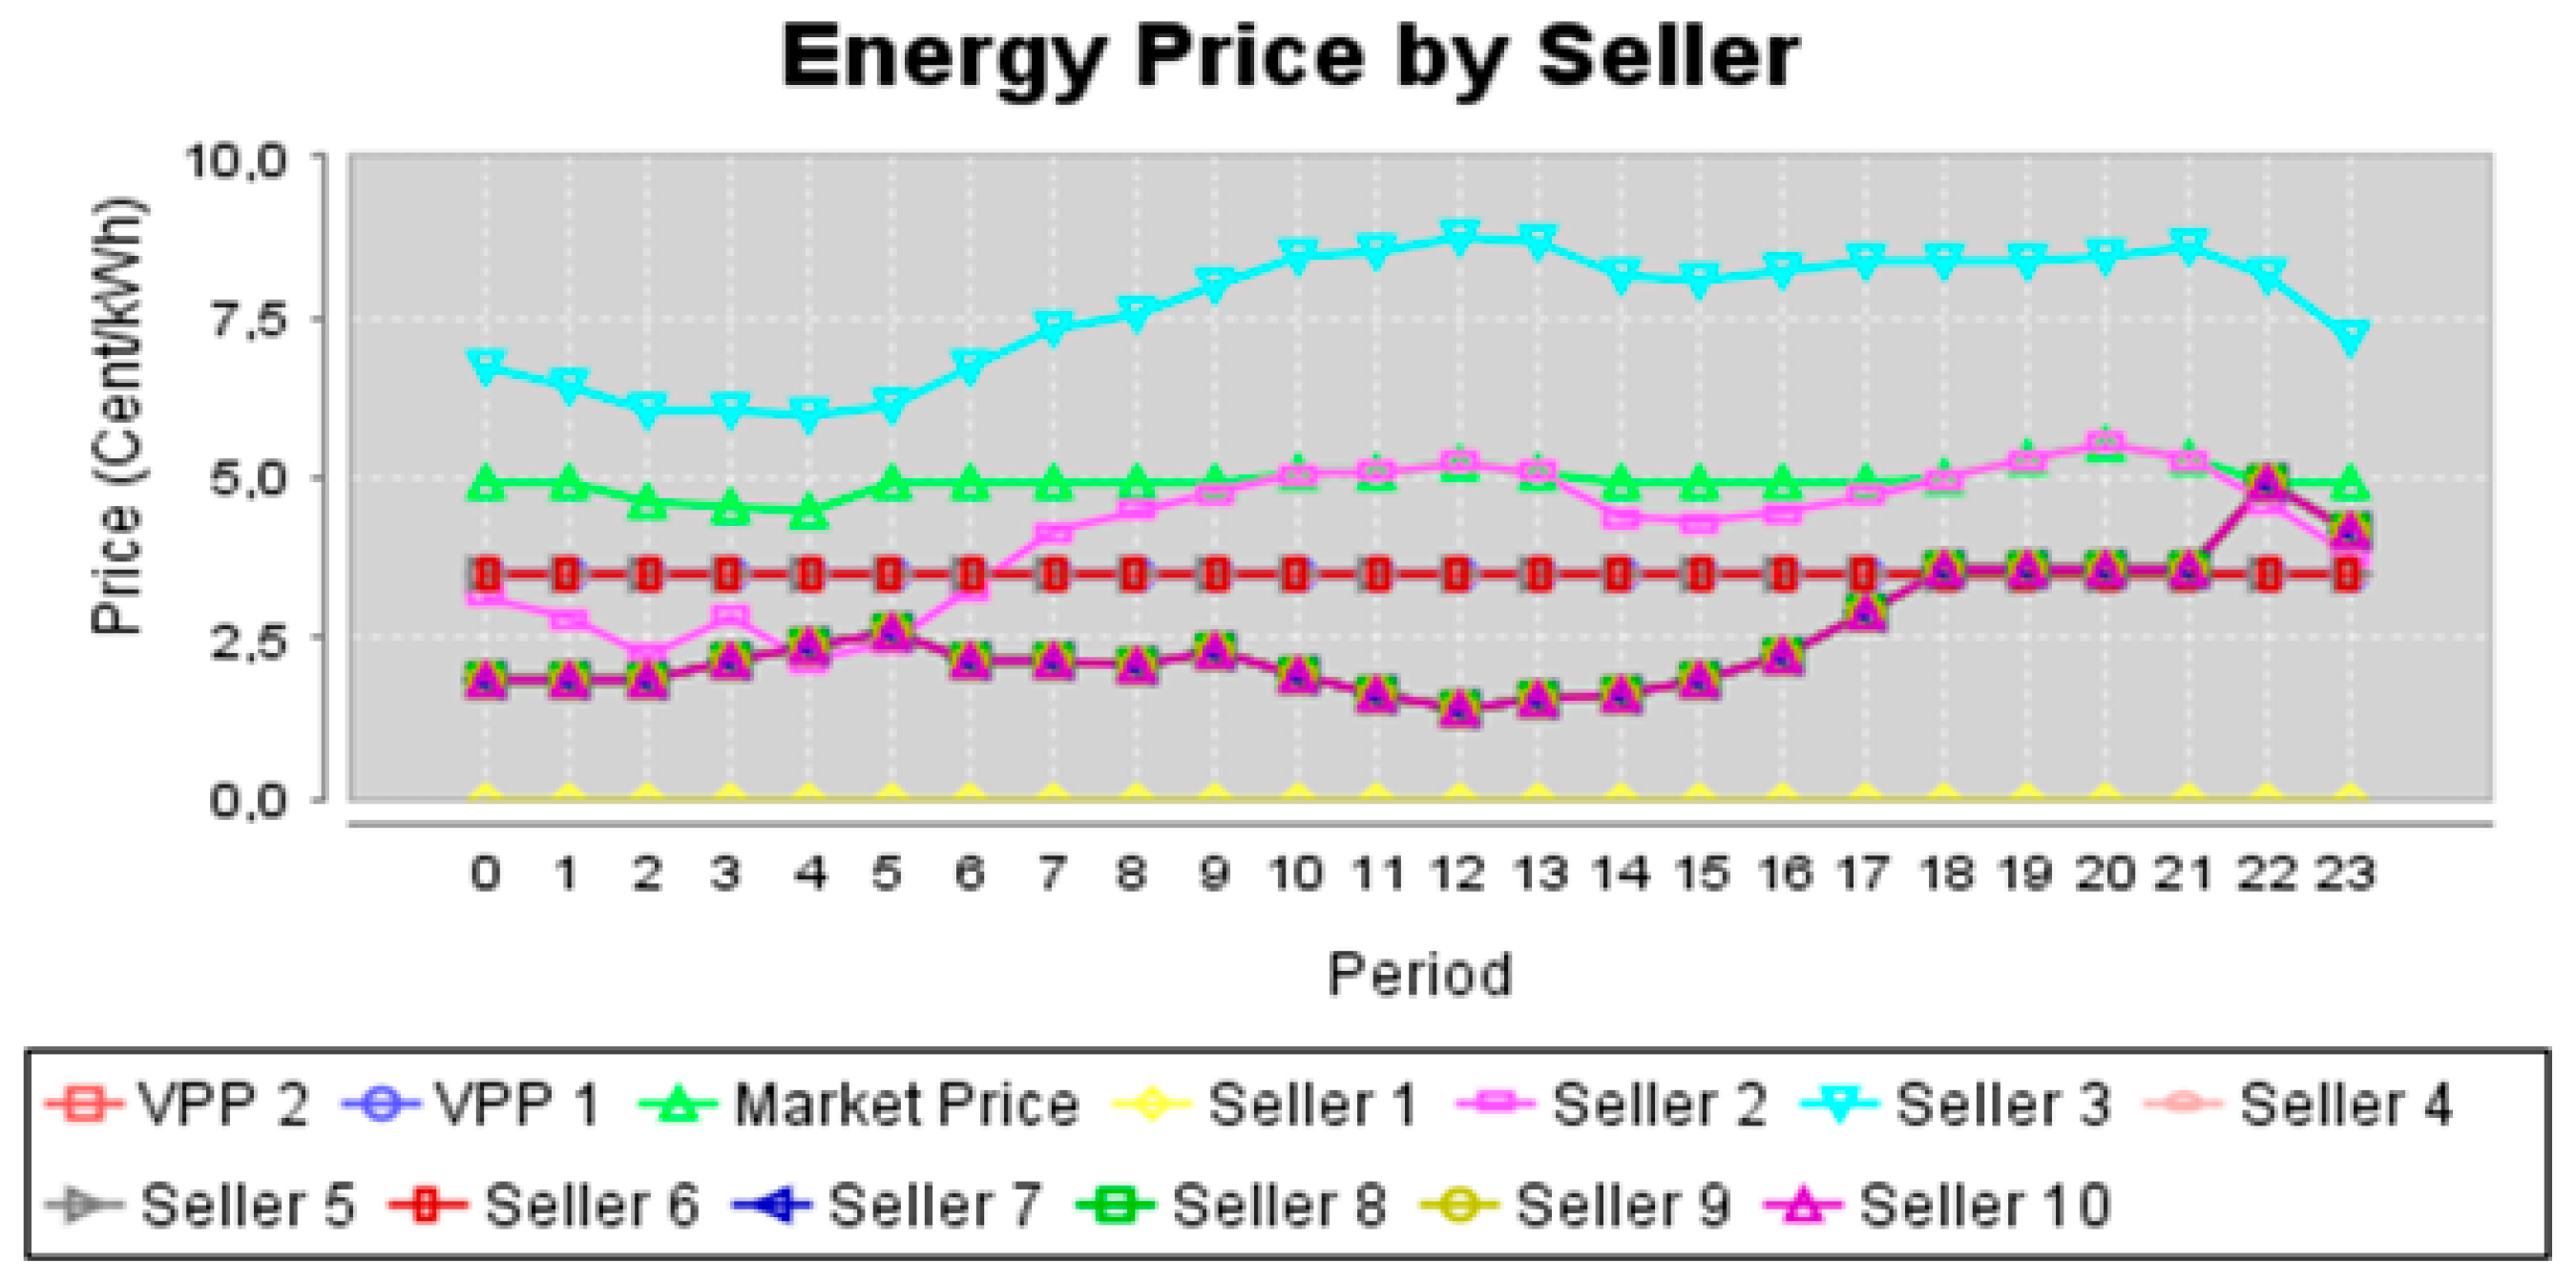
Figure 9 presents the evolution of all sellers’ proposals throughout the day.
From Figure 9 it is visible that the bid price of Seller 2 is highly competitive with some other sellers. This is almost unnotable by the overlapping of the curves of the graph. This competition, and proximity in bid prices, indicates that a small reduction in the bid price from behalf of Seller 2 can mean a notable difference in what concerns the market sales results.
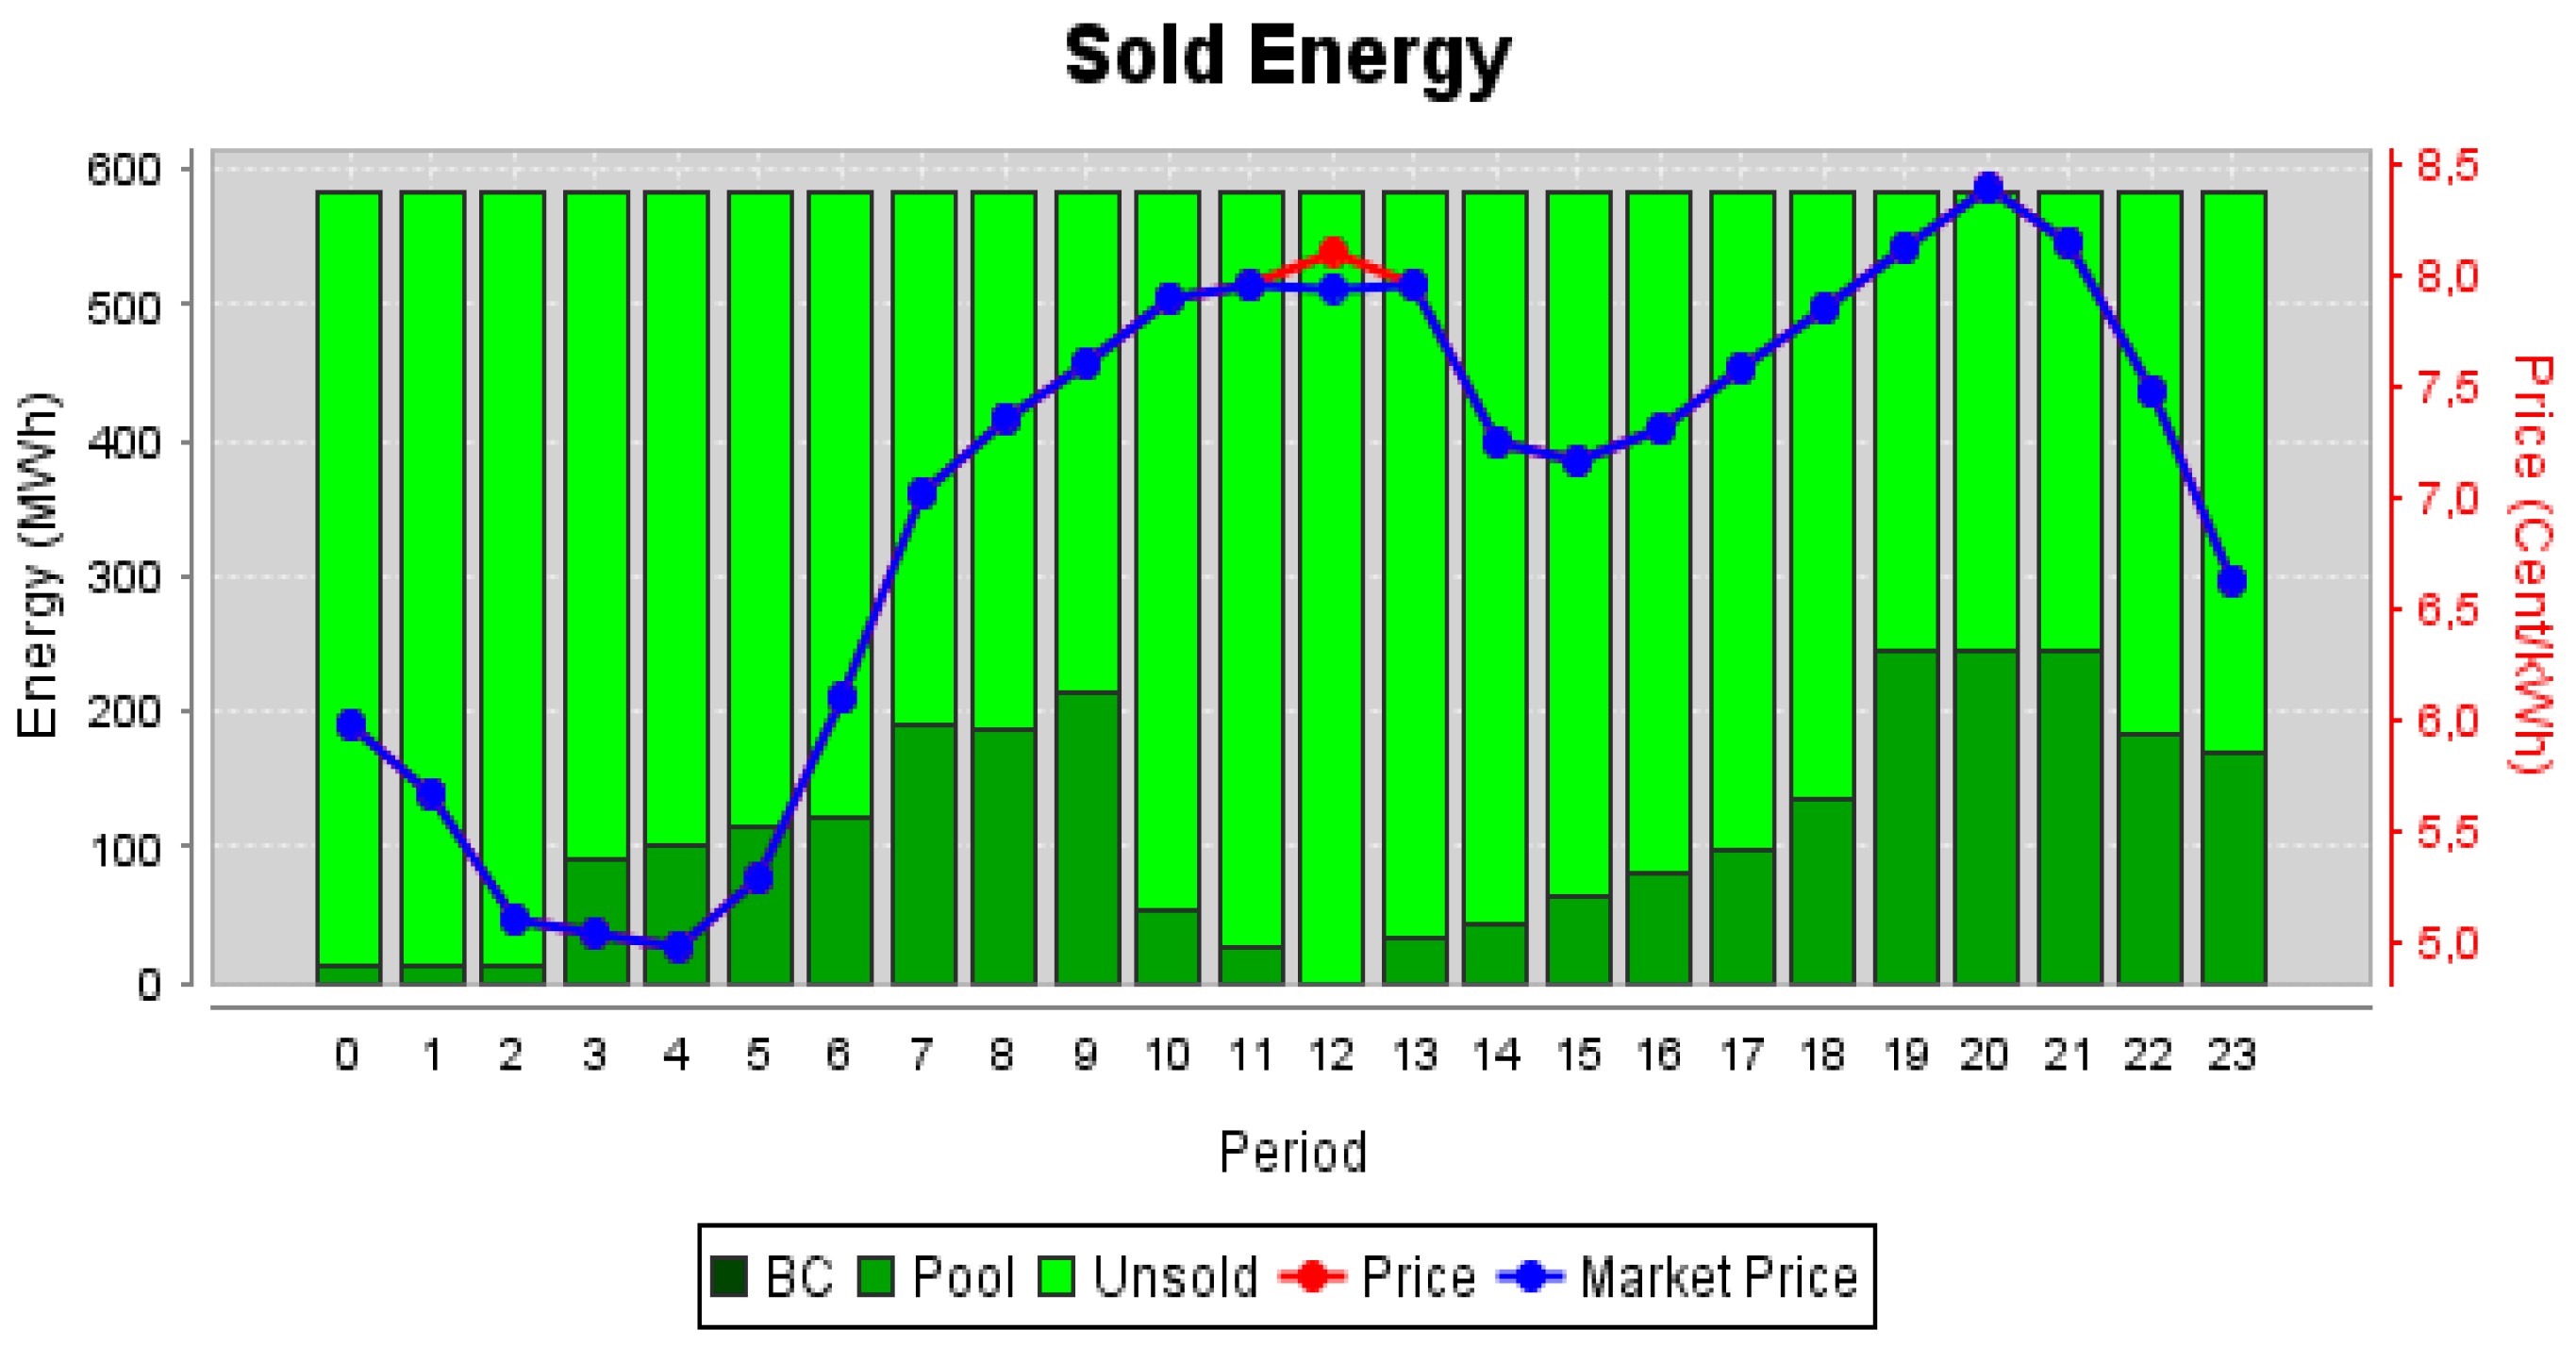
 Figure 10 and Table 2 aim to demonstrate the values obtained with the second simulation, considering the gain obtained in the Guarantees of Origin market, in the definition of the offer made on the second day.
From Figure 10, and comparing it with Figure 8, it is visible that despite the participation in the market for Guarantees of Origin certificates the values acquired by the sale of certificates do not allow Seller 2 to sufficiently decrease its bid price, to increase its energy sales in the market.
Table 2 presents the electricity and Guarantees of Origin markets results. The first column shows the base values initially imposed by Seller 2 in c€/kWh, having 100 MW to sell in every hour. The values of the last column represent the gain obtained in the Guarantees of Origin market, which are subtracted from the original offer.
The second simulation shows that Seller 2 failed to sell more energy when participating in the green certificates market because its gains in the Guarantees of Origin market have not been enough to make a more attractive offer in order to sell a higher amount of energy. The energy that was actually sold can be found in the third column of Table 2.
The conclusions drawn by the strategy for the involvement of energy producer in the market for licenses are quite clear according to the data from the presented simulations. It appears that the registered producer cannot gain enough in the Guarantees of Origin market to significantly lower its bid in the sale of electricity.
The failure to obtain larger profits from the sale of Guarantees of Origin certificates does not mean that companies involved in the production of energy using renewable sources should not have some facilities registered in this system. Despite the incomes from the selling of Guarantees of Origin certificates not being high, they still mean an extra revenue. And even this strategy can show different results when the original bid prices are even closer to the market price, which can be achieved with the use of forecasting and data mining methods. In that case, even a minimal reduction in the prices can be translated into an increase in the amount of selling power, and consequently the increase in profits.
In order to complement the analysis made for the two reference days presented in the above simulations, Table 3 presents a sensitivity analysis on the influence of the sold volume and reference price for selling of Guarantees of Origin certificates. This analysis presents the extra revenue (in €) obtained by selling Guarantees of Origin certificates during a full day, assuming the same availability of 100 MW in each hour. The sensitivity analysis considers different variations of the total volume of sold energy during the day, and variation of the reference price of Guarantees of Origin certificates depending on the percentage of redeemed certificates.
From Table 3 it can be seen that the extra revenue obtained by selling Guarantees of Origin certificates can be up to 2400.00 € in the total of the considered day. This scenario considers that 100% of the submitted certificates are redeemed and the total volume of energy is sold throughout the entire day. Although this is currently not a realistic scenario, it may be not that far away. Given the current agreements and initiatives to boost the usage of renewable energy, it is not unfeasible that in some years all the certificates may possibly be redeemed. Even when considering a percentage of 50% redeemed certificates: the reference value identified by this study given the current status of the Guarantees of Origin trading, the extra revenue obtained when selling the entire amount of energy is of 1200.00 €, which is still a very significant amount as additional daily income on top of the energy sale in the wholesale electricity market. In summary, it is noteworthy to mention that the participation in Guarantees of Origin certificates trading is always beneficial for renewable energy sellers, as it represents an additional gain that complements the incomes from the traditional electricity market participation.

4.2. Strategy 2: Participation in the Carbon Market

A seller’s participation in the carbon market allows a possible selling of emission rights if it can manage to stay under the maximum of granted allowances. The strategy is defined by a reduction in power production in order to be able to obtain credit in the carbon market, this way being able to sell the exceeding allowances in the CO2 emissions market, gaining room to reduce the value of its bid in the energy market, if the producer finds that it is not obtaining a significant dispatch of the selling power.
Technologies based on fossil fuels as a source of production have a higher rate of emissions. This requires greater care in the management because what may be looked at as profit in the electricity market may have additional costs in the case of having to pay high values for exceeding the awarded allowances.
To test this strategy, we will maintain the bid values for the first day constant. If Seller 2 can not sell all of its power at the desired price, the next day’s bid will be lowered in accordance to the profits obtained the day before in the CO2 emissions market. The next example aims to demonstrate this strategy more explicitly. In this study, Seller 2 represents a producer that explores the Pego Thermal Power Plant in Portugal (http://www.tejoenergia.com/):
  • Allowances per year: 2,723,011 tonCO2;
  • Installed capacity: 584 MW.
Consideration: The plant ceases to produce during 48 h to be able to acquire enough allowances to cover emissions made in the third day, therefore lowering its required price in the energy market. To cover the CO2 emissions recorded during energy production, the producer will have to use the allowances acquired in previous days and sell those in excess in the carbon market. The value gained in this operation will be applied in the reduction of the bid for the electricity market.
Considering a total allowance per year and an average generation of 584 MWh, means that, approximately, 479.60 tonnes of CO2 per hour will be issued representing an allocation of allowances of 310.85 tonnes of CO2 per hour. This means the producer would have to buy licences to compensate for the issued excess. However, since it did not produce energy during 48 h, it gained a total value of € 179,049.60 with the sale of the allowances it saved during those hours, considering as reference the value of € 12 per allowance presented in Section 2.2. In the third day, the total amount of allowances needed per hour to compensate for the extra production is the hourly allocation of allowances (310.85 tonCO2) subtracted to the effective hourly production (479.60 tonCO2) corresponding to 168.75 tonCO2. This means an hourly expense of € 2025.00 and a total expense for the day of € 48,600.00. Therefore, the total profit, €130,449.60 is the total income received from the selling of the allowances in the first 48 h, without the total value paid to compensate for the extra production in the last day. Now, if we divide this total profit for the total production of the day, we get to the value that we can subtract to the bid to still maintain the guarantees of having profit. This corresponds to 0.9307 c€/kWh in the possible reduction of Seller 2′s offer in the energy market.
This means the producer would have to buy licences to compensate for the issued excess. However, since it did not produce energy during 48 h, it gained a total value of € 179,049.60 with the sale of the allowances it saved during those hours, considering as reference the value of € 12 per allowance.
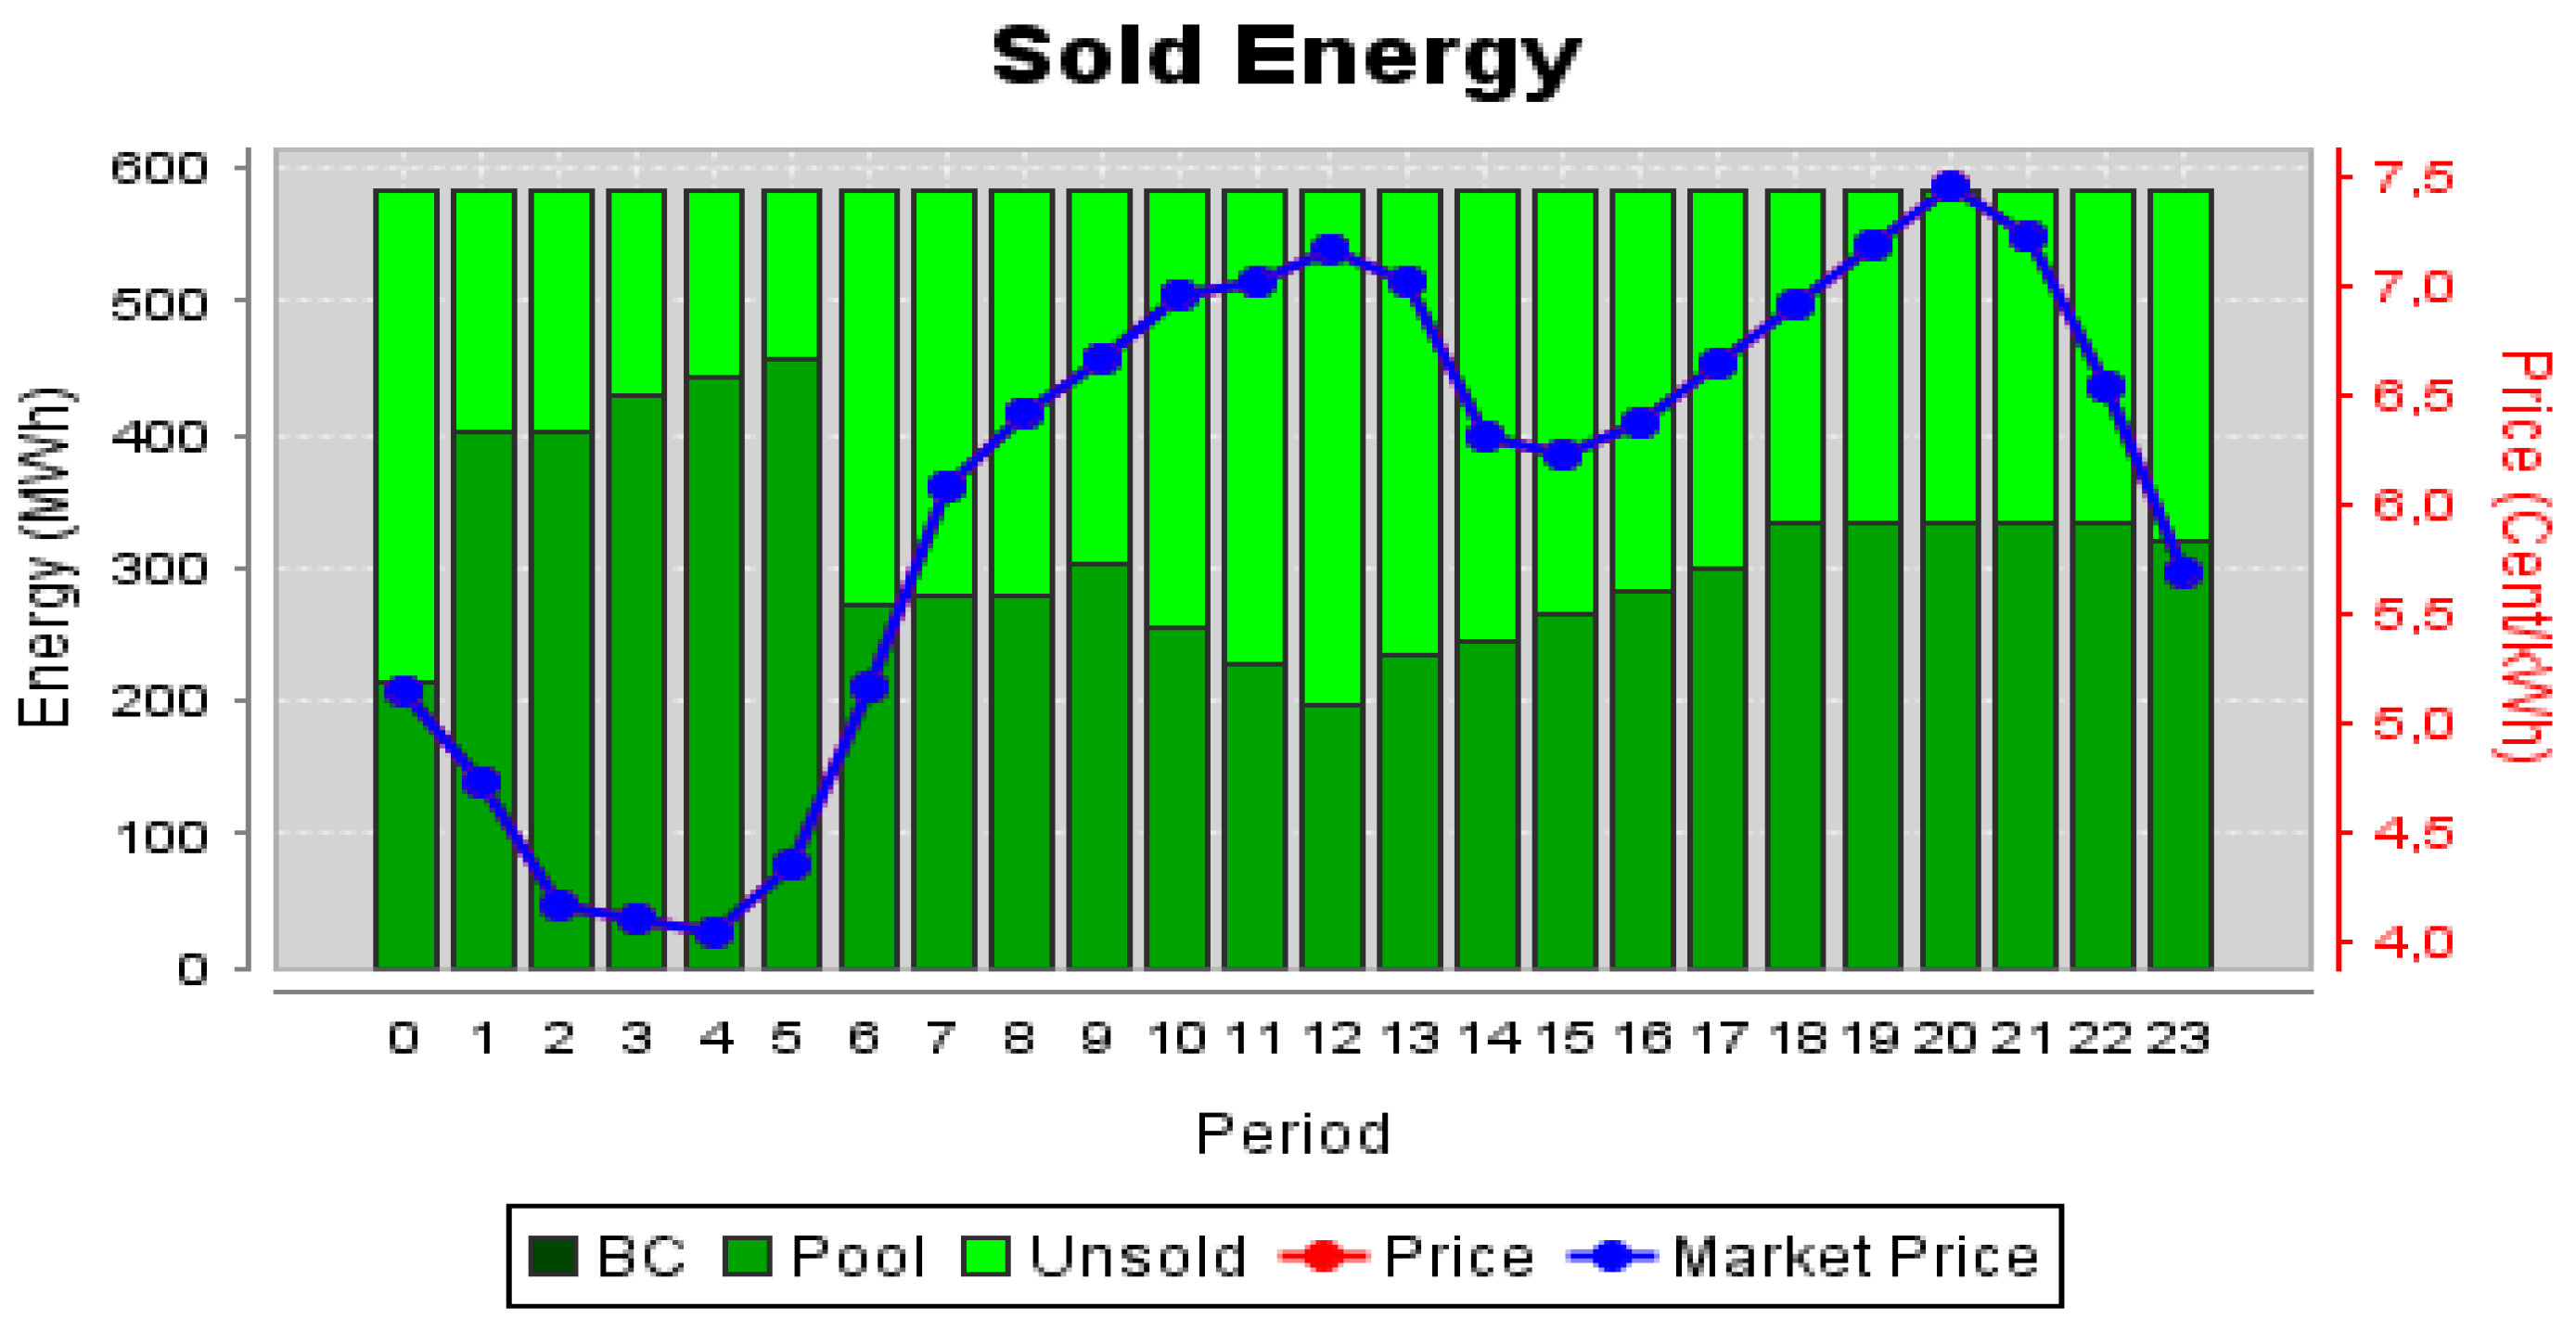
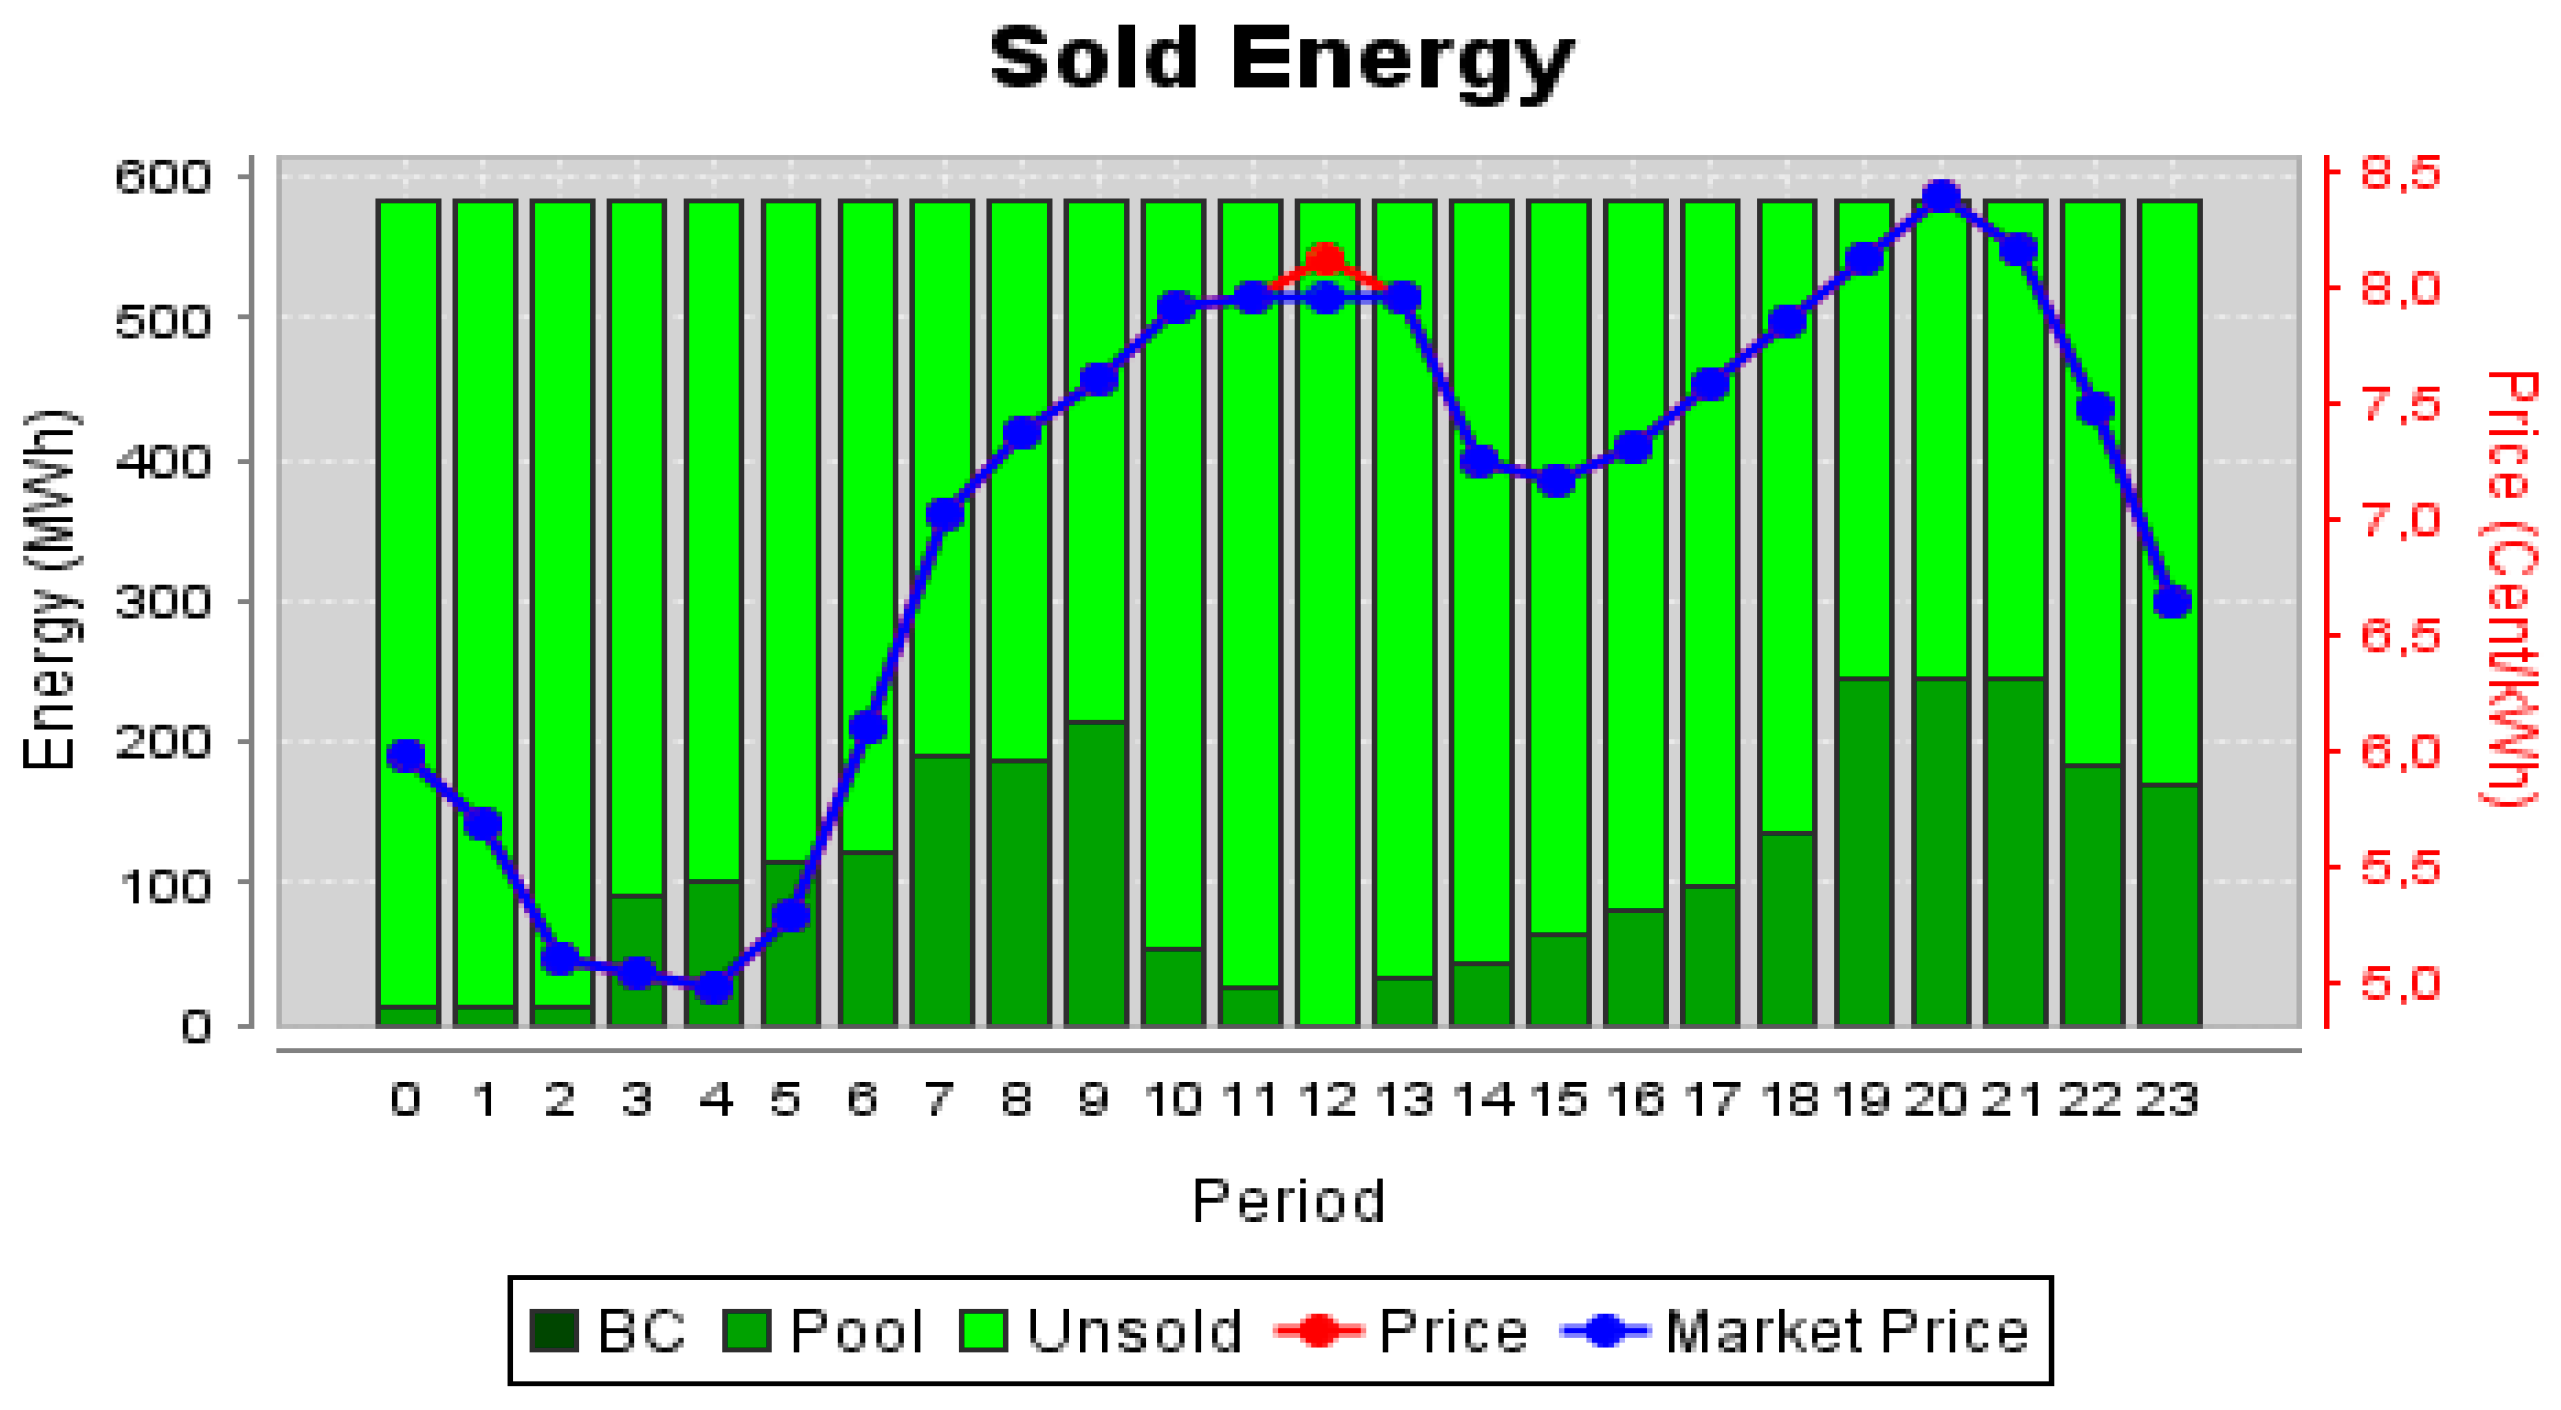
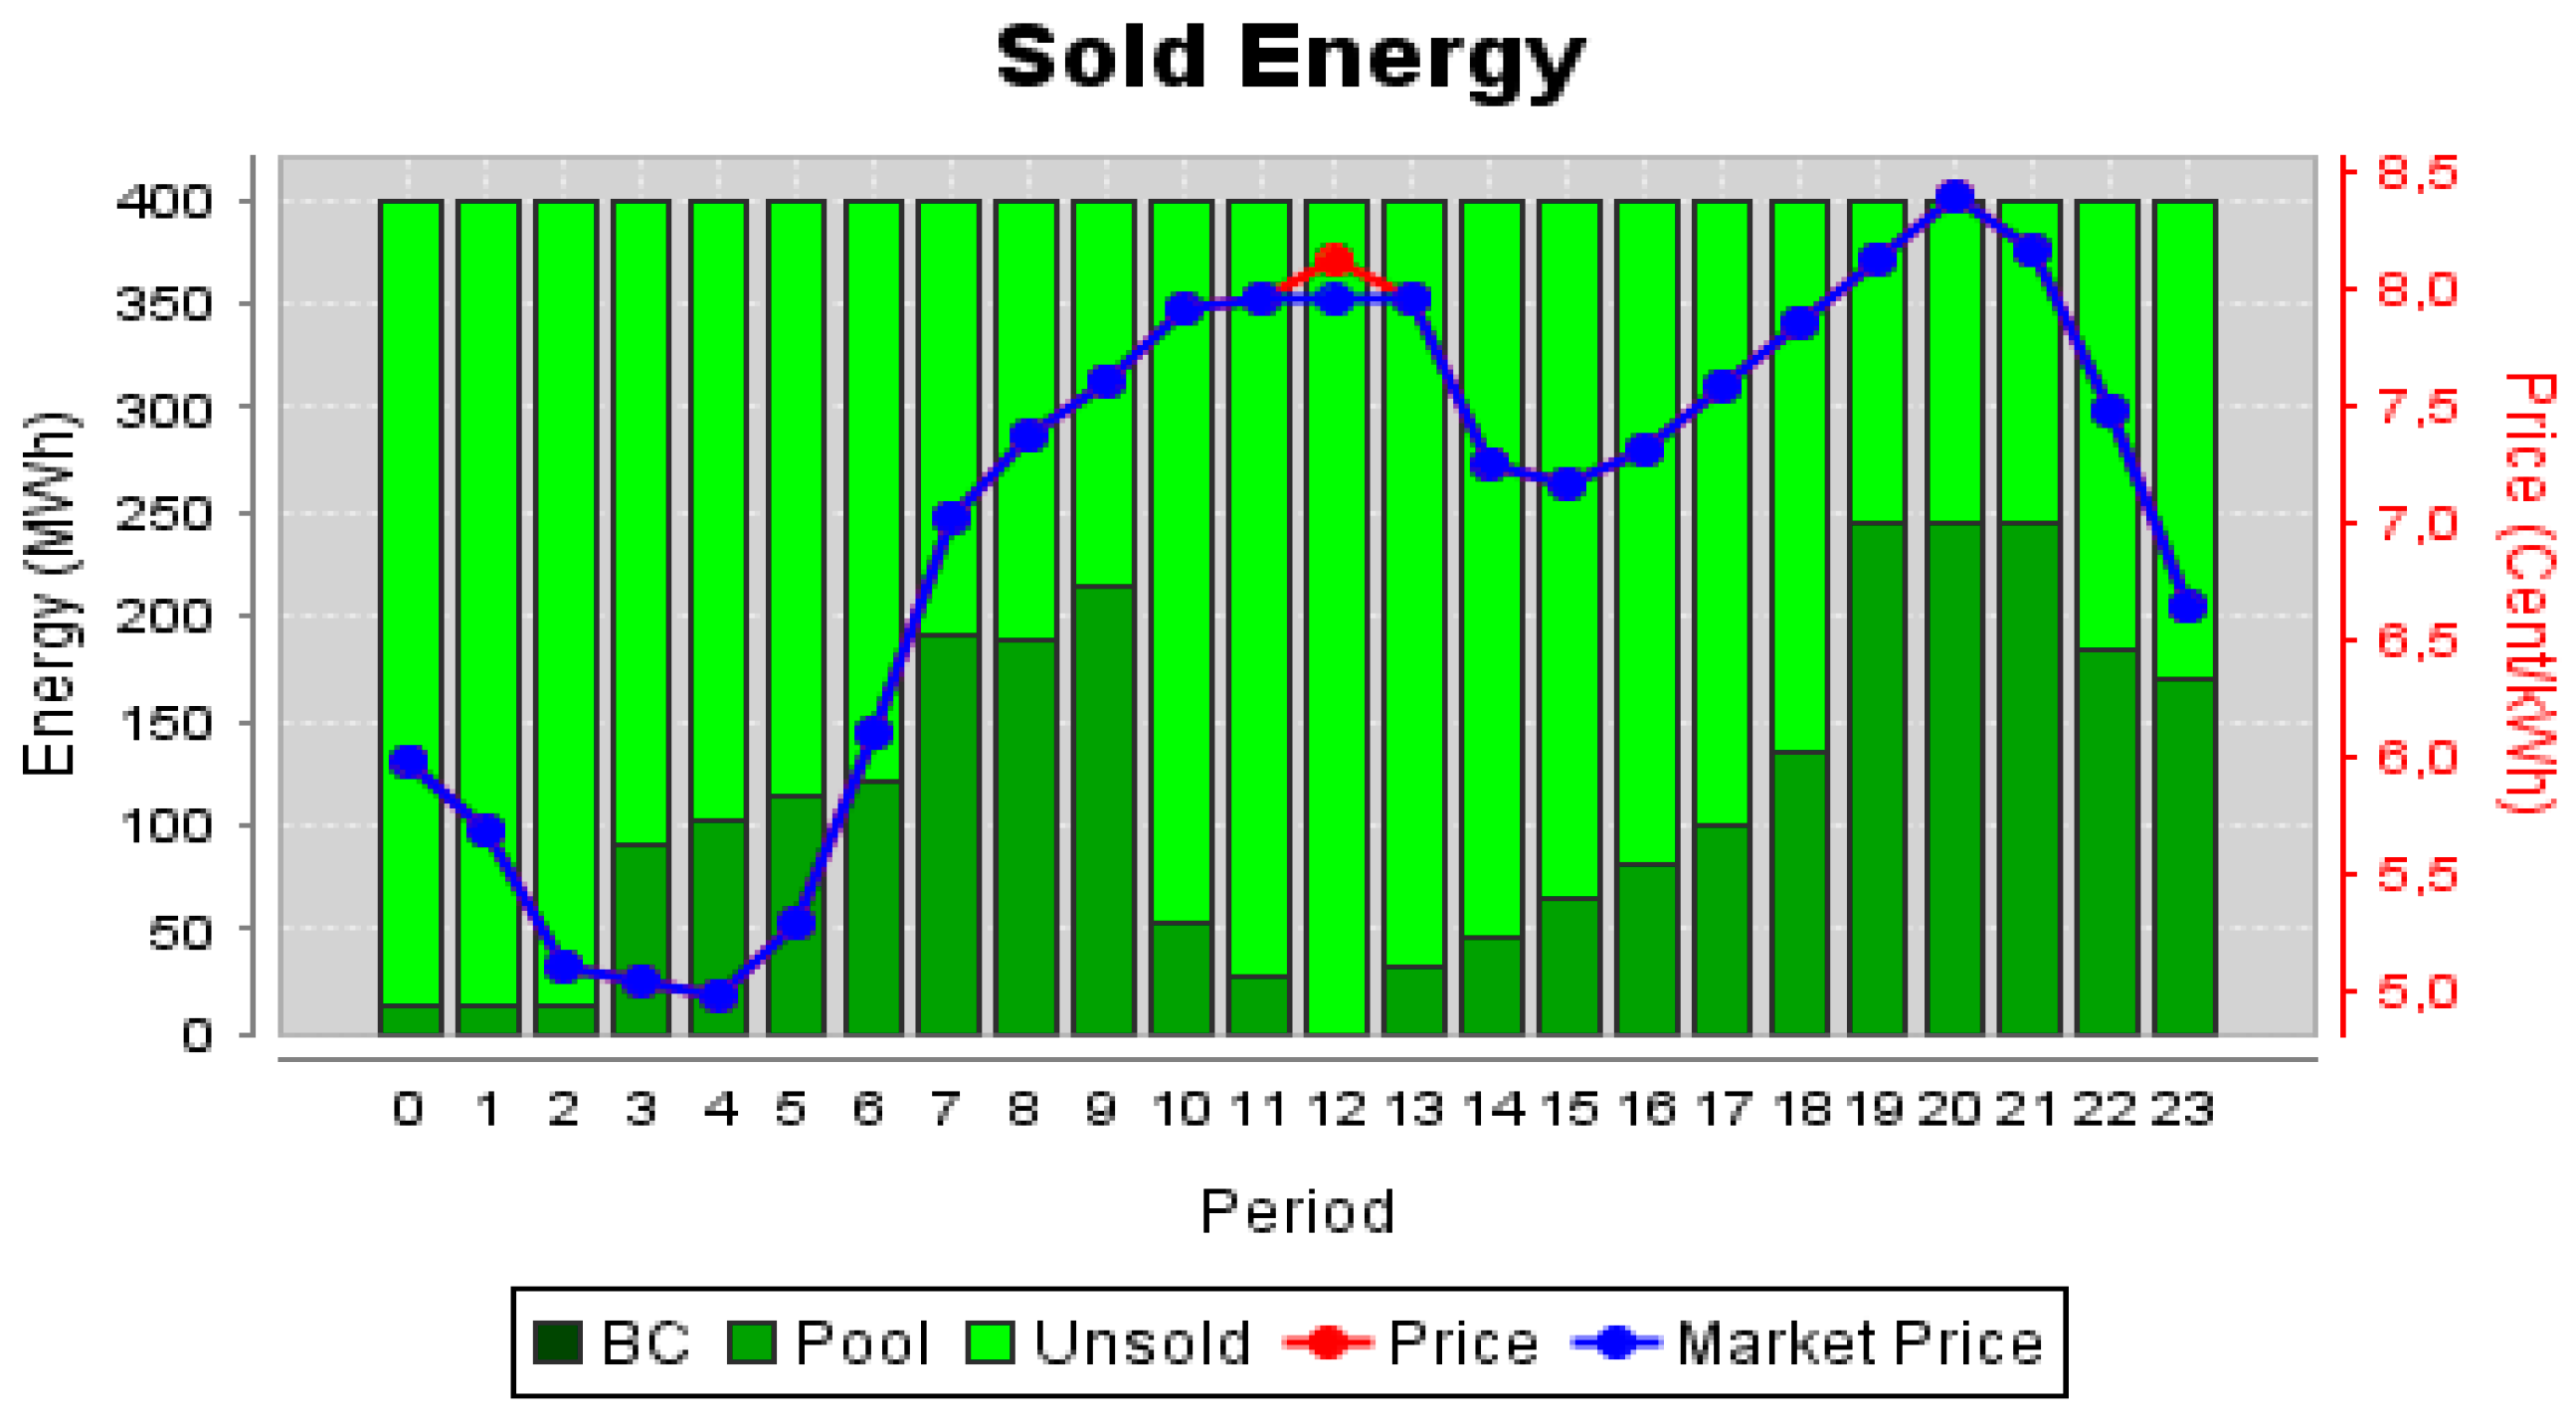
The simulation that follows is performed with MASCEM and intends to demonstrate the change in energy sales in the market over 24 h. On the first day, the gain realized on the carbon market is not considered, while the offer of the following day takes into account the profit of the previous days. Figure 11 presents the results of Seller 2 when acting in the electricity market for the first day (without considering the gains in the CO2 emissions market yet). Figure 12 presents the results of Seller 2 for the second day, when acting in the electricity market considering the gains in the CO2 emissions market achieved in the previous days.
Figure 11 and Figure 12 allow observing the amount of energy sold in the market. The dark green bars represent the energy that was actually sold, compared to the base production, the blue line represents the market price set by the market operator, and the red line represents the bid price set by Seller 2.
Seller 2 has stopped its production for two days allowed it to get enough credits to cover the license issued by energy production and to define a more attractive offer which is reflected in the amount of energy it could sell. The fact that the blue and red lines are overlapped in most periods in both graphs is a result of Seller 2 being the most influent seller in this simulation, and its bid price is defining the market price in most periods. This is the main reason why this was the chosen seller to be our object of study, this way it is possible to have an easier visualization of the changes that happen when its bid price and energy amount change. 
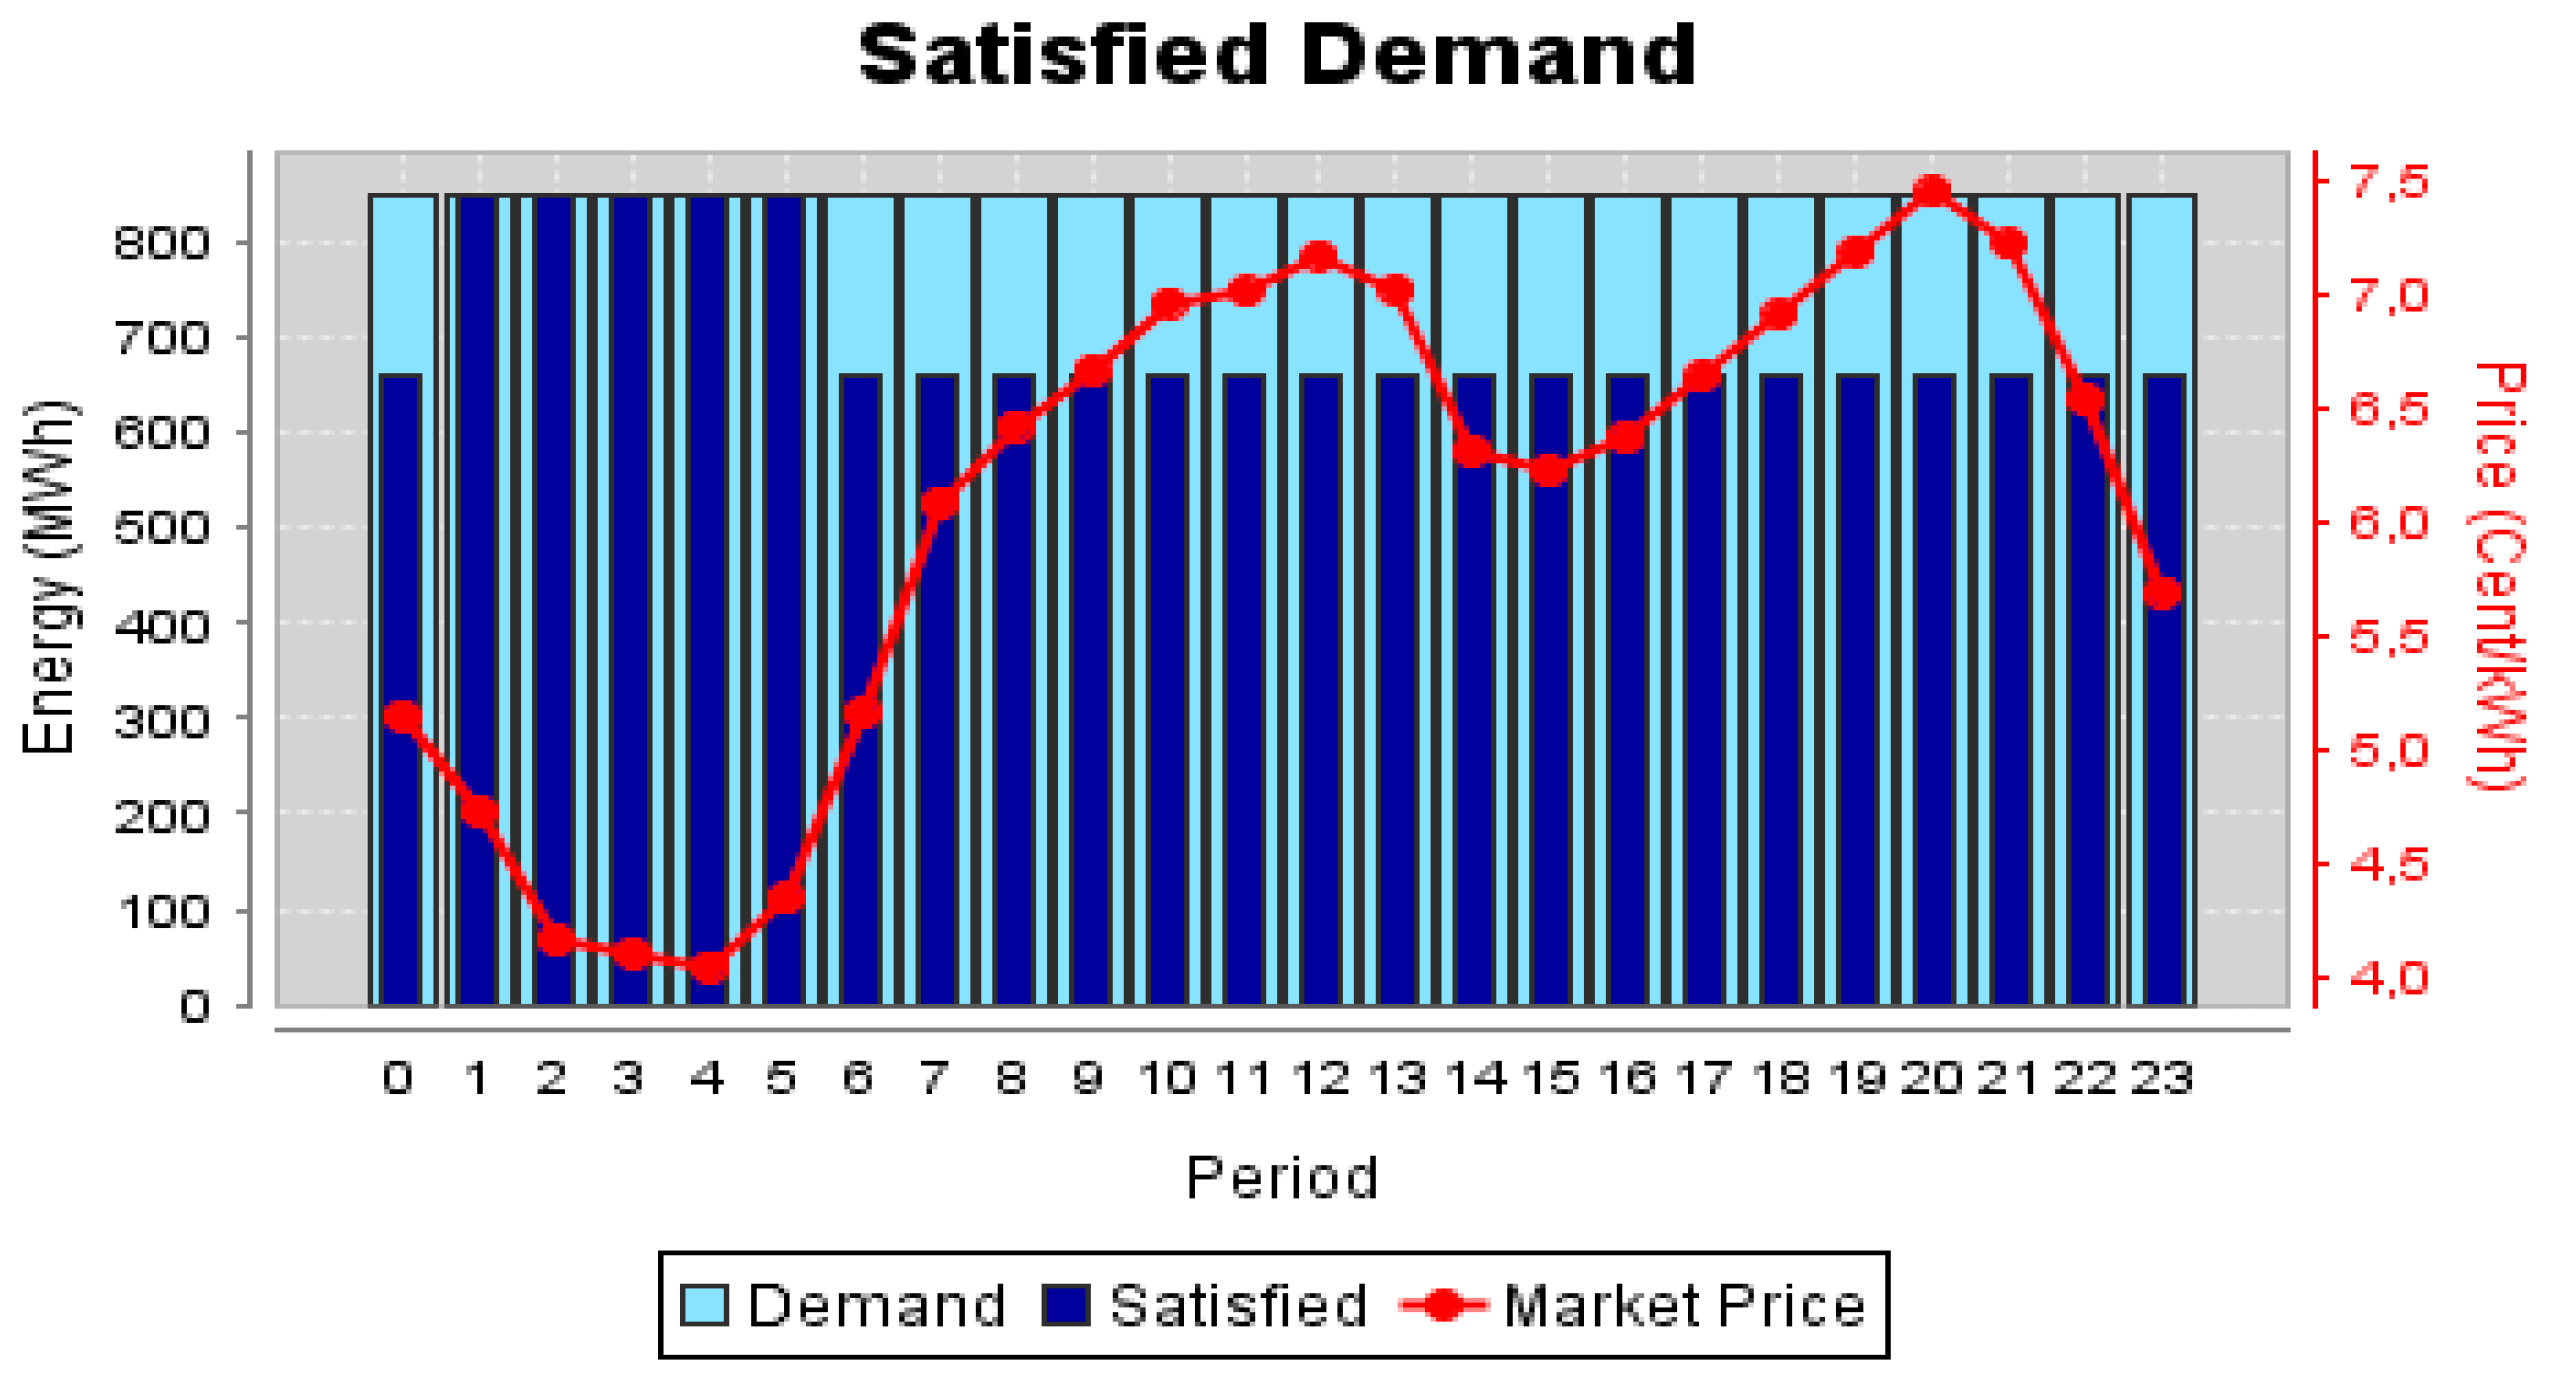
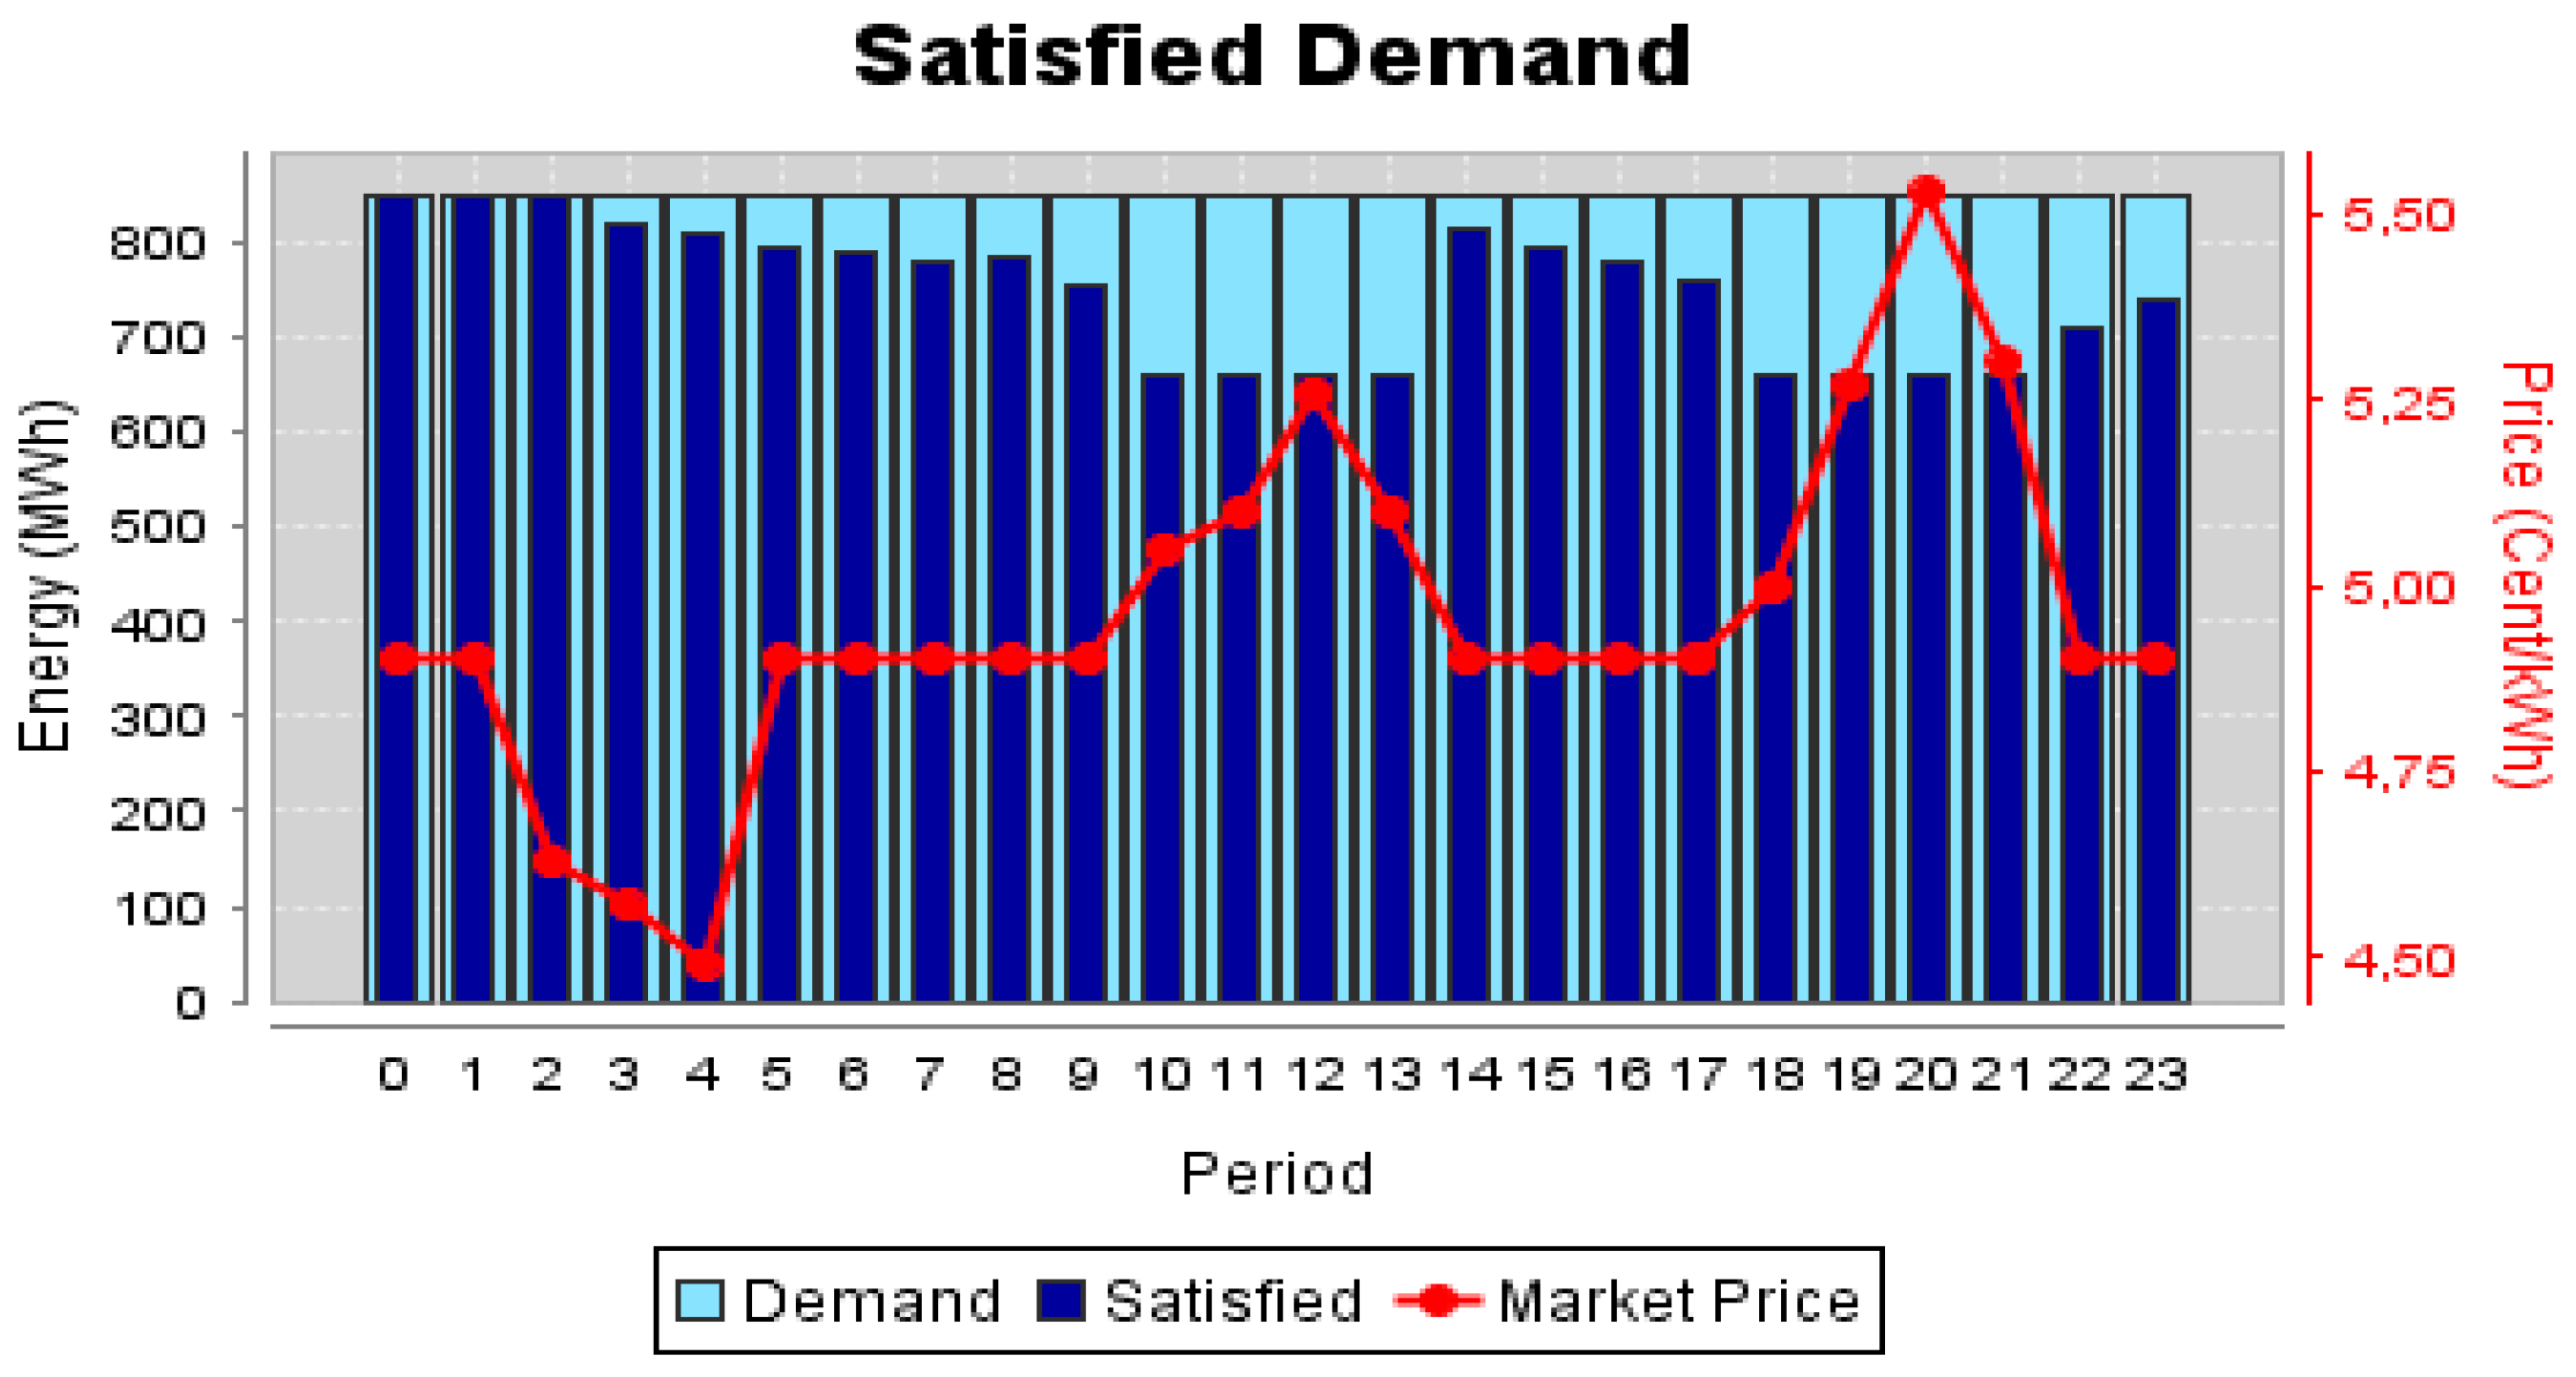
Figure 13 presents the comparison between the total demand in the market and the demand that was, in fact, satisfied.
Depending on the variation in energy prices imposed by the market, it is observed if the demand for energy was satisfied or not. The graph of Figure 13 is characterized by the results obtained with Seller 2 participating in both the electricity market and the CO2 emissions market. Figure 13 shows that Seller 2′s decrease in its bid originated the satisfaction of much of the energy demand. Table 4 presents a comparison between the proposed and accepted bids for Seller 2, in both cases, with and without the carbon market participation. From Table 4 it is important to note the results obtained with the action in the carbon market, being Seller 2 a facility registered in the EU-ETS and adopting the proposed market strategy, it can be observed that in the first simulation (offer n) were sold only 2689 MW over 24 h. In the second simulation (offer n + 1) the sale struck up the 7477 MW, about 64% more.
According to the values recorded in the table, it is possible to see that Seller 2, by acting in both the carbon market and electricity market can obtain a total of € 441,737.91. This is a high value compared to the € 195,161.02 obtained without the simultaneous participation in the two markets. Now, let’s analyze the case where Seller 2 does not participate in the CO2 market at all. 
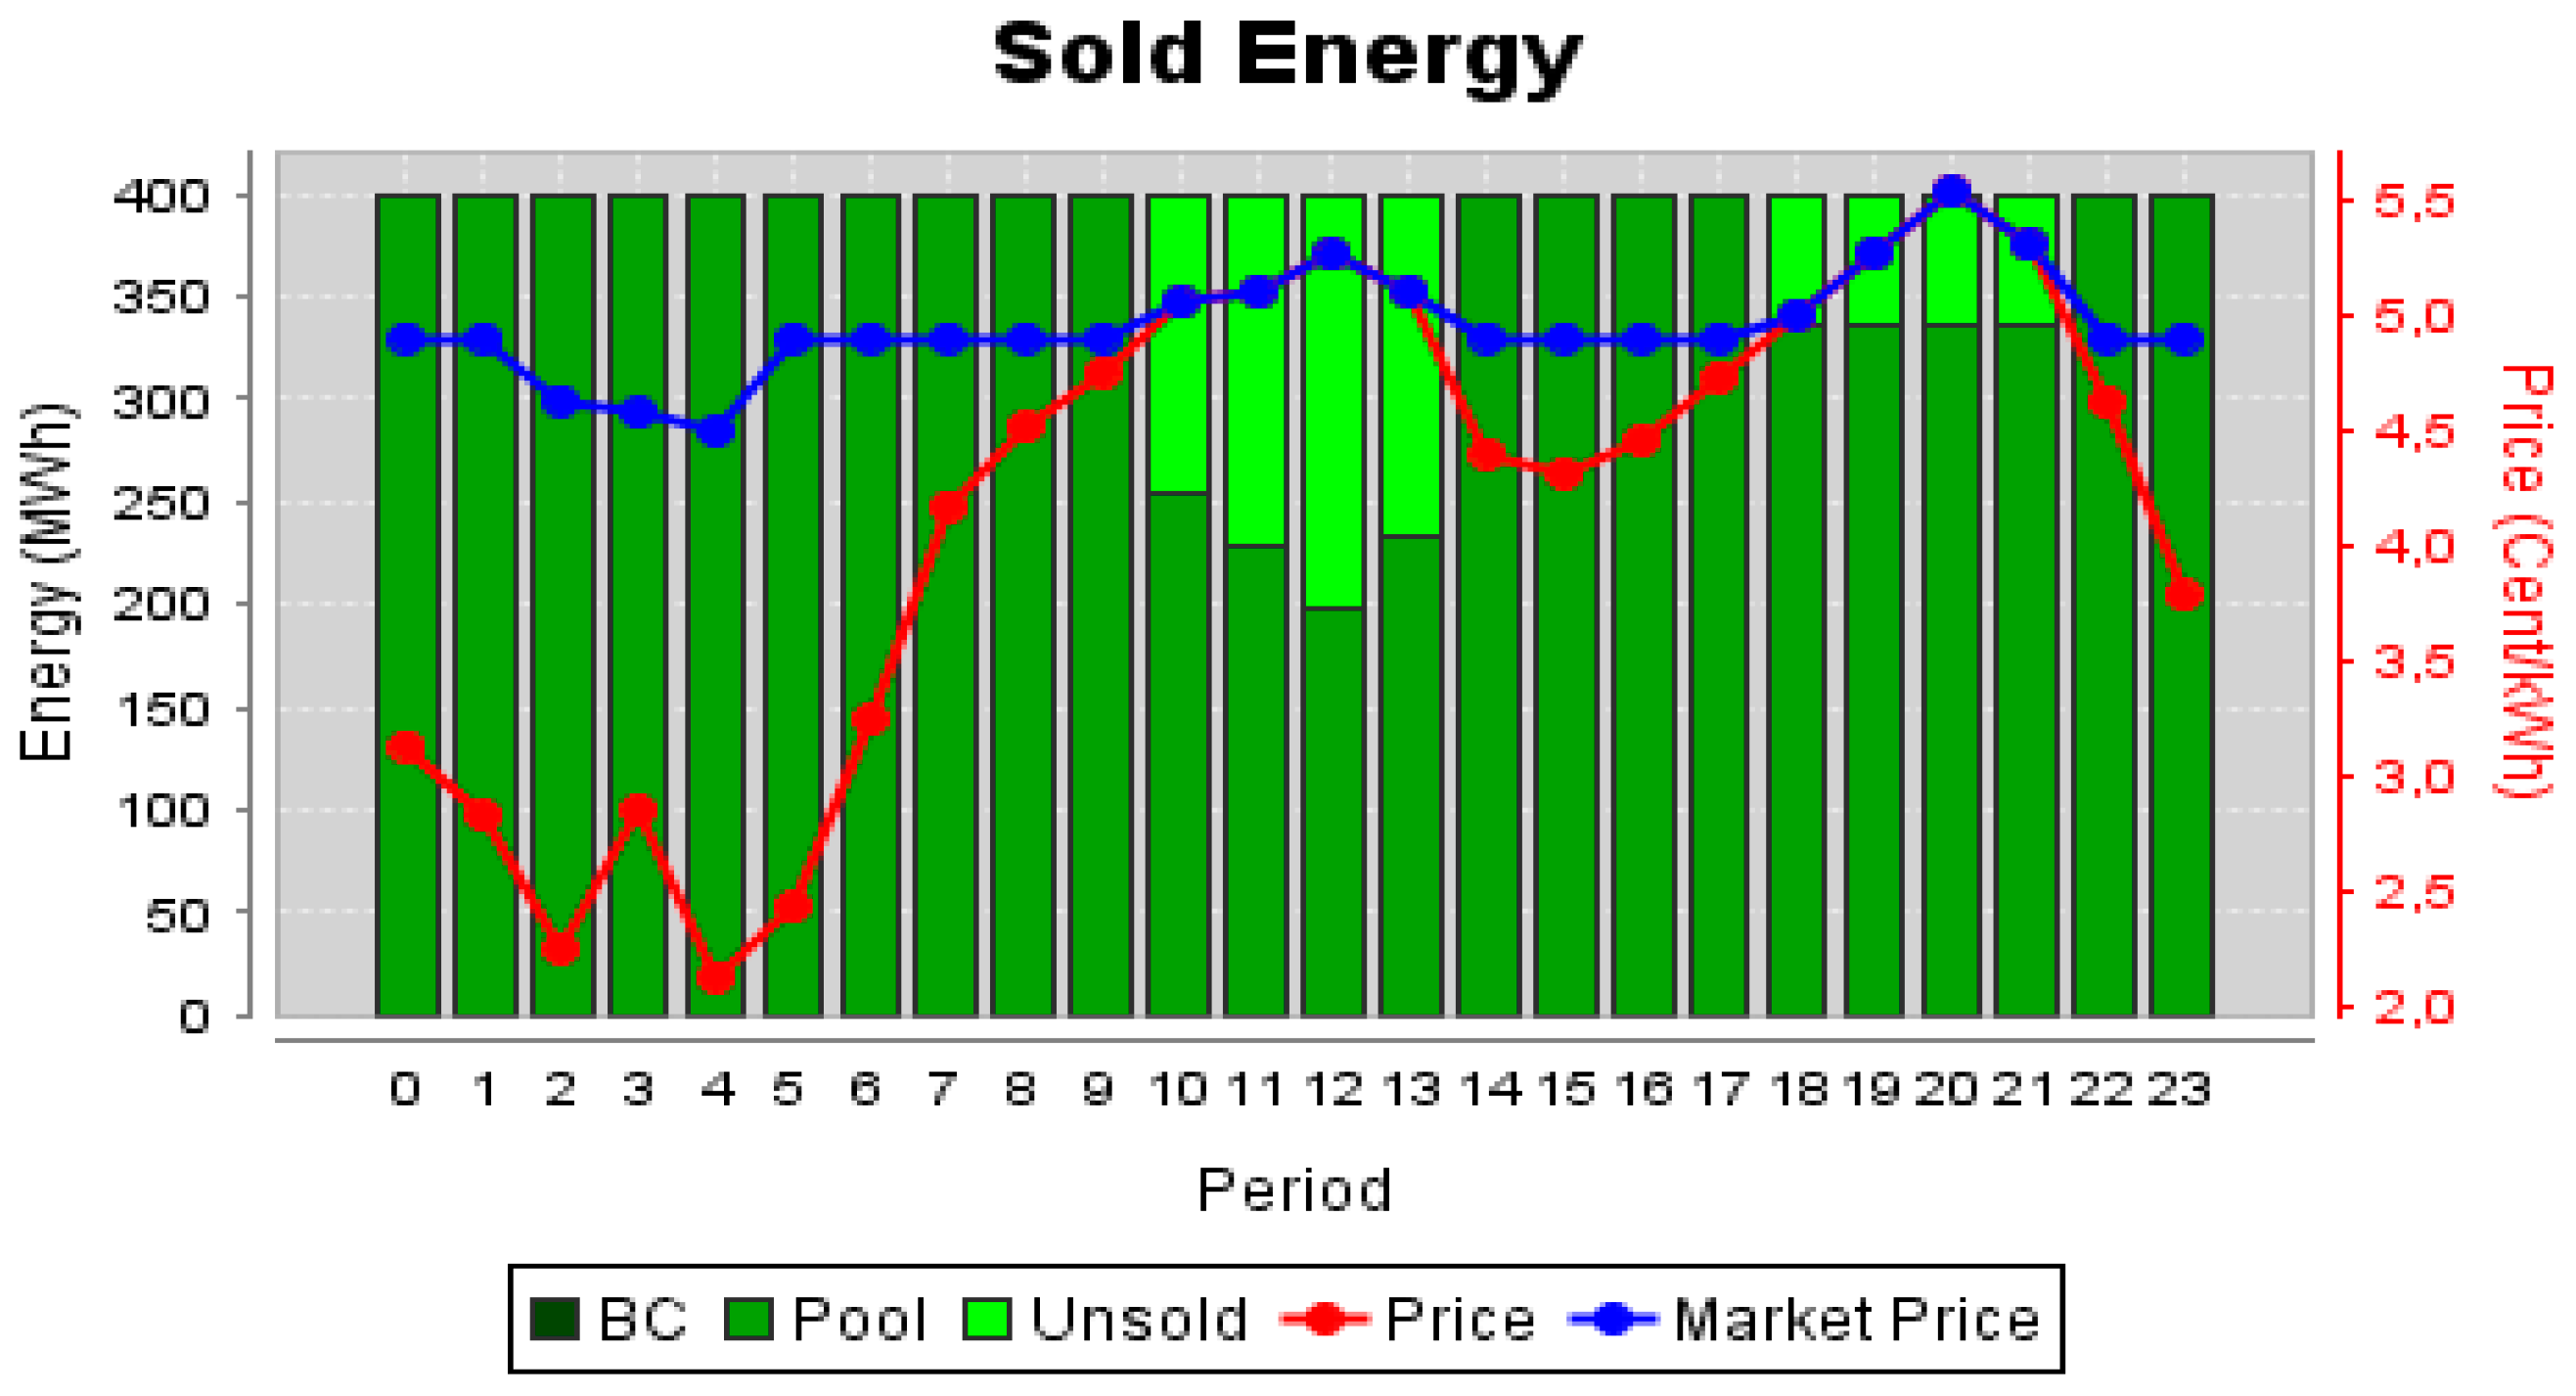
Figure 14 shows the simulation values for the first day of simulation.
The difference from the case presented in Figure 14 to the first day of the previous simulation (Figure 11) is that since there was no stop in production, the amount to pay for CO2 emissions will affect the offer made to the market, implying its increase to try to regain some of the money spent to buy emission allowances. Table 5 shows the influence of the buying of allowances in the bid price of Seller 2.
According to the values shown in Table 5, when the facility produces 584 MWh during 24 h, it emits about 479.60 tonnes of CO2 per hour, an amount that exceeds the average 310.85 assigned to it. As it cannot stay below the allocations, it will have to buy allowances amounting to € 4050.10, which is the difference between the emissions recorded and allocated, multiplied the average value of € 12 per tonne of CO2. With these data, it is estimated that the producer will have to pay approximately 0.6935 c€/kWh per hour. This value will be considered in the offer price of Seller 2 in the market.
Table 5 shows the value that the power producer will have to pay for emitting more CO2 than what is allowed. The considered amount of energy to sell on the market was 584 MWh. However, the value actually sold is far below, which allows us to infer that the fact that it increased the offer price has not contributed to the selling of a large part of the energy. Values with negative sign mean prejudice to the power producer, as it will have to recover the money lost in the carbon market. The values of the first column of the table are determined to take into consideration the values of the last column.

4.3. Strategy 3: Participation in the Hot Water and Steam Market

Strategy 3 considers the sale of steam produced by a cogeneration plant with an installed capacity of 400 MW. The remuneration from the sale of steam will be critical to enable Seller 2 to formulate offers below the price imposed by the market operator, to increase its odds to sell as much of the electricity produced in CHP plant as possible.
The remuneration gained with the sale of steam for each kWh of electricity produced is 2.85 c€. This value will allow Seller 2 to revise its bid on the second day of action in the electricity market. Similarly, to the previous strategies, two simulations will be presented for different days, the first simulation considers the bid prices without reducing the bid for the electricity market, based on the profit gained in the market for steam. The second, on the contrary, takes into account the value of 2.85 c€ per hour obtained by the sale of steam. 
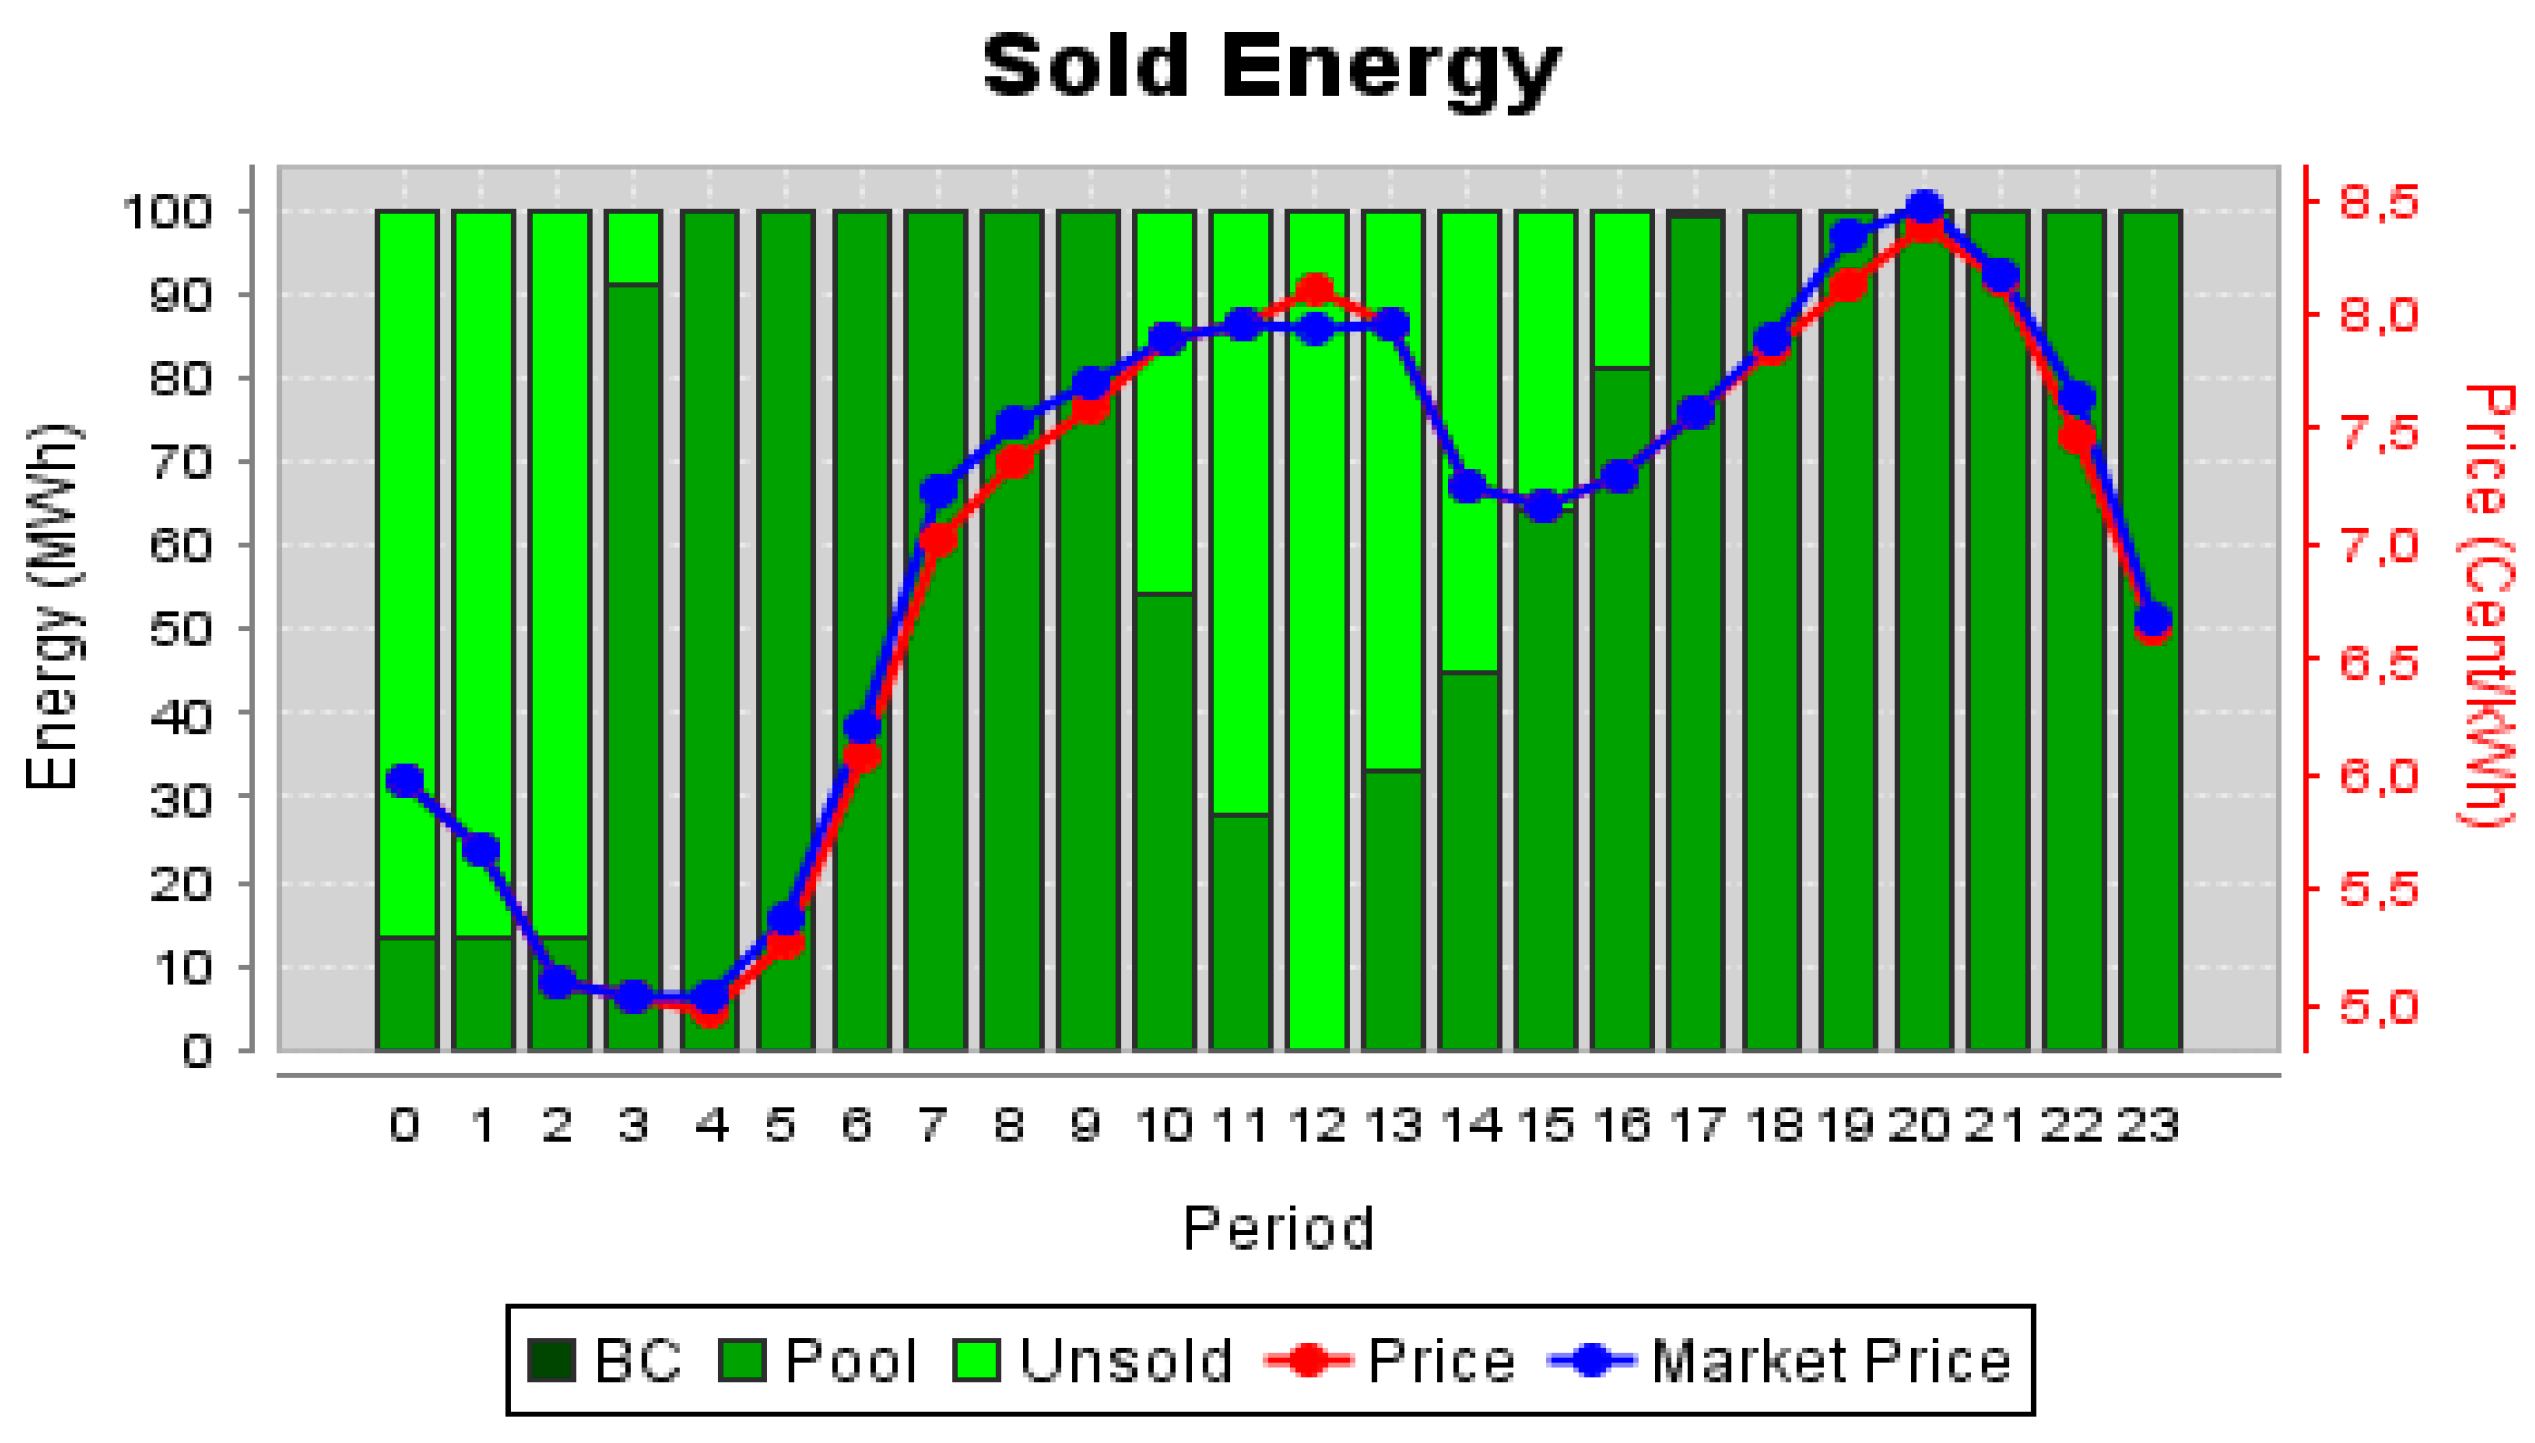
Figure 15 shows the results for Seller 2 when participating in the market, when not considering the participation in the steam sale.
The chart presented in Figure 15 shows the maximum energy that Seller 2 desires to sell, the price at which energy is sold and the amount of energy that is actually sold. Figure 16 shows the same information for the case of the profits with the steam sale being considered.
Analysing Figure 16 it is obvious that the results for this second case are much more advantageous for Seller 2. The reduction in the bid price allowed Seller 2 to sell practically all its available energy in every period. By showing the comparison between all sellers’ proposals in the electricity market, Figure 17 shows how the reduction in Seller 2′s bid price influenced the market results.
From Figure 17 one can see how Seller 2′s bid prices compare to the other sellers’ bids, enabling it to stay always bellow the market price, and therefore sell all of its available power at a higher price, except from periods 10 to 13. These simulations allow showing the success achieved by Seller 2 in the sale of most of the available energy. These results were possible only because of the profit gained with the sale of steam. Figure 18 presents the comparison between the total demand in the market and the demand that was, in fact, satisfied.
One can see in Figure 18 that Seller 2′s success also contributed to the almost total satisfaction of the market demand for this day. Table 6 shows the results for Seller 2 when performing the steam sale. By Table 6 one can see the gains achieved with the proposal for the first day (day n), values not considering the sale of steam; and the values won with the bid for the second day when the bid is reduced by a value of 2.85 c€, compared to the previous days, guaranteed by the sale steam. The bid for the second day (n + 1) is far more profitable for Seller 2 because it allowed the sale of more 5964 MW of energy than in day n. The total gain obtained by acting in the steam market is valued at € 351,705.14 while considering the offer n, the total gain would be only € 195,161.02.
Table 7 presents a sensitivity analysis on the influence of the steam market price and traded volume over the expected revenues of the player. This analysis considers as reference steam market price the 2.85 c€/kWh explained above (100%), and analyses the impact of the variation of this price up to 50% upwards and downwards. It also considers the influence of the traded volume, from 0% to 100% trading success.
From Table 7 one can see that the additional gain is high regardless of the producer’s generated amount. Since the steam can be sold in a complementary way to the electrical energy, generators can find a significant source of additional revenue with the sale of the water steam. The steam price variation has an obvious influence on the additional revenue that can be achieved, but this income is relevant even when the price drops to one half; hence suggesting that the participation in the water steam market should not be neglected.

5. Conclusions

The overall objective of this paper is to present the study on the impacts of complementary markets to the electricity market, realizing the advantages and disadvantages of acting in several markets simultaneously. Collecting and processing relevant data to this work has permitted the achievement of satisfactory and realistic results, defining the scope for the progress that a company can have by participating in the Guarantees of Origin Market, Carbon Market or the electricity generation and sale of steam and hot water.
The benefit for entering these secondary markets will be increased as the dimension that the power producer has in each market, i.e. producers with registered premises in the three referenced markets have a chance to get a bigger profit by selling energy than producers which have registered premises in only one.
With the general increase in energy consumption, it becomes crucial to bet in new production facilities to meet the demand. Production rates that an installation achieves throughout the day and how the primary energy is converted into electrical energy are crucial factors in obtaining a technically acceptable producer, with quality of service, and with high efficiency in power conversion.
The future focuses increasingly on the rational use of energy and is increasing the need to invest in production technologies with GHG emission levels ever smaller, using renewable resources such as solar, wind, water or even the endogenous resources as a primary energy source.
The creation of market strategies to register a total energy dispatch allows participating players to be compensated in the medium/long term of capital investment and maintenance costs of primary energy. The use of the MASCEM simulator allowed observing the evolution of each of the strategies drawn up within 24 h for each considered offer. This part was instrumental in the response to the strategies defined for each type of seller, giving valuable indications of the strategies that present the best performances in the market.
After the analysis of these three complementary markets and the strategies developed specifically for each, one can conclude that the one in which there was a greater cash flow was the second strategy, which allowed the producer of a thermoelectric plant to sell its allowances on the carbon market getting a significant profit that would be applied in the preparation of a more attractive offer in the electricity market to be able to sell the most of the energy produced in each period. The third strategy, referring to the sale of steam has proven to be advantageous as well, as it showed that the values achieved in this type of sale were sufficient to get a relevant income, which allowed an advantageous reduction in the electricity market bid, resulting in the achievement of higher incomes. In what concerns the Guarantees of Origin market, this is the one that represents a lower profit margin, as it is a market that is still underdeveloped and the number of certificates redeemed is much below the licenses issued, and so being verified that the earnings obtained by the sale of licenses are much lower than what would be measured in other markets.
This paper intends to show, based on realistic electricity market simulations using real data from the Iberian market, that the performance in various complementary markets can enable the power producer to obtain an extra profit that will be essential to cover the costs of production and maintenance of facilities.

Author Contributions

H.M. contributions are in the development of the main idea, in the definition of case-study and paper writing. T.P. contributed to the simulation implementation and data analysis. Z.V. contributions’ are in the definition of idea and main goals and the paper write and revision. All authors have read and agreed to the published version of the manuscript.

Funding

This research received no external funding.

Acknowledgments

This work was supported by national funds through FCT, Fundação para a Ciência e a Tecnologia, under projects UIDB/50021/2020, UIDB/00760/2020 and CEECIND/01811/2017. This work has also received funding from the EU Horizon 2020 research and innovation program under project DOMINOES (grant agreement No 771066).

Conflicts of Interest

The authors declare no conflict of interest.

References

  1. Hocaoglu, F.O.; Karanfil, F. Examining the link between carbon dioxide emissions and the share of industry in GDP: Modeling and testing for the G-7 countries. Energy Policy 2011, 39, 3612–3620. [Google Scholar] [CrossRef]
  2. Afonso, T.L.; Marques, A.C.; Fuinhas, J.A. Strategies to make renewable energy sources compatible with economic growth. Energy Strat. Rev. 2017, 18, 121–126. [Google Scholar] [CrossRef]
  3. Kittel, M.; Goeke, L.; Kemfert, C.; Oei, P.-Y.; Von Hirschhausen, C. Scenarios for Coal-Exit in Germany—A Model-Based Analysis and Implications in the European Context. Energies 2020, 13, 2041. [Google Scholar] [CrossRef] [Green Version]
  4. Passey, R.; Spooner, T.; MacGill, I.; Watt, M.; Syngellakis, K. The potential impacts of grid-connected distributed generation and how to address them: A review of technical and non-technical factors. Energy Policy 2011, 39, 6280–6290. [Google Scholar] [CrossRef]
  5. Upton, G.B.; Snyder, B.F. Funding renewable energy: An analysis of renewable portfolio standards. Energy Econ. 2017, 66, 205–216. [Google Scholar] [CrossRef]
  6. Nesta, L.; Vona, F.; Nicolli, F. Environmental policies, competition and innovation in renewable energy. J. Environ. Econ. Manag. 2014, 67, 396–411. [Google Scholar] [CrossRef]
  7. Schusser, S.; Jaraite, J. Explaining the interplay of three markets: Green certificates, carbon emissions and electricity. Energy Econ. 2018, 71, 1–13. [Google Scholar] [CrossRef] [Green Version]
  8. Chao, H.-P. Efficient pricing and investment in electricity markets with intermittent resources. Energy Policy 2011, 39, 3945–3953. [Google Scholar] [CrossRef]
  9. Hu, J.; Harmsen, R.; Crijns-Graus, W.; Worrell, E.; Broek, M.V.D. Identifying barriers to large-scale integration of variable renewable electricity into the electricity market: A literature review of market design. Renew. Sustain. Energy Rev. 2018, 81, 2181–2195. [Google Scholar] [CrossRef]
  10. Pinto, T.; Morais, H.; Oliveira, P.; Vale, Z.; Praça, I.; Ramos, C. A new approach for multi-agent coalition formation and management in the scope of electricity markets. Energy 2011, 36, 5004–5015. [Google Scholar] [CrossRef] [Green Version]
  11. Santos, G.; Pinto, T.; Praça, I.; Vale, Z. MASCEM: Optimizing the performance of a multi-agent system. Energy 2016, 111, 513–524. [Google Scholar] [CrossRef] [Green Version]
  12. Europen Comission. EU Emissions Trading System (EU ETS). 2020. Available online: https://ec.europa.eu/clima/policies/ets_en (accessed on 20 February 2020).
  13. Europen Comission. Going Climate-Neutral by 2050 A Strategic Long-Term Vision for a Prosperous, Modern, Competitive and Climate-Neutral EU Economy. 2019. Available online: https://op.europa.eu/en/publication-detail/-/publication/92f6d5bc-76bc-11e9-9f05-01aa75ed71a1/language-en/format-PDF (accessed on 21 February 2020).
  14. Ciarreta, A.; Espinosa, M.P.; Pizarro-Irizar, C. Optimal regulation of renewable energy: A comparison of Feed-in Tariffs and Tradable Green Certificates in the Spanish electricity system. Energy Econ. 2017, 67, 387–399. [Google Scholar] [CrossRef]
  15. Voogt, M.; Boots, M.; Schaeffer, G.; Martens, J. Renewable Electricity in a Liberalised Market—The Concept of Green Certificates. Energy Environ. 2000, 11, 65–79. [Google Scholar] [CrossRef]
  16. AIB. AIB_Home. 2020. Available online: http://www.aib-net.org/portal/page/portal/AIB_HOME (accessed on 21 February 2020).
  17. AIB. AIB—ANNUAL REPORT 2018. 2018. Available online: https://www.aib-net.org/sites/default/files/assets/news-events/annual-reports/AIBAnnualReport2018_web20191021.pdf (accessed on 21 February 2020).
  18. Holland, S.P.; Moore, M.R. Market design in cap and trade programs: Permit validity and compliance timing. J. Environ. Econ. Manag. 2013, 66, 671–687. [Google Scholar] [CrossRef]
  19. Rabe, M.; Štreimikienė, D.; Bilan, Y. EU Carbon Emissions Market Development and Its Impact on Penetration of Renewables in the Power Sector. Energies 2019, 12, 2961. [Google Scholar] [CrossRef] [Green Version]
  20. EEA. Trends and Projections in the EU ETS in 2018The EU Emissions Trading System in Numbers. 2018. Available online: https://www.eea.europa.eu/publications/trends-and-projections-in-the (accessed on 22 February 2020).
  21. Bruckner, T.; Fulton, L.; Hertwich, E.; McKinnon, A.; Perczyk, D.; Roy, J.; Schaeffer, R.; Schlömer, S.; Sims, R.; Smith, P.; et al. Technology-specific Cost and Performance Parameters. Clim. Chang. 2014, 1329–1356. Available online: https://www.ipcc.ch/site/assets/uploads/2018/02/ipcc_wg3_ar5_annex-iii.pdf (accessed on 22 February 2020).
  22. Tomofuji, D.; Morimoto, Y.; Sugiura, E.; Ishii, T.; Akisawa, A. The prospects of the expanded diffusion of cogeneration to 2030—Study on new value in cogeneration. Appl. Therm. Eng. 2017, 114, 1403–1413. [Google Scholar] [CrossRef]
  23. Nosrat, A.; Pearce, J.M. Dispatch strategy and model for hybrid photovoltaic and trigeneration power systems. Appl. Energy 2011, 88, 3270–3276. [Google Scholar] [CrossRef] [Green Version]
  24. Steinbuks, J.; Neuhoff, K. Assessing energy price induced improvements in efficiency of capital in OECD manufacturing industries. J. Environ. Econ. Manag. 2014, 68, 340–356. [Google Scholar] [CrossRef] [Green Version]
  25. Fell, H.; Linn, J. Renewable electricity policies, heterogeneity, and cost effectiveness. J. Environ. Econ. Manag. 2013, 66, 688–707. [Google Scholar] [CrossRef] [Green Version]
  26. Morcillo, J.D.; Franco, C.J.; Angulo, F. Delays in electricity market models. Energy Strat. Rev. 2017, 16, 24–32. [Google Scholar] [CrossRef]
  27. Negrete-Pincetic, M.; Wang, G.; Arancibia, M.; Kowli, A.; Shafieepoorfard, E.; Meyn, S.P. The value of volatile resources in electricity markets. Sustain. Energy Grids Networks 2017, 11, 46–57. [Google Scholar] [CrossRef]
  28. Pinto, T.; Vale, Z.; Sousa, T.; Praça, I.; Santos, G.; Morais, H. Adaptive learning in agents behaviour: A framework for electricity markets simulation. Integr. Comput. Eng. 2014, 21, 399–415. [Google Scholar] [CrossRef] [Green Version]
  29. Vale, Z.; Pinto, T.; Praça, I.; Morais, H. MASCEM: Electricity Markets Simulation with Strategic Agents. IEEE Intell. Syst. 2011, 26, 9–17. [Google Scholar] [CrossRef] [Green Version]
  30. Praça, I.; Ramos, C.; Vale, Z.; Cordeiro, M. MASCEM: A multiagent system that simulates competitive electricity markets. IEEE Intell. Syst. 2003, 18, 54–60. [Google Scholar] [CrossRef]
  31. Pinto, T.; Morais, H.; Sousa, T.M.; Sousa, T.; Vale, Z.; Praca, I.; Faia, R.; Pires, E.J.S. Adaptive Portfolio Optimization for Multiple Electricity Markets Participation. IEEE Trans. Neural Netw. Learn. Syst. 2016, 27, 1720–1733. [Google Scholar] [CrossRef] [PubMed]
Figure 1. Electric Energy Market and Guarantees of Origin Market, adapted from [14].
Energies 13 02808 g001
Figure 2. Working principle of a green certificate system, adapted from [15].
Energies 13 02808 g002
Figure 3. Certificates issued, traded and cancelled in Europe [17].
Energies 13 02808 g003
Figure 4. Representative scheme of allowances at auction.
Energies 13 02808 g004
Figure 5. CO2 emissions directly (fuel combustion) and indirectly (plant manufacturing, maintenance and fuel supply process) in the production of electricity [21].
Energies 13 02808 g005
Figure 6. Comparison between the production cycle of a power plant and a cogeneration plant [23].
Energies 13 02808 g006
Figure 7. MASCEM negotiation framework [30].
Energies 13 02808 g007
Figure 8. Energy sold on the market when not participating in the Guarantees of Origin certificate market.
Energies 13 02808 g008
Figure 9. Evolution of the sellers’ offer price and the market price.
Energies 13 02808 g009
Figure 10. Energy sold on the market considering the results of Guarantees of Origin market.
Energies 13 02808 g010
Figure 11. Energy sold on the market by Seller 2 in the first day.
Energies 13 02808 g011
Figure 12. Energy sold on the market by Seller 2 on the second day.
Energies 13 02808 g012
Figure 13. Satisfied market demand.
Energies 13 02808 g013
Figure 14. Energy sold on the market by Seller 2, when participating exclusively in the electricity market.
Energies 13 02808 g014
Figure 15. Energy sold on the market not considering the steam sale.
Energies 13 02808 g015
Figure 16. Energy sold on the market considering the results of the steam sale.
Energies 13 02808 g016
Figure 17. Evolution of sellers’ bids and market price during the simulation day.
Energies 13 02808 g017
Figure 18. Satisfaction of the market demand in strategy 3.
Energies 13 02808 g018
Table 1. Agents Strategies.
AgentDescription
Buyer 1This buyer intends to buy energy independently of the market price. For this, Buyer 1 offers to the maximum limit. In the case of MIBEL is 18.30 c€/kWh
Buyer 2Buy bid price is 10.00 c€/kWh
Buyer 3Buy bid price is 4.90 c€/kWh
Buyer 4Average prices of previous 4 day week (Wednesday in present simulation)
Buyer 5Average price of the last 4 months
Buyer 6Average price of the last 5 working days
Seller 1Sell bid price is 0.00 c€/kWh. The main goal is to sell all the power generation
Seller 2Average between the average market price of the last 4 months and the average market price of the last 5 working days
Seller 3Average between the average market price of the last 4 months plus 0.50 c€/kWh
VPP1The VPP 1 aggregates 3 wind farms offering a fixed value of 3.50 c€/kWh. Since VPP 1 aggregate only wind farms, the marginal price of generation is 0 c€/kWh. The price of 3.50 c€/kWh is defined considering the strategic behaviour of VPP1 since can have some market power. It is important to mention that, in this case study, the number of sellers is limited. In a market with more competition, the bidding price of this type of VPPs should be near the marginal price
VPP2The VPP 2 aggregates 4 generation units with different technologies: photovoltaic plant, wind farm, CHP and mini-hydro; the offer price is based on generation costs of co-generation and the total forecasted production. The VPP 2 can do multiple offers, one for each type of technology. However, aggregating all the resources in one single offer, the VPP 2 increase the power of this offer (some markets have limits) and will reduce the risk of settlement penalties.
Table 2. Results of the offer made by Seller 2 in the second simulation.
PeriodElectricity Market OfferGuarantees of Origin Market
Offer nSold Energy (MWh)Reference Price (c€/kWh)Income (€)
Power (MW)Price (c€/kWh)
11005.98130.00481650.63
21005.67130.63
31005.10130.63
41005.04914.38
51004.981004.82
61005.281004.82
71006.091004.82
81007.021004.82
91007.361004.82
101007.601004.82
111007.90542.60
121007.95281.35
131008.1100
141007.95331.59
151007.25452.17
161007.16643.08
171007.3813.90
181007.58994.77
191007.851004.82
201008.121004.82
211008.381004.82
221008.151004.82
231007.471004.82
241006.631004.82
Table 3. Extra revenue obtained by selling Guarantees of Origin certificates (in €).
Redeemed Certificates (%)0102030405060708090100
Reference Price (c€/kWh)00.0010.0020.0030.0040.0050.0060.0070.0080.0090.01
Sold Energy (%)1000.00240.00480.00720.00960.001200.001440.001680.001920.002160.002400.00
900.00216.00432.00648.00864.001080.001296.001512.001728.001944.002160.00
800.00192.00384.00576.00768.00960.001152.001344.001536.001728.001920.00
700.00168.00336.00504.00672.00840.001008.001176.001344.001512.001680.00
600.00144.00288.00432.00576.00720.00864.001008.001152.001296.001440.00
500.00120.00240.00360.00480.00600.00720.00840.00960.001080.001200.00
400.0096.00192.00288.00384.00480.00576.00672.00768.00864.00960.00
300.0072.00144.00216.00288.00360.00432.00504.00576.00648.00720.00
200.0048.0096.00144.00192.00240.00288.00336.00384.00432.00480.00
100.0024.0048.0072.0096.00120.00144.00168.00192.00216.00240.00
00.000.000.000.000.000.000.000.000.000.000.00
Table 4. Energy trade values.
PeriodOffer nOffer n + 1
Offered SoldOfferedSold
Power (MW)Price (c€/kWh)Energy (MWh)Incomes (€)Power (MW)Price (c€/kWh)Energy (MWh)Incomes (€)
15845.9813777.695845.0521310,759.82
25845.6713737.135844.7440318,100.32
35845.1013663.115844.1740316,805.76
45845.04914588.355844.1143117,720.28
55844.981035132.175844.0544317,950.29
65845.281156073.155844.3545519.793,82
75846.091217371.025845.1627113,986.42
85847.0219013,333.305846.0928017,043.08
95847.3618813,832.845846.4327817,867.57
105847.6021416,273.785846.6730420,288.53
115847.90544264.865846.9725417,696.65
125847.95282224.815847.0222815,994.26
135848.1100.005847.1819814,206.59
145847.95332624.265847.0223316,360.29
155847.25453260.675846.3224515, 472.31
165847.16644580.205846.2326416,436.25
175847.3815913.575846.3728117,899.67
185847.58997503.015846.6529919,877.77
195847.8513510,591.535846.9133523,164.80
205848.1224519,904.725847.1933524,098.78
215848.3824520,539.855847.4533524,967.22
225848.1524519,968.695847.2233524,186.25
235847.4718313,666.555846.5433321,769.38
245846.6317111,335.765845.7032118,291.83
Table 5. Allowances’ influence on energy production prices.
PeriodPrice (c€/kWh)Expected Emissions (tonCO2/h)Attributed (tonCO2/h)Purchase of Licences (€)Impact in the Price Offer (c€/kWh)
Power (MW)Price (c€/kWh)
15845.98479.60310.854050.100.69351
25845.67479.60310.854050.100.69351
35845.10479.60310.854050.100.69351
45845.04479.60310.854050.100.69351
55844.98479.60310.854050.100.69351
65845.28479.60310.854050.100.69351
75846.09479.60310.854050.100.69351
85847.02479.60310.854050.100.69351
95847.36479.60310.854050.100.69351
105847.60479.60310.854050.100.69351
115847.90479.60310.854050.100.69351
125847.95479.60310.854050.100.69351
135848.11479.60310.854050.100.69351
145847.95479.60310.854050.100.69351
155847.25479.60310.854050.100.69351
165847.16479.60310.854050.100.69351
175847.3479.60310.854050.100.69351
185847.58479.60310.854050.100.69351
195847.85479.60310.854050.100.69351
205848.12479.60310.854050.100.69351
215848.38479.60310.854050.100.69351
225848.15479.60310.854050.100.69351
235847.47479.60310.854050.100.69351
245846.63479.60310.854050.100.69351
Table 6. Comparison between the values of the bids and the gains using strategy 3.
PeriodDay nDay n + 1
Offered SoldOfferedSold
Power (MW)Price (c€/kWh)Energy (MWh)Incomes (€)Power (MW)Price (c€/kWh)Energy (MWh)Incomes (€)
14005.9813777.694003.1340012,529.08
24005.6713737.134002.8240011,280.98
34005.1013663.114002.254009,003.50
44005.04914588.354002.8540011,400.00
54004.981035132.174002.134008,530.78
64005.281156073.154002.434009,724.00
74006.091217371.024003.2440012,967.00
84007.0219013,333.304004.1740016,670.10
94007.3618813,832.844004.5140018,031.58
104007.6021416,273.784004.7540019,018.28
114007.90544264.864005.0525412,821.65
124007.95282224.814005.1022811,618.28
134008.1100.004005.2619810,406.40
144007.95332624.264005.1023311,888.34
154007.25453260.674004.4040017,583.75
164007.16644580.204004.3140017,226.25
174007.3815913.574004.4540017,802.80
184007.58997503.014004.7340018,915.18
194007.8513510,591.534005.0033516,735.18
204008.1224519,904.724005.2733517,669.16
214008.3824520,539.854005.5333518,537.60
224008.1524519,968.694005.3033517,756.63
234007.4718313,666.554004.6240018,472.25
244006.6317111,335.764003.7840015,116.40
Table 7. Extra revenue obtained by participating in the steam market (in €).
Reference Steam Price (%)
5060708090100110120130140150
Sold Energy (%)10013681642191521892462273630103283355738304104
9012311477172419702216246227092955320134473694
8010941313153217511970218924082627284530643283
709581149134115321724191521072298249026812873
60821985114913131477164218061970213422982462
5068482195810941231136815051642177819152052
40547657766876985109412041313142315321642
30410492575657739821903985106711491231
20274328383438492547602657711766821
10137164192219246274301328356383410
000000000000

