Article

A Systematic PVQV-Curves Approach for Investigating the Impact of Solar Photovoltaic-Generator in Power System Using PowerWorld Simulator

by
Abdullahi Oboh Muhammed
* and
Muhyaddin Rawa
Center of Research Excellence in Renewable Energy and Power Systems, Department of Electrical and Computer Engineering, Faculty of Engineering, K. A. CARE Energy Research and Innovation Center, King Abdulaziz University, Jeddah 21589, Saudi Arabia
*
Author to whom correspondence should be addressed.
Energies 2020, 13(10), 2662; https://doi.org/10.3390/en13102662
Submission received: 13 April 2020 / Revised: 6 May 2020 / Accepted: 22 May 2020 / Published: 25 May 2020
(This article belongs to the Section F: Electrical Engineering)

Abstract

:
With the recent growing interest in renewable energy integrated power systems across the globe for the various economic and environmental benefits, it is also significant to consider their influence on voltage stability in power systems. Therefore, this paper reports the static voltage stability impact of solar photovoltaic generation on power networks using PowerWorld simulator power-voltage (P–V)- and voltage-reactive power (V–Q)-curves to investigate the renewable energy generator model performance suitability. The impact of varying power factor control and static voltage droop control of a photovoltaic plant on the maximum generated power, threshold voltage profile and reactive power marginal loading has been examined. Besides, the concept of percentage change in voltage-power sensitivity has been systematically utilized to determine the optimal location for the solar photovoltaic generator on the power grid and the feasible penetrations have been defined for selected system buses. From the simulation results it can be concluded that in a steady-state analysis of the grid integrated power system the effects of power factor (pf) control and voltage droop control should be considered by power grid engineers for effective system operation and, equally, the application of percentage change in voltage-power sensitivity should be extended to real networks to determine the best positions for multiple installations of renewable energy resources.

Graphical Abstract

1. Introduction

Currently, the interest in renewable energy sources (RESs) integration in power systems in many countries all over the world is fast rising due to the significant shortage and/or price increase of fossil fuel and the need to avoid the harmful effects of global climate change [1,2]. It is required that the universal temperature increase should be lower than 2 °C and the maximum temperature rise being limited to 1.5 °C in comparison to the preindustrial level [3]. The use of renewable energy resources in world energy systems to realize these aims, and the reduction of global warming has been recognized. Recent developments in renewable energy technologies have availed various sustainable options. This has resulted in the ease of issuance of the Renewable Energy Law to incentivize government, industry or many cities around the globe to commence the inclusion of renewable energy programs in their domains to achieve sustainable development and environmental protection [4]. Thus, the world’s renewable energy generations and their integration levels in conventional power grids are rising speedily [5]. For example, to mention but a few, It is recorded that 25% of the energy required to meet electricity demand in Germany can now be obtained from renewable energy sources as against 5% about 20 years ago [6]. In Australia, effort at increasing both wind and solar power penetration levels to achieve the 20% renewable energy target by 2020 proposed by the National Renewable Energy Target (RET) scheme is well underway [7]. Additionally, in Turkey, the contribution of renewable energy generation was 6% in 2015 and the proportion of renewable energy generation is expected to grow to at least 30% in 2023 [8]. Reference [9] asserts that Saudi Arabia Vision 2030 aims to generate about 9.5 GW of power from renewable energy sources by 2023 and solar photovoltaic (PV) generation will constitute a major portion.
However, the role of solar energy sources being the third largest renewable power source in the world, (after wind energy and hydropower being the second and first largest renewable sources respectively), with photovoltaic (PV) technology is becoming one of the most promising energy sources in most countries. This is because the sun energy is largely accessible to everyone and it is a clean, abundant and sustainable energy source [10]. Currently, medium and large-scale grid-connect PV systems are more dominant in the USA, China and Germany medium among other countries [11]. PV technologies consist of photovoltaic cells, which convert incident solar radiation into DC energy [12,13]. Grid-connected solar photovoltaic generator (SPVG), as well as the other distributed renewable energy generations, can be used in modern power grids, for peak-shaving, strengthening local network and generation of power close to the consumers [14]. Even though SPVG output tallies well with peak load demand, there is a need to understand the characteristics of some of the model controls (also applicable to other forms of dispersed generation), which in part make these generators’ capabilities intrinsically different from those of conventional generator. To ensure the operation of these resources in power grids does not jeopardize its stability, an extensive study is needed to evaluate its influence on the power system static or dynamic stability based on suitable controls with which the best installation site can be determined. Since large-scale RESs, for example, solar plants, which penetrate in the grid without enough reactive power compensation, or renewable energy generators (REGs) situated far from load centers or connected to the system weak zone can impact adversely on the system security and stability [15,16]. Additionally, the central station or distributed solar photovoltaic generator (SPVG) for example has a power electronic converter that supplies reactive power for grid voltage control at a specific power factor [17,18]. Besides, REG voltage control capability is less compared to the conventional synchronous generator’s and when the voltage control capability is less than the system requirement, the grid may become unstable. Thus, the impacts of grid-connected RES on system voltage stability should be well studied [19,20]. Voltage stability is defined as the ability of the power system to maintain steady acceptable voltages at all buses in the network under normal operating conditions or after being subjected to a disturbance [21,22,23]. The level of voltage stability in the power system is mostly based on the strength of the network and the size of power transfer. Reference [24] states that power system voltage can also be affected by load and reactive power compensation device features, voltage control devices and generator reactive power capability. Static voltage stability can be studied using modal analysis, the continuation method, the optimization method, etc.
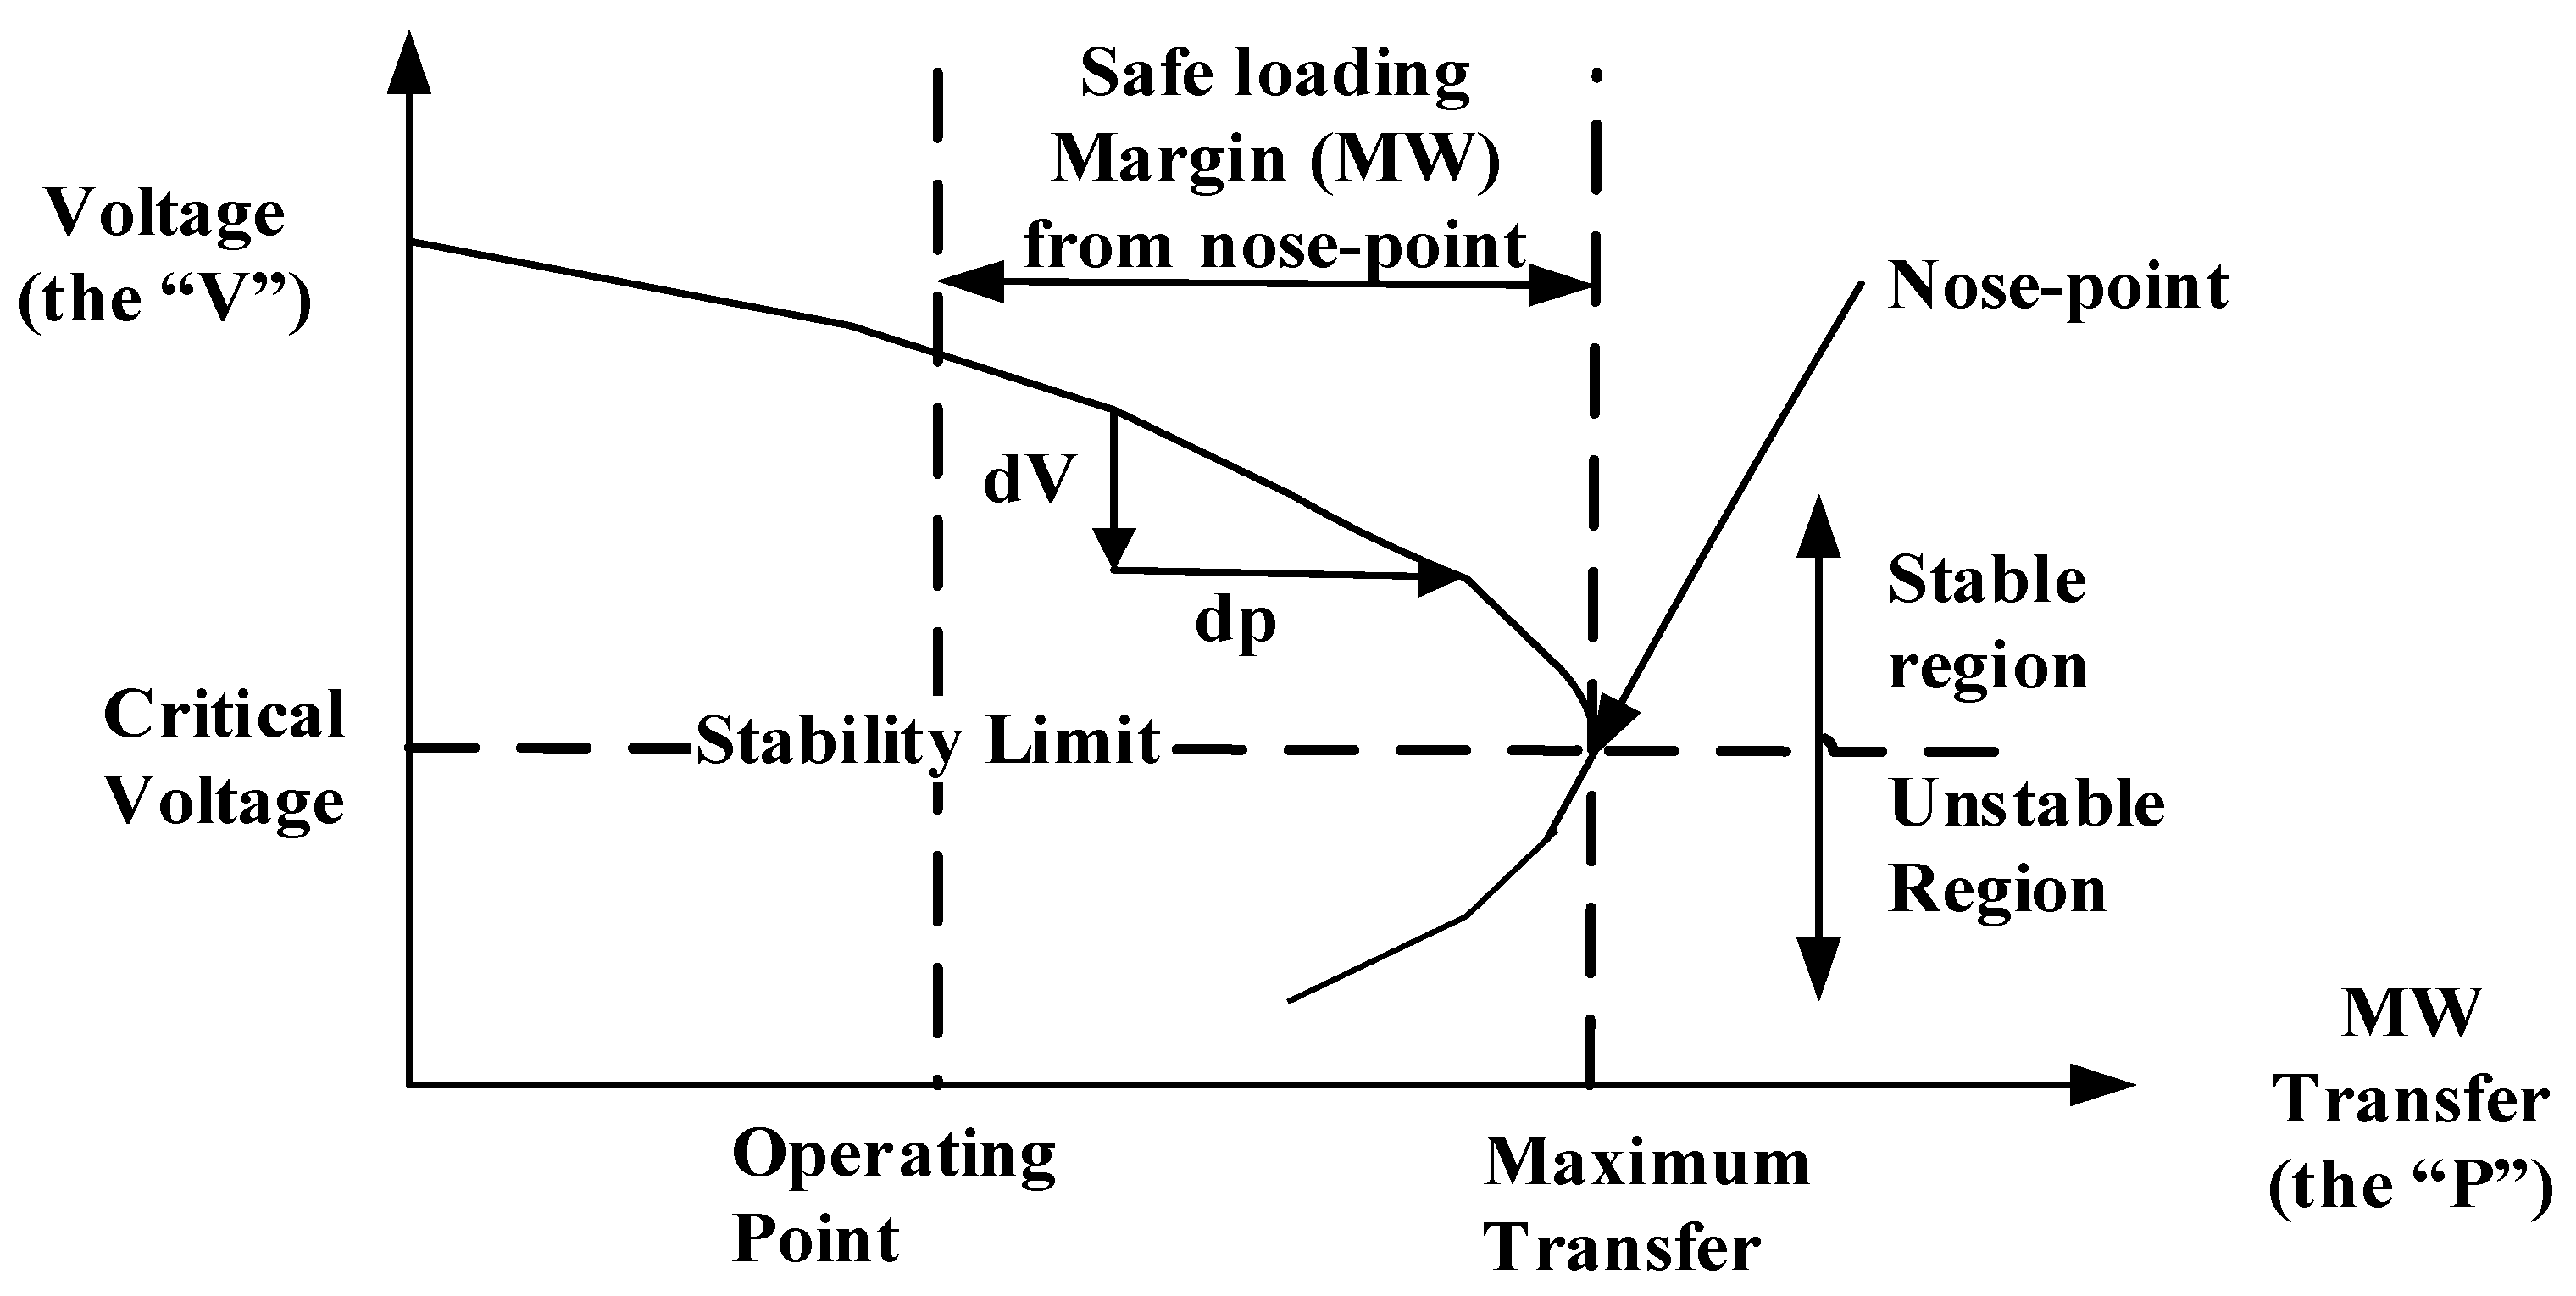
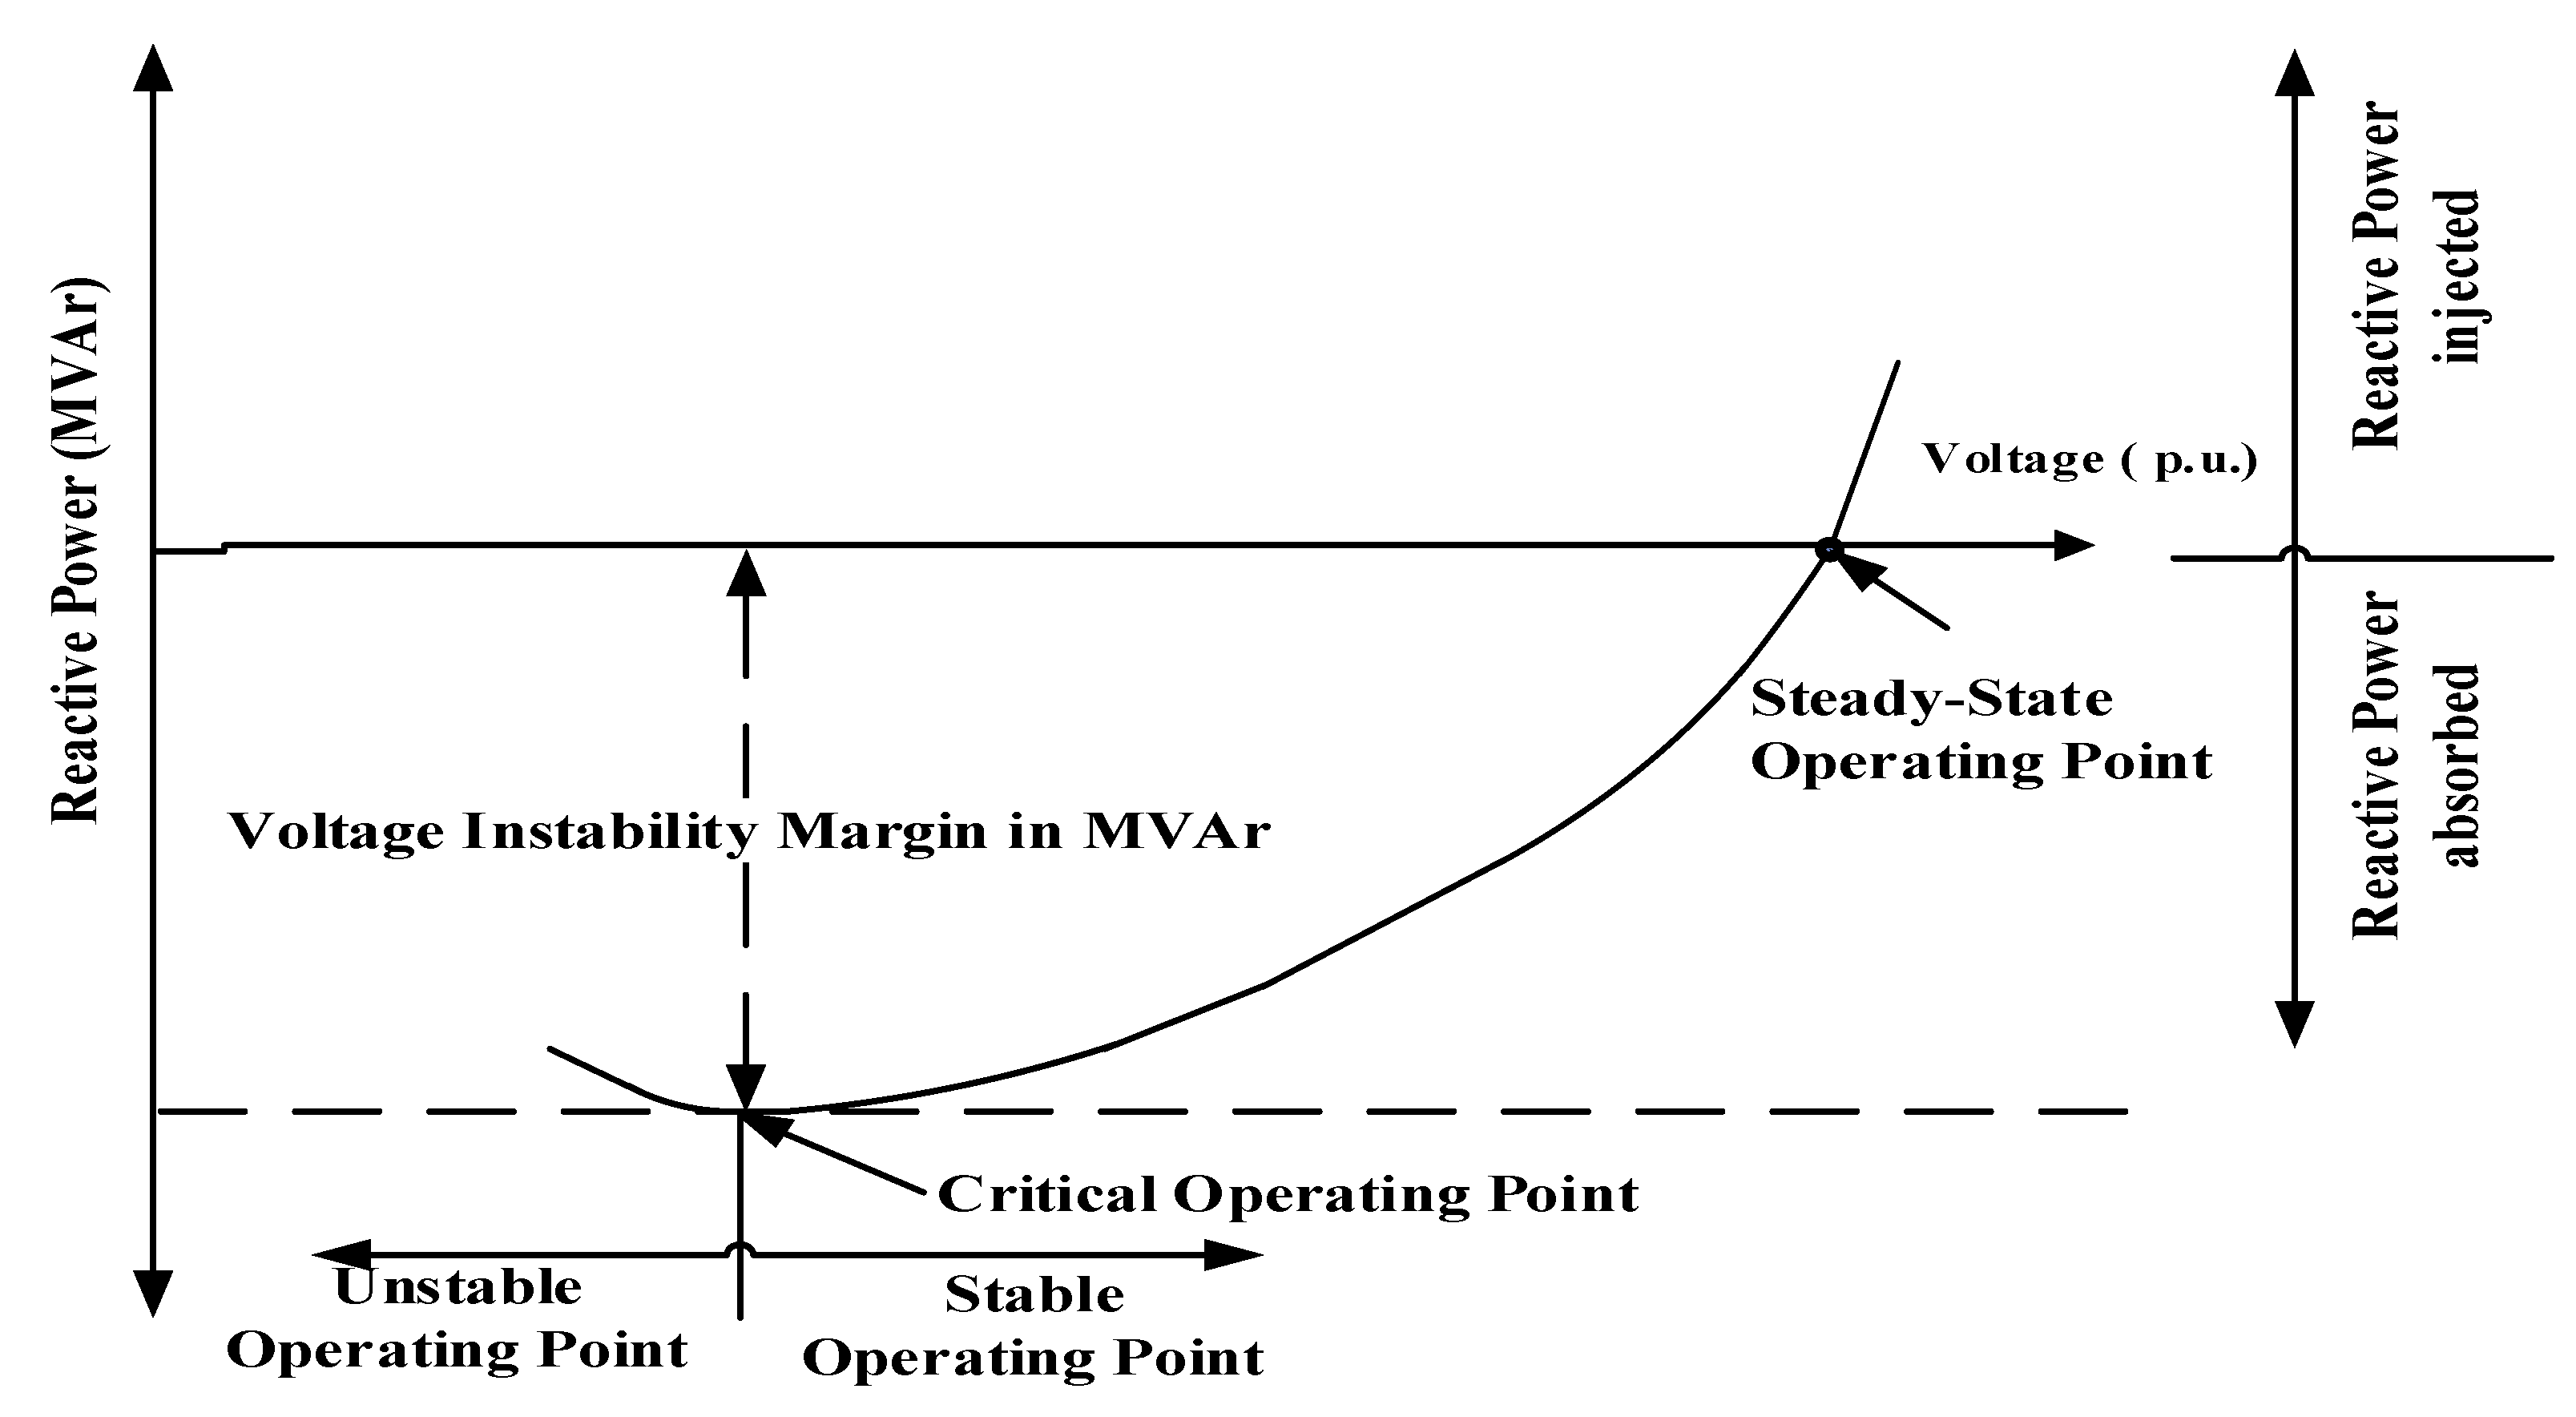
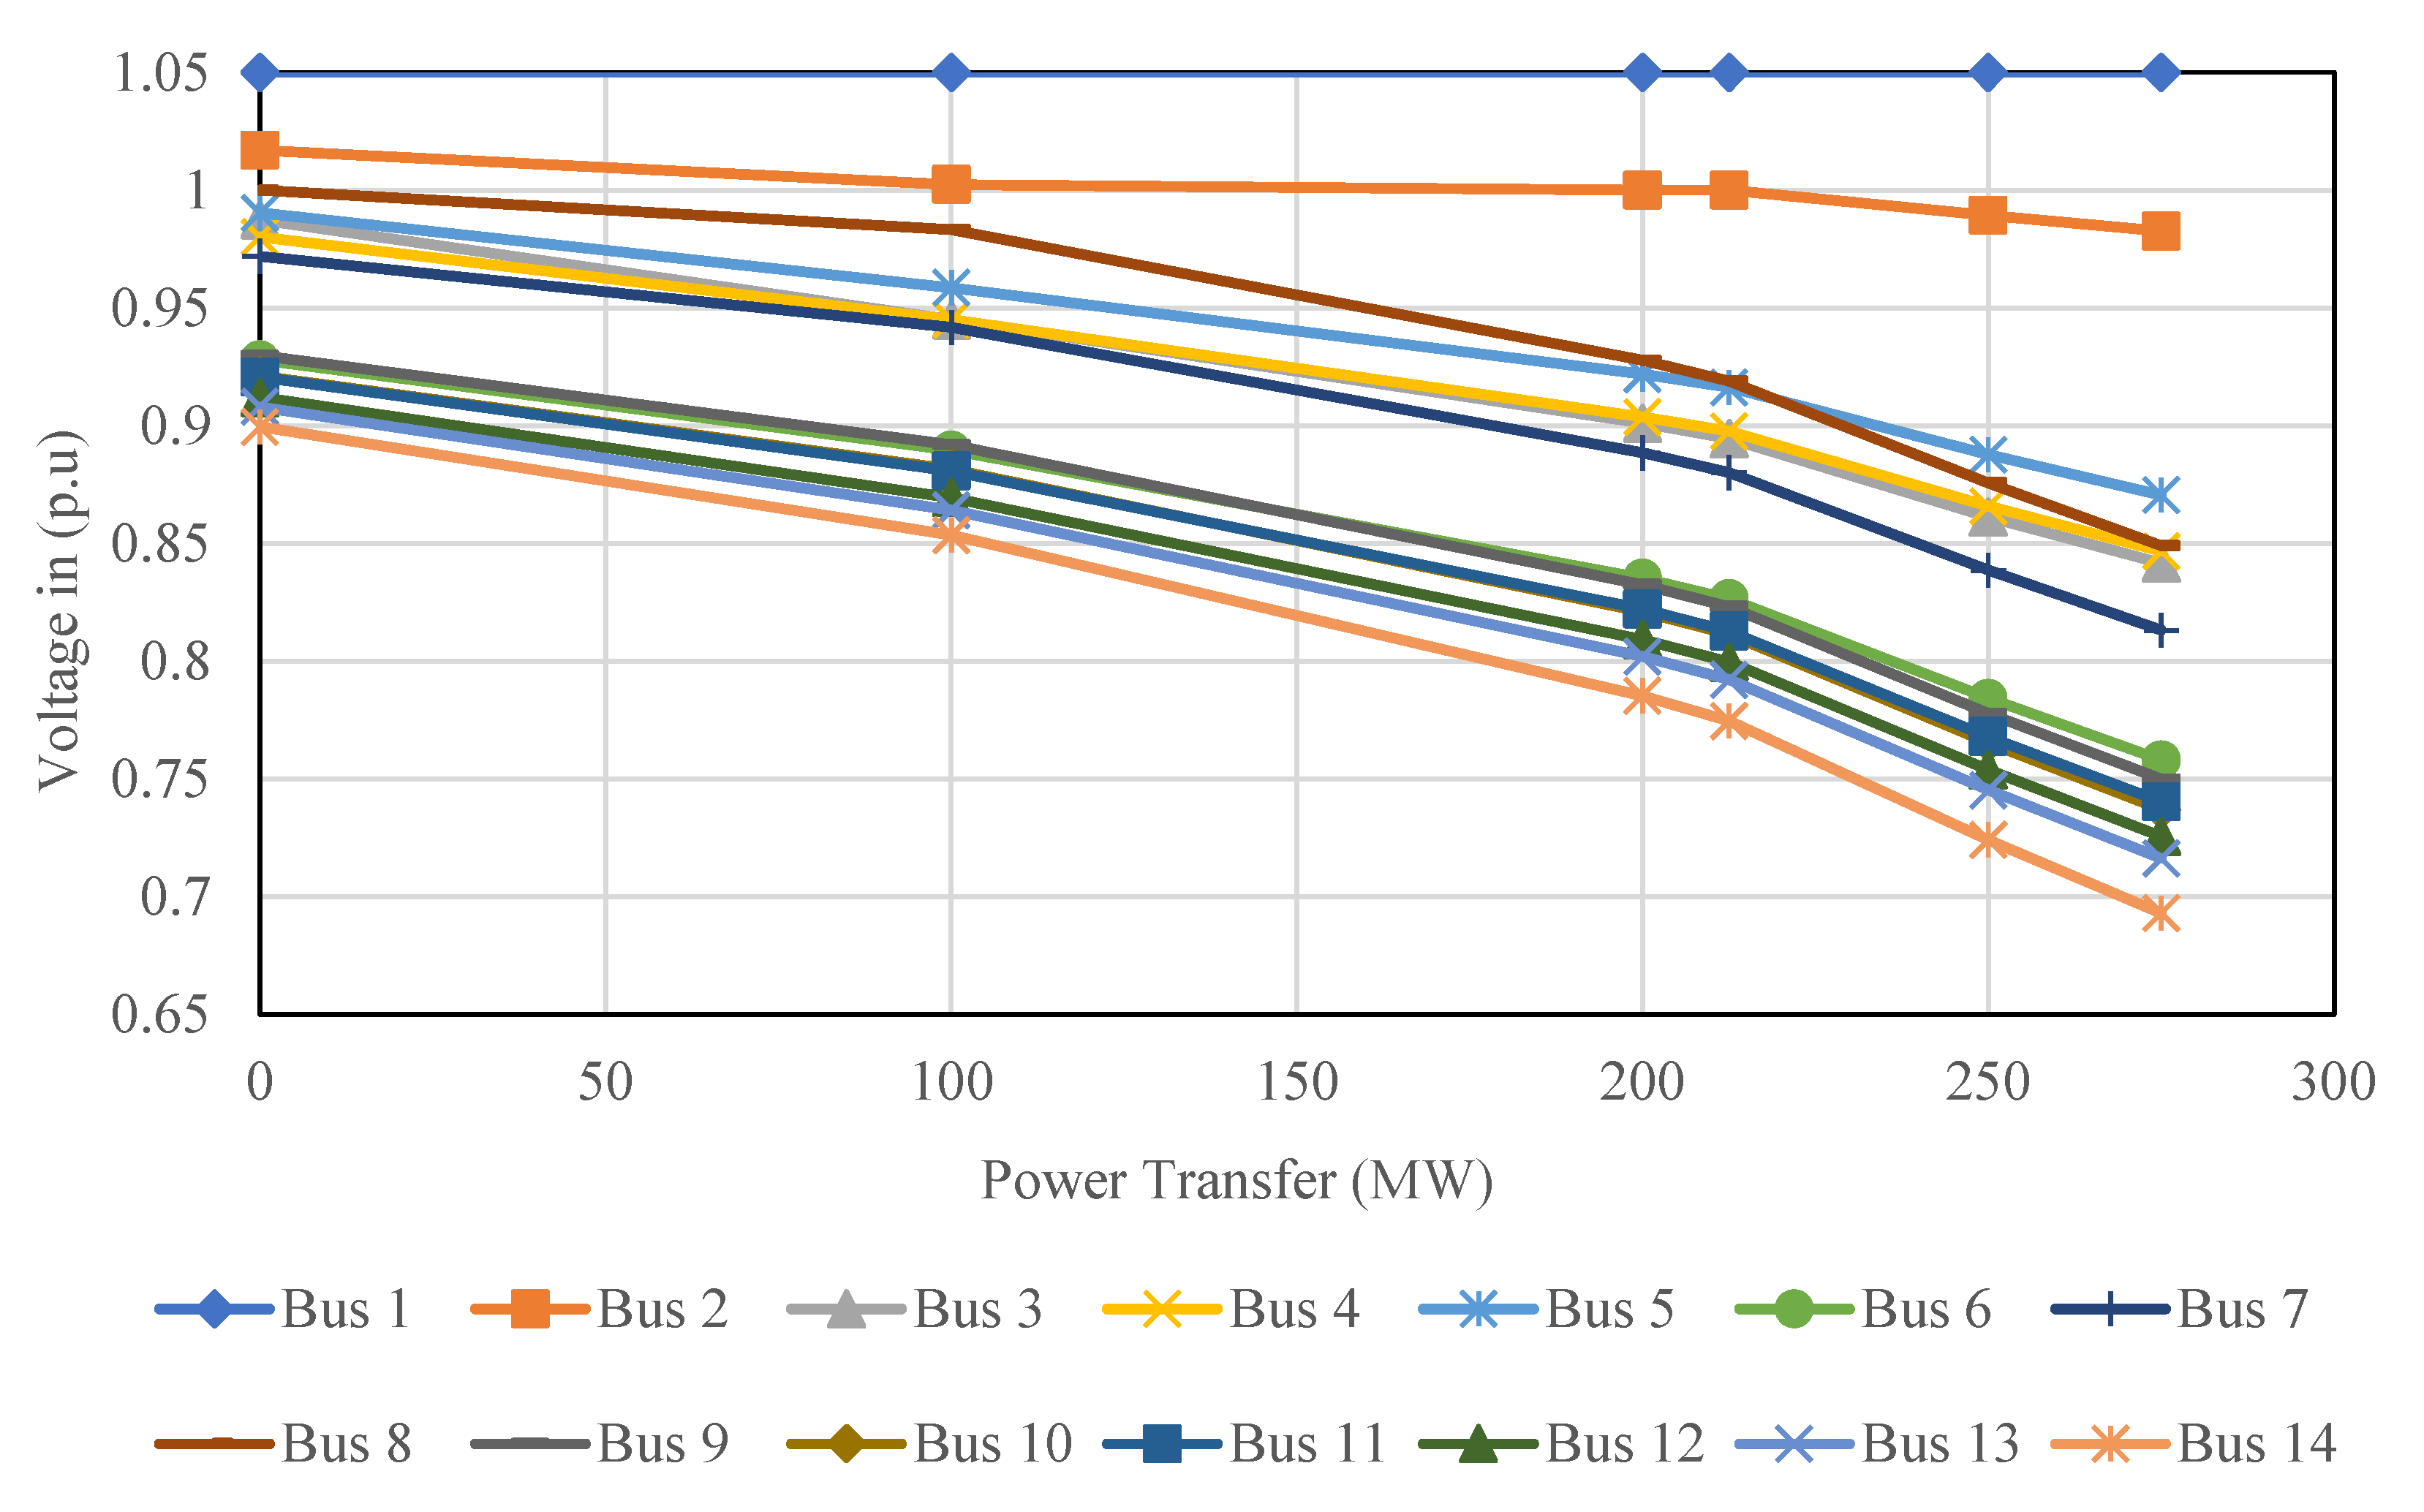
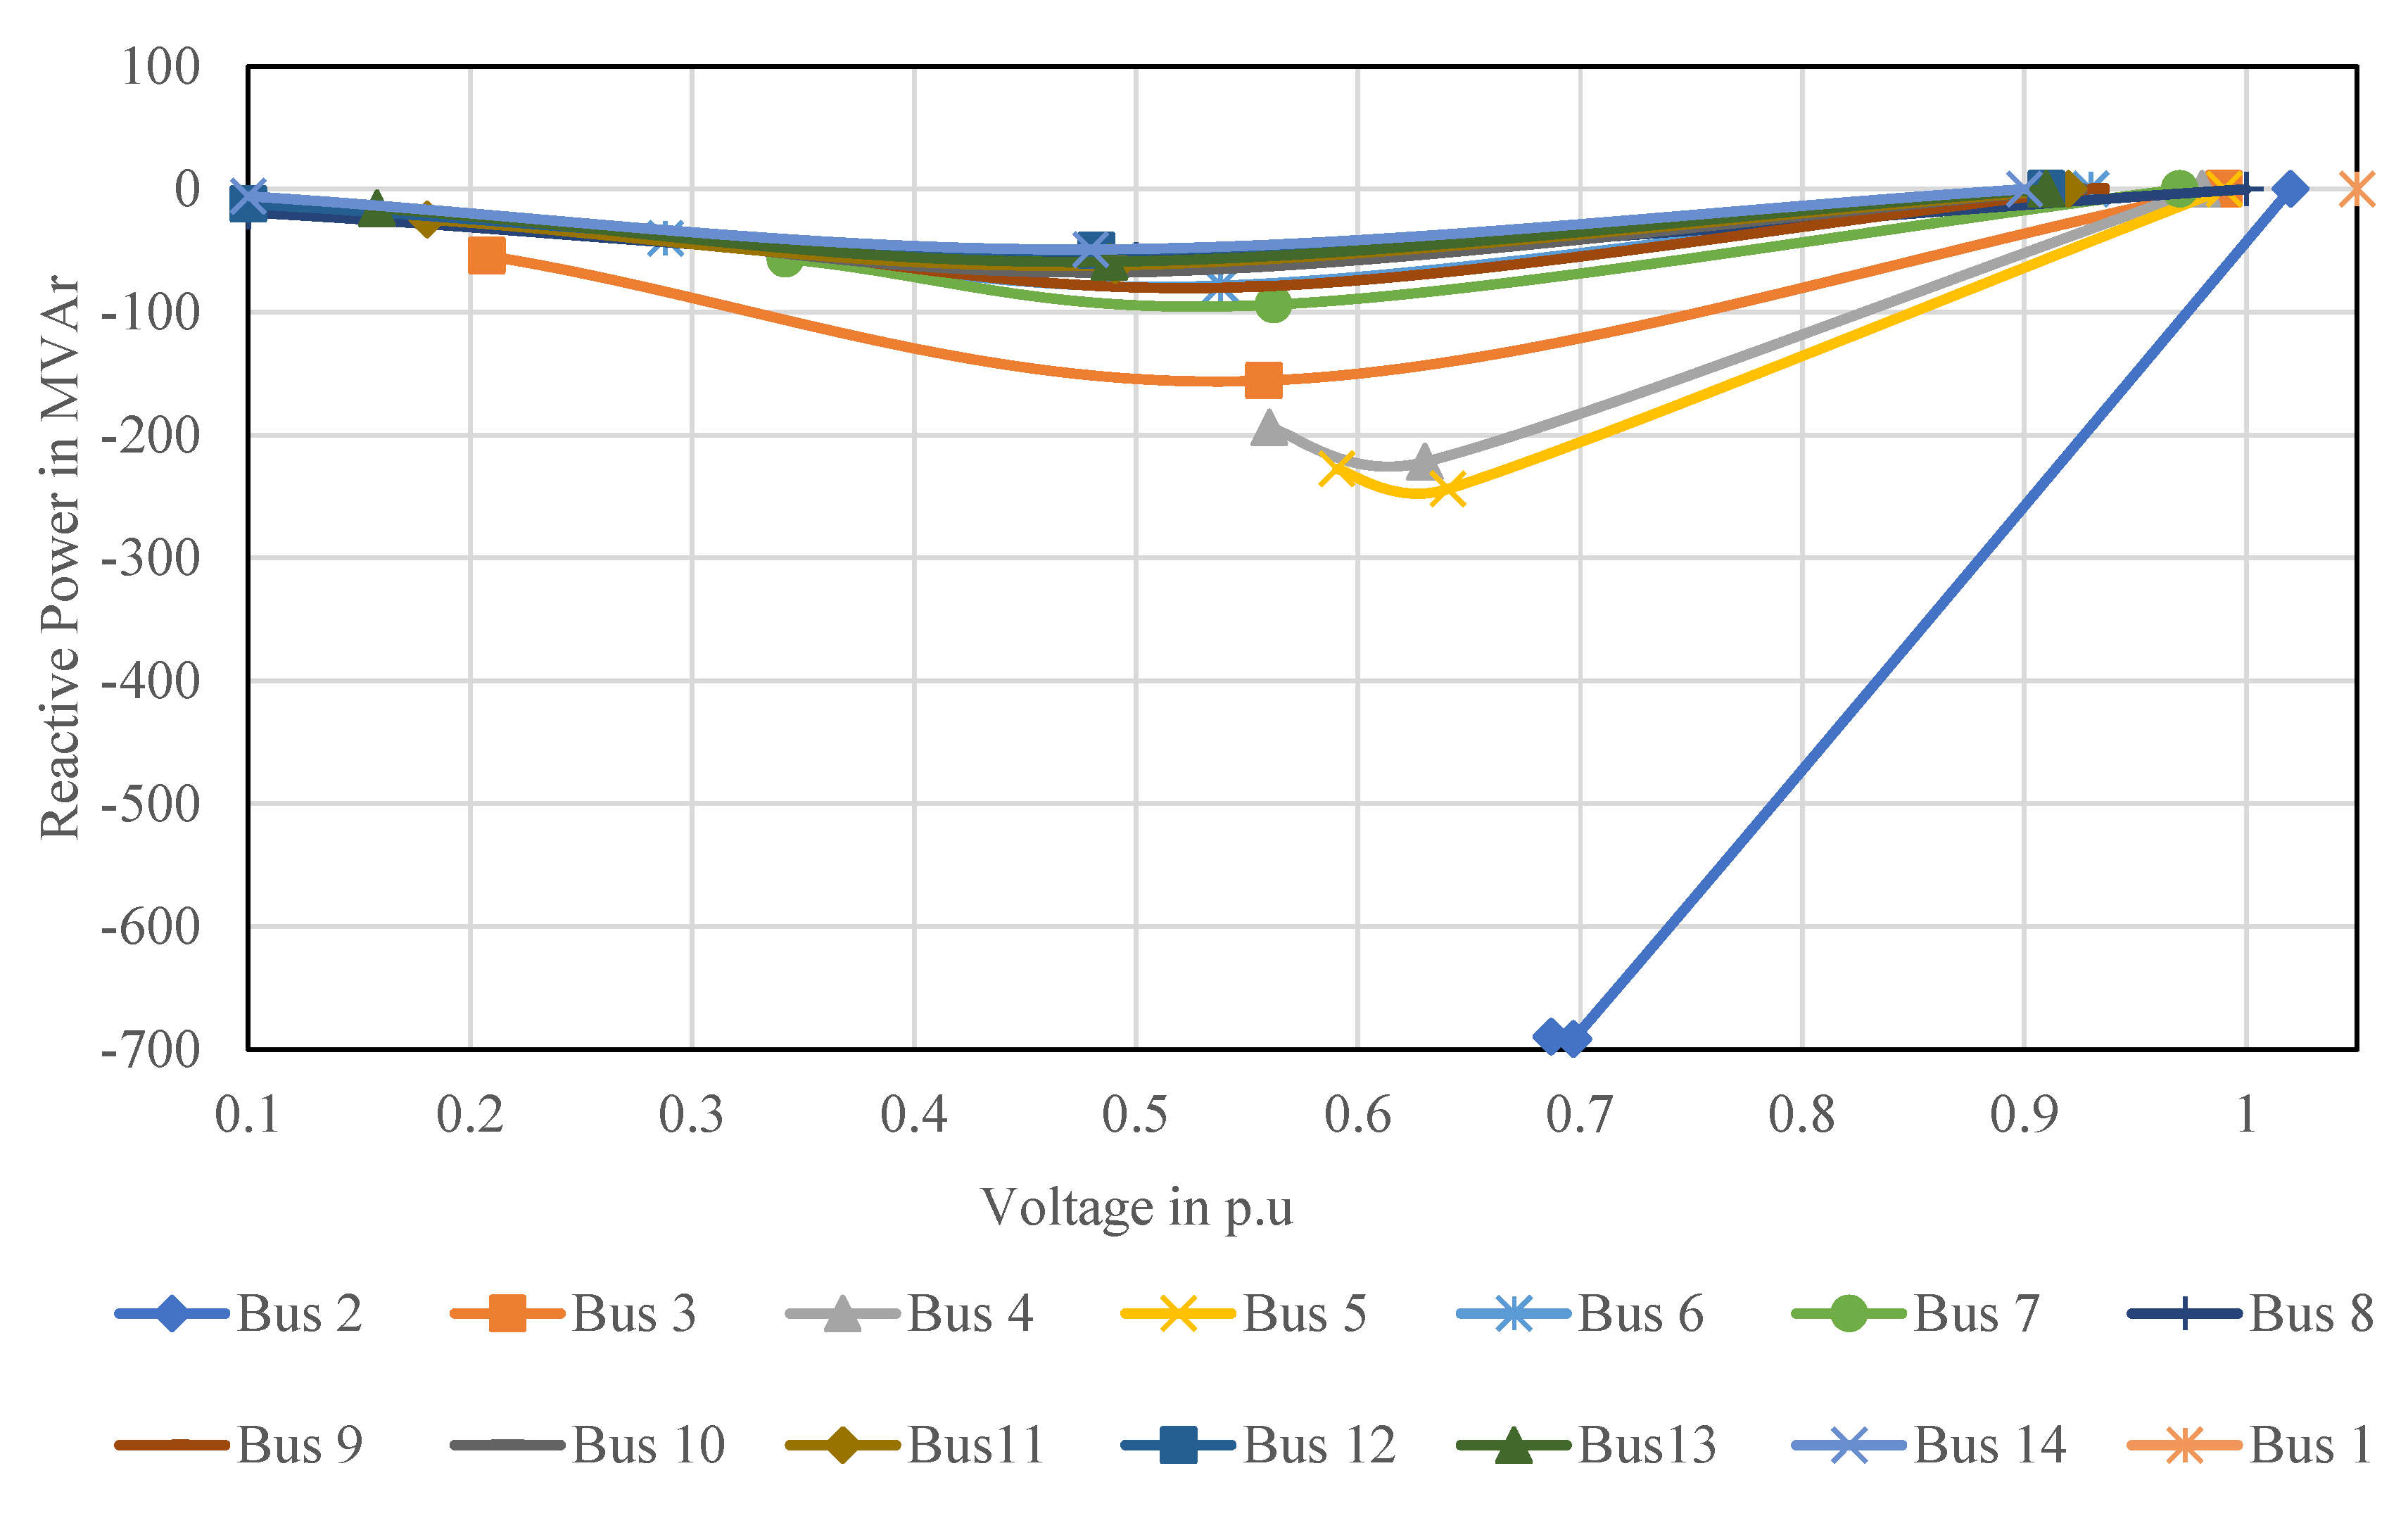
Nonetheless, the power-voltage (P–V)-curves and voltage-reactive power (V–Q)-curves methods are commonly used [25,26,27,28,29,30]. The P–V-and V–Q-curves show the reaction of bus voltage with increasing real power transfer from source to sink or with the absorption or injection of reactive power from or into the same bus. Notwithstanding, the P–V- and V–Q-curve methods are deterministic methods but accurate. Reference [31] used a P–V-curve to analyze the effect of a wind generator on the static voltage stability of the Zhanjiang power system using PSD-BPA Software. The study conducted in [15] employs continuation power flow (CPF) in the DIgSILENT/PowerFactory environment to investigate the impact of a large wind farm on China power system voltage stability. Additionally, the authors of [17] analyzed the impact of some control strategies of doubly-fed induction generator (DFIG) based wind power generation and solar photovoltaic generation on power system static voltage stability with the V–Q-curve using the Power Factory and compared the operational characteristics of the controlled DFIG based generators to the conventional synchronous generator and asserted that RESs gives reduced support for power system voltage. Furthermore, the study performed in [27] utilizes the CPF based P–V-curves method in the power system toolbox (PSAT) environment to investigate the influence of REGs on power system voltage stability. Reference [32] proposed two models for large SPVG integrated to the power system. Viz: (1) the constant power, P and constant reactive power, Q control and (2) constant P and constant voltage, V control. Additionally, it uses P–V-curves based on the proposed methods to evaluate the effect of SPVG on power system stability using PSAT Software.
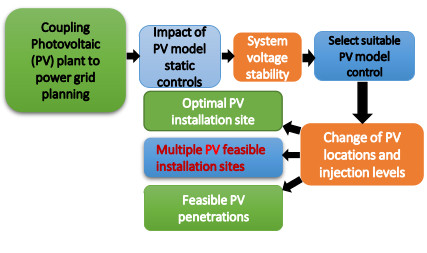
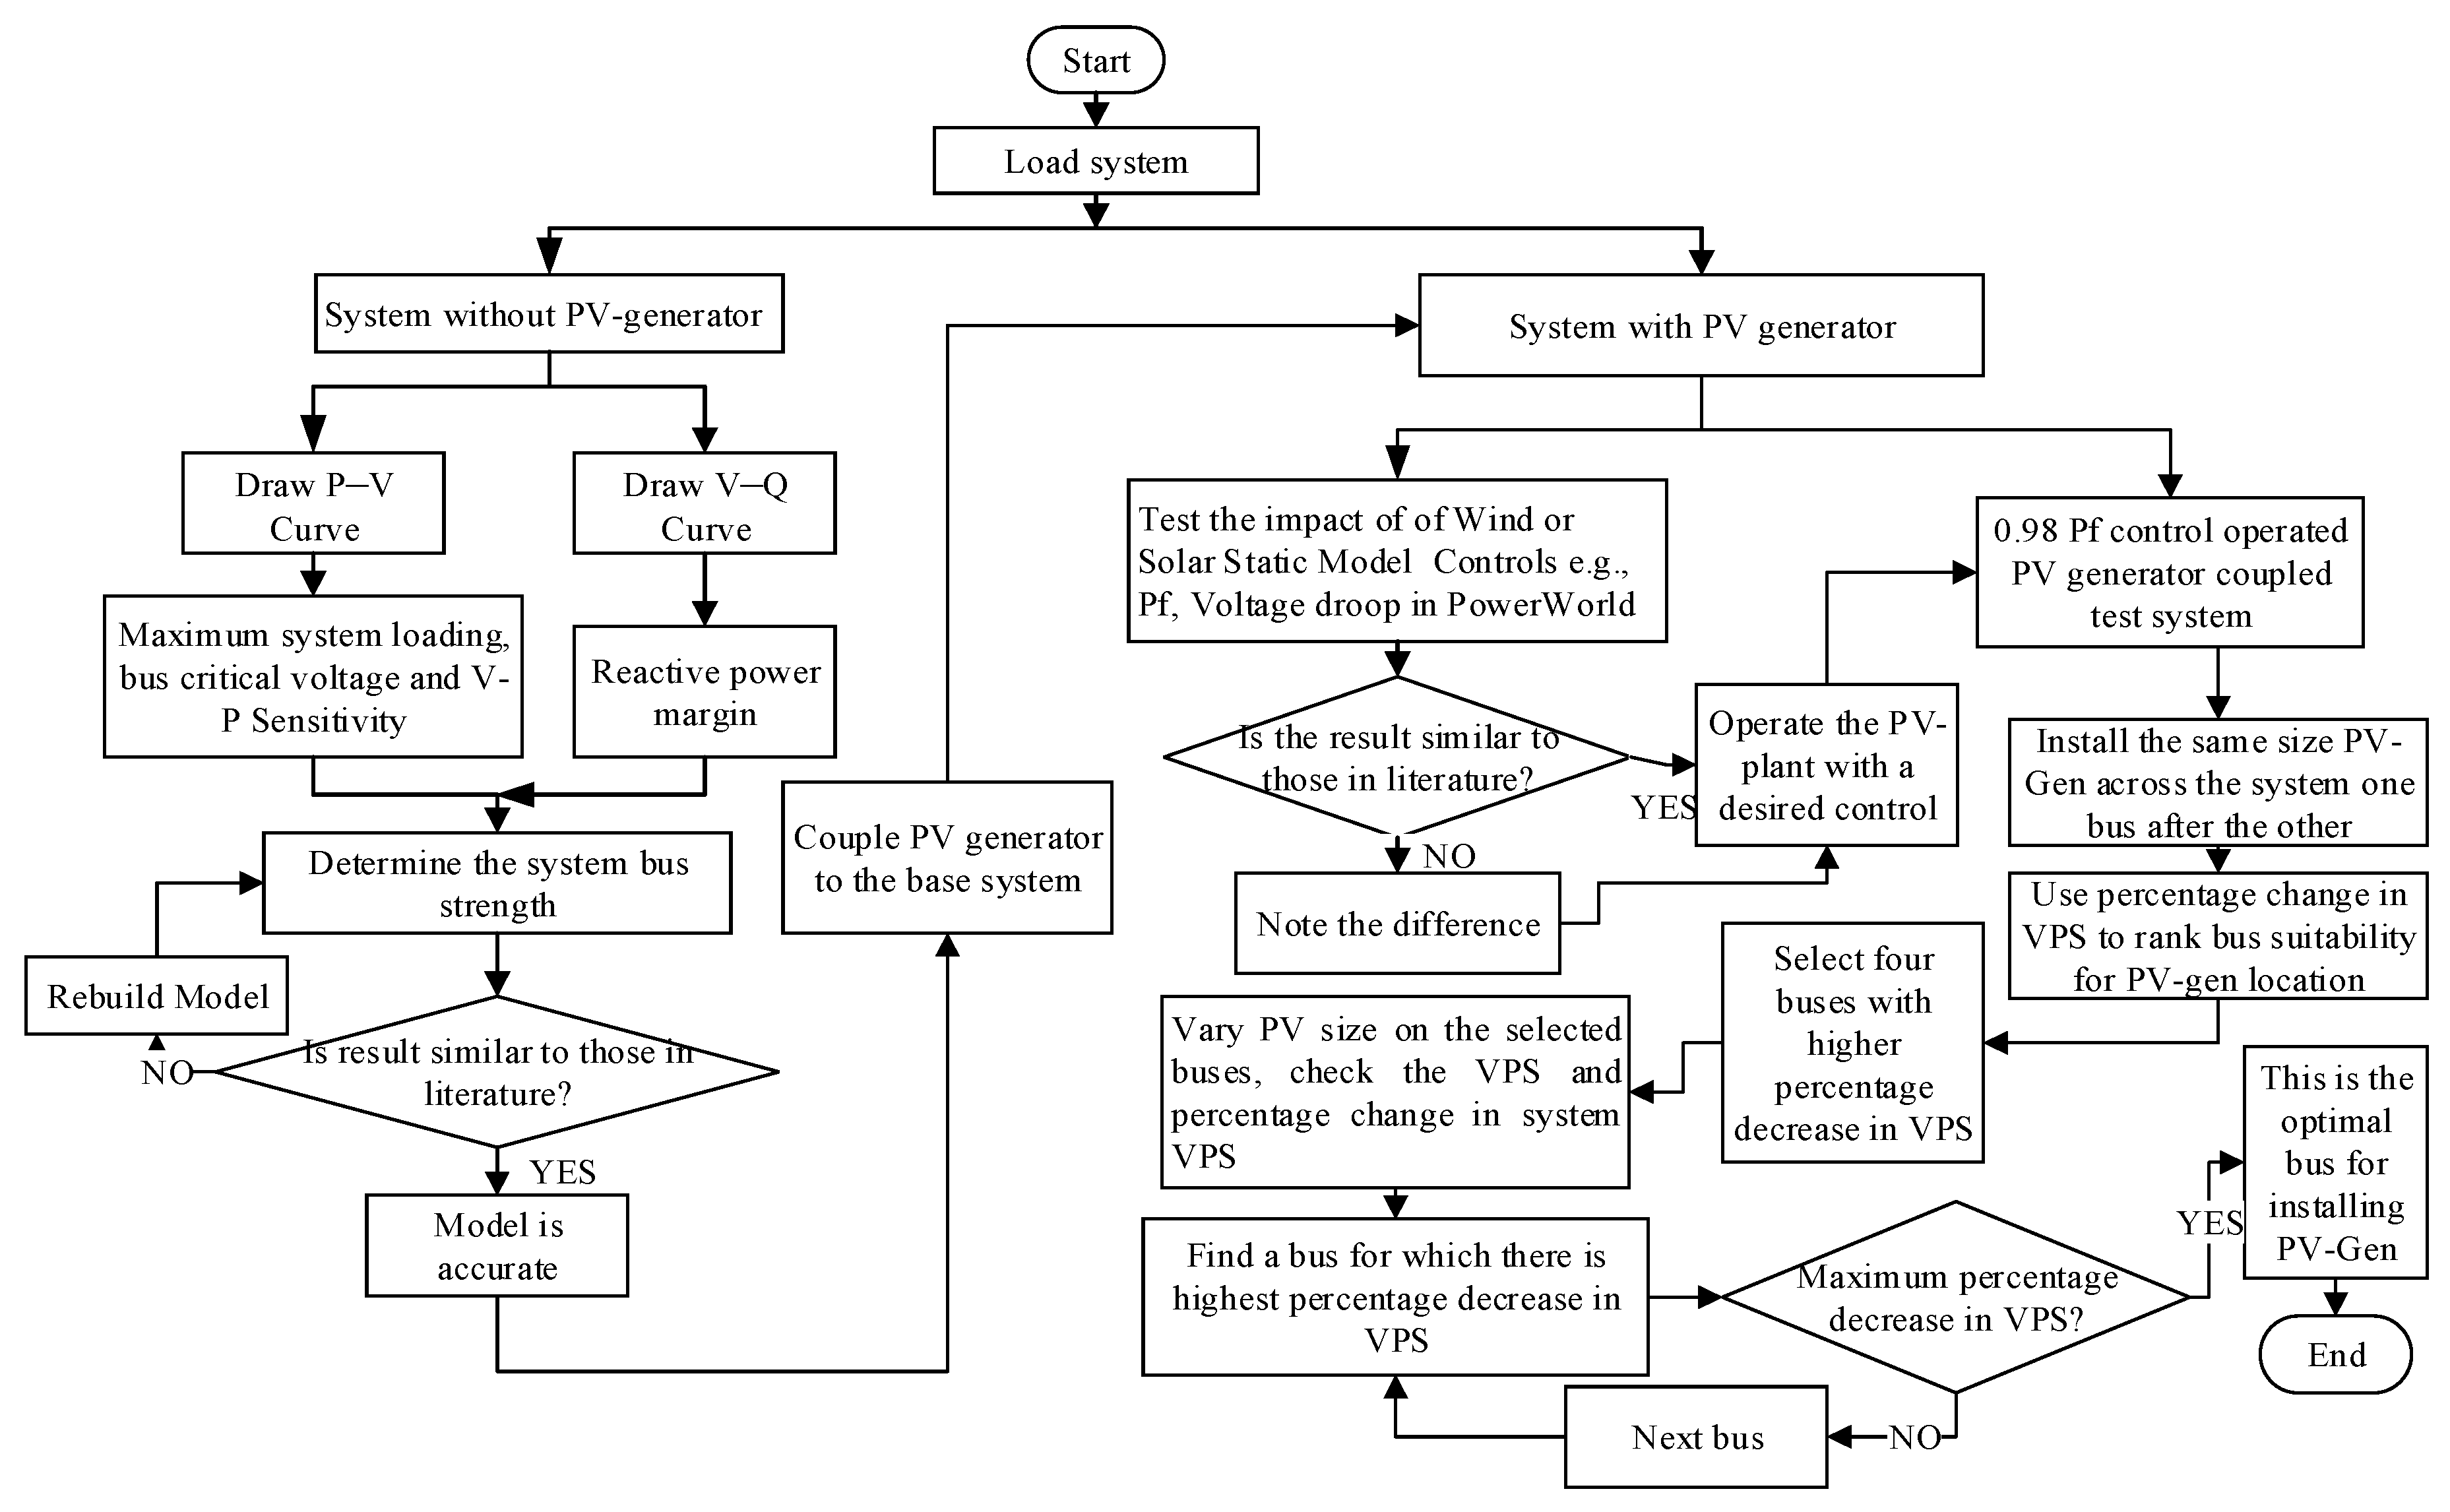
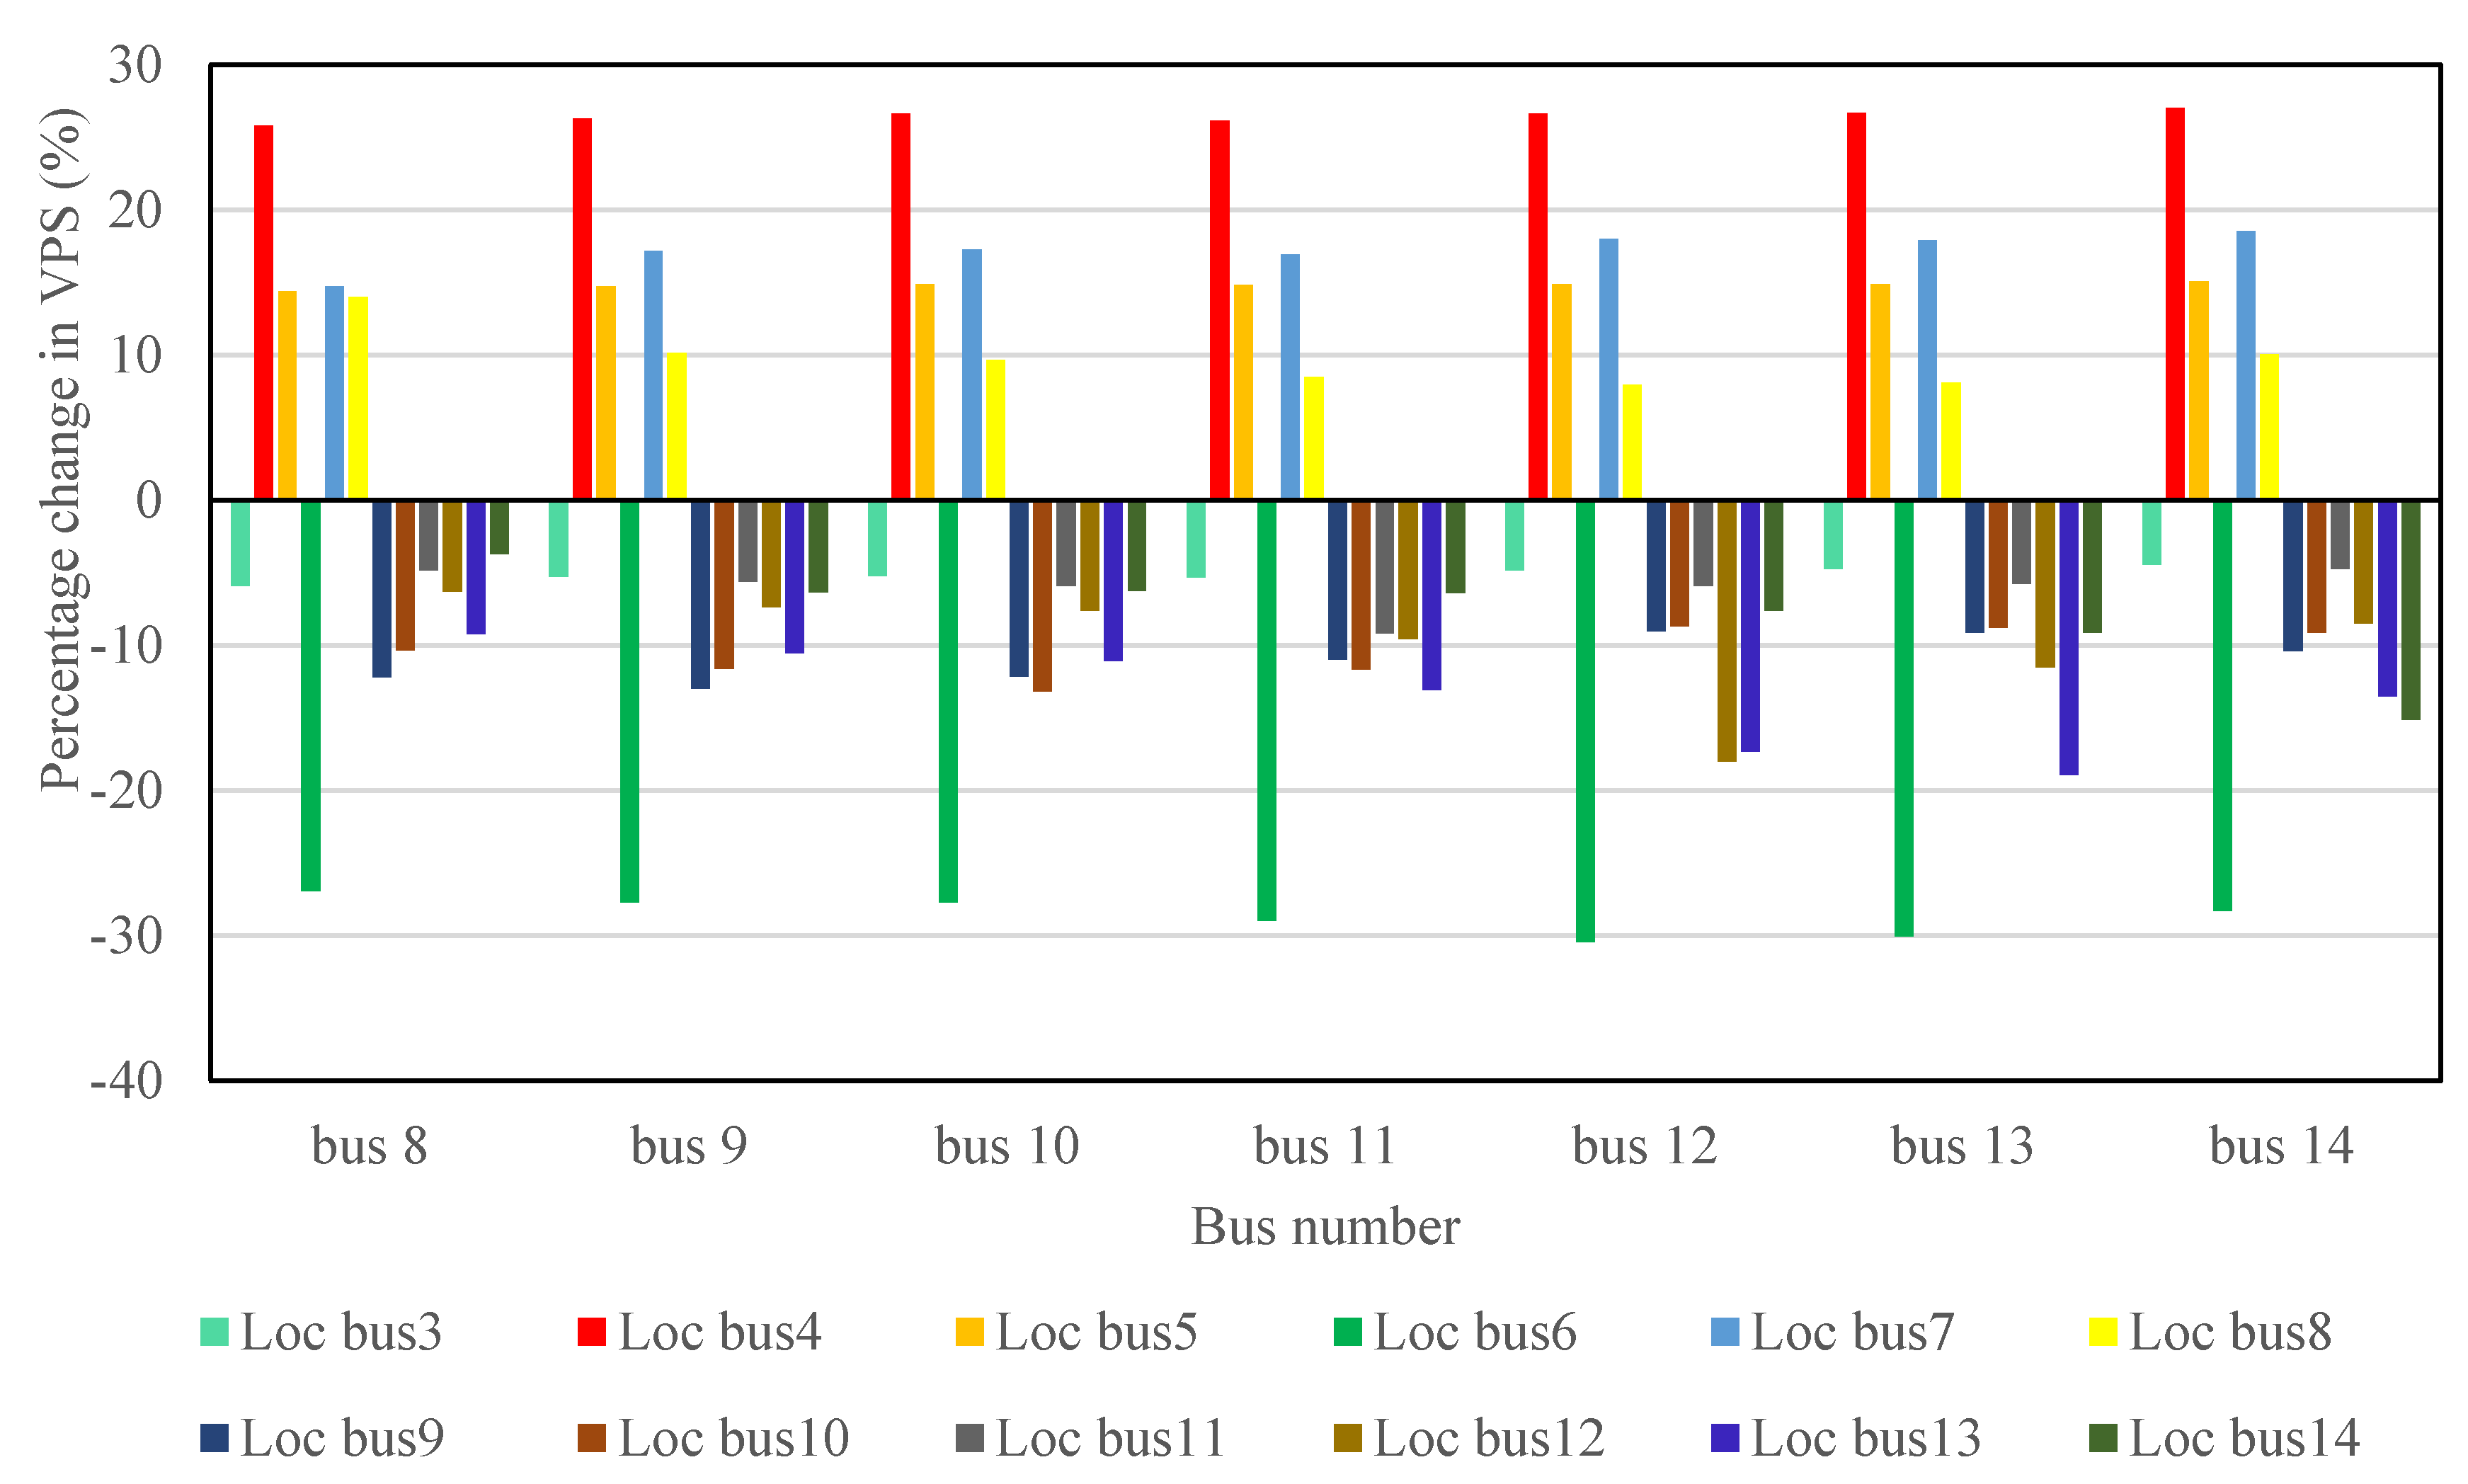
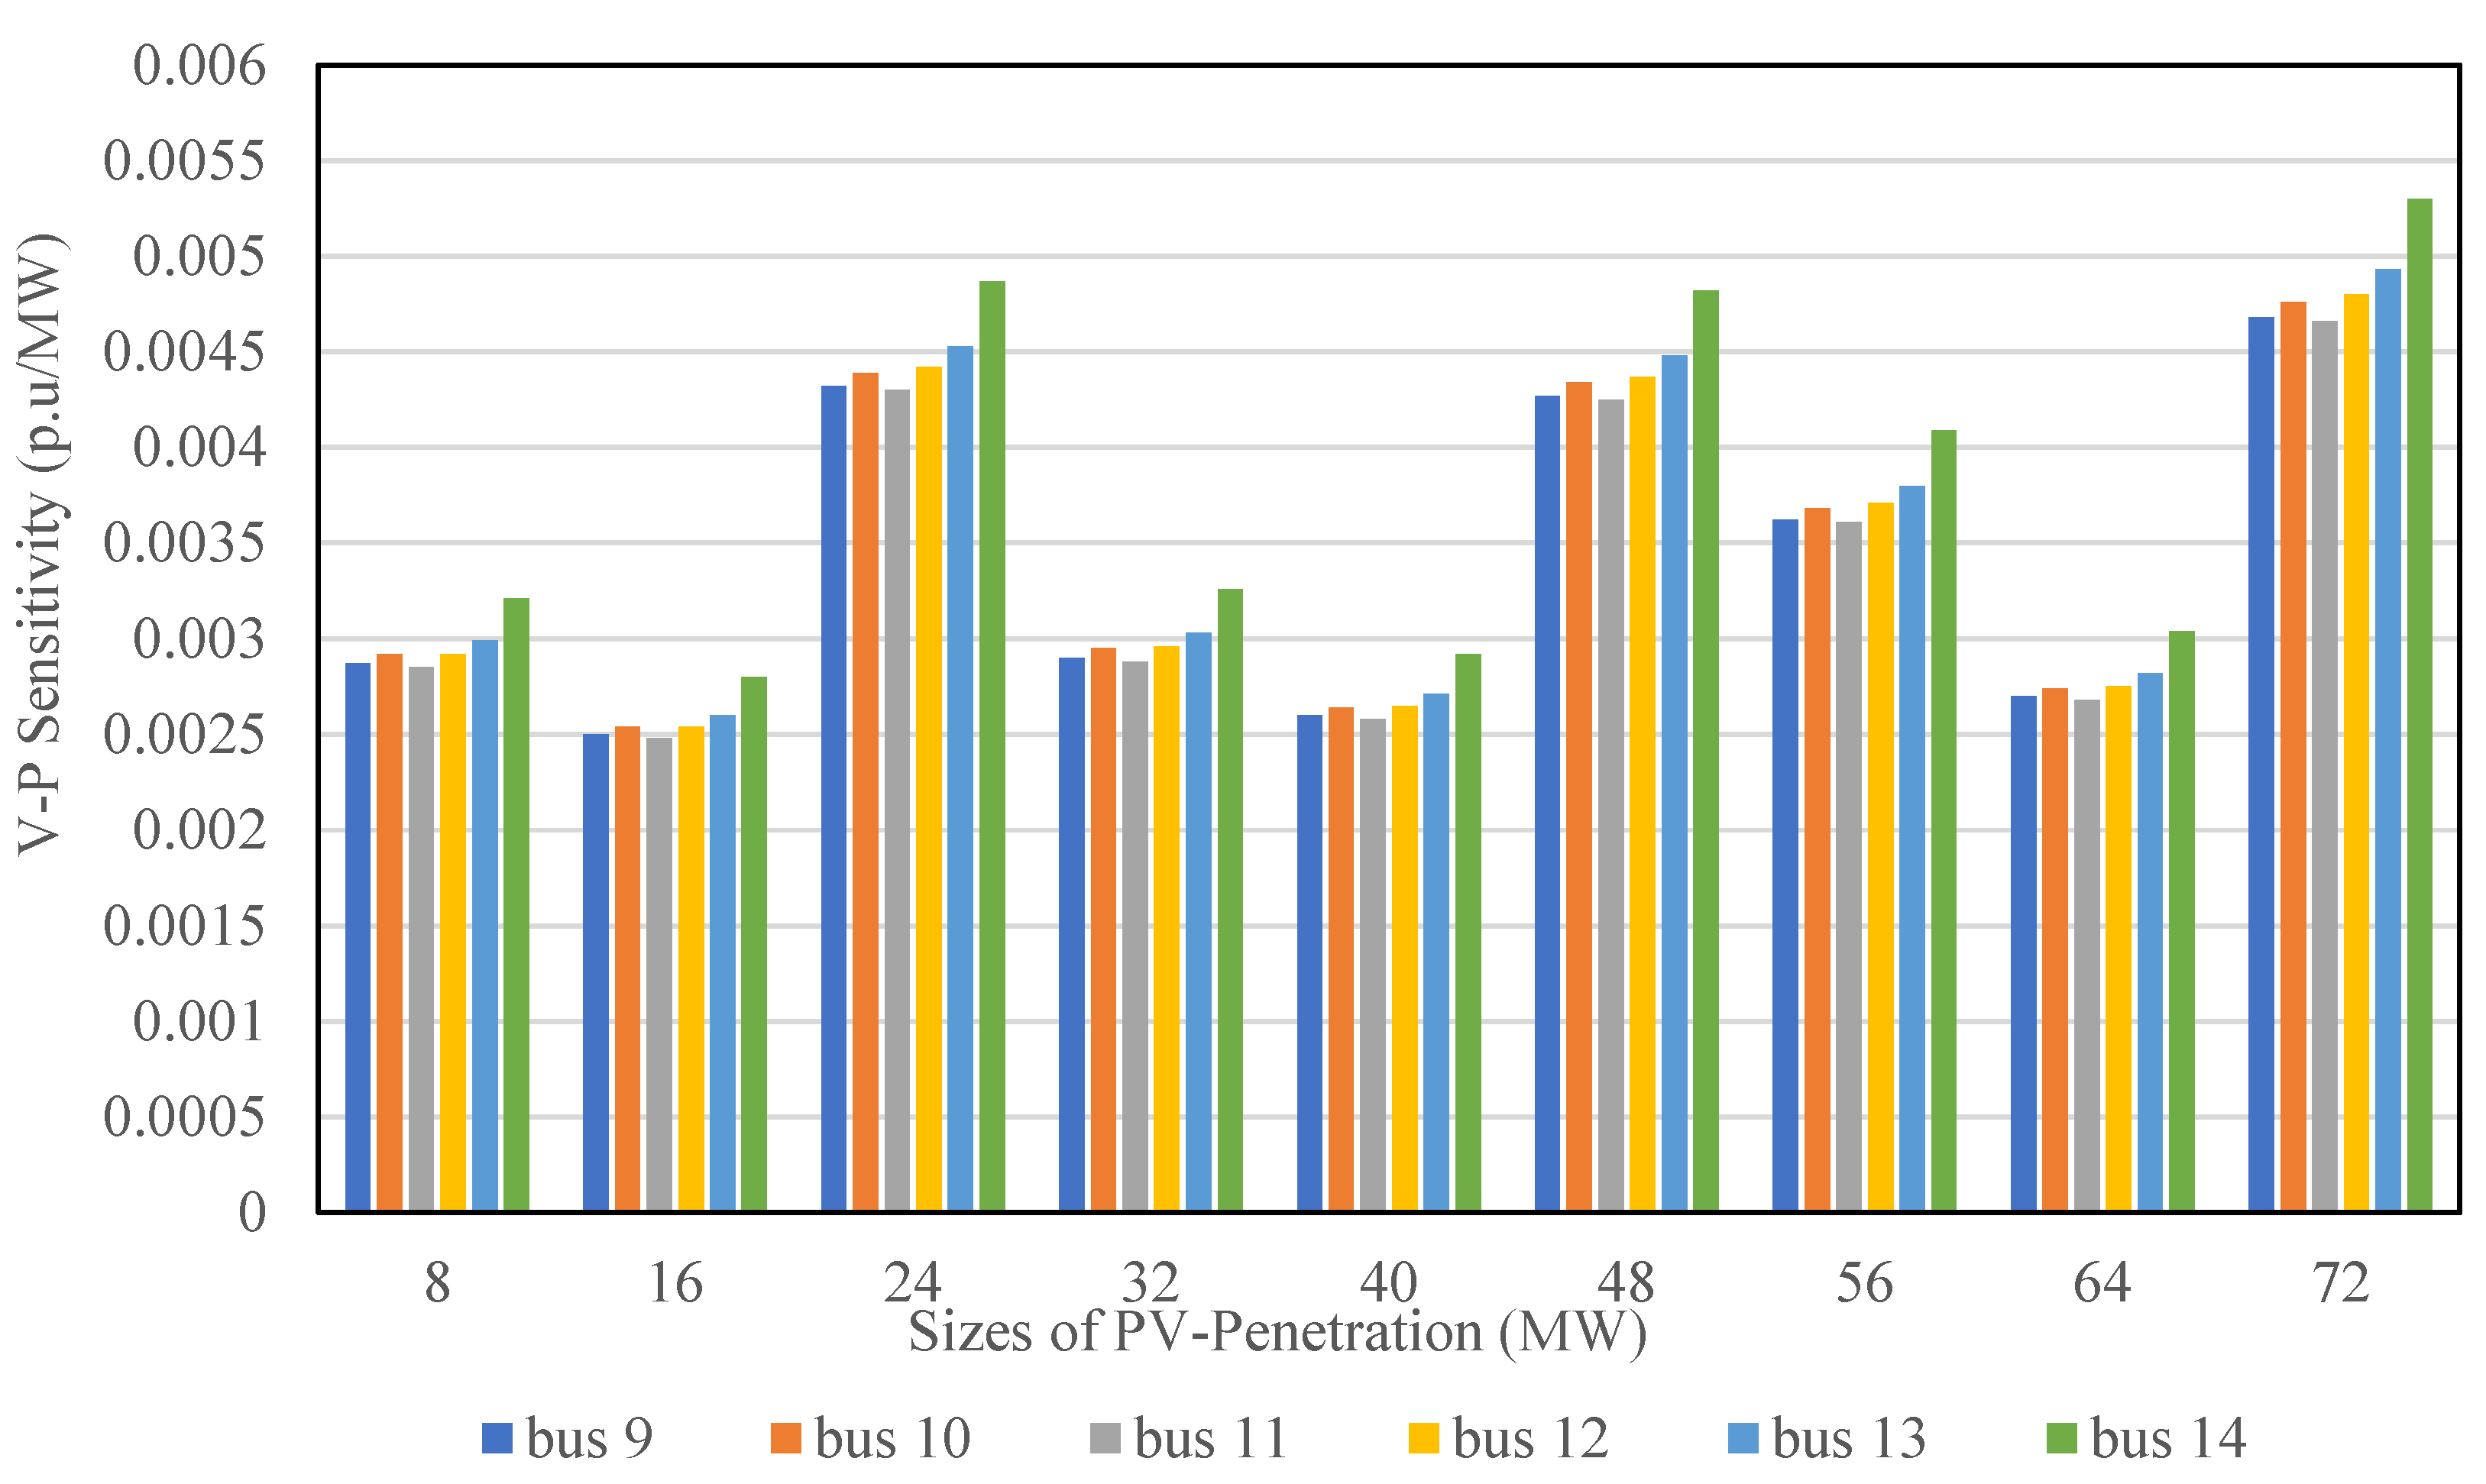
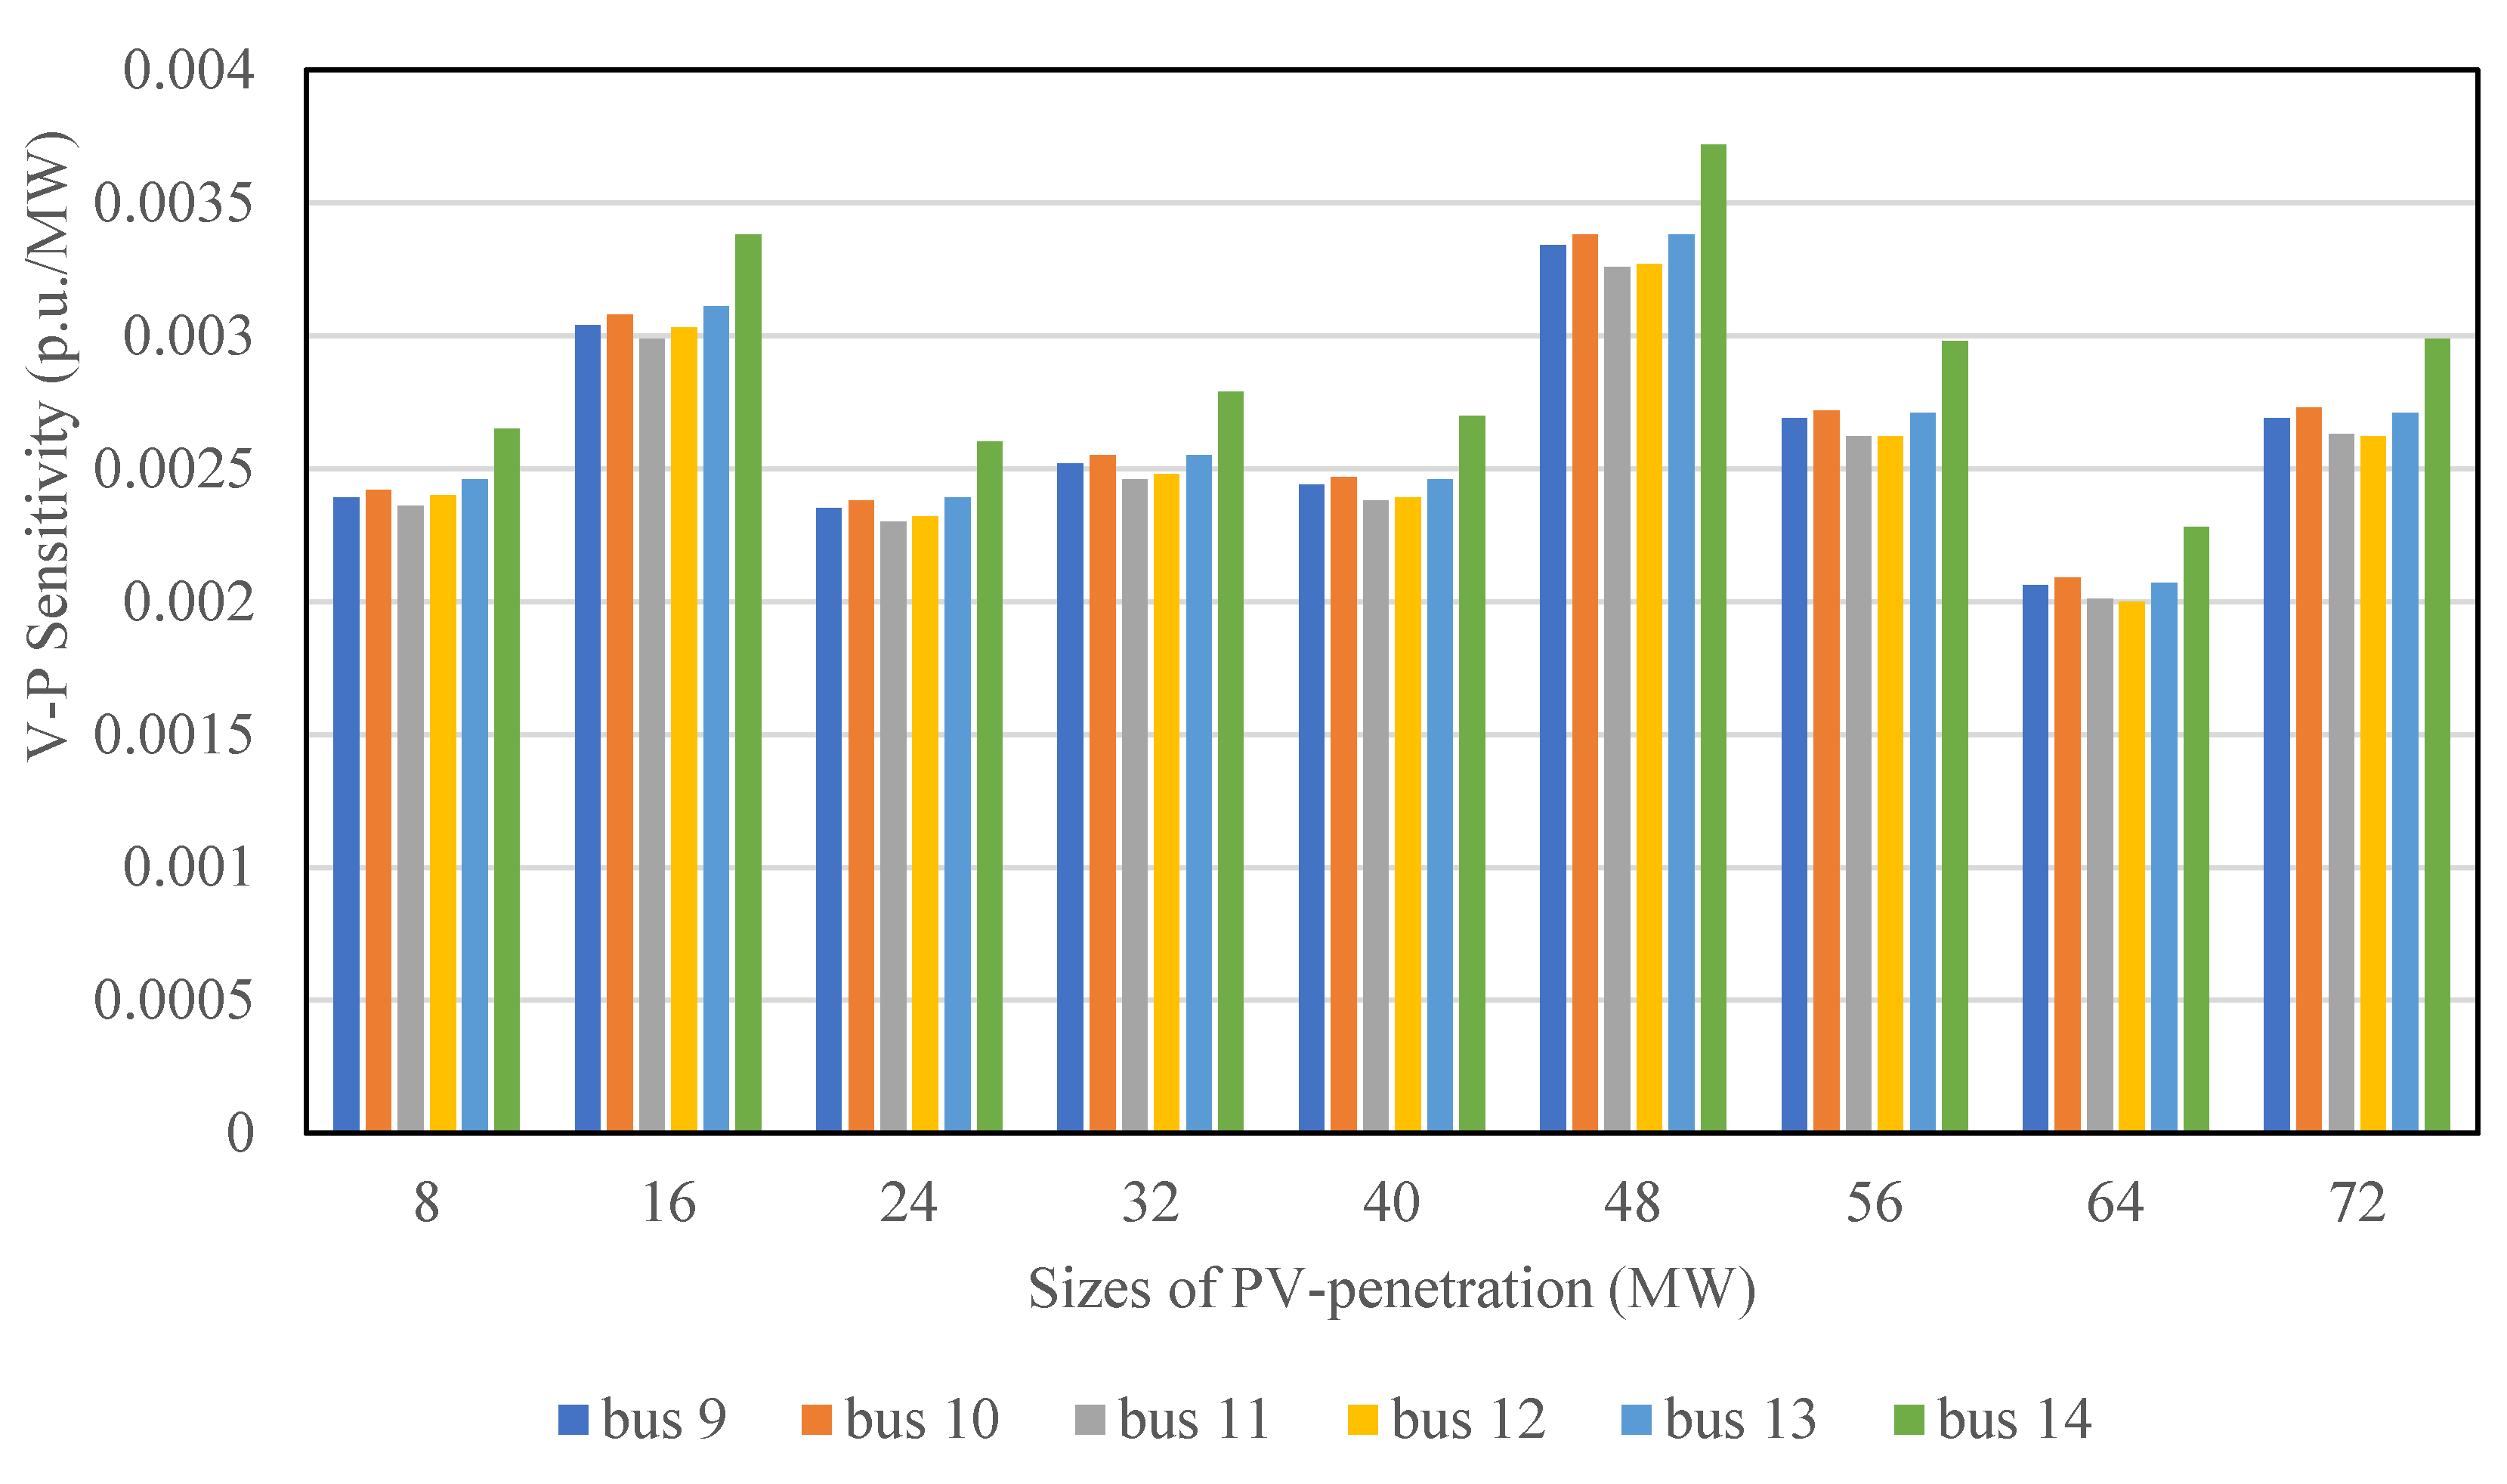
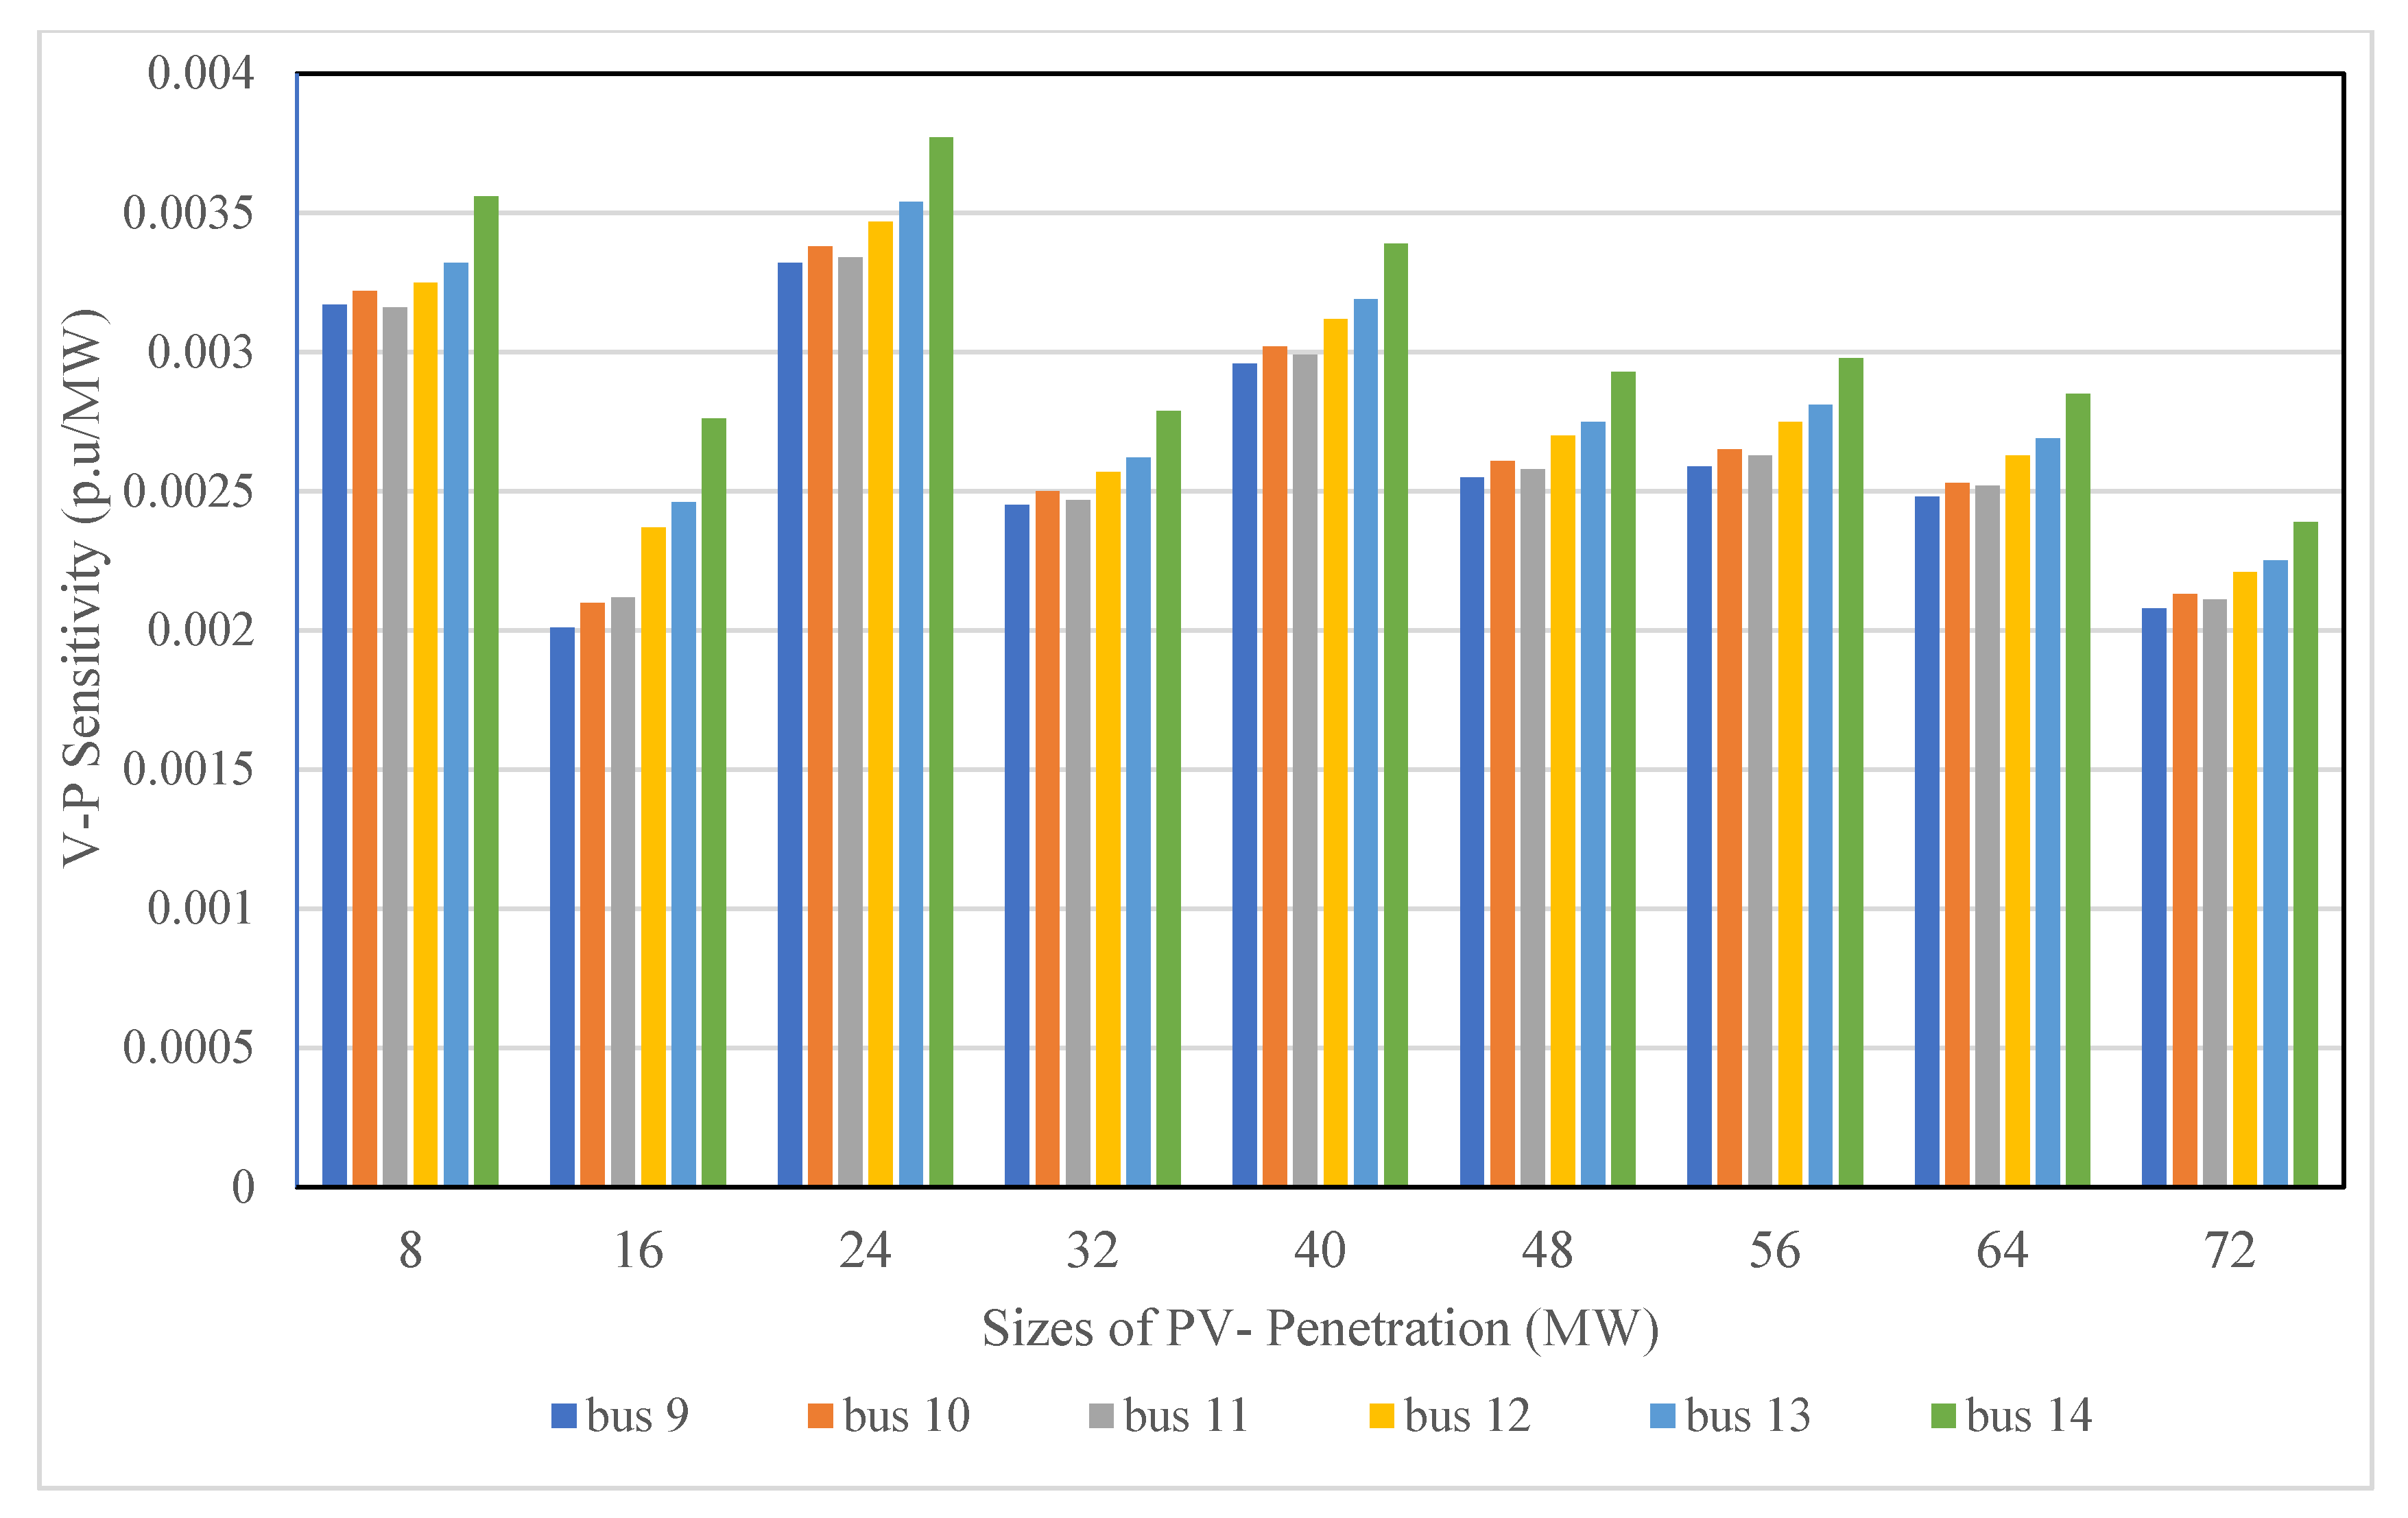
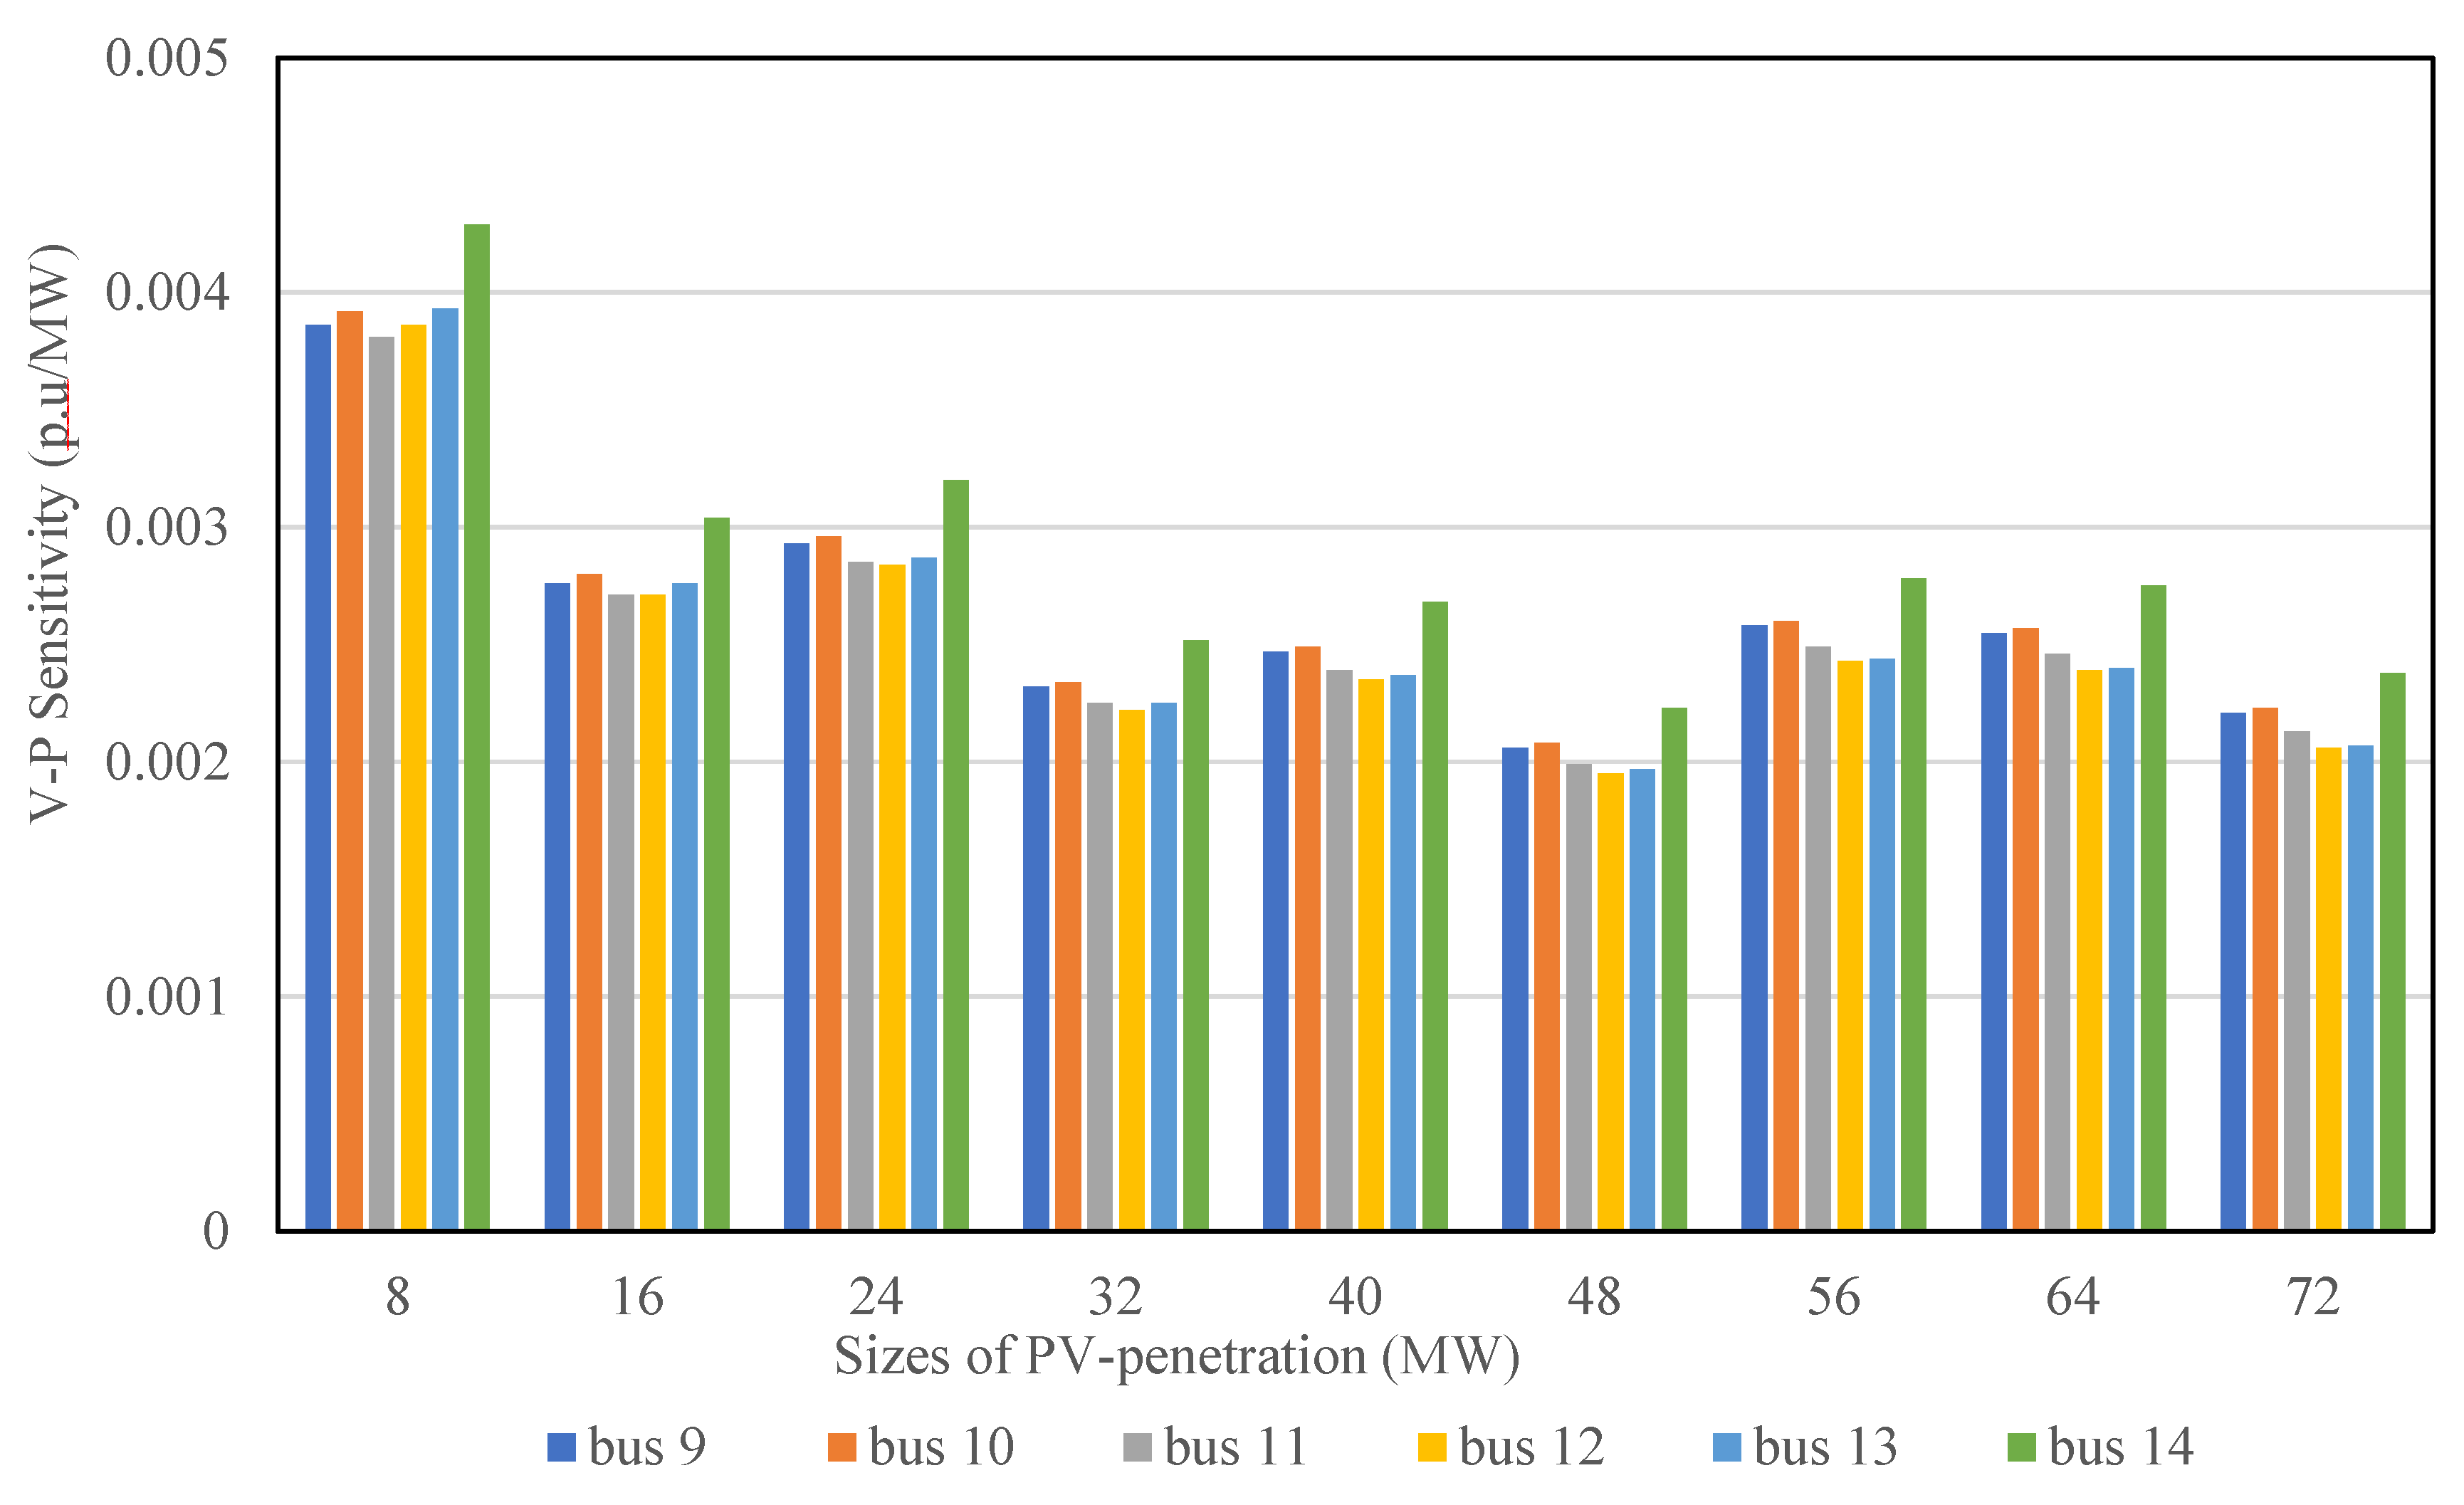
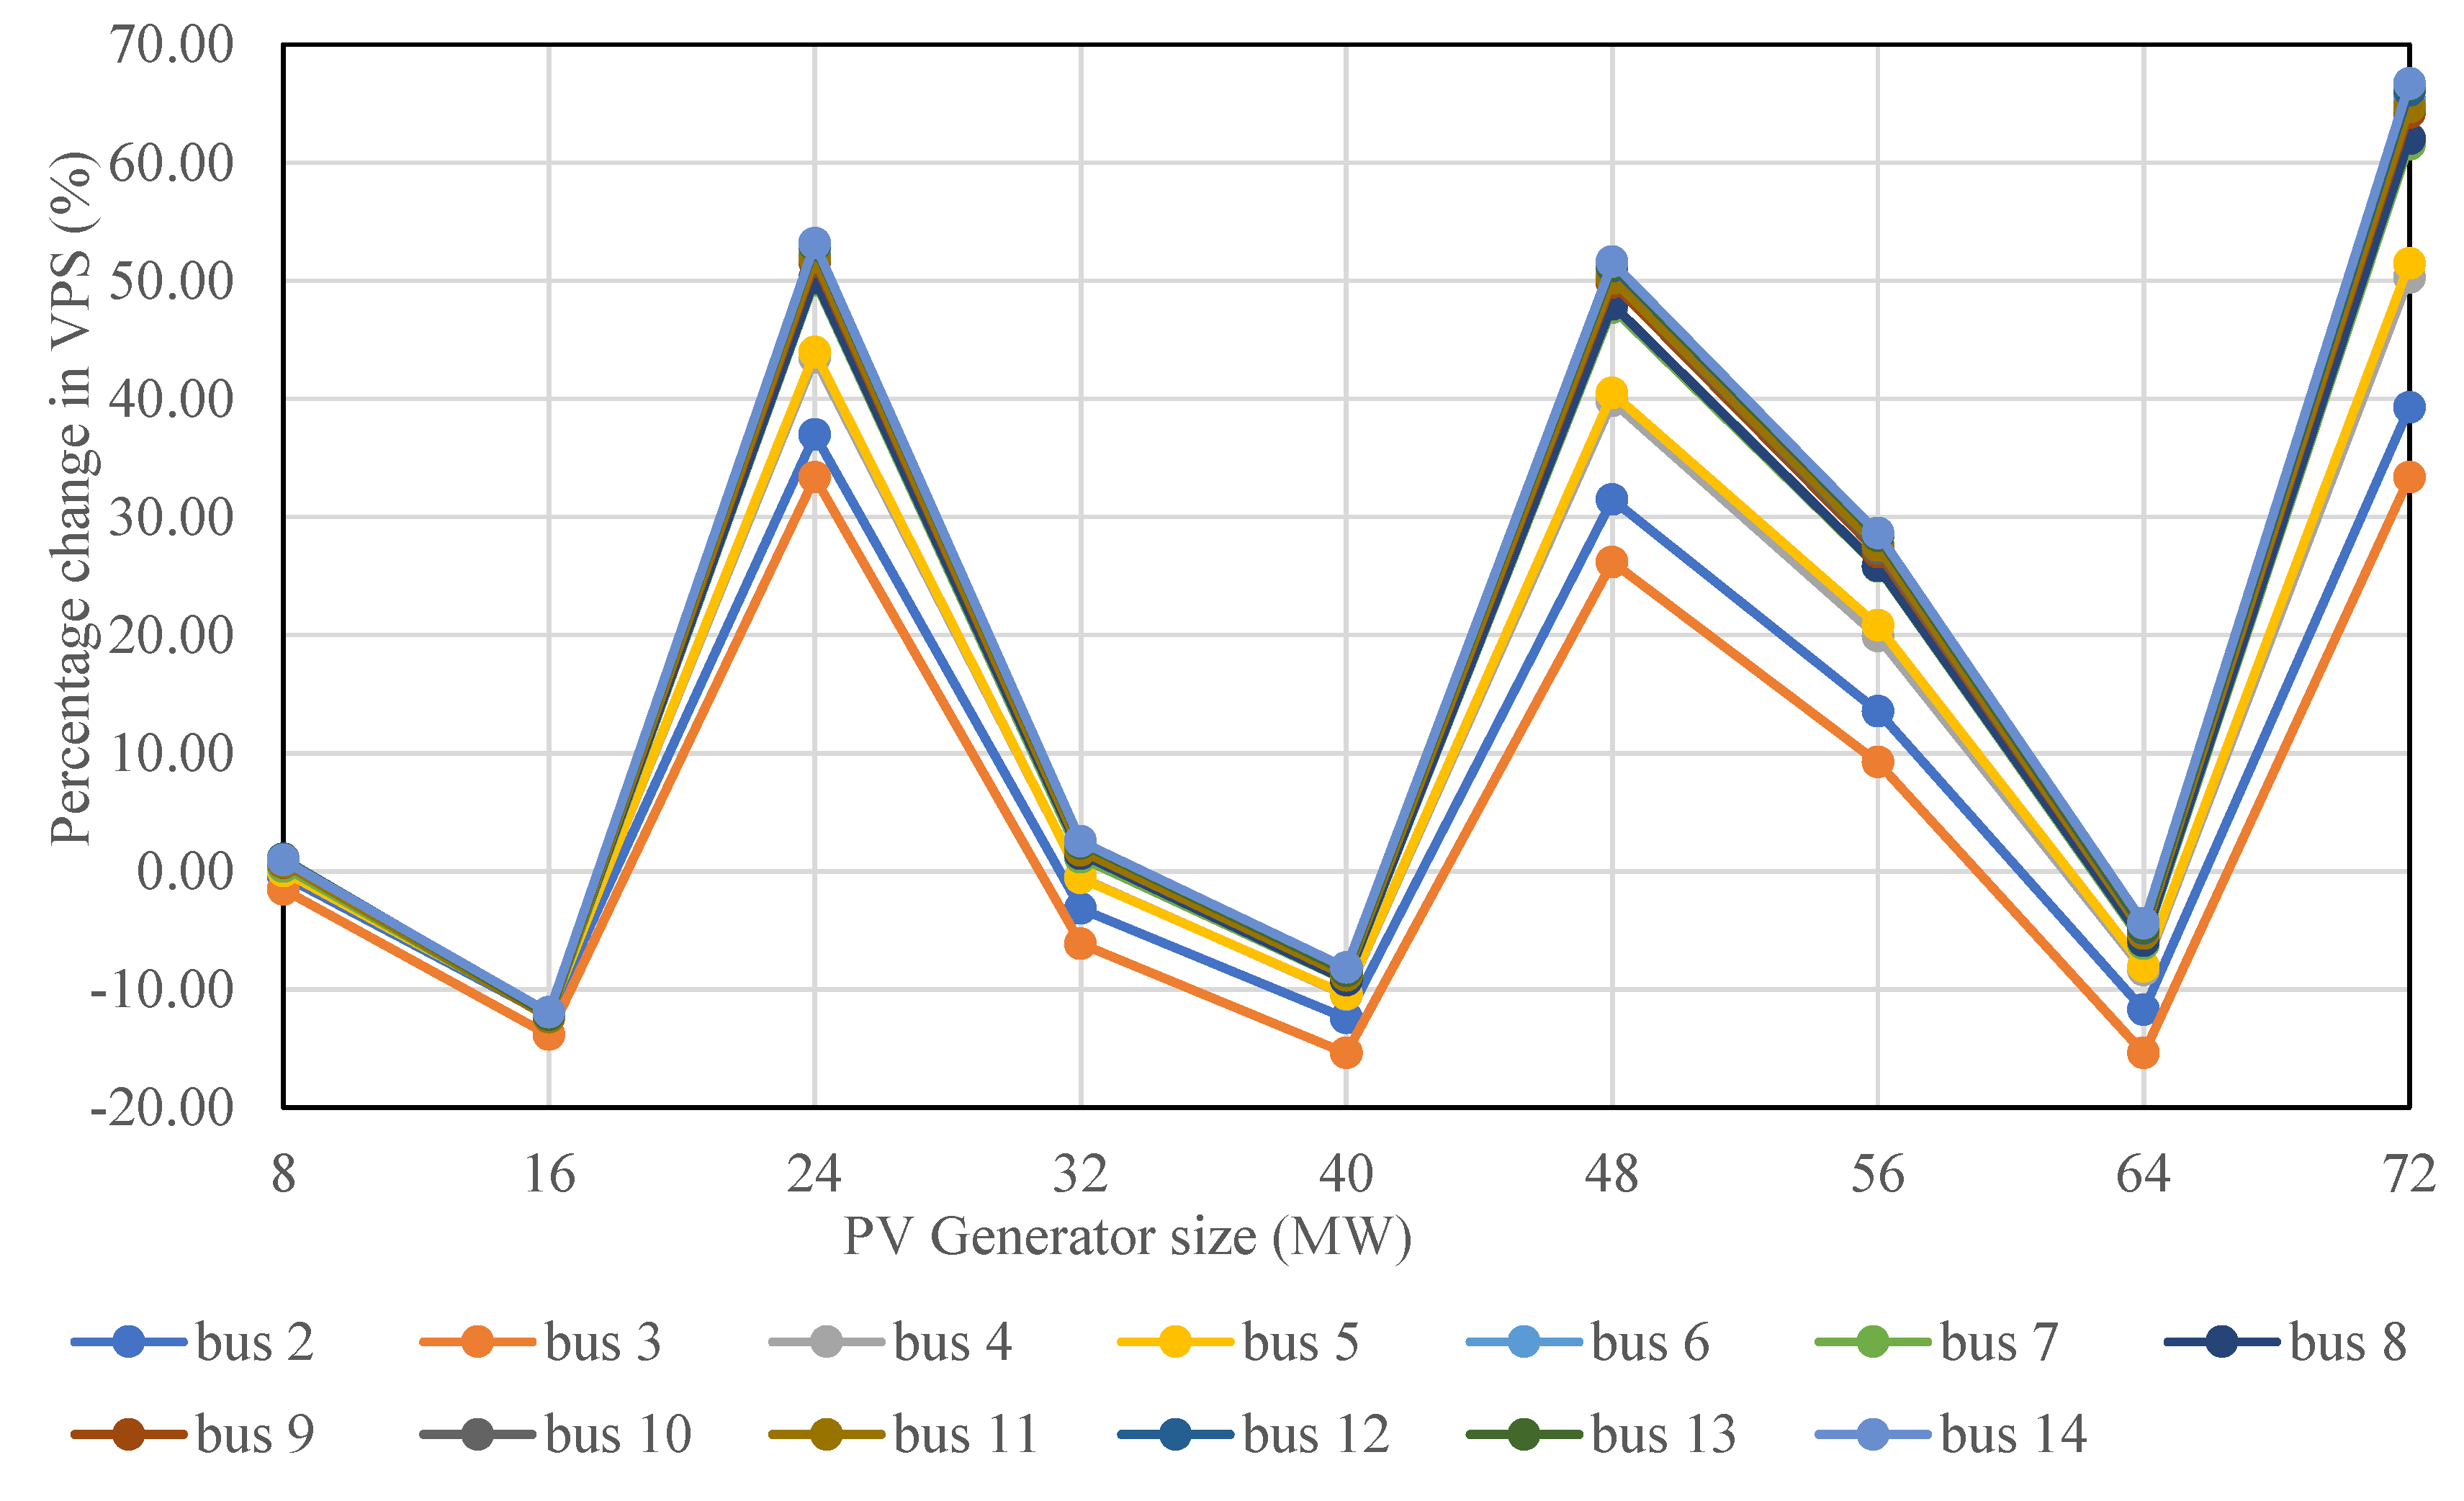
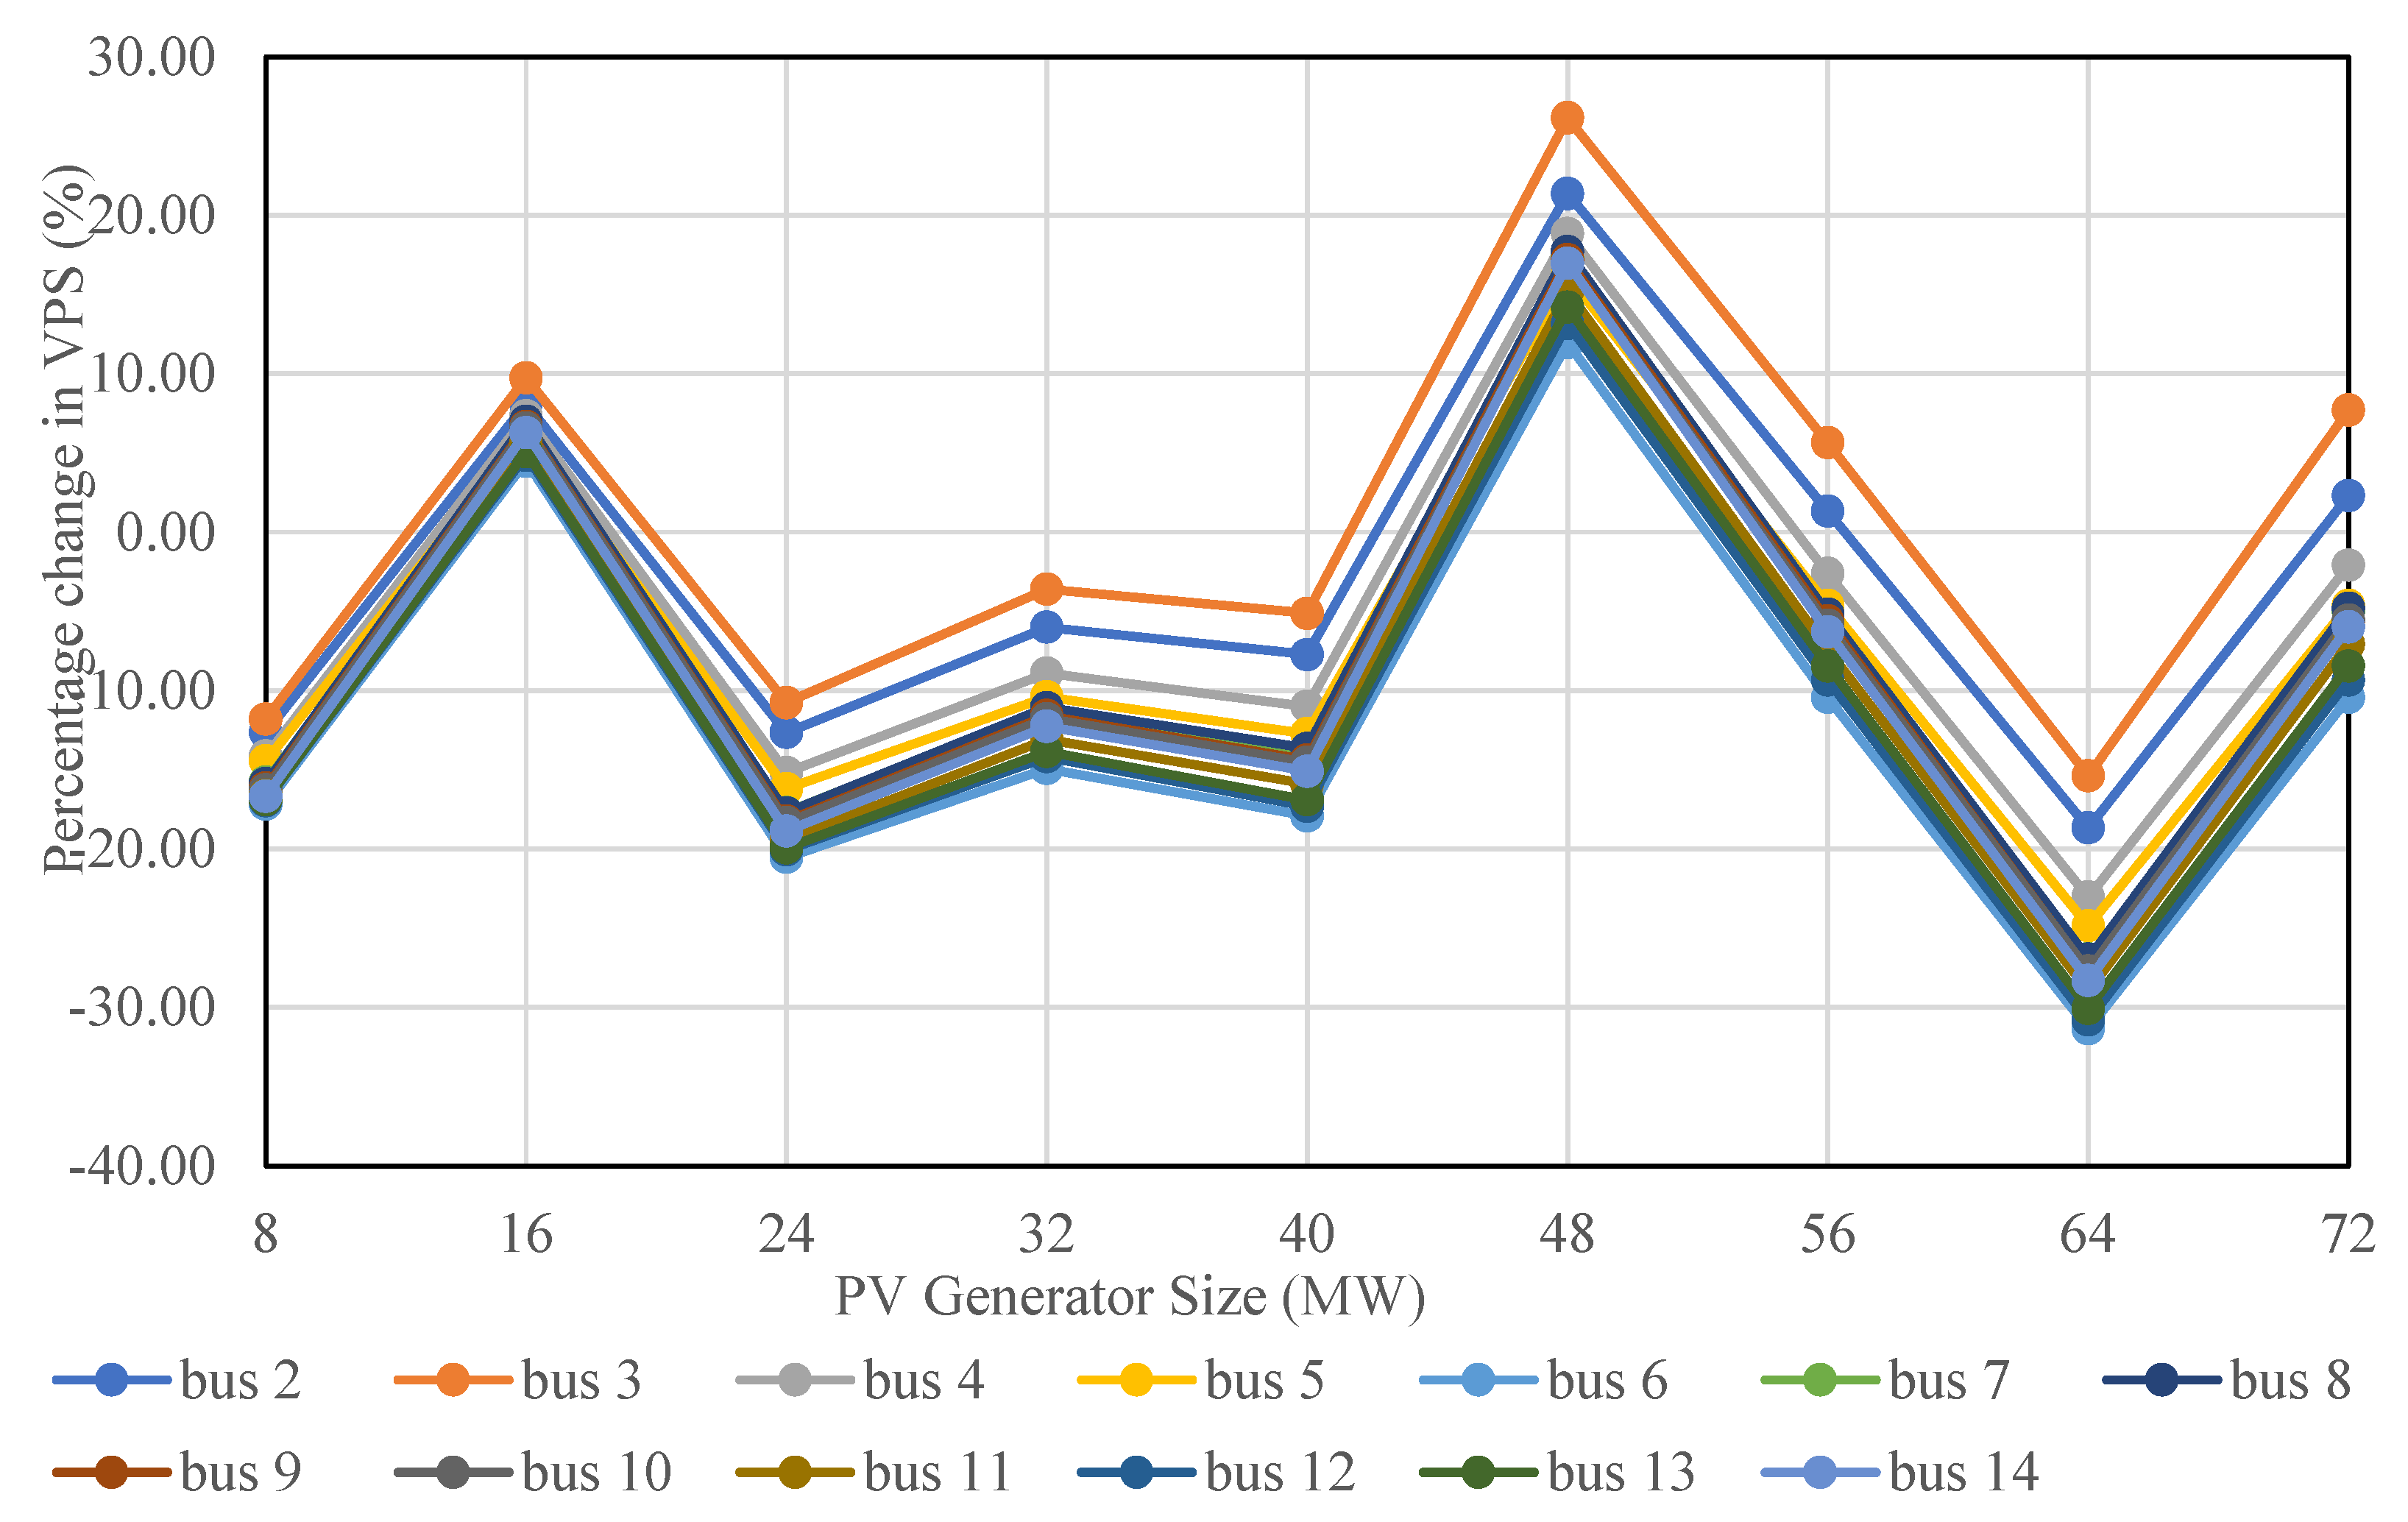
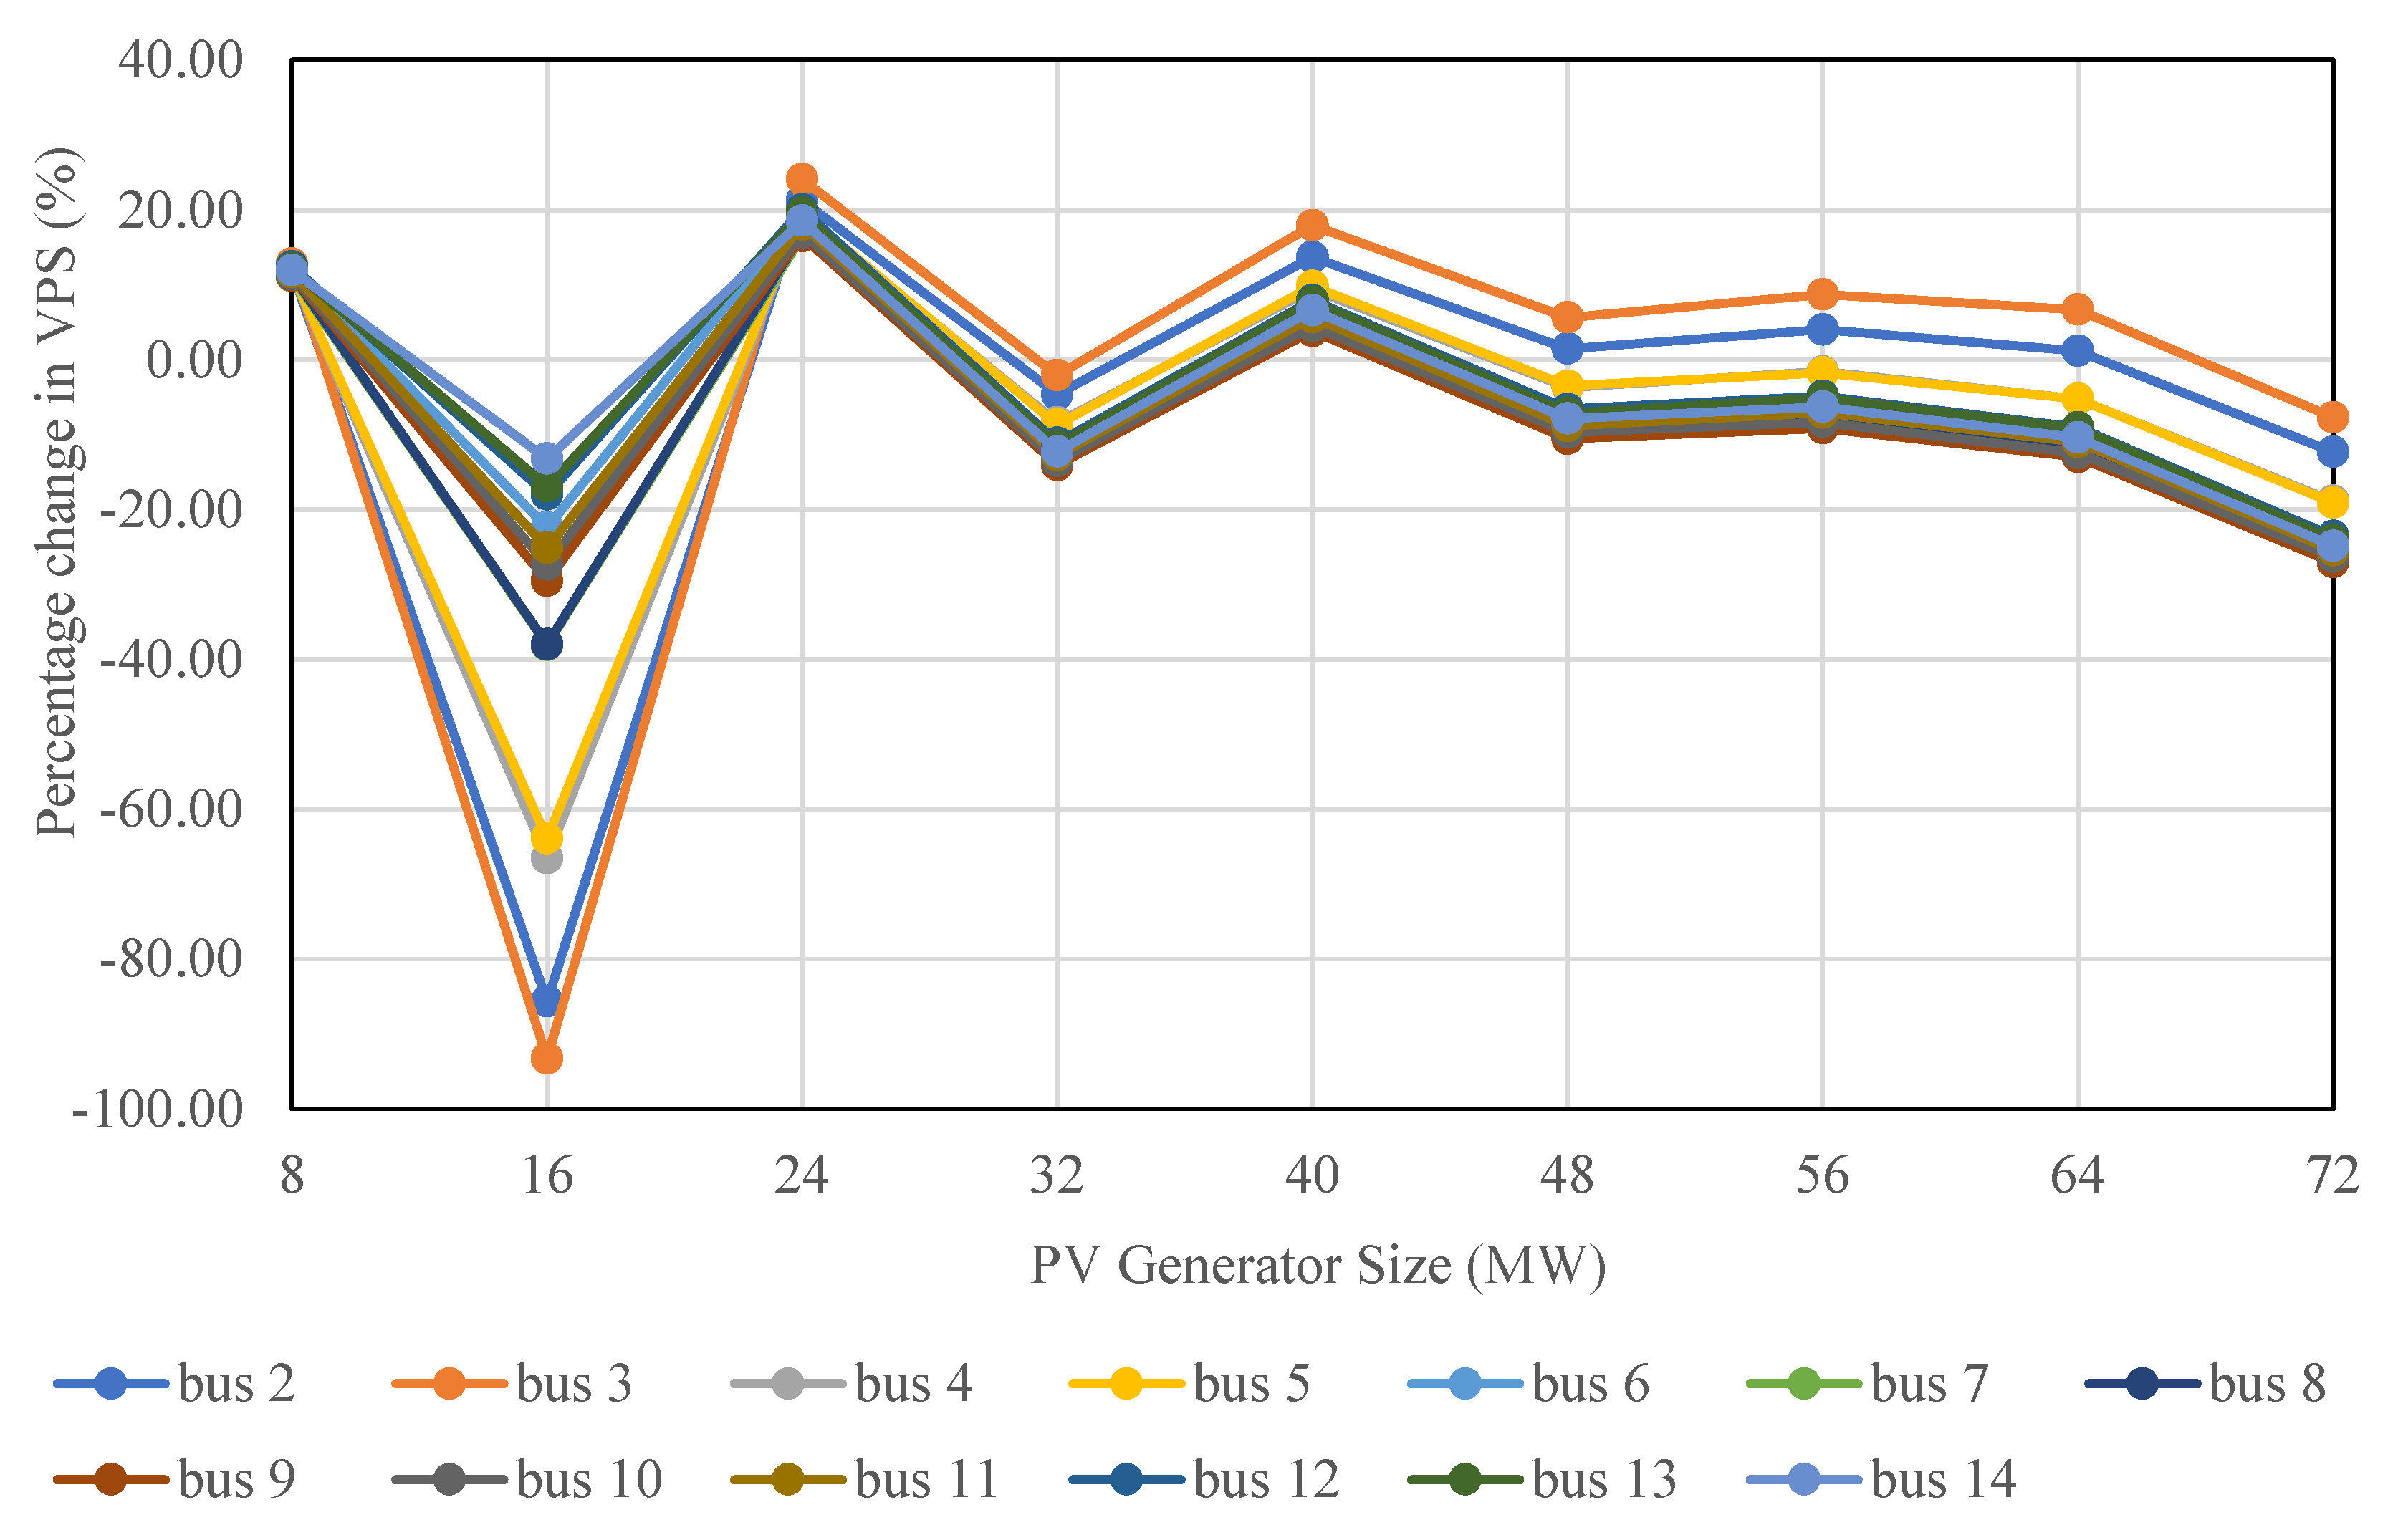
The presence of the power electronic converter system in photovoltaic plants (like other dispersed renewable generators) has made the control of both active and reactive power possible in the grid-connected PV generator to a certain degree. The reactive capability of distributed renewable generators can be varied within their control schemes. Voltage instability can arise due to the variable injection of renewable power generators (RPGs) in the power system. The simulation of different reactive power and/or voltage control values of these RPGs within an allowable operation standard to determine their influence in the power system stability is key for the determination of the best site for RPG installation, and its feasible penetrations provided that no any components of the power system are altered or no new compensator is used. Therefore, this paper reports the static voltage stability impact of solar photovoltaic generations on power networks using the PowerWorld simulator P–V- and V–Q-curves to investigate the renewable energy generator model performance suitability. The impact of varying power factor control and static voltage droop control of the photovoltaic plant on maximum generated power, threshold voltage profile and reactive power marginal loading has been examined. In addition, the concept of percentage change in voltage-power sensitivity (PCVPS) has been systematically utilized to determine the optimal location for solar photovoltaic generator on the power grid and the feasible solar photovoltaic generation penetrations have been defined for selected system buses. The following study scenarios are covered in this study:
Scenario 1: Determination of the system buses’ strengths without any PV generation installation to validate model accuracy.
Scenario2: PowerWorld-REG-model performance validation compared to other commonly used simulators model, e.g., Power factory, PSAT and PSS/E.
Scenario 3: Determination of the optimal site for solar PV placement.

1.1. Grid-Connected SPVG Structure

The deployment of grid-coupled SPVGs has recorded the fastest growth in the global energy industry sector, which occupies a key position in the international market [33,
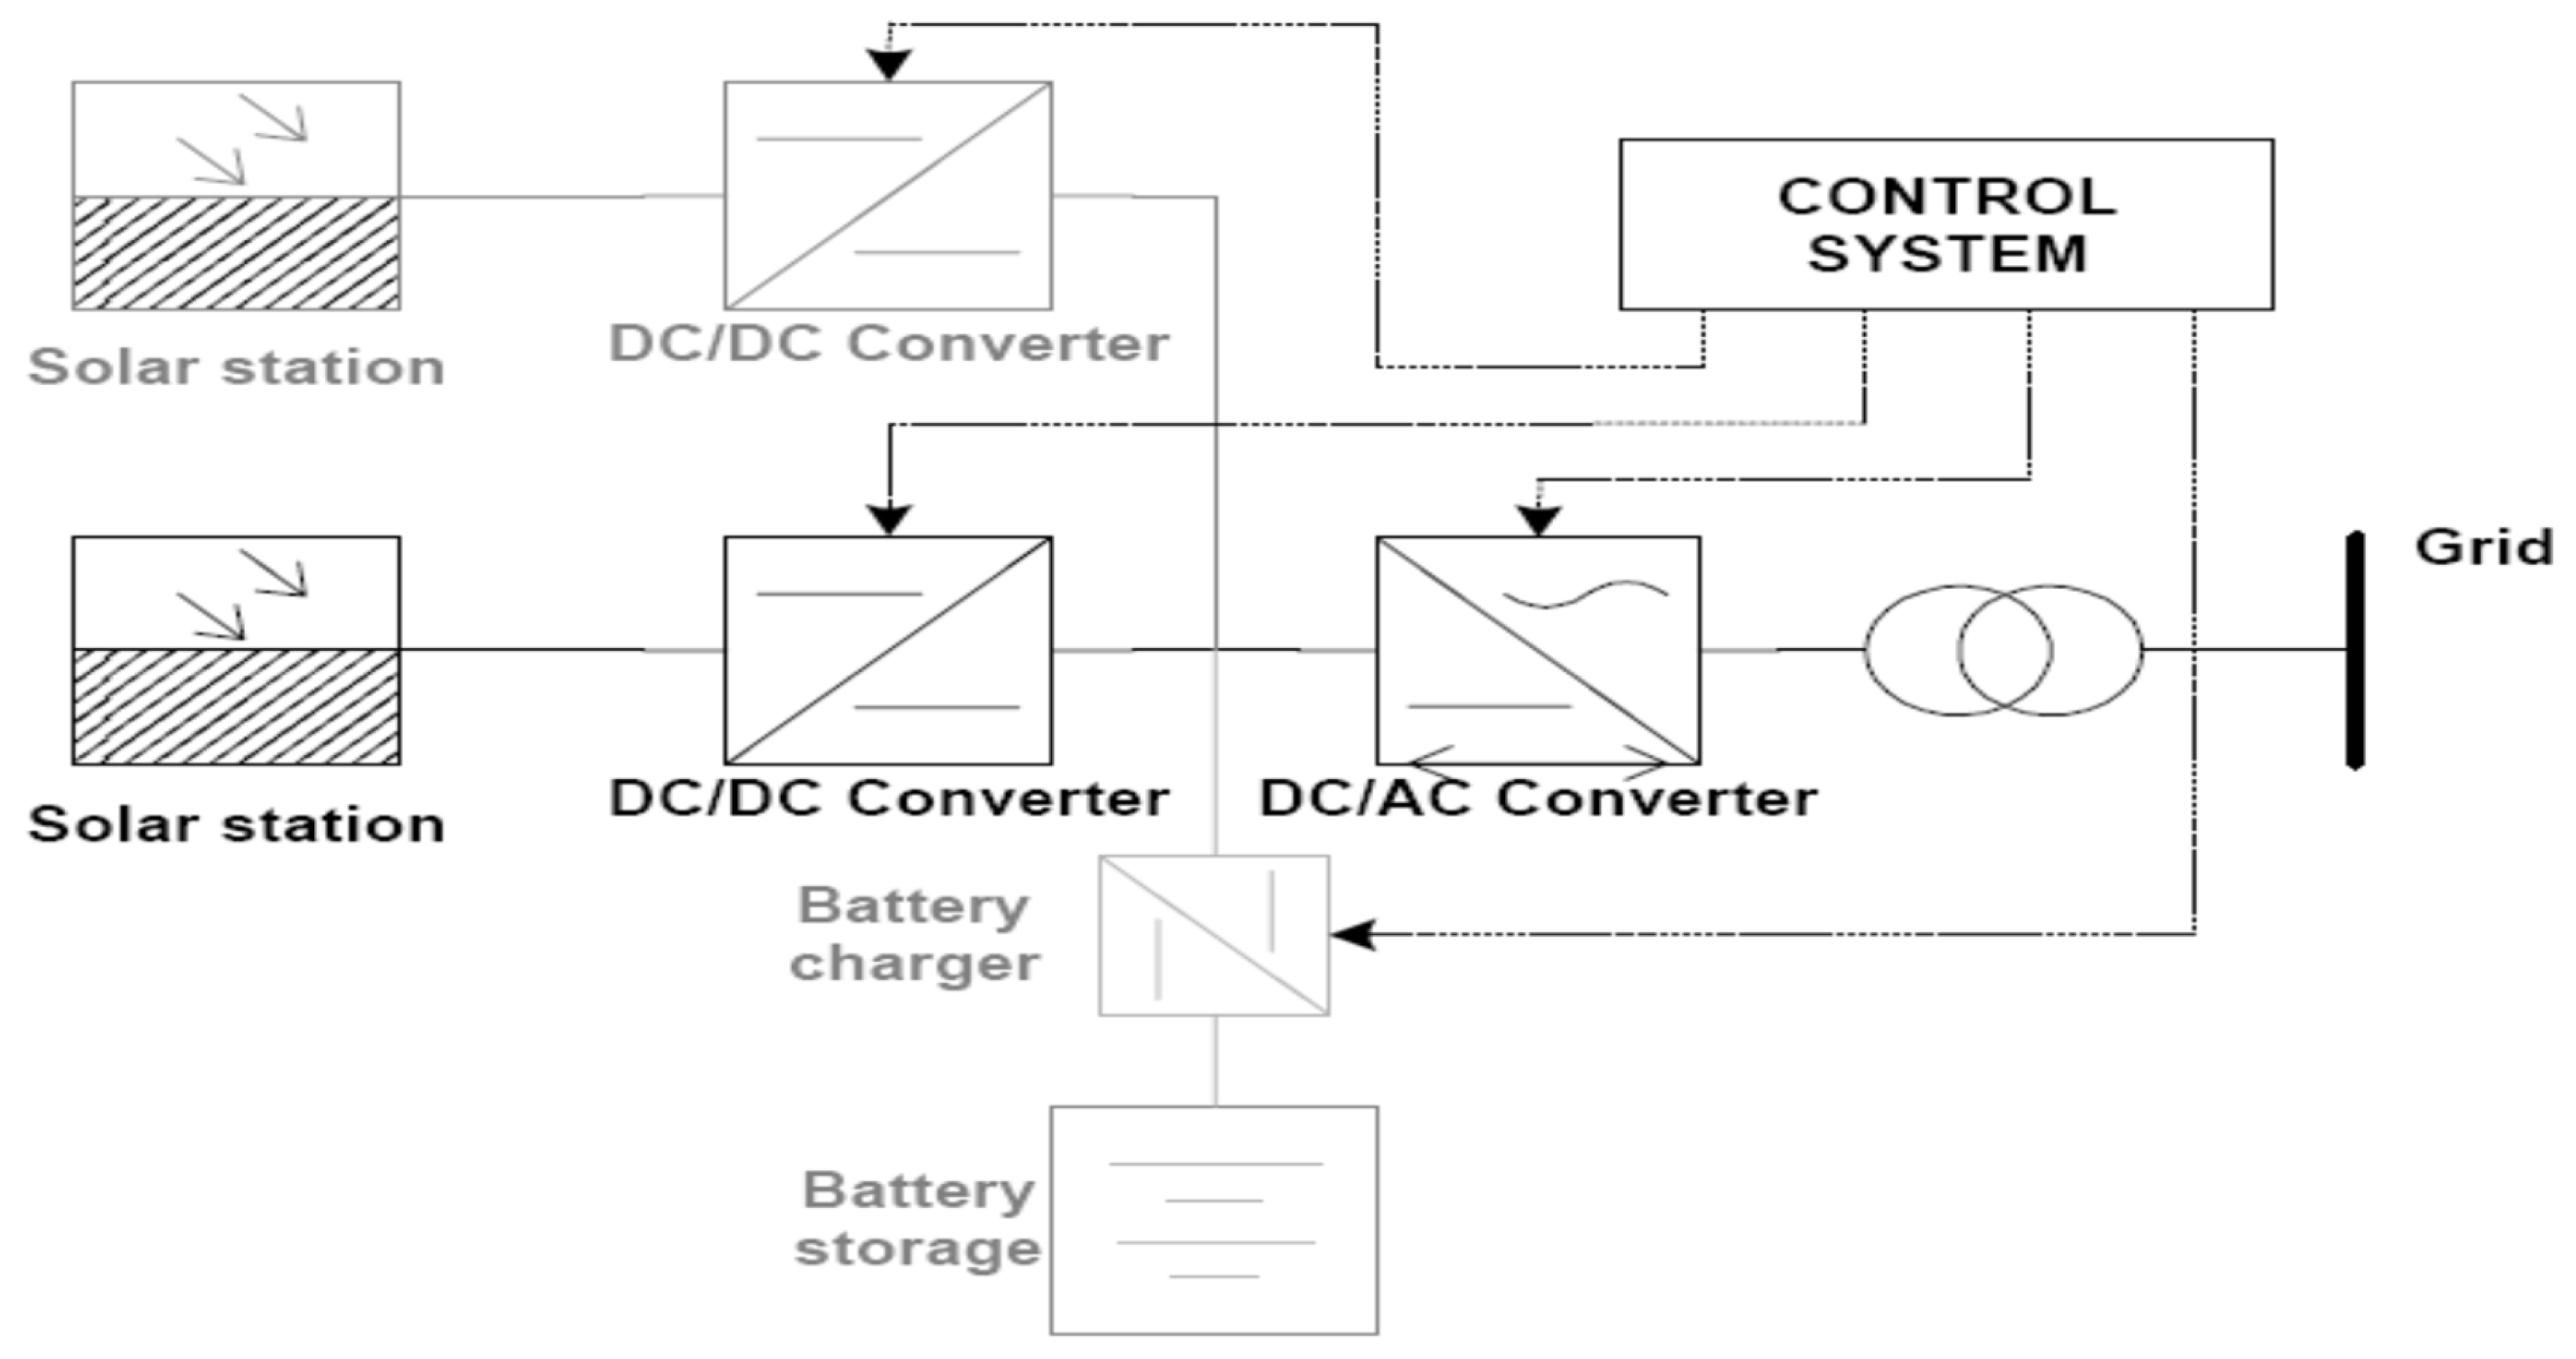
34]. Grid-connected solar photovoltaic generator (SPVG), shown in Figure 1, normally has a photovoltaic (PV) array (module), the DC/DC converter and DC/AC inverter at the grid side and some controls and converters. A storage system is not always used in large grid-connected SPVG installations, except for start-up controls of some critical loads. However, in a few cases, a large storage has been incorporated into large-scale SPVG. The DC/AC inverter helps to condition an unregulated DC output power from the PV module to make it suitable for grid connection. The DC/DC converter functions as a maximum power point tracking (MPPT) system at the output of the array, which keeps the voltage to a pre-set value. For stability studies, the response of the MPPT is considered instantaneous due to a lack of moving parts. The rest of the SPVG (DC bus, inverter and grid-connection devices) are modeled like variable speed wind turbines. Since SPVGs are normally connected to the grid via converter, it can be modeled as Type 3 or Type 4 wind turbine generator (WTG) [35,36,37,38] according to the North-American Electricity Reliability Corporation’s (NERC’s) special report on standard models for variable generation. The power converter processes output power and acts as a buffer between the generator and the grid and regulates reactive power output and/or the voltage at the point of common coupling [32,39].

1.2. SPVG Load Flow Model

In power flow analysis, a simplified solar plant can be used. This model comprises of a single generator and a unit transformer with MVA ratings equal to N multiples of individual device ratings, where N denotes the number of converters in the plant. This is appropriate for a smaller solar plant having a point of interconnection (POI) at 34.5 kV or less. For a larger plant, a second transformer is required to step from the collector voltage to the sub-transmission or transmission voltage level. Due to the relatively small size of the solar plant, the impedance and charging of the collector system are ignored. The single equivalent of the solar plant is modeled as a conventional generator coupled to a 480 volt bus or 600 volt bus [41]. The aggregator active power output (Pgen), minimum reactive power output (Qmin) and maximum reactive power output (Qmax) should tally with the solar plant capability. The reactive power capability is dependent on the number of converters available, and the need to meet interconnection requirements [36].

2. Materials and Methods

The main contribution of this study was to provide foundational knowledge for the strategic utilization of the concept of percentage change of voltage-power sensitivity (VPS) to determine optimal PV generator installation site in the power system. However, the concept of percentage change in the voltage–power stability analysis has been reported to present a clearer visualization of the power system voltage stability trend [42] than the conventional voltage sensitivity analysis [43]. This concept has been successfully employed to determine the optimal location of SPVG for system-wise improved voltage stability. Additionally, model accuracy and the impact of static renewable energy generator (REG) controls (power factor and voltage droop control) on power systems have been investigated using PowerWorld software PVQV-curves capabilities. This section presents the step by step realization of the methodology.

2.1. Study Rationale

In general, the amount of RES penetration in the power system is dependent on the system inertia. Each power system node (bus) has a different voltage strength. The voltage characteristics of the system nodes can be captured from the bus voltage reaction to real power transfer or reactive power extraction (or absorption) at the bus. The coupling of RPG to a particular system bus can alter the bus voltage strength depending on the penetration level, the control mode for the reactive power supply, or for regulating voltage deviation at the point of common coupling (PCC) to a setpoint value. With a high injection level of REG in the power system, voltage stability can be affected, which in consequence leads on to system instability [2]. The parameters of REG, which affect the connection point, are high active power injection (assumed constant supply) with limited reactive power to maintain a constant bus voltage and the ability to maintain the setpoint voltage value at PCC with available line reactive power. The PV plant in the power system is normally operated at a unity power factor. However, Institute of Electrical and Electronics Engineers (IEEE) Std 1547–2003 amended in 2018 now allows both non-unity power factor and voltage regulation [44]. In this way, the selection of the control value or size of RPG, in practice, by the grid planning engineer is based on the trade-off between the need and cost (e.g., cost of the converter). For example, for a PV plant of 10.5 MW maximum output power to operate at say ± 0.93 power factor (pf) range ( ± 4.2 MVAr) at full output power, which would provide a total of 11.3 MVA, it should be configured with 16 converters. Likewise, to operate the same plant at say ± 0.99 pf range ( ± 1.45 MVAr) for a total of 10.6 MVA, it could be configured with 15 converters [36]. However, in this study, the focus is only on the impacts of variable control values and the determination of best location site for SPVG operating at a specific control value with variable penetration using the PowerWorld simulator.

2.2. Drawing of the P–VCurve

The P–Vcurve, as indicated in Figure 2, represents a non-linear relationship between the active power and voltage. It is used to locate the maximum allowable safe loading margin (in MW) from the operating point to the critical voltage for a specific load bus(es) in a power network [45,46,47]. The PV-curve can be calculated by using a series of power-flow solutions for different load levels. Here, the load in the system is uniformly scaled up while the power factor is kept constant. The generator real power output is increased according to the size of the generator. At the knee of the P–Vcurve, the voltage falls speedily with an increase in load demand. The load-flow solution fails to converge above the nose-point, which is indicative of instability.
No practical operation can be at or near the stability limit. A satisfactory operation can be obtained by allowing a sufficient power margin off the nose-point [48,49,50]. In this study, maximum system loading, bus critical voltage profile and VPS are determined from P–Vcurves and the concept of PCVPS is further applied.

Finding the Voltage–power Sensitivity (VPS) Curve

The VPS or voltage sensitivity factor (VSF) calculates the strength of a bus. The high-sensitive bus possesses a high likelihood of voltage magnitude deviation with increasing power import and this shows the weakness of the bus. In VPS analysis, the change in network voltage considering the change in loading is investigated as expressed in Equation (1) [42,43].
V P S = | | d V d P | |
where d V and d P are the change in voltage and power transfer respectively.
In this study, VPS and the percentage increase and decrease (percentage change) in VPS were systematically utilized to characterize the system bus strength and/or voltage stability.

2.3. Drawing of V–QCurves

The V Q curve depicted in Figure 3 is a powerful tool for analyzing the steady-state voltage stability limits and reactive power margins of the power system by describing the relationship between the bus voltage and the injected or absorbed reactive power into or from the same node. It indicates the reactive power distance from the normal operation point to the voltage collapse point [51,52]. In this study, the V–Qcurve was used to find the reactive power margin for the selected bus(es).

2.4. The Method Algorithm

The algorithm for the methodology adopted in this work is presented in Figure 4. From Figure 4, based on the study rationale, the strengths of the system buses (depicted in Figure 5) without SPVG were evaluated from the plots of the P–Vcurve and V–Q-curve. The ranking of bus strength is based on reactive power margins, voltage–power sensitivities and voltage profile. Sequel to this, a PV generator was installed on any of the nodes of the base network of interest and its model controls (pf control and static voltage droop control) were varied and their effects recoded. In consequence, a desired model control value was selected. Operating at the selected control value, the location of an aggregated PV plant of constant size was changed from one bus to another across the network. The voltage–power sensitivities resulting from each of the node positions of the SPVG were recorded and, equally, their percentage changes with respect to the base case were analyzed. Four bus locations that yielded much better system stability were selected for convenience. On the selected buses, the penetration of the PV plant was varied and at each injection level, the VPSs and PCVPSs of the whole network were tracked. Any of the selected buses that yield the highest percentage decrease in VPS at the different penetration levels becomes the best site for the SPVG in the power system under consideration.
The use of PowerWorld does not necessarily require the mathematical specification of network model unlike other software such as MATLAB or Power Factory or PSAT. The PowerWorld has a mathematical model and numerical parameterization of each of the network model components plus those of the controls of renewable energy generator, where the solar photovoltaic generator can be specified. These capabilities are inbuilt in the simulator and are reduced from the reality of the users. The user only has access to the software graphical user interface—on which he picks network elements for power system design. This informed the rationale for the design parameter verification for system strength characterization where it has shown high capability [50] and renewable energy generator static model controls, which has not gain much credence in the available literature. This is called for to provide educational knowledge as well as the reliability of simulated results.

2.5. Benchmarked System Description

The network diagram of the benchmark system used in this study is illustrated in Figure 5. The system was comprised of two synchronous generators one main 615 MVA synchronous generator at bus 1, and a smaller 40 MW synchronous generator at bus 2 (base case) [53] and three synchronous condensers (modeled in the PowerWorld simulator with a continuous shunt compensation element), 14 buses, 17 branches and four 2 winding transformers. The base-case load of the network was 259 MW and 73.5 MVAr. The total in-service generation was 272.1 MW and 122.7 MVAr with generator positive spinning reserves of 368 MW and negative spinning reserves being 272.1 MW. The network was modified to have three voltage levels (designated in different colors on the online diagram); 132 kV at buses 1–5, 33 kV for the rest buses except for bus 8, which was 11 kV, which results in a power network with high voltage and medium voltage levels. Additionally, three of the four transformers were configured as voltage magnitude regulators. The significance of selecting a benchmark system is that it offers the ease of comparing and verification of simulation results using different software packages. The SPVG model used was based on the General Electric Company (GE) solar photovoltaic plant each of 0.7 MW, 0.98 pf and 0.48 kV rating per converter as presented in Table 4. Power factor (pf), 0.98 is considered to reduce the number of converters requirement and for a reactive power of about ± 0.142 MVAr per unit. A pad transformer of 0.48/33 kV connects the aggregate solar generator to the medium voltage and for the connection to 132 kV voltage side, a feeder of 120 MVA rating, and a step-up transformer of 33/132 kV were further added. The data for the solar system design were obtained from [41]. The network simulation parameters are given in Table 1, Table 2, Table 3, Table 4, Table 5, Table 6 and Table 7.

3. Results and Discussion

The validity of simulations results of the benchmark system with RES integration based on static voltage stability using the PowerWorld software package was discussed in this section. The concept of the percentage change in voltage–power sensitivity was presented to demonstrate its utilization for determining optimal installation node for RESs in power systems.

3.1. Scenario 1: Determination of the System Buses’ Strengths without Any PV Generation Installation

P–V- and V–Q-curves were generated for the study case and subsequently for a system with solar PV (at constant irradiance) integration for the subsequent scenarios.

3.1.1. Scenario 1A: PV-curve

The P–V-curve was drawn to evaluate the maximum loadability of the system, which was 275 MW as shown in Figure 6 and Figure 6 presents a clear picture of the buses’ critical voltage. In addition, Figure 7 depicts V–P sensitivity versus the ramping power for all buses of the system. It is important to note that V–P sensitivity (VPS) or the voltage sensitivity factor (VSF) calculates the strength of a bus. The highest sensitive bus possesses a high likelihood of voltage deviation with increasing power import. From Figure 7, it can be observed that the bus participation in system stability decreased in the following order: bus 1, 2, 5, 8, 4, 3, 7, 6, 9, 11, 10, 12, 13 and 14. It turns out that bus-14 was the most sensitive bus and thus the weakest bus.

3.1.2. Scenario 1B: V–Qcurve

The V Q curve was plotted to find the reactive power margin of each system bus as illustrated in Figure 8. Figure 8 also shows that bus-14 had the least reactive power margin. These results and interpretation confirm the results from previous studies [50,54] on the test network except that some results claimed that bus 12 was the weakest. These results revealed the accuracy of the simulation and the performance efficiency of P–V- and V–Q-curve tools in Power World.

3.2. Scenario 2: Model Validation

PowerWorld simulator renewable energy source (RES) static model controls have been explored to investigate the impact of renewable energy source static model controls on the simulated system and the results obtained on the effects of the control on V–Q marginal stability agreeing with those obtained from using software packages such as Power factory, PSAT and PSS/E [17,54]. The verification is necessary to affirm the capability of the PowerWorld renewable energy generator model. Thus, validation was done by drawing the P–V-curve and V–Q-curves at different power factor controls [41] and voltage droop controls [55] of the static solar PV generator model in PowerWorld. For ease of study, a solar PV generator of 8.75% of installed capacity (640 MW) was arbitrarily chosen and coupled to bus-14; the weakest busto yield a more noticeable impact on the network. The SPVG was operated at varying power factor (pf; boundary pf), to evaluate its influence on the PV generator reactive power capability, which in turn impacts the system voltage stability level, V–Q voltage instability margin and the total system generation. Power factors of 0.9, 0.94, 0.96, 0.98 and 1 were experimented on in this study. Table 8 shows the maximum power generated (in MW) at different power factors. Figure 9 shows the variation of V–Q voltage instability margins with changes in the power factor. The change in the voltage profile of buses 6, 9, 10, 11, 12, 13 and 14 for changes in the pf-value is presented in Figure 10.
Figure 9 shows that as pf-value decreased, the reactive capability of the solar PV improved and thus the bus V–Q voltage instability margin, which led to a system voltage improvement (see Figure 10). Of course, a PV plant model with a converter similar to the wind turbine model of Type 3 or 4 can dispatch more reactive power at varying power factors when operated other than the grid code unity power factor requirement [56,57]. So, 0.98 pf was adopted in subsequent scenarios.
From Figure 11, it can be observed that MVAr loading of bus 14 remained constant for different voltage droop values (1%, 3% and 5% voltage droop) at the reactive power of ± 27.12 MVAr which corresponded to the 0.9 power factor control MVAr value. Besides, the operational limit (in MW) and the threshold voltage on the   PV -curve for the selected bus.

3.3. Scenario 3: Determination of Optimum Solar PV Location

Different factors should be considered before the integration of the PV generator to the grid. For example, land availability, transmission line right-of-way, cost–benefit, etc. Therefore, the influence of REG at different locations on a power network should also be evaluated to ensure effective planning and operation decision making. This study scenario intended to harness this variation of SPVG influence based on different installation locations to determine the optimum bus for SPVG placement on the benchmarked system using the concept of percentage change in voltage–power stability analysis. This scenario is divided into two parts as follows:
  • The changing of the same size PV generator bus location on the system.
  • Increase in PV penetration levels on the four most suitable PV generator locations obtained from the first part.
For the first part, the 64 MW peak (10% of 640 MW installed capacity of the base case) solar PV generator at 0.98 boundary power factor operation was used to penetrate an individual bus at different instances. The percentage change in VPS for all the buses for changing PV generator locations is presented in Table 9. From Table 9, when the PV generator was installed at bus 3 and bus 6, the entire system buses recorded a percentage decrease in VPS (see Figure 12 and Figure 13). With the PV generator coupling to buses 9, 10, 11, 12 and 13, the system’s buses exhibited a lower percentage decrease in VPS compared to bus 6 location and a percentage increase in VPS for bus 2 and bus 3, which experience a percentage increase in VPS. Moreover, when the PV generator was coupled to bus 14, buses 2, 3, 4 and 5 experienced a percentage increase in VPS whereas the rest of the buses have a percentage decrease in VPS. Finally, PV plant location at buses 4, 5, 7 and 8 present the system buses with a percentage increase in VPS. Thus, it turns out that solar PV at buses 3 and 6 improved the whole system bus voltage stability. However, the system voltage stability decreased the most at location bus-4 and followed by 7, 5 and 8. Hence, from these findings, buses 6, 3, 9 and 13 were the first four most suitable buses for PV plant installation, followed by 10, 12, 11 or 14 (no clear distinction), then 8, 5, 7 and 4 respectively.
For the second part, the PV plant was installed on buses 3, 6, 9 and 13 individually to determine the best site for PV generator installation. PV penetration of 8–72 M W P e a k with an 8 M W P e a k step size (i.e., 1.25% of the network capacity) was considered for the analysis. The location of the PV generator at bus 3 as shown in Figure 14, yielded high voltage sensitivity values for buses 9, 10, 11, 12, 13 and 14 for each level of PV penetration. From Figure 15, having a PV plant placed at bus 6, the monitored buses V–P sensitivities were lower than the values in Figure 14. However, from Figure 16, the voltage sensitivity values were lower than those depicted in Figure 14 but higher than Figure 15 values. For Figure 17, the values of P–V sensitivities were slightly higher than in Figure 15 but much lower than PV generator at bus 3 and bus 9.

3.3.1. Scenario 3A: Percentage Change in V–P Sensitivity (VPS)

From the results of the PV generator placement at bus 3, 6, 9 and 13, the graphs of the percentage change in VPS for the test system are illustrated in Figure 18, Figure 19, Figure 20 and Figure 21.
For the PV generator at bus 6 as shown in Figure 19, the system experienced the highest percentage decrease in VPS with most of the penetration levels. The percentage decrease in VPS for PV generator placement at bus 3 in Figure 18 was slightly higher than the percentage decrease when the PV generator was on bus 13 in Figure 21. Additionally, the percentage decrease in VPS with a PV plant at bus 9 in Figure 20 was much lower than the values in the other three locations.

3.3.2. Scenario 3B: Feasible PV Penetration Levels

With the benchmark system parameter unchanged, the feasible PV penetration levels (for the considered PV sizes) for each selected bus are shown in Table 10. Note that a penetration level is feasible when the system shows an overall improvement of voltage stability.
From all of these analyses, it could be concluded that bus 6 was the optimal bus for PV generator placement and the next best location was bus 3, then bus 13 and followed by bus 9.

4. Conclusions

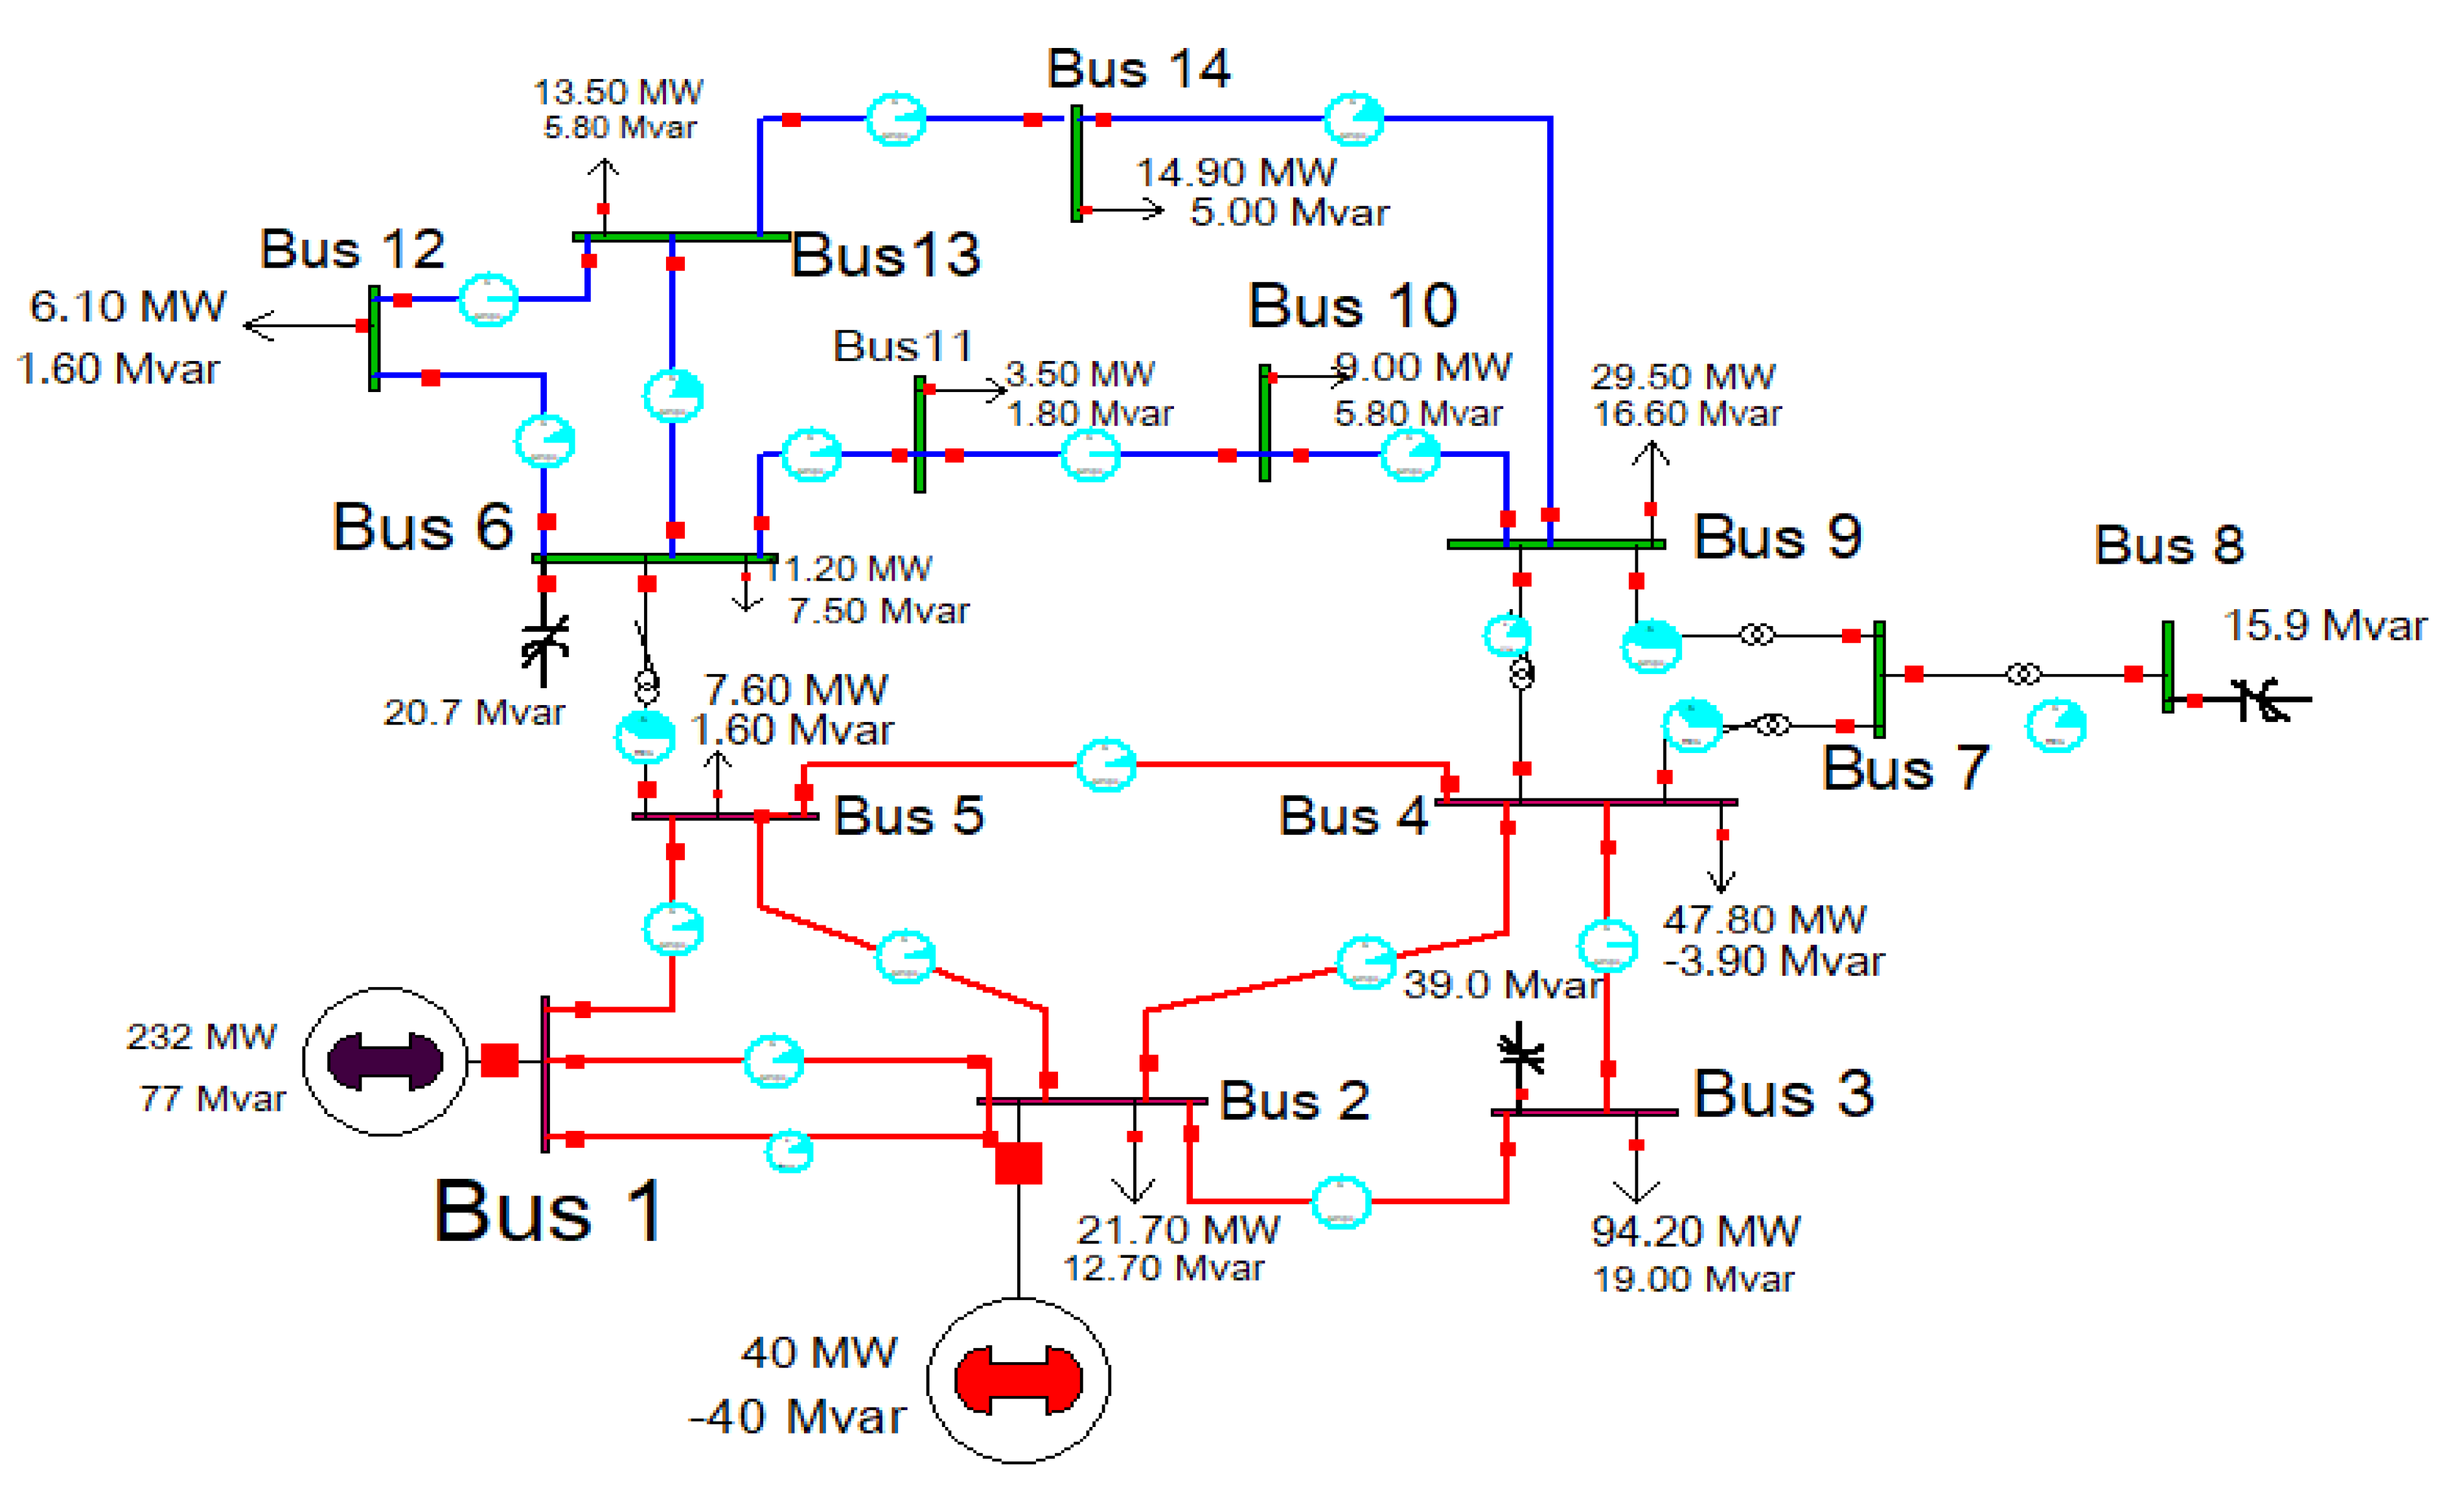
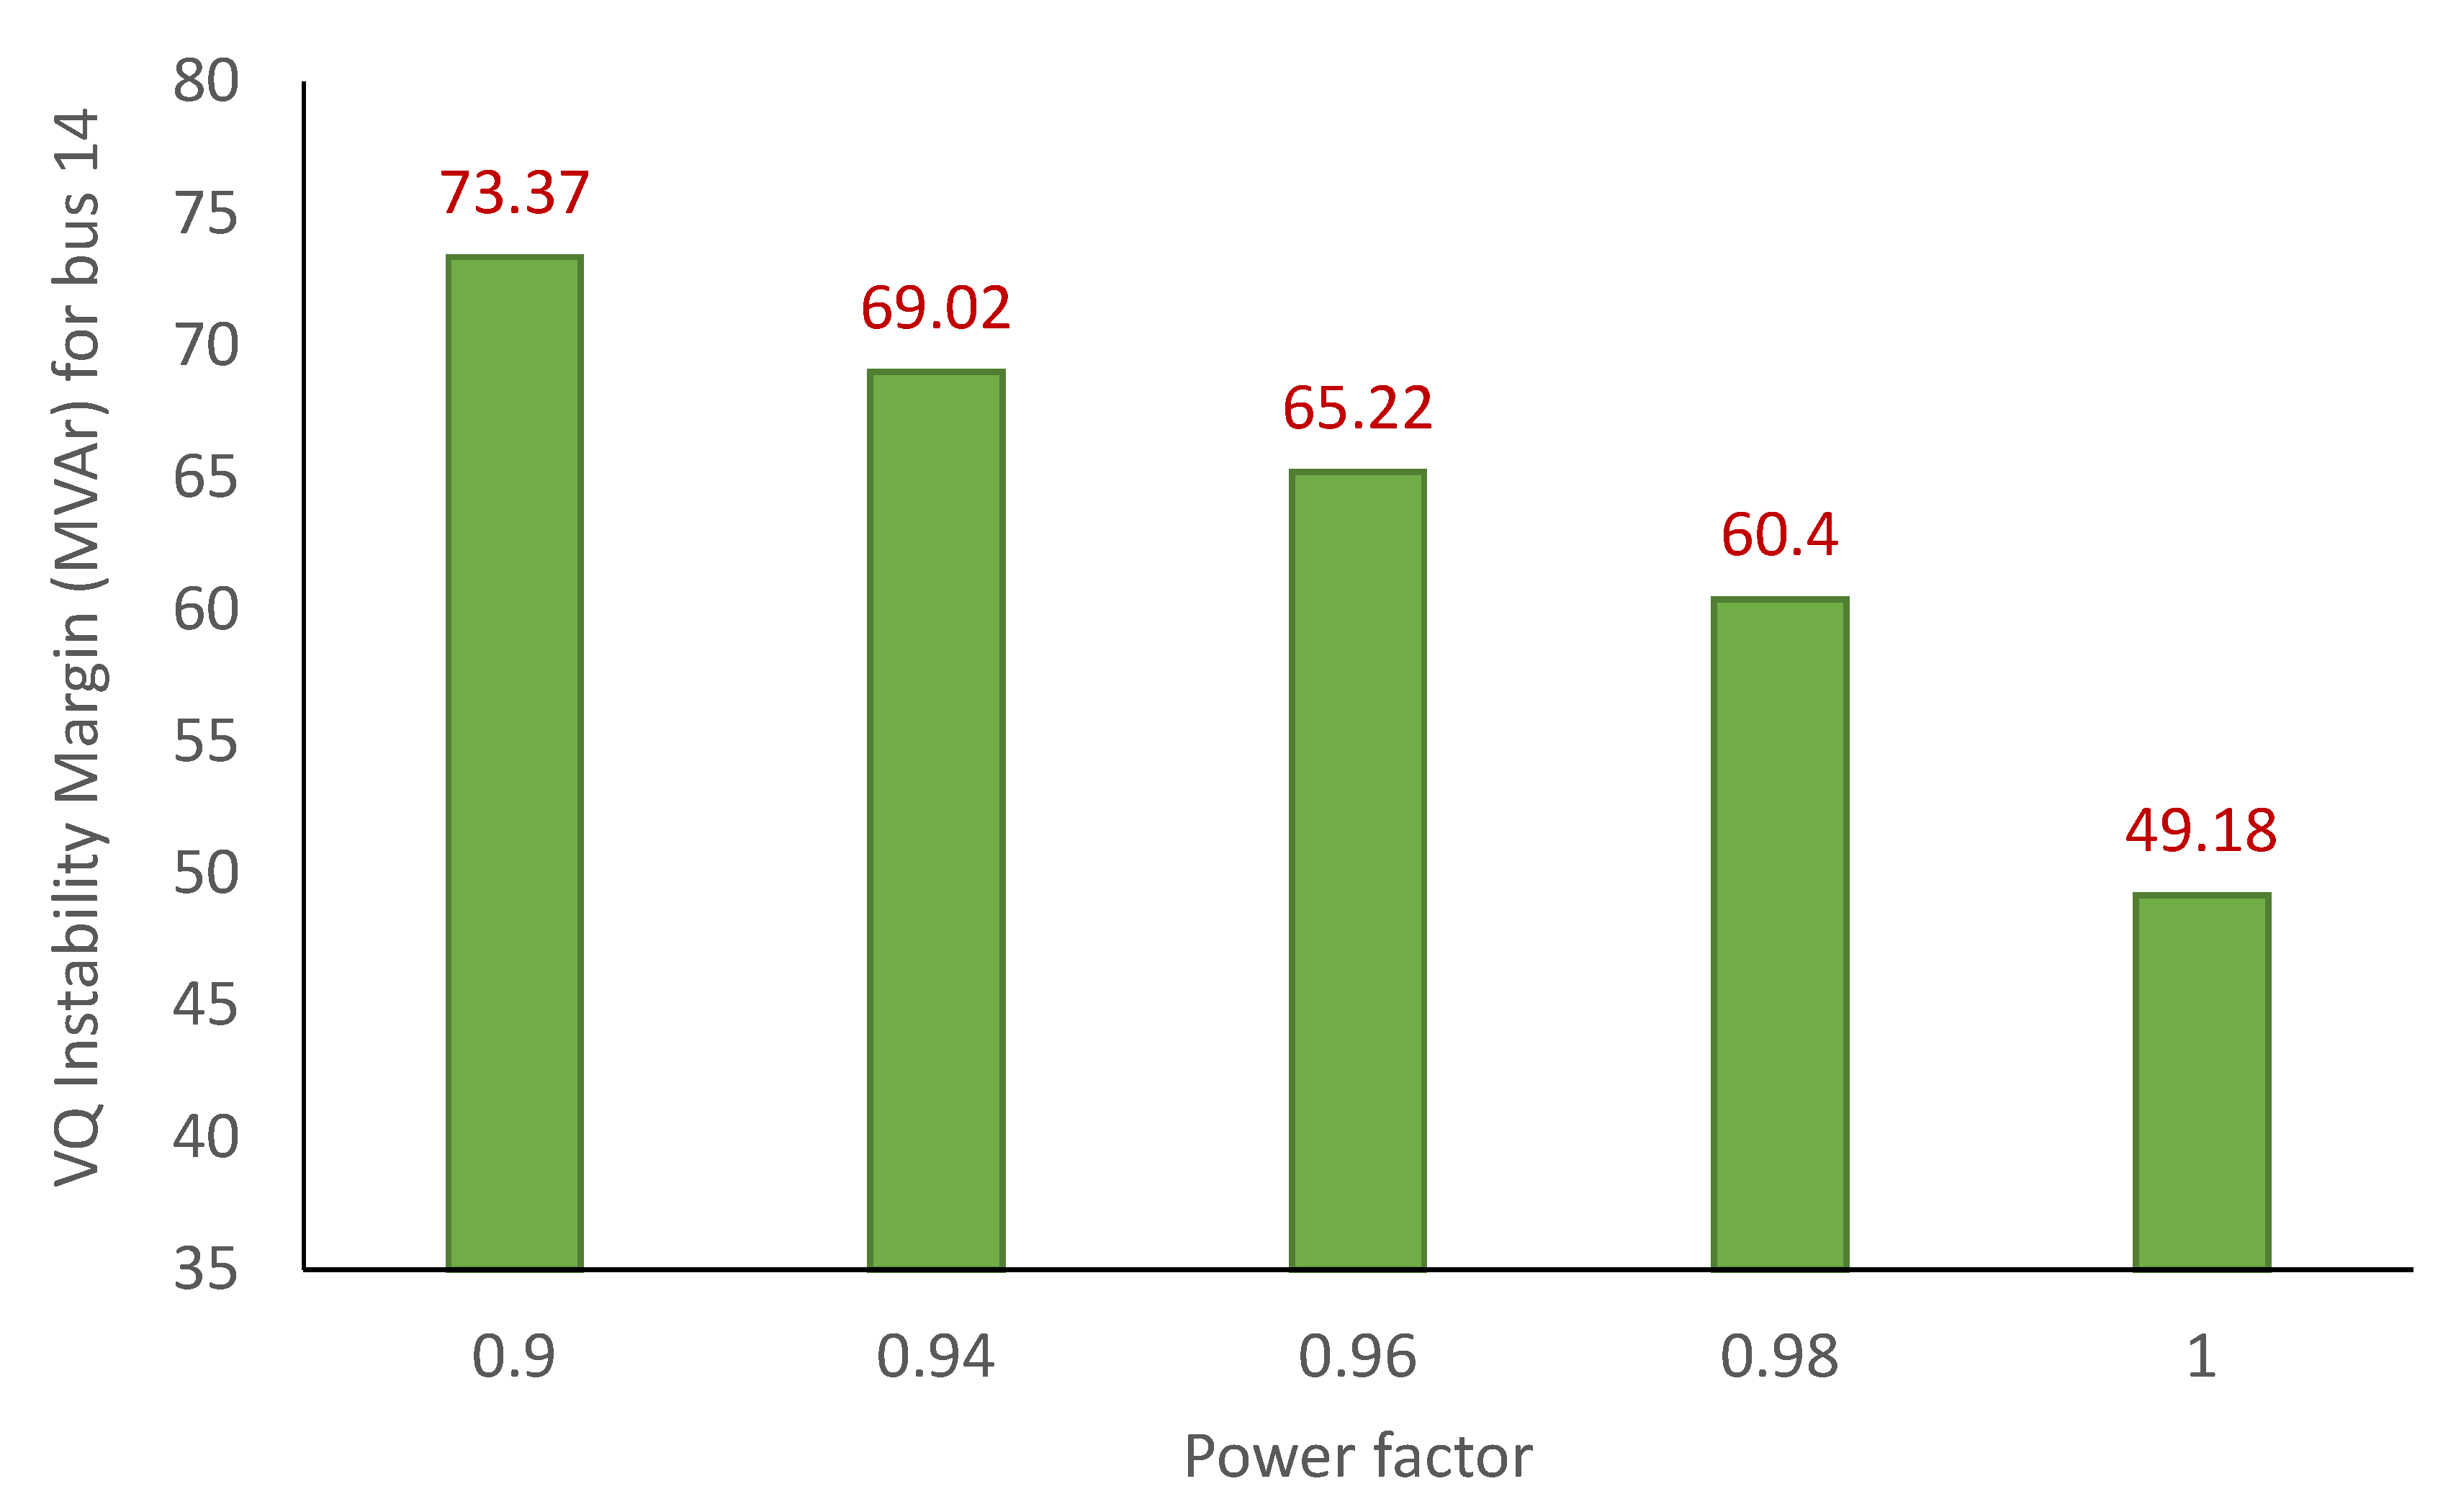
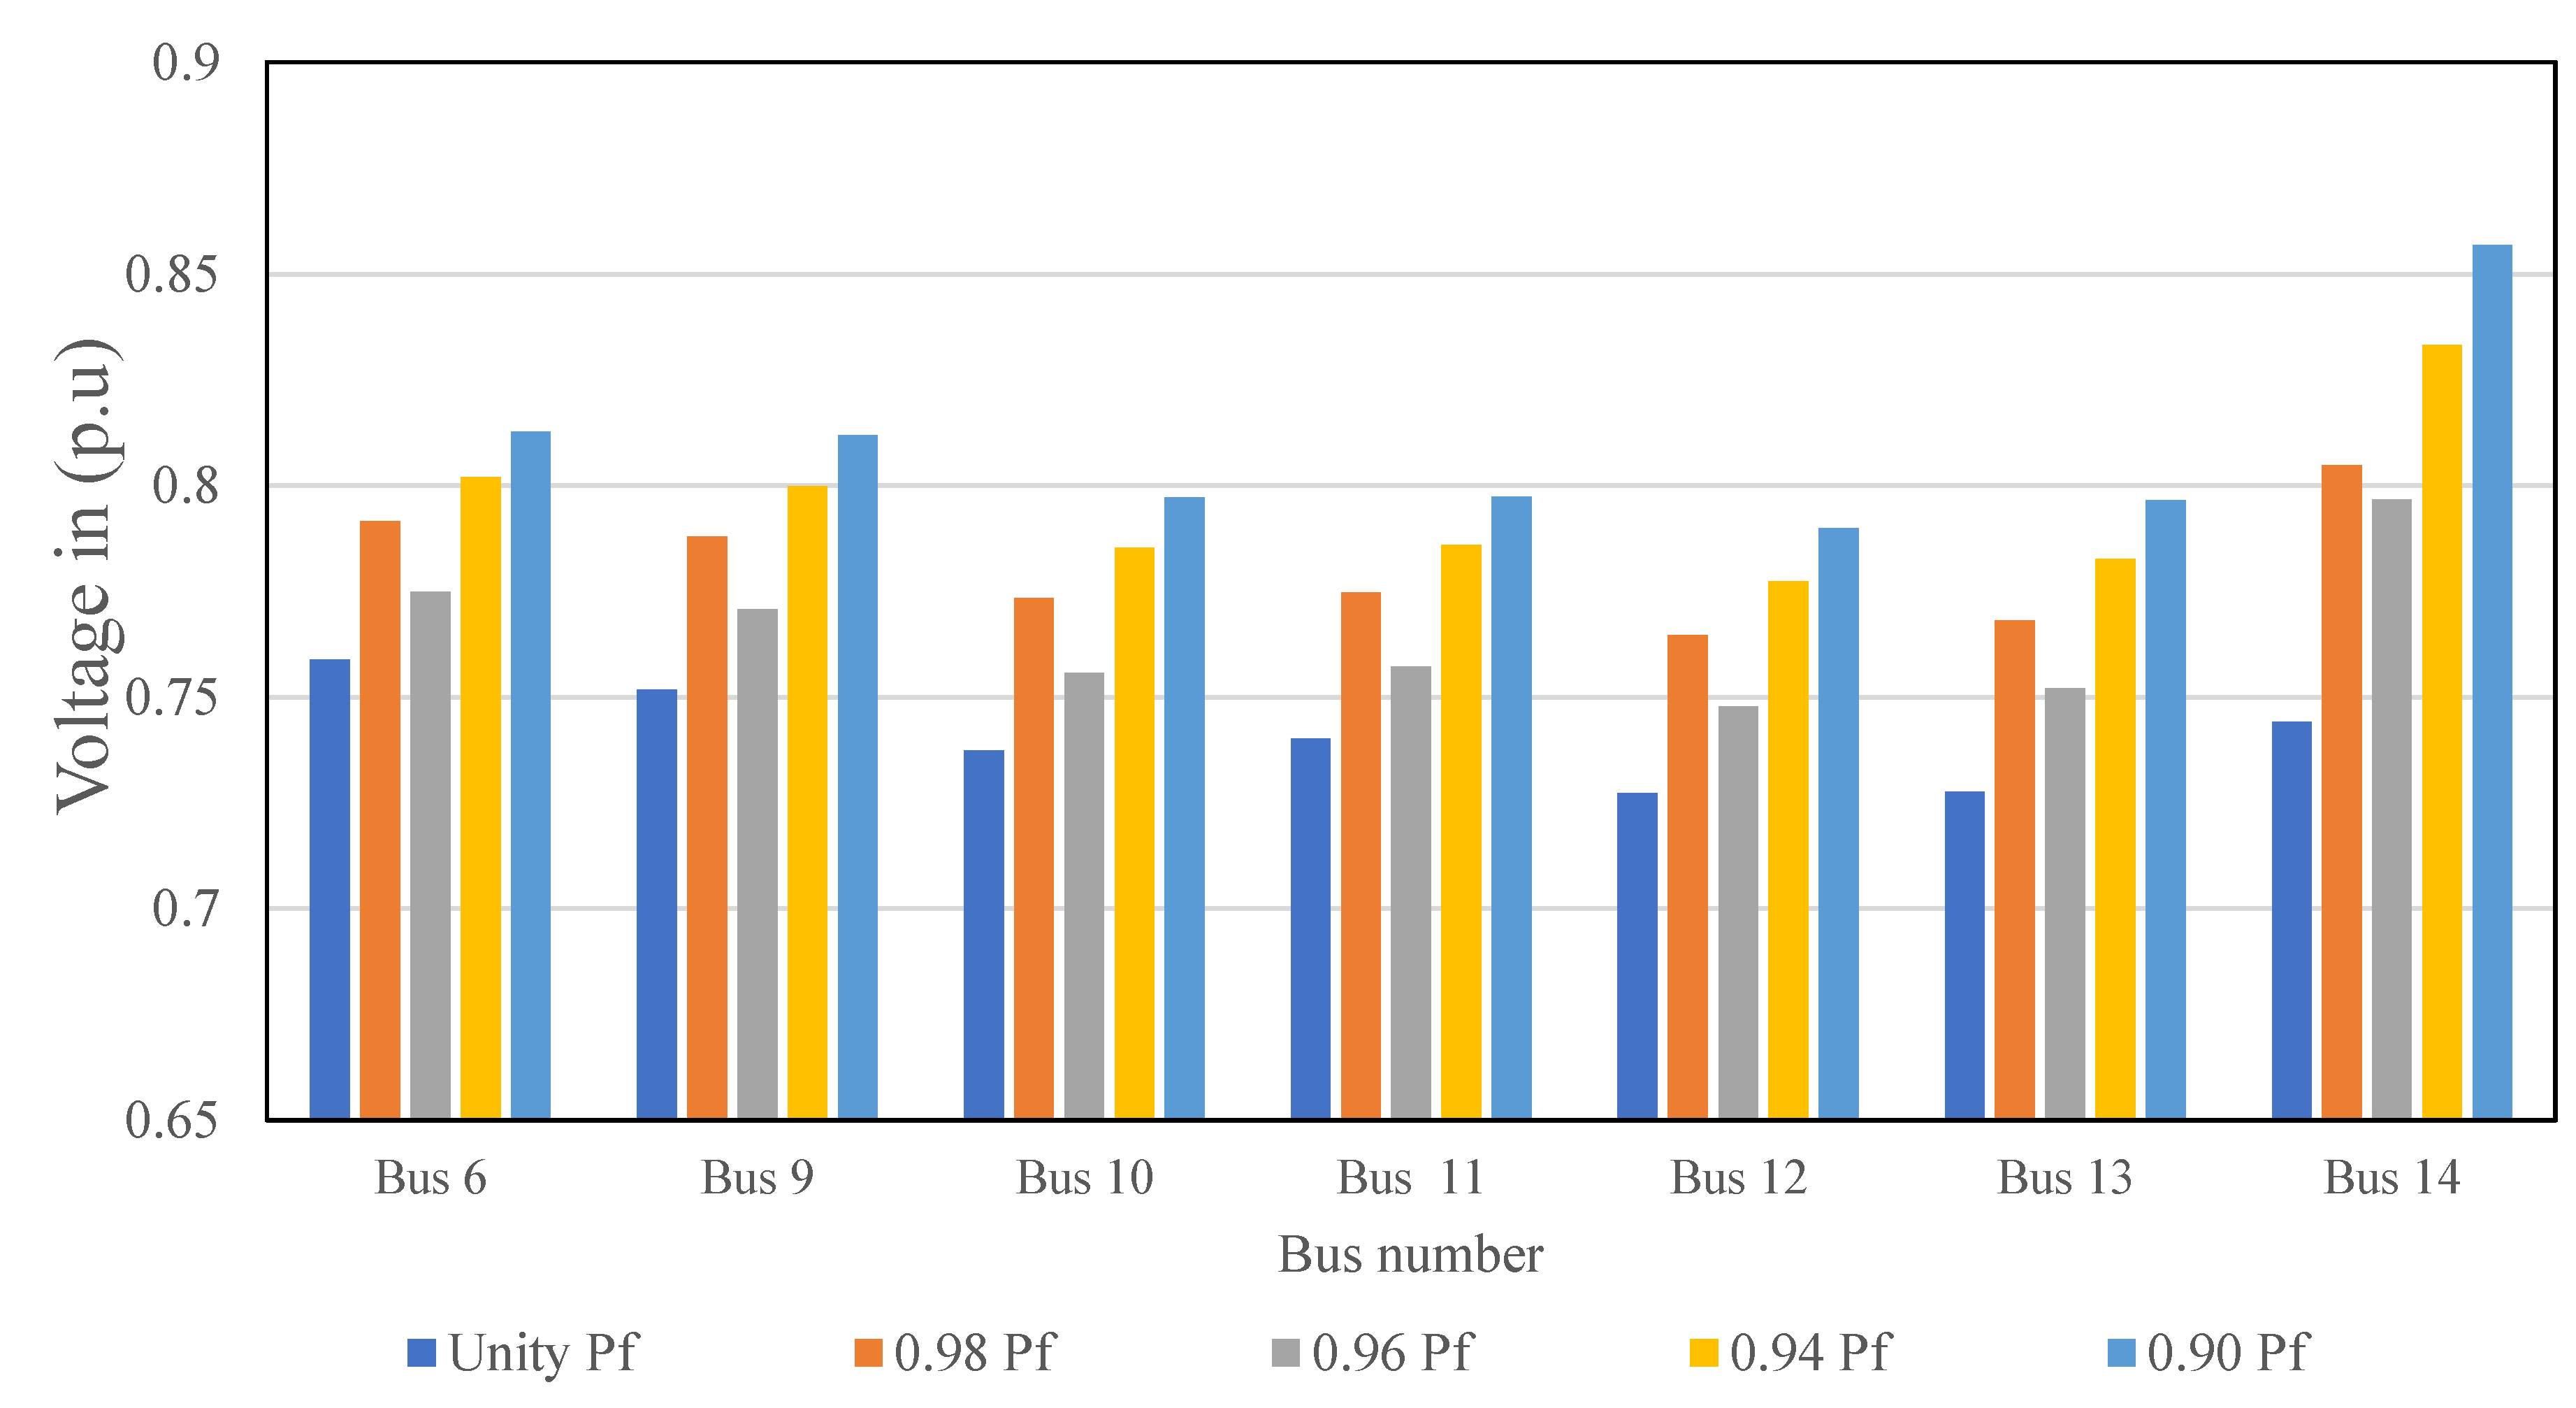
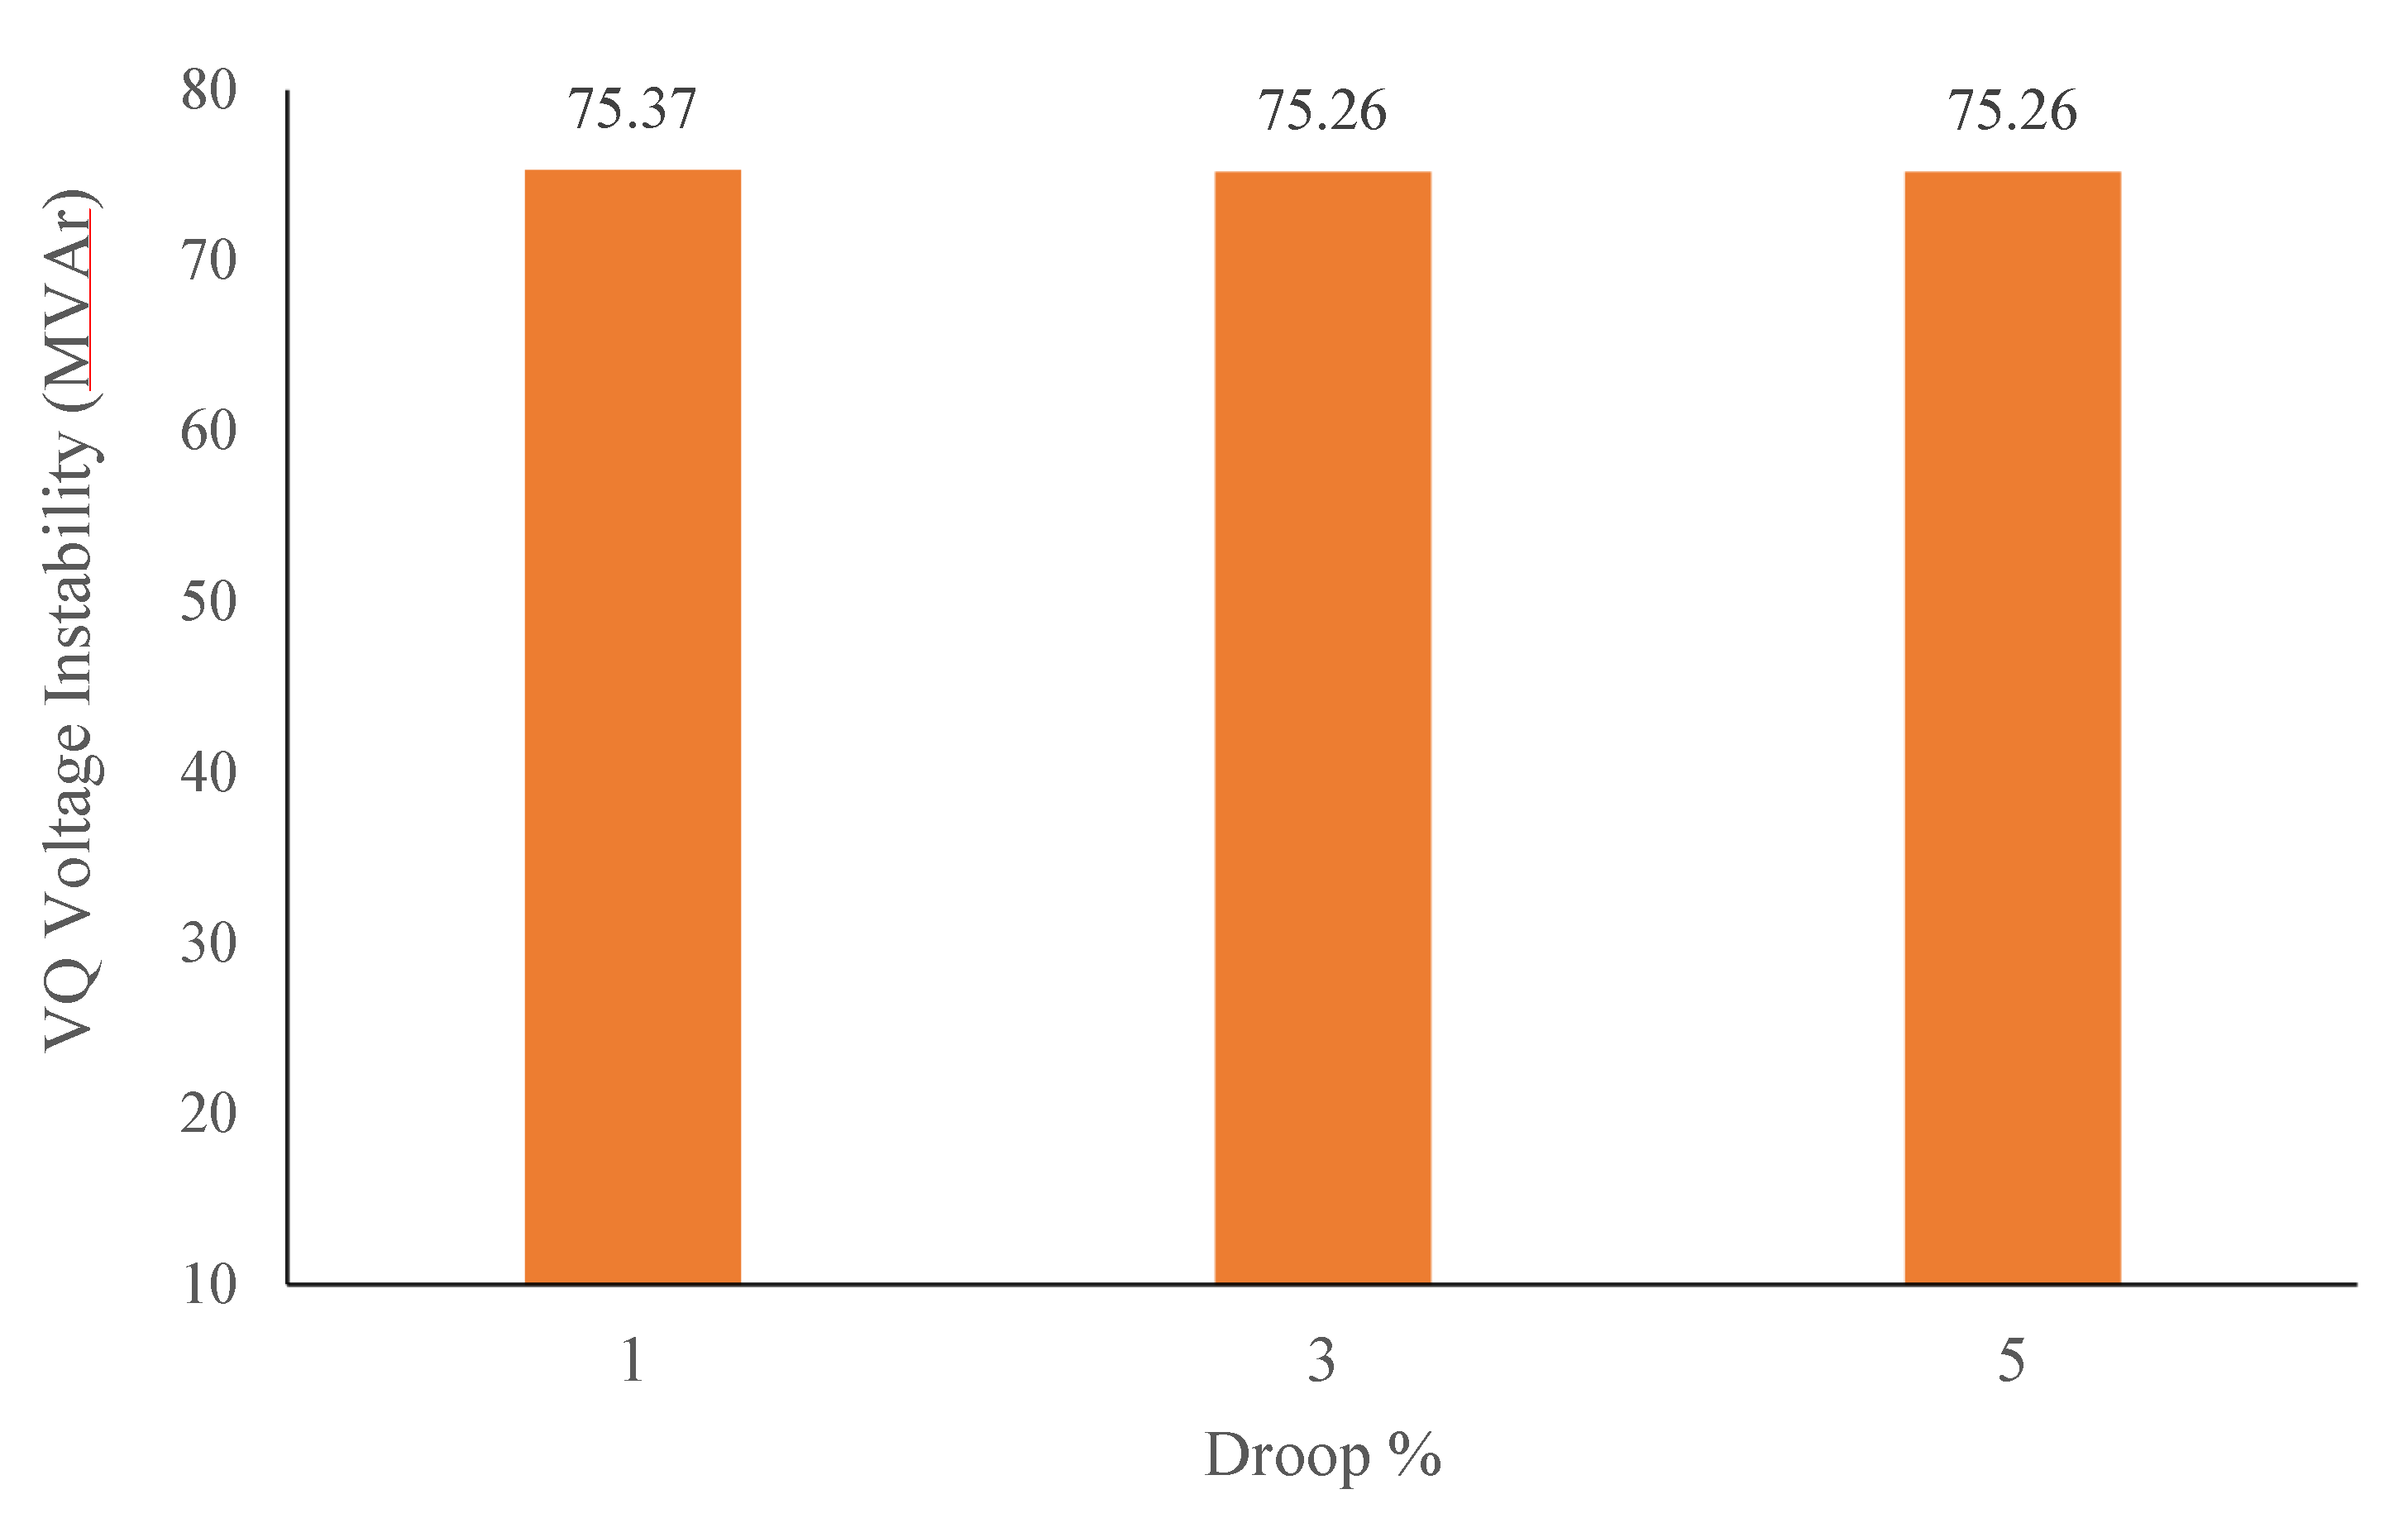
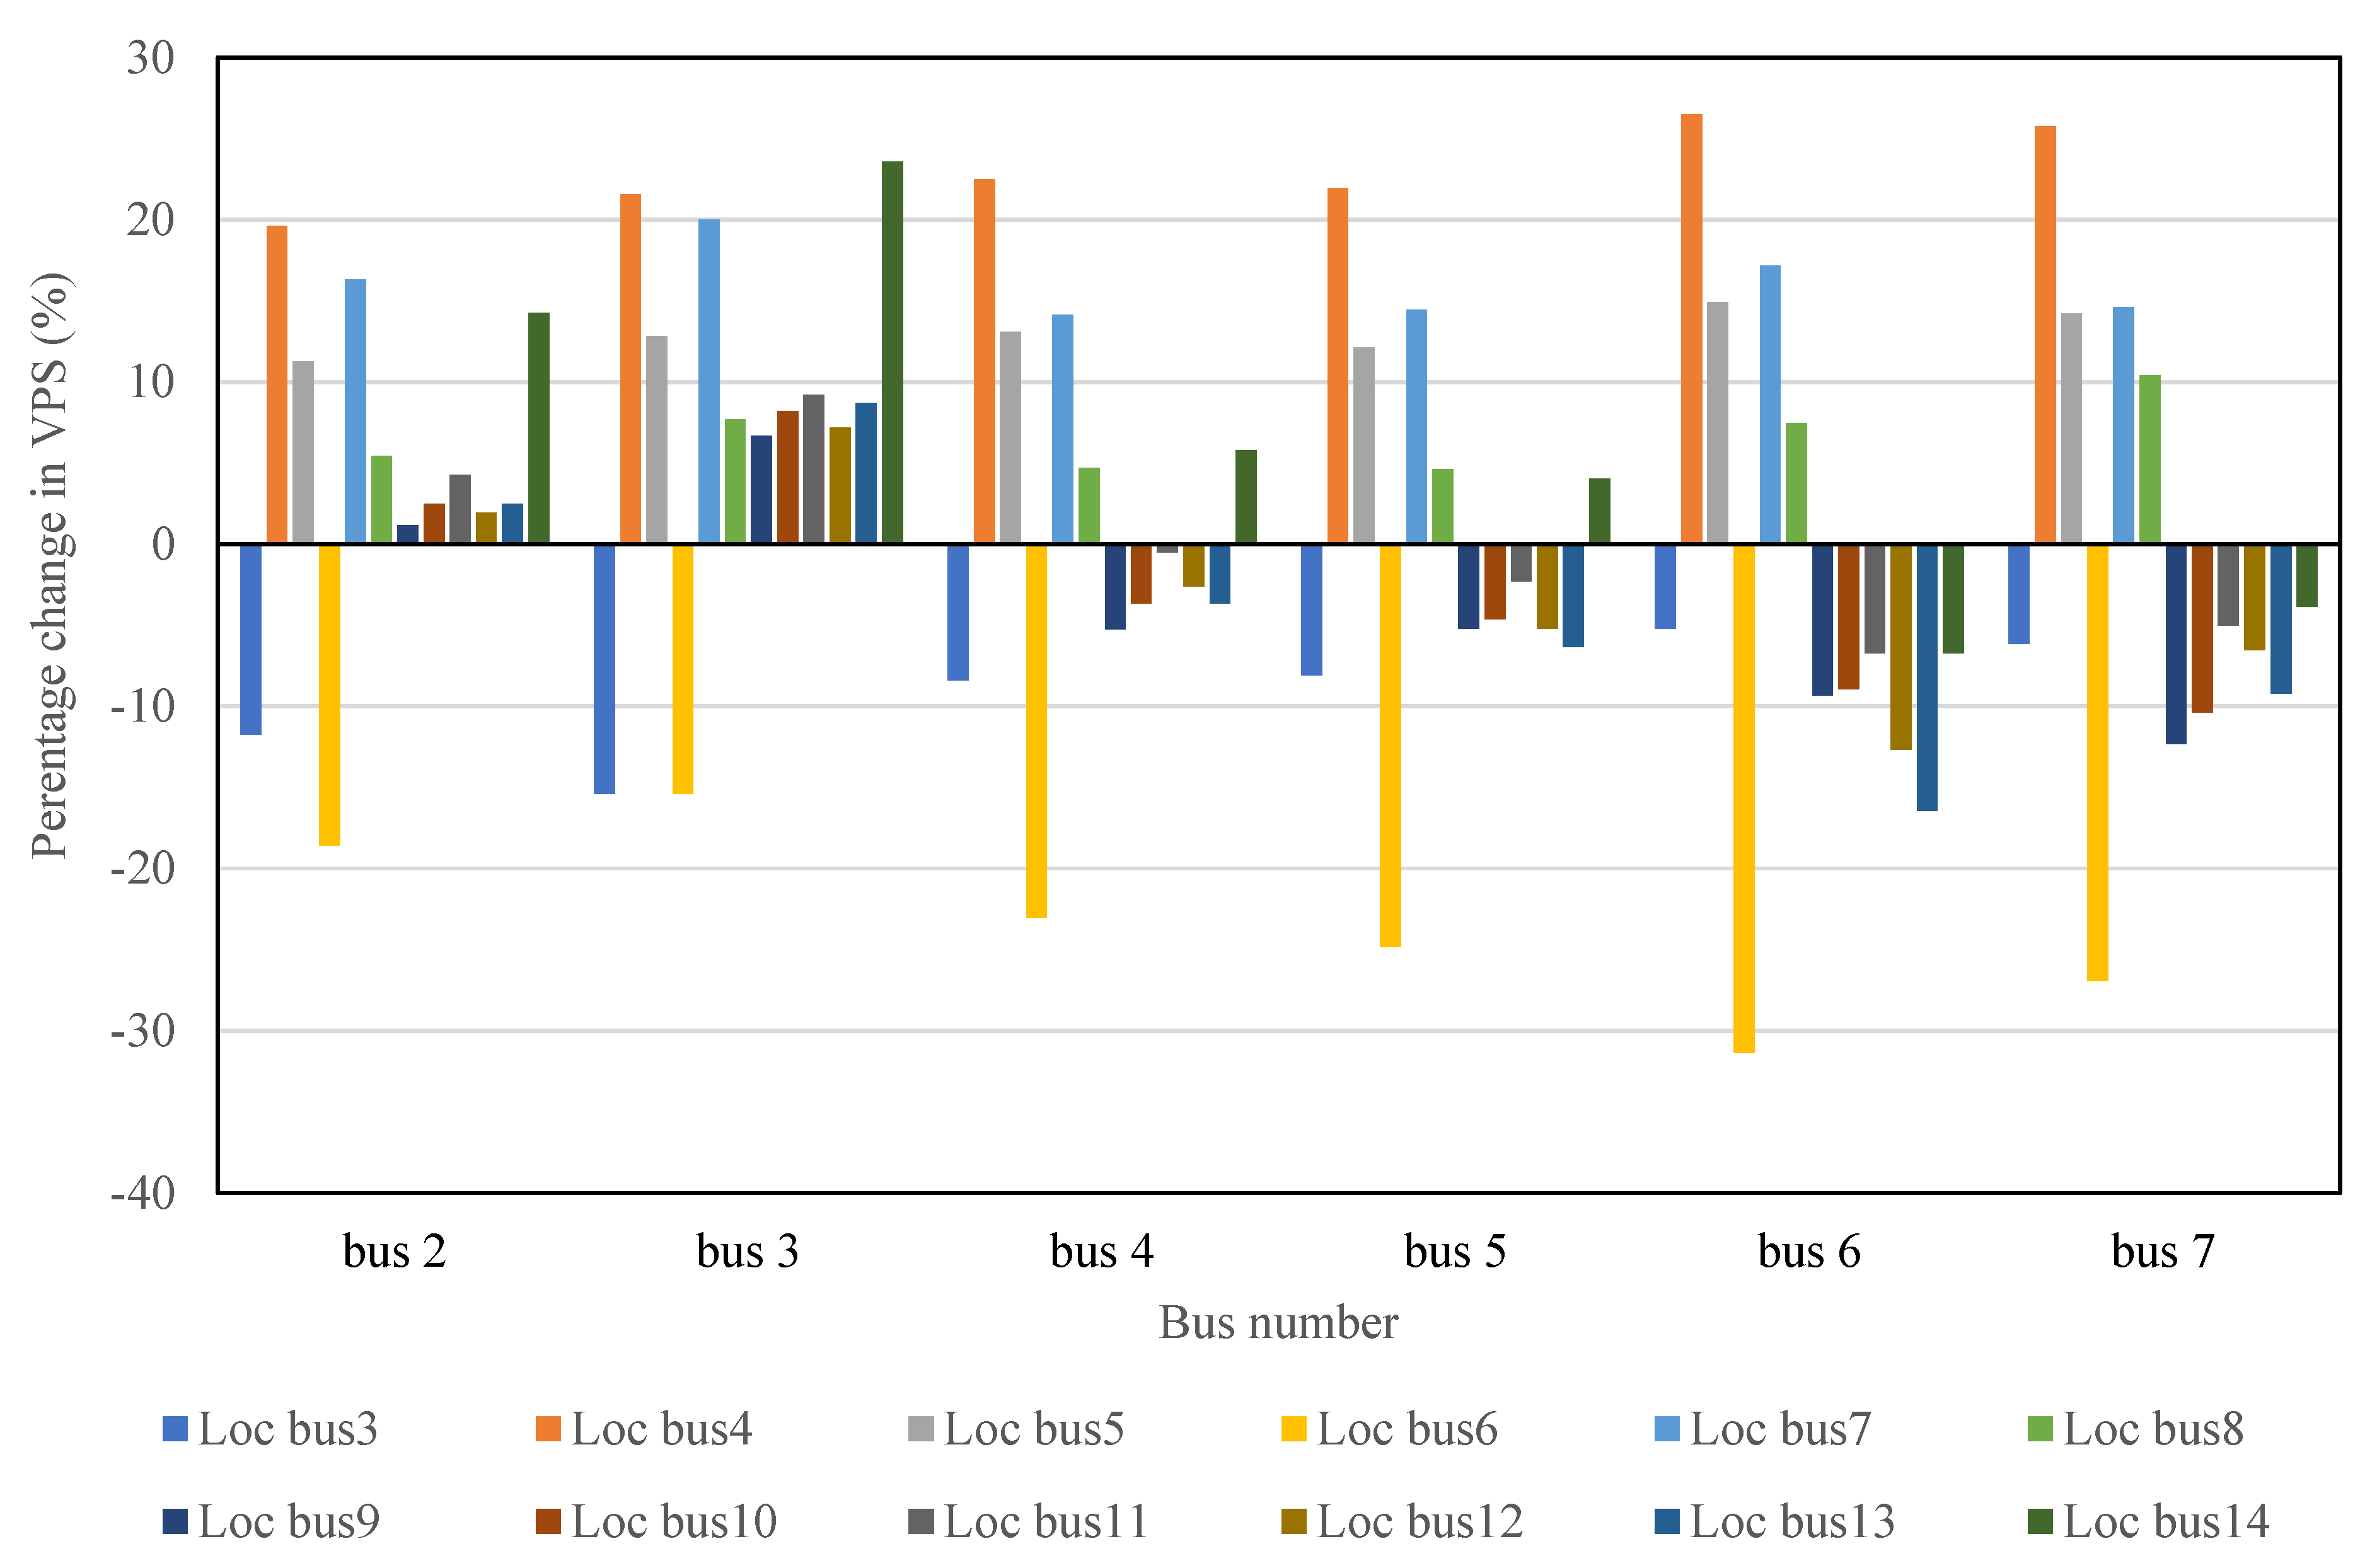
This study evaluated the influence of solar photovoltaic generation in power systems voltage stability based on variable power factor control, variable static voltage droop control, increasing penetrations, as well as the application of the concept of percentage change in voltage–power sensitivity to determine the best installation site for SPVG in the power system. The analysis was done for American standard IEEE-14 Bus Benchmark Network using the PowerWorld simulator. It was observed, from the variable power factor (pf) control impact on the active power margin, and reactive power margin, that there was a 5.4% (34.51 MW) rise of maximum power generated with a decreasing pf control value from unity to 0.96 but a 3.9% (24.9 MW) increase at the 0.94 pf control value and 5.1% (32.72 MW) increase at 0.9 pf while the reactive power marginal loading improved continuously and a total of a 49.2% (24.19 MVAr) increase was recorded at the 0.9 pf control value. It follows from above that the power system voltage stability threshold and power loadability margin were capable of rising and falling with a decreasing pf control value. Additionally, the variation of static voltage droop control values of RES at the interconnection point was found to have a negligible impact on reactive power loading at the interconnection points. In extension, the optimal installation site for SPVG operated at a fixed pf control value with variable penetrations was determined using PCVPSbased technique.
From the simulation results it could be concluded that in the steady-state analysis of the grid integrated power system the effects of pf control, voltage droop control should be considered by power grid engineers for effective system operation and, equally, the application of the percentage change in voltage–power sensitivity should be extended to real networks to determine the best positions for multiple installations of renewable energy resources. Future studies will be focused on the comparison of this concept with other optimization techniques.

Author Contributions

Conceptualization, A.O.M.; Methodology, A.O.M., and M.R.; Software, A.O.M.; Validation, M.R.; Formal analysis, A.O.M.; Resources, M.R.; Writing—Original draft preparation, A.O.M.; writing—Review and editing, A.O.M. and M.R.; Supervision, M.R.; Funding acquisition, M.R. All authors have read and agreed to the published version of the manuscript.

Funding

This project was funded by King Abdulaziz University, Jeddah, Saudi Arabia and King Abdulah City for Atomic and Renewable Energy, Riyadh, Saudi Arabia. Therefore, the authors gratefully acknowledge their technical and financial support.

Acknowledgments

The authors would like to thank King Abdulaziz University, Jeddah, Saudi Arabia and King Abdulah City for Atomic and Renewable Energy, Riyadh, Saudi Arabia.

Conflicts of Interest

The authors declare no conflict of interest.

Abbreviations

The following abbreviations are used in this manuscript:
RESRenewable energy source (-)
RETRenewable energy target (-)
PVPhotovoltaic (-)
SPVGSolar photovoltaic generator (-)
DCDirect current (A)
REGRenewable energy generator (-)
CPFContinuation power flow (-)
DFIGDoubly fed induction generator (-)
PSATPower System Toolbox (-)
RPGRenewable power generator (-)
ACAlternating current (A)
MPPTMaximum power point tracking (-)
WTGWind turbine generator (-)
NERCNorth-American Electricity Reliability Corporation (-)
VPSVoltage power sensitivity (Volt/MW)
PCVPSPercentage change in voltage power sensitivity ( ± V o l t M W % )
PV-curveActive power—voltage curve (-)
VQ-curveVoltage—reactive power curve (-)
PfPower factor (-)
PUPer unit (-)
PCCPoint of common coupling (-)
IEEEInstitute of Electrical and Electronics Engineers (-)
GEGeneral Electric Company (-)

References

  1. Aleem, S.A.; Hussain, S.M.S.; Ustun, T.S. A Review of Strategies to Increase PV Penetration Level in Smart Grids. Energies 2020, 13, 636. [Google Scholar] [CrossRef] [Green Version]
  2. Kroposki, B.; Johnson, B.; Zhang, Y.; Gevorgian, V.; Denholm, P.; Hodge, B.M.; Hannegan, B. Achieving a 100% Renewable Grid: Operating Electric Power Systems with Extremely High Levels of Variable Renewable Energy. IEEE Power Energy Mag. 2017, 15, 61–73. [Google Scholar] [CrossRef]
  3. Dominković, D.F.; Bačeković, I.; Sveinbjörnsson, D.; Pedersen, A.S.; Krajačić, G. On the way towards smart energy supply in cities: The impact of interconnecting geographically distributed district heating grids on the energy system. Energy 2017, 137, 941–960. [Google Scholar] [CrossRef] [Green Version]
  4. Wang, L.; Lin, Y.F.; Ke, S.C. Stability analysis of an offshore wind farm connected to Taiwan power system using DIgSILENT. In Proceedings of the OCEANS 2014—TAIPEI, Taipei, Taiwan, 7–10 April 2014; pp. 1–5. [Google Scholar]
  5. Mosobi, R.W.; Chichi, T.; Gao, S. Modeling and Power Quality Analysis of Integrated Renewable Energy System. In Proceedings of the 2014 18th National Power Systems Conference, Guwahati, India, 18–20 December 2014; pp. 1–6. [Google Scholar] [CrossRef]
  6. Leader, P.; Vittal, V.; University, A.S. Impact of Increased DFIG Wind Penetration on Power Systems and Markets Final Project Report; Arizonal State University: Arizona, AZ USA, 2009; p. 220, PSERC. [Google Scholar]
  7. Von Appen, J.; Braun, M.; Stetz, T.; Diwold, K.; Geibel, D. Time in the sun: The challenge of high PV penetration in the German electric grid. IEEE Power Energy Mag. 2013, 11, 55–64. [Google Scholar] [CrossRef]
  8. Bayindir, R.; Demirbas, S.; Irmak, E.; Cetinkaya, U.; Ova, A.; Yesil, M. Effects of Renewable Energy Sources on the Power System. In Proceedings of the 2016 IEEE International Power Electronics and Motion Control Conference (PEMC), Varna, Bulgaria, 25–28 September 2016; pp. 388–393. [Google Scholar] [CrossRef]
  9. Imam, A.A.; Al-Turki, Y.A. Techno-Economic Feasibility Assessment of Grid-Connected PV Systems for Residential Buildings in Saudi Arabia—A Case Study. Sustainability 2019, 12, 262. [Google Scholar] [CrossRef] [Green Version]
  10. Zsiborács, H.; Hegedűsné Baranyai, N.; Csányi, S.; Vincze, A.; Pintér, G. Economic Analysis of Grid-Connected PV System Regulations: A Hungarian Case Study. Electronics 2019, 8, 149. [Google Scholar] [CrossRef] [Green Version]
  11. Katiraei, F.; Agüero, J.R. Solar PV Integration Challenges. IEEE Power Energy Mag. 2011, 9, 62–71. [Google Scholar] [CrossRef]
  12. Hosenuzzaman, M.; Rahim, N.A.; Selvaraj, J.; Hasanuzzaman, M.; Malek, A.B.M.A.; Nahar, A. Global prospects, progress, policies, and environmental impact of solar photovoltaic power generation. Renew. Sustain. Energy Rev. 2015, 41, 284–297. [Google Scholar] [CrossRef]
  13. Kumar Sahu, B. A study on global solar PV energy developments and policies with special focus on the top ten solar PV power producing countries. Renew. Sustain. Energy Rev. 2015, 43, 621–634. [Google Scholar] [CrossRef]
  14. Alboaouh, K.A.; Mohagheghi, S. Impact of Rooftop Photovoltaics on the Distribution System. Available online: https://www.hindawi.com/journals/jre/2020/4831434/ (accessed on 1 May 2020).
  15. Chi, Y.; Liu, Y.; Wang, W.; Dai, H. Voltage Stability Analysis of Wind Farm Integration into Transmission Network. In Proceedings of the 2006 International Conference on Power System Technology, Chongqing, China, 22–26 October 2006; pp. 1–7. [Google Scholar]
  16. Mansouri, N.; Lashab, A.; Guerrero, J.; Cherif, A. Photovoltaic Power Plants in the Electrical Distribution Networks: A Review on Their Recent Integration Trends. IET Renew. Power Gener. 2020. [Google Scholar] [CrossRef]
  17. Amarasekara, H.W.K.M.; Meegahapola, L.; Agalgaonkar, A.P.; Perera, S. Impact of Renewable Power Integration on VQ Stability Margin. In Proceedings of the 2013 Australasian Universities Power Engineering Conference (AUPEC), Hobart, Australia, 29 September–3 October 2013; pp. 1–6. [Google Scholar]
  18. Ellis, A.; Behnke, M.R.; Elliott, R.T. Western Electricity Coordinating Council Modeling and Validation Work Group Generic Solar Photovoltaic System Dynamic Simulation Model Specification; Prepared by WECC Renewable Energy Modeling Task Force (REMTF): Salt Lake City, Utah, USA, 2013 20 September; pp. 1–16, SAND2013--8876, 1177082. [Google Scholar]
  19. Lee, Y.; Song, H. A Reactive Power Compensation Strategy for Voltage Stability Challenges in the Korean Power System with Dynamic Loads. Sustainability 2019, 11, 326. [Google Scholar] [CrossRef] [Green Version]
  20. Adetokun, B.B.; Muriithi, C.M.; Ojo, J.O. Voltage stability assessment and enhancement of power grid with increasing wind energy penetration. Int. J. Electr. Power Energy Syst. 2020, 120, 105988. [Google Scholar] [CrossRef]
  21. Kundur, P.; Paserba, J.; Ajjarapu, V.; Andersson, G.; Canizares, C.; Hatziargyriou, N.; Hill, D.; Stankovic, A.; Taylor, C.; Custsem, T.V.; et al. Definition and Classification of Power System Stability IEEE/CIGRE Joint Task Force on Stability Terms and Definitions. IEEE Trans. Power Syst. 2004, 19, 1387–1401. [Google Scholar] [CrossRef]
  22. Adebayo, I.; Sun, Y. New Performance Indices for Voltage Stability Analysis in a Power System. Energies 2017, 10, 2042. [Google Scholar] [CrossRef] [Green Version]
  23. Ngo, V.; Le, D.; Le, K.; Pham, V.; Berizzi, A. A Methodology for Determining Permissible Operating Region of Power Systems According to Conditions of Static Stability Limit. Energies 2017, 10, 1163. [Google Scholar] [CrossRef] [Green Version]
  24. Boheme, P.A. Simulation of Power System Response to Reactive Power Compensation. Master’s Thesis, University of Tennessee, Knoxville, TN, USA, 2006; p. 100. [Google Scholar]
  25. Sulaiman, M.; Nor, A.F.M. PV and QV Curves Approach for Voltage Instability Analysis on Mesh-Type Electrical Power Networks Using DIgSILENT. MAGNT Res. Rep. 2015, 3, 36–42. [Google Scholar]
  26. Mohamad Nor, A.F.; Sulaiman, M.; Abdul Kadir, A.F.; Omar, R. Voltage Instability Analysis for Electrical Power System Using Voltage Stabilty Margin and Modal Analysis. Indones. J. Electr. Eng. Comput. Sci. 2016, 3, 655. [Google Scholar] [CrossRef]
  27. Toma, R.; Gavrilas, M. The Impact on Voltage Stability of the Integration of Renewable Energy Sources into the Electricity Grids. In Proceedings of the 2014 International Conference and Exposition on Electrical and Power Engineering (EPE), Iasi, Romania, 16–18 October 2014; pp. 1051–1054. [Google Scholar]
  28. Sultan, H.; Diab, A.; Kuznetsov, O.; Ali, Z.; Abdalla, O. Evaluation of the Impact of High Penetration Levels of PV Power Plants on the Capacity, Frequency and Voltage Stability of Egypt’s Unified Grid. Energies 2019, 12, 552. [Google Scholar] [CrossRef] [Green Version]
  29. Hammad, M.; Harb, A. Static Analysis for Voltage Stability of the Northern Jordanian Power System. In Proceedings of the 2018 9th International Renewable Energy Congress (IREC), Hammamet, Tunisia, 20–22 March 2018; pp. 1–5. [Google Scholar]
  30. Sewdien, V.N.; Preece, R.; Torres, J.L.R.; van der Meijden, M.A.M.M. Evaluation of PV and QV based Voltage Stability Analyses in Converter Dominated Power Systems. In Proceedings of the 2018 IEEE PES Asia-Pacific Power and Energy Engineering Conference (APPEEC), Kota Kinabalu, Malaysia, 7–10 October 2018; pp. 161–165. [Google Scholar]
  31. Zeng, J.; Liu, Q.; Zhong, J.; Jin, S.; Pan, W. Influence on Static Voltage Stability of System Connected with Wind Power. In Proceedings of the 2012 Asia-Pacific Power and Energy Engineering Conference, Shanghai, China, 27–29 March 2012; pp. 1–4. [Google Scholar]
  32. Tamimi, B.; Canizares, C.; Bhattacharya, K. Modeling and Performance Analysis of Large Solar Photo-voltaic Generation on Voltage Stability and Inter-area Oscillations. In Proceedings of the 2011 IEEE Power and Energy Society General Meeting, San Diego, CA, USA, 24–28 July 2011; pp. 1–6. [Google Scholar]
  33. Li, H.; Wen, C.; Chao, K.H.; Li, L.L. Research on Inverter Integrated Reactive Power Control Strategy in the Grid-Connected PV Systems. Energies 2017, 10, 912. [Google Scholar] [CrossRef]
  34. Kouro, S.; Leon, J.I.; Vinnikov, D.; Franquelo, L.G. Grid-Connected Photovoltaic Systems: An Overview of Recent Research and Emerging PV Converter Technology. IEEE Ind. Electron. Mag. 2015, 9, 47–61. [Google Scholar] [CrossRef]
  35. Miller, N.W.; Sanchez-Gasca, J.J.; Price, W.W.; Delmerico, R.W. Dynamic Modeling of GE 1 5 and 3.6 MW Wind Turbine-generators for Stability Simulations. In Proceedings of the 2003 IEEE Power Engineering Society General Meeting (IEEE Cat. No.03CH37491), Toronto, ON, Canada, 13–17 July 2003; Volume 3. [Google Scholar]
  36. Clark, K.; Miller, N.W. Modeling of GE Solar Photovoltaic Plants for Grid Studies; General Electric International, Inc.: New York, NY, USA, 2010; pp. 1–36. [Google Scholar]
  37. Pourbeit, P. Proposed Changes to the WECC WT4 Generic Model for Type 4 Wind Turbine Generators; Electric Power Research Institute, Inc.: California, CA, USA, 2011; p. 35. [Google Scholar]
  38. Laboratories, S.N.; Contract, S. Western Electricity Coordinating Council Modeling and Validation Work Group Pseudo Governor Model for Type 1 and 2 Generic Turbines Prepared by WECC Renewable Energy Modeling Task Force This work is supported by Sandia National Laboratories and U.S. Department of Energy, WECC REMTF, Salt Lake City, Utah, U.S, 2012; pp. 1–34. Available online: https://www.powerworld.com/files/WECC-Solar-PV-Dynamic-Model-Specification-September-2012.pdf (accessed on 1 May 2020).
  39. Special Report. Standard Models for Variable Generation; North American Electric Reliability Corporation (NERC): Atlanta, GA, USA, 2010; p. 60. [Google Scholar]
  40. Hatziargyriou, N.; Donnelly, M.; Papathanassiou, S.; Lopes, J.A.P.; Takasaki, M.; Chao, H.; Usaola, J.; Lasseter, R.; Karoui, K. Cigre Technical Brochure on Modeling New forms of Generation and Storage, CIGRE TF 38.01.10. 2000, pp. 1–140. Available online: https://fglongatt.org/OLD/Archivos/Archivos/SistGD/CIGRE-TF-380110.pdf (accessed on 1 May 2020).
  41. Weber, J. Wind Turbine Models in PowerWorld Simulator Power Flow Models of Renewable Generation Plants; PowerWorld Corporation: Illinois, USA, 2014; Volume 1, pp. 1–27. [Google Scholar]
  42. Rahman, M.M.; Barua, S.; Zohora, S.T.; Hasan, K.; Aziz, T. Voltage Sensitivity Based Site Selection for PHEV Charging Station in Commercial Distribution System. In Proceedings of the 2013 IEEE PES Asia-Pacific Power and Energy Engineering Conference (APPEEC), Kowloon, China, 8–11 December 2013; pp. 1–7. [Google Scholar]
  43. Aziz, T.; Saha, T.K.; Mithulananthan, N. Identification of the Weakest Bus in a Distribution System with Load Uncertainties Using Reactive Power Margin. In Proceedings of the 2010 20th Australasian Universities Power Engineering Conference, Christchurch, New Zealand, 5–8 December 2010; pp. 1–6. [Google Scholar]
  44. IEEE Standard for Interconnection and Interoperability of Distributed Energy Resources with Associated Electric Power Systems Interfaces; IEEE Std 1547-2018 Revis. IEEE Std 1547-2003; IEEE: New York, NY, USA, 2018; pp. 1–138. [CrossRef]
  45. Manjul, N.; Rawat, M.S. PV/QV Curve based Optimal Placement of Static Var System in Power Network using DigSilent Power Factory. In Proceedings of the 2018 IEEE 8th Power India International Conference (PIICON), Kurukshetra, India, 10–12 December 2018; pp. 1–6. [Google Scholar]
  46. Thasnas, N.; Siritaratiwat, A. Implementation of Static Line Voltage Stability Indices for Improved Static Voltage Stability Margin. J. Electr. Comput. Eng. 2019, 2019, 1–14. [Google Scholar] [CrossRef]
  47. Garcia Sanchez, Z.; González, J.A.; Crespo, G.; Herrera, H.H.; Silva, J.I. Voltage collapse point evaluation considering the load dependence in a power system stability problem. Int. J. Electr. Comput. Eng. 2020, 10, 61. [Google Scholar] [CrossRef]
  48. Kundur, P. Kundur, Prabha, Power System Stability and Control; McGraw-Hill Education: New York, NY, USA, 1993; p. 1661. [Google Scholar]
  49. Bhaladhare, S.B.; Telang, A.S.; Bedekar, P.P. P-V, Q-V Curve—A Novel Approach for Voltage Stability Analysis. Proceedings Published by International Journal of Computer Application (IJCA). 2013, p. 5. Available online: https://www.semanticscholar.org/paper/P-V%2C-Q-V-Curve-%E2%80%93-A-Novel-Approach-for-Voltage-Bhaladhare-Telang/d21309085c54f799ce8cd236e42bd4e2f76d3b9d (accessed on 1 May 2020).
  50. Mahmood, F.B.K.; Ahmad, S.; Mukit, G.; Shuvo, M.T.I.; Razwan, S.; Maruf, M.N.I.; Albatsh, F.M. Weakest Location Exploration in IEEE-14 Bus System for Voltage Stability Improvement Using STATCOM, Synchronous Condenser and Static Capacitor. In Proceedings of the 2017 International Conference on Electrical, Computer and Communication Engineering (ECCE), Cox’s Bazar, Bangladesh, 16–18 February 2017; pp. 623–629. [Google Scholar]
  51. Chary, D.V.M.; Subramanyam, M.V.; Kishor, P. P-V Curve Method for Voltage Stability and Power Margin Studies; International Journal of Engineering Science and Computing (IJESC), Bangolore, India, 2017; Volume 7, pp. 11867–11869.
  52. Maharjan, S.; Sampath Kumar, D.; Khambadkone, A.M. Enhancing the voltage stability of distribution network during PV ramping conditions with variable speed drive loads. Appl. Energy 2020, 264, 114733. [Google Scholar] [CrossRef]
  53. Milano, F. An Open Source Power System Analysis Toolbox. IEEE Trans. Power Syst. 2005, 20, 1199–1206. [Google Scholar] [CrossRef]
  54. Shah, R.; Mithulananthan, N.; Bansal, R.C.; Lee, K.Y.; Lomi, A. Power System Voltage Stability as Affected by Large-scale PV Penetration. In Proceedings of the 2011 International Conference on Electrical Engineering and Informatics, Bandung, Indonesia, 17–19 July 2011; pp. 1–6. [Google Scholar]
  55. Weber, J. Voltage Droop Control in Power Flow Solutions; PowerWorld Corporation: Illinois, USA, 2018; Volume 1, pp. 1–71. [Google Scholar]
  56. Kim, I.; Harley, R.G. Examination of the effect of the reactive power control of photovoltaic systems on electric power grids and the development of a voltage-regulation method that considers feeder impedance sensitivity. Electr. Power Syst. Res. 2020, 180, 106130. [Google Scholar] [CrossRef]
  57. Munkhchuluun, E.; Meegahapola, L.; Vahidnia, A. Long-term voltage stability with large-scale solar-photovoltaic (PV) generation. Int. J. Electr. Power Energy Syst. 2020, 117, 105663. [Google Scholar] [CrossRef]
Figure 1. The basic configuration of a grid-connected photovoltaic generator [40].
Energies 13 02662 g001
Figure 2. Typical active power–voltage curve (P–V curve).
Energies 13 02662 g002
Figure 3. A typical voltage-reactive power curve (V–Qcurve).
Energies 13 02662 g003
Figure 4. The conceptual algorithm for model validation and determination of the optimal location for the photovoltaic (PV) generator.
Energies 13 02662 g004
Figure 5. The benchmark IEEE 14-bus system.
Energies 13 02662 g005
Figure 6. P–V curve for the 14 bus benchmark system.
Energies 13 02662 g006
Figure 7. V–P sensitivity vs. power-shift.
Energies 13 02662 g007
Figure 8. V–Q curves for the test system.
Energies 13 02662 g008
Figure 9. V–Q voltage instability margins variation with power factor control on bus-14.
Energies 13 02662 g009
Figure 10. Critical voltage for bus 6, 9, 10, 11, 12, 13 and 14 for a change in the pf-value.
Energies 13 02662 g010
Figure 11. Droop control of the solar PV generator remained constant at the various droop values. Apart from the clear improvement of bus voltage stability (implicitly system stability) at varying power factor control, it was found that solar PV operation at a given power factor (pf) and when operated with specific voltage droop with reactive power capacity corresponding to the given pf, the impact turns out same.
Energies 13 02662 g011
Figure 12. The percentage change in VPS for buses 2, 3, 4, 5, 6 and 7 with changing PVgenerator location.
Energies 13 02662 g012
Figure 13. The percentage change in VPS for buses 8, 9, 10, 11, 12, 13 and 14 with changing PV generator location.
Energies 13 02662 g013
Figure 14. V–P Sensitivity for buses 9, 10, 11, 12, 13 and 14 for PV generator at bus 3.
Energies 13 02662 g014
Figure 15. V–P Sensitivity for buses 9, 10, 11, 12, 13 and 14 for PV generator at bus 6.
Energies 13 02662 g015
Figure 16. V–P Sensitivity for buses 9, 10, 11, 12, 13 and 14 for PV generator at bus 9.
Energies 13 02662 g016
Figure 17. V–P Sensitivity for buses 9, 10, 11, 12, 13 and 14 for PV generator at bus 13.
Energies 13 02662 g017
Figure 18. Percentage change in VPS for PV generator at bus 3.
Energies 13 02662 g018
Figure 19. Percentage change in VPS for PV generator at bus 6.
Energies 13 02662 g019
Figure 20. Percentage change in VPS for PV generator at bus 9.
Energies 13 02662 g020
Figure 21. Percentage change in VPS for PV generator at bus 13.
Energies 13 02662 g021
Table 1. Network parameters: bus, generator and load parameters.
Bus DataGenerator/Synchronous CondenserLoad
Bus No.Bus codeBus Voltage (pu)Bus angle (deg) P G   ( MW ) Q G   ( MVAr ) Q m i n   ( MVAr ) Q m a x   ( MVAr ) P L   ( MW ) Q L   ( MVAr )
111.060000000
221.04504042.4−405021.712.7
321.010023.404094.219
431.00000047.8−3.9
531.0000007.61.6
621.070012.2−62411.27.5
731.00000000
821.00017.4−62400
931.00000029.516.6
1031.0000009.05.8
1131.0000003.51.8
1231.0000006.11.6
1331.00000013.55.8
1431.00000014.95
Table 2. Network parameters: transmission lines and transformers.
Transmission Lines and Transformers
From BusTo BusR (pu)X (pu)B/2 (pu)Transformer Tap (a)
120.019380.059170.02641
150.054030.223040.02461
230.046990.197970.02191
240.058110.176320.01701
250.056950.173880.01731
340.067010.171030.00641
450.013350.042110.01
470.00.209120.00.978
490.00.556180.00.969
560.00.252020.00.932
6110.094980.198900.01
6120.122910.255810.01
6130.066150.130270.01
780.031810.176150.01
790.00.110010.01
9100.031810.084500.01
9140.127110.270380.01
10110.082050.192070.01
12130.220920.199880.01
13140.170930.348020.01
Table 3. Network component rating.
Power FactorMaximum Power Generated (MW)
Gen 1615 [32]
Gen 2100 [17]
Transformer 5–6100
Transformer r 4–9100
Transformer 4–7100
Transformer 7–8100
Table 4. Single GE solar converter rating [36].
Single GE Solar Converter Rating
Generator Rating707 KVA
Pmax700 kW
Pmin0 kW
Qmax99 kVAr
Qmin−99 kVAr
Terminal Voltage480 V
Table 5. Solar system bus information [41].
BusBus Voltage and Angle
Ref Term 1 12.712
Ref Low1 0.9986 9.841
Ref Low 2 0.9837 8.390
Ref High 1.0493 2.585
Table 6. Solar system transformer information [41].
TransformerReactance (p.u)MVA Rating
10.05120
20.1120
Table 7. Solar system line information [41].
Line NoResistance, R (p.u)Reactance (X) (p.u)Shunt Charging (B)MVA Rating
10.0150.0250.01120
20.010.10.02120
Table 8. Maximum power generated (MW).
Power FactorMaximum Power Generated (MW)
1639.01
0.98646.94
0.96673.52
0.94663.91
0.90671.73
Table 9. The percentage change in V–P sensitivity for all buses with changing PV generator location.
Bus noThe Percentage Change in V–P Sensitivity for All Buses with Changing the Location of PV Generator
Location Bus3Location Bus4Location Bus5Location Bus6Location Bus7Location Bus8Location Bus9Location Bus10Location bus11Location bus12Location bus13Location bus14
bus 2−11.7219.6111.27−18.6016.335.431.182.494.241.932.4714.25
bus 3−15.3821.5412.82−15.3820.007.696.678.219.237.188.7223.59
bus 4−8.3822.5113.09−23.0414.144.71−5.24−3.66−0.52−2.62−3.665.76
bus 5−8.0921.9712.14−24.8614.454.62−5.20−4.62−2.31−5.20−6.364.05
bus 6−5.2226.4914.93−31.3417.167.46−9.33−8.96−6.72−12.69−16.42−6.72
bus 7−6.1525.7714.23−26.9214.6210.38−12.31−10.38−5.00−6.54−9.23−3.85
bus 8−5.9025.8314.39−26.9414.7614.02−12.18−10.33−4.80−6.27−9.23−3.69
bus 9−5.2626.3214.74−27.7217.1910.18−12.98−11.58−5.61−7.37−10.53−6.32
bus 10−5.1926.6414.88−27.6817.309.69−12.11−13.15−5.88−7.61−11.07−6.23
bus 11−5.3026.1514.84−28.9816.968.48−10.95−11.66−9.19−9.54−13.07−6.36
bus 12−4.8426.6414.88−30.4517.997.96−9.00−8.65−5.88−17.99−17.30−7.61
bus 13−4.7326.6914.86−30.0717.918.11−9.12−8.78−5.74−11.49−18.92−9.12
bus 14−4.4027.0415.09−28.3018.5510.06−10.38−9.12−4.72−8.49−13.52−15.09
Table 10. Feasible PV penetration level.
Location of PV GeneratorFeasible PV Penetration Level (MW)
Bus 316, 40, 64
Bus 68, 24, 32, 40, 64
Bus 916
Bus 1332, 40, 48

