1. Introduction
The growing demands for electric energy arising from the current development and production model based on a post-industrial society is the driving force behind the constant search for a guaranteed energy supply. These demands operate by configuring, demanding, and providing feedback to the electrical industry, since they result from a production process that is continuously sustained and reproduced due to an incessant desire for energy.
In this context, the development and use of renewable energy conversion technologies is the result of choices defined in both socioeconomic and political dispute spaces and are guided by natural conditions (resources) and by current economic model tension and interests. New converters result from determinations placed on the electric energy market, which motivate and are motivated by its different dimensions, namely physical, technological, economic, political, institutional, and environmental spheres.
Among technologies for exploiting renewable sources, photovoltaic solar energy, along with wind energy, has increased in use since the beginning of this century. Increased interest of different consumer sectors is noted, supported by the concept of distributed generation when investing in solar photovoltaic technology, making the use of this energy source a promising market. Every year, new installed capacity records and technological innovations and improvements are achieved worldwide.
A significant perspective on photovoltaic solar energy is observed as, when produced in low carbon intensity regions for electricity generation, it is associated to the current effort to mitigate global greenhouse gas (GHG) emissions and minimize impacts resulting from the use of fossil fuels, as well as their socioeconomic repercussions. Therefore, the adoption of technologies that apply photovoltaic solar energy displays the potential to significantly mitigate problems associated with energy security and climate change [
1].
As a result, a significant growth in the global photovoltaic installed capacity has been observed since the beginning of 2010s, reaching a global level of 638 GWp at the end of 2019 [
2]. Asia is responsible for the majority of installed systems (57%), where 62% of this total is installed in China, followed by Europe at 24% [
3].
The American continent (Canada and USA) accounts for 11% of the global installed capacity in the world and Latin America, 2%. Africa and the Middle East together participate with only 2% of the global photovoltaic market [
3].
It is worth noting that Latin America member countries have registered a notable growth in the use of renewable energy for electricity generation since 2010. Biomass, wind, and solar energy production have experienced strong growth, although their participation in the electrical matrix is still small. In these countries, the most frequent support mechanisms consist of tax incentives, mainly through income tax, added value or sales tax and tariff exemptions. The adoption of the net measurement system is also increasing in the region [
4]. According to [
5], regulatory frameworks and the role of regulatory agencies played an important role in the results achieved in that region.
Due to the growth in installed power and the popularization of photovoltaic energy worldwide, it is increasingly imperative to predict the amount of energy that can be generated by a given photovoltaic system and assess its performance, to then evaluate its economic viability and potential environmental impacts. For this purpose, several scientific works resort to the so-called photovoltaic models, mathematical representations that allow the simulation of the behavior of a photovoltaic system in its entirety, ranging from the irradiation capture in the panel plane to the final energy, in Alternating Current (AC).
Table 1 presents a literature review of studies associated to photovoltaic installation estimates or performance evaluations. Studies found in the literature are fundamentally oriented to evaluate system performances from information designed for the actual systems, with no assessments allowing the inclusion of possible locational factors to register changes if the system is installed in another site, which is feasible if the user makes different possible spaces for use available, such as multi-headquartered institutions and corporations.
This article, in turn, advances when evaluating this performance both by projected theoretical data and measured data, allowing for comparisons. It also ponders the system results by evaluating their performance using data from other sites made available by the user.
Brazil’s size and continentality is worth noting, where very different energy resources and exploitation realities exist, i.e., considerable gains in wind speed and quality, as well as in radiation per m2 when solar photovoltaic technology exploitation can be verified. In addition, the regulatory possibility of remote self-consumption is also observed, where it is permissible to install parks either at different sites or centrally, far from the consumption unit. In this sense, the need to evaluate energy efficiency gains and investment returns for of these options is gaining ground. In the Brazilian case, an example of centralized remote self-consumption was performed by the automotive company Honda Automóveis do Brasil. Its plant is located in the city of Sumaré in the state of São Paulo, while a 27 MW wind farm investment and construction was performed in the city of Xangri-la in the state of Rio Grande do Sul, 1000 km away. Another example is the company Multiplan (a shopping center branch) which has a commercial unit in the city of Rio de Janeiro and invested in two photovoltaic solar plants with 8.33 MWp capacity in the city of Itacarambi, in northern of Minas Gerais, 1100 km away. In addition, both companies did not carry out or disseminate analysis regarding resource exploitation strategies either centrally or in different sites, giving up better project management, particularly when addressing the issue of risk management.
Another example, further elaborated in this article, refers to the public policy underway conducted by the Brazilian Federal Government, which aims to install about 5.5 MWp in photovoltaic solar energy distributed in its Federal Professional and Technological Education Institutes, which include 644 campuses distributed throughout the country [
6,
7].
The examples of the Brazilian reality in a scope concerning the exploitation of energy resources, in particular in the breadth of its characteristics in the scope of solar photovoltaic use, open space so that their experiences can be replicated in other frontiers, going beyond ready and unique solutions.
In this sense, it is paramount to foster national and international debate, learning from their experience and aiding in conducting environmentally sustainable energy use, adding value to companies/institutions and promoting a society more aligned with the principles of sustainability.
Thus, studies that unveil the benefits, barriers, and opportunities of photovoltaic use that evaluate both the conditions of the usage areas, as well as their performance in other places—Centralized vs. Decentralized Arrangement—gain global reach.
Brazil presents a significant potential for exploiting solar energy, since most of its territory is located relatively close to the equator and solar incidence variations per hour of the day between different regions [
8] are minimal. The average annual Brazilian radiation ranges from 1200 to 2400 kWh/m²/year, well above the European average [
9]. Overall, the Northeast presents global solar irradiation values among the highest of all Brazilian geographic regions, with the highest average and the lowest annual variability. The northeast semiarid region, in particular, is noteworthy for its climatic conditions, resulting in a stable regime of low cloudiness and high irradiation incidence.
Due to the recognized potential of solar energy in generating electricity, the actual possibilities of fulfilling the use of these resources for both private and commercial purposes in Brazil are stated under Law No. 9074 of 1995, which has created a favorable environment for the admission of new agents on the market and, as a result, encouraged the use of renewable energy sources. However, it was Normative Resolution of the National Electric Energy Agency (ANEEL) no. 482/2012 that allowed every Brazilian consumer with an interest to generate their own electric energy from renewable sources or cogeneration, and even supply the surplus to the distribution network of his/her concession area, under the concept of distributed generation
ANEEL has justified the innovation by claiming that the incentives to promote distributed generation would be based on the potential benefits that this modality can provide to the electrical system, namely [
10]: (i) the postponement of investments concerning system transmission and distribution expansion; (ii) the reduction of conventional system environmental impacts; (iii) technical gains, such as reduced network loads and minimized losses; and (iv) electric matrix diversification.
According to [
11,
12], solar photovoltaic systems, especially those integrated into buildings and connected to the distribution system, offer several electrical system advantages. Especially with regard to avoiding certain costs, normally either not considered or quantified, such as decreased transmission and energy distribution losses, due to the fact that consumption occurs close to the production site; decreased transmission and distribution line investments, as these systems do not require additional physical areas and provide considerable electricity generation in times of peak demands, and finally, due to the fact that photovoltaic generators, when strategically distributed, offer minimal idle generation capacity.
ANEEL Resolution No. 482/2012, modified by Resolution No. 786/2017, which enabled consumers with installed power of less than or equal to 5 MW to use renewable electric energy sources connected to the distribution network through consumer unit facilities, has favored a notorious growth of distributed generation in Brazil, both in the number of projects and in installed micro- (≤75 kW) and mini- (≤5 MW) generation capacity, making distributed generation using only photovoltaic solar energy reach the 1.19 GW installed power mark at the end of 2019. When also considering centralized generation, the installed photovoltaic solar energy capacity in Brazil has already exceeded 3.4 GW, with distributed generation applying this technology displaying an 137% increase in 2019, while centralized generation increased 26.2% [
30]. According to [
31], residential consumers lead the statistics in terms of installed distributed photovoltaic generation capacity, at 72.6%, followed by commerce and service companies (17.99%), rural consumers (6.25%), industries (2.68%), public authorities (0.43%), public services (0.04%), and public lighting (0.01%).
Therefore, Brazil has advanced in the use of photovoltaic solar energy in homes, businesses, industries, public buildings, rural areas, and public lighting.
It is also noted that public or private institutions with more than one headquarter began to incorporate the adoption of photovoltaic systems in their strategic planning, with the main purpose of reducing energy bill participation in their cost structures and attaching sustainability benefits to their image, as well as collaborating with the Brazilian Nationally Determined Contributions (NDC) within the scope of the commitments assumed in the Paris Agreement.
In this context, the Brazilian Ministry of Education (MEC) created the Thematic Committee for Professional Training in Renewable Energies and Energy Efficiency in 2015, linked to the Federal Professional Education Network (RFETP), with the aim of advising Federal Institutes on energy efficiency actions. Among other actions, they formulated the Incentive Project for Solar Photovoltaic Energy (IF-Solar Project), aiming at the implementation of 20,172 photovoltaic solar panels for electricity generation throughout 82 RFETP campuses, totaling 6 MW of installed power when completed.
Based on the IF-Solar Project guidelines, the Rio Grande do Norte Federal Institute of Education, Science and Technology (IFRN), this article’s object of study, installed 2 MW of photovoltaic generation in 19 of its 22 headquarters from 2013 to 2019. This achievement is in accordance with the Institutional Development Plan (PDI), which states that at least 30% of the electric energy consumed by the IFRN must be provided by renewable sources when the systems are installed in all units. The investment return of the project is estimated at 13 years, considering a useful solar panel life of 25 years [
32].
In the face of an investment of this nature, whose financial value is considerable in a context of institutional (public) budget participation indicates the importance of further detailed analyses of the project’s technical and economic performances, to verify if all generated expectations are confirmed in the perspective of these two aspects.
From a technical point of view, an important aspect to be observed is photovoltaic generation unit performance, which depends, essentially, on the following parameters:
- (i)
Solar radiation;
- (ii)
Temperature Effect at the installation sites;
- (iii)
System behavior.
Thus, the IFRN photovoltaic park becomes an appropriate laboratory to elucidate doubts when evaluating theoretical meanings by recording system performances and proposing adjustments that permits the expansion of the positive results of the adoption of this technology. This article, therefore, aims at evaluating the technical and economic performances resulting from the implementation of a solar photovoltaic system in multi-headquarter institutions, considering the efficiency of different existing photovoltaic parks, depending on climatic conditions and physical installation profiles and the economic and financial viability of different projects.
Therefore, a comparative study was carried out between the dispersed system arrangement adopted in the IFRN-Solar project and headquarter centralization for better energy efficiency.
2. Promoting Sustainability in Teaching Spaces
The 1990s consolidated the debate that pointed out the urgent need for the collective promotion of attitude transformations that would better guide the inseparable relationship between the development process and the use of natural resources it promotes. This new way of thinking about development is linked, in part, to the stripping of environmental implications resulting from the damage caused by energy systems, which are essentially based on non-renewable resources.
This positioning, led by the defense of a development that appears sustainable, has shaped international articulations whose objective is to structure a set of procedures with global adhesion that endorses energy efficiency and reduces socioeconomic and environmental impacts resulting from the energy market, while also contributing to the mitigation of gases responsible for intensifying the greenhouse effect. The growing socioeconomic costs imposed by the mandatory need to establish energy security are also considered in this environment, especially linked to the dependence on fossil fuels in most National States.
In this context, efficient energy promotion use and the development and expansion of renewable technology use are both highlighted, reflected by the new guidelines given by National States applied in an attempt to overcome the technological paradigm based on continuous installed capacity growth in large generating plants. In this scenario, a trend towards promoting distributed generation focusing on taking advantage of the energy vocation of each region is noted, based on the region’s renewable resources and conversion technologies as a way of contributing towards sustainable development.
In this context, federal public educational institutions in Brazil, notably Federal Institutes, have been encouraged to adopt policies promoting efficient electric energy use in their spaces, as well as distributed generation through renewable energy sources. To this end, the MEC created the Thematic Committee for Professional Training in Renewable Energies and Energy Efficiency in 2015, formed by Secretariat of Professional and Technological Education (SETEC) managers and representatives of institutions comprising the Federal Network of Professional Education, Scientific and Technological (RFEPCT). Since then, the Committee has been preparing several proposals for the sector, such as new course implementations and the mapping of market needs and infrastructure equipment specifications.
According to [
33], the aim of these actions is to reduce the cost of these institutions and jointly disseminate an energy efficiency and sustainability culture in their basic nuclei, whether for student preparation or certification processes, both in research and innovation. To this end, the projection is to provide the 644 RFEPCT campi with solar photovoltaic systems by 2025.
Located in this reality, the South of Minas Gerais Federal Institute of Education, Science and Technology (IFSULDEMINAS), initiated the IF-Solar Project in 2015, whose aim is not limited to photovoltaic plant establishment for electric energy generation in the institute itself, but also in other RFEPCT institutions, comprising a total of 82 units. According to [
34], seeking renewable energy generation sources has been a difficulty for most institutions, hence the motivation to setup an innovative and pioneering project, combining sustainability and financial resource savings.
IFSULDEMINAS has already implemented nine photovoltaic plants, with investments reaching up to US
$ 1206 million, at a cost of US
$ 134 thousand each. This is expected to save approximately US
$ 172 thousand a year. According to [
35], the expectation is that IFSULDEMINAS will recover its investments after four years of operation.
In national terms, the IF-Solar Project foresees the service of 82 RFEPCT campi, totaling approximately US
$ 11 million in investments by the end of 2020. Among the institutions benefited by this project, the Bahian Federal Institute of Education, Science and Technology (IFBAIANO) has estimated a decrease in about 40% of its annual electricity consumption, while the Rio Grande do Sul Federal Institute of Education, Science and Technology (IFSUL) expects savings of up US
$ 7.74 thousand per month. In total, the savings at all 16 institutes that joined the project are estimated at U
$ 2.11 million a year [
34].
In addition to the perspective of saving public financial resources, the IF-Solar Project also uses the installed photovoltaic plants as laboratories for its students, in order to disseminate the importance of renewable sources and expand knowledge, research and innovation in this area, in its technological, socioeconomic and environmental dimensions.
The IFRN and Its Sustainability Policy
Rio Grande do Norte (RN) is one of the 27 federative Brazilian units. Located in the Northeast region, it comprises 167 municipalities, with a total area of 52,797 km², corresponding to 3.42% of the entire Northeast area and 0.62% of Brazil’s total surface. About 3.5 million people live in this state [
36], and Natal, the state’s capital, is the most populous city, followed by Mossoró, Parnamirim and São Gonçalo do Amarante. Regarding solar potential, Rio Grande do Norte averages a global daily solar radiation level from 5.5 to 5.9 kWh/m
2·day [
37], depending on the region, among the best indices in Brazil.
The Rio Grande do Norte Federal Institute of Education, Science and Technology (IFRN) is located in the state of Rio Grande do Norte, comprising 22 teaching units distributed throughout 16 municipalities, with the purpose of offering professional and technological education, permeating education levels from initial to continuing worker training, through technical vocational training at the medium and higher levels to postgraduate studies.
The Sustainable Logistics Management Plan adopted by IFRN fundamentally aims to: (i) improve the quality of public costs by eliminating waste and continuously improve process management; (ii) promote environmental, economic, and social sustainability within the IFRN academic community; and (iii) encourage the implementation of energy efficiency actions [
32]. Therefore, sustainable service projects are planned, which include features such as selective collection implementation and the rational use of water and electricity.
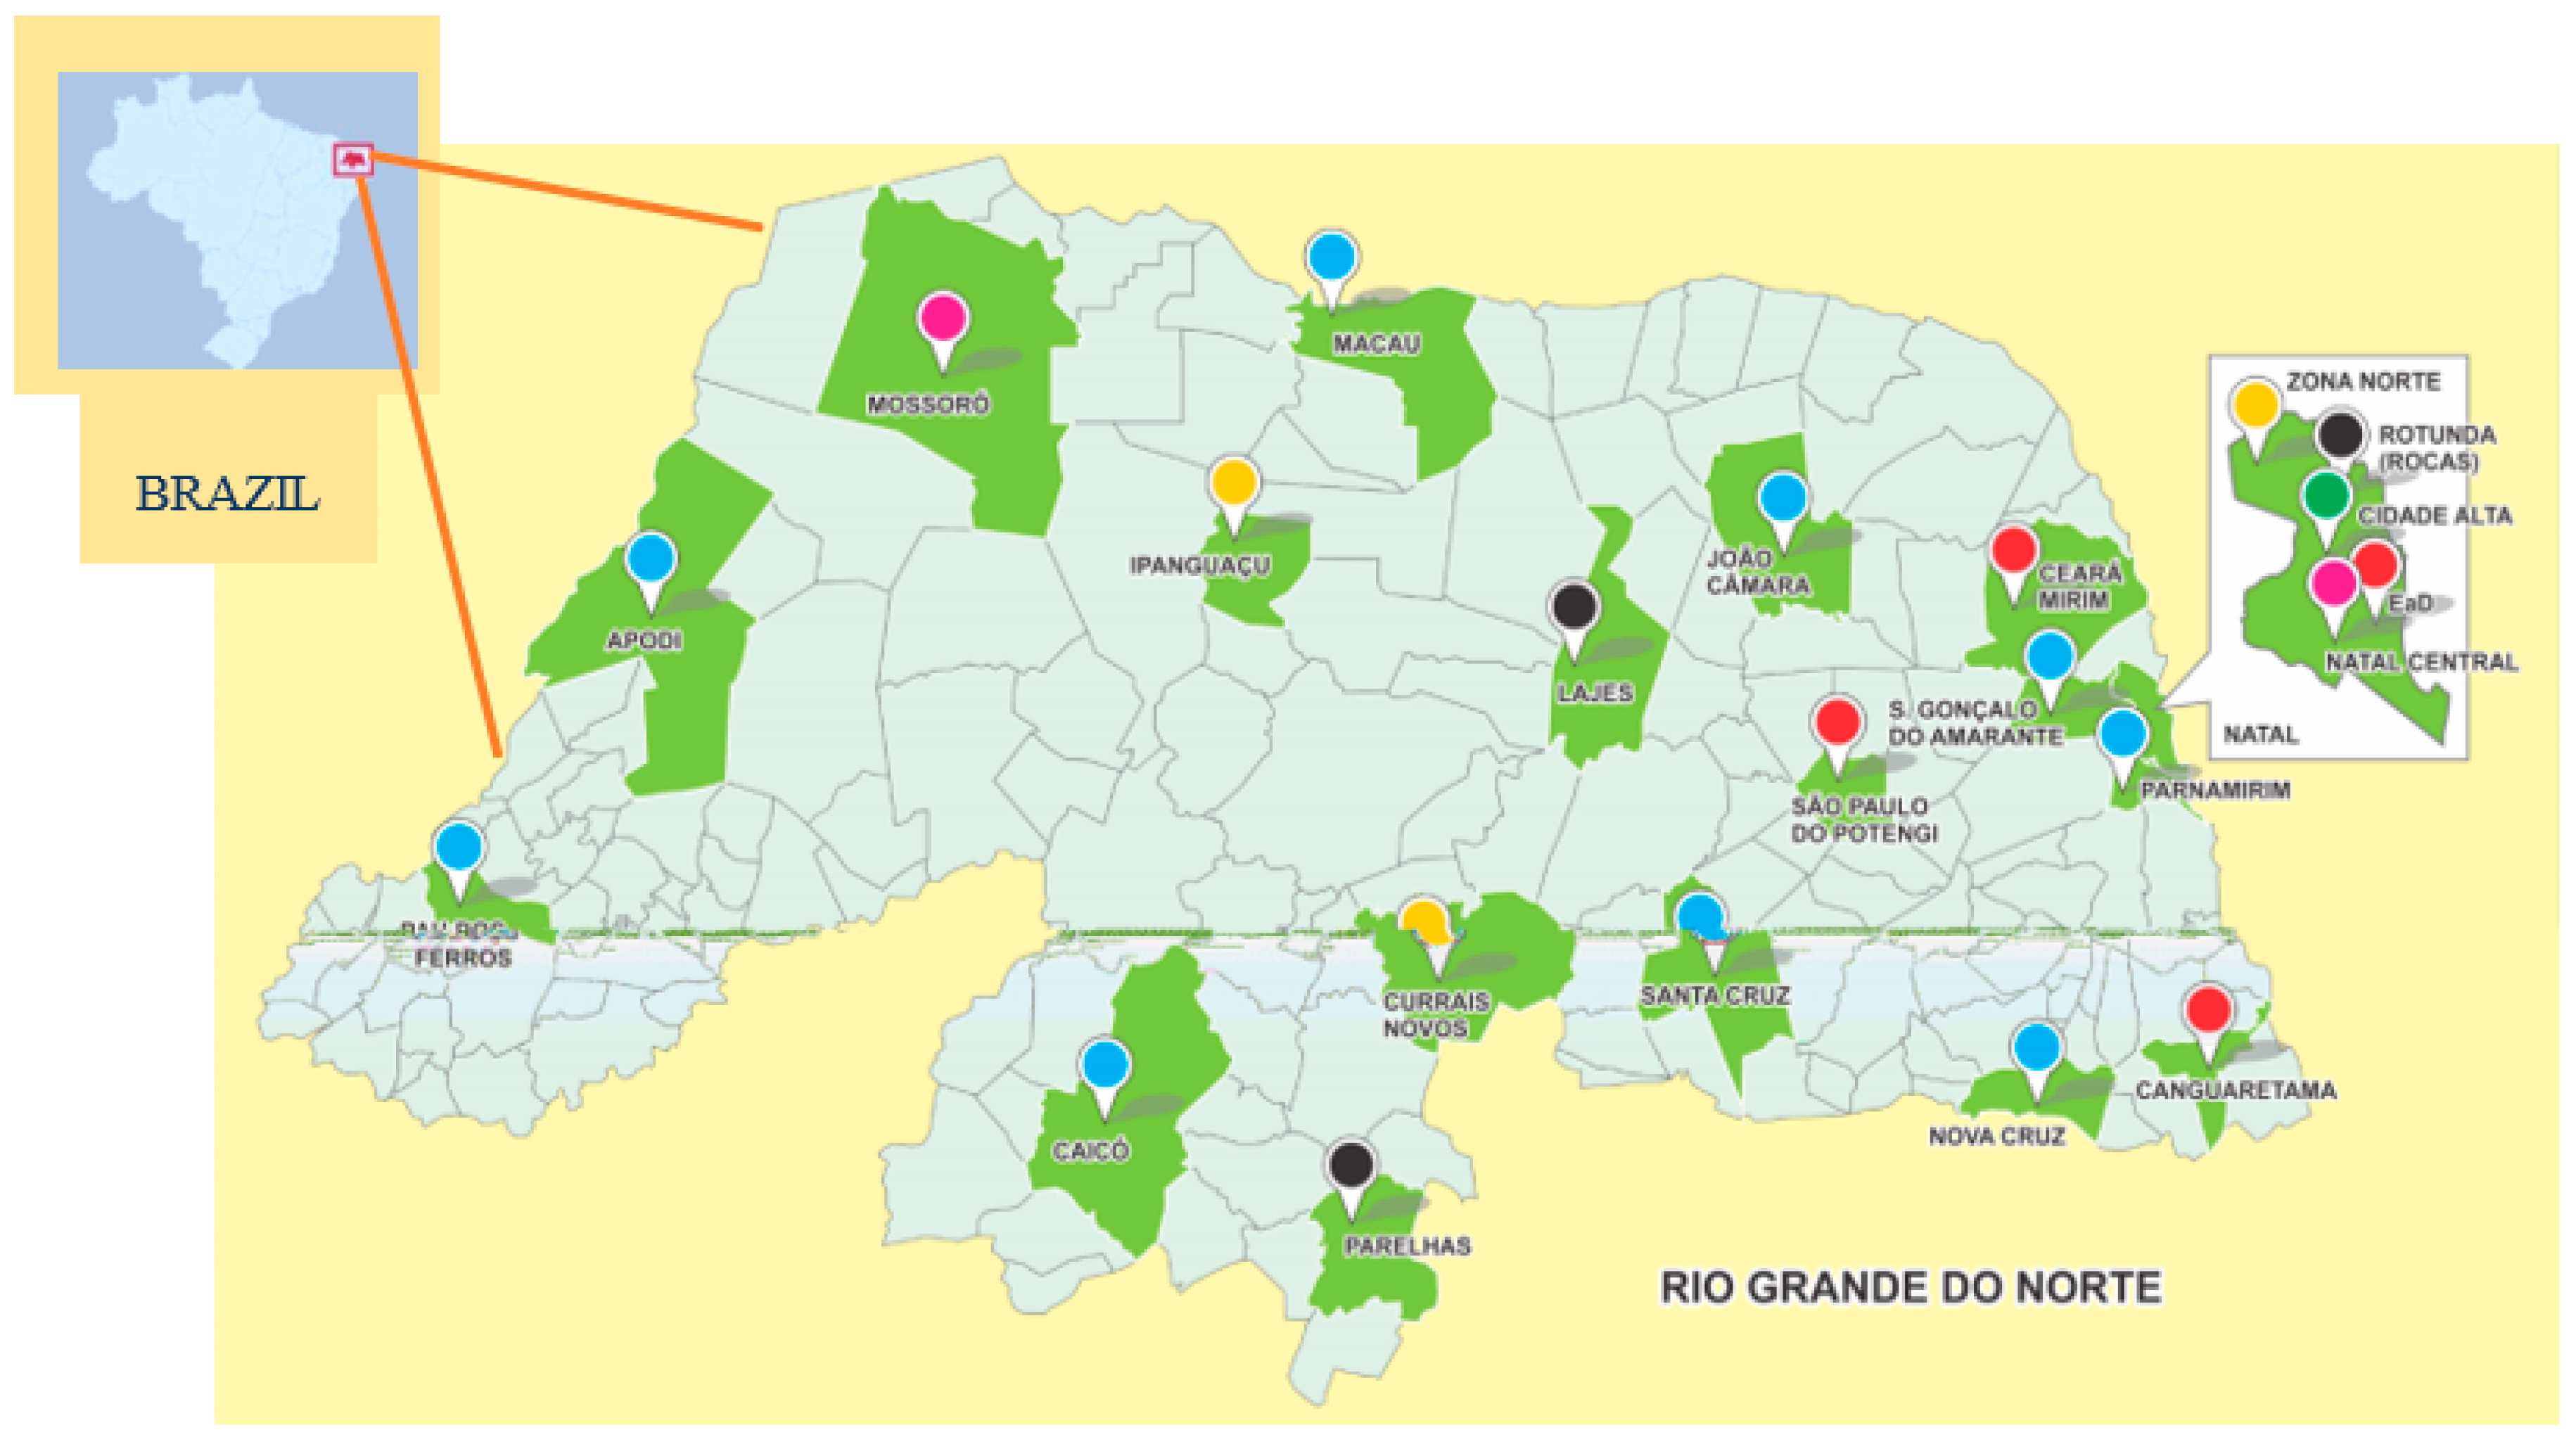
Guided by its PLS, IFRN has adopted as its main action the implementation of photovoltaic plants at its various campi and in the central administration, totaling 2 MWp installed in all 19 headquarters, distributed throughout 24 network-connected systems, as detailed in
Table 2. The city of Natal has seven plants (Cidade Alta, Natal Central I and II, Reitoria I and II, and Zona Norte I and II) installed in its four headquarters (Cidade Alta, Natal Central, Reitoria, and Zona Norte), while the other 17 plants are distributed throughout the other IFRN campuses located in other municipalities.
Figure 1 displays the IFRN headquarter distribution in the state of Rio Grande do Norte.
Plant implementation took place in a gradual and planned manner, so that each administrative unit would have its own generating source, as dispersion of the plants throughout the various campi, in a management view, would equitably distribute the benefits of photovoltaic technology to all teaching units, in addition to providing visibility towards politically and environmentally correct actions. Thus, a project was prepared for each generation unit, whose capacity, in kWp, would supply a portion of the installed load of the administrative unit based on its own non-standardized criteria.
Within this planning, the distribution of the first plant took place in the Rectory (Reitoria) building, the headquarters of the institution’s top administration, representing a strategic landmark, providing notoriety for management concerns regarding the efficiency of public resources and institutional sustainable development. Subsequently, the focus turned to photovoltaic plant deployment on newer campi, such as Ceará-Mirim, São Paulo do Potengi, and Canguaretama. In the following years, IFRN fulfilled the goal of placing one plant in each administrative unit whose sequential order, apparently, did not comprise any clearly established or conditioning criterion. The Mossoró, Santa Cruz, Natal-Central, Reitoria, and Zona Norte, headquarters received a second plant later on, to more adequately satisfy their photovoltaic production demands.
The purchase regime took place through a bidding process, where both lowest price and the structural, economic and legal contribution of the available companies were simultaneously considered when declaring the winner. Because of this, and due to the fact that bidding processes took place at different periods over time, differences between investments in US $/kWp and a variety of panel and inverter models, in terms of efficiency, power or technology, as well heterogenous installation modes (arranged on the ground, in parking lots, or on roof covers) are observed. This, in addition to specific factors such as location, orientation, slope, climatic conditions, investment, fixed and variable costs and energy taxes, will be considered to infer whether plant implementations meet technical and economic expectations argued as attractive to IFRN Solar project implementation.
3. Material and Methods
To meet the objectives of this research, the following methodological paths were applied:
- (i)
IFRN-Solar project photovoltaic systems generated electric energy assessments by using the free PVWatts Software, chose n for its simplicity and practicality, able to estimate energy production anywhere in the world from data comprising power, inclination, orientation and system installation method. The actual measurements recorded via online monitoring available for all plants were also used;
- (ii)
The irrandiance and temperature values used to estimate the energy production were extracted from the PVWatts software that uses database of the National Renewable Energy Laboratory (NREL) database.
- (iii)
Plant performance analyses based on consolidated literature performance indicators, such as Reference Yield, Final Yield, Performance Ratio, Capacity Factor and Global System Efficiency;
- (iv)
Economic analyses using the discounted payback technique, which consists of the period of time necessary to recover investments by evaluating discounted cash flows, i.e., considering the value of the capital over time.
In addition to the reality experienced by the IFRN-Solar project, of plants implemented in a decentralized manner in 19 headquarters, this study also considers a further two scenarios, allowing for assessments concerning probable energy generation gains and, consequently, financial returns earned when simulating photovoltaic system redistribution (centralization) in locations presenting better energy yields.
3.1. Photovoltaic Array Performance
Within an adequate regulatory framework that guarantees photovoltaic system-based electric energy production, the main investor uncertainty is the total electricity both generated and made available to supply demands. Thus, assessments concerning system performance are expected from the beginning of any photovoltaic project, paramount in assessing investment financial risks. Understanding system performance allows for total energy supply projections to be made available for consumption [
17]. To this end, the use of photovoltaic system performance models are required, which comprise mathematical representations used to estimate electricity generation. These models predict the amount of generated energy based on system specifications (modules, inverters, installation characteristics, among others.) and meteorological data (solar irradiance, ambient temperature and wind speed, among others).
Many photovoltaic system models and performance analysis methods are available in the literature. Observed differences are related to the type of input parameters, measuring equipment and operation (connected or not connected to the network). According to [
18], three main categories for evaluating and forecasting photovoltaic system performance are noted, based on: (i) real-time operating data; (ii) measurements; and (iii) simulation. On the other hand, [
24] categorized methods into three main categories: (i) statistical time series methods; (ii) physical methods; and (iii) combined.
In this context, software packages such as PVsyst, PVSOL Premium, HelioScorpe, PV DesignProl, and SOLergo provide complete 2D or 3D designs and simulation environment, using vast libraries, including solarimetric and meteorological databases, providing engineers, designers or researchers with the ability to completely scale photovoltaic systems connected to the distribution network, both isolated and hybrids, and carry out generated electricity estimates. However, the costs of these software packages limit their use for small-scale projects or for end-users [
19].
Thus, simpler performance simulators, such as PVSuiteBR and PVWatts, which are freely accessible, easy to interact with and require few input parameters, are more indicated. PVWatts was chosen for this study to simulate IFRN-Solar Project plant performance due to its ability to estimate photovoltaic system energy production anywhere in the world, allowing homeowners and small buildings owners, installers and manufacturers to more easily estimate the performance of possible photovoltaic generation units in their ventures. PVWatts allows the user to enter system parameters such as power, type of module, type of installation, inclination angle and azimuth angle, and obtain both estimated energy production calculations and system losses.
For the photovoltaic system performance analysis, the literature offers certain indicators, such as Reference and Final Yields, Performance Ratio, Capacity Factor and Global Efficiency of the System. These indicators allow for inferences regarding the solar potential of different locations or comparisons between different technologies, are were, thus, applied herein, detailed below.
The Reference Yield (
) represents the ratio between total or global radiation in the arrangement plane and the Reference Irradiance under Standard Test Conditions (STC). This indicator provides the equivalent number of hours of the Reference Irradiance, therefore representing the ideal energy to be produced if the system operates under STC efficiency conditions. [
18]. It conforms to a theoretical energy measure available at a specific location for a specified period of time [
21], and is represented by Equation (1).
where:
H is the total Solar Radiation in the plane, in kWh/m
2; and
GSTC is the solar irradiance in STC, whose value is 1 kW/m
2.
Equation (1) does not consider photovoltaic panel temperature effects, so a correction factor is required [
38], according to Equation (2).
where:
YCR is the Corrected Reference Yield;
YR is the Reference Income computed according to Equation (1);
α is the temperature coefficient of the panel, in %/°C;
TC is the panel temperature, in °C; and
TSTC is the reference temperature under STC, in °C.
The Final Yield (
YF) is defined as the ratio of the total alternating current (AC) energy generated by the system for a defined period of time and nominal installed system power. This indicator indicates how many hours per day the photovoltaic system must operate at its rated power to produce the total energy projected for the system [
21]. It that allows for generated energy normalization according to system size [
39], and is represented by Equation (3).
where:
EAC is the AC output power of the system, in kWh; and
PSTC is installed power under STC, in kW.
Another important photovoltaic system performance assessment index is the Performance Ratio (PR), which provides an understanding of the total system efficiency in relation to installed nominal power, defined as:
where:
YF is the Final Yield and
YCR is the Corrected Reference Yield.
PR values are used to compare different types of photovoltaic system technology as a way to correlate system performance with local climatic conditions, carried out seasonally [
40]. Annual
PR value comparisons allows for indicative photovoltaic use performance evaluations, although this does not take into account the effect of possible park grid disconnection periods. The
PR is useful in identifying problems such as inverter operation failures, module shading, diode failures and maintenance problems related to panel material deposition [
41]. It, thus, allows for inferences on global system productivity loss effects [
16].
The Capacity Factor (
CF) is defined as the ratio between the AC energy effectively produced by the photovoltaic system during a given period of time and the maximum generation capacity during that same period. Equation (5) expresses the Capacity Factor for an annual period:
where:
EAC is the AC output power of the system, in kWh and
PSTC is the installed power under STC, in kW. In this specific study, a time period of one year was considered, hence the appearance of the factor 8760, which corresponds to the multiplication of 365 days of the year by 24 h of operation per day [
16].
The Annual Global Efficiency (
ηA) of the system represents the ratio between the system’s annual AC power production and the total energy collected by the photovoltaic array, described by Equation (6):
where:
EAC is the AC output power of the system, in kWh;
H is the total solar radiation in the plane, in kWh/m
2; and
APV is the total area of the photovoltaic array, in m
2.
Technical plant performance analyses and comparisons installed within the scope of the IFRN-Solar Project were carried out based on three premises:
- (a)
Premise 1: assesses the energy production in the study localities by applying a standard system for all units. AC power production is estimated through the application of the PVWatts Performance Simulator, for each location where an IFRN unit is installed, applying common characteristics such as an installed capacity of 27,825 kWp and roof-installed photovoltaic panels at 10° inclination and 0° azimuth. This analysis aims to differentiate the theoretical yields of each location based on local climatic conditions, since the simulated system is common to all units.
- (b)
Premise 2: simulates energy production based on the real conditions of each photovoltaic system installed at the different units. AC power production is estimated through the PVWatts Performance Simulator for each IFRN unit location, using the actual information from each system installed in the IFRN-Solar Project in the analyzed location, such as latitude and longitude, type of installation, slope, orientation and installed power, as presented in
Table 2 and
Table 3. The aim of this premise is to highlight the differences between the calculated values and those obtained in Premise 1, in order to understand how significant orientation, inclination and type of installation influences become.
- (c)
Premise 3: the energy measurement records of the IFRN-Solar Project plants are used to then analyze the available parameters and compare them with the values obtained in Premises 1 and 2.
Thus, the Corrected Reference Yield (YCR), Final Yield (YF), Performance Ratio (PR), Capacity Factor (CF) and Annual Global Efficiency (ηA) of the systems were used to infer which locations (IFRN teaching units) are most appropriate for photovoltaic system deployment.
3.2. Economic Viability Analyses of the Photovoltaic Arrangements
Several studies [
14,
22,
23,
42,
43,
44,
45] have investigated economic photovoltaic system performance in terms of investment attractiveness, which considers the financial returns provided by a given technology. The most applied concepts are the Net Present Value (NPV), Payback (PB), and Internal Rate of Return (IRR). Payback (PB) is defined as the period of time required to recover an initial investment, but may overestimate the financial return if the discount rate is disregarded. Therefore, it is advisable to use the Discounted Payback Time (DPB). Similar to the NPV and DPB, the IRR allows for economic-financial performance comparisons between different regions and technologies, but becomes limited when comparing projects presenting different scales and time horizons. The IRR is indicated when it is difficult to fix the discount rate [
14].
In Brazil, companies that sell photovoltaic systems massively disclose the fact that it is advantageous to invest in individual electric energy production using this technology, mainly due to the constant drop in module prices noted since the 2010s, as well as increased electricity taxes. The main argument used is the Payback time, which usually ranges between 5 and 8 years [
46]. This parameter is considered as a rule for residential system investments. Because of this, this study uses the DPB as the main parameter to assess the financial viability of IFRN-Solar Project plants.
It is important to highlight that a photovoltaic system installation in a consumer unit (connected to the grid) requires the purchase of modules, inverters, cables, protection devices, electrical panels and connectors, among others, which demand investor disbursement for the system to begin operating, termed as initial investments. The system then produces electricity available for individual consumption or which may be injected into the local distribution network if the supply temporarily exceeds consumption. In the present study, all plants generate lower electricity values than the demands for each IFRN headquarters. In these operating conditions, photovoltaic system financial returns are accounted for by the product between the produced energy (kWh) and the electric energy tax (US$/kWh) practiced by the concessionaire in the concession area.
It is worth mentioning that, throughout the operation period, photovoltaic modules reduce their production capacity at a rate of 0.8%/year [
23], whereas, the energy price also varies over time, with an upward trend in the Brazilian case, considering the price variation driven mainly by inflation and in sectorial positions. In addition, operating and maintenance costs throughout the useful life of these systems must also be considered, which are also influenced by inflation. Equations (7)–(9) describe the power generation behavior, electricity tax value and operation and maintenance costs during the useful life of a photovoltaic system.
where:
PVGt is the photovoltaic (PV) system energy generation for the year
t (MWh);
PVG is the power generation of the PV system for the first year of operation (MWh);
DR is the photovoltaic module degradation rate over time (%/year);
t is the period represented in years;
EPt is the average grid electricity price in the year
t (US
$/kWh);
EP is the average grid electricity price in the first year of PV system operation (US
$/kWh);
PVR is the Energy Price Valuation Fee charged by the concessionaire (%);
O&Mt comprise the cost of operating and maintaining the photovoltaic plants in year
t (US
$);
O&M comprise the cost of operating and maintaining photovoltaic plants during the first year of operation (US
$); and
OMR consists in the Operation and Maintenance Cost Appreciation Rate (%).
Since the 2000s (the last 20 years), the average inflation rate in Brazil has remained at around 6.29% per year [
47]. This value is used as a reference for the Electricity Price Valuation Rate (
PVR) every year and for the System Operation and Maintenance Cost Appreciation Rate (
OMR). The Average Electricity Price (
EP), on the other hand, is estimated at US
$ 0.11/kWh based on average tax costs and average price of the dollar in 2019 [
48]. Operation and maintenance costs, in turn, consist of regular cleaning, performance monitoring and inverter replacement approximately every 10 years [
49]. The IFRN-Solar Project experience shows that, in addition to these factors, the replacement of equipment such as Surge Protection Devices (SPD), fuses, terminals and photovoltaic modules, as well as inverter repairs, still within the warranty period, are also required.
Table 4 displays the initial and maintenance and operating costs for each IFRN plant. Differences in the values referring to investments (US
$/kWp) and O&M costs (US
$/kWp) are noted, due to the variety of modules and inverters acquired during the IFRN-Solar Project.
These values allow for calculations concerning investment recovery time using Equation (10), which represents the Discounted Payback (DPB) method, reached when the cash flow accounted for until period T equals the initial investment
I (US
$) considering a discount rate
r (%). The goal is to determine the value of T, for which the sum equals the initial investment
I. The other variables in Equation (10) have been defined previously.
For investment analyses, the proposal for a new project must assess whether a Minimum Attractiveness Rate (MAR) that will serve as a reference for decision-making is available [
42]. This rate corresponds to the interest rate available on the financial market. Several indicators on which the investor may base him/herself are available but, in Brazil, the interest rate practiced in the market is based on the SELIC (Special Settlement and Custody System) rate, which comprises the reference rate for loans in government bonds, determined by the Brazilian Central Bank. This rate has assumed an average value of 6.22%, in the last two years (2018 and 2019) [
50]. For this study, considering the legal nature of IFRN, a public authority prevented from investing in the market, the SELIC rate is used as the discount rate
r, since it is used by the institution when assessing the economic viability of its projects, disregarding the use of the Risk Premium, the difference between the return of any investment and the return of another, considered risk-free.
3.3. Centralized vs. Decentralized Arrangement
Multi-headquarter companies or institutions should pay attention to their adopted arrangements, so that are able to obtain higher returns when planning the adoption of photovoltaic systems as a way of reducing electricity costs and promoting sustainability actions. The choice to disperse the photovoltaic systems in different locations should be opposed to arrangements that concentrate the systems in sites presenting better technical performance, in terms of alternative assessment studies, and consequently, greater economic and environmental gains. In the case of the IFRN-Solar Project, the adopted strategy was to disperse the plants throughout all IFRN headquarters, located in different regions in the state of Rio Grande do Norte.
This study investigates photovoltaic system allocation in locations displaying the best energy performance as a way of comparing how significant electricity generation and financial return gains become. To this end, three scenarios were structured:
- (a)
Scenario 1: aims to analyze the energy and financial gains obtained, basically, by the redistribution of IFRN-Solar Project plants to headquarters displaying the best energy performance. Thus, the total installed kWp, originally distributed throughout all IFRN headquarters, is now relocated to locations presenting the best energy efficiency, considering maximum unit demands through an energy concessionaire contract. According to [
51], the installed power for micro or mini individual consumer unit energy generation cannot exceed its maximum contracted demand. Therefore, kWp distribution is carried out according to
Table 5. In this scenario, the headquarters located at Apodi, Caicó, Cidade Alta, Natal Central, Pau dos Ferros, Reitoria and Zona Norte receive the corresponding power from other headquarters, respecting contracted demand limits. Initial and operation and maintenance plant costs are considered as remaining the same in relation to the actual data. This means that the possible obtained gains in this scenario, both concerning energy generation and financial returns, will be exclusively the result of the better aptitude of the locations designated for photovoltaic technology-based energy generation.
- (b)
Scenario 2: aims to understand financial IFRN gains in case the IFRN-Solar Project would be implemented based on the photovoltaic system resale prices currently practiced in the Brazilian market. In this proposal, the distribution of installed kWp is exactly equal to that of the IFRN-Solar Project, as displayed in
Table 2. The difference is in the fact that the original investment values are replaced by the average market prices of Scenario 2, [
52,
53,
54,
55], varying according to the power to be installed. As presented in
Table 5, these prices are much more attractive to investors than those originally purchased by the IFRN-Solar project, reflecting declining photovoltaic solar energy prices. Therefore, the results in energy terms for this scenario are expected to be equal to those already in place, since the photovoltaic module distribution is identical to that of the installed plants. Regarding financial returns, an even more positive result is expected, since the initial investment for Scenario 2 is less than one third of that noted for Scenario 1 for the most extreme cases, such as the power plants located at Cidade Alta and Parnamirim.
- (c)
Scenario 3: in this configuration, we wished to understand how significant the energy and financial returns would be based on installed kWp reallocation, as proposed in Scenario 1 while, at the same time, presenting the initial investment amounts proposed in Scenario 2. As a result, the expected results in terms of energy are the same as Scenario 1, since photovoltaic module reallocation is the same for both scenarios. Regarding financial returns, more attractive results from Scenario 2 in that it distributes the photovoltaic modules throughout headquarters offering greater electric energy production.
Considering that the distinctions in the scenario configurations basically reside in the way in which the plants are distributed among the headquarters and in the value of their initial investment,
Table 6 briefly explains these differences.
4. Results and Discussion
The energy and economic-financial analysis of the results of the implementation of the IFRN-Solar Project are based on the theoretical basis and the premises and scenarios presented in the previous section. The following parameters were applied for the energy analysis: (i) Corrected Reference Yield (YCR); (ii) Final Yield (YF), (iii) Performance Ratio (PR); (iv) Capacity Factor (CF); and (v) Global System Efficiency (ηA). The Discounted Payback (DPB) method was used for the economic analysis of the adopted Scenarios.
4.1. Energy Performance
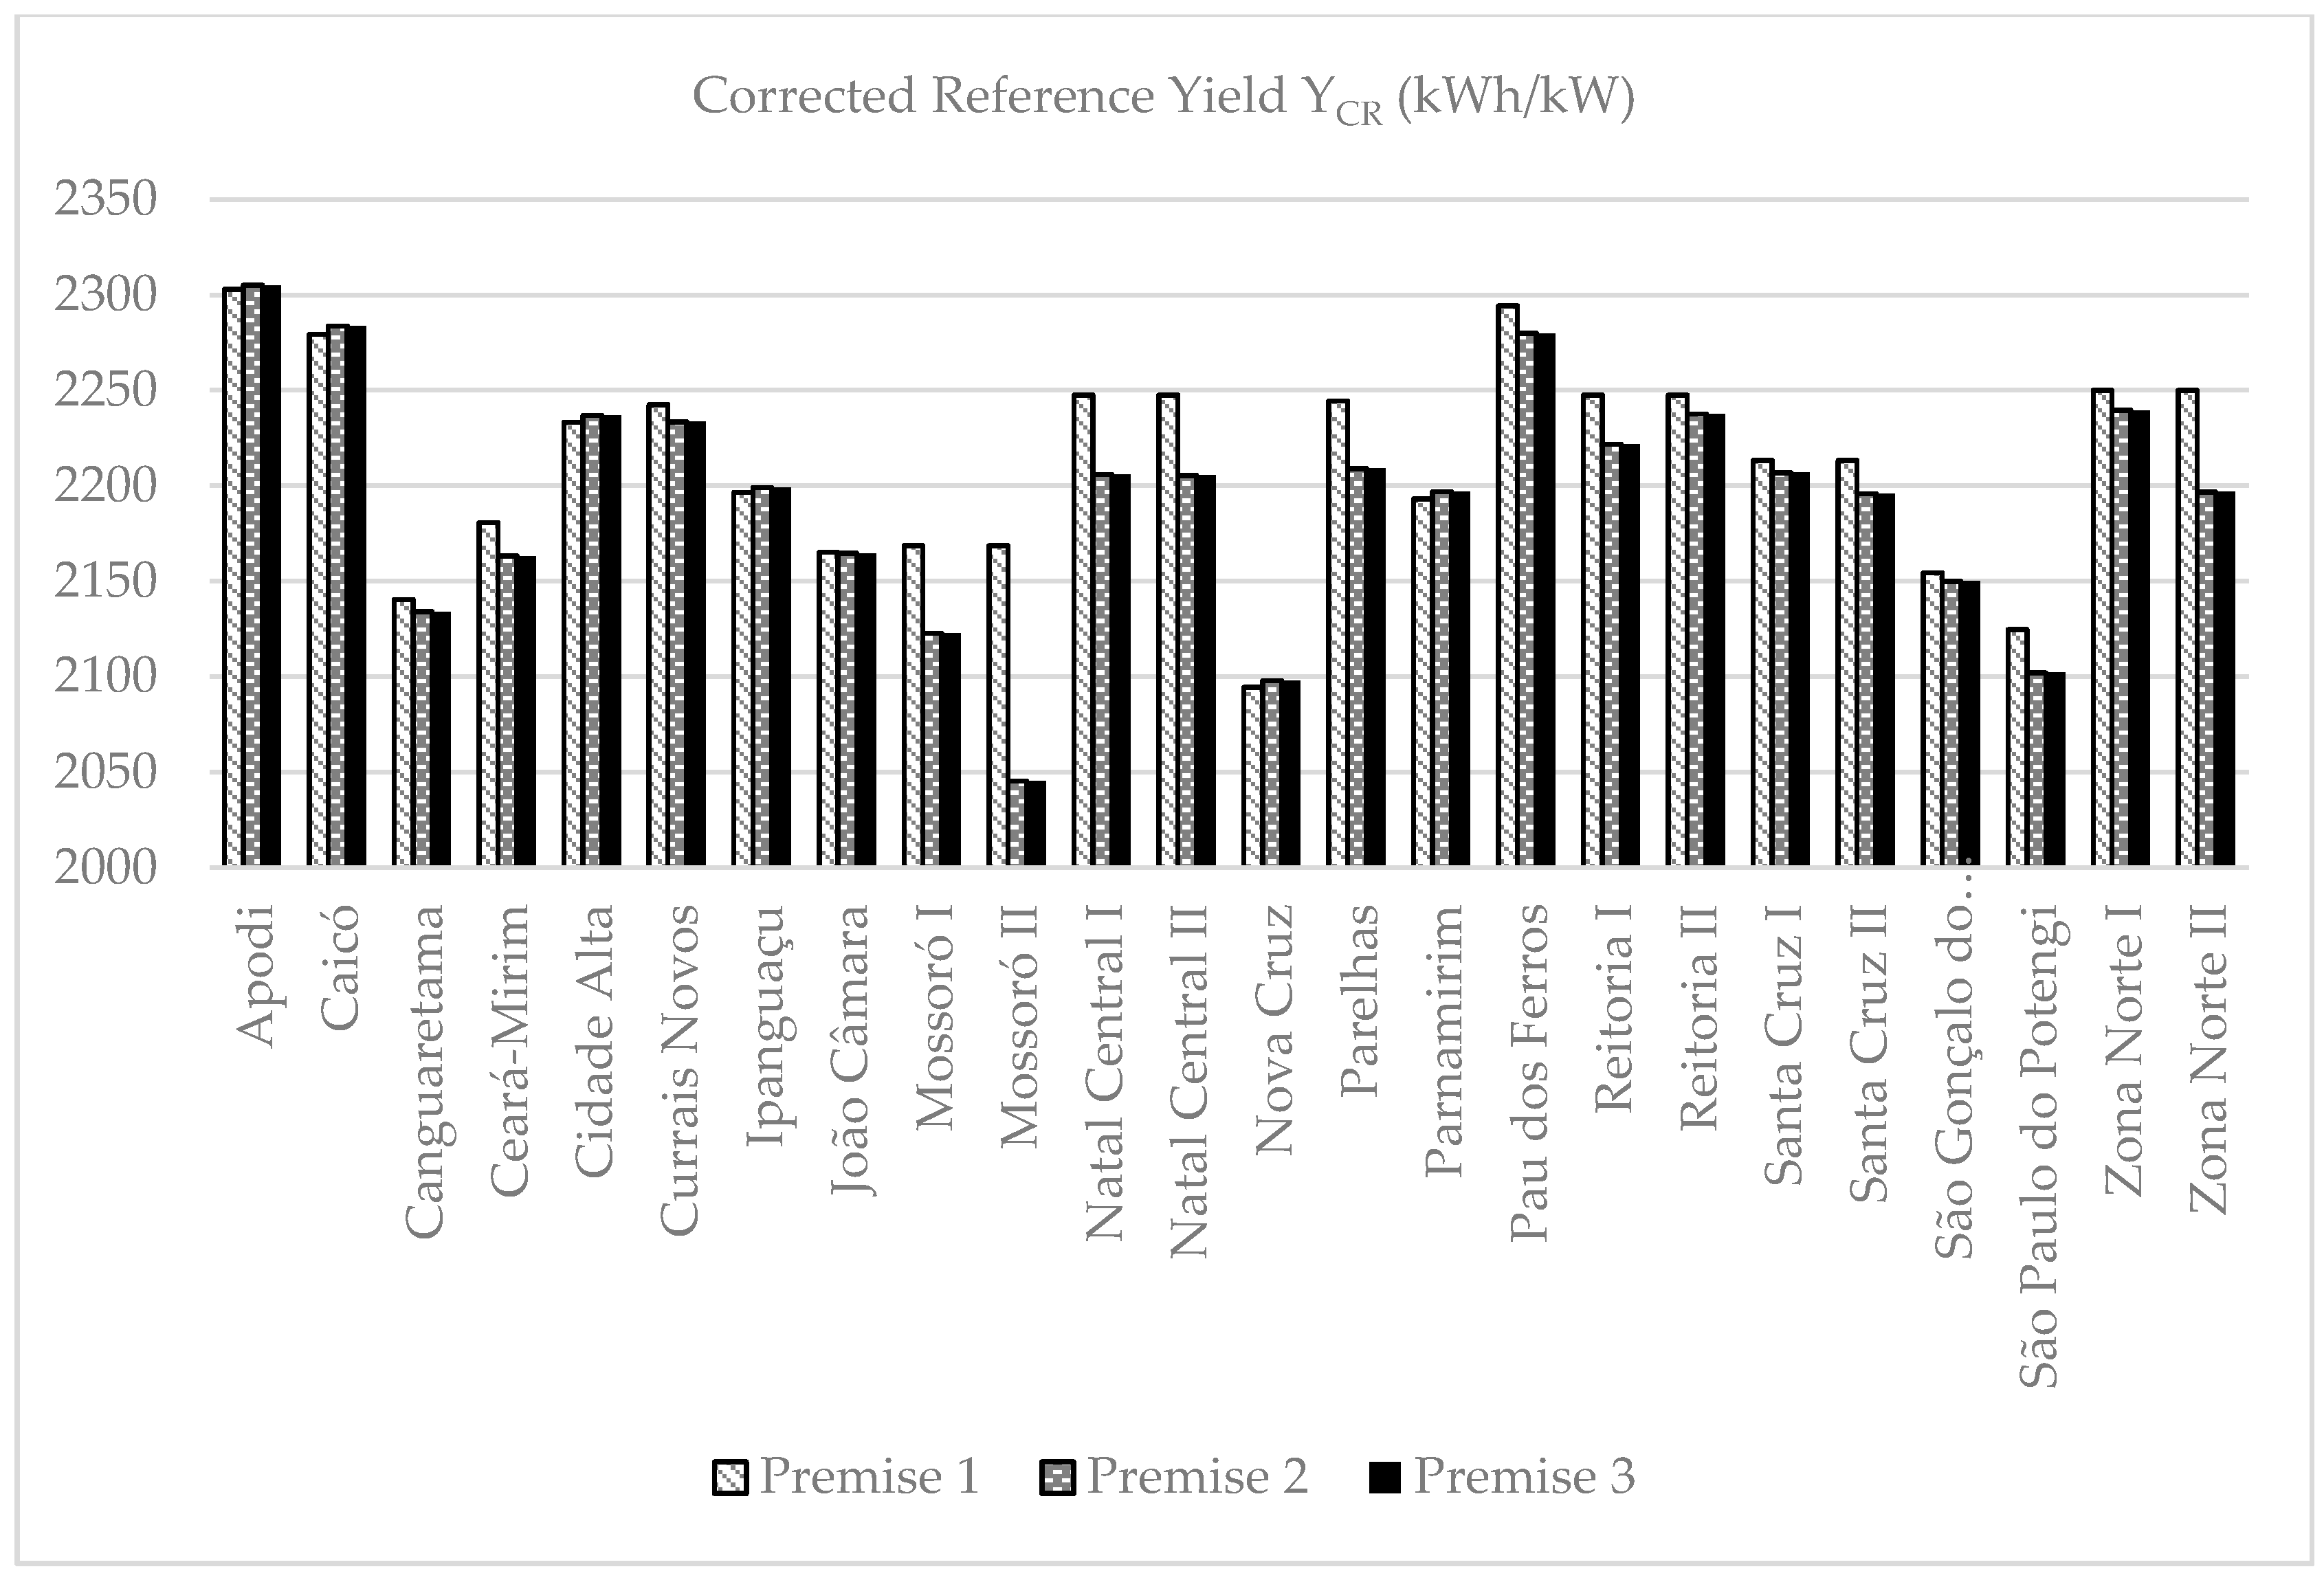
The Corrected Reference Yield (
YCR) represents the number of hours of full sun, which makes it possible to obtain energy generated under STC.
Figure 2 displays
YCR values for the different IFRN-Solar Project plants under the adopted premises 1 (theoretical measure, using the same photovoltaic system under the same installation conditions), 2 (theoretical measure, where the deployed photovoltaic systems and the actual conditions of each installation are applied), and 3 (actual measurements, obtained at the different photovoltaic system installation sites).
Figure 2 also highlights that the highest
YCR values result from Premise 1, where the generated energy values are estimated from the same modules installed in ideal situations, such as 10° inclination and 0° azimuth, whereas the modules in Premises 2 and 3 are those actually implemented according to
Table 2 and
Table 3. Comparing Premises 1 and 2, the biggest differences between
YCR values are noted in cases where the module slope is greater than 10°, when the modules are oriented in at least one direction whose azimuth is greater than 90° or when a combination of the two previous situations occurs, as in the case of the Mossoró campi at its plants I and II, Natal Central I and II, Parelhas, and Zona Norte II.
However, it is important to highlight that some YCR resulting from Premise 2 either match or exceed those from Premise 1, such as the Apodi, Caicó, Cidade Alta, Ipanguaçu, João Câmara, Nova Cruz, Parnamirim, and São Gonçalo do Amarante campi, as the modules are installed with a maximum inclination of 10° and a maximum azimuth of 27°.
The headquarters at Apodi, Pau dos Ferros, Caicó, North Zone, Natal Central, Reitoria, and Parelhas are noteworthy, as they present the highest YCR, based on Premise 1, justified by the most favorable solar radiation conditions at these locations.
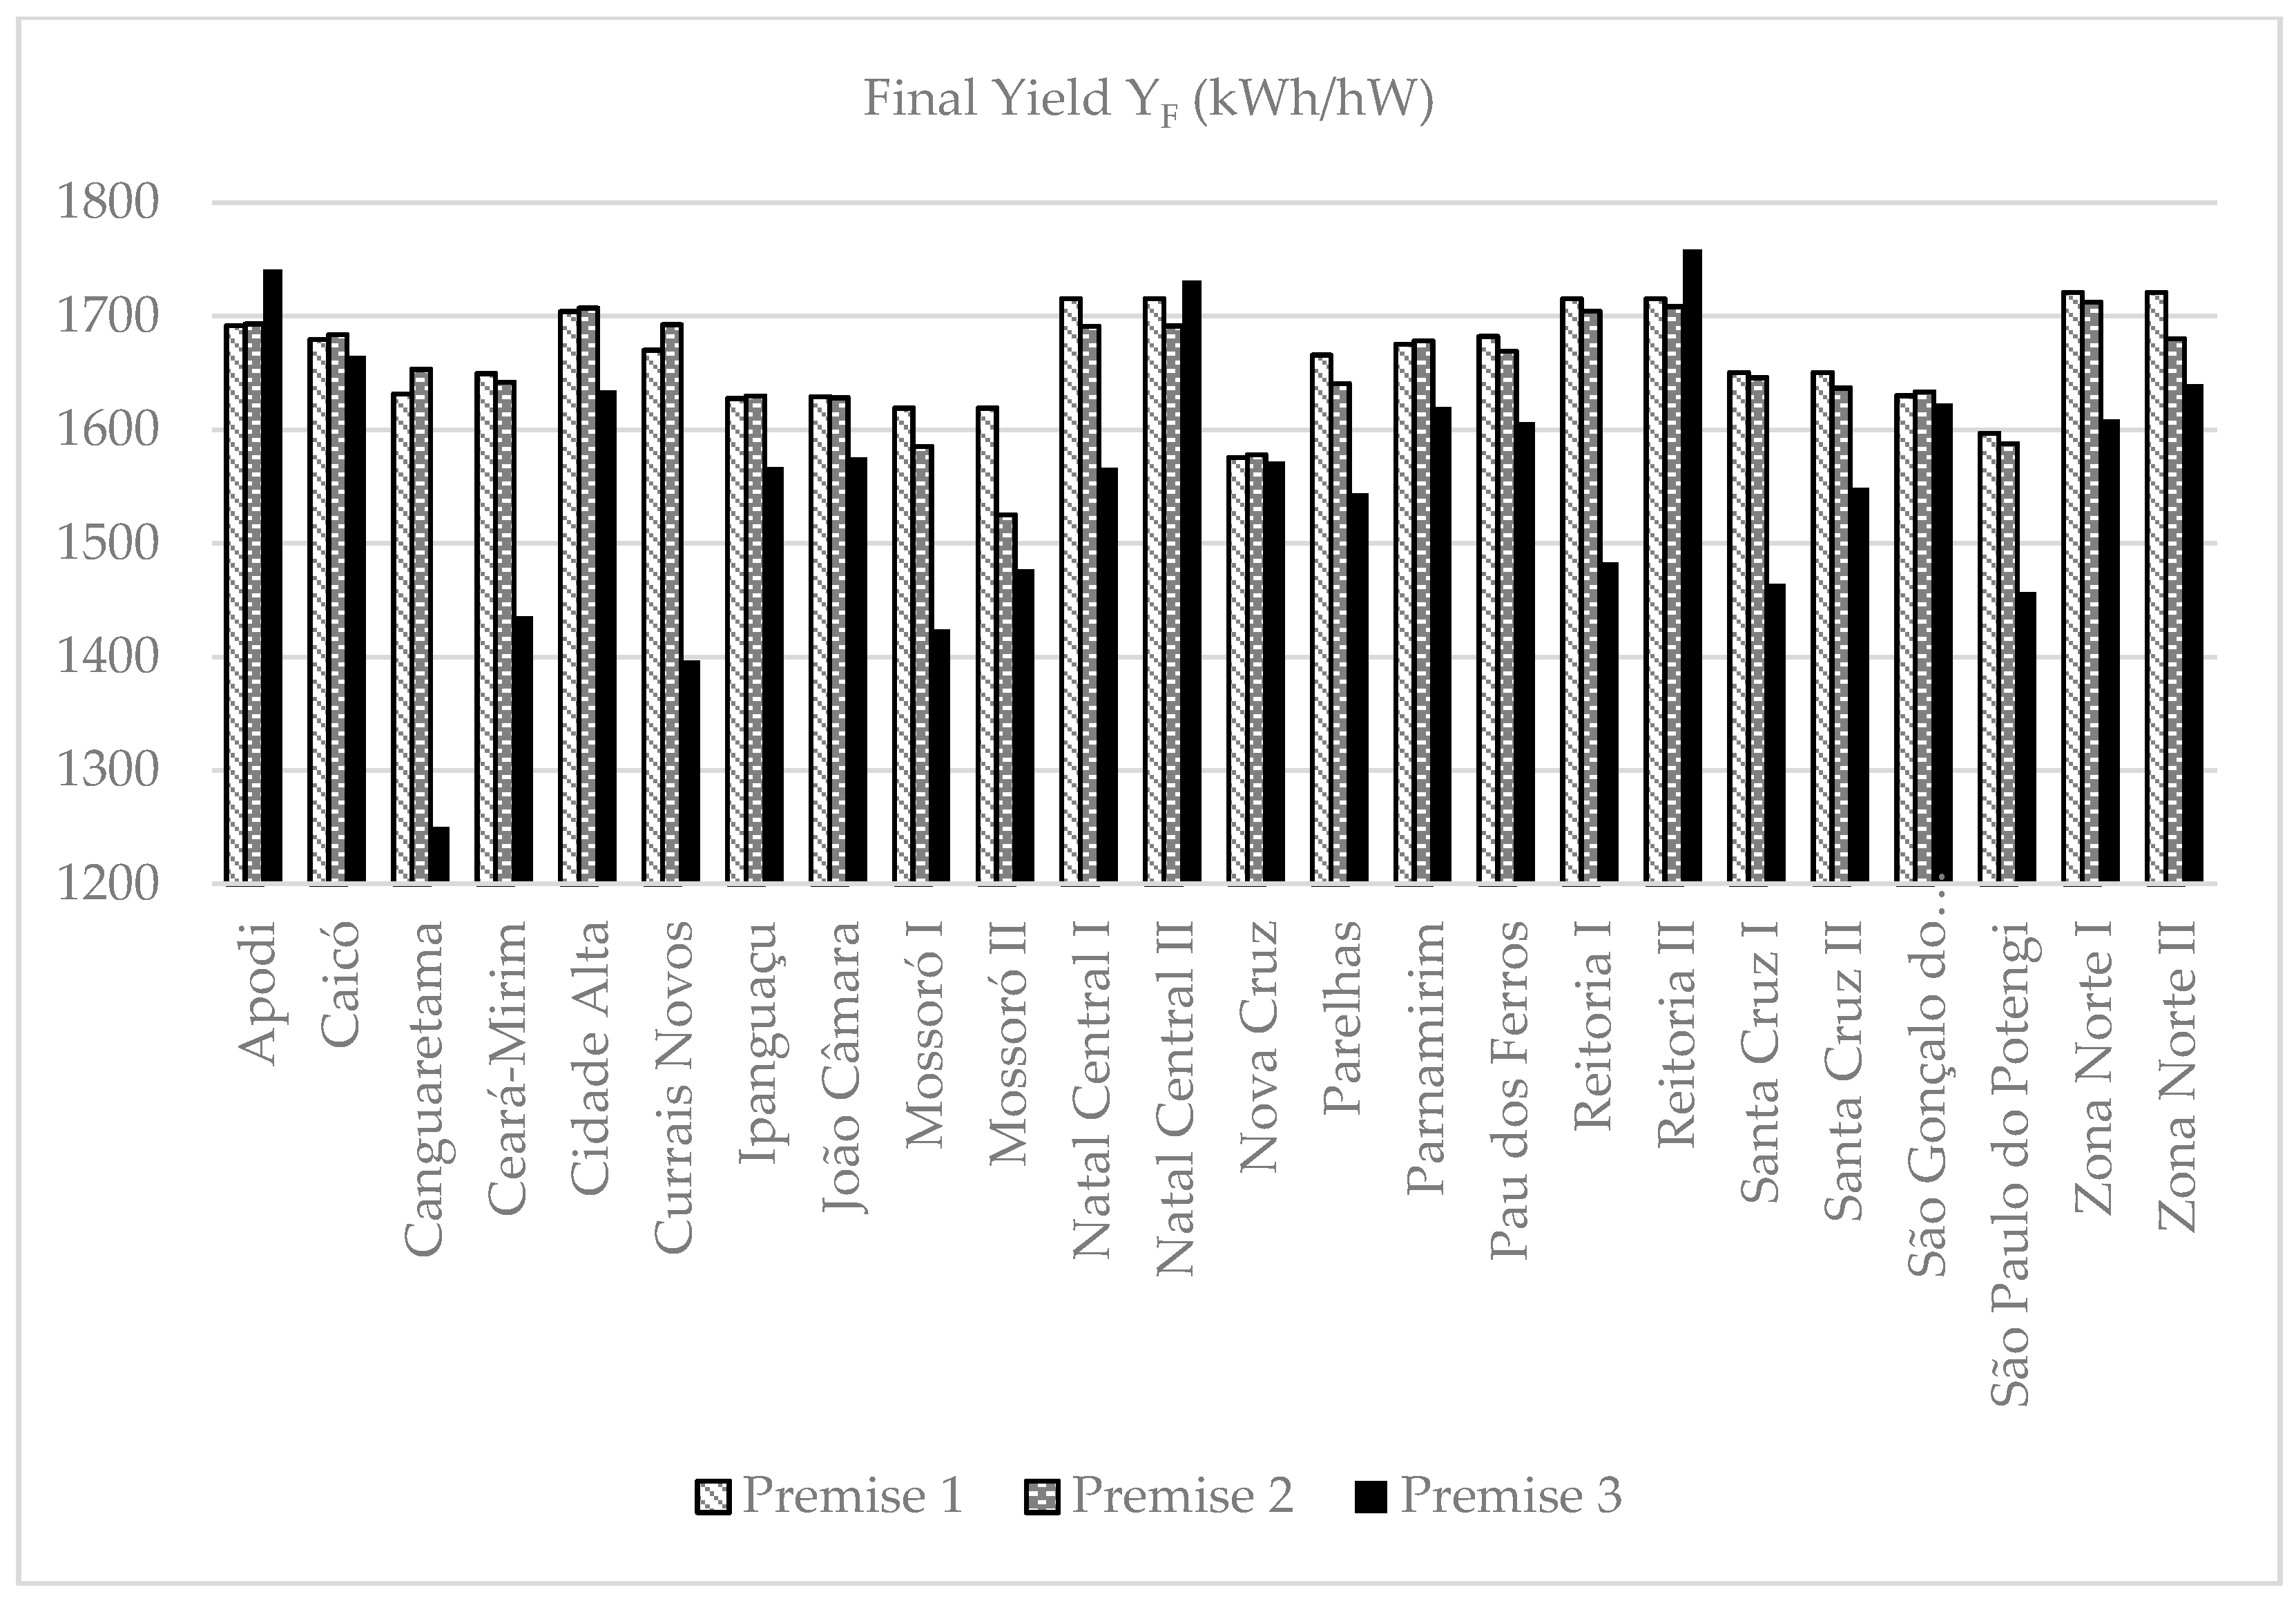
The final yield (
YF), in turn, represents the ratio between the energy (kWh) actually offered by a photovoltaic system and its maximum power capacity (kW), which considers, for this purpose, local climatic conditions and module installation method, orientation, inclination and technology, as well as inverter efficiency and losses throughout the process.
Figure 3 details the behavior of this variable at the IFRN-Solar project plants, indicating
YCR behavior and the existence of differences in final yields when Premises 1 and 2 are compared for the same location. These differences are determined by changes in module orientation, inclination and installation mode. Premise 3 displays a lower magnitude than the theoretical values (Premises 1 and 2) at most sites. This is understandable, as Premise 3 values consider actual existing losses from reduced sunshine periods to module impurities through failures in some devices. Exceptions are noted for the Apodi and Natal Central (plant II) and Reitoria II campi, which exceeded estimated values.
It is important to note the reality at Mossoró, Natal Central, Santa Cruz, Zona Norte, and Rectory campi, which boast of two plants. The measured
YF, using Premise 3 as a reference, was different for the installed plants at these locations, even though they are subject to the same climatic conditions. This is due to the fact that the plants present different inclinations, orientations, modules, models, and number of inverters (
Table 2 and
Table 3). At these headquarters, the plants with the highest
YF displayed higher Module Efficiency and/or had fewer inverters.
From a theoretical point of view, the headquarters at Zona Norte, Natal Central, Reitoria, Cidade Alta, all in the city of Natal, and Apodi, Pau dos Ferros and Caicó, in this order, present the highest YF. This result is consistent with the same analysis carried out for YCR. In practice, considering Premise 3, Parnamirim and São Gonçalo do Amarante also presented satisfactory yields.
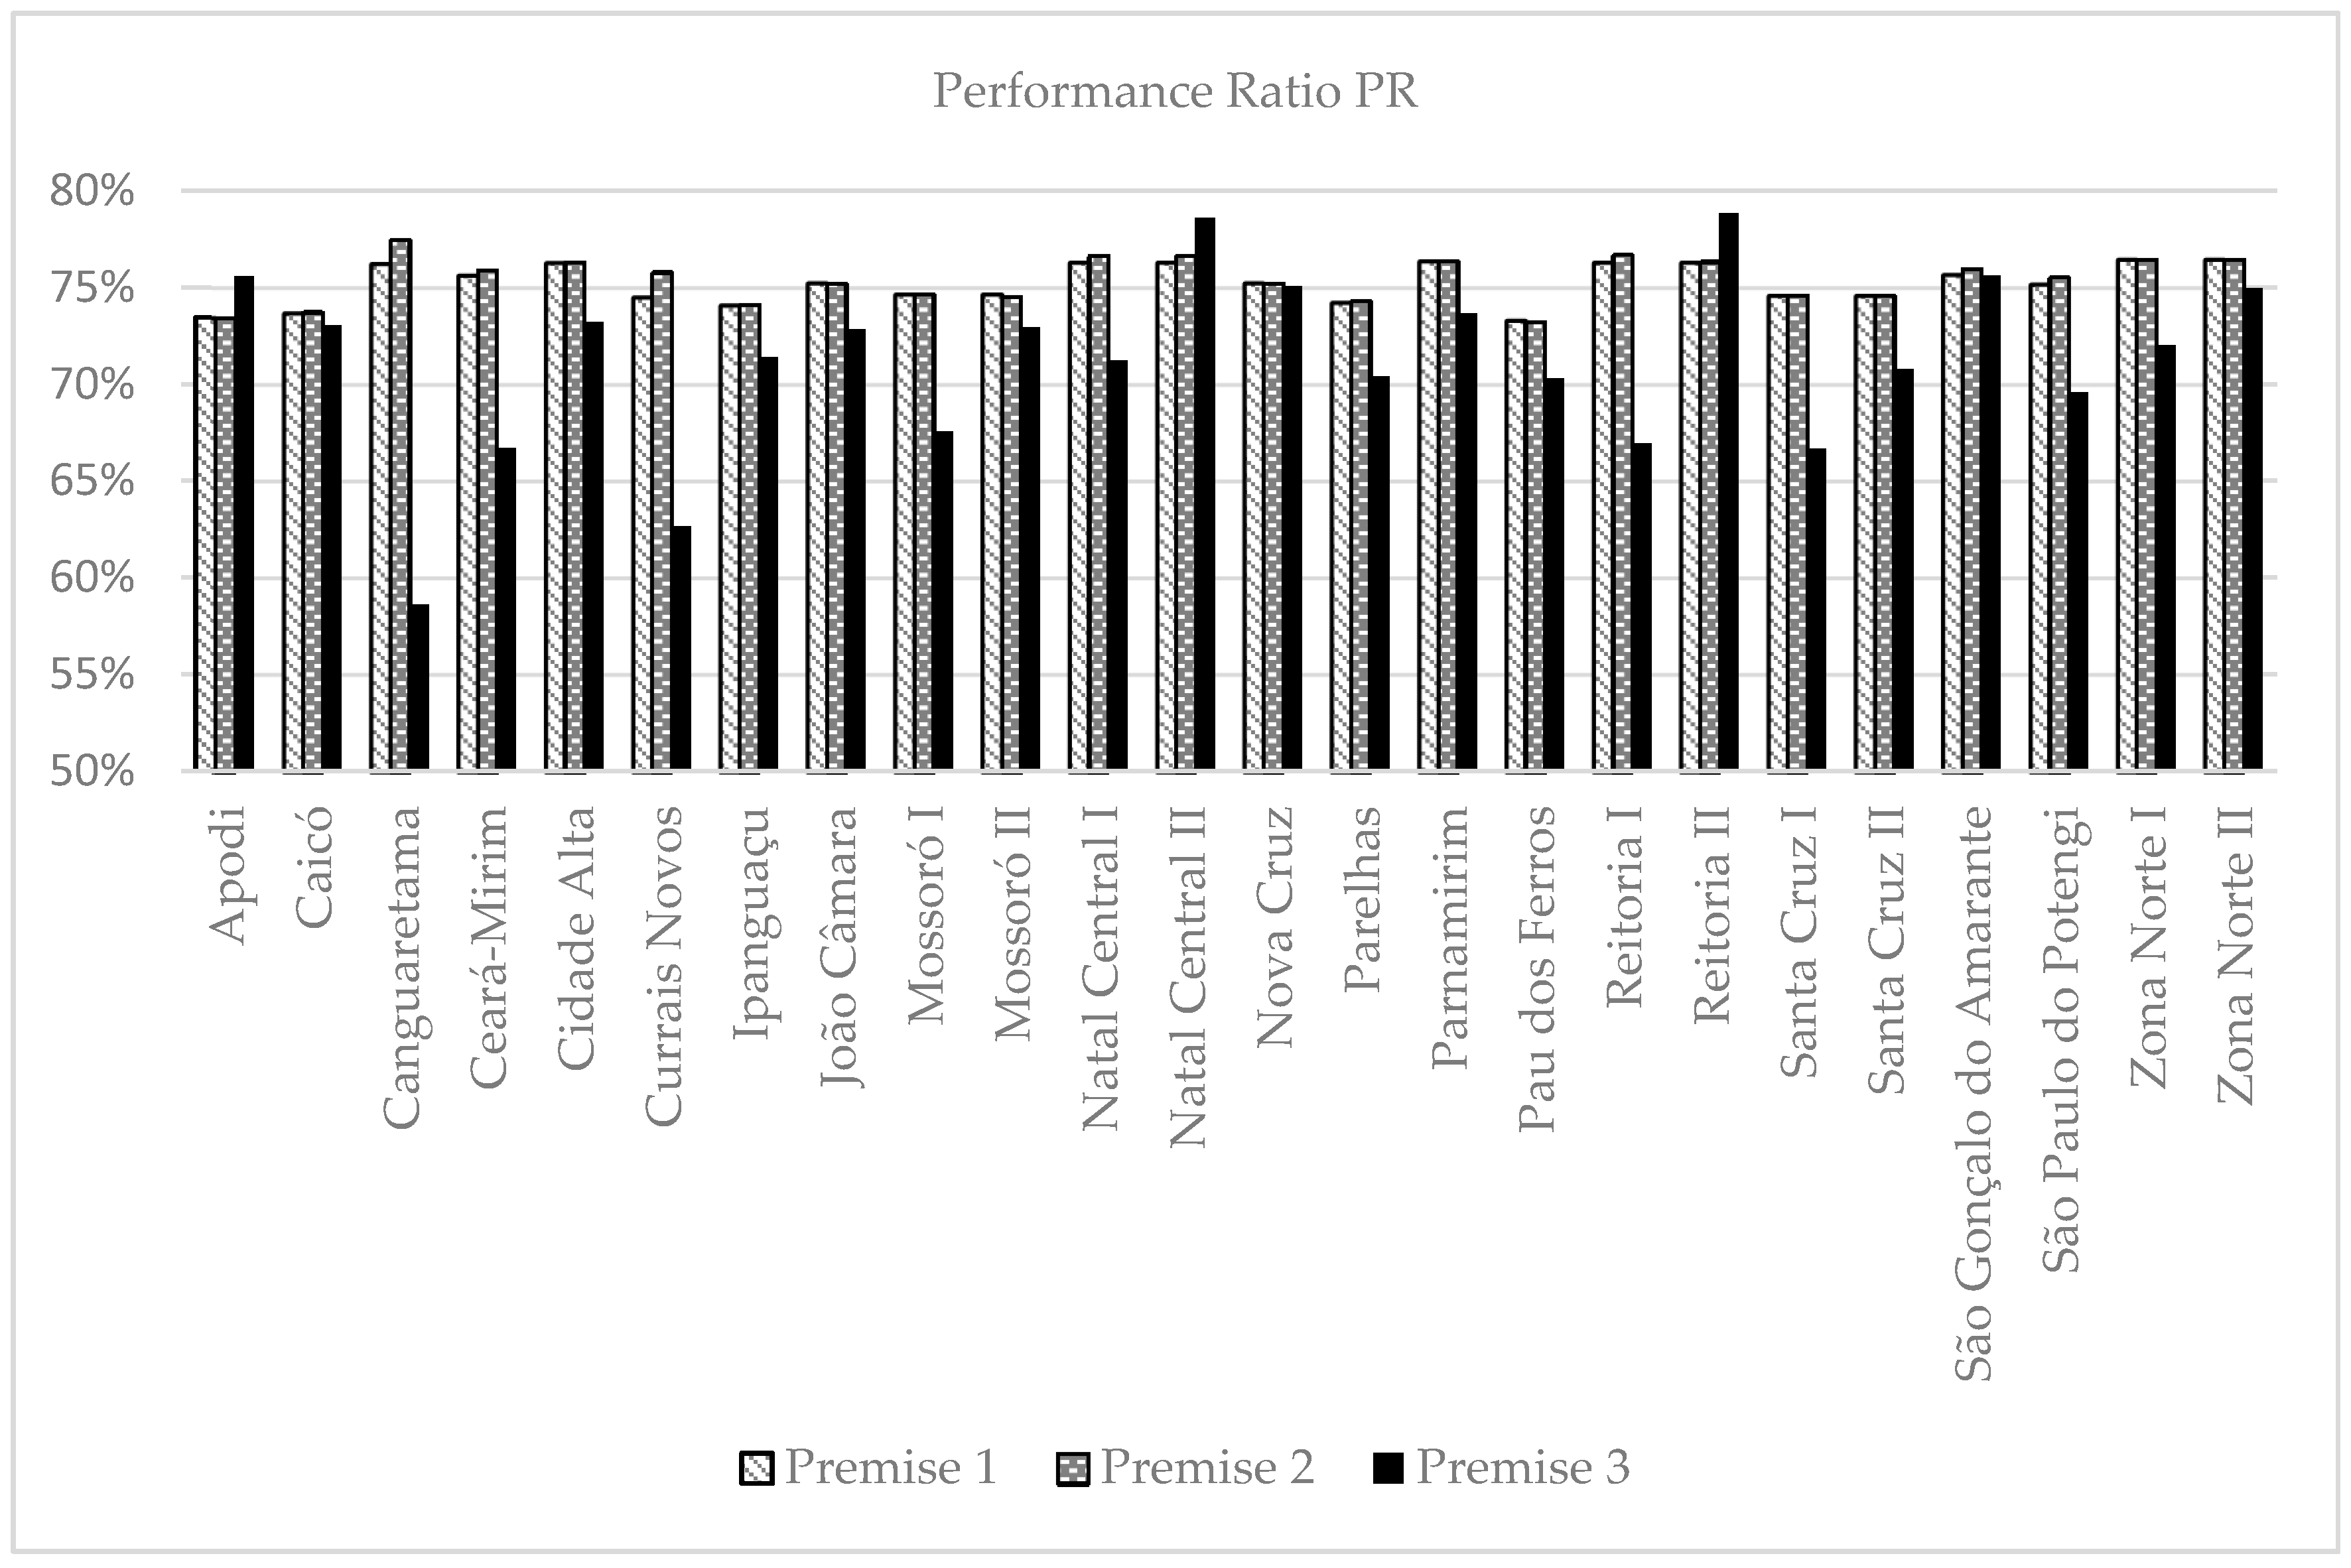
The Performance Ratio (
PR), another important parameter, represents how much
YCR can be materialized in
YF, i.e., it is capable of inferring global system productivity loss effects.
Figure 4 displays the
PR for the three premises, where, from a theoretical point of view, all IFRN headquarters presented considerably close values, averaging 75.2% and 75.4% for Premises 1 and 2, respectively. The headquarters at Cidade Alta, Natal Central, Rectory, and Zona Norte are among the best performers in this regard.
It is important to note that the
PR values obtained the Apodi, Caicó, and Pau dos Ferros headquarters are lower in terms of Premises 1 and 2. In this case, in order to understand the meaning of these values, Equation (4) and is parameters should be reassessed. This indicates that the
YF in these areas are among the highest, as well as their
YCR, albeit in greater totals, leading to the results displayed in
Figure 4. From a theoretical point of view, this means that global losses at these sites are a percentage higher, but they are still appropriate photovoltaic production sites, due to high energy generation. In these terms, this study indicates that such losses are not linked to module technologies, electrical losses or inverter efficiency, but to local climatic characteristics. Thus, although these sites present the greatest solar radiation potential, the combination of other local factors, such as temperature, pressure, humidity, altitude and wind speed, for example, result in a lower theoretical
PR. On the other hand, these same features lend these places greater attractiveness in terms of
YF.
With regard to Premise 3, differential PR values between headquarters are observed. Once again, Apodi, Natal Central II and Reitoria II are noteworthy, although Caicó, Cidade Alta, Parnamirim, São Gonçalo do Amarante, and Zona Norte II also present attractive values.
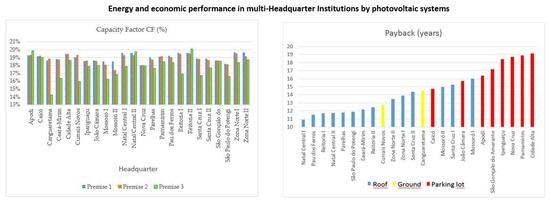
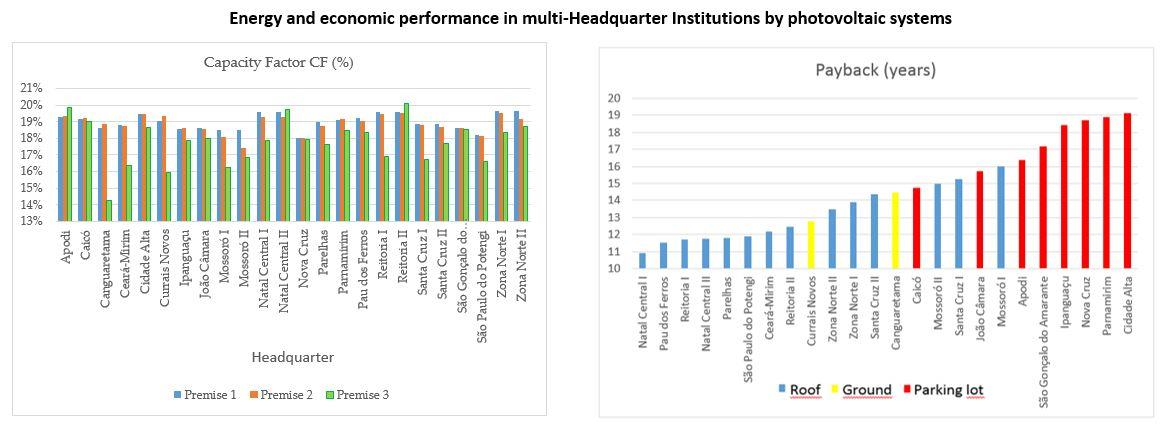
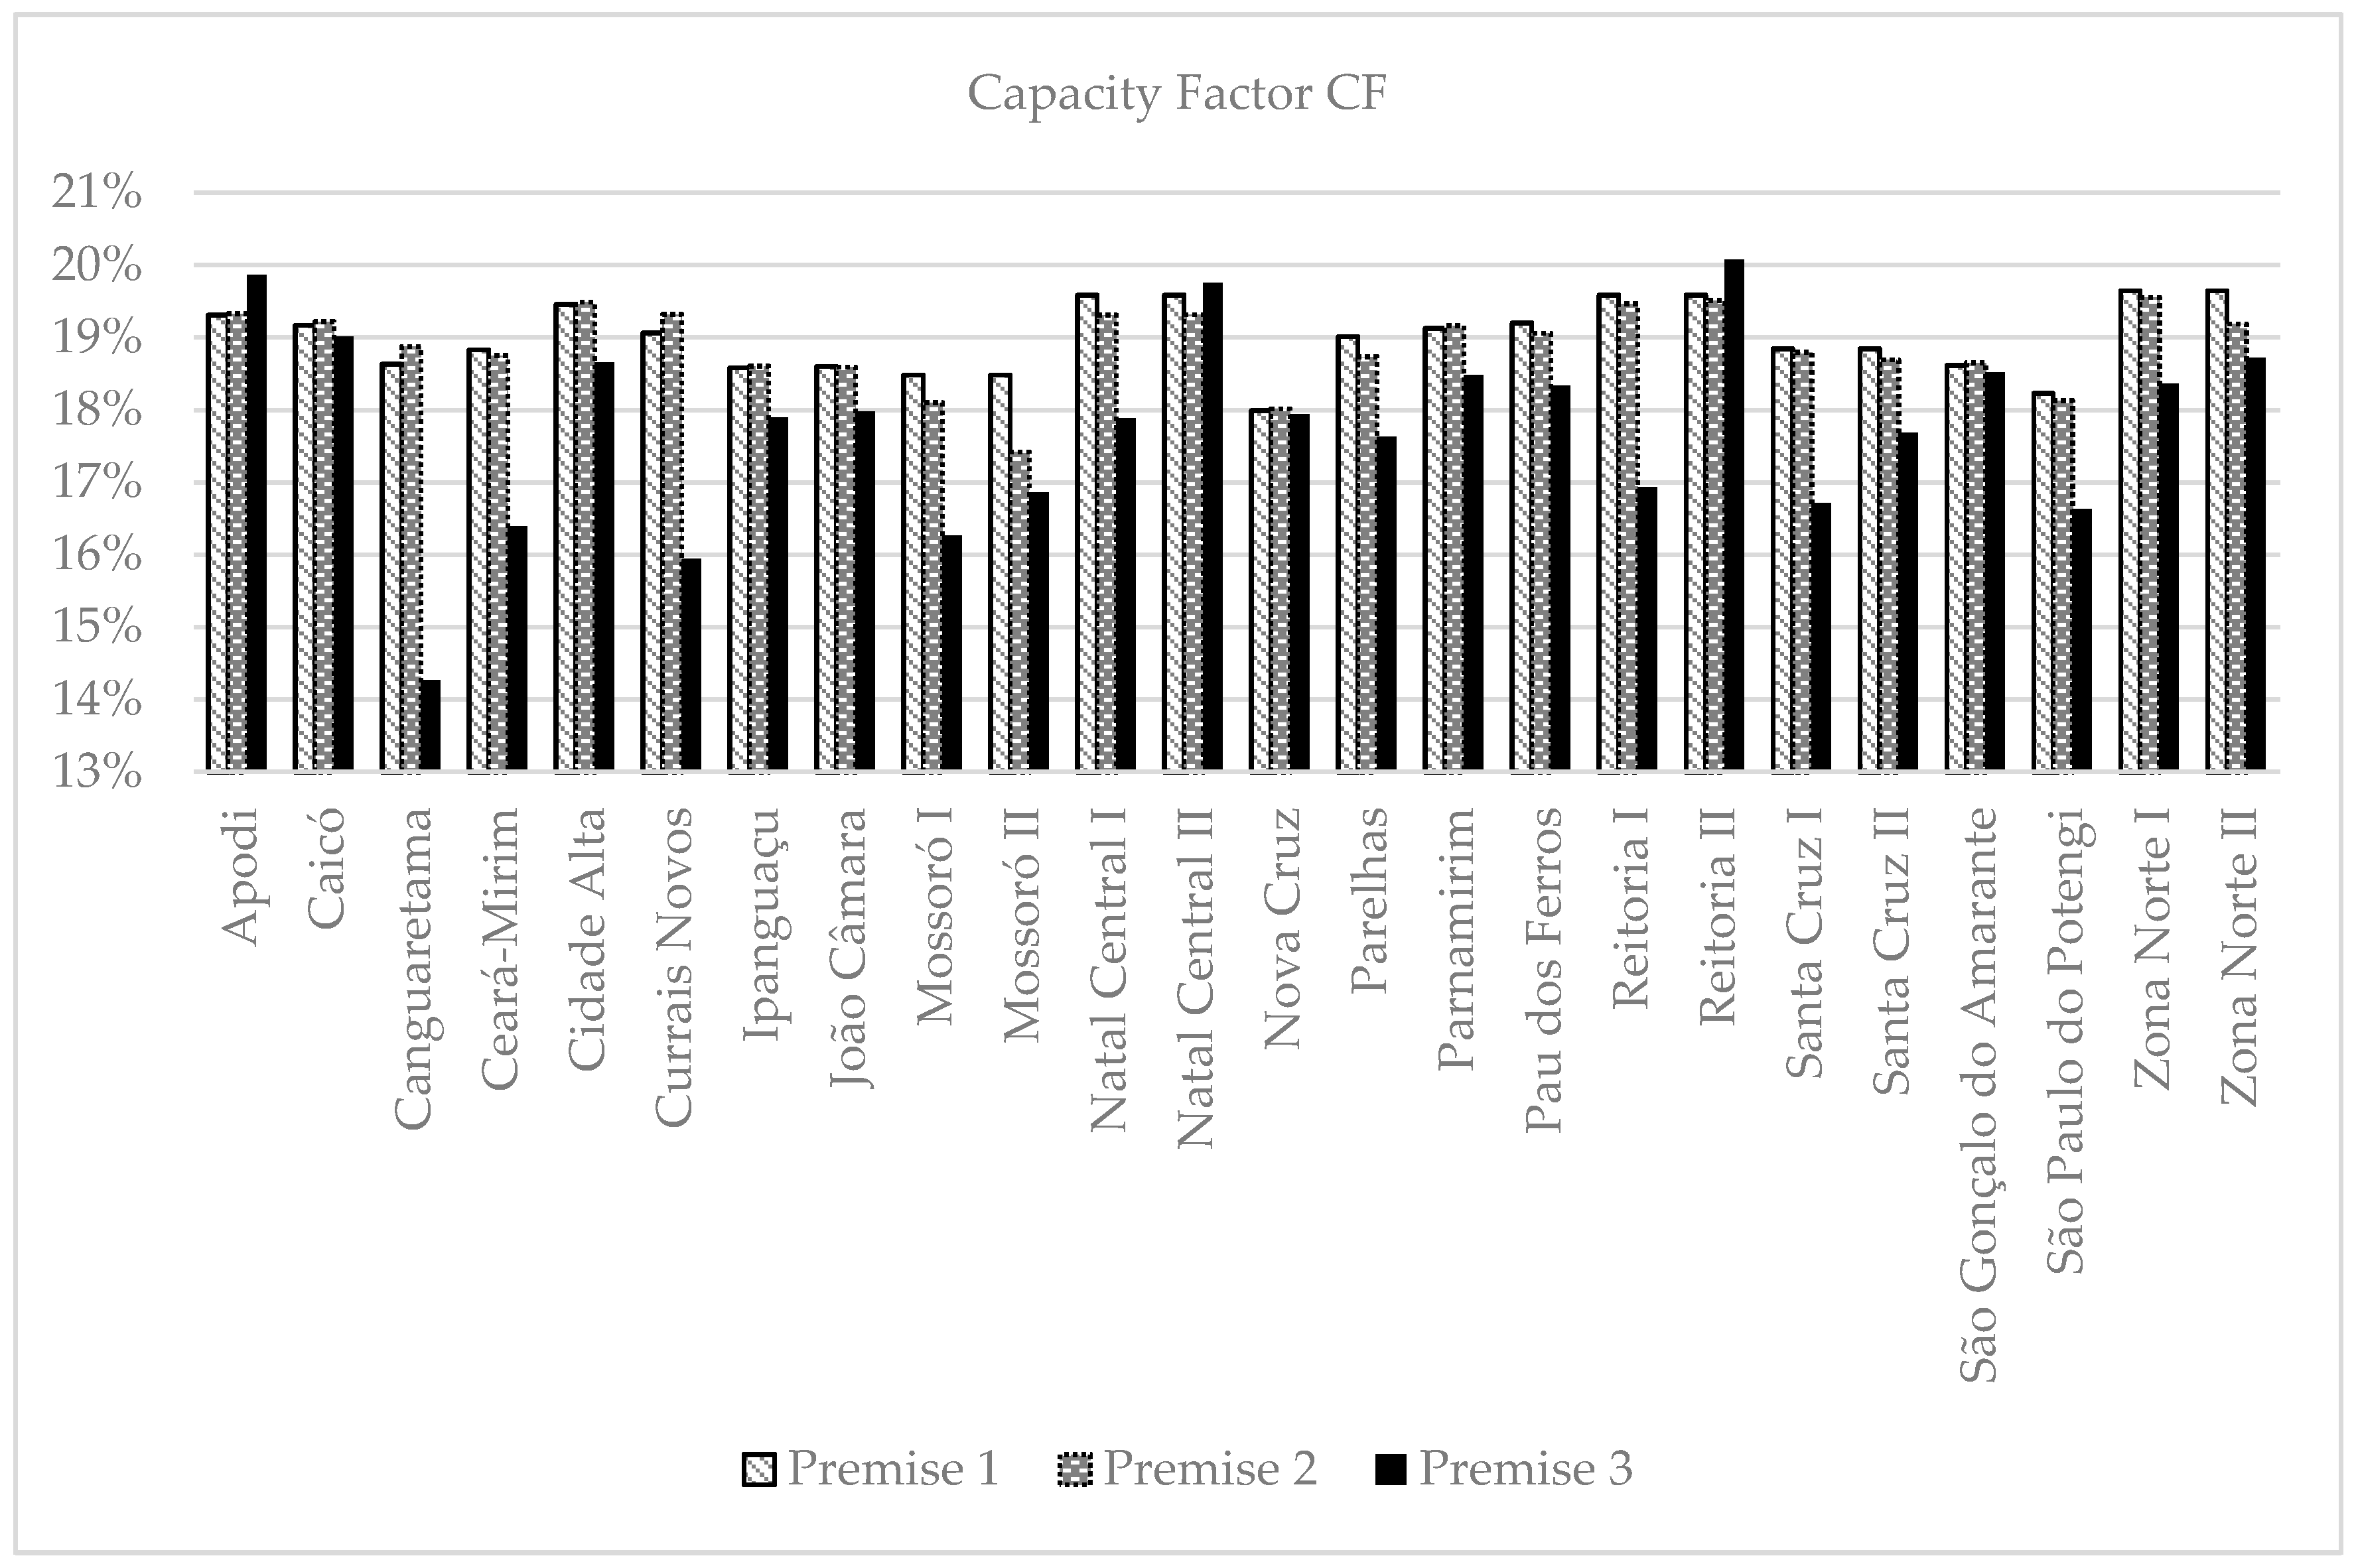
The Capacity Factor (
CF) should also be highlighted, as it represents the energy produced throughout the year if the system were to operate at full power for 24 h for the 365 days of the year. This is outlined in
Figure 5, where the
CF values in Premises 1 and 2 are practically identical for all headquarters, with the main differences observed for the Mossoró, plant II, and Zona Norte II campi. For Premise 1, the average capacity factor between plants is of 19%, and for Premise 2, 18.9%. From a theoretical point of view, the most attractive
CF are observed for the Apodi, Cidade Alta, Natal Central, Reitoria, and Zona Norte campi.
With regard to Premise 3, the CF in most plants is lower than the estimated theoretical value (Premise 2), averaging 16.4%, and the most discordant records are observed for the Canguaretama, Ceará-Mirim, Currais Novos, and Mossoró I headquarters. Further investigations are required at these locations, given the strong divergence between theoretical and measured values, in order to understand the variables and explanatory reasons for such discrepancies. On the other hand, the Apodi, Natal Central, plant II, and Reitoria II campi present higher CF, thus indicating more attractive photovoltaic system installation locations.
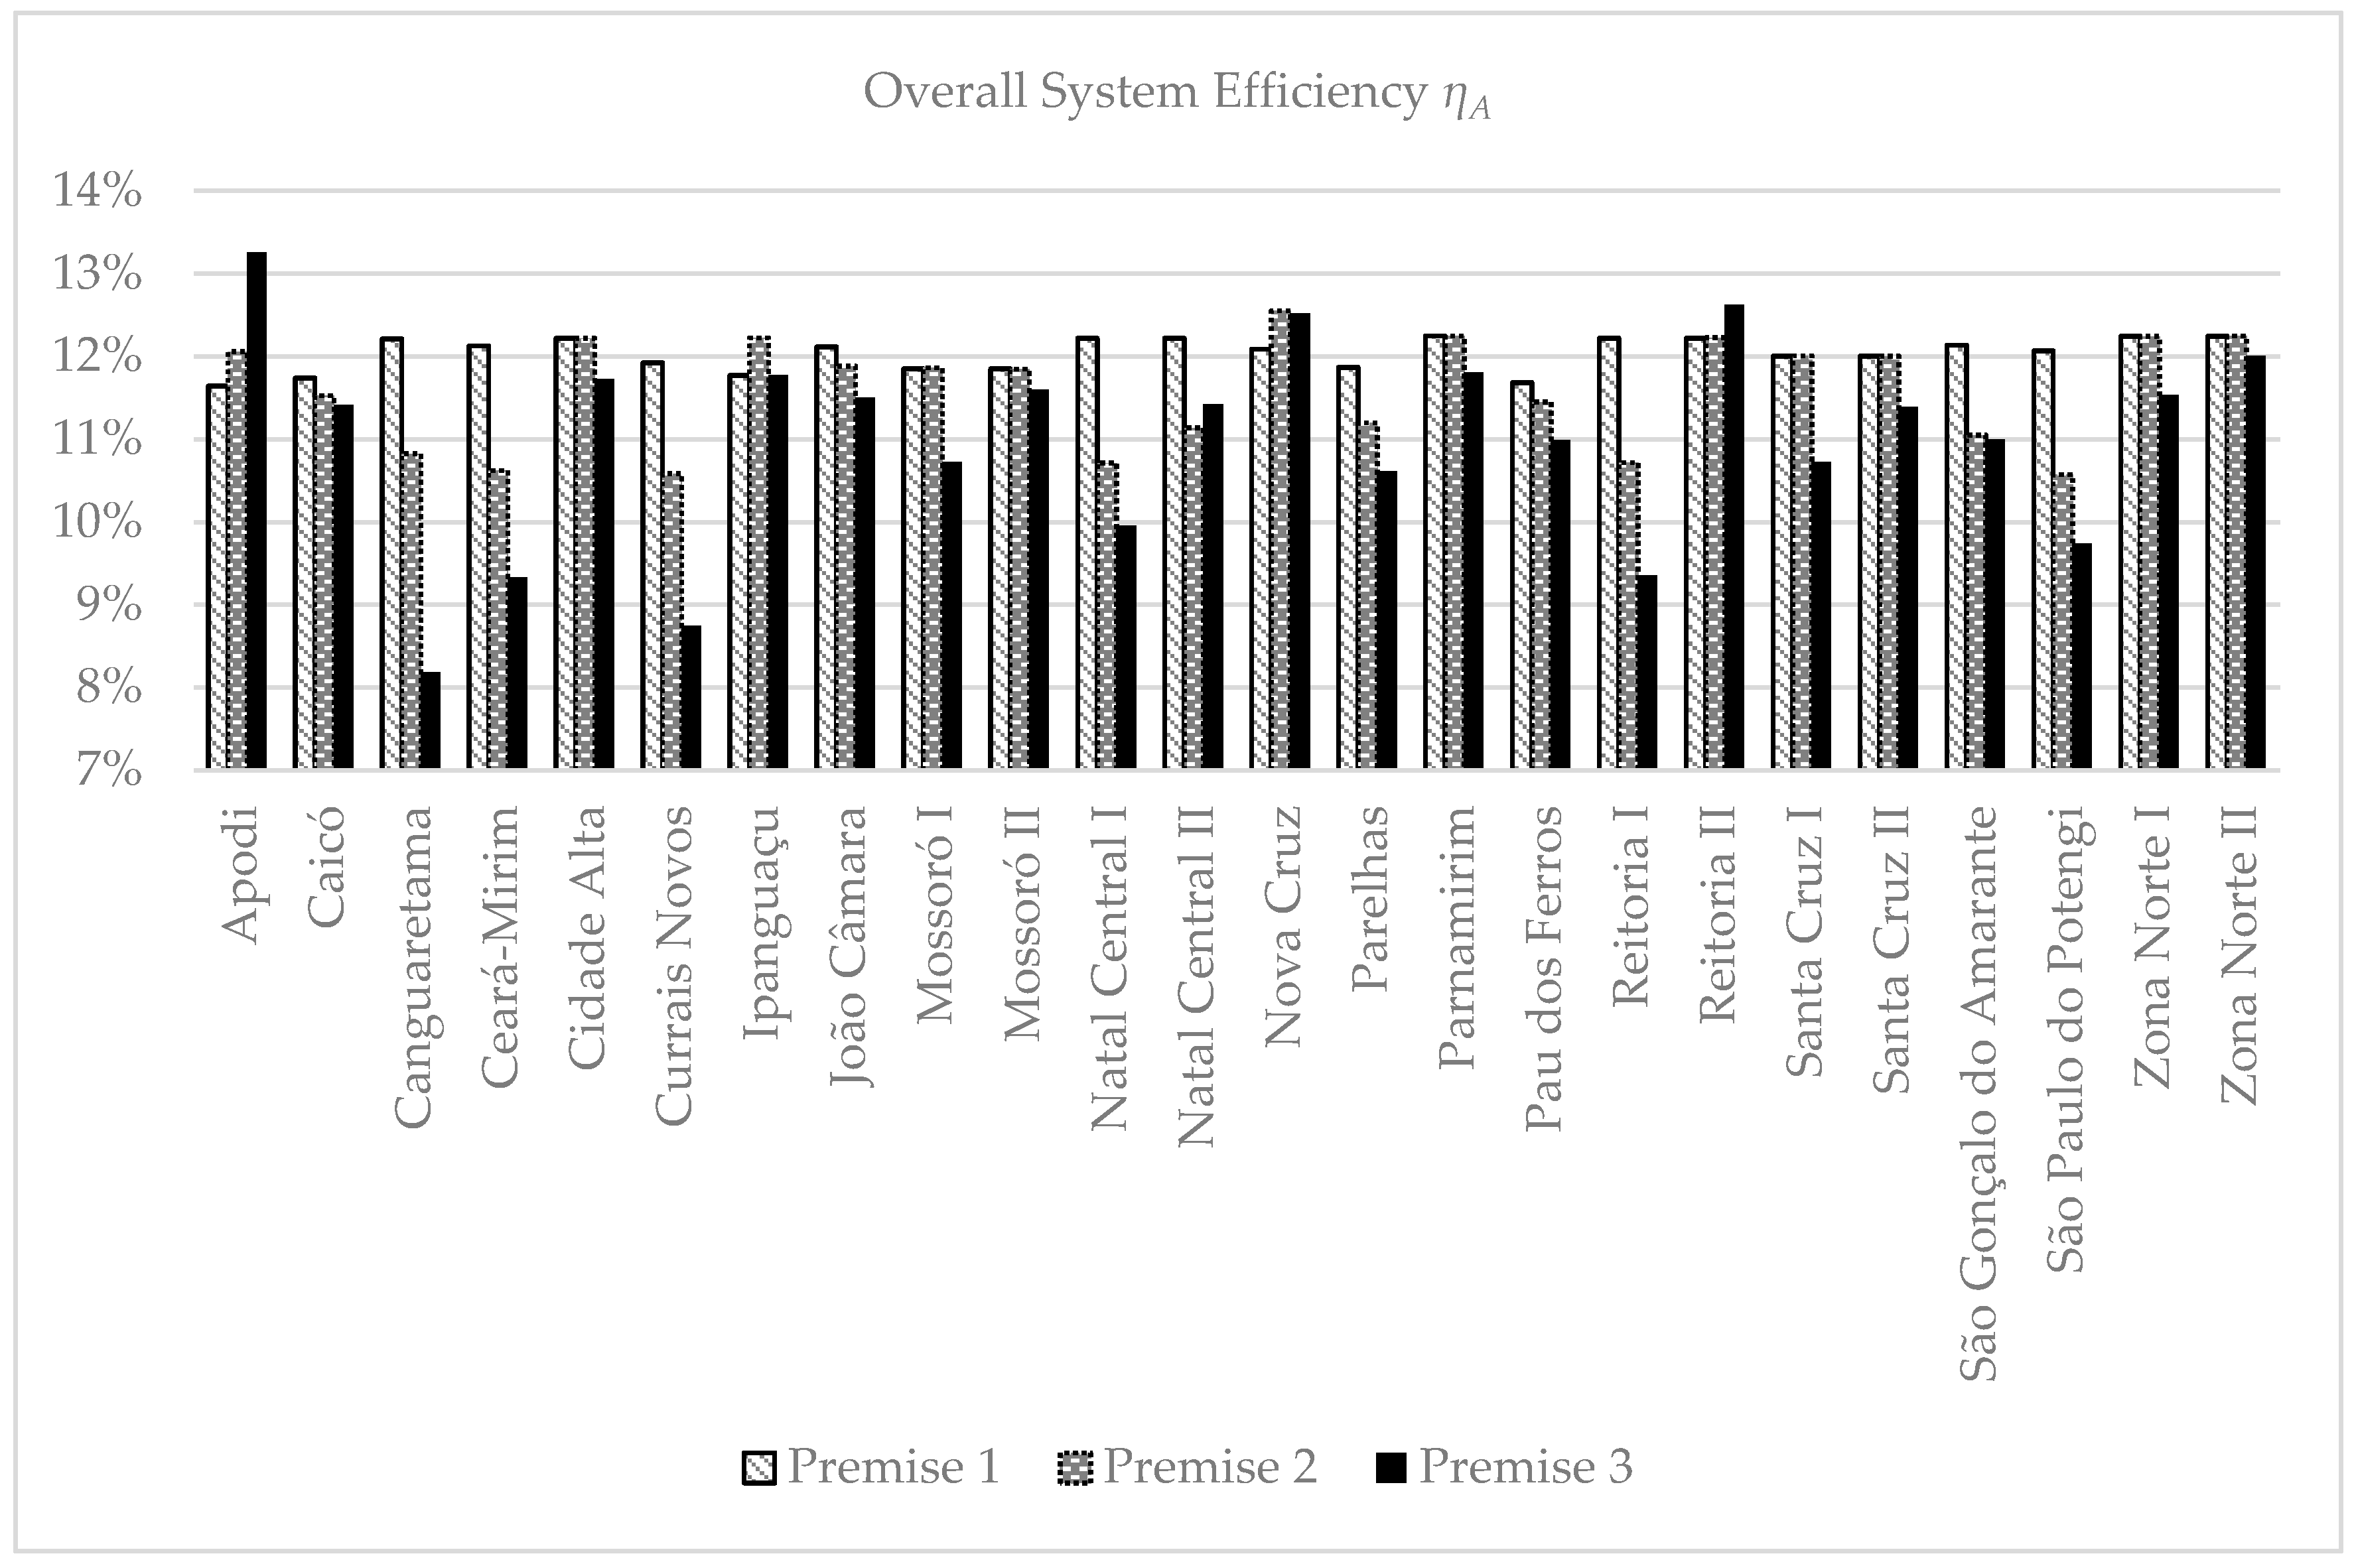
The Annual Global System Efficiency (
ηA) evaluates the incident solar radiation percentage on the photovoltaic arrangement that is converted into AC energy at the inverter output. It is defined as all the losses occurring during the process, from light capture to the AC energy offered at the inverter output, as well as module conversion efficiency.
Figure 6 presents the behavior of this parameter, based on a study carried out assessing the set of plants that make up the IFRN-Solar project.
Concerning Premise 1, very small differences were observed between the ηA values for the investigated plants, since, in this premise, the system is the same for all plants, including the area of each arrangement. Differences were noted concerning generated energy and module radiation. Sites receiving higher radiation display the potential to generate higher amounts of energy at lower rates than sites receiving less radiation when using theoretical radiation as a reference. This explains why Apodi presents lower ηA than São Paulo do Potengi, even generating more energy.
Concerning Premise 2, one set of plants presented ηA values above those of Premise 1, while a second set presented values below, using the same comparisons. In this regard, it appears that the plants comprising the first group display Module Efficiency of over 16%, while those in the second group present a Module Efficiency of less than 16%. Therefore, it seems that panel Module Efficiency considerably influences the Global System Efficiency (ηA).
Regarding Premise 3, the Canguaretama, Ceará-Mirim, Currais Novos, Natal Central I, Reitoria I, and São Paulo do Potengi plants presented the lowest ηA. As in the analysis carried out for Premise 2, this performance may be justified by the fact that these plants employ modules which display the lowest Maximum Efficiencies declared by the manufacturer (14.43%) among all IFRN-Solar project plants. In contrast, the Apodi, Nova Cruz, and Reitoria II campi presented the highest ηA values, employing photovoltaic panels with the highest Module Efficiency among all investigated plants, reaching 17.11%.
4.2. Investment Return Time
Assessments concerning investment return time of the IFRN-Solar project applied the Discounted Payback Method (DPB) in which the final value depends on different variables, such as the annual module degradation rate, the energy generated by the system throughout its useful life, energy prices in the same period, inflationary indices, discount rates, operating and maintenance costs, and the initial investment.
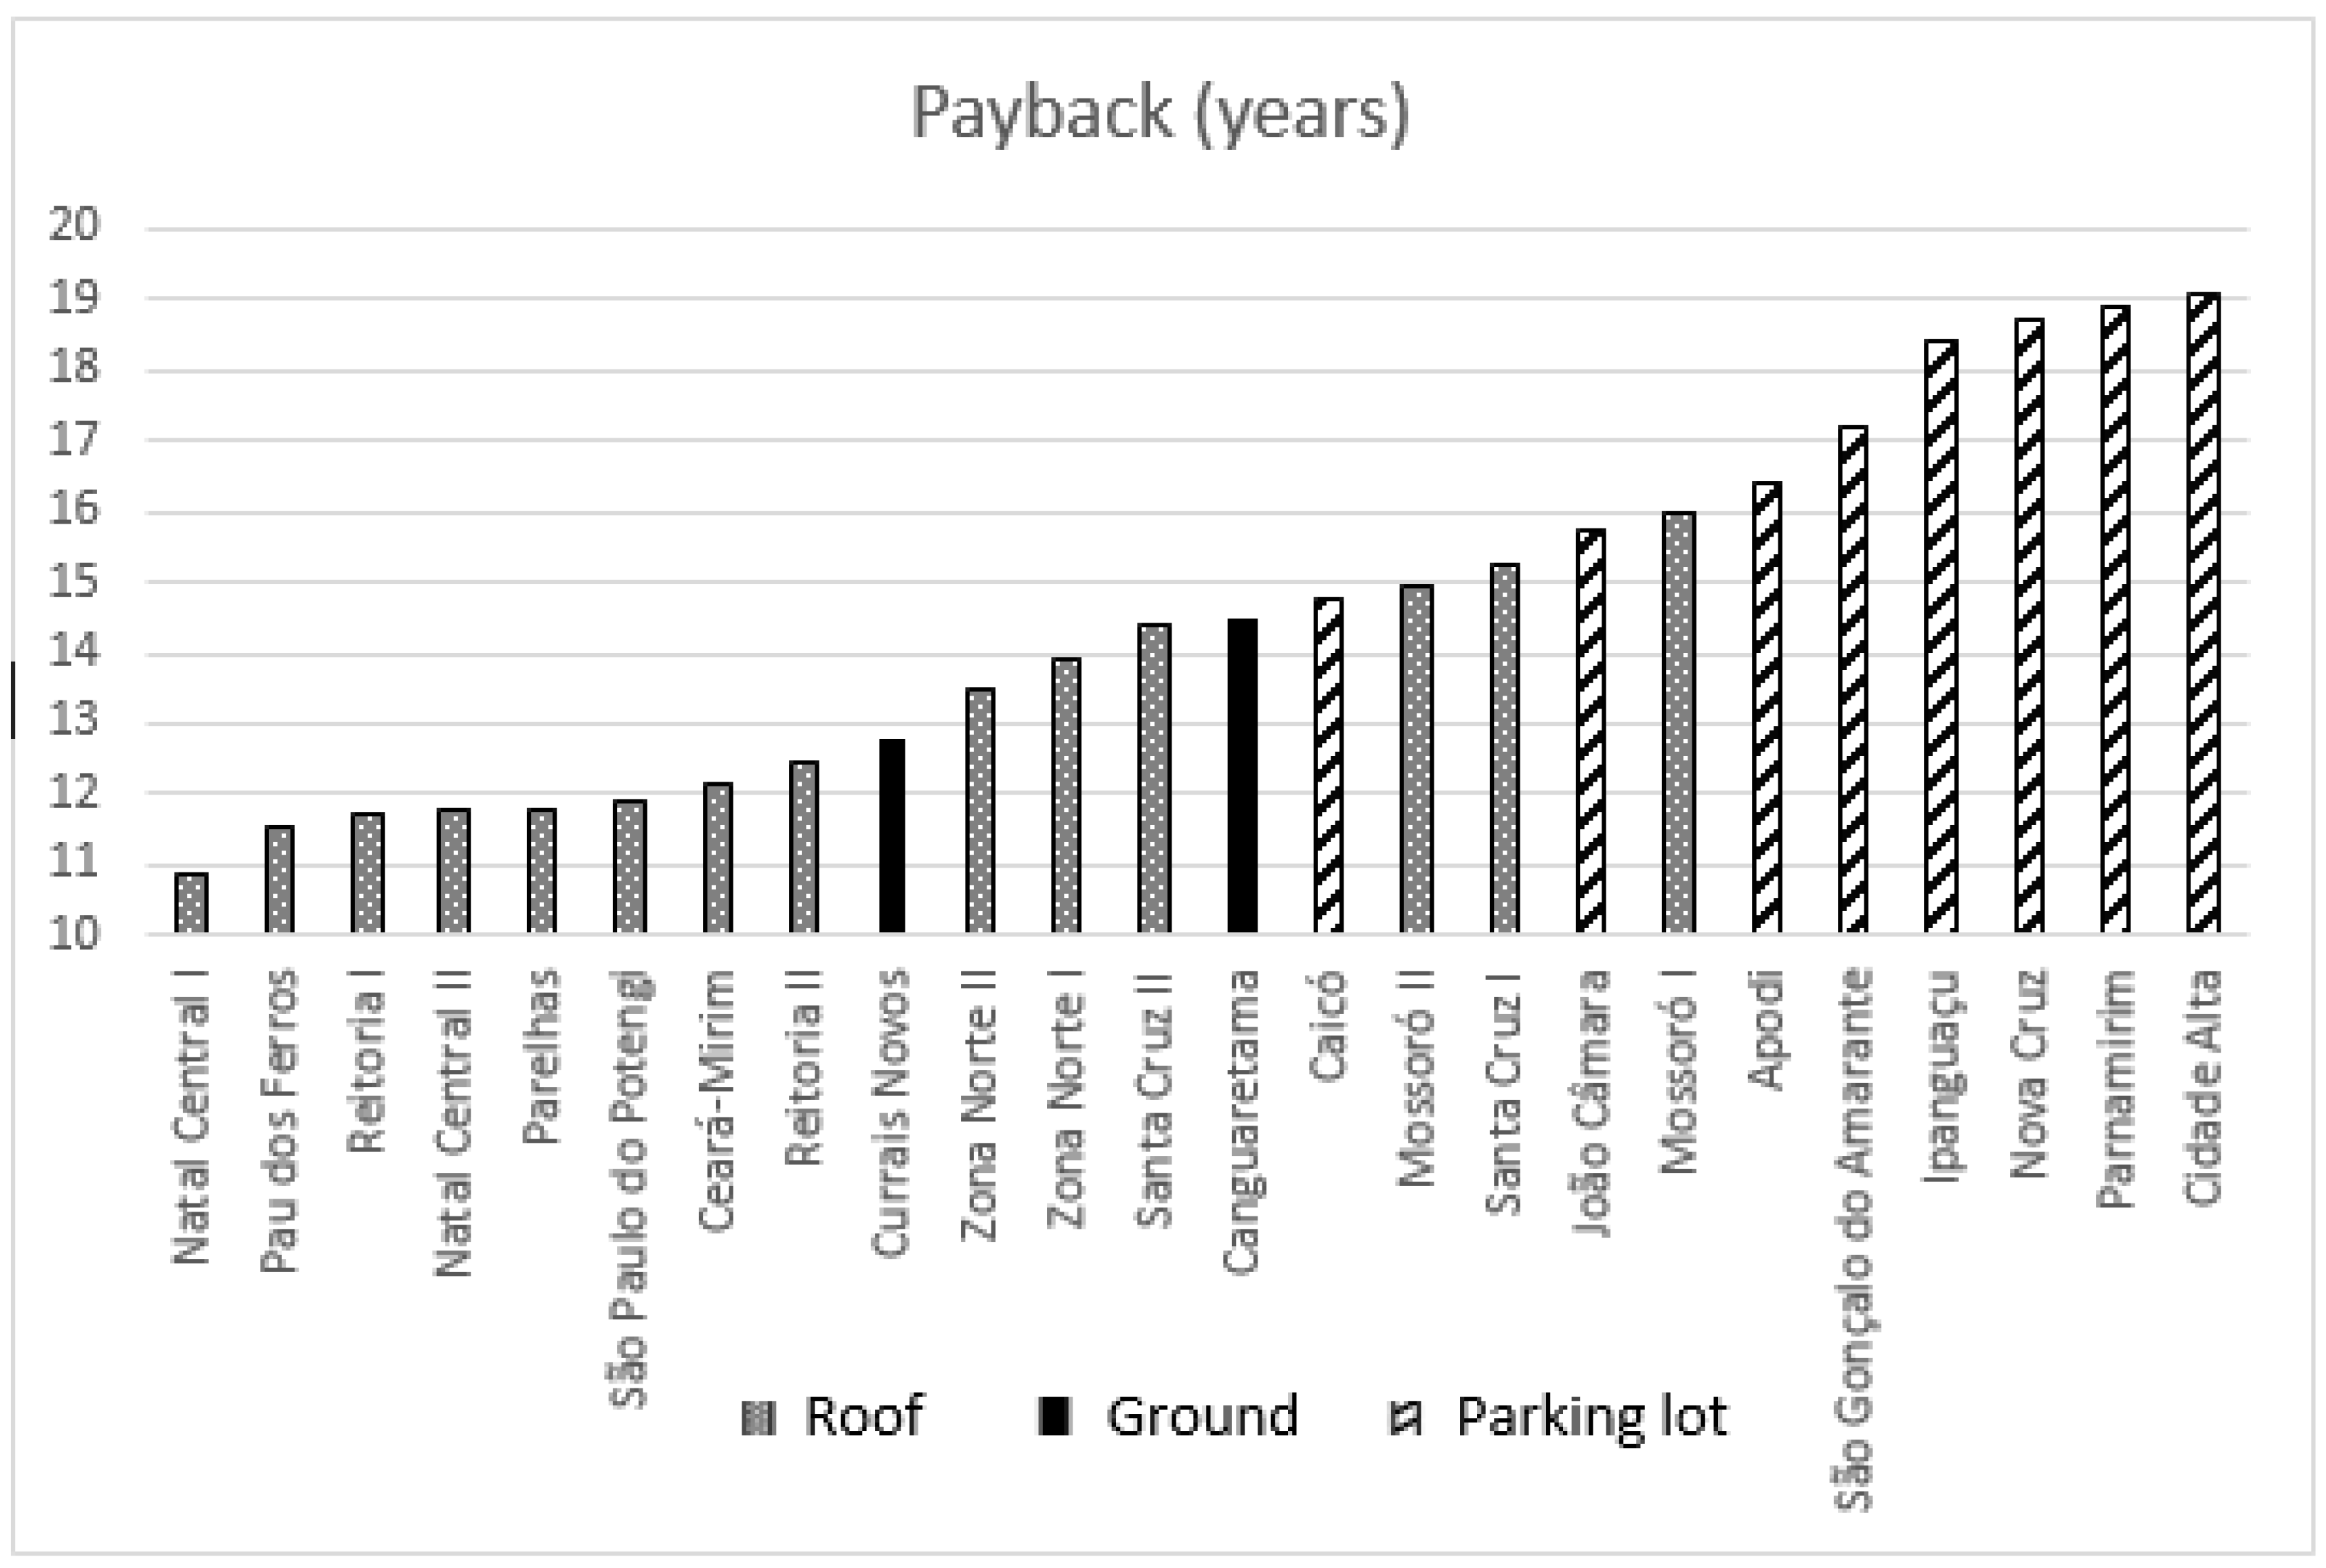
Figure 7 presents the DPB values for the plants that make up the IFRN-Solar project, where the plant dispersal strategy throughout different campi, without taking advantage of the different locality attractions, results in DPB values above those disseminated by brokers, between 5 and 8 years [
46]. Plant I on the Natal Central campus has the shortest turnaround time, estimated at around 11 years. Conversely, the Cidade Alta campus plant has the highest DPB, of 19 years. These differences are mainly due to the price of the initial investment in kWp, in addition to operation and maintenance costs and the Final Yield
YF of each plant, since the other variables that make up the DPB are common to all plants. The magnitude of the initial investment is the most relevant factor. The six highest payback plants have a kWp investment ranging from US
$ 2577.93 to US
$ 2723.86. The six plants with the lowest payback have a lower investment cost per kWp, ranging from US
$1434.18 to US
$ 1700.05.
Among the plants presenting the same investment, some O&M costs exceeded the gains earned by their Final Yields YF, i.e., those with higher O&M costs have higher paybacks. This is the case of the Nova Cruz campus, whose payback exceeds that of the Ipanguaçu campus, even though its YF is higher. The same was noted for Cidade Alta campus compared to the Parnamirim campus. On the other hand, in some cases, for the same initial investment, the Final Yield YF was more relevant to payback than O&M costs, such as for Reitoria I compared to the São Paulo do Potengi, Ceará-Mirim, and Canguaretama campi, and for Reitoria II in relation to Mossoró II.
The Final Yield
YF was also relevant, in cases in which two or more plants had the same initial investment and the same O&M cost, with the lowest payback noted for the plant with the highest
YF. This was observed for the Caicó campus in comparison to João Câmara, and for the São Paulo do Potengi campus in relation to Ceará-Mirim. Concerning the investment return analysis, the photovoltaic arrangement installation method was also proven decisive concerning payback influence. In parking lot-installed photovoltaic system units, the initial investment ranged from US
$ 2236.45 to US
$2723.86 per installed kWp, whereas roof or ground installations resulted in values of less than US
$ 2000.00 per installed kWp. As a result, the six lowest payback plants were installed on the roof, while the six highest payback plants were installed in parking lots. This analysis can be better visualized in
Figure 7.
The Scenarios proposed in
Section 3.3 aim at reallocating certain plants to headquarters with better Final Yields
YF, as in Scenarios 1 and 3. This exercise is relevant concerning investment time return analysis, as this allows for quantification of the advantages that emerge from these scenarios.
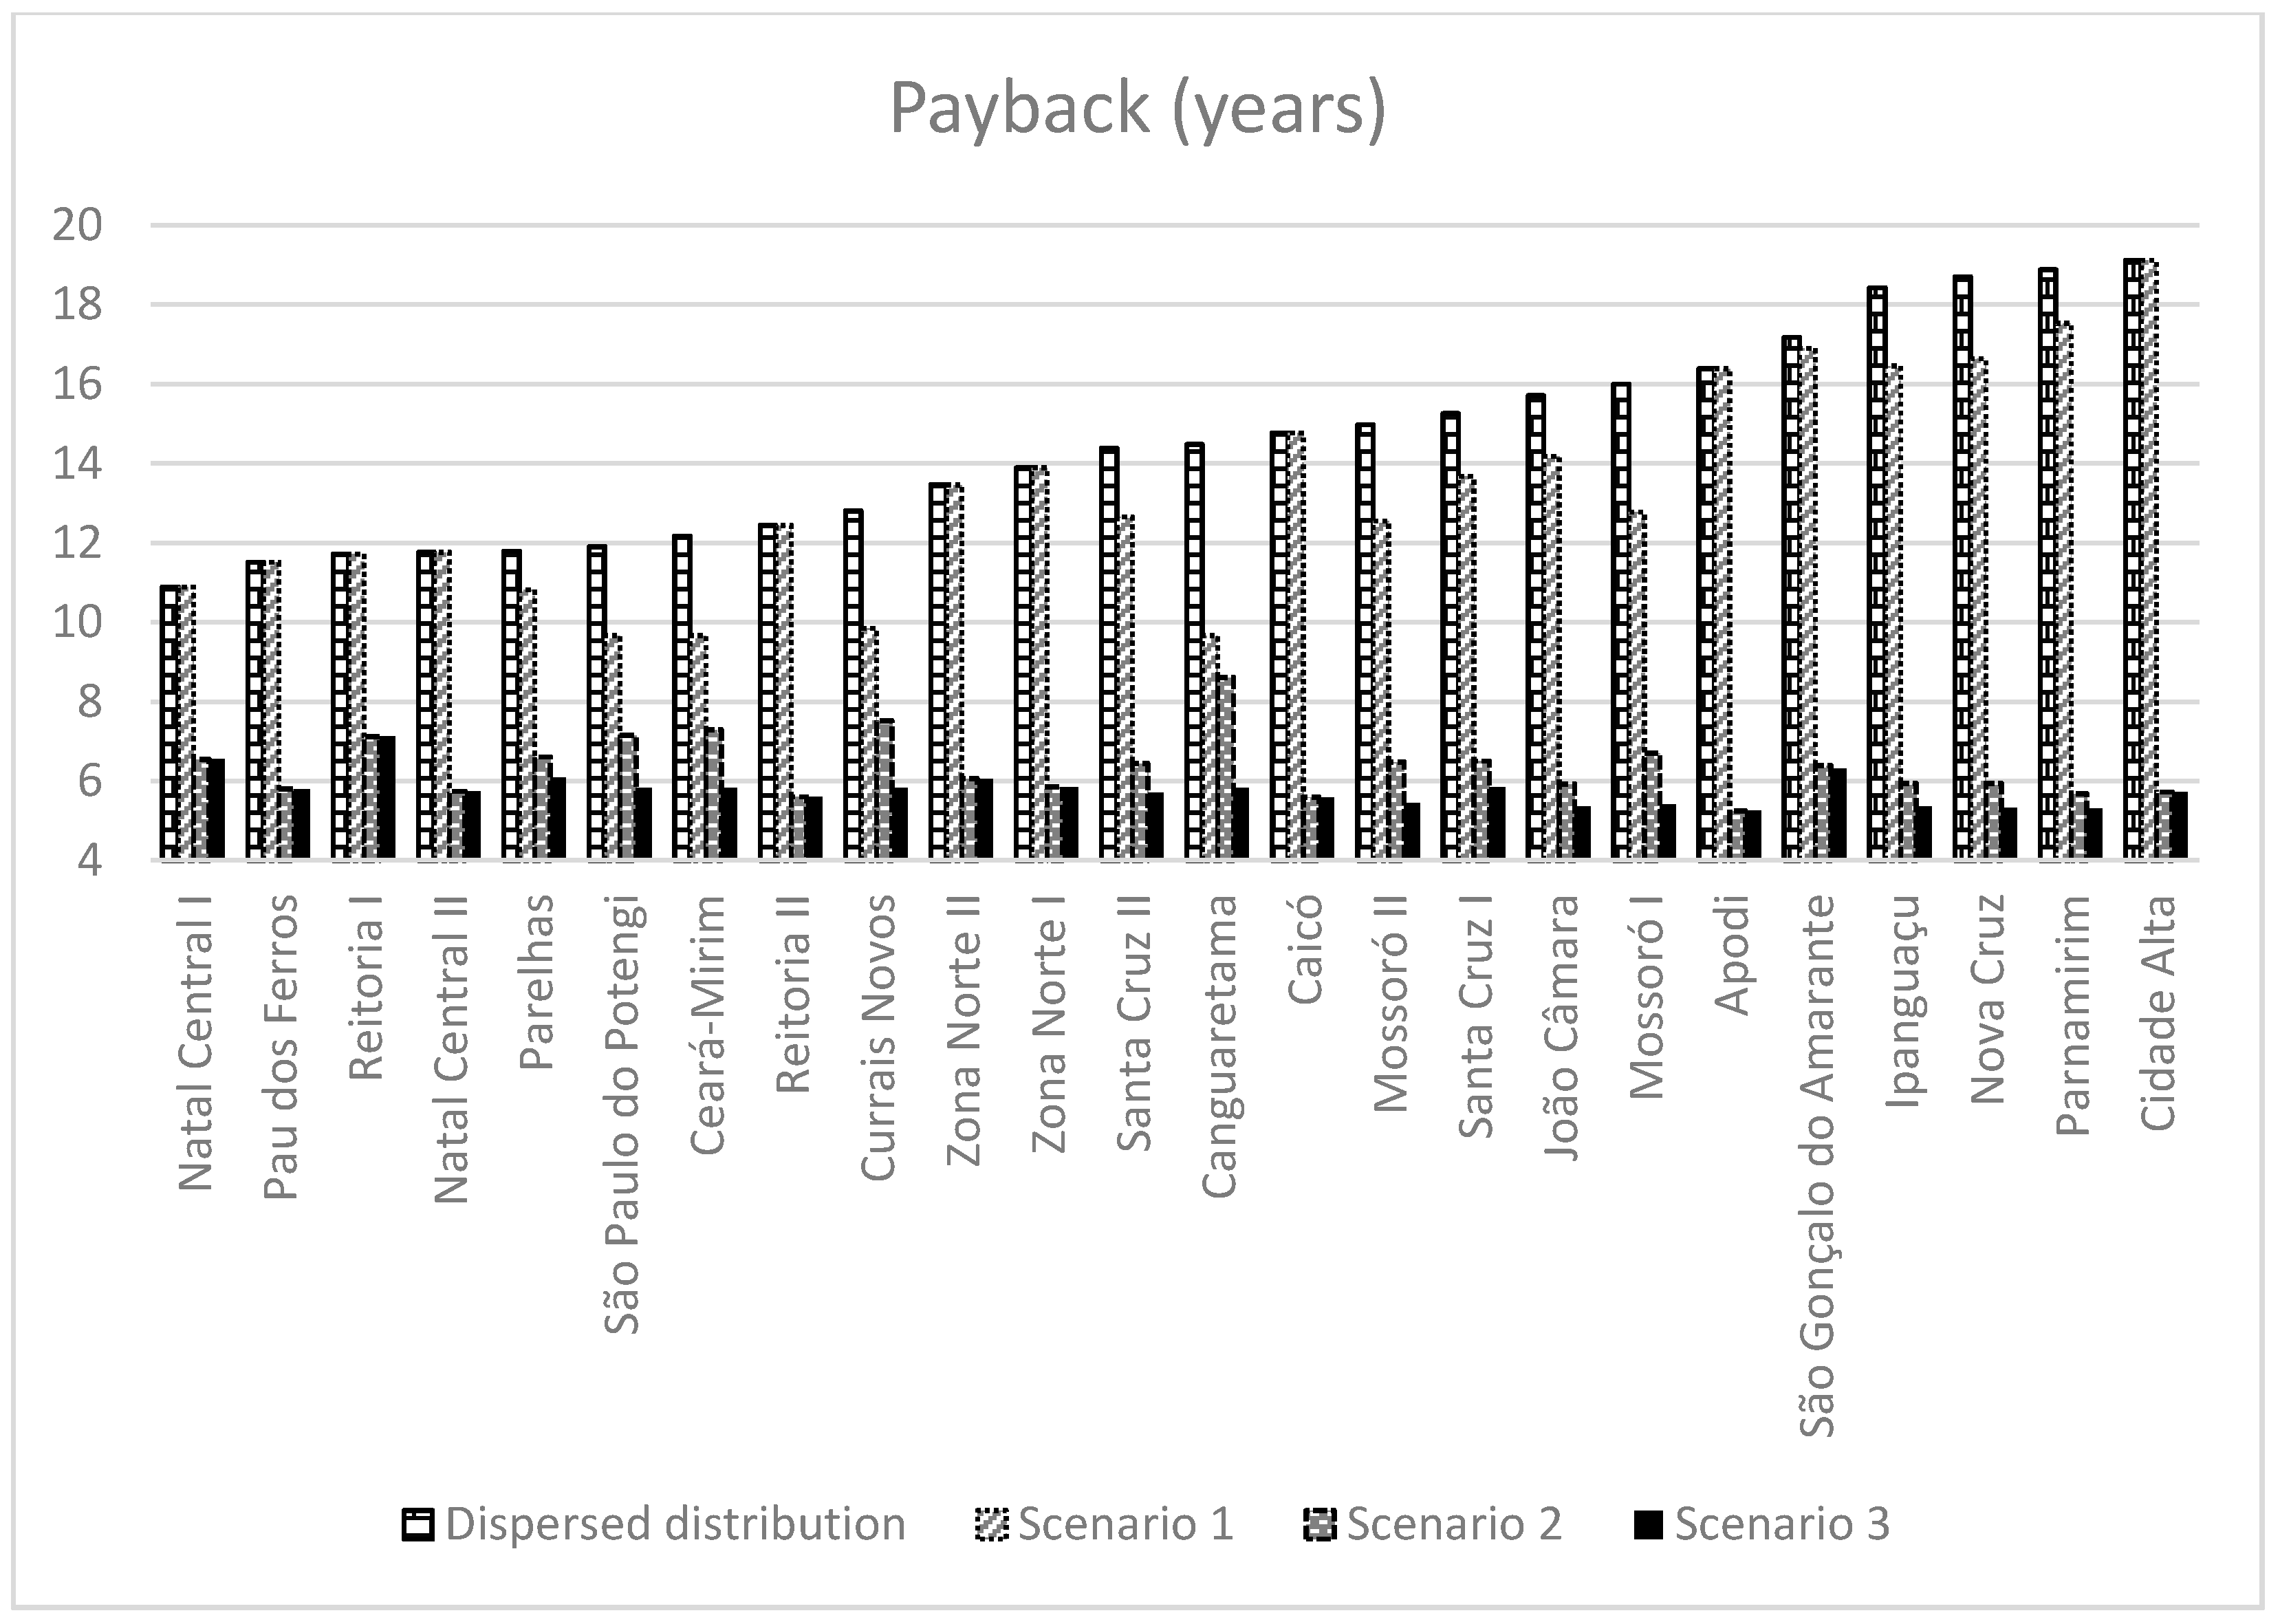
Figure 8 presents the paybacks obtained for the current IFRN-Solar project photovoltaic system configurations (dispersed plant distribution and actual initial investment), as well as Scenario 1 values (distribution concentrated in the best sites and actual initial investment), Scenario 2 values (dispersed plants distribution and initial investment with updated values), and Scenario 3 (distribution concentrated in the best sites and updated initial investments). Considering Scenario 1 conditions, all plants had their installed capacities redistributed at the Apodi, Caicó, Cidade Alta, Natal Central, Pau dos Ferros, Reitoria, and Zona Norte headquarters, as displayed in
Table 5. As a result, these relocated plants display decreased paybacks, on average of two years, mainly motivated by increased
YF. In this arrangement, the Canguaretama, Mossoró I and Currais Novos plant paybacks were reduced by 4.8, 3.2, and 3 years, respectively.
With regard to Scenario 2, plant distribution is dispersed, as in the case of the IFRN-Solar Project, with the difference that initial investment values are consistent with those practiced in the current Brazilian reality. As a result, average plant payback is in the range of 6.4 years, i.e., reduced by over 8 years when compared to the current original situation. This is the result of a significant drop in the initial investment value per plant, which, on average, was reduced to less than half of the original value. The Canguaretama, Currais Novos, Ceará-Mirim, and São Paulo do Potengi plants presented higher paybacks than the others, influenced by low YF.
For Scenario 3, the reallocations in force in Scenario 1 are maintained and the initial investment for each plant is replicated, as established in Scenario 2, so paybacks in this scenario are the result of combining photovoltaic system installation in the best energy efficiency locations with the lowest initial costs for each plant. As a result, average plant payback is of 5.8 years, representing an 8.7-year decrease compared to the original dispersion proposal. The most noteworthy are the Parnamirim, Nova Cruz and Apodi plants, with 13.6-, 13.4-, and 11.1-year reductions, respectively, when compared to their current original paybacks.
Figure 8 indicates that some plants (Apodi, Caicó, Cidade Alta, Natal Central, Pau dos Ferros, Reitoria, and Zona Norte) presented a payback equal to that of Scenario 2, precisely because they are located in the best energy performance areas. On the other hand, plants reallocated to these locations presented decreased paybacks of, on average, around 7 months, when compared to Scenario 2, essentially due to the capacity of these locations to generate more electricity.
Figure 7 and
Figure 8 display the paybacks for each plant, considering the IFRN Solar project structure and those calculated in Scenarios 1, 2, and 3. It is important to highlight that a performance overview of the entire set of plants that make up the IFRN-Solar project is required, from both an energy and economic-financial parameters perspective.
Table 7 summarizes this analysis, indicating that the entire system payback in the current configuration, as described previously for each plant, is above attractive market values, since financial returns will only begin after more than 58% of their useful lives.
By relocating the photovoltaic systems to the most attractive headquarters from an energy point of view, according to Scenario 1, the system payback as a whole decreased to 13.2 years, although still above market expectations. However, in this scenario, gains in the increase of generated energy in the order of 9% were observed, as well as an increased financial return by almost 26%, in 25 years when compared to the current configuration. These benefits are achieved by relocating photovoltaic systems to the best energy efficiency locations. However, under the economic aegis, this change is insufficient to achieve more expressive results. To this end, it is necessary to consider the decreasing kWp investment prices proposed for Scenarios 2 and 3. For Scenario 2, a 6.3-year payback for the entire system and a financial gain of over 87% were observed in relation to the current configuration estimated for 25 years. Scenario 3 presents even greater economic and financial gains, with payback reaching 5.7 years and financial return reaching about 113% over 25 years compared to the current arrangement. Scenario 3 also displays another advantage in relation to Scenario 2, of a gain of over 9% in energy production in relation to the current situation, within 25 years, as noted for Scenario 1. This result is associated to plant relocation to the best energy performance locations. Therefore, the analysis indicates that, for multi-headquarter institutions willing to invest in solar photovoltaic systems, the option of distributing these systems throughout headquarters that present better energy yield location conditions is more attractive, both technically and economically, when compared to the option of installing plants indiscriminately in a dispersed form throughout their headquarters without carrying out a technical-economic study as was performed in this assessment.
5. Conclusions
This study used the IFRN-Solar Project to evaluate the advantages of adopting a dispersed photovoltaic system distribution in multi-headquarters institutions, reallocating the generation units to the highest number of headquarters that make up the institution/company or promote a centralized headquarter distribution presenting better technical and economic indicators, in terms of electricity supply, investments, and costs.
With regard to energy performance, three propositions were evaluated in order to assess locality performance considering real situations, theoretical assumptions or both. Three plant arrangements were also evaluated, allowing for different distribution combinations, termed Scenario 1, Scenario 2, and Scenario 3. The results of these scenarios were then compared with the indicators obtained from values measured at the implemented plants within the scope of the IFRN-Solar Project, allowing for energy and economic-financial gains assessments.
The performance evaluations of the studied systems indicate that the locations exhibiting the highest Reference Yield registered better energy yields, even in higher temperature areas. This demonstrates that the losses resulting from higher temperature at the systems installation site can be compensated and surpassed by the gains plus greater solar incidence and local exposure time.
Concerning different systems, when exposed to the same climatic conditions, i.e., analyzed from their use in a single headquarters (location), the systems comprising panels with the highest Module Efficiency and/or the lowest number of inverters present greater energy generation per installed kWp that guarantee better performance. The irradiation conditions in the study region demonstrate reduced influence of installation type-fixed on the ground, in parking lots or in building roofs-module inclination and orientation on the results. However, this factor must be considered when other studies are carried out in different regions, considering solar incidence influence, geographical conditions, relief, landscape, and the built environment. The study also demonstrates that the Annual Global System Efficiency is strongly influenced by the Module Efficiency indicated in the panel manufacturer datasheets.
Regarding the economic analysis, it is concluded that the reallocation of the assessed systems to the best performing headquarters, result in energy gains −9.07% in Scenario 1 of the study, and financial gains −25.81% in 25 years for the system as a whole, in addition to reducing its payback by 1.4 years. The displacement of the systems to the better-performing headquarters associated with more favorable initial investments provide energy gains, in addition to increasing financial gains -of 112.96%, in 25 years and payback reduction in 8.9 years, as observed in scenario 3.
The evaluated results indicate that multi-headquarter institutions willing to invest in solar photovoltaic systems with the option of distributing these systems throughout the headquarters that present the most appropriate locational conditions for better energy efficiency obtain more attractive results, both technically and economically, when compared to indiscriminate dispersed plant installation throughout all headquarters, without performing a technical-economic study such as the one carried out herein.

 ,
, 


