Thermal Property Measurement of Nanofluid Droplets with Temperature Gradients


Department of Mechanical Engineering, Chosun University, Gwangju 61452, Korea
Energies 2020, 13(1), 244; https://doi.org/10.3390/en13010244
Submission received: 8 November 2019
/
Revised: 31 December 2019
/
Accepted: 2 January 2020
/
Published: 3 January 2020
(This article belongs to the Special Issue Photo Thermal Conversion and Pool Boiling Heat Transfer of Nanofluid)
Abstract
:In this study, the 3ω method was used to determine the thermal conductivity of nanofluids (ethylene glycol containing multi-walled carbon nanotubes (MWCNTs)) with temperature gradients. The thermal modeling of the traditional 3ω method was modified to measure the spatial variation of thermal conductivity within a droplet of nanofluid. A direct current (DC) heater was used to generate a temperature gradient inside a sample fluid. A DC heating power of 14 mW was used to provide a temperature gradient of 5000 K/m inside the sample fluid. The thermal conductivity was monitored at hot- and cold-side 3ω heaters with a spacing of 0.3 mm. Regarding the measurement results for the hot and cold 3ω heaters, when the temperature gradient was applied, the maximum thermal conductivity difference was determined to be 3% of the original value. By assuming that the thermo-diffusion of MWCNTs was entirely responsible for this difference, the Soret coefficient of the MWCNTs in the ethylene glycol was calculated to be −0.749 K−1.
1. Introduction
Particle transport in the presence of a temperature gradient is known as thermo-diffusion. Traditionally, thermo-diffusion is described as the net force exerted on a particle by the molecules of a fluid medium. In the presence of a temperature gradient, the medium molecules on the hot side, which have greater kinetic energy, push particles to the cold side. However, for some nanoscale particle suspensions, such as dilute aqueous suspensions of charged polystyrene spheres [1], silica nanoparticles dispersed in water [2], or DNA in water [3], negative thermo-diffusion movement (from cold to hot) at certain temperatures was reported. Despite a long history of theoretical analysis on this subject, no generally accepted theories exist [4].
Some researchers hypothesized that thermo-diffusion is one of the causes of convective nanofluid heat transfer enhancement in channel flows [5,6,7,8]. Numerical analysis results suggested a significant heat transfer enhancement for nanofluids in channel flows, based on the thermal dispersion of nanoparticles [9]. Despite these positive views of nanoparticle thermo-diffusion and its effects on nanofluid heat transfer, some argued that the thermo-diffusion velocity of a nanoparticle is too small to affect heat transfer mechanisms [10].
Because it is extremely difficult to distinguish particle diffusion caused by natural convection from that caused by thermo-diffusion, measurement techniques are limited to optical methods, such as optical beam deflection techniques [1,11,12] or all-optical microfluidic fluorescence methods [3]. For optical thermo-diffusion measurement techniques, sample suspensions must be sufficiently diluted such that particle–particle interactions are excluded from the measured data. Therefore, optical thermo-diffusion detection methods are not suitable for nanofluids used in heat transfer applications. Because the thermal conductivity of a nanofluid is a function of the nanoparticle concentration, thermal conductivity measurement in the presence of a temperature gradient can be used to characterize thermo-diffusion in nanofluids.
To detect the concentration gradients of nanoparticles in fluids with temperature gradients, we propose measuring localized thermal conductivities inside nanofluid samples. Because the measurement of steady-state thermo-diffusion is considered, a stable nanofluid without nanoparticle agglomeration or sedimentation is required. A mixture of acid-treated multi-walled carbon nanotubes (MWCNTs) and ethylene glycol (EG) was reported to exhibit no signs of sedimentation up to a nanoparticle concentration of 0.4 vol.% [13]. Additionally, adding MWCNTs to nanofluids yields a significant increase in thermal conductivity with an increase of only 0.1% in terms of volume fraction [14,15,16]. This difference in thermal conductivity can be detected using high-resolution spatial thermal conductivity measurement techniques, such as the three omega (3ω) method. The 3ω method was used to measure the thermal conductivity of thin films [17], liquids [18,19], and other substances. The spatial resolution of the 3ω method is less than 0.1 mm, and only a single droplet is required for thermal conductivity measurement.
Generally, the temperature variation in 3ω heaters can be controlled to within 1 K during measurement [20]. This limits the effects of natural convection, which typically acts as the most significant source of experimental uncertainty in thermo-diffusion detection. Furthermore, natural convection inside a nanofluid sample can be suppressed by using an inverted heater configuration, where the sensor is positioned such that the micro heaters are on top of the sample fluid. The effects of natural convection in stratified temperature fields (heating a liquid from the top side inside a gravitational field) inside a droplet of nanofluid can be minimized. A droplet of liquid is sufficiently small for it to exhibit no noticeable change in shape when it is placed on a sensor device and inverted [13,19].
In this study, the thermo-diffusion of MWCNTs in EG was analyzed through the measurement of localized thermal conductivities, using the 3ω method. Two 3ω heaters (hot and cold sides) separated by 0.3 mm were utilized to measure spatial thermal conductivity differences inside a sample fluid. A direct current (DC) heater was used to generate a temperature gradient, while transient thermal conductivities were measured simultaneously using the 3ω heaters. Differences in MWCNT concentrations at the hot- and cold-side 3ω heaters were calculated based on the thermal conductivity measurements. The thermo-diffusion of MWCNTs was quantified based on a simplified nanoparticle diffusion equation in the steady state.
2. Theoretical Analysis
Consider a metal strip heater placed on a layer of fluid. From the derivation of the conventional 3ω method, the relationship between the temperature oscillation of the heater (), sinusoidal heat generation (), and thermal properties of the sample can be expressed as follows [13,17]:
where l is the length of the heater, b is the half-width of the heater, q is a complex thermal wave number, ω is the angular velocity of the sinusoidal heat, and ρ, Cp, and k are the density, heat capacity, and thermal conductivity of the fluid, respectively [17]. In this work, the conventional 3ω method was extended to assess bi-directional heat conduction through two semi-infinite media. Consider a droplet of nanofluid placed on a Pyrex substrate with heaters. The sinusoidal heat generated by the heaters is transferred to either the nanofluid or substrate. In this case, the temperature oscillations of the heater exhibit the following relationship according to the boundary mismatch assumption (BMA) [19,21].
where is the measured temperature oscillation with the nanofluid droplet on the Pyrex substrate, can be measured without the nanofluid, and can be calculated using Equation (1). The least-squares fit of , which is derived by comparing the theoretical and experimental values, can be used to calculate the thermal conductivity of the nanofluid. The BMA indicates that the heat transfer between the Pyrex substrate and nanofluid is negligible. The BMA is valid as long as the differences in the thermal conductivities and thermal diffusivities of two semi-infinite layers are within one order of magnitude [19,21].
The typical heating frequency used in the 3ω method ranges from a few hertz to a few kilohertz. In this frequency range, the thermal penetration depths (TPD) of most fluids and a Pyrex substrate are smaller than a few hundred micrometers. Therefore, a droplet of nanofluid and a 0.5-mm-thick Pyrex substrate are sufficient for consideration as two semi-infinite media. Additionally, localized thermal property measurement inside a nanofluid droplet with a spatial resolution below 100 µm is possible when using the 3ω method [19,20]. This advantage can be adapted to the thermal characterization of a nanofluid when a temperature gradient is applied to the sample.
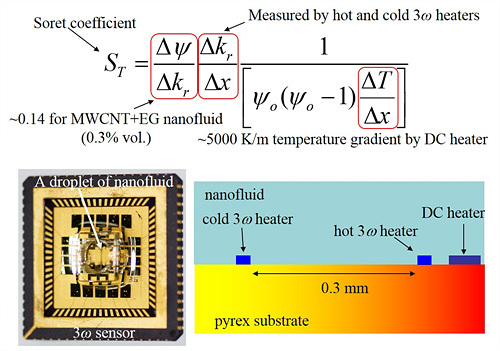
A schematic diagram of the proposed 3ω device with a DC heater that generates temperature gradients and two 3ω heaters that detect changes in local thermal conductivity is presented in Figure 1a. The input current frequency for the 3ω heaters can be controlled such that the TPD in the surrounding liquid medium is less than a few tens of micrometers. When sufficient power is supplied to the DC heater, a temperature gradient is generated around the 3ω heaters. The high spatial resolution of thermal conductivity measurement enables the detection of changes in thermal conductivity caused by the temperature gradient. The temperature gradient and thermo-diffusion of nanoparticles cause nanoparticle concentrations to differ around the hot and cold 3ω heaters. Because the thermal properties of the nanofluid are a function of the nanoparticle concentration, changes in the nanoparticle concentration can be calculated by measuring the thermal conductivity at two different locations.
The following equation can be applied to a system in which a temperature gradient is induced in a nanofluid layer, and mass diffusion of nanoparticles occurs [22]:
where is the mass flux of the nanoparticles, ρnf is the density of the nanoparticles, D is the nanoparticle diffusivity in the base fluid according to concentration differences, is the volume concentration of the nanoparticles, DT is the thermo-diffusivity, and is the initial volume concentration of the nanoparticles. When the system is in a steady state, is one-dimensional, and = 0, Equation (4) can be rewritten as follows:
where the ratio of DT to D is the Soret coefficient (ST). The force and direction of particle movement, either to the cold or hot side, depends on the amplitude and sign of ST.
To quantitatively examine the feasibility of thermo-diffusion detection in a nanofluid using the 3ω method, further assumptions are added to Equation (5). Small changes are considered in terms of the nanoparticle concentration and nanofluid thermal conductivity in a given domain. Therefore, Equation (5) can be modified as follows:
where kr represents the thermal conductivity increment ratio of the nanofluid relative to the base fluid, at a volume fraction of (i.e., (knf − kbf)/kbf), where the subscripts nf and bf represent the nanofluid and base fluid, respectively; Δ indicates small changes in each parameter.
Consider a nanofluid mixture of MWCNTs in EG. According to previous studies, the value of ΔΔkr for such a mixture is approximately 0.14 [13,15]. To analyze the required spatial resolution for thermal conductivity measurement, we must determine the ST value of MWCNTs. We assume a temperature difference of 0.5 K inside the sample fluid with a separation of 100 μm. The ST values of nanoscale solid particles in a suspension are not well known, but we consider a value of 0.3 K−1 based on experimental results for polystyrene nanoparticles in water, presented by Putnam et al. [11]. In this case, the required Δkr/Δx value is −32.1 m−1. This means that, if a thermal conductivity ratio difference of approximately 1% is detectable by the 3ω heaters with a separation distance of 0.3 mm, then an ST value of 0.3 or greater can be observed. The details of our experimental set-up and measurement considerations for calculating the ST value of MWCNTs in EG are presented in the next section.
3. Experimental Set-Up and Measurement Consideration
An array of metal strip heaters is required to measure thermal conductivity inside a nanofluid with a temperature gradient. Two 3ω heaters and a DC heater (see Figure 1) were micro-fabricated onto a Pyrex substrate. The widths of the 3ω and DC heaters were fixed at 10 μm and 40 μm, respectively. Details regarding the heater specifications are listed in Table 1. The spatial resolution of the 3ω heaters was considered to determine the distance between the hot and cold heaters. The TPD of EG at an input current frequency of 125 Hz is approximately 8 μm at room temperature. The temperature amplitude measured at the heater is affected by the thermal properties of the surrounding medium within a radius of tens of micrometers. The distance between the heaters was set to 300 μm in this study. Figure 1b illustrates the fabricated heaters on a Pyrex substrate.
The 3ω device was micro-fabricated on a 500-μm-thick Pyrex wafer. A 20-nm-thick chromium coating and 100-nm-thick platinum coating were sputtered and patterned using the liftoff method, followed by the plasma-enhanced chemical vapor deposition of a 200-nm-thick SiO2 passivation layer. The passivation layer on the contact pads was etched away through a plasma-etching process. A 3-mm-thick polydimethylsiloxane (PDMS) gasket was used to seal the device and create a well around the heater. Approximately 30 μL of nanofluid was placed inside the PDMS well.
The nanofluid was prepared by mixing commercial MWCNTs (CM-95, Iljin Nanotech Co., Ltd., Seoul, Korea) with EG. The MWCNTs were acid-treated prior to being mixed with EG to enhance the stability of the resulting nanofluid. The volume fraction of MWCNTs was fixed at 0.3%. The nanofluid was treated with more than 15 h of ultrasonic vibration. Because temperature–amplitude measurements were performed for several hours, stable nanofluids without any nanoparticle agglomeration or sedimentation were used. A previous paper of ours provided detailed descriptions of the 3ω sensors, nanofluid preparation, and measurement procedures [13,23]. All experiments were performed inside a thermally insulated oven at room temperature.
Prior to measuring 3ω signals, the changes in transient temperature at the hot and cold 3ω heaters with different DC heating power inputs were measured. The temperatures at the hot and cold 3ω heaters were measured by reading the heater resistances. The calibration curves for the electrical resistances and temperatures of the hot and cold 3ω heaters were obtained in advance. Figure 2a,b presents the transient behaviors of the temperature and the temperature differences between the hot and cold 3ω heaters when the DC heater operated at 14 mW with a droplet of EG on the 3ω device. An increase in temperature of approximately 1 K in the ambient environment was noted during the experiments. The ambient temperature was obtained by calculating the average temperature measured using thermocouples located on the top and bottom of the 3ω device.
The temperature difference between the hot and cold heaters was found to be constant at approximately 1.45 K for the inverted sensor position, in which the DC and 3ω heaters were placed on top of the sample fluid, as shown in Figure 2b. This temperature difference corresponds to a temperature gradient of approximately 5000 K/m. However, when the bottom side of the EG was heated, clear signs of natural convection could be observed, as indicated by the dotted line. The fluctuation in the temperature difference between the hot and cold 3ω heaters is believed to occur as a result of Rayleigh–Bernard convection instability inside the sample EG droplet. Because this fluctuation was not observed for the inverted sensor position, the effects of natural convection can be disregarded. All additional experiments were performed in the inverted sensor position.
4. Experimental Results and Discussion
The temperature oscillation of the 3ω heater with a Pyrex substrate in a vacuum with EG was firstly measured without DC heating. The input current frequency was controlled to be in the range of 1 Hz–1 kHz. When measuring the fluid sample, the natural convection of the sample fluid caused by the temperature oscillation of the metal heater was eliminated by maintaining the temperature amplitude of the heater and the time period of a frequency scan at less than 0.5 K and 3 min, respectively. The metal heater in the 3ω device was configured as part of a balanced Wheatstone bridge. A lock-in amplifier (SR850, Stanford Research, Sunnyvale, CA, USA) was used to accurately measure the 3ω voltage across the metal heater. The temperature amplitude based on the input frequency is presented in Figure 3a. The best fits for the experimental results when comparing calculations using Equations (1)–(3) were found to be 1.16 and 0.267 W/mK for the Pyrex substrate and EG, respectively. The fitting frequency range was modified to 30–200 Hz to achieve the best results. The measured thermal conductivity of EG was found to agree well with the table value of 0.26 W/mK. The measured results for a 0.3% volume fraction MWCNTs in EG are presented in Figure 3b. The best fit result for the thermal conductivity was found to be 0.28 W/mK, with a kr value of 0.045. The best fit and ±10% best fit values are also indicated by solid and dotted lines, respectively, for comparison.
To measure the thermal conductivity of a nanofluid with a temperature gradient, simultaneous temperature amplitude measurements at the hot and cold 3ω heaters are required. In this study, the input frequency was fixed at 125 Hz, and the resulting temperature amplitude was monitored. The transient temperature of the 3ω heaters changed when the DC heater was active, affecting the measured temperature amplitude. Therefore, we analyzed the temperature amplitude based on changes in the ambient temperature. A droplet of EG placed on the 3ω device was heated to 300 K inside an oven. The device was left in the oven for 3 h to achieve thermal equilibrium. The oven was then turned off and left to cool to the room temperature of 296 K. The temperature amplitude of the EG on the Pyrex substrate was measured as the temperature decreased. The transient 3ω signal measurements at the hot-side heater are presented in Figure 4a.
Figure 4b presents the corresponding ambient temperatures measured in the vicinity of the sample. The stepwise decrease in ambient temperature in Figure 4b is caused by the temperature measurement uncertainty (±0.1 K) of the thermocouples. There is a noticeable continuous increase in measured temperature amplitude with a decrease in ambient temperature. Approximately 0.001 K of the temperature amplitude, which corresponds to a fraction of 0.5%, can be observed to increase when the temperature drop of the EG is 1.6 K.
Here, we analyze the measurements of the temperature-dependent temperature amplitude. According to Equation (1), the parameters that affect the temperature amplitude at fixed frequencies are changes in the thermal properties (k, ρ, and Cp) of the sample or changes in caused by drift in the electrical resistance of the 3ω heaters. To rule out the effects of changes in , we measured the electrical current flowing through the 3ω heaters by measuring the voltage drop using a 100-Ω standard resistor (2792A06, Yokogawa, Tokyo, Japan) connected in series with the 3ω heaters, as shown in Figure 4a,b. The squared values of the measured electrical current are multiplied by the temperature-dependent electrical resistance of the 3ω heaters to calculate the generated . The ratio of the temperature amplitude to is plotted in Figure 5.
The increase in , shown in Figure 4a, and that in the / values over a cooling period of approximately 32,000 s are identical at 0.5%. This indicates that changes in during this period are irrelevant to the increase in . Additionally, we can rule out the effects of the increase in the electrical resistance of the 3ω heaters.
Therefore, we suspect the occurrence of changes in the thermal property of the EG during this period. We assumed the density of EG to be a constant value of 1117 kg/m3 and assumed that the heat capacity monotonically increases with temperature, based on experimental results presented by Nan et al. Specifically, it increases from 2.3556 to 2.4184 J/gK between 20 and 30 °C [24]. Figure 6 presents the transient thermal conductivity calculation for the EG based on the monitoring depicted in Figure 4a. Note that the time- and temperature-dependent and heat capacity values of EG were considered when analyzing transient thermal conductivity values, as shown in Figure 6.
The thermal conductivity of EG can be observed to decrease slightly during the cooling period. The decrease was approximately 1% for the temperature reduction of 1.7 K. Changes in the thermal conductivity of EG based on small changes in temperature are not yet reported, but we can compare our analysis results with experimental results presented by Harish et al. [14]. Harish et al. reported that the thermal conductivity of EG increases by approximately 1% from 0.253 to 0.256 W/mK between 298 and 300 K, based on measurements using the transient hot-wire method. The increment in thermal conductivity measurements when using the 3ω method appears to be larger than the values obtained in relevant studies. The possible reasons for this discrepancy are discussed later, along with the uncertainty analysis.
Figure 7a,b presents the transient values and the calculation of the thermal conductivity of the nanofluid sample at the hot- and cold-side 3ω heaters when the DC heater is turned on and off. The values measured at the hot and cold 3ω heaters exhibited a sudden decrease when the DC heater was turned on at 2000 s. The temperatures at the heaters were not measured simultaneously because the 3ω signals were measured continuously. However, we can consider the temperature profile inside the nanofluid to be similar to those presented in Figure 2a. In this case, the temperature increments at the hot and cold 3ω heaters due to DC heating at 14 mW can be considered to be 3.1 and 1.6 K, respectively. The calculation results for the transient thermal conductivity of the nanofluid obtained by following an identical process are presented in Figure 6. The density and heat capacity of the nanofluid are considered to be same as those of EG because the effect of 0.3 vol.% of MWCNTs on these properties is negligible. Q was measured by monitoring the voltage drop across a standard resistor connected in series to the 3ω heaters. The temperature-dependent heat capacity was used to calculate the thermal conductivity of the nanofluid based on Equations (1)–(3).
When the DC heater was turned on, the thermal conductivity values measured at the hot and cold 3ω heaters were found to increase from 0.282 and 0.281 W/mK to 0.299 and 0.291 W/mK, respectively. When the DC heater was turned off, the thermal conductivities returned to their original values. No transient behaviors were noticeable when the DC heater was turned on or off, except for some fluctuation between 2000 and 3000 s at the hot-side 3ω heater. The measured thermal conductivity values increased by 6.0% and 3.6% when the temperature increased from to 3.1 and 1.6 K at the hot and cold 3ω heaters, respectively. If we assume that this thermal conductivity increment stems solely from the thermo-diffusion of MWCNTs, then the ST value calculated using Equation (6) becomes −0.749 K−1. However, to the best of our knowledge, no experimental results were reported regarding the ST value of MWCNTs, and the absolute of measured value appears relatively large compared with the experimental results for other nanoparticles immersed in liquid [1,4]. For comparison, polystyrene nanoparticles in water exhibit ST values ranging from −0.47 to 0.3 K−1 depending on the temperature and the size of nanoparticles [4].
Here, we attempt to analyze the uncertainty of our measurements of temperature amplitude and calculations of thermal conductivity. The main source of uncertainty when measuring thermal conductivity rises from uncertainty in 3ω signals. The deviations in the resistance in electrical circuits, measured current, and the temperature coefficient of resistance are very small (less than 0.2%) compared with the deviation in the 3ω voltage signals read from the lock-in amplifier [23].
The deviation in the 3ω voltage signals was observed to be smaller than 0.5%, which can be verified by examining the scattering of the measured temperature amplitudes shown in Figure 4a. We considered the thermal properties of the Pyrex substrate to be constant and adopted an experimental value for measured at room temperature when using Equation (3). Increasing the temperature from 24 to 27 °C causes the thermal conductivity and heat capacity of the Pyrex substrate to increase by 0.5% and 1.3%, respectively [17,25]. This uncertainty can lead to maximum uncertainties of 0.4% for and 2.1% for the thermal conductivity of the nanofluid. The overall uncertainty in our experiments in terms of measuring the thermal conductivity of the nanofluid was found to be less than 3%. This corresponds to the same uncertainty as that in the ST calculation. Although this analyzed uncertainty is comparable to the thermal conductivity increment of the nanofluid when the DC heater is switched on, we believe that the measured value represents thermal conductivity deviations based solely on the thermo-diffusion of MWCNTs. Further research is required to verify the ST value of MWCNTs in EG based on other measurement techniques.
5. Conclusions
This paper presented a method for measuring the thermo-diffusion of MWCNTs in EG, based on thermal conductivity measurements in the presence of a temperature gradient. An array of metal heaters patterned on a Pyrex substrate was composed of hot and cold 3ω heaters for localized thermal conductivity measurements, and a DC heater for generating a temperature gradient. The TPD and input frequency of the 3ω heaters were controlled to have a spatial resolution less than a few tens of micrometers in the sample fluid. The 14 mW DC heater provided a 0.5 K temperature difference over the 0.3-mm spacing between the hot and cold 3ω heaters in the presence of EG. The thermal conductivities of EG and an EG-based nanofluid containing 0.3 vol.% of acid-treated MWCNTs were measured, and the results were found to be in agreement with previously reported values. The temperature amplitudes of the hot and cold 3ω heaters were monitored as the DC heater was turned on and off. The measured temperature–amplitude values were analyzed, and the transient thermal conductivities were calculated. When the DC heater was turned on, the temperatures and thermal conductivity increments at the hot and cold 3ω heaters were found to be 3.1 and 1.6 K, and 6% and 3.6%, respectively. These thermal conductivity differences correspond to an ST value of −0.749 K−1 when assuming that thermo-diffusion is responsible for the changes in temperature amplitude during the DC heating period. To the best of our knowledge, these are the first experimentally measured ST values for MWCNTs in EG. Although further verification of the presented ST values is required based on other measurement techniques, the proposed technique is very helpful for understanding thermal transport in nanofluids because it facilitates quantification of the thermo-diffusion of nanoparticles.
Funding
This study was supported by a research fund from Chosun University, 2019.
Conflicts of Interest
The author declares no conflict of interest.
Nomenclature
| b | Half width of 3ω heater (m) |
| Cp | Heat capacity (J∙kg−1∙K−1) |
| D | Diffusivity of nanoparticle (m2∙s−1) |
| DT | Thermo-diffusivity (m2∙s−1∙K−1) |
| J | Mass flux of the nanoparticles (kg∙s−1) |
| k | Thermal conductivity (W∙m−1∙K−1) |
| κ | Integration variable (−) |
| l | Length of 3ω heater (m) |
| , | Heat generation (W) |
| q | Complex thermal wave number (m−1) |
| ρ | Density (kg∙m−3) |
| ST | Soret coefficient (K−1) |
| T | Temperature (K) |
| Volume concentration of the nanoparticle (%) | |
| ω | Angular velocity of the sinusoidal heat (rad∙s−1) |
| Subscripts | |
| nf | Nanofluid |
| np | Nanoparticle |
| o | Initial value |
| r | Ratio |
| sub | Substrate |
References
- Putnam, S.A.; Cahill, D.G. Transport of nanoscale latex spheres in a temperature gradient. Langmuir 2005, 21, 5317–5323. [Google Scholar] [CrossRef] [PubMed]
- Cerbino, R.; Mazzoni, S.; Vailati, A.; Giglio, M. Scaling behavior for the onset of convection in a colloidal suspension. Phys. Rev. Lett. 2005, 94, 064501. [Google Scholar] [CrossRef] [PubMed] [Green Version]
- Duhr, S.; Braun, D. Why molecules move along a temperature gradient. Proc. Natl. Acad. Sci. USA 2006, 103, 19678–19682. [Google Scholar] [CrossRef] [PubMed] [Green Version]
- Putnam, S.A.; Cahill, D.G.; Wong, G.C. Temperature dependence of thermodiffusion in aqueous suspensions of charged nanoparticles. Langmuir 2007, 23, 9221–9228. [Google Scholar] [CrossRef] [PubMed]
- Bhatti, M.M.; Rashidi, M.M. Effects of thermo-diffusion and thermal radiation on Williamson nanofluid over a porous shrinking/stretching sheet. J. Mol. Liq. 2016, 221, 567–573. [Google Scholar] [CrossRef]
- Buongiorno, J. Convective transport in nanofluids. J. Heat Transf. 2006, 128, 240–250. [Google Scholar] [CrossRef]
- Chein, R.; Chuang, J. Experimental microchannel heat sink performance studies using nanofluids. Int. J. Therm. Sci. 2007, 46, 57–66. [Google Scholar] [CrossRef]
- Aprea, C.; Greco, A.; Maiorino, A.; Masselli, C. Enhancing the Heat Transfer in an Active Barocaloric Cooling System Using Ethylene-Glycol Based Nanofluids as Secondary Medium. Energies 2019, 12, 2902. [Google Scholar] [CrossRef] [Green Version]
- Khaled, A.-R.; Vafai, K. Heat transfer enhancement through control of thermal dispersion effects. Int. J. Heat Mass Transf. 2005, 48, 2172–2185. [Google Scholar] [CrossRef]
- Eapen, J.; Williams, W.C.; Buongiorno, J.; Hu, L.; Yip, S.; Rusconi, R.; Piazza, R. Mean-Field versus microconvection effects in nanofluid thermal conduction. Phys. Rev. Lett. 2007, 99, 095901. [Google Scholar] [CrossRef]
- Putnam, S.A.; Cahill, D.G. Micron-scale apparatus for measurements of thermodiffusion in liquids. Rev. Sci. Instrum. 2004, 75, 2368–2372. [Google Scholar] [CrossRef]
- Zhang, K.; Briggs, M.; Gammon, R.; Sengers, J.; Douglas, J. Thermal and mass diffusion in a semidilute good solvent-polymer solution. J. Chem. Phys. 1999, 111, 2270–2282. [Google Scholar] [CrossRef] [Green Version]
- Oh, D.-W.; Kwon, O.; Lee, J.S. Transient Thermal Conductivity and Colloidal Stability Measurements of Nanofluids by Usingthe 3w Method. J. Nanosci. Nanotechnol. 2008, 8, 4923–4929. [Google Scholar] [CrossRef] [PubMed]
- Harish, S.; Ishikawa, K.; Einarsson, E.; Aikawa, S.; Chiashi, S.; Shiomi, J.; Maruyama, S. Enhanced thermal conductivity of ethylene glycol with single-walled carbon nanotube inclusions. Int. J. Heat Mass Transf. 2012, 55, 3885–3890. [Google Scholar] [CrossRef]
- Xie, H.; Lee, H.; Youn, W.; Choi, M. Nanofluids containing multiwalled carbon nanotubes and their enhanced thermal conductivities. J. Appl. Phys. 2003, 94, 4967–4971. [Google Scholar] [CrossRef]
- Sekrani, G.; Poncet, S. Ethylene-and Propylene-Glycol Based Nanofluids: A Litterature Review on Their Thermophysical Properties and Thermal Performances. Appl. Sci. 2018, 8, 2311. [Google Scholar] [CrossRef] [Green Version]
- Cahill, D.G. Thermal conductivity measurement from 30 to 750 K: The 3ω method. Rev. Sci. Instrum. 1990, 61, 802–808. [Google Scholar] [CrossRef]
- Roy-Panzer, S.; Kodama, T.; Lingamneni, S.; Panzer, M.A.; Asheghi, M.; Goodson, K.E. Thermal characterization and analysis of microliter liquid volumes using the three-omega method. Rev. Sci. Instrum. 2015, 86, 024901. [Google Scholar] [CrossRef]
- Oh, D.-W.; Jain, A.; Eaton, J.K.; Goodson, K.E.; Lee, J.S. Thermal conductivity measurement and sedimentation detection of aluminum oxide nanofluids by using the 3ω method. In. J. Heat Fluid Flow 2008, 29, 1456–1461. [Google Scholar] [CrossRef]
- Oh, D.W. Thermal Conductivity Measurement of Liquids by Using a Suspended Microheater. Int. J. Thermophys. 2017, 38, 146. [Google Scholar] [CrossRef]
- Lubner, S.D.; Choi, J.; Wehmeyer, G.; Waag, B.; Mishra, V.; Natesan, H.; Bischof, J.C.; Dames, C. Reusable bi-directional 3 omega sensor to measure thermal conductivity of 100-mu m thick biological tissues. Rev. Sci. Instrum. 2015, 86, 014905. [Google Scholar] [CrossRef] [PubMed]
- Platten, J.K. The Soret effect: A review of recent experimental results. J. Appl. Mech. 2006, 73, 5–15. [Google Scholar] [CrossRef]
- Oh, D.-W. Thermal Property Measurements of Nanofluids by Using the 3 Omega Method; Seoul National University Rep.: Seoul, Korea, 2008. [Google Scholar]
- Nan, Z.; Liu, B.; Tan, Z. Calorimetric investigation of excess molar heat capacities for water + ethylene glycol from T = 273.15 to T = 373.15 K. J. Chem. Thermodyn. 2002, 34, 915–926. [Google Scholar] [CrossRef]
- Yang, G.; Migone, A.; Johnson, K. Heat capacity and thermal diffusivity of a glass sample. Phys. Rev. B 1992, 45, 157. [Google Scholar] [CrossRef] [PubMed]
Figure 1.
(a) Schematic representation of the thermal conductivity measurement of a nanofluid with a temperature gradient using the 3ω method, and (b) photograph of metal heaters on a Pyrex substrate used as 3ω and direct current (DC) heaters.
Figure 1.
(a) Schematic representation of the thermal conductivity measurement of a nanofluid with a temperature gradient using the 3ω method, and (b) photograph of metal heaters on a Pyrex substrate used as 3ω and direct current (DC) heaters.

Figure 2.
Transient measurement of (a) the temperatures of the hot and cold 3ω heaters, as well as the ambient temperature, and (b) the temperature difference between the hot and cold 3ω heaters in the presence of a droplet of ethylene glycol (EG) with a DC power input of 14 mW.
Figure 2.
Transient measurement of (a) the temperatures of the hot and cold 3ω heaters, as well as the ambient temperature, and (b) the temperature difference between the hot and cold 3ω heaters in the presence of a droplet of ethylene glycol (EG) with a DC power input of 14 mW.

Figure 3.
Measurement results for temperature amplitudes based on frequency for (a) the Pyrex substrate and pure EG with best fit values, and (b) 0.3% volume fraction multi-walled carbon nanotube (MWCNT) nanofluid with best fit and ±10% best fit values.
Figure 3.
Measurement results for temperature amplitudes based on frequency for (a) the Pyrex substrate and pure EG with best fit values, and (b) 0.3% volume fraction multi-walled carbon nanotube (MWCNT) nanofluid with best fit and ±10% best fit values.

Figure 4.
Transient measurement of (a) the temperature amplitude of the hot 3ω heater with EG with decreasing ambient temperature, and (b) the measurement of ambient temperature.
Figure 4.
Transient measurement of (a) the temperature amplitude of the hot 3ω heater with EG with decreasing ambient temperature, and (b) the measurement of ambient temperature.

Figure 5.
Transient measurement of the ratio of the temperature amplitude to the heat generation of the 3ω heater with EG with decreasing ambient temperature (see Figure 3b).
Figure 5.
Transient measurement of the ratio of the temperature amplitude to the heat generation of the 3ω heater with EG with decreasing ambient temperature (see Figure 3b).

Figure 6.
The transient thermal conductivity of EG, calculated from the temperature amplitude at 125 Hz while the ambient temperature decreases as shown in Figure 3b.
Figure 6.
The transient thermal conductivity of EG, calculated from the temperature amplitude at 125 Hz while the ambient temperature decreases as shown in Figure 3b.

Figure 7.
Transient (a) temperature amplitudes and (b) thermal conductivities of the nanofluid measured at the hot 3ω heater (red line) and cold 3ω heater (blue line) with the DC heater turned on from 2000 to 7000 s.
Figure 7.
Transient (a) temperature amplitudes and (b) thermal conductivities of the nanofluid measured at the hot 3ω heater (red line) and cold 3ω heater (blue line) with the DC heater turned on from 2000 to 7000 s.


Table 1.
Details of hot/cold 3ω and direct current (DC) heaters.
| Microheaters | Width (μm) | Length (mm) | Temperature Coefficient of Resistance (K−1) | Material |
|---|---|---|---|---|
| Hot/cold 3ω heater | 10 | 1.8 | 1.8 × 10⁻⁶ | Cr (20 nm) Pt (100 nm) |
| DC heater | 40 | 2.4 |
© 2020 by the author. Licensee MDPI, Basel, Switzerland. This article is an open access article distributed under the terms and conditions of the Creative Commons Attribution (CC BY) license (http://creativecommons.org/licenses/by/4.0/).
Share and Cite
MDPI and ACS Style
Oh, D.-W. Thermal Property Measurement of Nanofluid Droplets with Temperature Gradients. Energies 2020, 13, 244. https://doi.org/10.3390/en13010244
AMA Style
Oh D-W. Thermal Property Measurement of Nanofluid Droplets with Temperature Gradients. Energies. 2020; 13(1):244. https://doi.org/10.3390/en13010244
Chicago/Turabian StyleOh, Dong-Wook. 2020. "Thermal Property Measurement of Nanofluid Droplets with Temperature Gradients" Energies 13, no. 1: 244. https://doi.org/10.3390/en13010244
Note that from the first issue of 2016, this journal uses article numbers instead of page numbers. See further details here.