Effects of the Heat Transfer Fluid Selection on the Efficiency of a Hybrid Concentrated Photovoltaic and Thermal Collector


Abstract
:1. Introduction
2. The PowerCollector™ Model
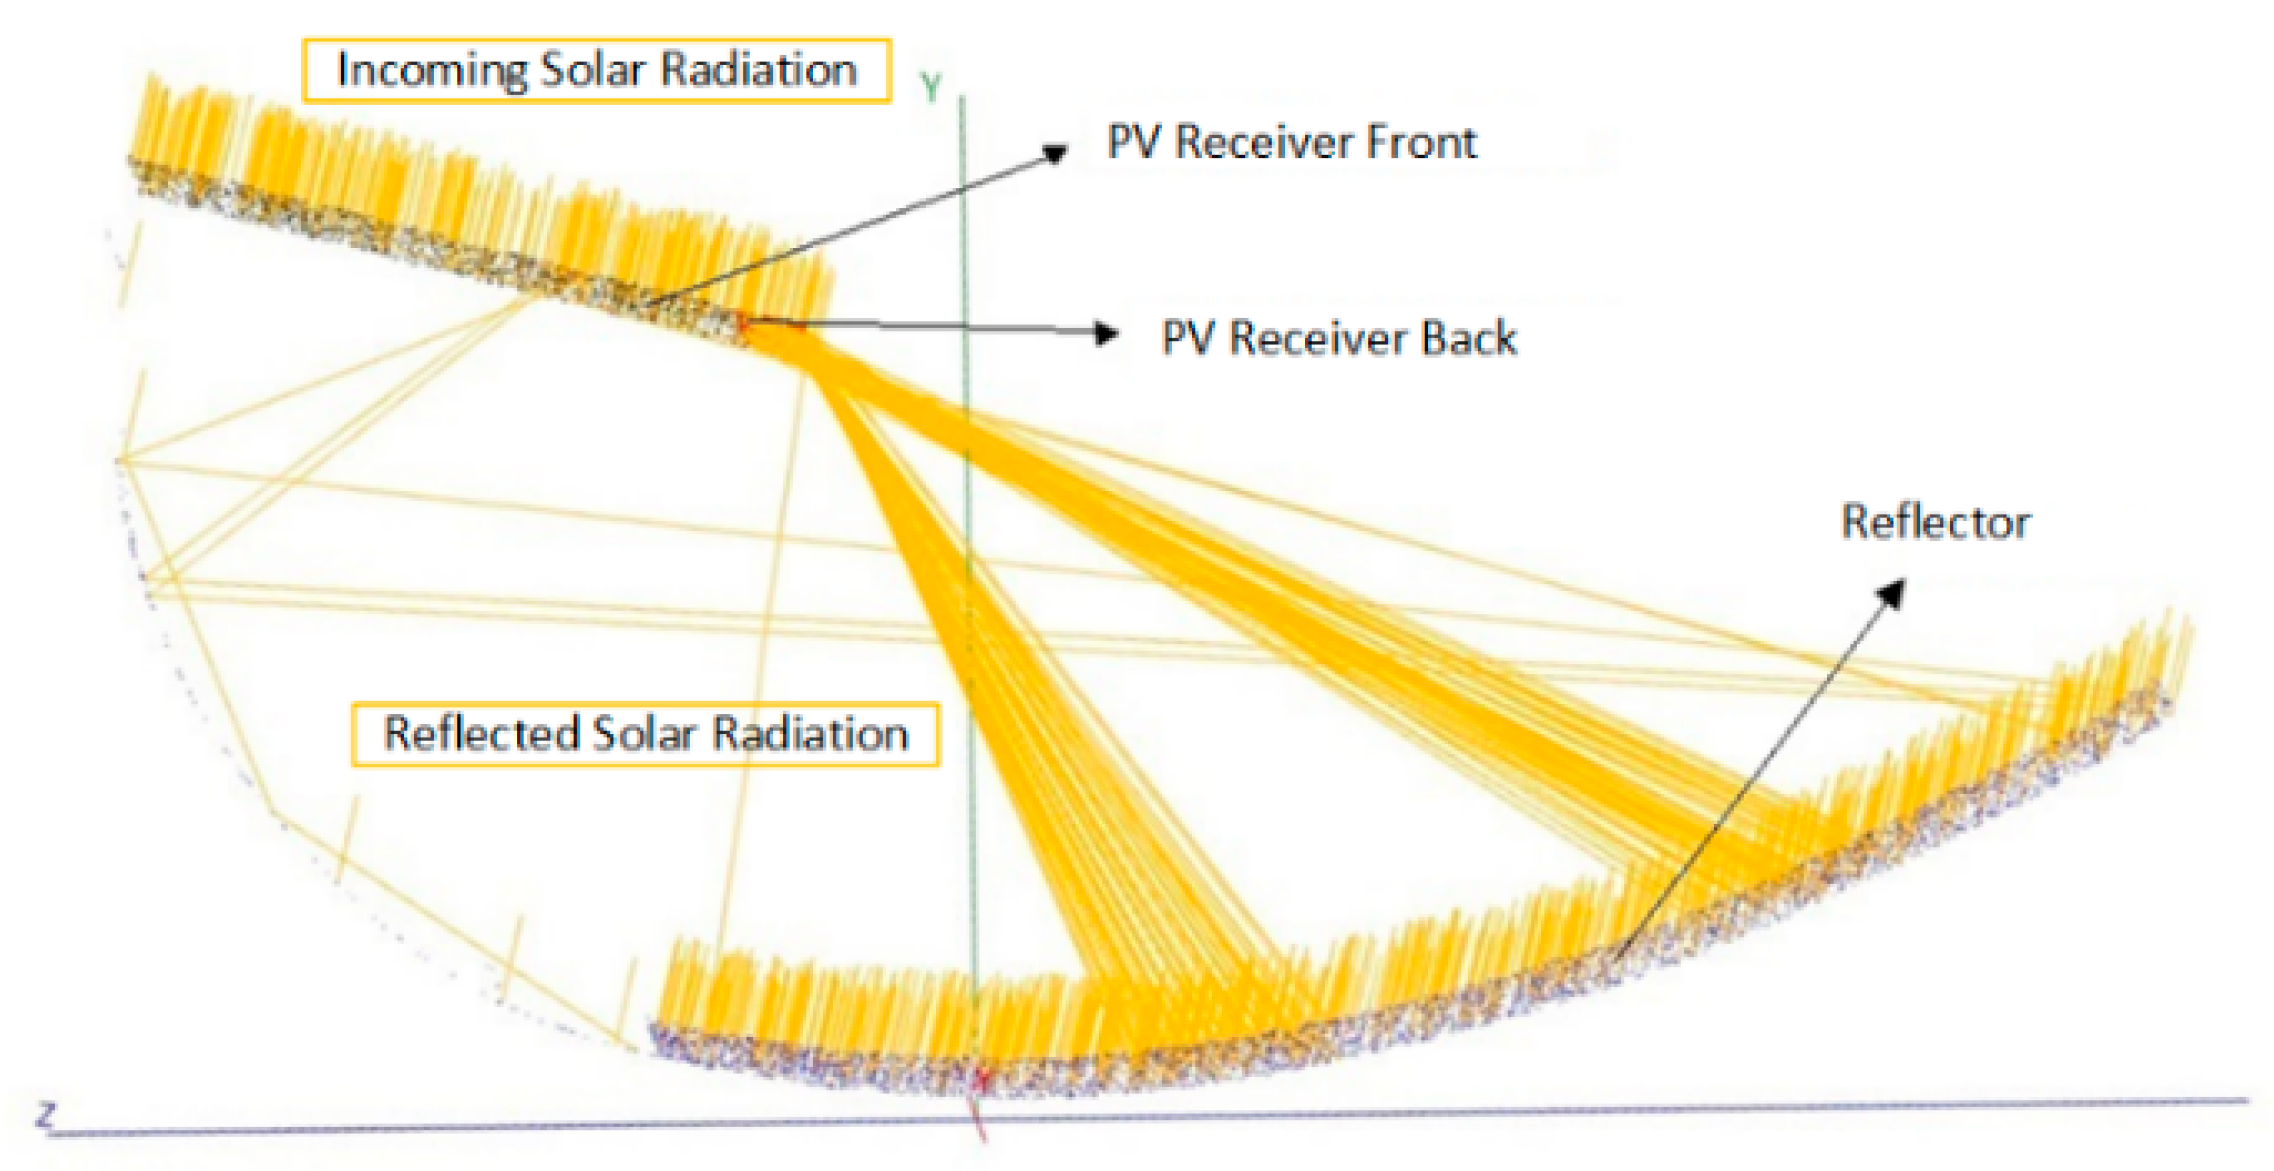
2.1. Optical Collector Model
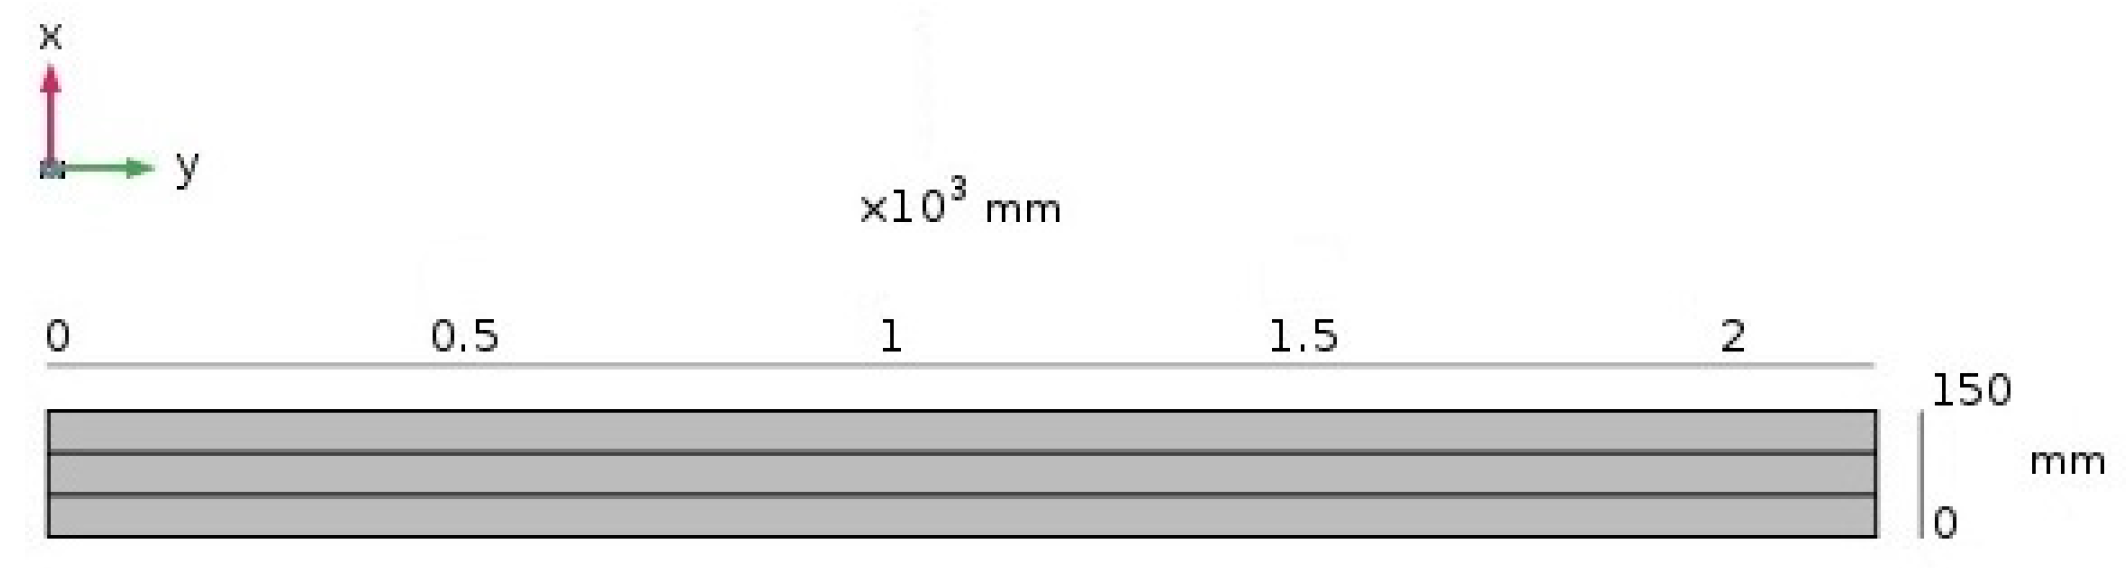
2.2. Thermal Model
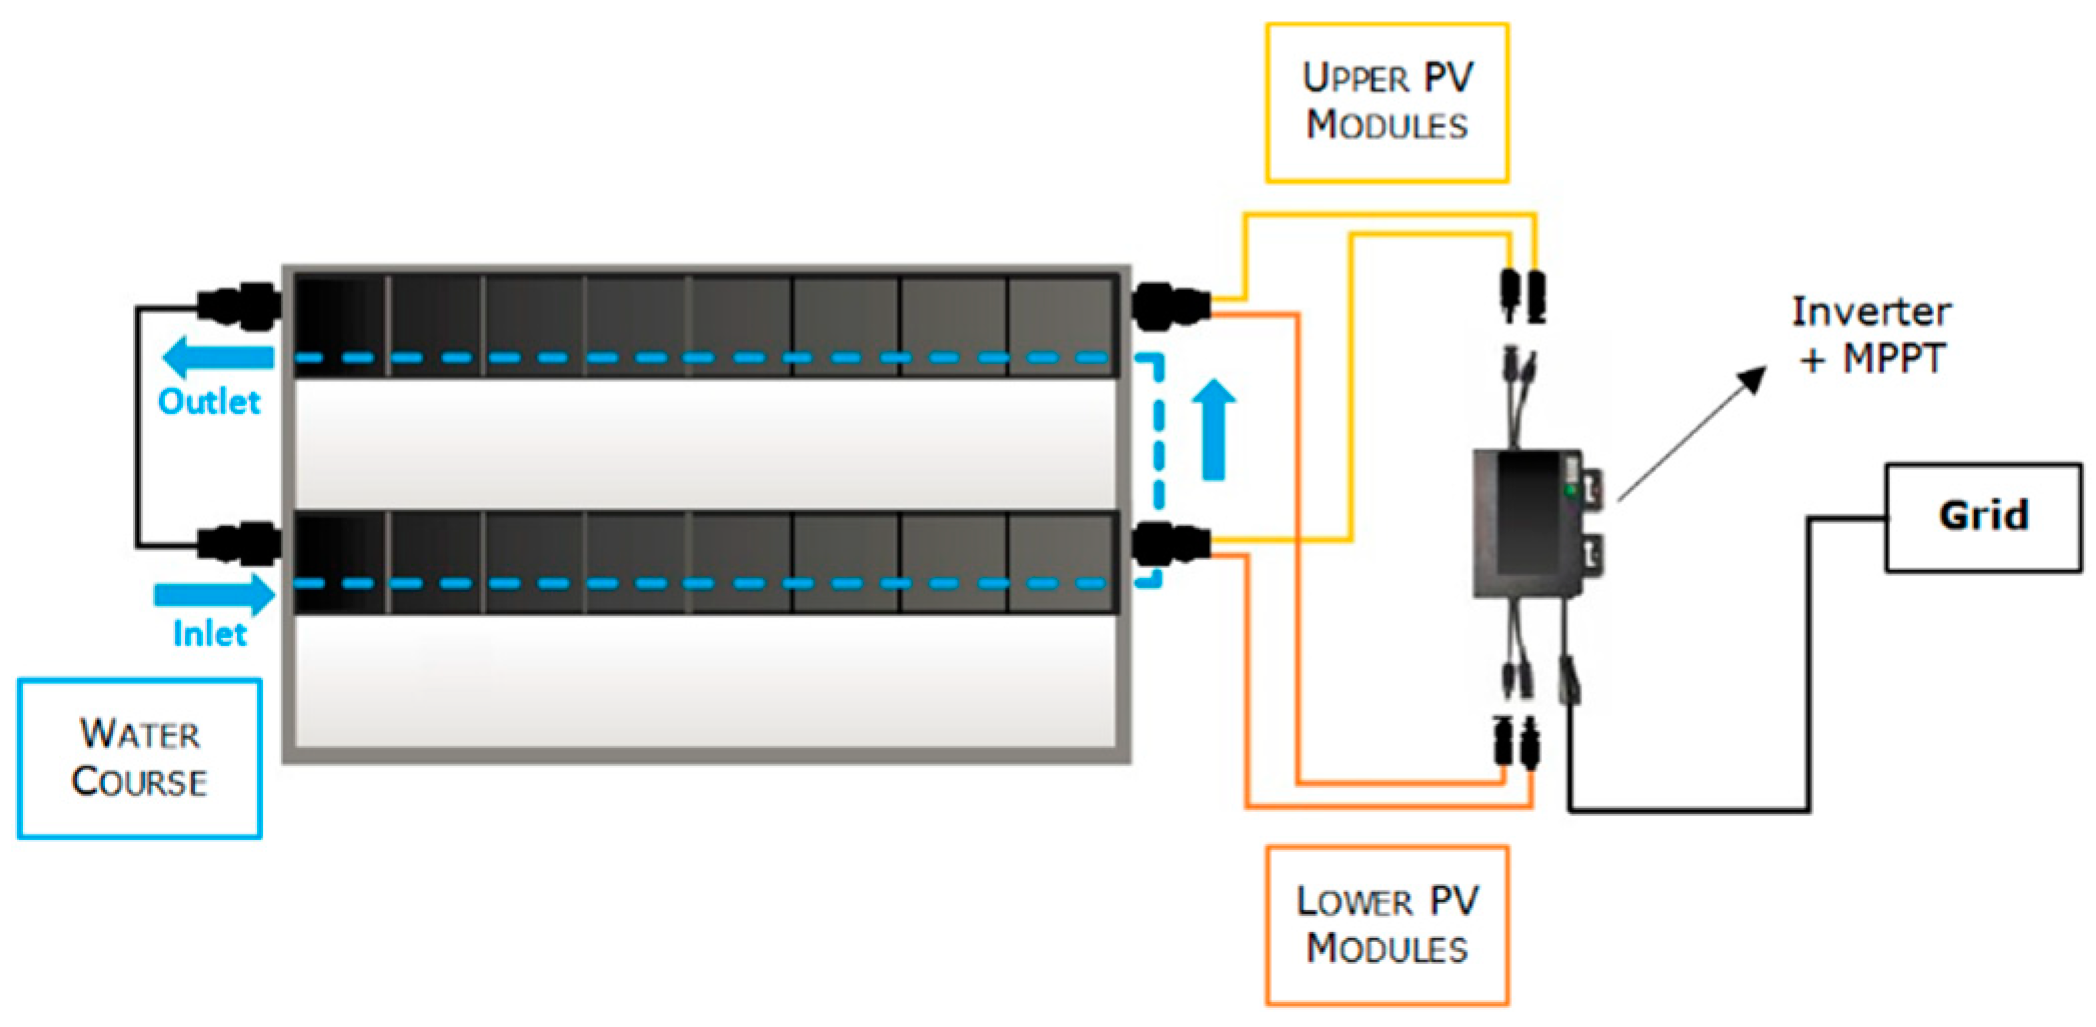
2.3. Electric Model
2.3.1. Influence of the Temperature
2.3.2. The Influence of the Irradiance
2.3.3. Constant Parameter and Final Computations
3. Simulation Model Validation
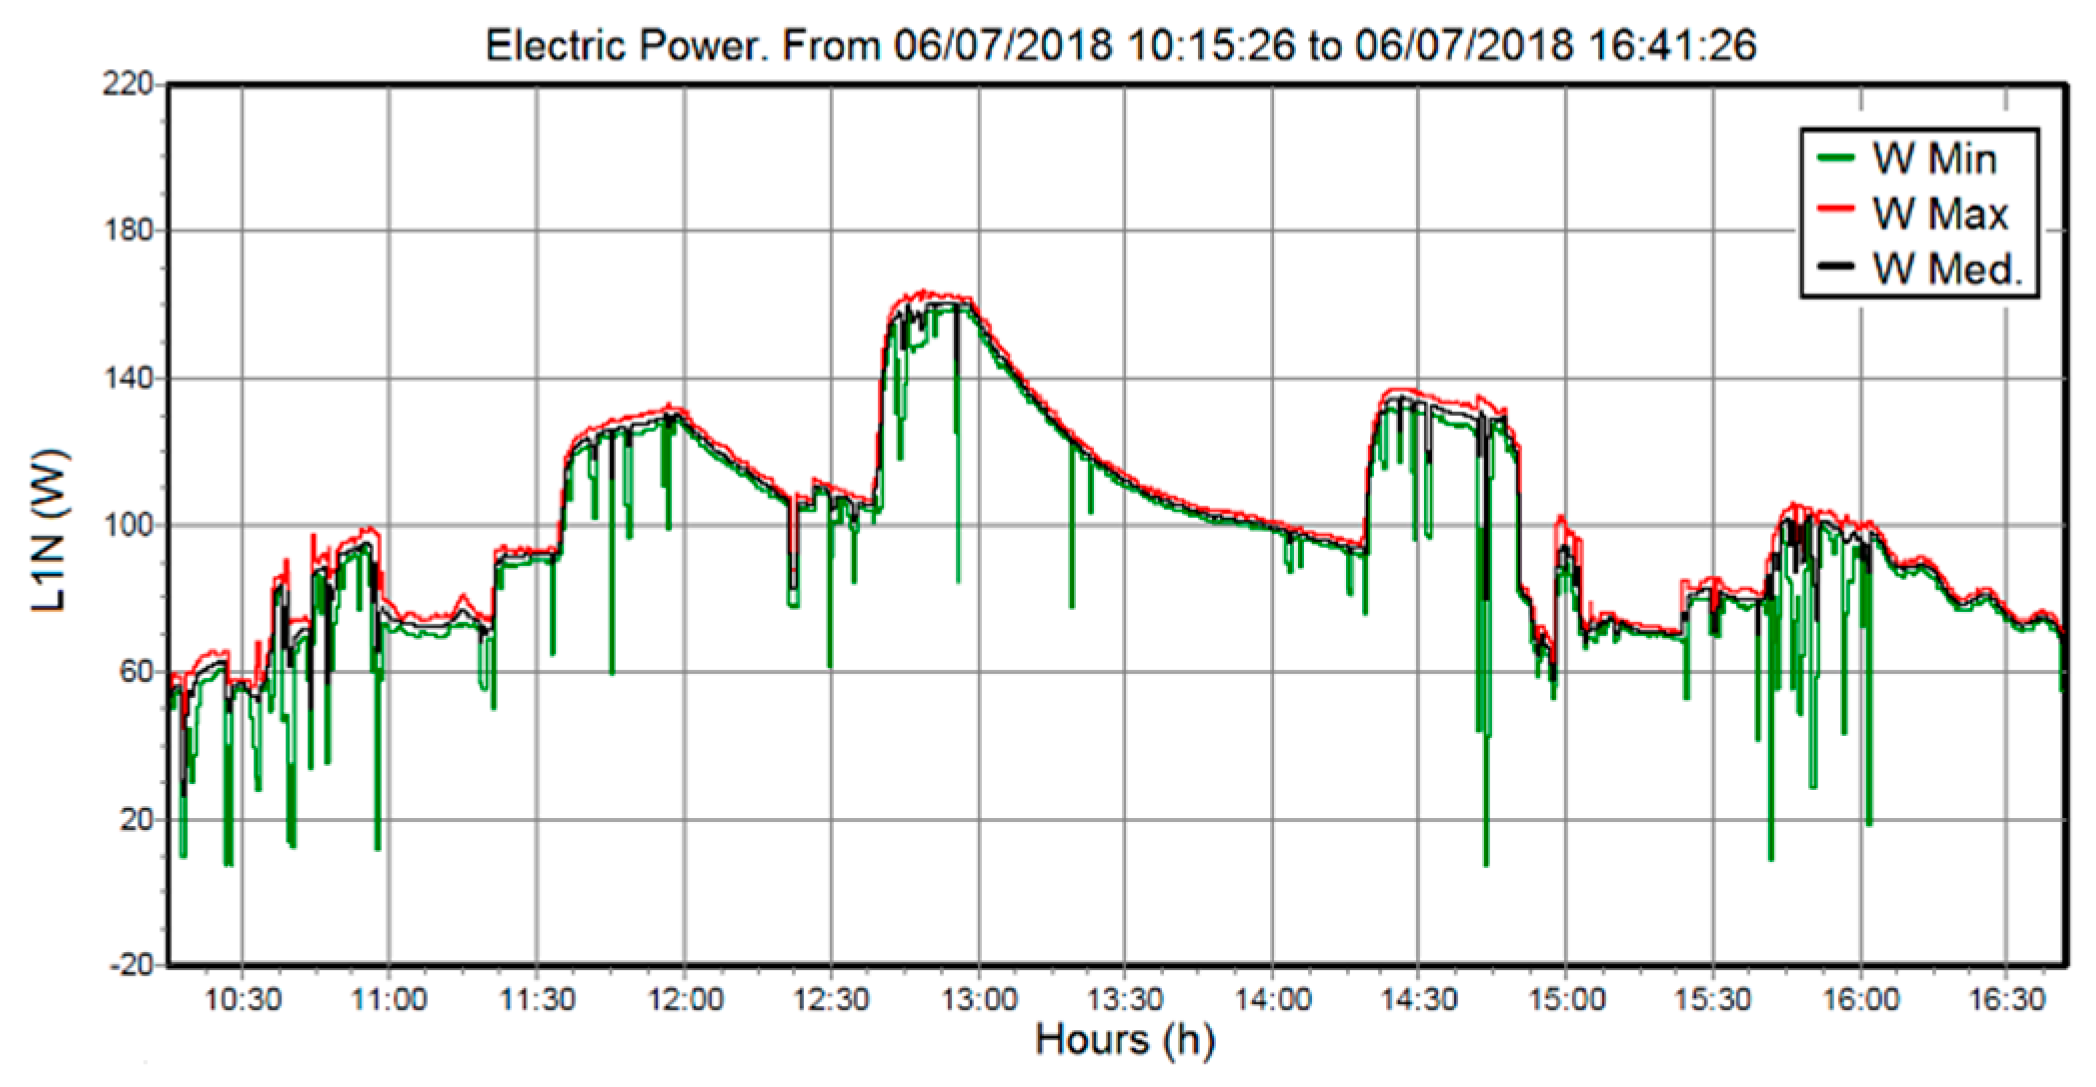
Experimental Results
4. Effects of Using Alternative Heat Transfer Fluids
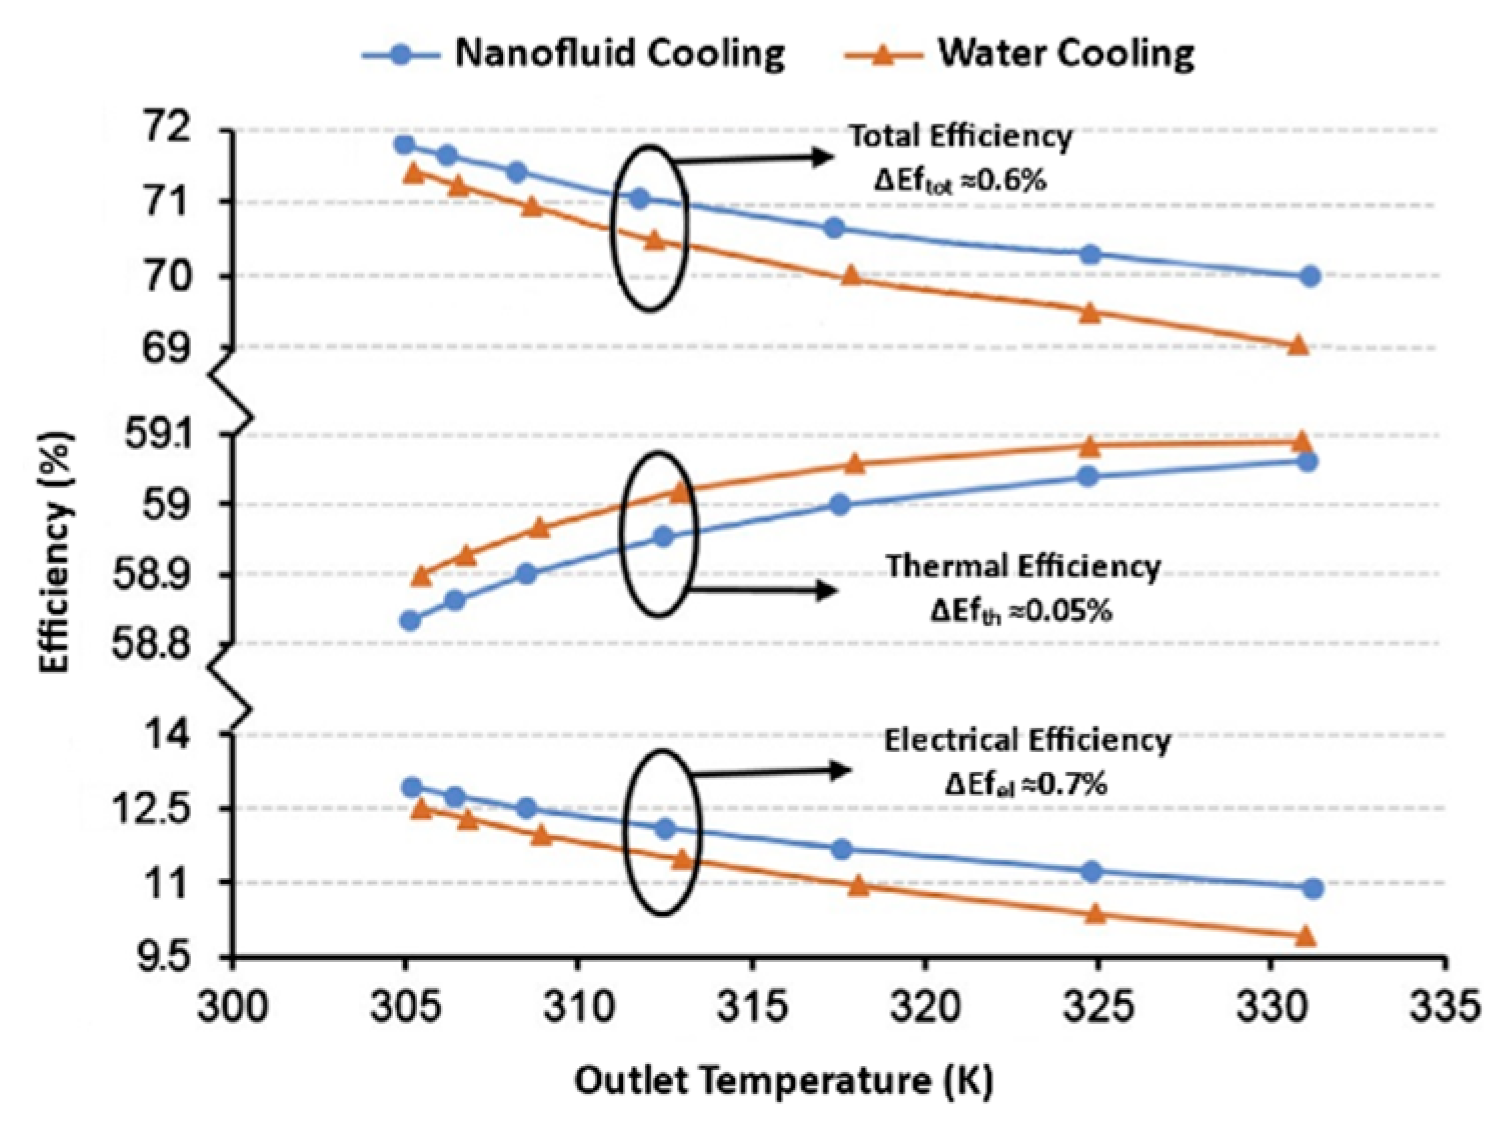
4.1. Global Efficiency
4.2. Corrosion and Erosion
5. Conclusions
Author Contributions
Funding
Acknowledgments
Conflicts of Interest
Nomenclature
| P | Density | kg/m3 |
| Cp | Heat capacity | J/(kg·K) |
| ε | Band Gap | eV |
| G | Irradiance | W/m2 |
| H | Heat transfer | |
| IM | Current maximum peak power | A |
| ISC | Short-circuit current | A |
| K | Boltzmann constant | J/K |
| M | Diode ideal factor | -------- |
| NS | Number of cells in series | -------- |
| P | Fluid pressure | Pa |
| Q | Heat source | W/m3 |
| q | Heat flux | W/m2 |
| q | Electron charge | C |
| T | Temperature | K |
| U | Fluid velocity | m/s |
| UMP | Voltage maximum peak power | V |
| V∞ | Wind speed | m/s |
| VT | Thermal voltage | V |
| κ | Thermal conductivity | W/(m·K) |
| M | Fluid viscosity | Pa |
References
- Zhu, H.; Wei, J.; Wang, K.; Wu, D. Applications of carbon materials in photovoltaic solar cells. The history of solar. Sol. Energy Mater. Sol. Cells 2011, 93, 1461–1470. [Google Scholar] [CrossRef]
- Sanjeev, J.; Soni, M.S.; Gakkhar, N. Historical and recent development of concentrating photovoltaic cooling technologies. Renew. Sustain. Energy Rev. 2016, 60, 41–59. [Google Scholar]
- Gong, J.; Sumathy, K. Active solar water heating systems. In Advances in Solar Heating and Cooling; Wang, R., Ed.; Woodhead: Cambridge, UK, 2016; pp. 203–224. [Google Scholar]
- Aberle, A.G. Surface passivation of crystalline silicon solar cells: A review. Prog. Photovoltaics: Res. Appl. 2000, 8, 473–487. [Google Scholar] [CrossRef]
- Ward, T. This is the Most Efficient Solar Panel Ever Made; World Economic Forum: Cologny, Switzerland, 2017. [Google Scholar]
- Tobergte, D.R.; Curtis, S. Concentrator Photovoltaics. Available online: http://link.springer.com/10.1007/978-3-540-68798-6 (accessed on 11 December 2018).
- Torres, J.P.N.; Fernandes, C.A.F.; Gomes, J.; Luc, B.; Giovinazzo, C.; Olsson, O.; Branco, P.J.C. Effect of reflector geometry in the annual received radiation of low concentration photovoltaic systems. Energies 2018, 11, 1878. [Google Scholar] [CrossRef]
- Heat Transfer Module User’s Guide; COMSOL: Los Angeles, CA, USA, 2017; Chapter 6; pp. 431–465.
- Torres, J.P.N.; Nashih, S.K.; Fernandes, C.A.F.; Leite, J.C. The effect of shading on photovoltaic solar panels. In Energy Systems; Springer: Basel, Switzerland, 2018; Volume 9, pp. 195–208. [Google Scholar]
- Marques, L.; Torres, J.P.N.; Costa Branco, P.J. Triangular shape geometry in a Solarus AB concentrating photovoltaic-thermal collector. Int. J. Interact. Des. Manuf. 2018, 12, 1–14. [Google Scholar] [CrossRef]
- Samuel, K.; Nashih, C.A.F.; Fernandes, J.P.N.; Torres, J.G.; Costa Branco, P.J. Validation of a simulation model for analysis of shading effects on photovoltaic panels. J. Sol. Energy Eng. 2016, 138, 044503. [Google Scholar]
- Andreoli, M.; Torres, J.P.N.; Fernandes, C.A.F. Water dynamics simulation in the system pipes of a concentrated photovoltaic-thermal collector solar painel. Int. J. Interact. Des. Manuf. 2018, 12, 1–7. [Google Scholar] [CrossRef]
- COMSOL. Multiphysics Reference Manual; COMSOL: Los Angeles, CA, USA, 2017; Chapter 13; pp. 782–786. [Google Scholar]
- Defraeye, T.; Blocken, B.; Carmeliet, J. Convective heat transfer coefficients for exterior building surfaces: Existing correlations and CFD modelling. Energy Convers. Manag. 2011, 52, 512–522. [Google Scholar] [CrossRef] [Green Version]
- Blocken, B.; Defraeye, T.; Derome, D.; Carmeliet, J. High-resolution CFD simulations for forced convective heat transfer coefficients at the facade of a low-rise building. Build. Environ. 2009, 44, 2396–2412. [Google Scholar] [CrossRef]
- Hocksun Kwan, T.; Yao, Q. Thermodynamic and transient analysis of the hybrid concentrated photovoltaic panel and vapour compression cycle thermal system for combined heat and power applications. Energy Convers. Manag. 2019, 185, 232–247. [Google Scholar] [CrossRef]
- Cygan, D.; Abbasi, H.; Kozlov, A.; Pondo, J.; Winston, R.; Widyolar, B.; Osowski, M. Full spectrum solar system: Hybrid concentrated photovoltaic/concentrated solar power (CPV-CSP). MRS Adv. 2016, 1, 2941–2946. [Google Scholar] [CrossRef]
- An, W.; Zhang, J.; Zhu, T.; Gao, N. Investigation on a spectral splitting photovoltaic/thermal hybrid system based on polypyrrole nanofluid: Preliminary test. Renew. Energy 2016, 86, 633–642. [Google Scholar] [CrossRef]
- Hamed, O.; Torabi, A.; Ahmadi, M.H.; Bahiraei, M.; Goodarzi, M.; Safaei, M.R. Application of nanofluids in thermal performance enhancement of parabolic trough solar collector: State-of-the-art. Appl. Sci. 2019, 9, 463. [Google Scholar]
- Bubbico, R.; Celata, G.P.; D’Annibale, F.; Mazzarotta, B.; Menale, C. Experimental analysis of corrosion and erosion phenomena on metal surfaces by nanofluids. Chem. Eng. Res. Des. 2015, 104, 605–614. [Google Scholar] [CrossRef]
- Liang, M.; Melchers, R.; Chaves, I. Corrosion and pitting of 6060 series aluminium after 2 years exposure in seawater splash, tidal and immersion zones. Corros. Sci. 2018, 140, 286–296. [Google Scholar] [CrossRef]
- Gimenez, P.; Rameau, J.J.; Reboul, M.C. Experimental pH potential diagram of aluminium for sea water. Corrosion 1981, 37, 673–681. [Google Scholar] [CrossRef]
- Vargel, C. Corrosion of Aluminium, 1st ed.; Elsevier: Amsterdam, The Netherlands, 2004. [Google Scholar]
- Abd El-Samie, M.M.; Ju, X.; Xu, C.; Du, X.; Zhu, Q. Numerical study of a photovoltaic/thermal hybrid system with nanofluid based spectral beam filters. Energy Convers. Manag. 2018, 174, 686–704. [Google Scholar] [CrossRef]


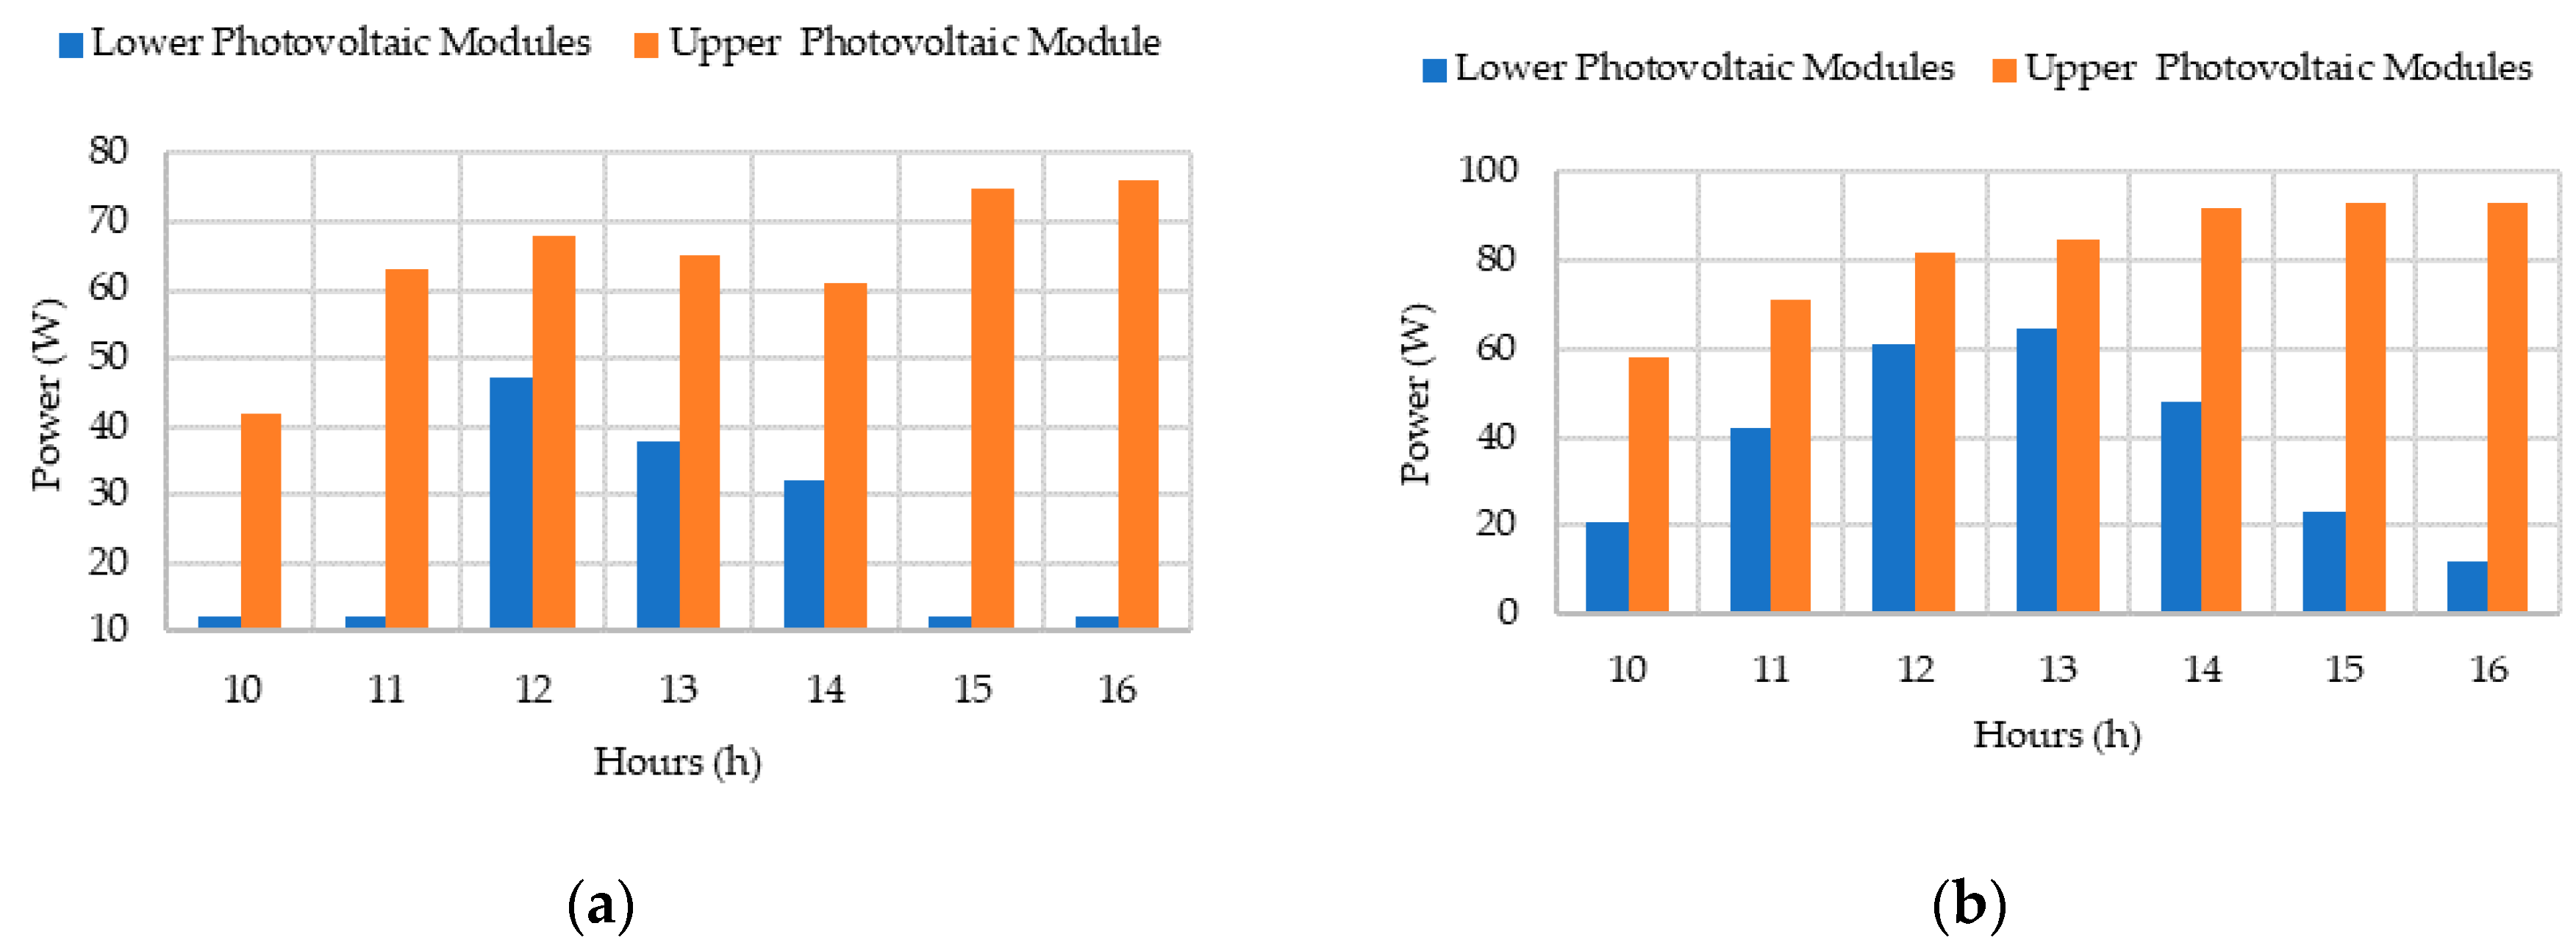
| Hours | Model Results | Error | ||
|---|---|---|---|---|
| Pup [W] | Plow [W] | Pup [%] | Plow [%] | |
| 10:00 | 44.65 | 11.41 | 6.31 | 4.92 |
| 11:00 | 55.81 | 12.22 | 11.41 | 1.83 |
| 12:00 | 60.40 | 52.44 | 11.17 | 11.57 |
| 13:00 | 58.06 | 40.25 | 10.68 | 5.92 |
| 14:00 | 62.45 | 35.72 | 2.38 | 11.66 |
| 15:00 | 78.04 | 13.23 | 4.05 | 10.25 |
| 16:00 | 77.78 | 12.78 | 2.34 | 6.50 |
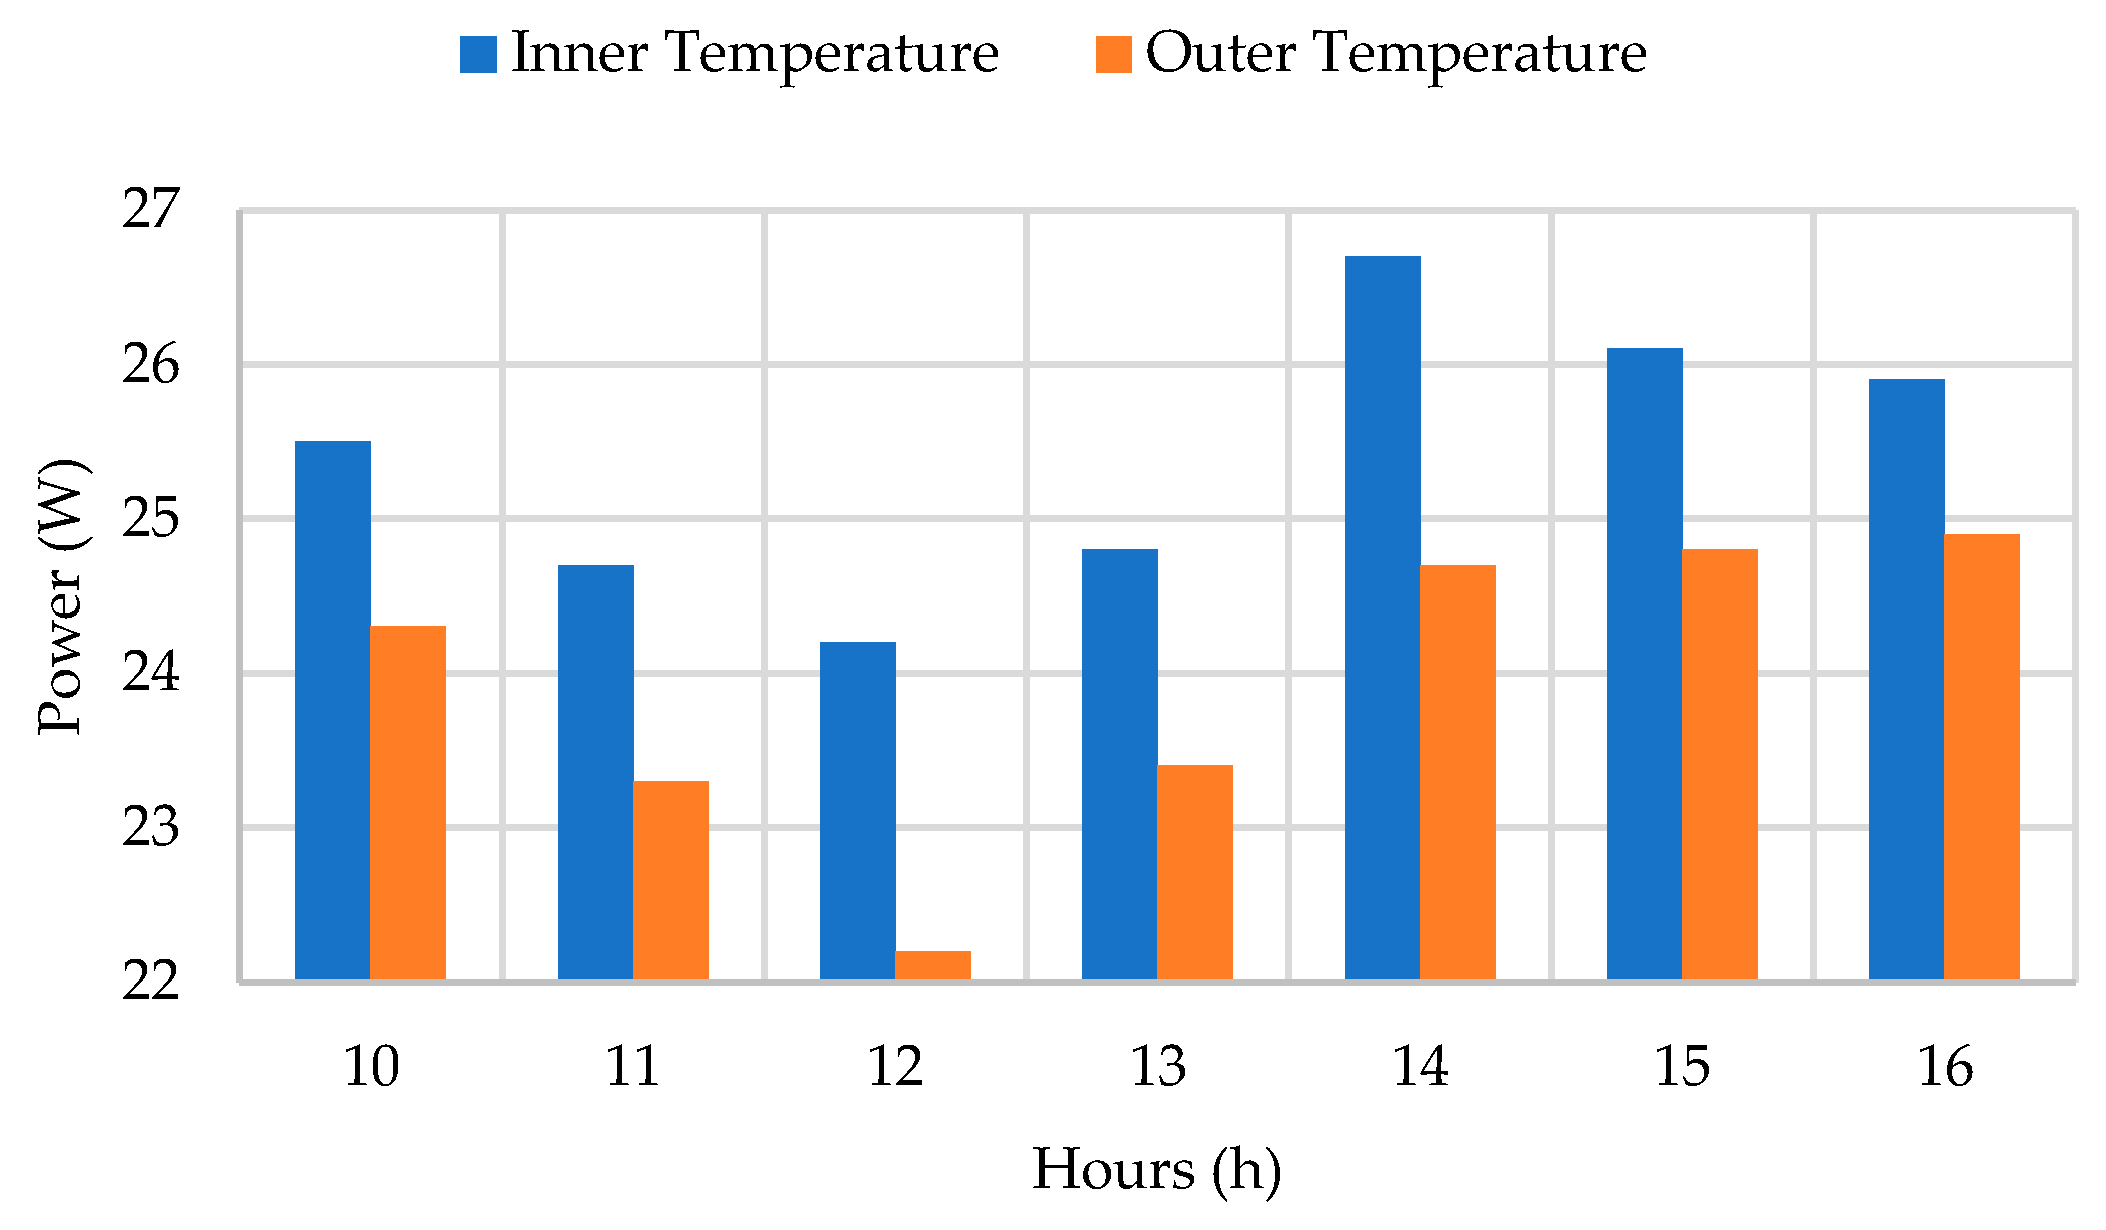
| Hours | Model Results | Error | |||
|---|---|---|---|---|---|
| Pup [W] | Plow [W] | ΔT [°C] | Pup [%] | Plow [%] | |
| 10:00 | 58.51 | 18.0 | 1.40 | 0,88 | 14.29 |
| 11:00 | 72.25 | 47.23 | 1.83 | 1,76 | 12.45 |
| 12:00 | 75.55 | 68.33 | 2.56 | 7,87 | 12.02 |
| 13:00 | 76.87 | 73.65 | 1.77 | 9,56 | 13.31 |
| 14:00 | 104.81 | 54.18 | 2.08 | 13,92 | 12.88 |
| 15:00 | 100.34 | 25.44 | 1.66 | 7,89 | 10.61 |
| 16:00 | 101.79 | 13.89 | 1.44 | 9,45 | 15.75 |
| Nanofluid | Observed Results Description | pH |
|---|---|---|
| Al2O3-9% | High deterioration effect, with 182 μm decrease in thickness of the area exposed to the fluid. | 8.8 |
| Al2O3-3% | Very strong corrosion effect and a considerable decrease in the sample targets thickness (263 μm). | 8.6 |
| TiO2-9% | Damaging similar to the water. Incrustation of nanoparticles deposit. | 7.3 |
| SiC-3% | No significant corrosion effects when compared to water. | 5.9 |
© 2019 by the authors. Licensee MDPI, Basel, Switzerland. This article is an open access article distributed under the terms and conditions of the Creative Commons Attribution (CC BY) license (http://creativecommons.org/licenses/by/4.0/).
Share and Cite
Campos, C.S.; Torres, J.P.N.; Fernandes, J.F.P. Effects of the Heat Transfer Fluid Selection on the Efficiency of a Hybrid Concentrated Photovoltaic and Thermal Collector. Energies 2019, 12, 1814. https://doi.org/10.3390/en12091814
Campos CS, Torres JPN, Fernandes JFP. Effects of the Heat Transfer Fluid Selection on the Efficiency of a Hybrid Concentrated Photovoltaic and Thermal Collector. Energies. 2019; 12(9):1814. https://doi.org/10.3390/en12091814
Chicago/Turabian StyleCampos, Catarina Sofia, João Paulo N. Torres, and João F. P. Fernandes. 2019. "Effects of the Heat Transfer Fluid Selection on the Efficiency of a Hybrid Concentrated Photovoltaic and Thermal Collector" Energies 12, no. 9: 1814. https://doi.org/10.3390/en12091814