Design and Simulation of an Energy Homeostaticity System for Electric and Thermal Power Management in a Building with Smart Microgrid

 ,
, 
Abstract
:1. Introduction
1.1. Understanding the Electric Utilities’ Perspective in Today’s Distribution Market
1.2. Microgrid Control and Its Integration with the Utilities
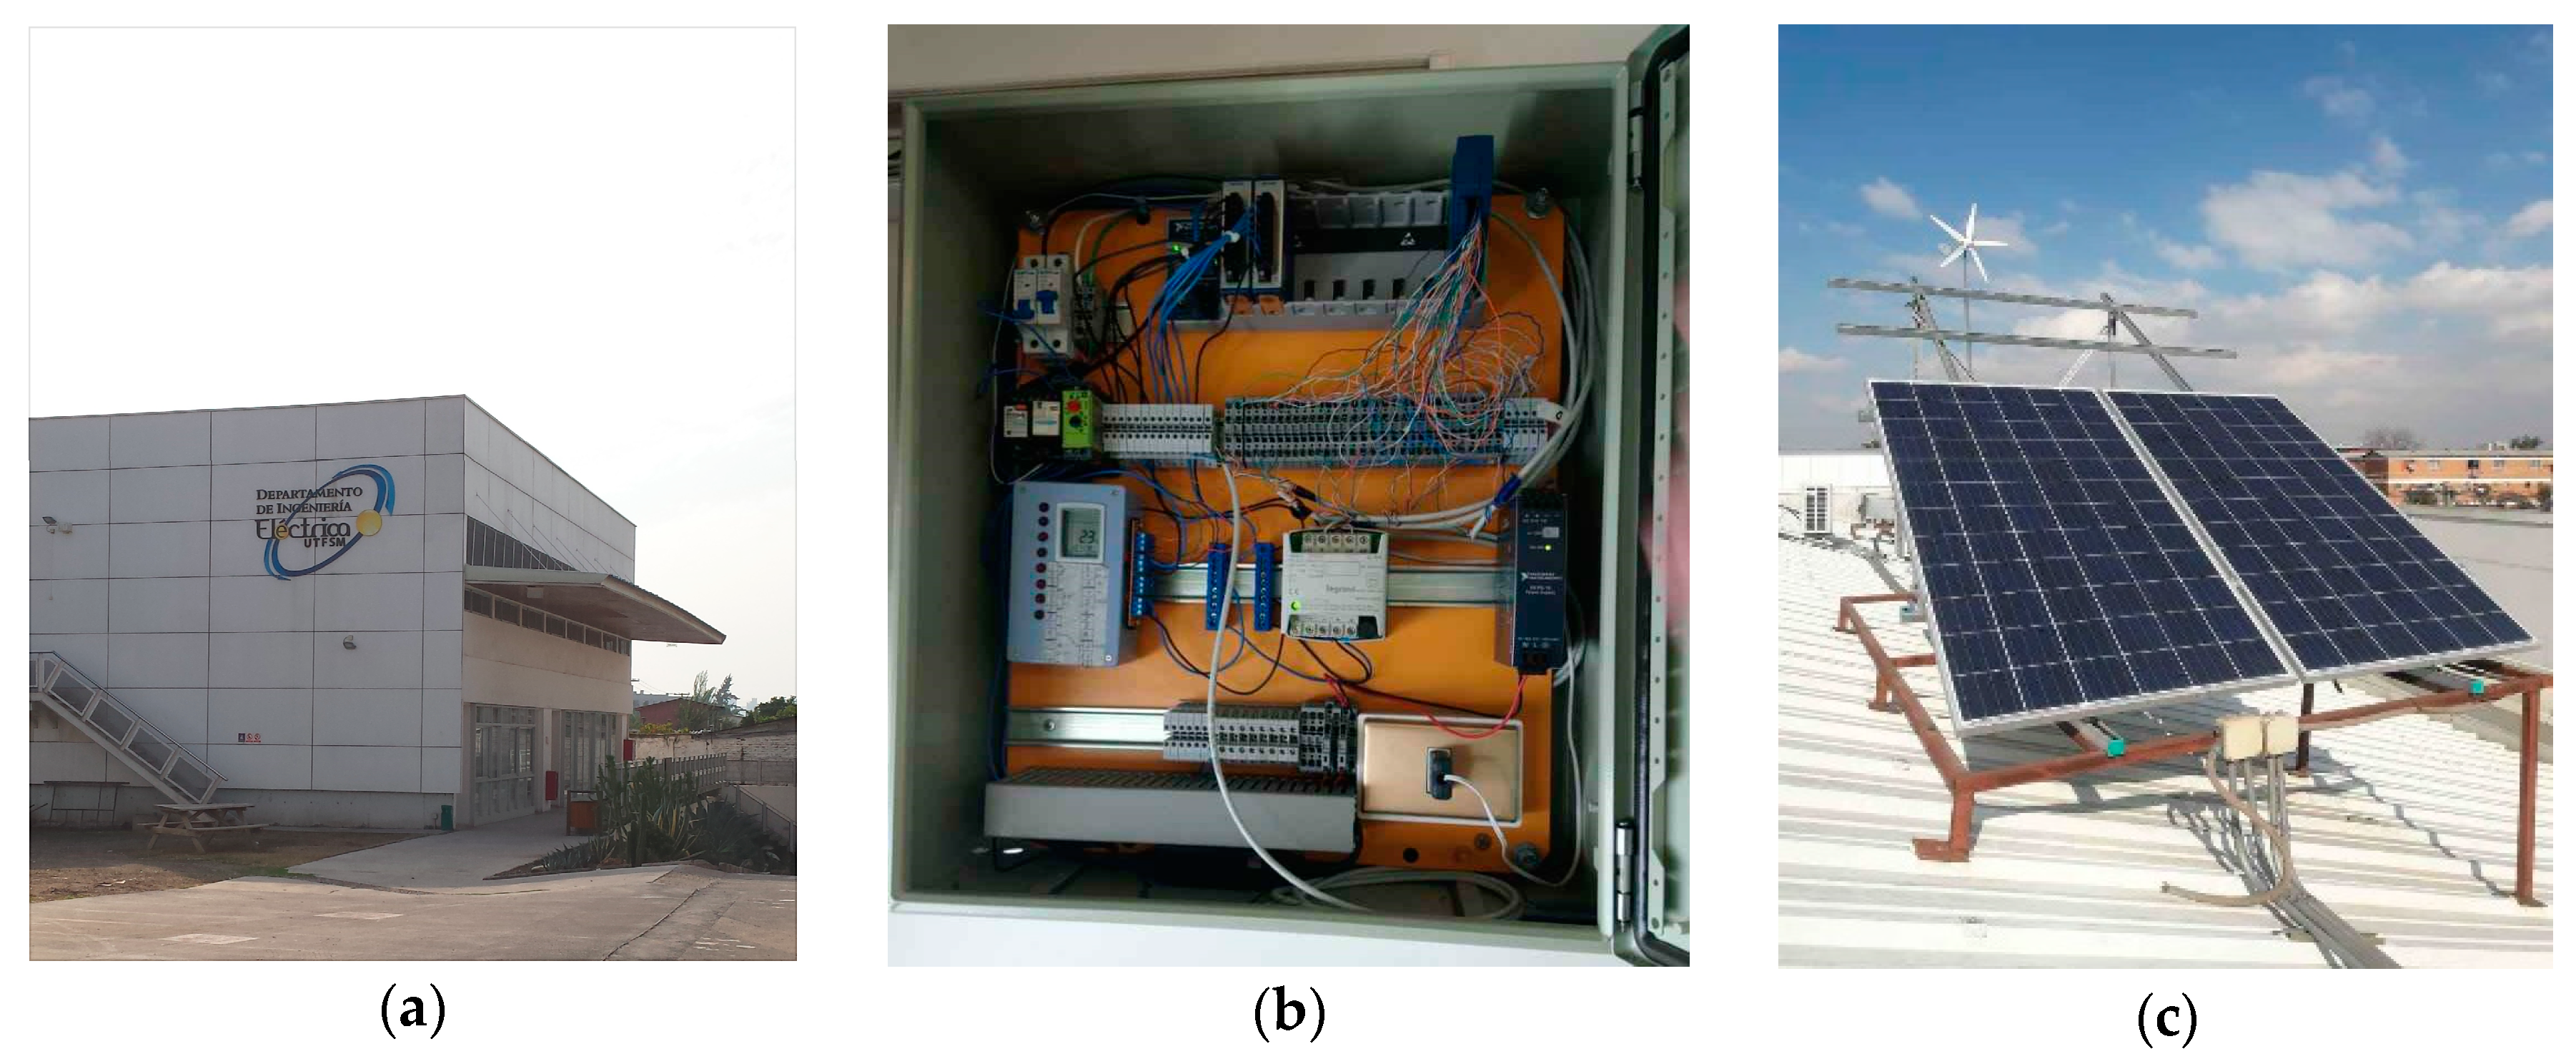
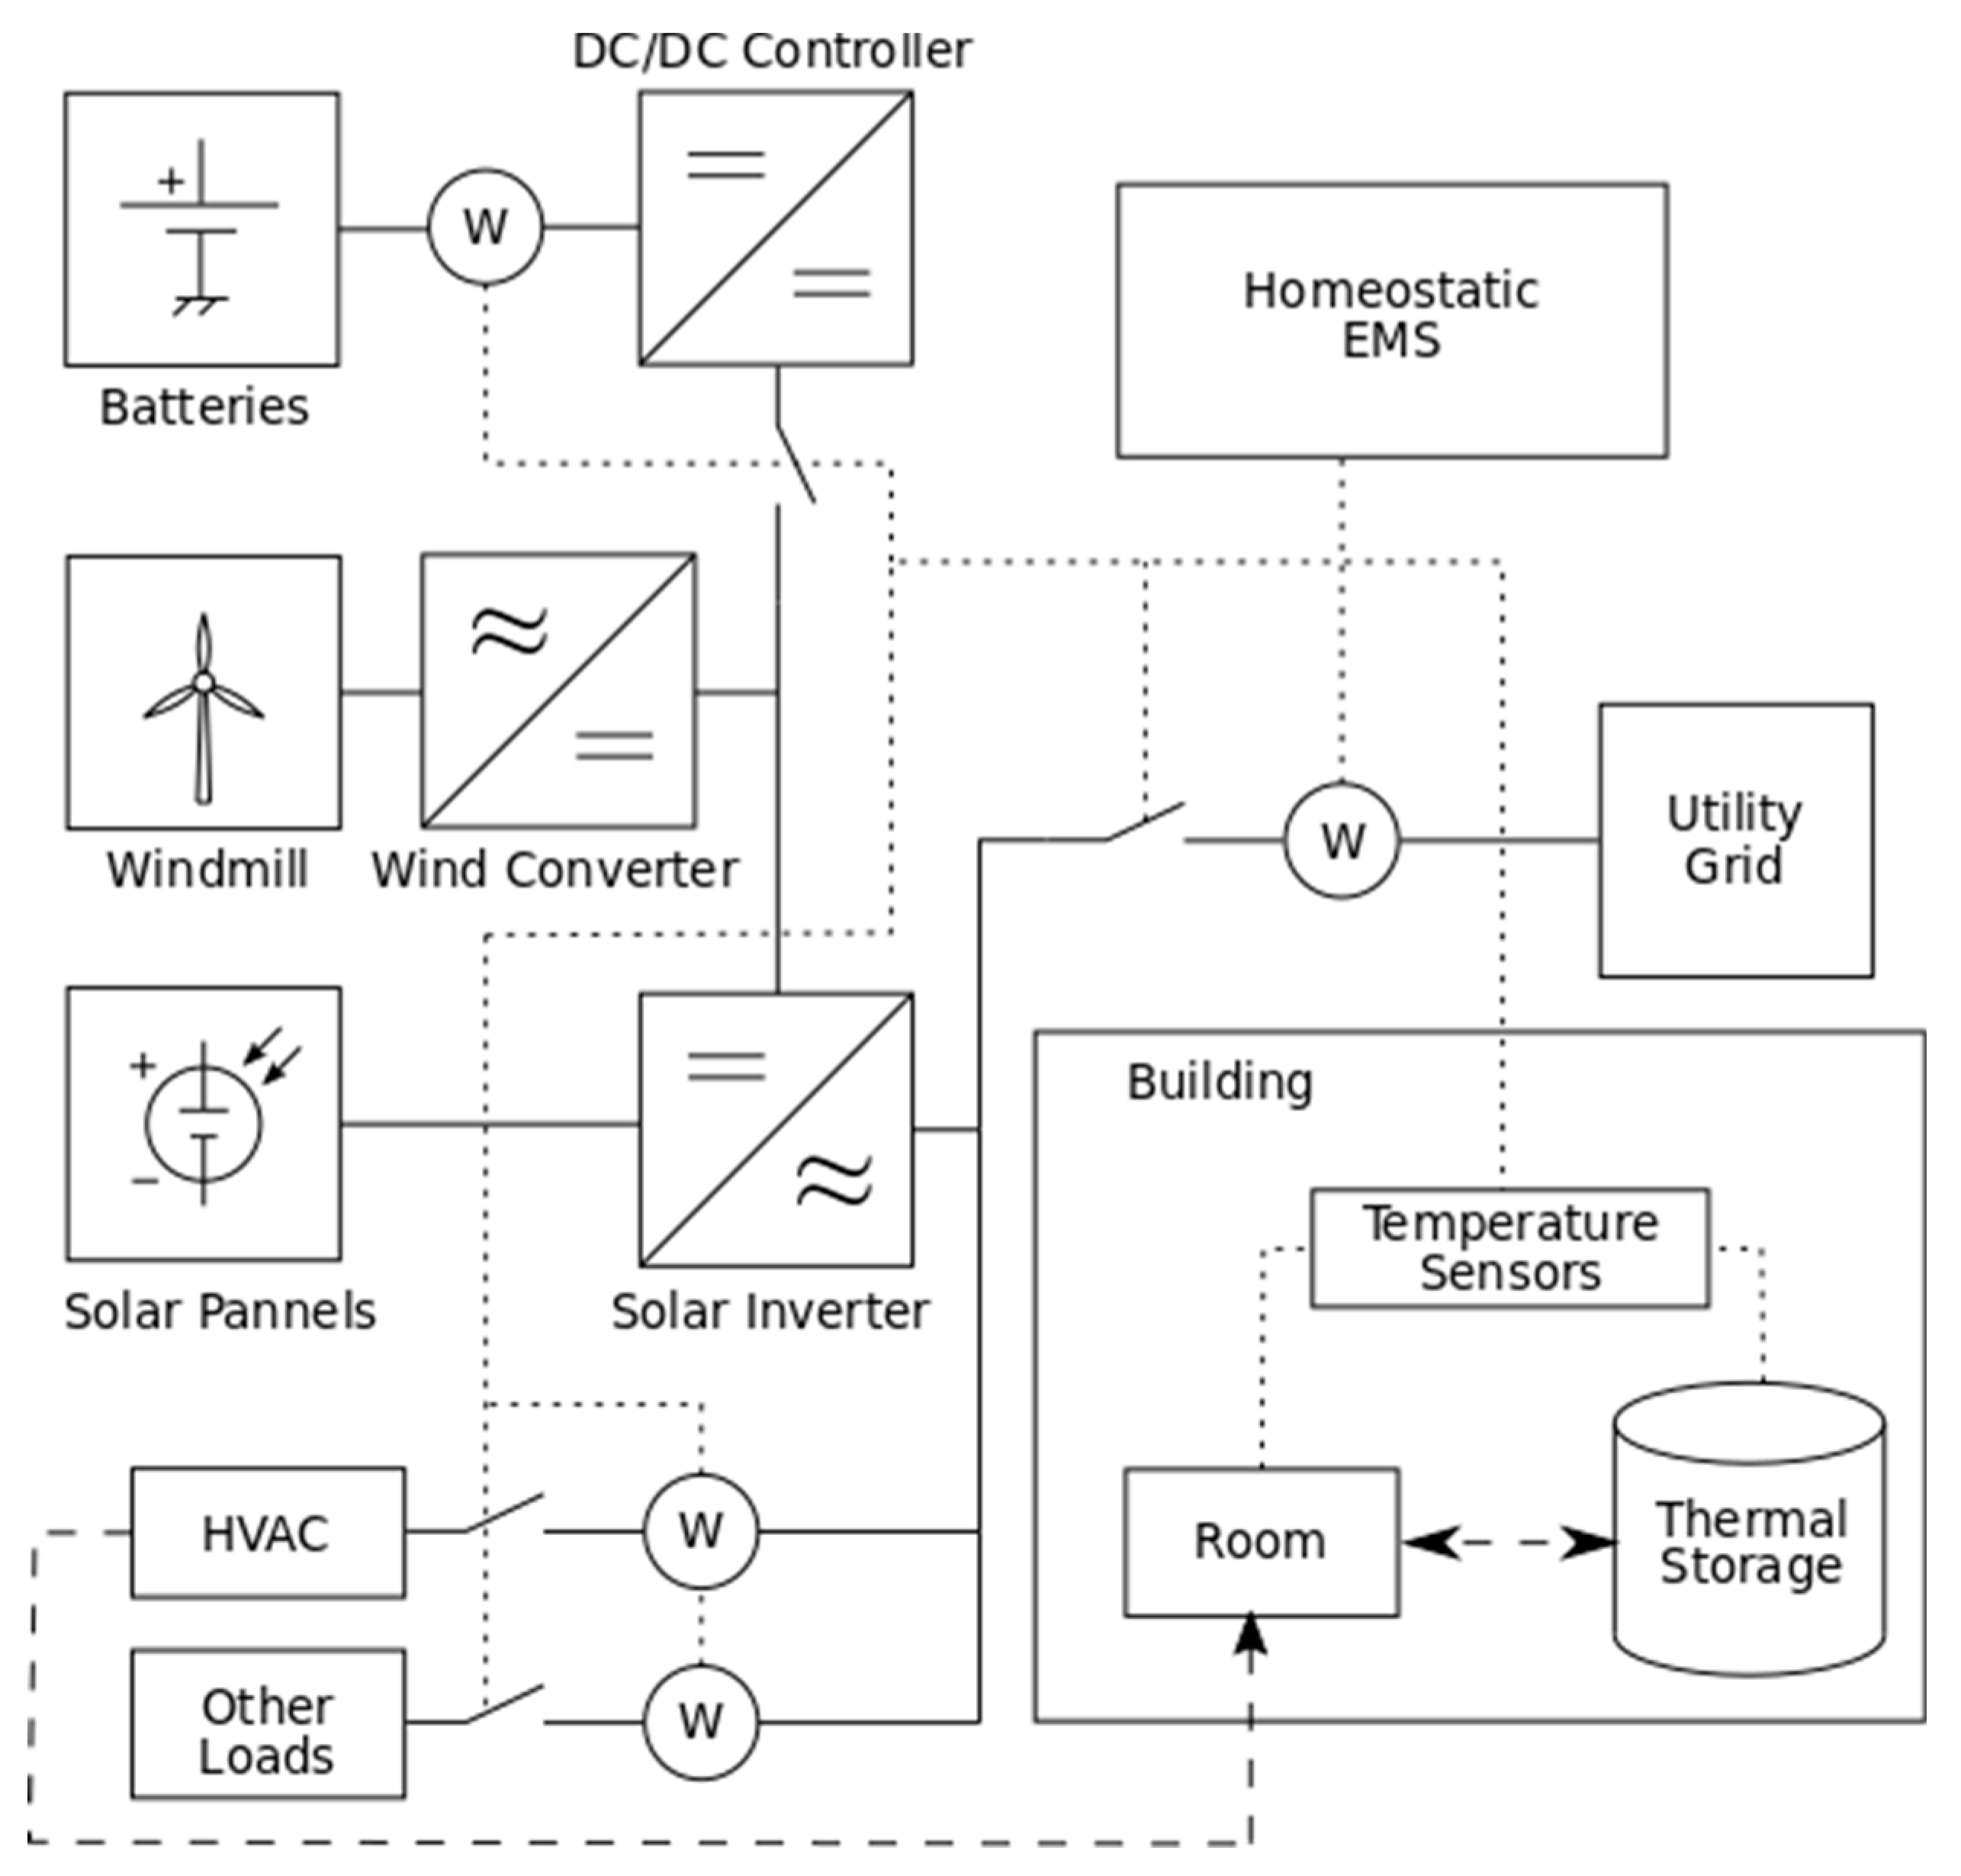
2. Microgrid Laboratory
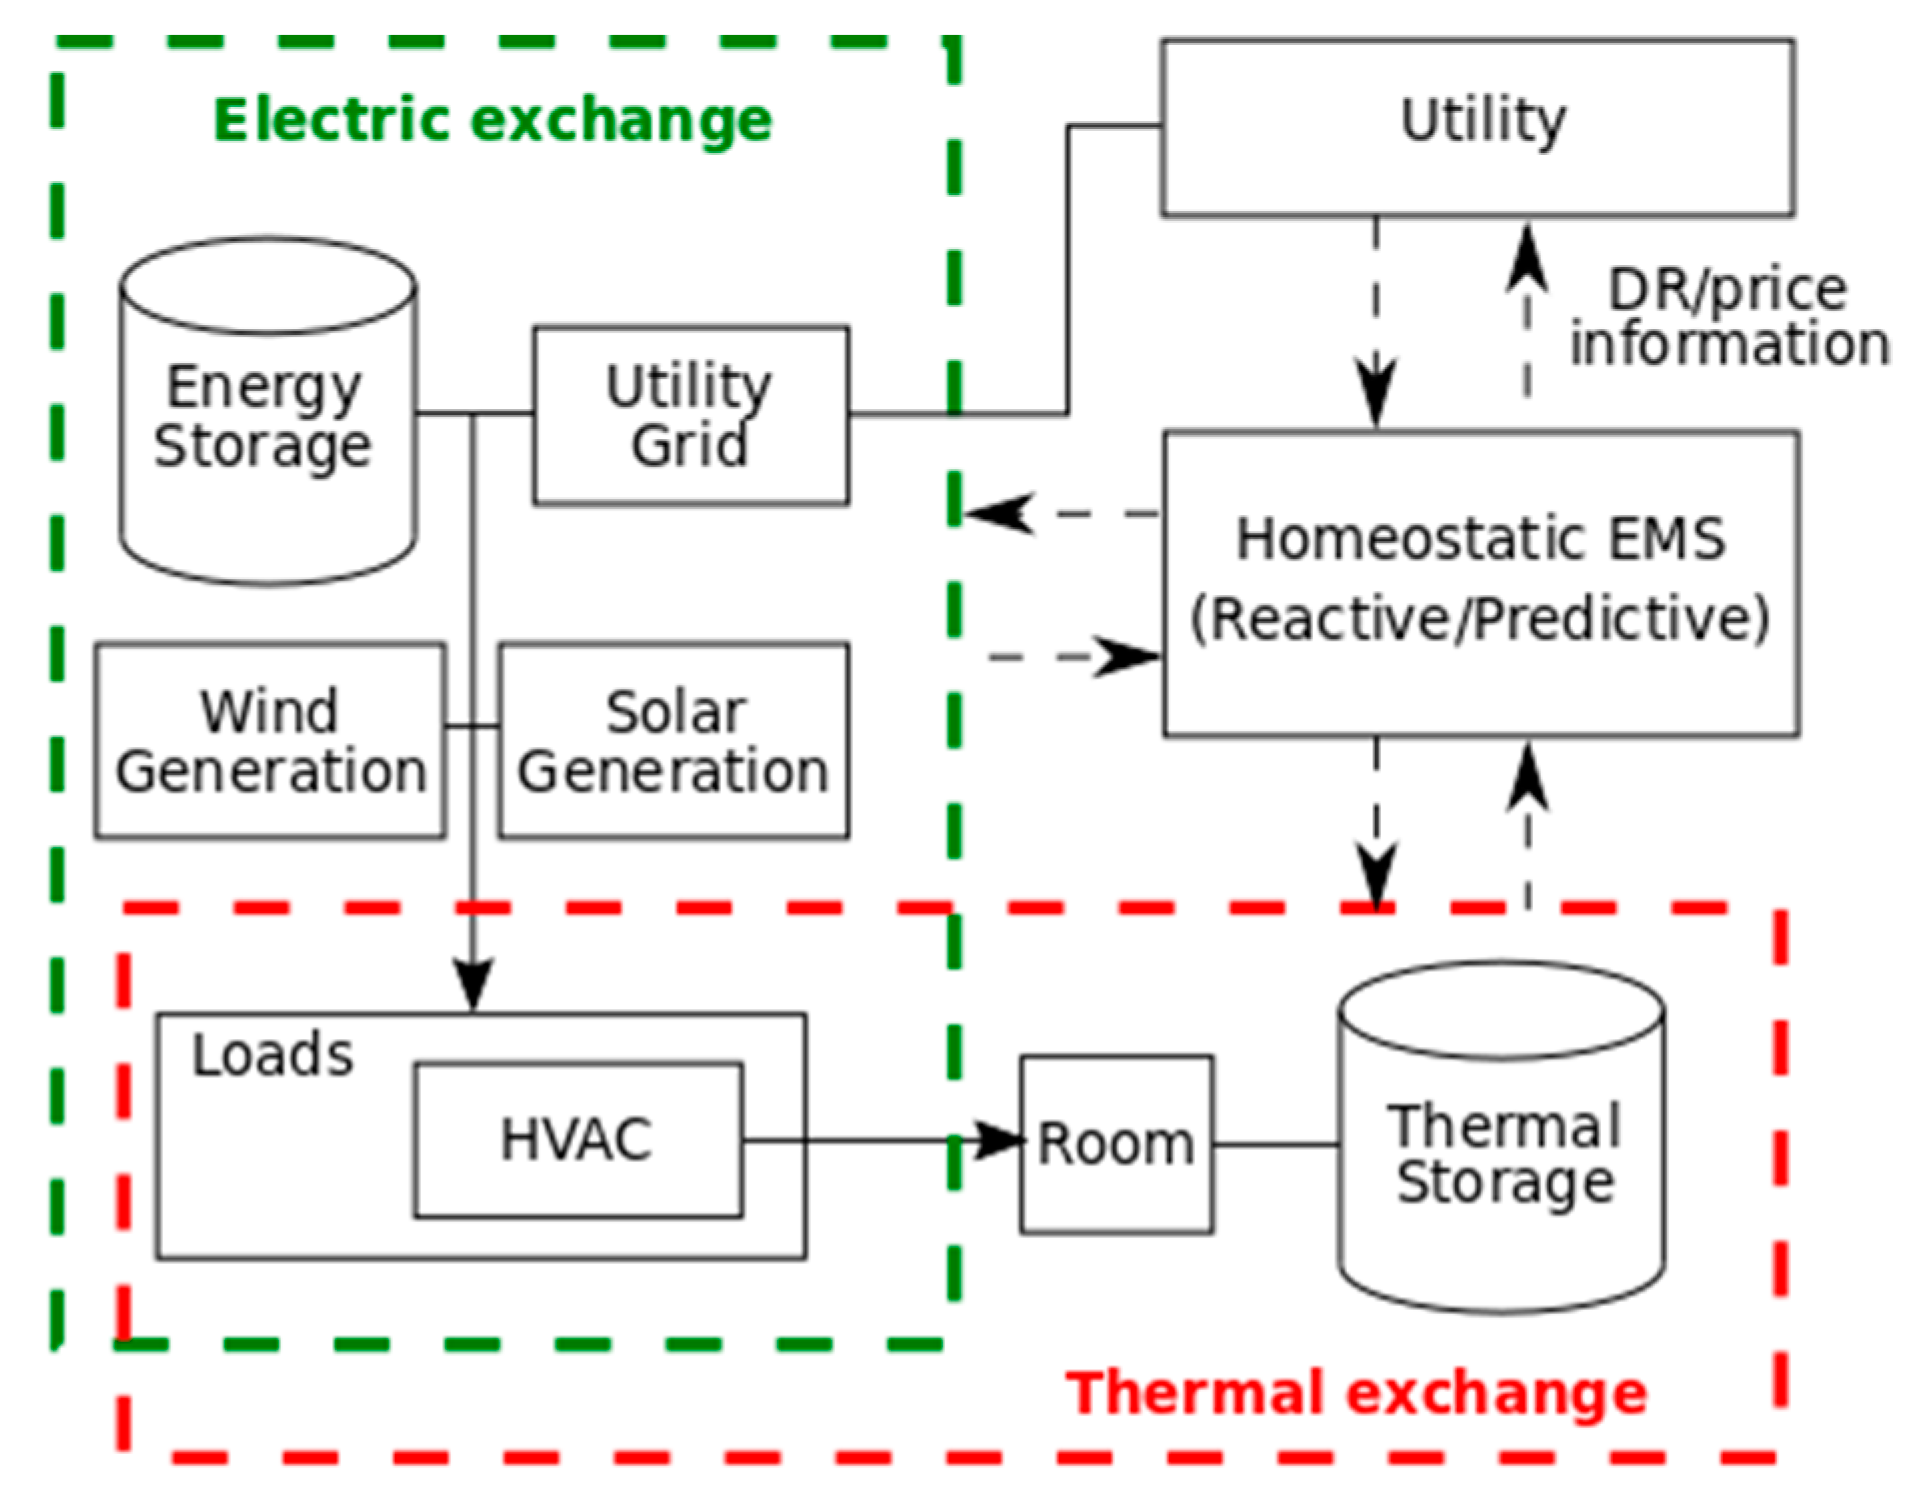
2.1. Energy Fluxes
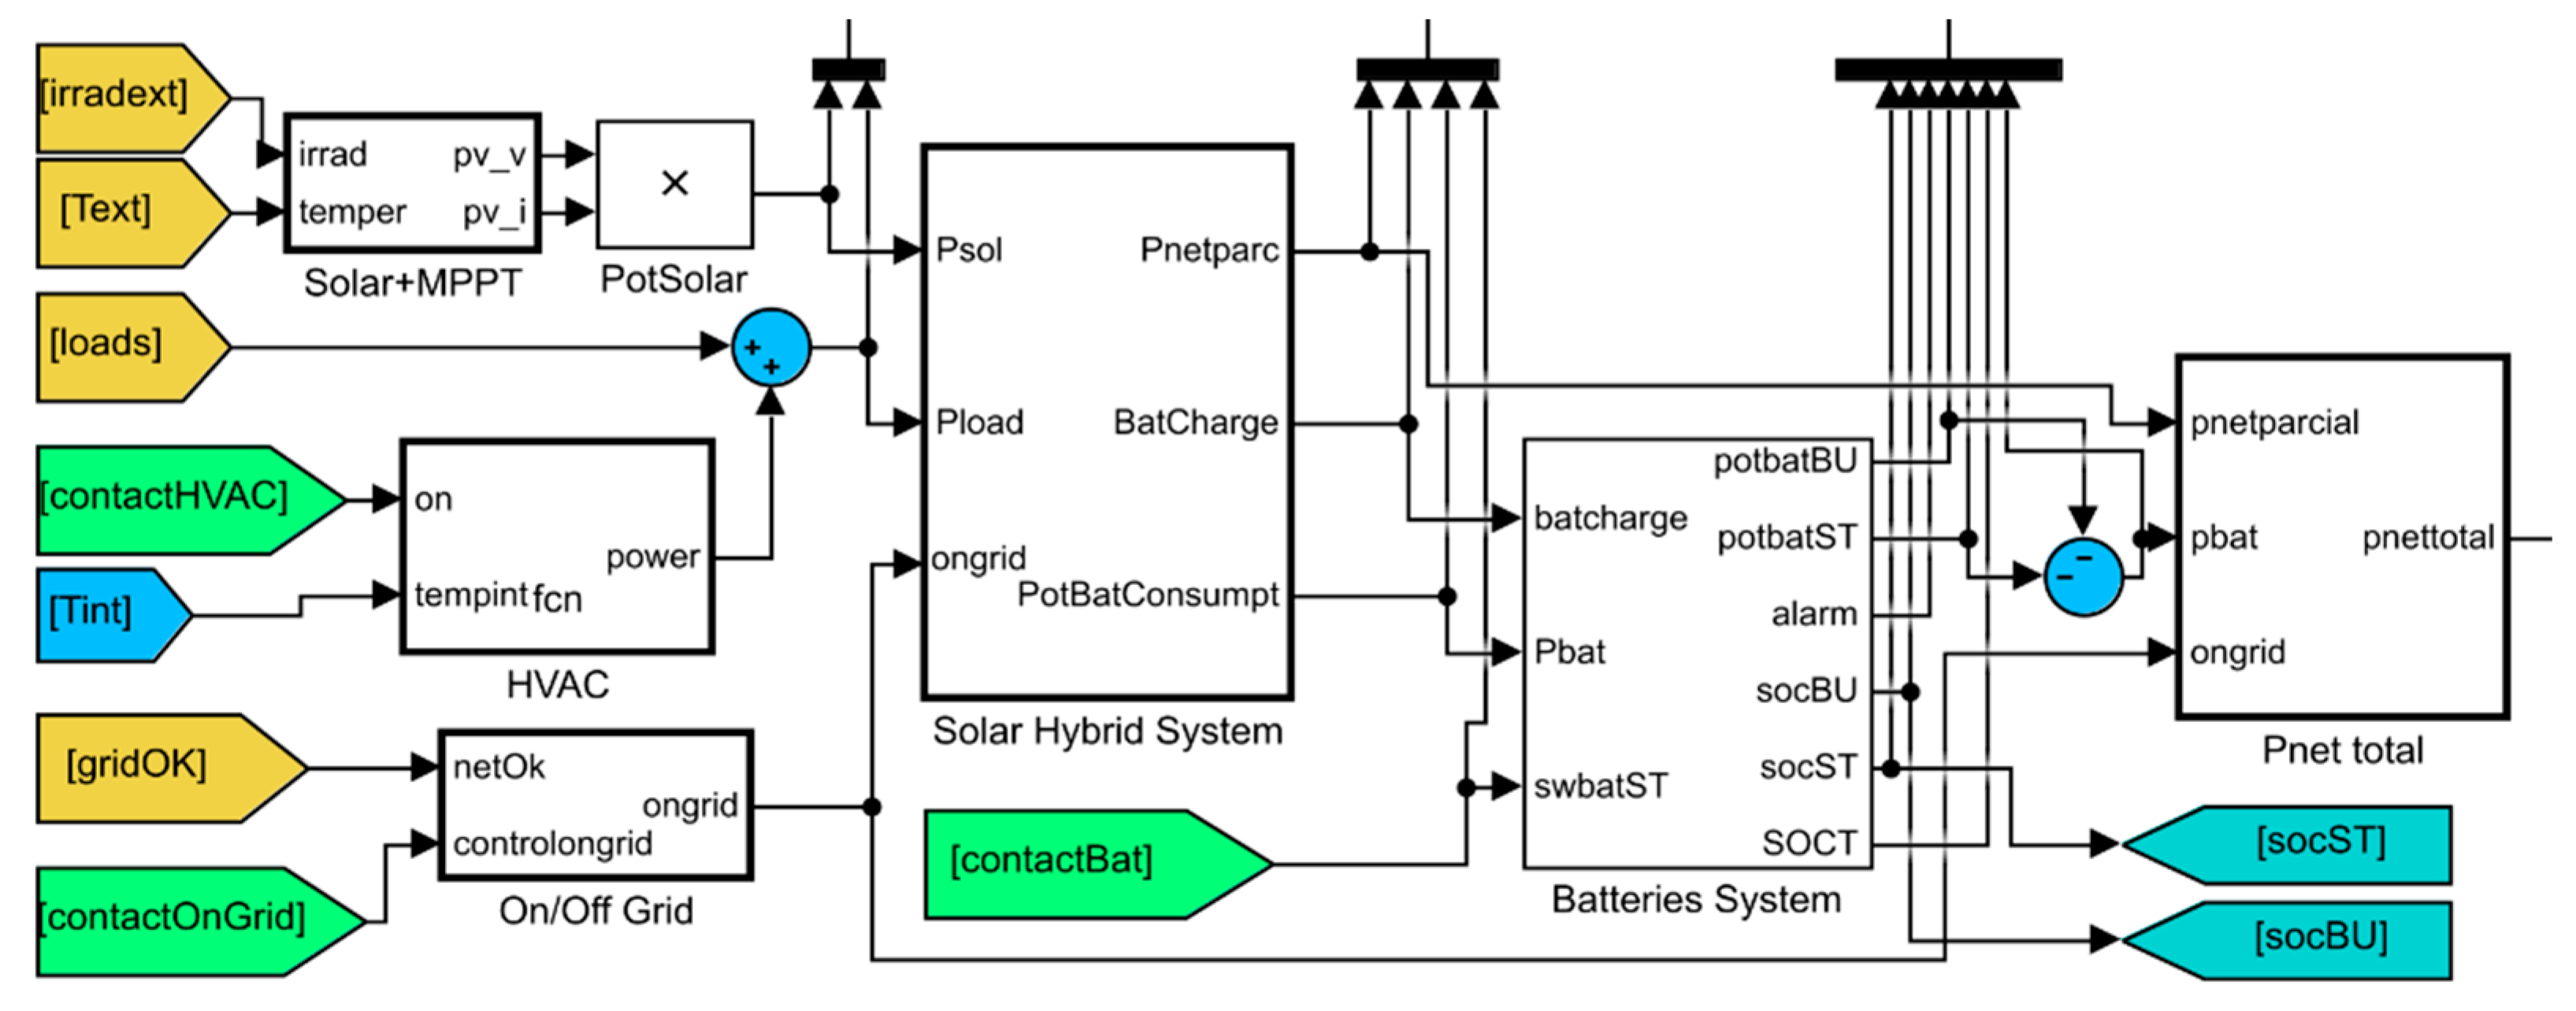
2.2. Simulation Model
2.3. The Power and Energy Management Model by Means of Energy Homeostaticity
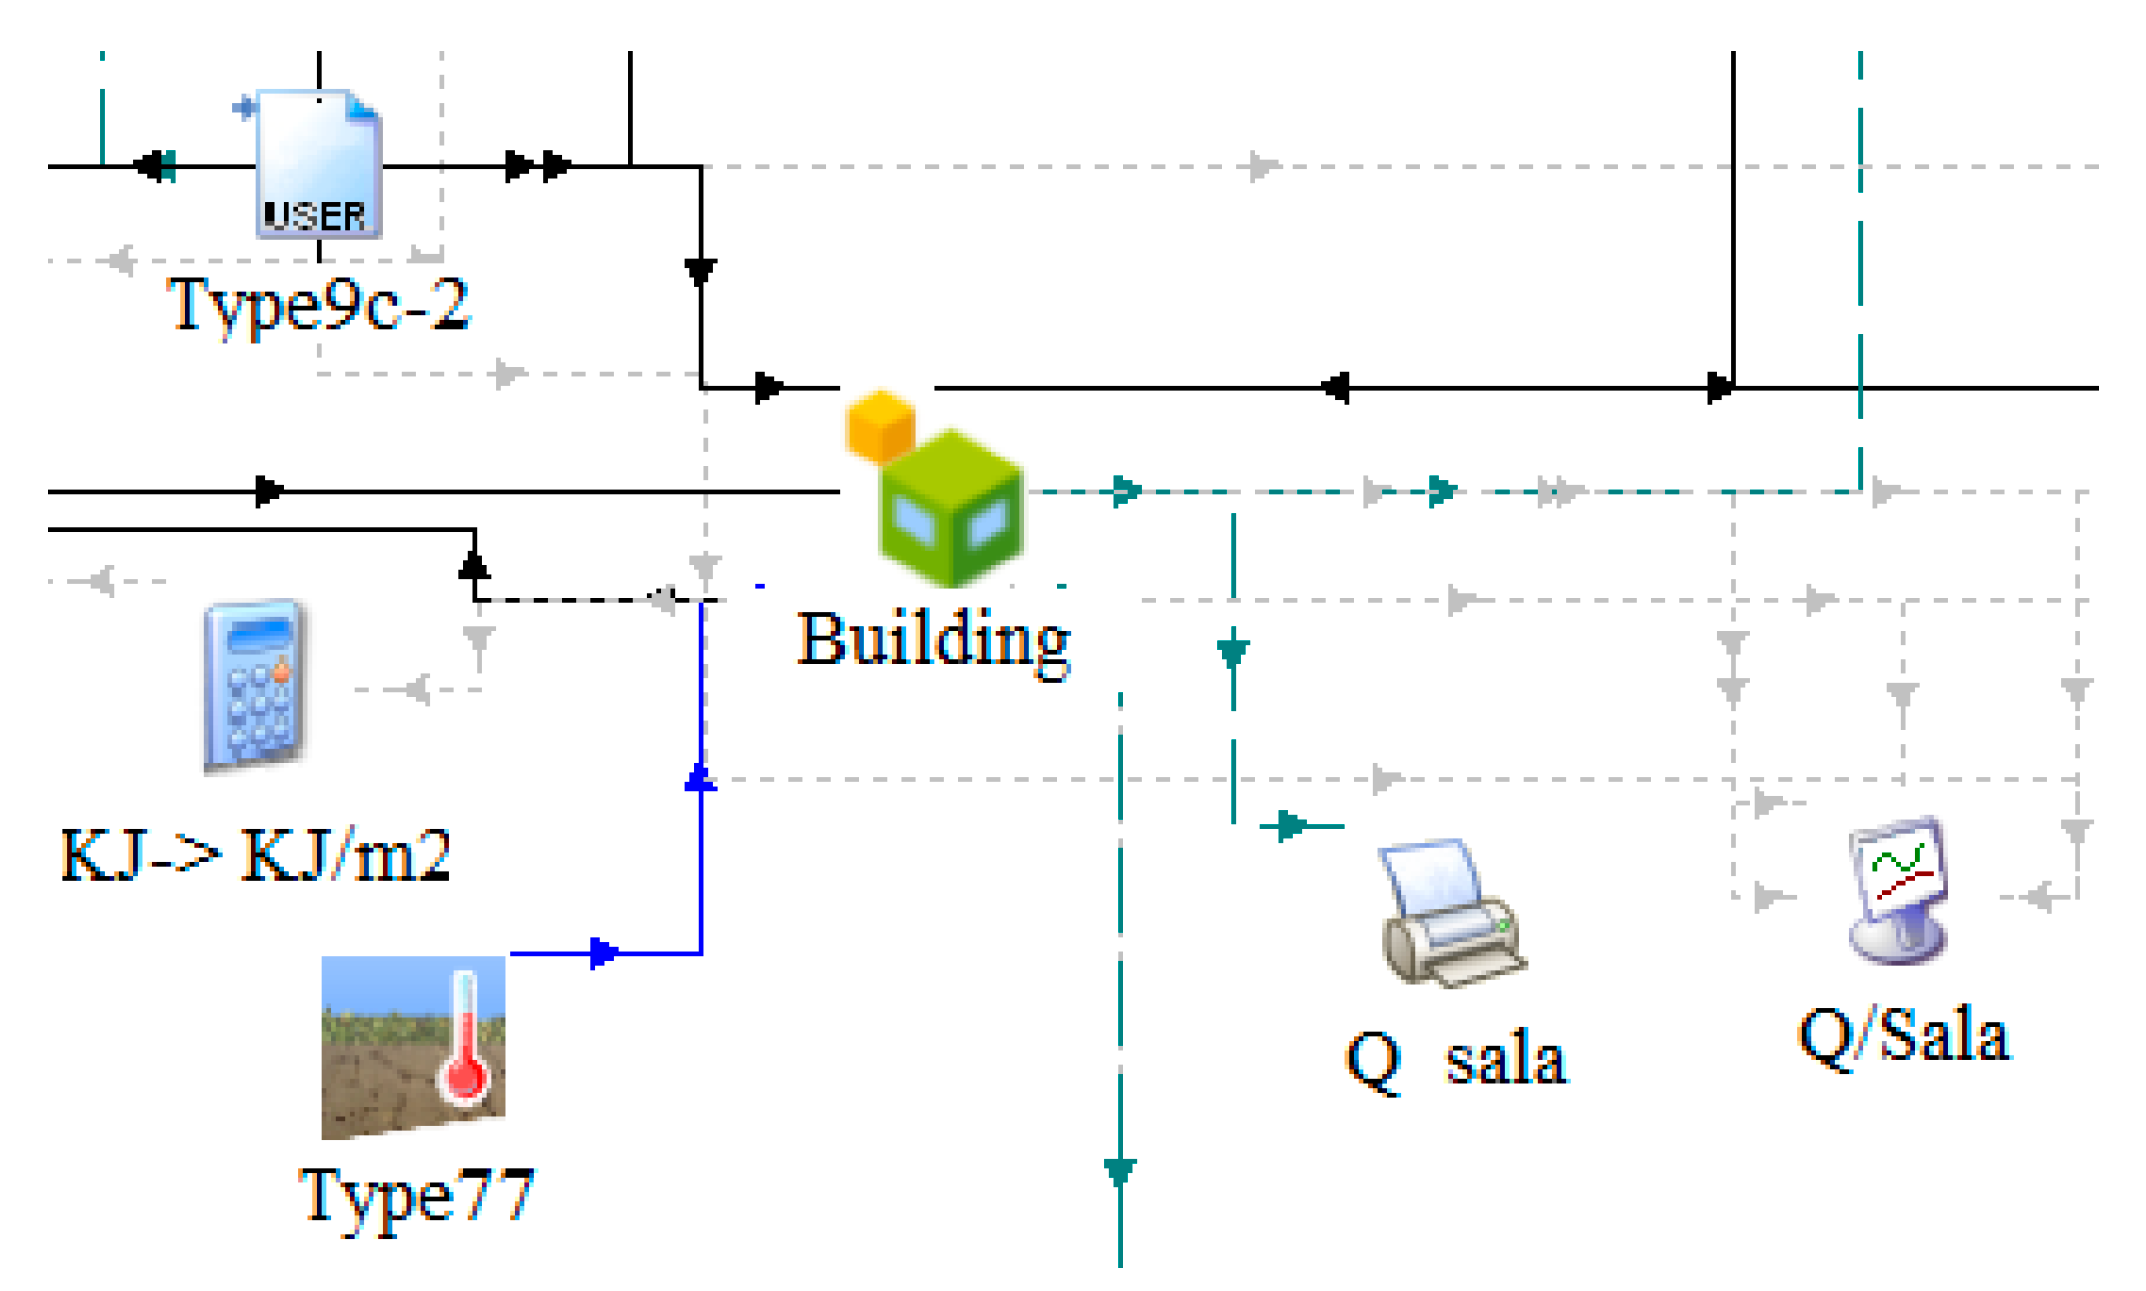
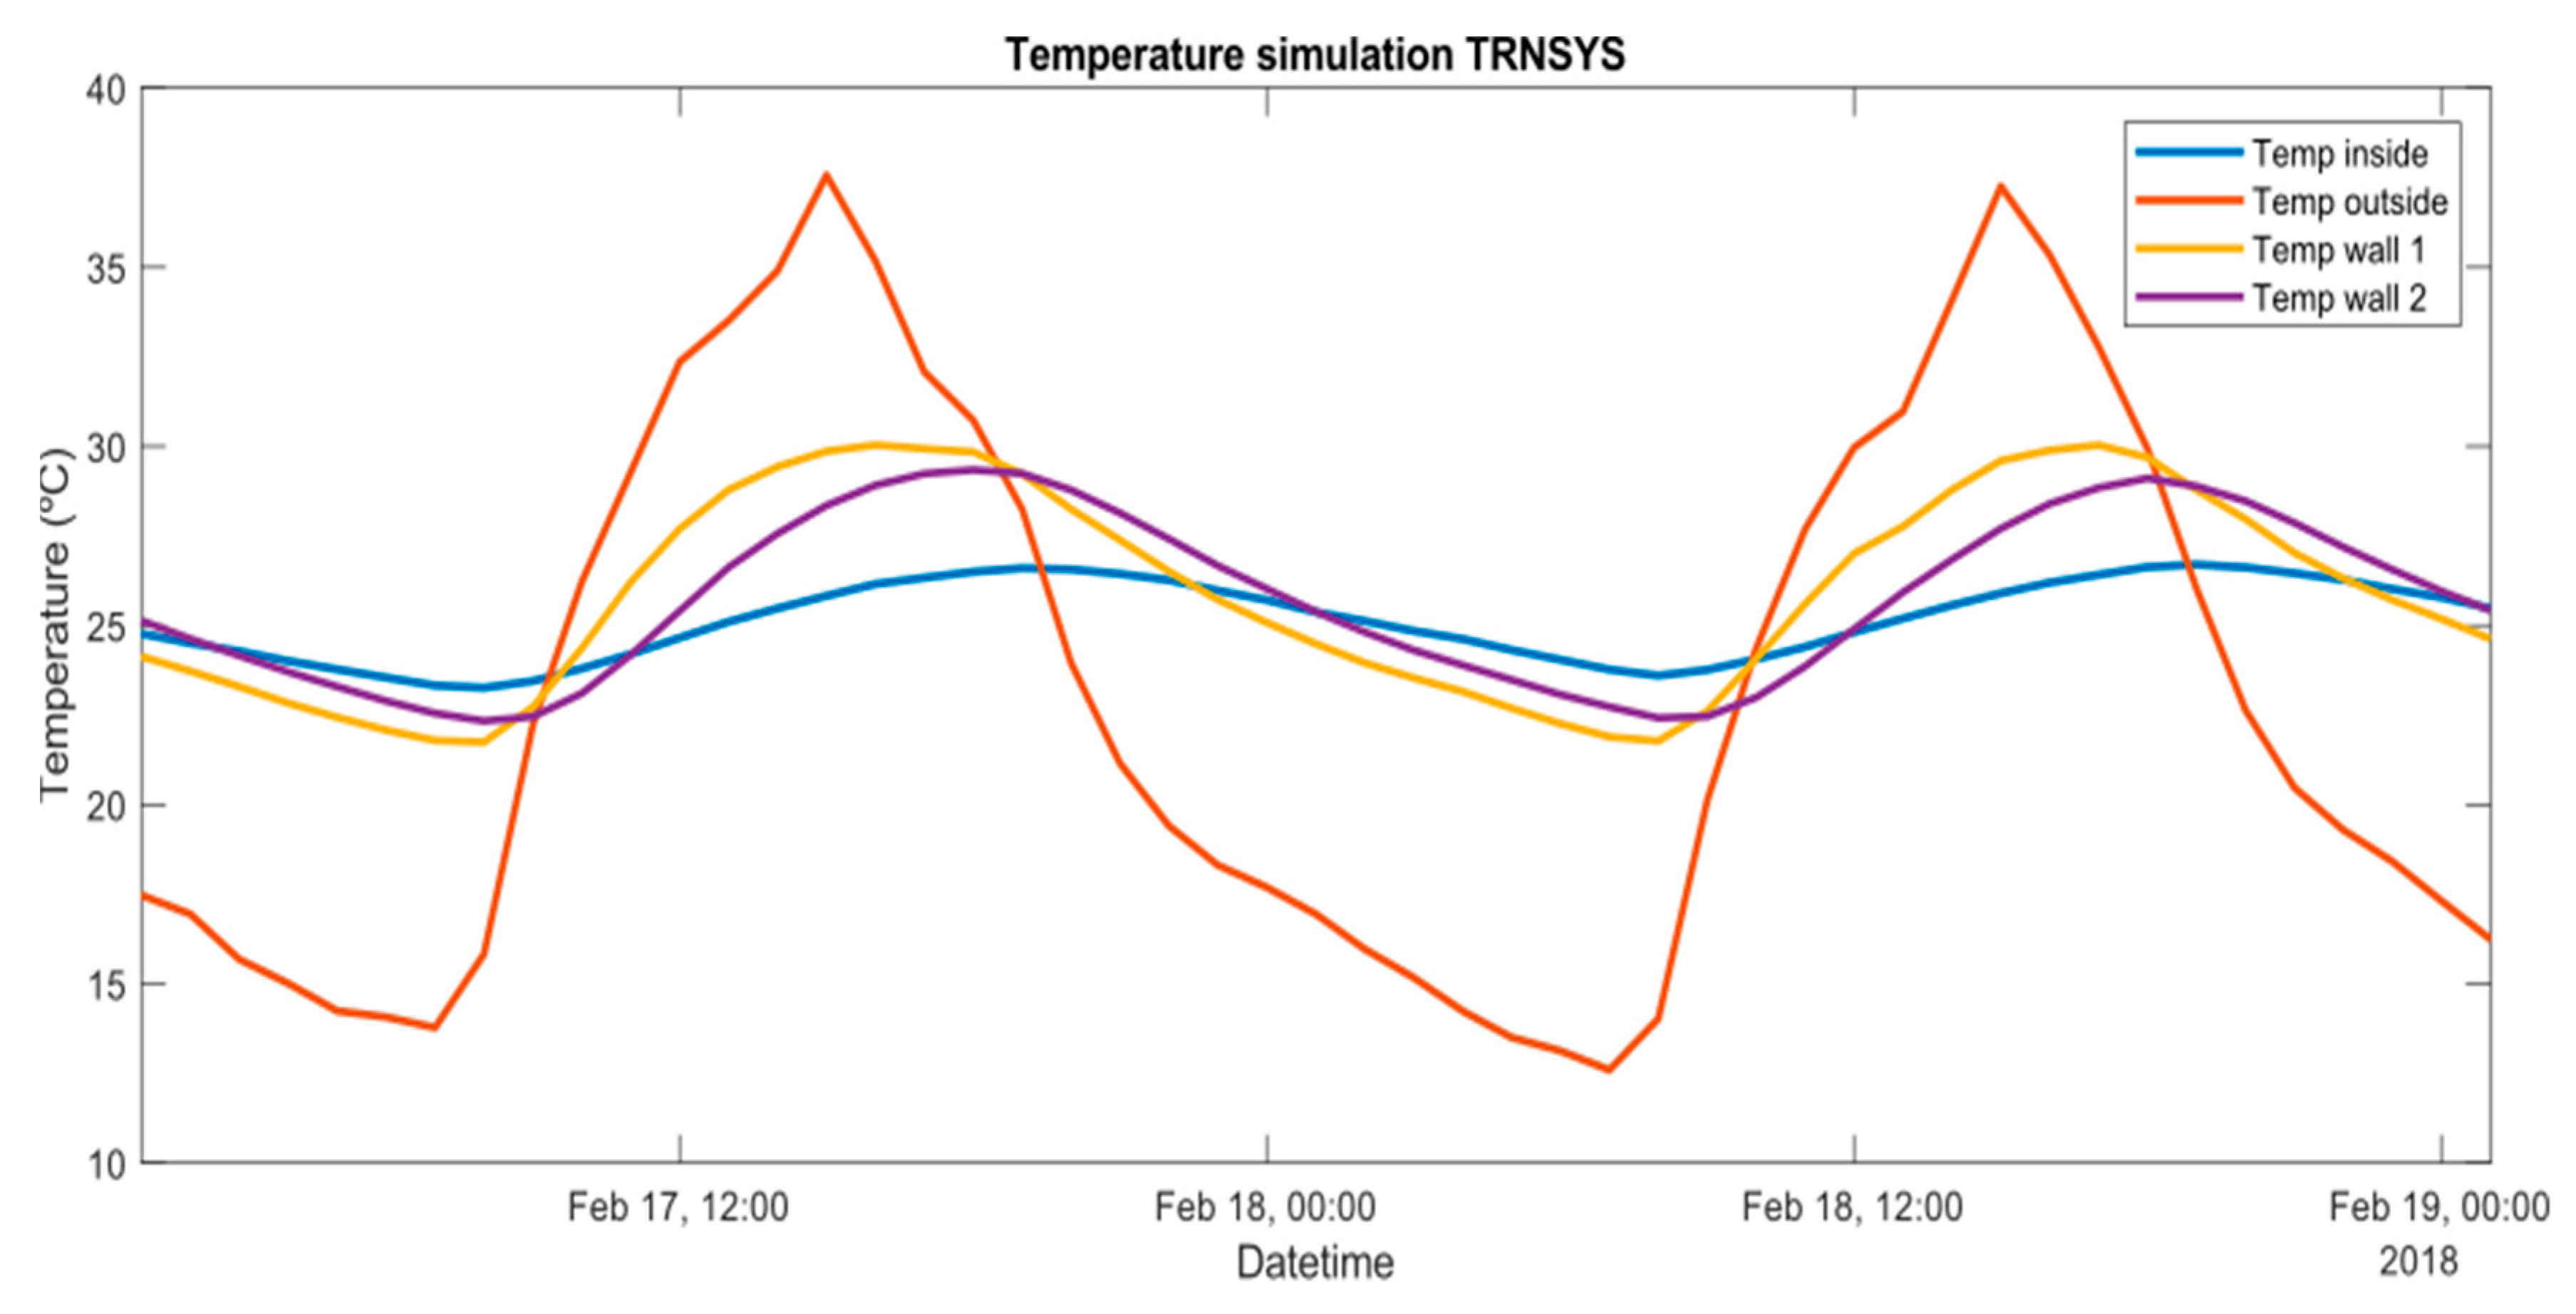
2.4. Thermal Model
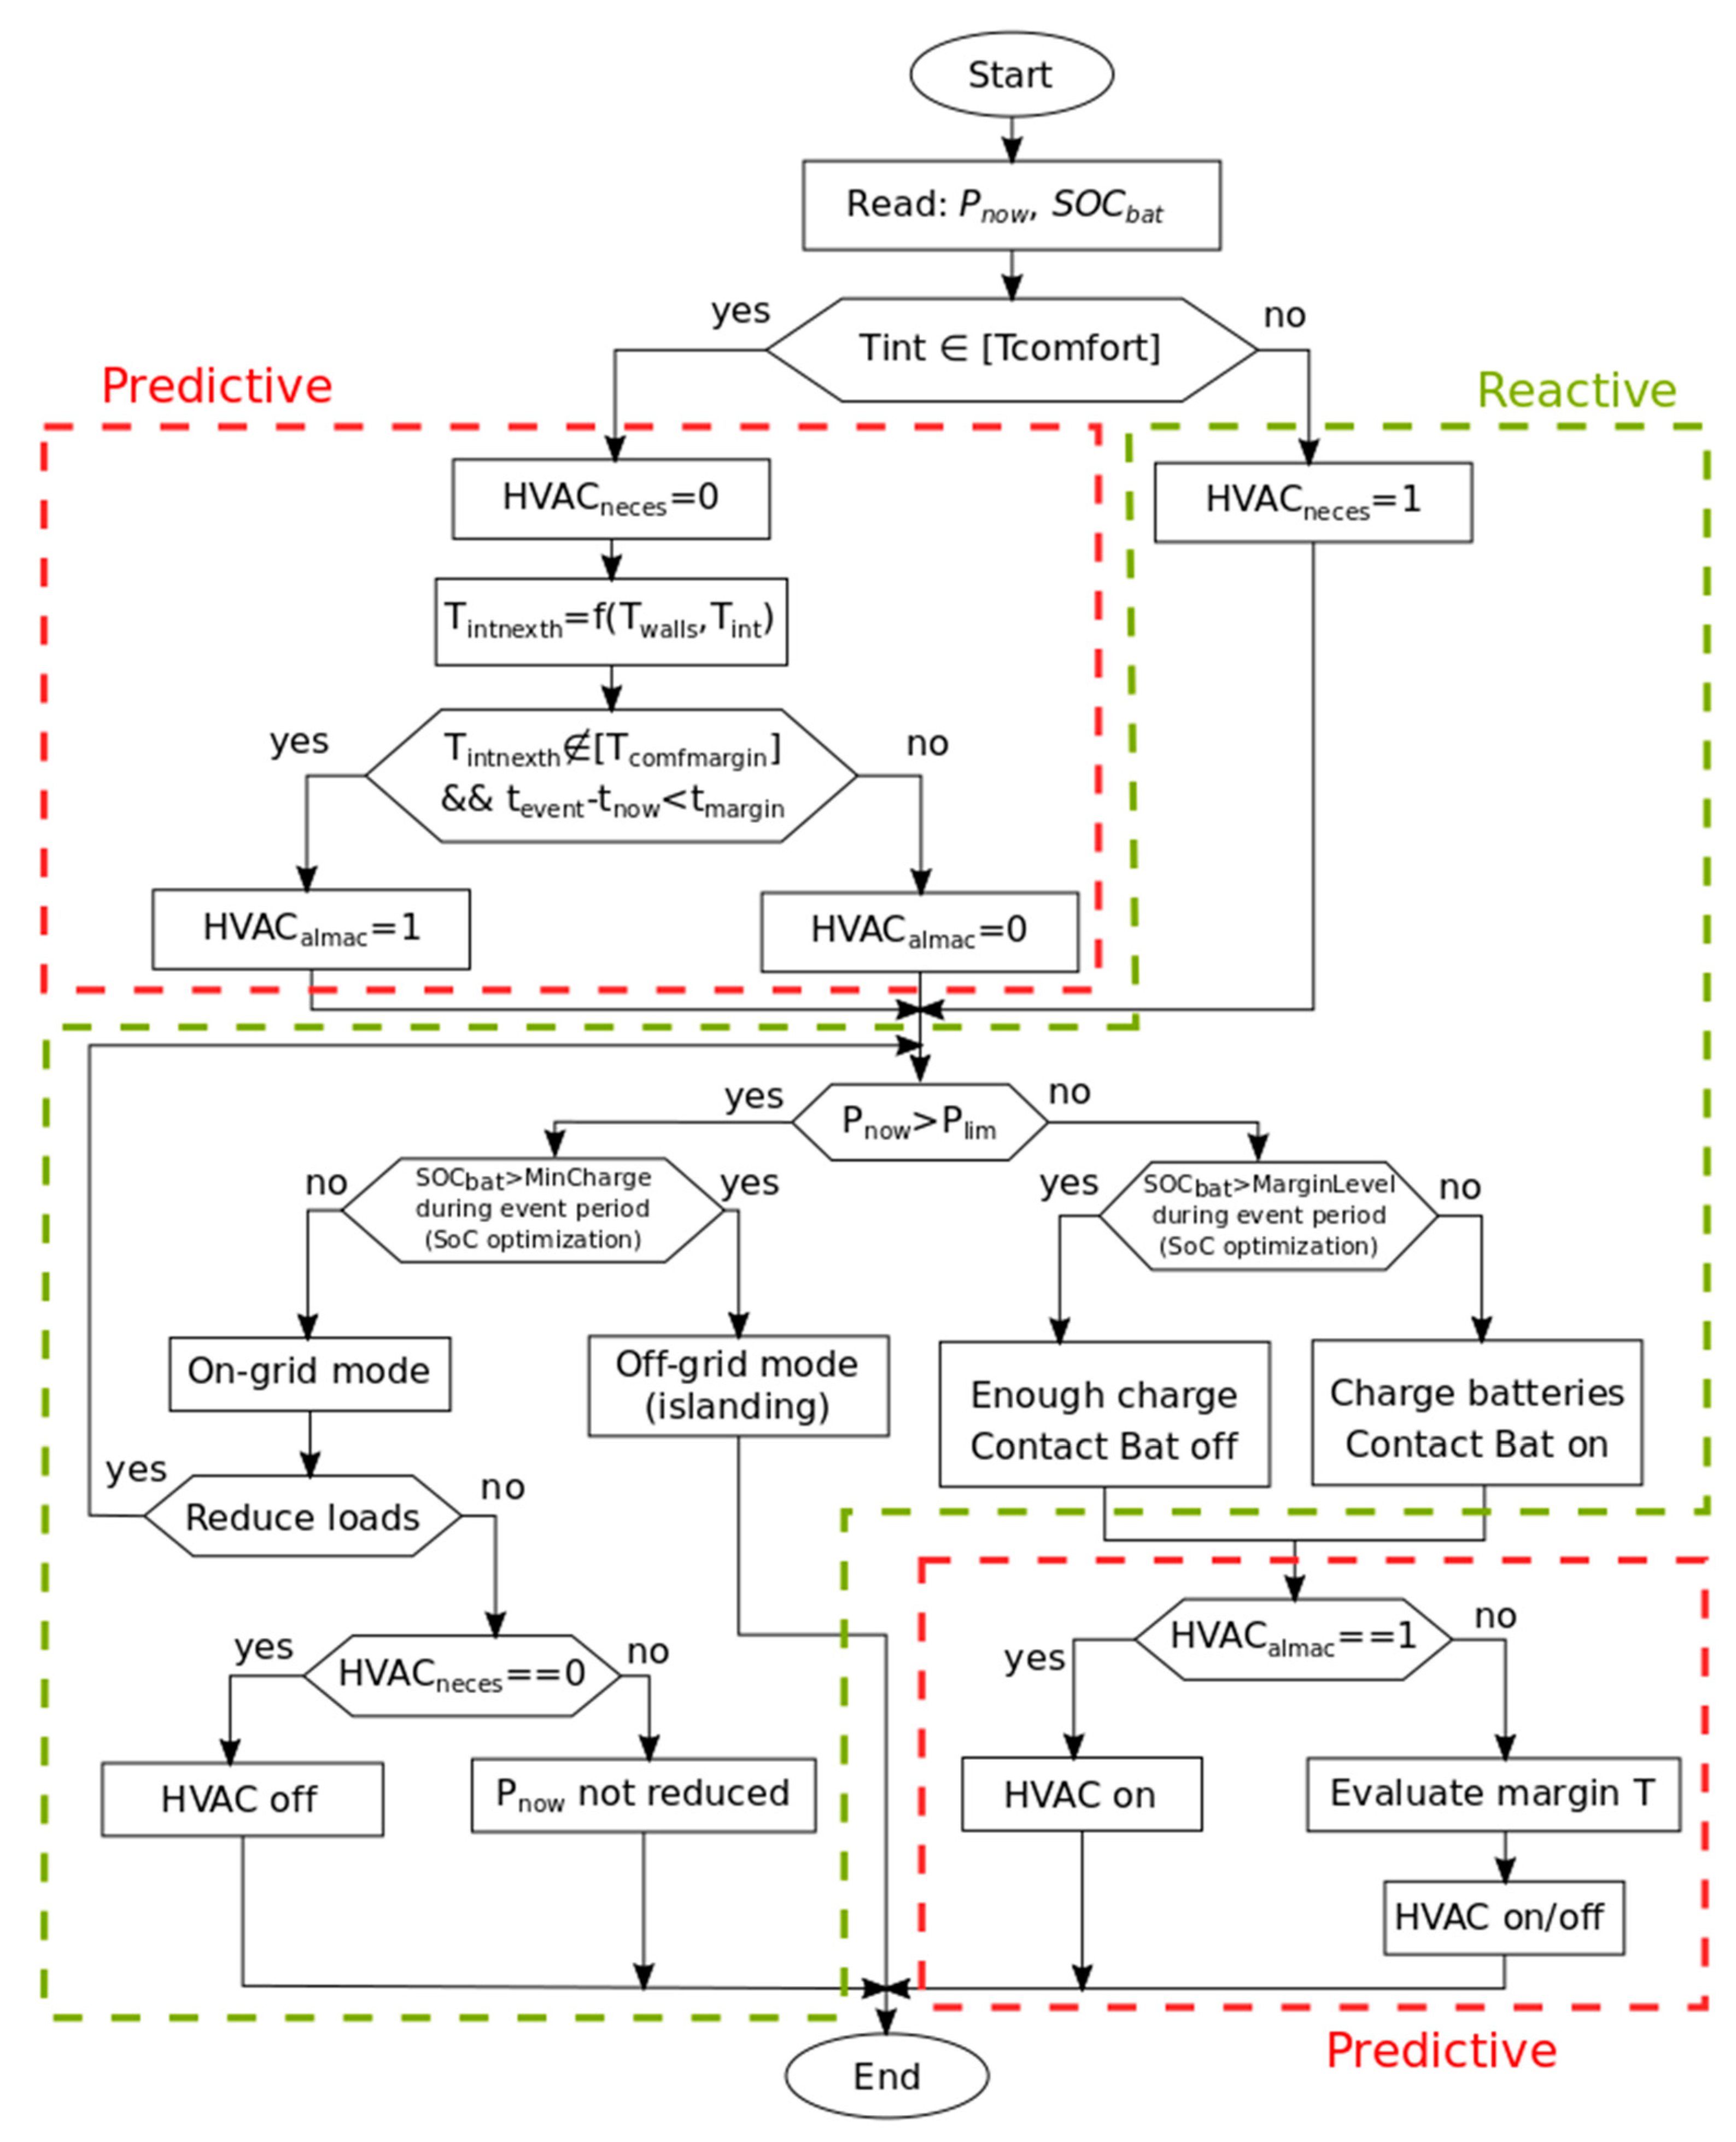
2.5. Control Block
3. Homeostatic Control
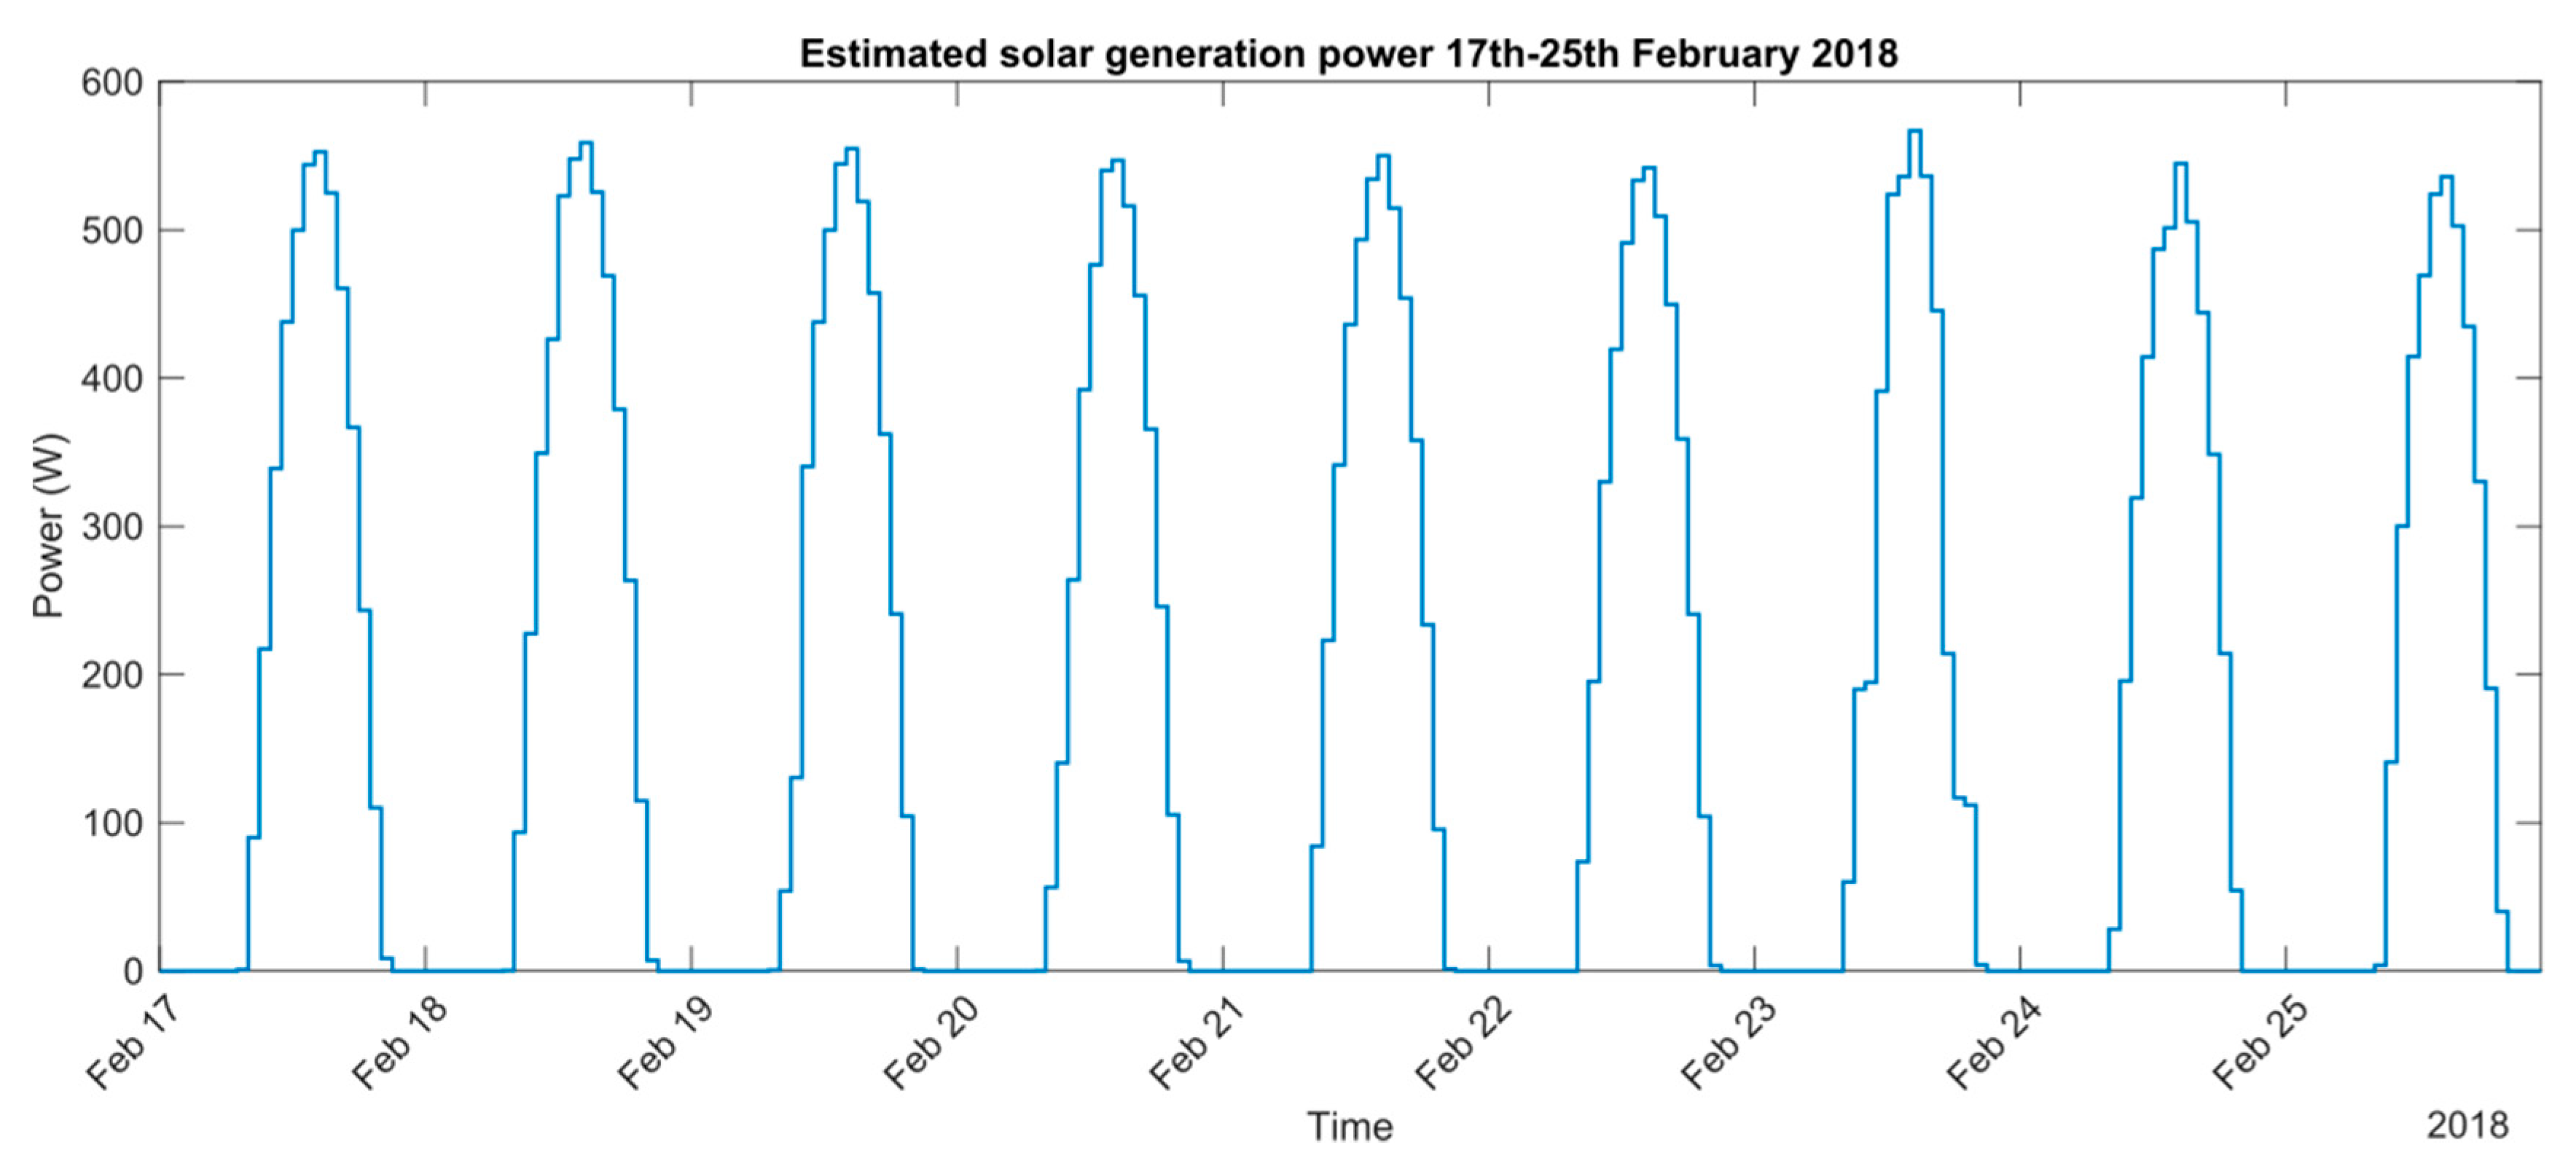
4. Results
5. Discussion
6. Conclusions
Author Contributions
Funding
Acknowledgments
Conflicts of Interest
References
- Gomez, T.; Herrero, I.; Rodilla, P.; Escobar, R.; Lanza, S.; de la Fuente, I.; Llorens, M.L.; Junco, P. European Union Electricity Markets: Current Practice and Future View. IEEE Power Energ. Mag. 2019, 17, 20–31. [Google Scholar] [CrossRef]
- Agency for the Cooperation of Energy Regulators (ACER). Monitoring report on the implementation of the CACM Regulation and the FCA Regulation; ACER: Ljubljana, Slovenia, 2019.
- Wood, E. US Senate Passes Bill that Supports Grid-Connected and Hybrid Microgrids. Microgrid Knowledge. Microgrid Knowledge. Available online: https://microgridknowledge.com/hybrid-microgrids/ (accessed on 14 February 2019).
- Diakakis, M.; Deligiannakis, G.; Katsetsiadou, K.; Lekkas, E. Hurricane Sandy mortality in the Caribbean and continental North America. Disaster Prev. Manag. Int. J. 2015, 24, 132–148. [Google Scholar] [CrossRef]
- Blake, E.S.; Kimberlain, T.B.; Berg, R.J.; Cangialosi, J.P.; Beven, J.L., II. Hurricane Sandy: October, 22, p.29. (PDF) (Tropical Cyclone Report). United States National Oceanic and Atmospheric Administration’s National Weather Service. National Hurricane Center, Archived from the original on February 17, 2013. Available online: https://www.nhc.noaa.gov/data/tcr/AL182012_Sandy.pdf (accessed on 14 February 2019).
- N. W. S. United States. Hurricane/Post-Tropical Cyclone Sandy, October 22–29, 2012 (PDF) (Service Assessment). United States National Oceanic & Atmospheric Administration’s. Available online: https://repository.library.noaa.gov/view/noaa/6633 (accessed on 7 May 2019).
- Energy Policies of IEA Countries: The United States 2014 Review Executive Summary. International Energy Agency. Available online: https://www.iea.org/Textbase/npsum/US2014sum.pdf (accessed on 14 February 2019).
- Wood, E. Think Microgrid: Why Government Leaders Are on a Serious Quest to Build Microgrids. Microgrid Knowledge. Available online: https://microgridknowledge.com/think-microgrid-government-leaders-serious-quest-build-microgrids/ (accessed on 14 February 2019).
- U. S. Senate. Energy Policy Modernization Act of 2015. Senate of the United States. Available online: https://www.energy.senate.gov/public/index.cfm/files/serve?File_id=eb454e3b-7f32-479e-b1a6-e84f9019941d (accessed on 7 March 2019).
- Sanchez-Squella, F.F.; Barrueto, A.; Cordova Yanine, A.; Sahoo, S.K. Engineering Sustainable Energy Systems: How Reactive and Predictive Homeostatic Control Can Prepare Electric Power Systems for Environmental Challenges. Procedia Comput. Sci. 2017, 122, 439–446. [Google Scholar]
- Morgan, P.; Martinez, D.; Maxwell, A. From Good To Great: The Next Step in Chilean Energy Efficiency. Natural Resources Defence Council (NRDC). 2014. Available online: https://www.nrdc.org/sites/default/files/chile-energy-efficiency-report.pdf (accessed on 7 March 2019).
- Smart City Santiago. ENEL. Available online: http://www.smartcitysantiago.cl/smart-grid (accessed on 14 February 2019).
- Lund, H.; Andersen, A.N.; Østergaard, P.A.; Mathiesen, B.V.; Connolly, D. From Electricity Smart Grids to Smart Energy Systems—A Market Operation based Approach and Understanding. Energy 2012, 42, 96–102. [Google Scholar] [CrossRef]
- Lund, H.; Østergaard, P.A.; Connolly, D.; Mathiesen, B.V. Smart Energy and Smart Energy Systems. Energy 2017, 137, 556–565. [Google Scholar] [CrossRef]
- Yanine, F.F.; Sauma, E.E. Review of grid-tie micro-generation systems without energy storage: Towards a new approach to sustainable hybrid energy systems linked to energy efficiency. Renew. Sust. Energy Rev. 2013, 26, 60–95. [Google Scholar] [CrossRef]
- Yanine, F.; Córdova, F.M. Homeostatic control in grid-connected micro-generation power systems: A means to adapt to changing scenarios while preserving energy sustainability. In Proceedings of the 2013 International Renewable and Sustainable Energy Conference (IRSEC), Ouarzazate, Morocco, 7–9 March 2013; pp. 525–530. [Google Scholar]
- Cordova, F.M.; Yanine, F.F. Homeostatic control of sustainable energy grid applied to natural disasters. Int. J. Comput. Commun. Control 2012, 8, 50–60. [Google Scholar] [CrossRef]
- Becerra, A.; Diaz, M.; Zagal, J.C. Feasibility study of using a small satellite constellation to forecast, monitor and mitigate natural and man-made disasters in Chile and similar developing countries. In Proceedings of the 26th Annual AIAA/USU Conference on Small Satellites, Logan, UT, USA, 13–16 August 2012. [Google Scholar]
- Zimmermann, K.A. Hurricane Katrina: Facts, Damage & Aftermath. Livescience. Available online: https://www.livescience.com/22522-hurricane-katrina-facts.html (accessed on 14 February 2019).
- Yanine, F.; Sanchez-Squella, A.; Barrueto, A.; Sahoo, S.K.; Cordova, F. Smart Energy Systems: The Need to Incorporate Homeostatically Controlled Microgrids to the Electric Power Distribution Industry: An Electric Utilities’ Perspective. Int. J. Eng. Technol. 2018, 7, 64–73. [Google Scholar] [CrossRef]
- Yanine, F.; Sanchez-Squella, A.; Barrueto, A.; Cordova, F.M.; Sahoo, S.K.; Rother, H.C. When energy efficiency is not enough: Homeostaticity of energy systems and why electric utilities should care. In Proceedings of the 7th International Conference on Computers Communications and Control (ICCCC), Oradea, Romania, 8–12 May 2018; pp. 142–149. [Google Scholar]
- Ambiental degradation in the Bahía de Quintero. Available online: http://repositorio.uchile.cl/bitstream/handle/2250/111636/5.0parque.pdf?sequence=6 (accessed on 14 February 2019).
- Rearte-Jorquera, A.; Sánchez-Squella, A.; Pulgar-Painemal, H.; Barrueto-Guzmán, A. Impact of Residential Photovoltaic Generation in Smart Grid Operation: Real Example. Procedia Comput. Sci. 2015, 55, 1390–1399. [Google Scholar] [CrossRef] [Green Version]
- Olivares, D.E.; Mehrizi-Sani, A.; Etemadi, A.H.; Cañizares, C.A.; Iravani, R.; Kazerani, M.; Hajimiragha, A.H.; Gomis-Bellmunt, O.; Saeedifard, M.; Palma-Behnke, R.; Jiménez-Estévez, G.A.; Hatziargyriou, N.D. Trends in Microgrid Control. IEEE Trans. Smart Grid 2014, 5, 1905–1919. [Google Scholar] [CrossRef]
- Ramirez, V.; Ortega, R.; Bethoux, O.; Sánchez-Squella, A. A dynamic router for microgrid applications: Theory and experimental results. Control Eng. Pract. 2014, 27, 23–31. [Google Scholar] [CrossRef]
- Umeozor, E.C.; Trifkovic, M. Energy management of a microgrid via parametric programming. IFAC-PapersOnLine 2016, 49, 272–277. [Google Scholar] [CrossRef]
- Bhavsar, Y.S.; Joshi, P.V.; Akolkar, S.M. Simulation of Microgrid with energy management system. In Proceedings of the 2015 International Conference on Energy Systems and Applications, Pune, India, 30 October–1 November 2015; pp. 592–596. [Google Scholar]
- Xu, X.; Wang, W.; Hong, T.; Chen, J. Incorporating machine learning with building network analysis to predict multi-building energy use. Energy Build. 2019, 186, 80–97. [Google Scholar] [CrossRef]
- Hedley, J.; Tsypin, B.; Raghu, D. Building Energy Consumption Analysis System. U.S. Patent 8756024B22010, 2014. [Google Scholar]
- Chen, Y.; Hong, T.; Luo, X.; Hooper, B. Development of city buildings dataset for urban building energy modeling. Energy Build. 2019, 183, 252–265. [Google Scholar] [CrossRef]
- Cannon, W.B. Organization for physiological homeostasis. Physiol. Rev. 1929, 9, 399–431. [Google Scholar] [CrossRef]
- Yanine, F.; Sanchez-Squella, A.; Barrueto, A.; Tosso, J.; Cordova, F.M.; Rother, H.C. Reviewing homeostasis of sustainable energy systems: How reactive and predictive homeostasis can enable electric utilities to operate distributed generation as part of their power supply services. Renew. Sust. Energy Rev. 2018, 81, 2879–2892. [Google Scholar] [CrossRef]
- Yanine, F.F.; Caballero, F.I.; Sauma, E.E.; Córdova, F.M. Homeostatic control, smart metering and efficient energy supply and consumption criteria: A means to building more sustainable hybrid micro-generation systems. Renew. Sustain. Energy Rev. 2014, 38, 235–258. [Google Scholar] [CrossRef]
- Yanine, F.F.; Caballero, F.I.; Sauma, E.E.; Córdova, F.M. Building sustainable energy systems: Homeostatic control of grid-connected microgrids, as a means to reconcile power supply and energy demand response management. Renew. Sustain. Energy Rev. 2014, 40, 1168–1191. [Google Scholar] [CrossRef]
- Yanine, F.F.; Córdova, F.M.; Valenzuela, L. Sustainable Hybrid Energy Systems: An Energy and Exergy Management Approach with Homeostatic Control of Microgrids. Procedia Comput. Sci. 2015, 55, 642–649. [Google Scholar] [CrossRef] [Green Version]
- Yanine, F.F.; Sauma, E.E.; Cordova, F.M. An Exergy and Homeostatic Control Approach to Sustainable Grid-Connected Microgrids without Energy Storage. Appl. Mech. Mater. 2014, 472, 1027–1031. [Google Scholar] [CrossRef]
- Sauma Caballero, E.F.; Yanine, F. Business optimal design of a grid-connected hybrid PV (photovoltaic)-wind energy system without energy storage for an Easter Island’s block. Energy 2013, 61, 248–261. [Google Scholar] [CrossRef]
- Li, W.; Yang, L.; Ji, Y.; Xu, P. Estimating demand response potential under coupled thermal inertia of building and air-conditioning system. Energy Build. 2019, 182, 19–29. [Google Scholar] [CrossRef]
- Cheng, Y.; Zhang, S.; Huan, C.; Oladokun, M.O.; Lin, Z. Optimization on fresh outdoor air ratio of air conditioning system with stratum ventilation for both targeted indoor air quality and maximal energy saving. Build. Environ. 2019, 147, 11–22. [Google Scholar] [CrossRef]
- San Diego Gas & Electric. Schedule CBP—Capacity Bidding Program. San Diego Gas & Electric. Available online: http://regarchive.sdge.com/tm2/pdf/ELEC_ELEC-SCHEDS_CBP.pdf (accessed on 8 April 2019).


| Name | Type | Description |
|---|---|---|
| pow_limit | Input | Power consumption limit (from the utility grid) |
| pow_now | Input | Power consumption |
| soc_batBU | Input | State of battery group 1 |
| soc_batST | Input | State of battery group 2 |
| gridOK | Input | Indicates if the utility grid is available (no blackout) |
| Twalls | Input | Walls temperature |
| Text | Input | Outside temperature |
| Tint | Input | Internal temperature |
| contactOnGrid | Output | On/Off grid selector |
| ContactBat | Output | On/Off battery selector |
| ContactHVAC | Output | On/Off HVAC selector |
© 2019 by the authors. Licensee MDPI, Basel, Switzerland. This article is an open access article distributed under the terms and conditions of the Creative Commons Attribution (CC BY) license (http://creativecommons.org/licenses/by/4.0/).
Share and Cite
Parejo, A.; Sanchez-Squella, A.; Barraza, R.; Yanine, F.; Barrueto-Guzman, A.; Leon, C. Design and Simulation of an Energy Homeostaticity System for Electric and Thermal Power Management in a Building with Smart Microgrid. Energies 2019, 12, 1806. https://doi.org/10.3390/en12091806
Parejo A, Sanchez-Squella A, Barraza R, Yanine F, Barrueto-Guzman A, Leon C. Design and Simulation of an Energy Homeostaticity System for Electric and Thermal Power Management in a Building with Smart Microgrid. Energies. 2019; 12(9):1806. https://doi.org/10.3390/en12091806
Chicago/Turabian StyleParejo, Antonio, Antonio Sanchez-Squella, Rodrigo Barraza, Fernando Yanine, Aldo Barrueto-Guzman, and Carlos Leon. 2019. "Design and Simulation of an Energy Homeostaticity System for Electric and Thermal Power Management in a Building with Smart Microgrid" Energies 12, no. 9: 1806. https://doi.org/10.3390/en12091806