Article

LCA-Based Comparison of Two Organic Fraction Municipal Solid Waste Collection Systems in Historical Centres in Spain

1
Department of Chemical and Biomolecular Engineering, University of Cantabria, Avda. de los Castros s/n, 39005 Santander, Spain
2
UNESCO Chair in Life Cycle and Climate Change ESCI-UPF, Universitat Pompeu Fabra, Pg. Pujades 1, 08003 Barcelona, Spain
*
Author to whom correspondence should be addressed.
Energies 2019, 12(7), 1407; https://doi.org/10.3390/en12071407
Submission received: 20 March 2019 / Revised: 9 April 2019 / Accepted: 10 April 2019 / Published: 11 April 2019

Abstract

:
Municipal solid waste (MSW) collection is an important issue in the development and management of smart cities, having a significant influence on environmental sustainability. Door-to-door and pneumatic collection are two systems that represent a way of arranging waste collection in city´s historic areas in Spain where conventional street-side container collection is not feasible. Since door-to-door collection generates significant direct greenhouse gas emissions from trucks, pneumatic collection emerges as an alternative to the trucking system. While this technology apparently reduces local direct air emissions, it suffers from a large energy demand derived from vacuum production for waste suction. The introduction of new normative frameworks regarding the selective collection of the biodegradable fraction makes necessary a comprehensive analysis to assess the influence of this fraction collection and its subsequent recycling by anaerobic digestion. As a novelty, this work compares both conventional door-to-door and pneumatic collection systems from a life cycle approach focusing on the biodegradable waste. Results indicate that, in spite of the fact electricity production and consumption have a significant influence on the results, the energy savings from the recycling of the organic fraction are higher than the energy requirements. Therefore, the pneumatic collection could be an environmentally-friendly option for MSW management under a circular economy approach in Spanish city´s historic areas, since wastes could be a material or energy source opportunity.

1. Introduction

Cities are expanding and increasing in number. In fact, c.a. 70% of the population will move to urban areas by 2050, leading to vast cities [1]. Such cities will require smart sustainable infrastructures to manage citizens’ needs and to offer fundamental and more advanced services [2]. This urbanization process in cities of developing countries has led to an increase in the quantity and complexity in terms of composition of municipal solid waste (MSW) [3]. The worldwide MSW generation in 2016 was approximately 2.01 billion tonnes [4] and it is estimated that, by 2050, the production will rise to 3.40 billion tonnes with approximately 56% of organic content [5]. At a European level, the annual generation of MSW in EU-28 reached 483 kg per person in 2016, with the daily waste production per capita in the European countries ranging from 0.71 to 2.06 kg [6]. Therefore, it is expected that, in the coming years, both the increase of global population and the growth in developing countries will create a boost in MSW production. In this context cities will have to face new challenges, linking technology to the improvement of the quality of citizen´s life, moving towards the smart city concept [7]. It is essential to be able to assess the environmental impact of cities by assessing their different components, such as the waste management infrastructure [8].
In response to the challenge posed by the generation and consequently management of MSW, the European Union (EU) has established a legal framework targeting strategies to increase resource efficiency. The most relevant goals for MSW are the recycling rates proposed by the Packaging [9] and Packaging Waste Directive [10] and the Directive on Industrial Emissions (DIE) [11]. The Directive on Landfills [12], which aims to prevent or to reduce as far as possible the negative effects on the environment caused by waste landfilling, has set the amount of biodegradable municipal waste landfilled to be reduced to 50% in 2009 and to 35% in 2016 (compared to 1995 levels). In addition, the Waste Framework Directive [13] establishes a target of recycling and preparing for reuse of 60% by 2025 and 65 % by 2030. To reach these values, the EU fosters selective collection systems and recycling of the MSW fractions, ensuring the sustainability of smart cities moving towards a circular economy approach (Figure 1) [14]. This legal framework contributes to the EU Sustainable Development Goals (SDGs) indicator set. For instance, SDG 7: affordable and clean energy; SDG 11: sustainable cities and communities; SDG 12: responsible production and consumption and SDG 13: climate action [15].
At a national level, in most Spanish cities, glass, paper/cardboard and light packaging are currently collected separately, whereas the remaining fraction comprises the organic fraction because biodegradable waste collection system has not been still fully implemented [16]. However, to meet the goals of the European legislation [13], organic waste should be collected separately in a specific container for two main reasons: it represents around 40% of the MSW generated in Europe [17] and a suitable collection allows obtaining a higher quality compost [18]. In fact, one of the main components of the biodegradable fraction is food waste, which has been analysed in terms of prevention and recovery in many studies. Laso et al. [19] combined Life Cycle Assessment (LCA) and Data Envelopment Analysis (DEA) to assess the efficiency of Spanish agri-food system. Garcia et al. [20] quantified the food losses at the distinct stages of the food supply chain in terms of mass, nutrients and economy. On the other hand, Thyberg and Tonjes [21] examined the impacts of food system modernisation on food waste generation. Finally, Gustavsson et al. reported two studies focused on the extent and effects as well as causes and prevention of food losses and food waste, one for medium/high income countries [22] and another for low income countries [23]. In Spain, both European and Spanish legislation have boosted the introduction of selective collection systems for biowaste [24]. In fact, some Spanish regions, such as Catalonia, Madrid and Navarre, have already introduced in their MSW collection systems the “fifth container” or “brown container”, exclusive for compostable MSW (see Figure 2). These containers collect kitchen waste, garden rubbish, tree cuts and waste from food market and biodegradable bags [16]. In this way, the amount of MSW disposed in landfills is reduced by means of increasing the percentage of recycling through composting. Nevertheless, there are several disadvantages related to its storage and collection; for instance, the need of specific containers, additional bins and collection points, and the requirement of additional trucks and new routes [17]. All these factors depend on the collection method: street-side or underground containers, door-to-door or pneumatic collection.
Waste collection accounts for 50–75% of the total MSW cost in developed countries, being one of hots spots from an environmental perspective, due to its energy consumption and related CO2 emissions [27]. The collection method varies from region to region. For instance, in Spain the conventional management of MSW relies on the collection of the waste from containers placed in the street by means of a fleet of heavy trucks. In particular, in 2015, 92.6% of MSW was collected from street-side containers, whereas underground containers represented 5.2%, door-to-door collection covered 1.5% and pneumatic collection only 0.7% [28]. On the other hand, in Nordic countries such as Sweden, the collection from containers has been replaced by new technological and automated systems such as vacuum waste collection and underground container systems. The use of these systems has increased, particularly in cities and in newly built areas, moving towards more environmentally-friendly cities, but also in city´s historic areas where the conventional street-side collection systems is not feasible due to the difficult access for garbage trucks [29]. Therefore, society seems to be aware about the importance of the selective collection of different waste fractions, but there is more disagreement about the most environmentally suitable selective collection system [30].
In this sense, in the last years, Life Cycle Assessment (LCA) methodology [31] has been applied to evaluate and to compare several MSW collection systems developing ad hoc methodology [32]. Some authors have assessed the most common collection systems, door-to-door and street-side containers under environmental perspectives. Mora et al. [33] used LCA to assess the environmental impact of a waste management system based on kerbside collection. On the other hand, Gilardino et al. [34] combined operational research techniques and LCA to create an effective collection-route system for garbage compactor trucks to attain a reduction in environmental impacts in the city of Lima. Other authors, such as Pérez et al. [35] described a methodology to evaluate the environmental impact of the urban containerization systems by using LCA, whereas Pires et al. [36] also evaluated, apart from the environmental, the economic aspect of a kerbside system and an exclusive bring system. Also, the social perspective of the most common collection systems was assessed under a social perspective [37]. The introduction of new technologies and automated systems boosted the comparison of conventional collection with novel systems such as vacuum collection. In this case, Teerioja et al. [27] compared a hypothetical stationary pneumatic waste collection system with a traditional vehicle-operated door-to-door collection system in an existing, densely populated urban area, from an economic point of view, while Punkkinen et al. [38] and Aranda-Usón et al. [39] applied LCA to compare the environmental sustainability of both collection systems. On the other hand, Iriarte et al. [30] used LCA to quantify and to compare the potential environmental impacts of three selective collection systems: mobile pneumatic, multi-container and door-to-door. The main conclusions previously obtained state that a pneumatic system generates more air emissions due to the consumption of electricity and installation materials. Only when the loads are close to 100%, the vacuum system had the best environmental performance compared to the conventional systems. In addition, under an economic perspective, the pneumatic collection is estimated to be six times more expensive than traditional systems [27].
The mentioned studies consider the management of MSW taking into account glass, paper/cardboard, light packaging and bulky fraction. However, the introduction of the “brown container” makes necessary assessing the energy efficiency of the conventional and new collection systems, in order to determine the influence of the biodegradable fraction and its subsequently treatment by means of anaerobic digestion. The organic fraction of MSW is a substrate of interest due to its availability and characteristics [40]. Therefore, this study compares the energy efficiency of door-to-door system vs pneumatic waste collection, considering two alternatives: (i) the bulky fraction includes the organic fraction and (ii) the organic fraction is collected separately for further anaerobic digestion. The collection using street-side containers was excluded from the assessment since the study is placed in historic areas of Spanish cities.

2. Materials and Methods

The LCA is a tool to assess the potential environmental impacts and resources consumption throughout a product and service life-cycle [41]. In this regard, LCA has become one of the most relevant methodologies to help organisations perform their activities in the most environmentally friendly way along the whole value chain. In this work, LCA is conducted following the recommendations of the ISO 14040 [31] and 14044 [42] international standards in which LCA methodology is divided into four phases: (i) goal and scope, (ii) life cycle inventory (LCI), (iii) life cycle impact assessment (LCIA) and (iv) interpretation of the results.

2.1. Goal and Scope Definition

In this phase an accurate specification of the product or products to be investigated is done, as well as a clear description of the intended application of the study and its scope, in terms of system boundaries and functional unit (FU) [43]. Moreover, allocation procedures, cut-off rules and assumptions are also defined in this phase [44].
The purpose of this study is to assess the primary energy demand (PED) and the environmental efficiency of both conventional door-to-door and the alternative pneumatic waste collection systems considering only the management of the organic fraction. The results are expected to provide an interesting discussion on the suitability of using different collection systems depending on the waste fraction managed.

2.1.1. Function, Functional Unit and System Boundaries

The function of the compared systems is the management of MSW and, in particular, of the organic fraction generated in historic areas of Spanish cities. These areas are characterised by narrow and tortuous streets where, in most cases, the transit of people and vehicles is not feasible, causing traffic jams and the disturbance of the daily routine of citizens. To handle this problem, many cities have pedestrianised and widened the streets making difficult the waste collection by means of street-side containers and garbage trucks. In addition, in the last years, these areas have turned into the shopping and leisure centres of the city, combining banks, company headquarters and public institutions with shops, hotels and restaurants which generate high amounts of MSW that have to be managed properly. To quantify this function, it is necessary to define a FU, to which all the inputs and outputs will be referred. In this case, the FU is described as the collection of one t of MSW with the composition showed in Table 1, in which biowaste is the major fraction (42%), followed by paper/cardboard (15%).
The system boundaries comprise the stages of the supply chain from cradle to gate, that is to say, the waste collection system, the transport of the collected waste to the sorting plant, the waste classification in the sorting plant and its treatment by means of anaerobic digestion. The waste collection system includes the manufacturing of components (i.e., bins and/or pipes) and the use stage (i.e., operation and maintenance) (see Figure 3).

2.1.2. Description of Selective Collection Systems

As previously mentioned, door-to-door and pneumatic systems are the waste collection alternatives analysed in this study, that, together with multi-container collection are the waste collection systems most implemented in urban areas. The combination of several collection systems depends on budget limitations, public participation, urbanisation age and municipal and regional planning, among others. In particular, the pneumatic system has been implemented for more than a decade and its future development will depend, just like the other systems, on economic, social and environmental aspects [30].
  • Door-to-door: in this system, citizens leave each waste fraction outside their house, separated according to a pre-established collection schedule based on daily waste generation. A garbage truck collects waste from door-to-door bins on a specific collection day. Compacting waste trucks collect the waste from the containers (one truck for each collected fraction) in order to deliver it to final treatment. A full service scheme includes the cleaning with hot and cold water and detergent of containers using a mobile container washing vehicle.
  • Pneumatic collection: this system uses a network of urban pipes, underground storage containers and waste inlets and chutes. Several indoor and outdoor collection points are available for the waste fractions. Waste bags are dropped inside underground containers through a chute and, according to a collecting schedule, waste is transported by a vacuum system to a collection plant. This plant, located in the centre of the collection network, is the heart of the system composed of turbo fans, cyclones, waste compressors, cleaning filters and general equipment, such as conveyor belts, cranes, compressed air and automated control systems. This collection method uses electricity to collect and compact the different waste streams [39].

2.1.3. Assumptions

The following points explain the reason for excluding some processes of the system:
  • The production of aluminium and the production of fiberglass have been excluded because, at the time of model construction, no data was available. In addition, the environmental impact associated with the manufacture of these materials is not large enough to cause a deviation of the results due to the small quantities used compared to the stainless steel, the main material of which containers are made. Therefore, it is assumed that all containers are completely made of stainless steel, as well as the pipes.
  • The installation of the waste pneumatic system, the manufacture of the waste collection plant, as well as the construction of the sorting plant have not been included in the model. This is due to the lack of available data and irrelevance of the environmental impacts within the pneumatic collection system. It can be reasonably assumed that, when expressed per FU, their contribution to the waste manage life cycle will be minimal. This assumption is based on the environmental impacts caused by other processes involved and the considered lifespan of these infrastructures.
  • The end of life is not included because it was outside the system boundaries.
  • The manufacture of the waste valves, filters and cyclones are not inventoried because it has been considered that the associated environmental impact is insignificant compared to the waste transported by this system and valves/cyclone lifespan.
  • The vehicle manufacture was also excluded from the analysis.

2.1.4. Description of the Scenarios under Study

Separate collection of the organic fraction has been implemented in the northern European countries for several years, and it is now relatively well established there. However, it is not yet widespread in Spain or others countries of the southern Europe, although there is some experience at local or regional level. Therefore, the collection of the organic fraction currently coexists with the collection of the bulky fraction. In this sense, this work assesses four scenarios (see Figure 4), which are based on the two waste collection systems described above and the waste fraction managed. Scenarios 1a and 2a represent the collection of the bulky fraction by means of the door-to-door and pneumatic waste collection systems, respectively, while in scenarios 1b and 2b the organic fraction is collected separately in the fifth container. In these scenarios, sensitivity analyses were carried out varying the effectiveness of the selective collection. Initially the study assumes that 100% of the organic fraction is disposed of in the fifth container. However, this ideal situation does not always occur. Therefore, in the sensitivity analysis this percentage was reduced, increasing the amount of biodegradable fraction in the bulky fraction. This bulky fraction is conducted to a sorting plant in order to recover the largest amount of organic matter. In this study, only 9.8% of the organic fraction was considered to be recovered from the bulky fraction, and the collection truck is considered to cover an average distance of 35 km to the sorting plant [46]. Finally, since the aim of the selective collection of the organic fraction is to convert it into high quality compost, the final destination of the organic fraction is a composting plant, which is located next to the sorting plant.

2.1.5. Allocations

The scenarios under study are multi-outputs processes in which the management of MSW is the main function of the system and the production of electricity and compost are additional functions. To handle this problem ISO [31] establishes a specific allocation procedure in which system expansion is the first option. In this case, in the anaerobic digestion stage, methane is assumed to be combusted with a 25% efficiency of the low heating value of the biogas to generate electricity. The delivering residue of the anaerobic digestion, i.e., digestate, is transferred to a composting plant for the production of biocompost. While the compost is assumed to replace mineral fertilizer, with a substitution ratio of 20 kg N equivalent per ton of compost, the energy generated from biogas is considered to replace the Spanish electric mix [47].

2.2. Life Cycle Inventory (LCI)

LCI consists on the collection of the relevant input and output data for the assessed systems [48], and is one of the most effort-consuming phases of an LCA, both in terms of work and dedicated time [44]. In this section, data sources and main assumptions for the scenarios under study are detailed. In this case, the LCI was collected by means of an input-output analysis. Regarding the processes shared by the two scenarios, such as the sorting plant and the composting plant, data were obtained from Cobo et al. [46] and Righi et al. [49], respectively. Since the amount of MSW entering pre-treatment and treatment stages depends on the scenario analysed, the data of the sorting plant and composting plant collected in Table 2 are expressed per tonne of waste treated.

2.2.1. Door-to-Door Collection

Primary data were obtained from the Spanish Ministry of Environment and Rural and Marine Affairs (MERMA) [50] and from the UNESCO Chair in Life Cycle and Climate Change (by means of a personal communication from Ecoembes in the framework of the Life-FENIX project), while secondary data were sourced from the thinkstep database [51]. The fuel consumption rates were estimated at 3.98 and 0.07 L of diesel and gasoline per collected t of waste [50]. Energy demand and emission factors for fuel production were taken from the thinkstep database [51]. Based on Ecoembes information, containers requirements were estimated at 0.107 m3 per FU. All fractions were assumed to be deposited in a high density polyethylene (HDPE) container, which was modelled assuming the following composition: 74.75% HDPE, 21.57% steel and 3.68% styrene-butadiene-rubber. A lifetime of 7.5 years was assumed for all the containers. They were considered to be washed six times/y, using 0.35 kg of detergent per m3 of container. The LCI of the system is shown in Table 2.

2.2.2. Pneumatic Collection

The main sources of information were Ecoembes and the two main companies that manage the pneumatic system in Portugal and Spain: Envac Iberia [52] and Ros Roca [53]. The authors personally visited their plants aiming to have a better perception of the system performance and to get real and representative data allowing the construction of the model as close as possible to reality. Secondary data, such as the production of stainless steel cold rolled for the manufacture of bins and pipes, were taken from the Thinkstep database [51]. Data collection is explained according to three main infrastructure stages of the system: waste collection plant, central collection points and underground pipes. The LCI data is listed in Table 2.
• Waste collection plant
All the waste gathered in the collection points is carried to the waste collection plant through the network of underground pipes. Then, waste is compacted and deposited in a container until it is full. The energy consumed by the system is linked to the suction and compaction operations at the waste collection plant. The suction stage is estimated to work 3,500 h/y with a power of 220 kW. The average compaction demand is established at 15 kW for 1,100 h/y. From these data, the consumptions per metric ton of waste collected for both processes has been calculated, obtaining the total consumption of this waste collection system. The estimation is explained in detail in Section S1 of the Supplementary Material.
• Central collection points
The central collection points are composed of a number of bins where citizens can deposit the wastes. Below these boxes, there are the waste valve and an air valve which are responsible for connecting the bin of the central collection point to the overall network of underground pipes. These components have been excluded from the system because of their irrelevance comparing to the whole environmental impact of the system. According to Envac Iberia [52] and Ros Roca [53], the number of bins per collection point depends on the amount of waste fractions managed. In the model under study, it has been considered only one fraction at time (the organic fraction). A lifetime of 9 years is assumed for the bins [54]. Two different containers composed the system: a sidewalk container, entirely made of stainless steel, and an indoor bin, made of stainless steel and a small fraction of fiberglass and aluminium. However, both containers have been assumed to be made entirely of stainless steel because the contribution of fiberglass and aluminium is negligible compared to the stainless steel. According to Ecoembes [28], there are 70 collection points per kilometre and, in this case, one bin per collection point having a weight of 40 kg each [55]. In Section S2 of the Supplementary Material the procedure for the calculation of the weight of bins is described.
• Underground pipes
The underground network of pipes is made of stainless steel pipes with an average length of 1 km per station line and an inner diameter of 50 cm and 12.5 mm of thickness. A 30 years lifetime is considered for them. Inside of these pipes, a stream of air transports waste bags at an average speed of 25 m/s. [55]. In Section S3 of the Supplementary Material the weight of pipe per tonne of waste collected is estimated.

3. Results and Discussion

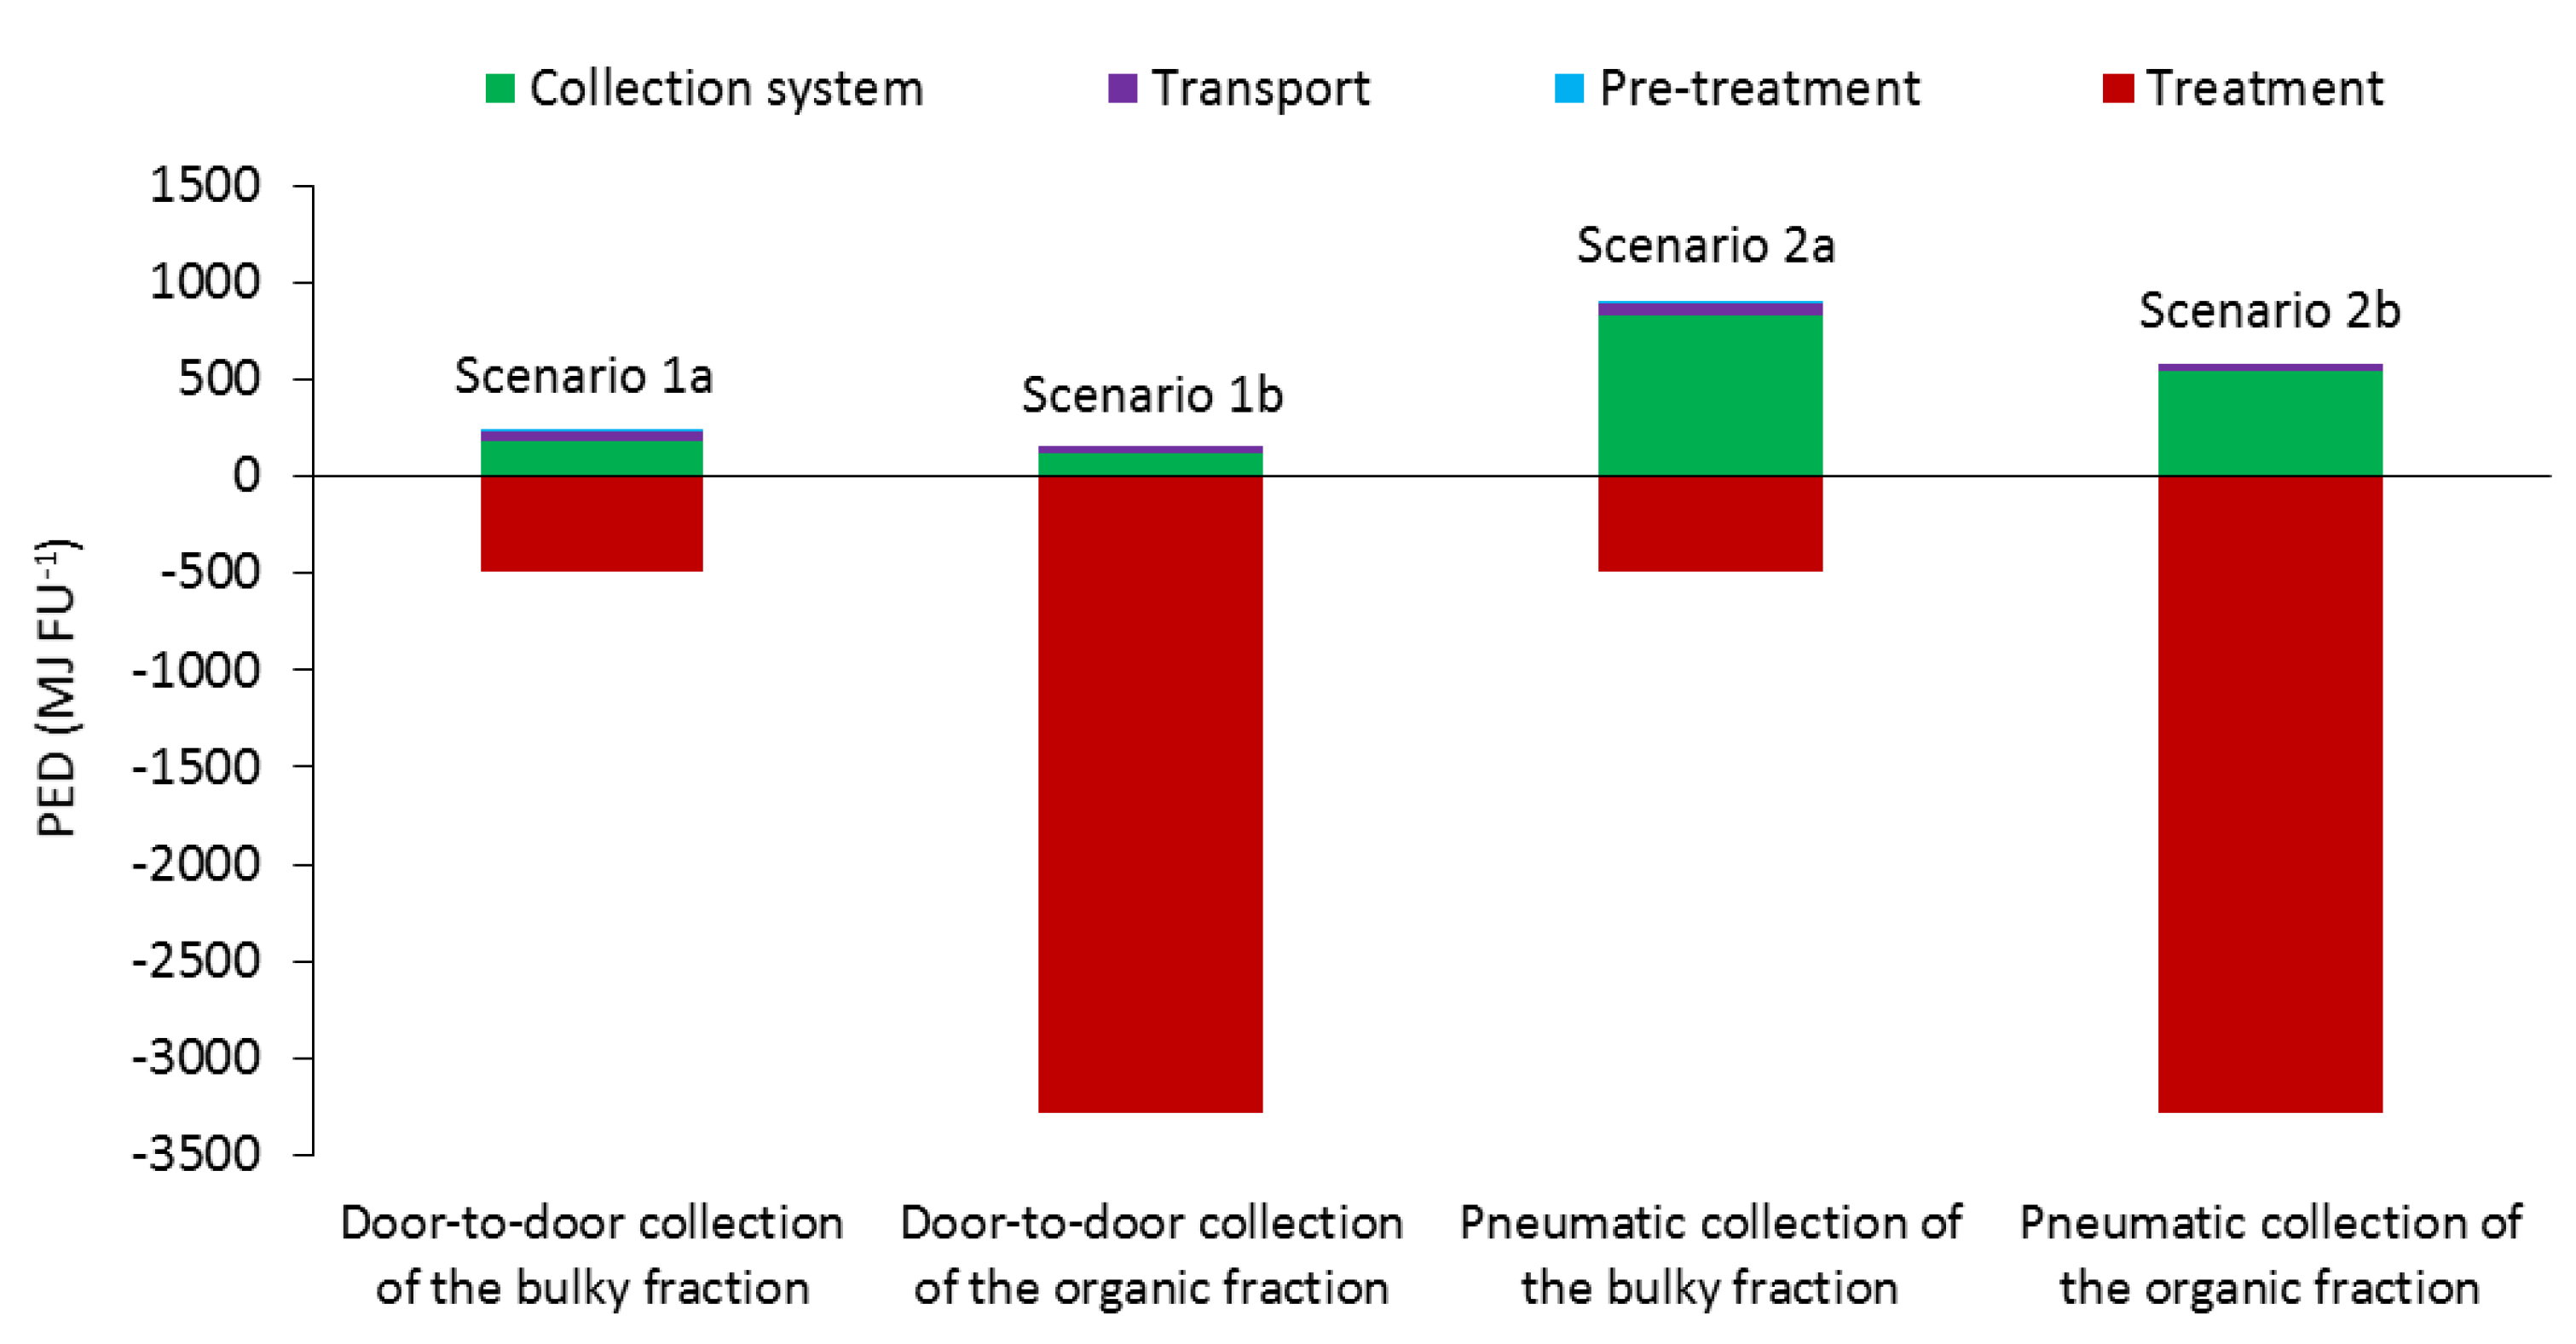
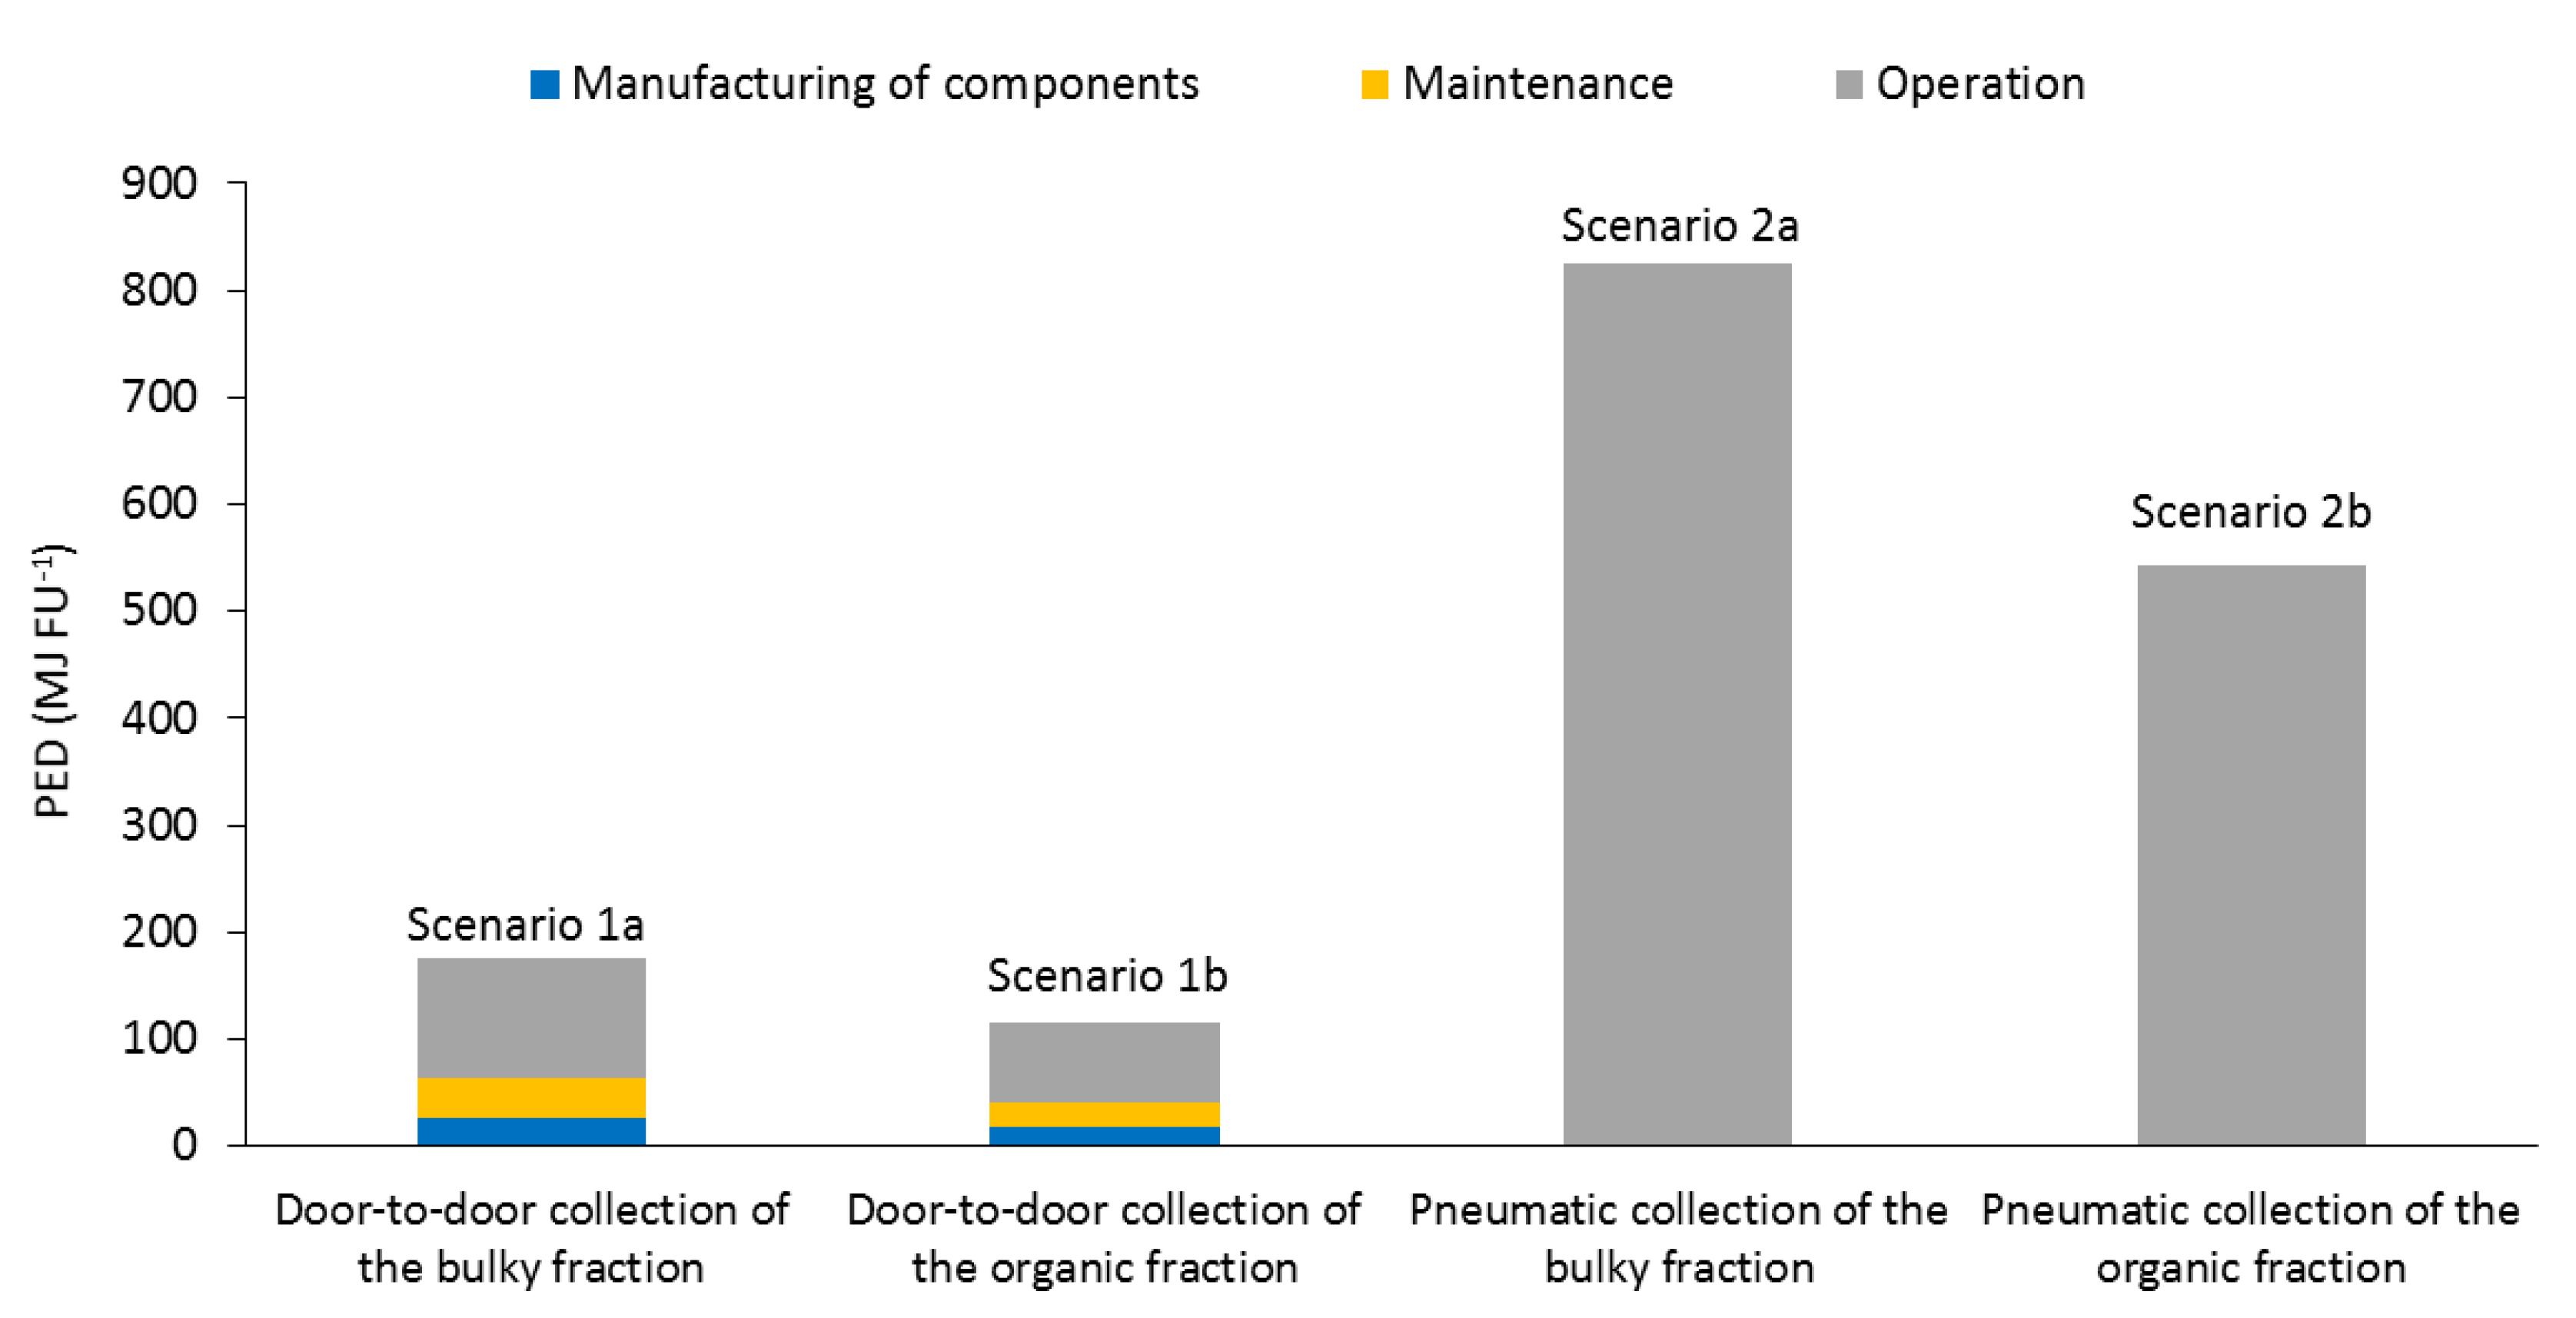
3.1. Comparison of the Two Waste Collection Systems

The four scenarios were assessed following the LCA methodology. Figure 5 shows the primary energy demand (PED) results per FU, also cited as cumulative energy demand (CED), an indicator commonly used to assess waste management systems [56]. The results are divided into the four stages of the life cycle (collection, transport, pre-treatment and treatment). As it can be observed, the results change significantly when the organic fraction is collected separately (scenarios 1b and 2b) compared to scenarios 1a and 2a where the bulky fraction includes the biodegradable fraction. In this case, the PED of scenarios 1b and 2b is similar: −3,128 MJ and −2,701 MJ, respectively. The negative values are associated to the energy savings of the anaerobic digestion process. This is because the environmental benefits of electricity and compost production displace the environmental impact of production of electricity from the Spanish grid mix of 2016 and the production of fertilizers, and overcomes the energy inputs of the collection system. It is important to correctly calculate the credits obtained through material recycling and energy recovery [32]. Those results indicate that, when the biowaste is collected separately and, considering the composting of these residues, the use of a pneumatic system could be a suitable option, as well as the door-to-door collection was. However, when the bulky fraction includes the biodegradable fraction, pneumatic collection (scenario 2a) exhibits the largest PED, estimated at 405 MJ per FU, whereas the door-to-door collection presents negative PED values (−245 MJ). The reason is that the energy demand for the vacuum system is higher than the energy recovered from the composting process. Authors such as Iriarte et al. [30] and Punkkinen et al. [38] stated that the system with the greatest environmental impact is the pneumatic collection compared to door-to-door and multi-container collection. Nevertheless, these studies only include the collection stage, without the subsequent waste valorisation treatment and environmental benefits. On the other hand, considering the CED indicator, Iriarte et al. [30] stated that the door-to-door system had the greatest energy demand, in particular 38% higher than the pneumatic system. In our study, this difference between door-to-door and pneumatic collection is lower, around 14%, due to the energy requirement for the anaerobic process. Finally, the contribution of the MSW transportation to the pre-treatment installation and the contribution of the pre- treatment in the sorting plant was negligible, around 1% (in case of scenarios 1b and 2b the pre-treatment stage is not necessary, therefore, its contribution to the total PED is zero). These results reinforce the idea that the use of the pneumatic system could be an appropriate waste collection system in the development and the implementation of smart city technologies in historic areas of cities [57]. As mentioned previously, official data sets that street-side containers is the most common MSW collection system used. In addition, some authors such as Iriarte et al. [30] and Aranda-Usón et al. [39] have stated that this collection system presents the lowest environmental impact. However, since the main objective of this study is assessing the management of the organic fraction generated in historic areas of cities where the conventional street-side collection systems is not feasible due to traffic restrictions, this type of collection was excluded from the study. In this sense, there is a debate about which is the best collection system for these areas. Currently, there are not studies that address this problem from an environmental point of view and, in particular, under an energy and climate change perspective. In this sense, historic areas of cities are suitable zones to apply smart city technologies where monitoring and information are essential for the correct management of these areas. The management of MSW is an example for this purpose.
Figure 6 focuses on the collection system stage and displays the PED consumption of each process of the waste collection system (manufacturing of components, maintenance and operation). As can be observed in Figure 6, when the waste collection system is considered isolated, the pneumatic collection consumes 5.0 times more primary energy than the door-to-door collection. This is in agreement with Iriarte et al. [30] and Punkkinen et al. [38] and highlights the importance of considering the subsequent waste valorisation treatment and environmental benefits. Regarding the contribution of the different processes, in the conventional door-to-door collection (scenarios 1a and 1b), fuel production for garbage trucks in the operation step was responsible for 64% of the PED. The rest of PED is attributed to the production and maintenance of containers (36%). On the other hand, in the pneumatic system, the production of electricity used in the process accounts for almost 100% of the total PED, whereas the manufacturing of bins and pipelines and its maintenance is negligible compared to the consumption of energy.
According to the results of the study, the electricity requirements for vacuum production is the item with the most impact. Therefore, reducing energy consumption for waste transport through the underground system and using a more environmentally friendly energy source, such as renewable energies [58], are the best improvement measures to ensure the sustainability of the pneumatic process, since waste management and energy supply systems are becoming more inter-connected [59]. This study contributes to decision-making in waste management strategies and enables the introduction of the environmental variable in the design model of smart cities. In addition, this study comprises the basis for the future optimisation of pneumatic collection as hybrid systems feed by renewable energies, such as photovoltaic installations.

3.2. Sensitivity Analysis

Our results in the baseline case study depend on many assumptions concerning the installation of the pneumatic system. Particularly, the effectiveness of the biodegradable collection, the number of waste collection points in the pneumatic system and the population density were examined.

3.2.1. Effectiveness of the Biodegradable Collection

The energy efficiency of the pneumatic collection system depends on the attitude of the citizens towards the introduction of the selective collection of the organic fraction. In this sense, a sensitivity analysis was performed varying the effectiveness of the biodegradable collection, considering the best scenarios (scenarios 1b and 2b), in which 100% of the organic waste generated is collected separately, together with less-efficient scenarios in which part of the organic fraction is collected separately and the rest remains in the bulky fraction. Figure 7 shows the results of the sensitivity analysis.
As previously mentioned, the negative values are associated with the energy savings from the composting process. When the efficiency varies from 100% to 40%, the energy savings are reduced to 57% for door-to-door collection and to 66% for the pneumatic system. Therefore, these results highlight the importance of people awareness and information campaigns about the benefits of the biodegradable waste being recycled and aim at emphasizing the role that consumers play in biowaste separation at source [17].

3.2.2. Population Density

Taking as reference 20,000 citizens per km2, to see how the environmental impact is influenced by higher densities and, therefore, larger waste volumes, the number of citizens was increased up to 80,000 citizens per km2. Given the fixed capacity of the collection system, the PED will be established by the increase in the emptying frequency due to the increase in the waste volumes. For the sake of comparison, the management of higher waste volumes in the door-to-door collection requires either a fourfold increase in waste containers, a four times higher emptying frequency, or an intermediate solution. In this case, a higher emptying frequency is considered [27].
The increase in the population density in a specific zone is mainly due to tourism. In Spain, cities such as Fuengirola (Málaga), Benidorm (Alicante), Ibiza (Balearic Islands) and Salou (Tarragona) experiment an increase of between 65–75% in their population density due to tourism [60]. The tourism can sustain high levels of employment and incomes in the economies of many regions, but the sector is a source of environmental impacts, resource consumption and public health problems [61]. In particular, one of the most important impacts of tourism is the generation of MSW. According to Mateu-Sbert et al. [61], on average, an increase of 1% in the tourist population in Menorca causes an overall MSW raise of 0.282%. Following this statement and considering that a population density of 20,000 citizens/km2 generate around 1,936 metric tons of MSW per year [27], the increase of the waste volume due to the raise of the population density was estimated. On the other hand, the composition of generated MSW is extremely variable as a consequence of seasonal and lifestyle impacts, in particular in historic areas of cities, which are a tourist attraction [62]. In this sense, it is considered that the increase in the population density affects the waste composition. A population density of 20,000 citizens/km2 in winter, could corresponds to 40,000 citizens/km2 in autumn period, reaching 60,000 and 80,000 citizens/km2 in spring and summer, respectively. Figure 8 displays the different waste generation and composition for each population density considered.
The amount of MSW increases from 1,936 metric tons with 20,000 citizens per km2 to 2,586 metric tons when the population density reaches 80,000 citizens per km2. Regarding the waste composition, there is no a great difference in the organic content, varying from 36% in winter to 41% in spring. These results were introduced into the environmental model previously described to analyse the model sensitivity to changes in the population density. Figure 9 displays the results of PED obtained for door-to-door collection and pneumatic collection of the biodegradable fraction. It can be observed that the higher increase in the population density, the greater negative value of the PED, which means a higher recovery of energy from the treatment of the MSW. An increase of 75% of the population density means 27% of PED savings for both collection systems. These results indicate that, even though the increase of MSW generation implies a higher emptying frequency for the door-to-door collection, and a higher use of energy for the pneumatic collection, since more daily pneumatic transportation is needed, the savings from the anaerobic digestion treatment are higher.

4. Conclusions

In this study, pneumatic collection is presented as an alternative to conventional trucking systems, reducing noise and odour effects, presenting potential space savings, increasing pedestrian areas, and apparently decreasing resource consumption. The energy assessment of door-to-door and pneumatic collection, focusing on the biodegradable fraction collection and its subsequent recycling by anaerobic digestion indicated that, when the organic fraction is collected separately, out of the bulky fraction, the pneumatic collection could be a suitable alternative because the energy requirements are balanced with the savings from the anaerobic digestion process. These results highlight the idea that energy recovery from MSW is a feasible alternative to face the challenge to move towards smart cities. Moreover, the combination of this technology with renewable energy supply, such as solar and wind (when high insolation and land availability are present), and new information and communications technologies, such as sensors to retrieve the fill level of containers, could be a good option to handle the cities transition along with the implementation of encouraging renewable technologies.
In the performed sensitivity analysis, one of the variables that potentially have a significant impact on the results is the effectiveness of the biodegradable fraction collection since when the efficiency varies from 100% to 40%, the energy savings are reduced to 57% for door-to-door collection and to 66% for the pneumatic system. This result highlights the importance of people awareness and information campaigns about the benefits of the biodegradable waste selective collection. On the other hand, other variable with potential influence on the results is the population density. An increase of 75% of the population density means 27% of PED savings for both collection systems due to the avoided impacts from the anaerobic digestion treatment.
This study aims to develop a general suitable model for Spain, based on average values, facilitating the decision-making process for the MSW collection and management. It is important to highlight the need of carrying out specific case studies with the aim of validating the model and to support the results of this work.

5. Proclamations

Due to the rapid growth of the world population, improvements in urban environments, structures and services are necessary to meet citizen’s needs. New technologies open the door to innovative systems, to move conventional cities towards becoming smart cities. The generation and management of MSW is an important issue in the development and management of smart cities, where waste collection has a significant influence on the environmental sustainability. European Directives enhance selective collection systems and recycling of different MSW fractions, ensuring the capability of smart cities to move towards a circular economy. In addition, the current trend of decreasing the amount of waste disposed in landfills fosters the selective collection of the biodegradable fraction and its subsequent treatment by means of anaerobic digestion. The selective collection of MSW, in particular the organic waste, in historic areas of cities is an issue which has opened the door to a discussion in Spain about which is the best collection system for these zones, since the conventional street-side collection systems is not feasible due to traffic and access restrictions. In those areas where the lack of historical remains that can compromise the installation of the system is guaranteed, and from an energy point of view, this study encourages the use of pneumatic collection. However, in order to make a more comprehensive study, the energy assessment of the collection systems should be complemented including social and economic aspects, whose deployment can shift the balance towards one or another management options. In addition, an environmental sustainability evaluation of the collection systems could confirm the benefits of pneumatic collection mainly due to the environmental benefit deriving from the anaerobic digestion of the organic fraction, as stated some authors such as Ranieri et al. [63] and Digiesi et al. [64].

Supplementary Materials

The following are available online at https://www.mdpi.com/1996-1073/12/7/1407/s1, Section S1: Waste collection plant, Section S2: Central collection points, Section S3: Underground pipes.

Author Contributions

Conceptualization, R.A.; Formal analysis, A.B., P.F.-i.-P., A.I. and R.A.; Investigation, J.L. and I.G.-H.; Methodology, A.B., P.F.-i.-P., A.I. and R.A.; Supervision, M.M. and R.A.; Writing–original draft, J.L. and I.G.-H.; Writing–review & editing, J.L., I.G.-H. and A.B.

Funding

This work has been made under the financial support of the Project Ceres-Procom: Food production and consumption strategies for climate change mitigation (CTM2016-76176-C2-1-R) (AEI/FEDER, UE) financed by the Ministry of Economy and Competitiveness of the Government of Spain.

Acknowledgments

The authors want to acknowledge the earlier contributions within the LIFE+ project: FENIX-Giving Packaging a New Life (LIFE08ENV/E/000135) by Bala, A. and Fullana-i-Palmer, P.; and to the UNESCO Chair in Life Cycle and Climate Change. In this respect, the authors are responsible for the choice and presentation of the information contained in this paper as well as for the opinions expressed therein, which are not necessarily those of UNESCO and do not commit this Organization.

Conflicts of Interest

The authors declare no conflicts of interest.

References

  1. Anagnostopoulos, T.; Zaslavsky, A.; Kolomvatsos, K.; Medvedev, A.; Amirian, P.; Morley, J.; Hadjieftymiades, S. Challenges and opportunities of waste management in IoT-enabled smart cities: A survey. IEEE Trans. Sustain. Comput. 2017, 2, 275–289. [Google Scholar] [CrossRef]
  2. Talari, S.; Shafie-Khah, M.; Siano, P.; Loia, V.; Tommasetti, A.; Catalao, J.P.S. A review of smart cities based on the internet of things concept. Energies 2017, 10, 421. [Google Scholar] [CrossRef]
  3. Taheri, M.; Gholamalifard, M.; Ghazizade, M.J.; Rahimoghli, S. Environmental impact assessment of municipal solid waste disposal site in Tabriz, Iran using rapid impact assessment matrix. Impact Assess. Proj. Apprais. 2014, 32, 162–169. [Google Scholar] [CrossRef]
  4. Kaza, S.; Yao, L.; Bhada-Tata, P.; Van Woerden, F.V. What a Waste 2.0. A Global Snapshot of Solid Waste Management to 2050. Urban Development; The World Bank Group: Washington, DC, USA, 2018. [Google Scholar]
  5. Capuzano, R.; González-Martínez, S. Characteristics of the organic fraction of municipal solid waste and methane production: A review. Waste Manag. 2016, 54, 3–12. [Google Scholar] [CrossRef] [PubMed]
  6. EUROSTAT. Statistical Office of the European Union. 2018. Available online: www.ec.europa.eu/eurostat/web/waste/municipal-waste-generation-and-treatment-by-treatment- (accessed on 19 October 2018).
  7. Díaz-Díaz, R.; Muñoz, L.; Pérez-González, D. The business model evaluation tool for smart cities: Application to SmartSantander use case. Energies 2017, 10, 262. [Google Scholar] [CrossRef]
  8. Albertí, J.; Balaguera, A.; Brodhag, C.; Fullana-i-Palmer, P. Towards life cycle sustainability assessment of cities. A review of background knowledge. Sci. Total Environ. 2017, 609, 1049–1063. [Google Scholar] [CrossRef]
  9. EC. European Parliament and Council Directive 1994/62/EC on Packaging and Packaging Waste. 1994. Available online: https://eur-lex.europa.eu/legal-content/EN/TXT/PDF/?uri=CELEX:31994L0062&from=EN (accessed on 19 October 2018).
  10. EC. European Parliament and Council Directive 2004/62/EC Amending Directive 94/62/EC on Packaging and Packaging Waste. 2004. Available online: https://eur-lex.europa.eu/resource.html?uri=cellar:f8128bcf-ee21-4b9c-b506-e0eaf56868e6.0004.02/DOC_1&format=PDF (accessed on 19 October 2018).
  11. EC. European Parliament and Council Directive 2010/75/EU on Industrial Emissions (Integrated Pollution Prevention and Control). 2010. Available online: https://eur-lex.europa.eu/legal-content/EN/TXT/PDF/?uri=CELEX:32010L0075&from=EN (accessed on 19 October 2018).
  12. EC. European Council Directive 1999/31/EC on the Landfill of Waste. 1999. Available online: https://eur-lex.europa.eu/legal-content/EN/TXT/PDF/?uri=CELEX:31999L0031&from=EN (accessed on 19 October 2018).
  13. EC. European Parliament and Council Directive 2008/98/EC on Waste and Repealing Certain Directives. 2008. Available online: https://eur-lex.europa.eu/legal-content/EN/TXT/PDF/?uri=CELEX:32008L0098&from=EN (accessed on 19 October 2018).
  14. Arushanyan, Y.; Björklund, A.; Eriksson, O.; Finnveden, G.; Söderman, M.L.; Sundqvist, J.; Stenmarck, A. Environmental assessment of possible future waste management scenarios. Energies 2017, 10, 247. [Google Scholar] [CrossRef]
  15. UNDP. Sustainable Development Goals. 2015. Available online: https://www.un.org/sustainabledevelopment/sustainable-development-goals/ (accessed on 19 October 2018).
  16. MITECO. Introducción a los Modelos de Gestión de Residuos (Introduction to the Residues Management Models). 2018. Available online: /www.miteco.gob.es/es/calidad-y-evaluacion-ambiental/temas/prevencion-y-gestion-residuos/flujos/domesticos/gestion/modelo_gestion/Default.aspx (accessed on 19 October 2018). (In Spanish).
  17. Bernad-Beltrán, D.; Simó, A.; Bovea, M.D. Attitude towards the incorporation of the selective collection of biowaste in a municipal solid waste management system. A case study. Waste Manag. 2014, 34, 2434–2444. [Google Scholar] [CrossRef]
  18. Di Mateo, U.; Nastasi, B.; Albo, A.; Astiaso-Garcia, D. Energy contribution of OFMSW (organic Fraction of Municipal Solid Waste) to energy-environmental sustainability in urban areas at small scale. Energies 2017, 10, 229. [Google Scholar] [CrossRef]
  19. Laso, J.; Hoehn, D.; Margallo, M.; García-Herrero, I.; Batlle-Bayer, L.; Bala, A.; Fullana-i-Palmer, P.; Vázquez-Rowe, I.; Irabien, A.; Aldaco, R. Assessing energy and environmental efficiency of the Spanish agri-food system using the LCA/DEA methodology. Energies 2018, 11, 3395. [Google Scholar] [CrossRef]
  20. Garcia-Herrero, I.; Hoeh, D.; Margallo, M.; Laso, J.; Bala, A.; Batlle-Bayer, I.; Fullana, P.; Vázquez-Rowe, I.; Gonzalez, M.J.; Durá, M.J.; et al. On the estimation of potential food waste reduction to support sustainable production and consumption policies. Food Policy 2018, 80, 24–38. [Google Scholar] [CrossRef]
  21. Thyberg, K.L.; Tonjes, D.J. Drivers of food waste and their implications for sustainable policy development. Resour. Conserv. Recycl. 2016, 106, 110–123. [Google Scholar] [CrossRef]
  22. Gustavsson, J.; Cederberg, C.; Sonesson, U.; van Otterdijk, R.; Meybeck, A. Global Food Losses and Food Waste: Extent, Causes and Prevention; Food and Agriculture Organization of the United Nations (FAO): Rome, Italy, 2011. [Google Scholar]
  23. Gustavsson, J.; Cederberg, C.; Sonesson, U.; Emanuelsson, A. The Methodology of the FAO Study: “Global Food Losses and Food Waste–Extent, Causes and Prevention”–FAO; The Swedish Institute for Food and Biotechnology (SIK): Göteborg, Sweden, 2013. [Google Scholar]
  24. Ley 22/2011. de 28 de Julio, de Residuos y Suelos Contaminados. BOE-A-2011-13046. 2011. Available online: https://www.boe.es/buscar/act.php?id=BOE-A-2011-13046 (accessed on 19 October 2018).
  25. Residuos Profesional. Galdakao Implanta la Recogida Neumática de Materia Orgánica (Galdakao Set up the Pneumatic Collection of Organic Residues). 2014. Available online: www.residuosprofesional.com/galdakao-implanta-la-recogida-neumatica-de-materia-organica/ (accessed on 22 December 2018). (In Spanish).
  26. Madridfree. Madrid Estrena el Contenedor Marrón de Materia Orgánica (Madrid Launches the Brown Container of Organic Residues). 2017. Available online: www. madridfree.org/madrid-contenedor-marron/ (accessed on 19 October 2018). (In Spanish).
  27. Teerioja, N.; Moliis, K.; Kuvaja, E.; Ollikainen, M.; Punkkinen, H.; Merta, E. Pneumatic vs. door-to-door waste collection systems in existing urban areas: A comparison of economic performance. Waste Manag. 2012, 32, 1782–1791. [Google Scholar] [CrossRef]
  28. Ecoembes. 2018. Available online: www.ecoembes.com (accessed on 15 October 2018).
  29. Avfall Sverige. Swedish Waste Management; Swedish Waste Management and Recycling Association: Malmö, Sweden, 2016; Available online: https://www.avfallsverige.se/in-english/ (accessed on 15 October 2018).
  30. Iriarte, A.; Gabarrell, X.; Rieradevall, J. LCA of selective waste collection systems in dense urban areas. Waste Manag. 2009, 29, 903–914. [Google Scholar] [CrossRef]
  31. ISO 14040. Environmental Management–Life Cycle Assessment–Principles and Framework; International Organization for Standardization: Geneva, Switzerland, 2006. [Google Scholar]
  32. Bala, A.; Raugei, M.; Fullana-i-Palmer, P. Introducing a new method for calculating the environmental credits of end-of-life material recovery in attributional LCA. Int. J. Life Cycle Assess. 2015, 20, 645–654. [Google Scholar]
  33. Mora, C.; Manzini, R.; Gamberi, M.; Cascini, A. Environmental and economic assessment for the optimal configuration of a sustainable solid waste collection system: A “kerbside” case study. Prod. Plan. Control 2014, 25, 737–761. [Google Scholar] [CrossRef]
  34. Gilardino, A.; Rojas, J.; Mattos, H.; Larrea-Gallegos, G.; Vázquez-Rowe, I. Combining operational research and Life Cycle Assessment to optimize municipal solid waste collection in a district in Lima (Peru). J. Clean. Prod. 2017, 156, 589–603. [Google Scholar] [CrossRef]
  35. Pérez, J.; Lumbreras, J.; de la Paz, D.; Rodríguez, E. Methodology to evaluate the environmental impact to urban solid waste containerization system: A case study. J. Clean. Prod. 2017, 150, 197–213. [Google Scholar] [CrossRef]
  36. Pires, A.; Sargedas, J.; Miguel, M.; Pina, J.; Martinho, G. A case study of packaging waste collection systems in Portugal–Part II: Environmental and economic analysis. Waste Manag. 2017, 61, 108–116. [Google Scholar] [CrossRef]
  37. Yildiz-Geyhan, E.; Altun-Ciftçioglu, G.A.; Neset Kadirgan, M.A. Social life cycle assessment of different packaging waste collection system. Resour. Conserv. Recycl. 2017, 124, 1–12. [Google Scholar] [CrossRef]
  38. Punkkinen, H.; Merta, E.; Teerioja, N.; Moliis, K.; Kuvaja, E. Environmental sustainability comparison of a hypothetical pneumatic waste collection system. Waste Manag. 2012, 32, 1775–1781. [Google Scholar] [CrossRef]
  39. Aranda-Usón, A.; Ferreira, G.; Zambrana-Vázquez, D.; Zabalza-Bribián, I.; Llera-Sastresa, E. Environmental-benefit analysis of two urban waste collection systems. Sci. Total Environ. 2013, 463–464, 72–77. [Google Scholar] [CrossRef]
  40. Keucken, A.; Habagil, M.; Batstone, D.; Jeppsson, U.; Arnell, M. Anaerobic co-digestion of sludge and organic food waste-performance, inhibition and impact on the microbial community. Energies 2018, 11, 2325. [Google Scholar] [CrossRef]
  41. Margallo, M.; Onandía, R.; Aldaco, R.; Irabien, A. When life cycle thinking is necessary for decision making: Emerging cleaner technologies in the chlor-alkali industry. Chem. Eng. Trans. 2016, 52, 475–480. [Google Scholar]
  42. ISO 14044. Environmental Management–Life Cycle Assessment–Requirements and Guidelines; International Organization for Standardization: Geneva, Switzerland, 2006. [Google Scholar]
  43. Guinée, J.B.; Udo de Haes, H.A.; Huppes, G. Quantitative life cycle assessment of products. 1: Goal definition and inventory. J. Clean. Prod. 1993, 1, 3–13. [Google Scholar] [CrossRef]
  44. Rebitzer, G.; Ekvall, T.; Frischknecht, R.; Hunkeler, D.; Norris, G.; Rydberg, T.; Schmidt, W.P.; Suh, S.; Weidema, B.P.; Pennington, D.W. Life cycle assessment–Part 1: Framework, goal and scope definition, inventory analysis, and applications. Environ. Int. 2004, 30, 701–720. [Google Scholar] [CrossRef]
  45. Ministry of Agriculture, Food and Environment of Spain. PEMAR: Plan Estatal Marco de Gestión de Residuos 2016–2022 (Waste Management Plan 2016–2022); Ministerio de Agricultura, Alimentación y Medio Ambiente de España. Ministry of Agriculture, Food and Environment of Spain: Madrid, Spain, 2015. (In Spanish) [Google Scholar]
  46. Cobo, S.; Dominguez-Ramos, A.; Irabien, A. Trade-offs between nutrient circularty and environmental impacts in the management of organic waste. Environ. Sci. Technol. 2018, 52, 10923–10933. [Google Scholar] [CrossRef]
  47. Hoehn, D.; Margallo, M.; Laso, J.; García-Herrero, I.; Bala, A.; Fullana-i-Palmer, P.; Irabien, A.; Aldaco, R. Energy Embedded in Food Loss Management and in the Production of Uneaten Food: Seeking a Sustainable Pathway. Energies 2019, 12, 767. [Google Scholar] [CrossRef]
  48. Garcia-Herrero, I.; Margallo, M.; Onandía, R.; Aldaco, R.; Irabien, A. Environmental challenges of the chlor-alkali production: Seeking answers from a life cycle approach. Sci. Total Environ. 2017, 580, 147–157. [Google Scholar] [CrossRef]
  49. Righi, S.; Oliviero, L.; Pedrini, M.; Buscaroli, A.; Della Casa, C. Life Cycle Assessment of management systems for sewage sludge and food waste: Centralized and decentralized approaches. J. Clean. Prod. 2013, 44, 8–17. [Google Scholar] [CrossRef]
  50. MERMA, Spanish Ministry of Environment and Rural and Marine Affairs. Agencia d’Ecologia Urbana de Barcelona. Diagnóstico de la Gestión de Residuos de Competencia Municipal. Caso 2: Modelo 4 Contenedores. Aplicación del Programa SIMUR (Municipal Waste Management Diagnosis. Case 2: 4 Containers Model. SIMUR Programme Application). 2011. Available online: www.mapama.gob.es/ca/calidad-y-evaluacion-ambiental/temas/prevencion-y-gestion-residuos/simur_marm_caso_5__4cont_tcm8-230480.pdf (accessed on 14 March 2018). (In Spanish).
  51. Thinkstep. Gabi 6 Software and Database on Life Cycle Assessment; Thinkstep: Leinfelden-Echterdingen, Germany, 2017. [Google Scholar]
  52. Envac. Situación de la Recogida Automática o Neumática de Residuos en España y en la Región sur de Europa, Sistemas Sostenibles de Recogida Neumática de Residuos. (State of the Art of the Automatic or Pneumatic Collection of Residues in Spain and South Europe Region, Sustainable Systems of Pneumatic Collection of Residues. 2010. Available online: https://www.envac.es/ (accessed on 14 March 2018). (In Spanish).
  53. Ros Roca. Recogida Neumática de Residuos, Descripción General del Sistema, Fichas Técnicas Centrales de Recogida. (Pneumatic Collection of Residues, General Description of the System, Collection Data Sheets). 2011. Available online: www.rosroca.es/es/ (accessed on 19 October 2018). (In Spanish).
  54. Hernandez, C. Recogida Neumática de Residuos Sólidos Urbanos, España. Conama10, Congreso Nacional del Medio Ambiente. (National Congress of Environment. Pneumatic Collection of Municipal Solid Waste, Spain); Congress Communication: Madrid, Spain, 2010; Available online: http://www.conama10.conama.org/conama10/download/files/CT%202010/40864.pdf (accessed on 18 October 2018). (In Spanish)
  55. Medina-Díaz, R. Ecodiseño y Sostenibilidad en el Sistema de Recogida de los RSU. (Eco-Designing and Sustainability in the Collection of MSW). Proyecto de fin de Carrera; Universidad Pontificia Comillas–Escuela Técnica Superior de Ingeniería (ICAI): Madrid, Spain, 2009; Available online: https://www.iit.comillas.edu/pfc/resumenes/4a30edc029ec1.pdf (accessed on 18 October 2018). (In Spanish)
  56. Puig, R.; Fullana-i-Palmer, P.; Baquero, G.; Riba, J.; Bala, A. A Cumulative Energy Demand indicator (CED), Life Cycle based, for Industrial Waste Management decision making. Waste Manag. 2013, 33, 2789–2797. [Google Scholar] [CrossRef]
  57. Popa, C.L.; Carutasu, G.; Cotet, C.E.; Carutasu, N.L.; Dobrescu, T. Smart city platform development for an automated waste collection system. Sustainability 2017, 9, 2064. [Google Scholar] [CrossRef]
  58. Zhang, T.; Wang, M.; Yang, H. A review of the energy performance and life-cycle assessment of buildings-integrated photovoltaic (BIPV) systems. Energies 2018, 11, 3157. [Google Scholar] [CrossRef]
  59. Eriksson, O. Energy and waste management. Energies 2017, 10, 1072. [Google Scholar] [CrossRef]
  60. INE. Instituto Nacional de Estadística (Spanish Statical Office). 2018. Available online: https://www.ine.es/ (accessed on 11 March 2019).
  61. Mateu-Sbert, J.; Ricci-Cabello, I.; Villalonga-Olives, E.; Cabeza-Irigoyen, E. The impact of tourism on municipal solid waste generation: The case of Menorca Island (Spain). Waste Manag. 2013, 33, 2589–2593. [Google Scholar] [CrossRef]
  62. Gidarakos, E.; Havas, G.; Ntzamilis, P. Municipal solid waste composition determination supporting the integrated solid waste management system in the island of Crete. Waste Manag. 2006, 26, 668–679. [Google Scholar] [CrossRef]
  63. Ranieri, L.; Mossa, G.; Pellegrino, R.; Digiesi, S. Energy recovery from the organic fraction of municipal solid waste: A real options-based facility assessment. Sustainability 2018, 10, 368–383. [Google Scholar] [CrossRef]
  64. Digiesi, S.; Facchini, F.; Mossa, G.; Mummolo, G.; Verriello, R. A Cyber-based DSS for a Low Carbon Integrated Waste Management System in a Smart City. IFAC-PapersOnLine 2015, 48, 2356–2361. [Google Scholar] [CrossRef]
Figure 1. Framework of the study.
Energies 12 01407 g001
Figure 2. Municipal solid waste (MSW) containers in (a) Navarre and (b) Madrid (Spain). Source: [25,26].
Energies 12 01407 g002
Figure 3. Diagram of selective waste collection boundaries.
Energies 12 01407 g003
Figure 4. Diagram of selective waste collection scenarios under study.
Energies 12 01407 g004
Figure 5. Primary energy demand (PED) per functional unit of each scenario.
Energies 12 01407 g005
Figure 6. Primary energy demand (PED) of each process of the MSW collection system.
Energies 12 01407 g006
Figure 7. Results of the sensitivity analysis varying the effectiveness of the selective collection of the organic waste (100%, 80%, 60% and 40%).
Energies 12 01407 g007
Figure 8. Variation in the municipal solid waste (MSW) generation and composition due to the increase in the population density.
Energies 12 01407 g008
Figure 9. Results of the sensitivity analysis varying the population density of the area considered.
Energies 12 01407 g009
Table 1. Average composition of the Spanish MSW (year 2016) [45].
Municipal Solid Waste FractionPercentage
Organic Matter42%
Paper/Cardboard15%
Plastic9%
Glass8%
Other8%
Moisture and food debris7%
Textile5%
Metals3%
Wood2%
Bricks1%
Table 2. Life cycle inventory for door-to-door collection and pneumatic collection systems.
UnitsQuantity
Door-to-door collection
InputsContainerm3·FU−10.11
HDPEkg·m3 container4.61
Stainless steel cold rolledkg·m3 container1.33
Styrene-butadiene-rubberkg·m3 container0.23
Detergentkg·m3 container2.22
Waterm3· m3 container84.7
DieselL·FU−13.98
GasolineL·FU−10.07
Pneumatic collection
InputsElectricityMJ·FU−1438
Stainless steel cold rolledkg·FU−10.05
Waterm3·FU−11.00 × 10⁻⁴
Sorting plant
InputsElectricityMJ·t waste−14.86
Composting plant
InputsElectricityMJ· t waste−1446
Lubricantkg·FU−1 t waste−10.10
Waterkg· t waste−1186
Dieselkg· t waste−10.64
OutputsBiogaskg· t waste−1333
Compostkg· t waste−1210
NH3kg· t waste−10.04
CH4kg· t waste−12.34 × 10³
COkg· t waste−10.40
HClkg· t waste−16.00 × 10⁻³
NOxkg· t waste−10.30
NMVOCkg· t waste−10.30

