Article

A Flower Pollination Method Based Global Maximum Power Point Tracking Strategy for Point-Absorbing Type Wave Energy Converters

1
Department of Electronic Engineering, Shanghai Maritime University, Shanghai 201306, China
2
Department of Energy Technology, Aalborg University, DK-9220 Aalborg, Denmark
3
Department of Electronic Engineering, City University of Hong Kong, Hongkong 999077, China
*
Authors to whom correspondence should be addressed.
Energies 2019, 12(7), 1343; https://doi.org/10.3390/en12071343
Submission received: 23 January 2019 / Revised: 4 April 2019 / Accepted: 4 April 2019 / Published: 8 April 2019

Abstract

:
To maximize the generated output power under random waves, the control strategy of maximum power point tracking (MPPT) is incorporated in point-absorbing type wave energy converter (WEC) system. However, due to the influence of mutative wave conditions, the curve of the maximum average power appears in multiple peaks, adding complexity to the tracking process. This paper proposes a new MPPT control technique for a wave power generation system, by using the flower pollination algorithm (FPA) instead of the conventional hill-climbing method. Compared with the hill-climbing method, this method has advantages of achieving a smaller peak-to-average ratio and capturing the more average power under the same sea state. The verification has been carried out through the simulations and the experimental results on a lab test bench.

1. Introduction

In recent years, the exhaustion of fossil fuel resources, environmental problems, and growing energy demands have prompted the active study of producing electricity from renewable energy sources. Among renewable energies, ocean wave energy has attracted more attention, due to its high availability and low environmental impact [1]. In addition, ocean wave energy has a quite higher energy density than solar energy and is more stable than wind energy [2,3,4]. Up to date, several wave energy converters (WEC) concepts have been studied, and the research focuses so far mainly on the mechanical structure, the hydrodynamic aspect and the energy conversion rate of different WECs [5,6,7].
Compared with larger converter units, the point absorber is one of the most promising solutions in all wave energy conversion technologies, due to its ease of both fabrication and installation [8,9]. Figure 1 shows a typical point absorber WEC, where the wave energy is captured by floating buoys and converted into linear motions. At present, there are several point-absorbing type WECs available, including Ocean Power Technology’s Powerbuoy [10] and Wavestar [11]. However, their frequency response tends to be narrow-band, which means that they will perform poorly under the irregular wave conditions. In order to improve the efficiency of point-absorbing type WEC, control strategies for optimizing wave energy capture were usually adopted [12,13], ensuring that the wave power generation system can always capture the maximum power in the real sea state. In addition, the instantaneous output power peak-to-average ratio should be limited in a reasonable range during extracting the maximum average power of wave energy, since it directly affects the cost of electromechanical systems [14].
Currently, various control methods of point-absorber type WEC for optimizing wave energy capture have been proposed, where the implementation complexity, the accuracy and the tracking speed of these techniques are different. These control techniques can be classified into four categories: (1) phase and amplitude control [15,16,17,18], (2) complex conjugate control [19,20,21], (3) model predictive control (MPC) [22,23,24], and (4) extremum-seeking control [25].
The phase and amplitude control of heaving-buoy WEC constrained by amplitude are described in [15,16,17], where the phase control is applied to keep the velocity of the buoy in phase with the excitation force of waves, producing a result similar to locking. This method is effective for achieving the maximum power extraction of the point absorber. However, the phase control requires an additional mechanism to be configured to hold and release the buoy. The results show that the phase control suffers from considerable practical challenges, significantly increasing the return on investment periods [18].
For the complex conjugate control [19,20,21], to maximize the generated power in each sea state, the damping coefficients and the stiffness coefficients of the power take-off (PTO) unit are controlled to be equal to the complex conjugate of the inherent mechanical impedance. In terms of hydrodynamics, the complex conjugate control can achieve the optimal energy extraction, as it aims to obtain resonance between the wave power generation system and the incident waves. However, a substantial amount of reactive power is required, when the resonance frequency drifts. Moreover, realizing the optimal control can lead to excessive motions, and this control technique usually requires the position and velocity of the buoys, which can easily introduce uncertain information. In addition, the application of this method is difficult under random wave conditions.
Another solution is the MPC [22,23,24], where the model is used to predict the future response of the system. This method can accurately estimate the parameters of the point-absorbing type WEC and search the maximum power point without detecting the dominant frequency of the wave. However, the future value of the wave excitation should be predicted, and the computation burden is increased. Meanwhile, the control system becomes more complex.
The superiority of extreme-seeking based on metaheuristic process in solving nonlinear optimization problems has been recognized. The extremum-seeking is a well-known control strategy that has been used with great success in other forms of renewable energy, such as solar energy and wind energy [26,27,28]. However, the extremum-seeking technology is rarely used in wave energy. The hill-climbing method is used to implement the MPPT of point-absorber type WEC [25]. This method does not need to predict the wave period of irregular waves, the added impedance, the added mass, and the buoyancy term on the WEC. However, it is found that the curve of the average power has multiple peaks, especially under irregular wave conditions. The hill-climbing method cannot search the global maximum power point among multiple extreme points, due to its monotonous search characteristics. Moreover, the step of the hill-climbing method is fixed, which will greatly affect the search time and search accuracy.
Recently, MPPT researchers witnessed the optimization of swarm optimization and meta-heuristic methods [29]. These methods had been successfully applied in the fields of solar and wind energy [30,31,32]. The main advantages associated with these methods are (1) starting with a random search, (2) avoiding the convergence to a local minimum, and (3) easy to implement.
In this paper, a new point-absorbing type WEC control strategy based on the flower pollination algorithm (FPA) is proposed for maximum wave power absorption, as also introduced in [33]. The FPA is a new nature-inspired algorithm, based on the characteristics of flowering plants [34] and the FPA had been successfully applied in the photovoltaic field [35,36]. From these literature, it is found that this method has several significant advantages, such as (1) the ability to search global space, (2) being easy to implement, (3) being easy to encode and compile, and (4) the fast convergence. When the control strategy of MPPT based on the FPA is incorporated in a point-absorbing type wave power generation system, it is not necessary to detect the wave frequency, the accurate information of the incoming excitation force, and parameters of the point-absorbing type WEC. This method can obtain the maximum power of the wave energy rapidly, the reduced power peak-to-average ratio, and less overall system costs as well.
The rest of this paper is organized as follows: The analysis model of the point-absorbing type WEC system and power spectrum are first derived in Section 2. Then, the proposed control strategy and its implementation are presented in Section 3. Further, the proposed control strategy is evaluated through simulation in Section 4 and by the experiment in Section 5, compared with the hill-climbing method. Finally, conclusions are drawn in Section 6.

2. Analysis Model of the Point-Absorbing Type WEC and Power Spectrum

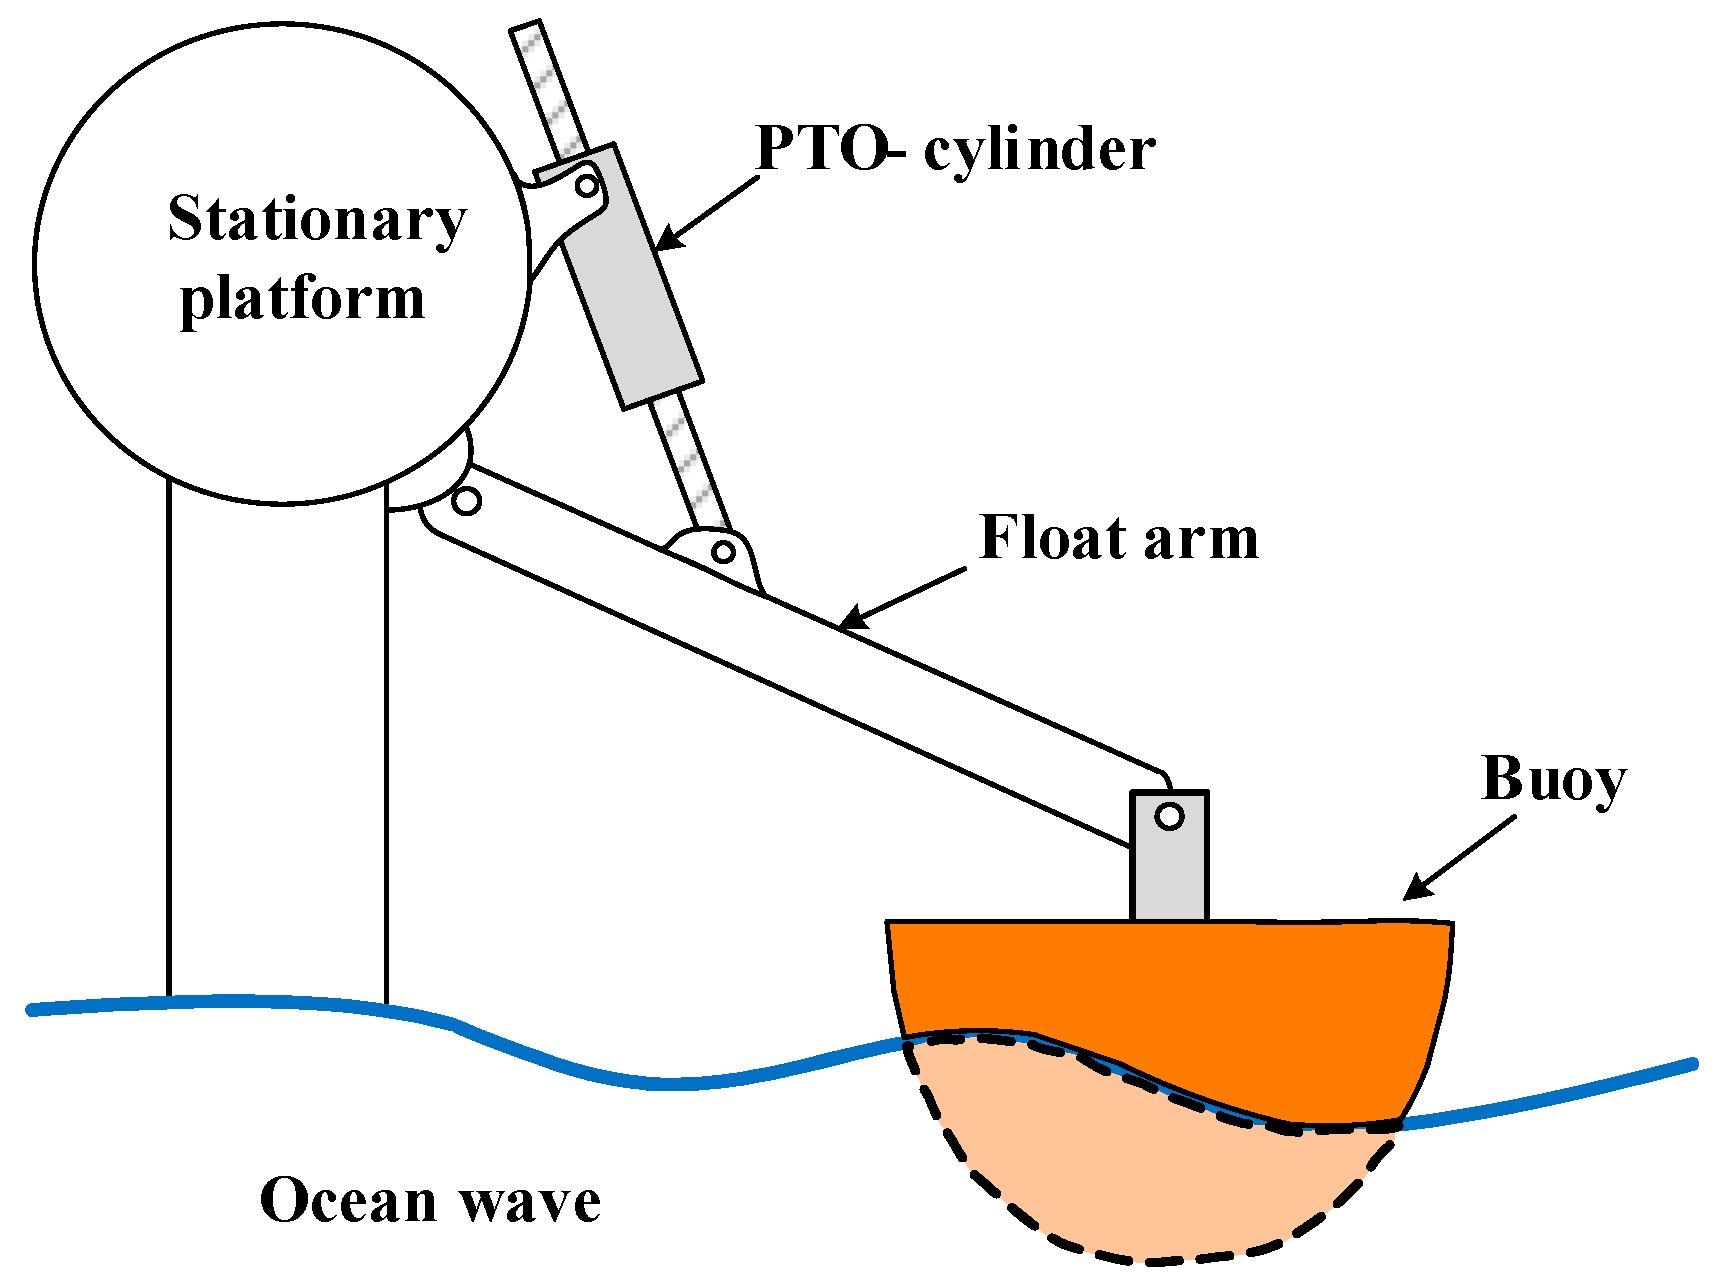
2.1. Modeling of Irregular Wave Energy and Heave-Buoy Mechanic Analysis

Ocean waves are typically irregular and consist of multiple regular waves with varying frequencies and amplitudes. To describe a sea state mathematically, the energy spectrum characteristic of ocean waves is constructed by the Bretschneider spectrum which is widely adopted based on representative sea state parameters [37]. The spectrum depends on the significant wave height H1/3 and spectrum peak period Tp, as,
S ( ω ) = 5 16 H 1 / 3 2 16 π 4 T p 4 ω 5 e 5 4 ( 2 π ω T p ) 4
The Bretschneider wave energy spectrum of the sea states 2–6 is depicted in Figure 2. The angular frequency ω of the regular waves is mainly concentrated in the range of 0.5 rad/s to 1.2 rad/s. The irregular time-domain excitation can be obtained from the energy spectrum as,
A i ( ω i ) = 2 S ( ω i ) Δ ω
F exc ( t ) = i = 1 N A i f exc ( ω i ) cos ( ω i t + φ i )
where A i ( ω i ) are the wave amplitudes, ∆ω represents the wave spectrum discretization step; f exc ( ω i ) are the excitation force coefficients, calculated by the hydrodynamics software, such as WAMIT or ANSYS AQWA in the frequency domain, and φ i are the random phase angles from 0 rad to 2π rad.
Figure 2 shows the energy spectrum obtained by the selected wave period and a significant wave height of the sea state. It can be seen that the available wave energy range is from 0.5 rad/s to 1.2 rad/s, while the wave energy density of other frequencies is quite small and can be ignored when power control is carried out in the wave power generation system. The time-domain expression of the excitation force on the float can be found [38]. An example of an excitation force curve is shown in Figure 3, with a significant wave height (H1/3 = 1.2 m) and spectrum peak period (Tp = 7.5 s).
In order to analyze the motion and control of WECs in irregular waves, a time-domain model is required [39]. According to the wave–buoy interaction, the analytical force equation is given as,
( M + m ) s ¨ ( t ) + 0 t H rad ( t τ ) s ˙ ( τ ) d τ + K s ( t ) = F PTO ( t ) + F exc ( t ) H rad ( t ) = 2 π 0 B ( ω ) cos ( ω t ) d ω
m = lim ω m ( ω )
where “.” is time derivation operation, M represents the mass of the WEC, the damping (Hrad(t)) and added mass ( m ) time-domain components can be determined in (4) and (5) from its frequency-domain parameters ( B ( ω ) and m ( ω ) ) [39], s(t) is the displacement of the buoy, K is spring stiffness, and F exc is the excitation wave force.

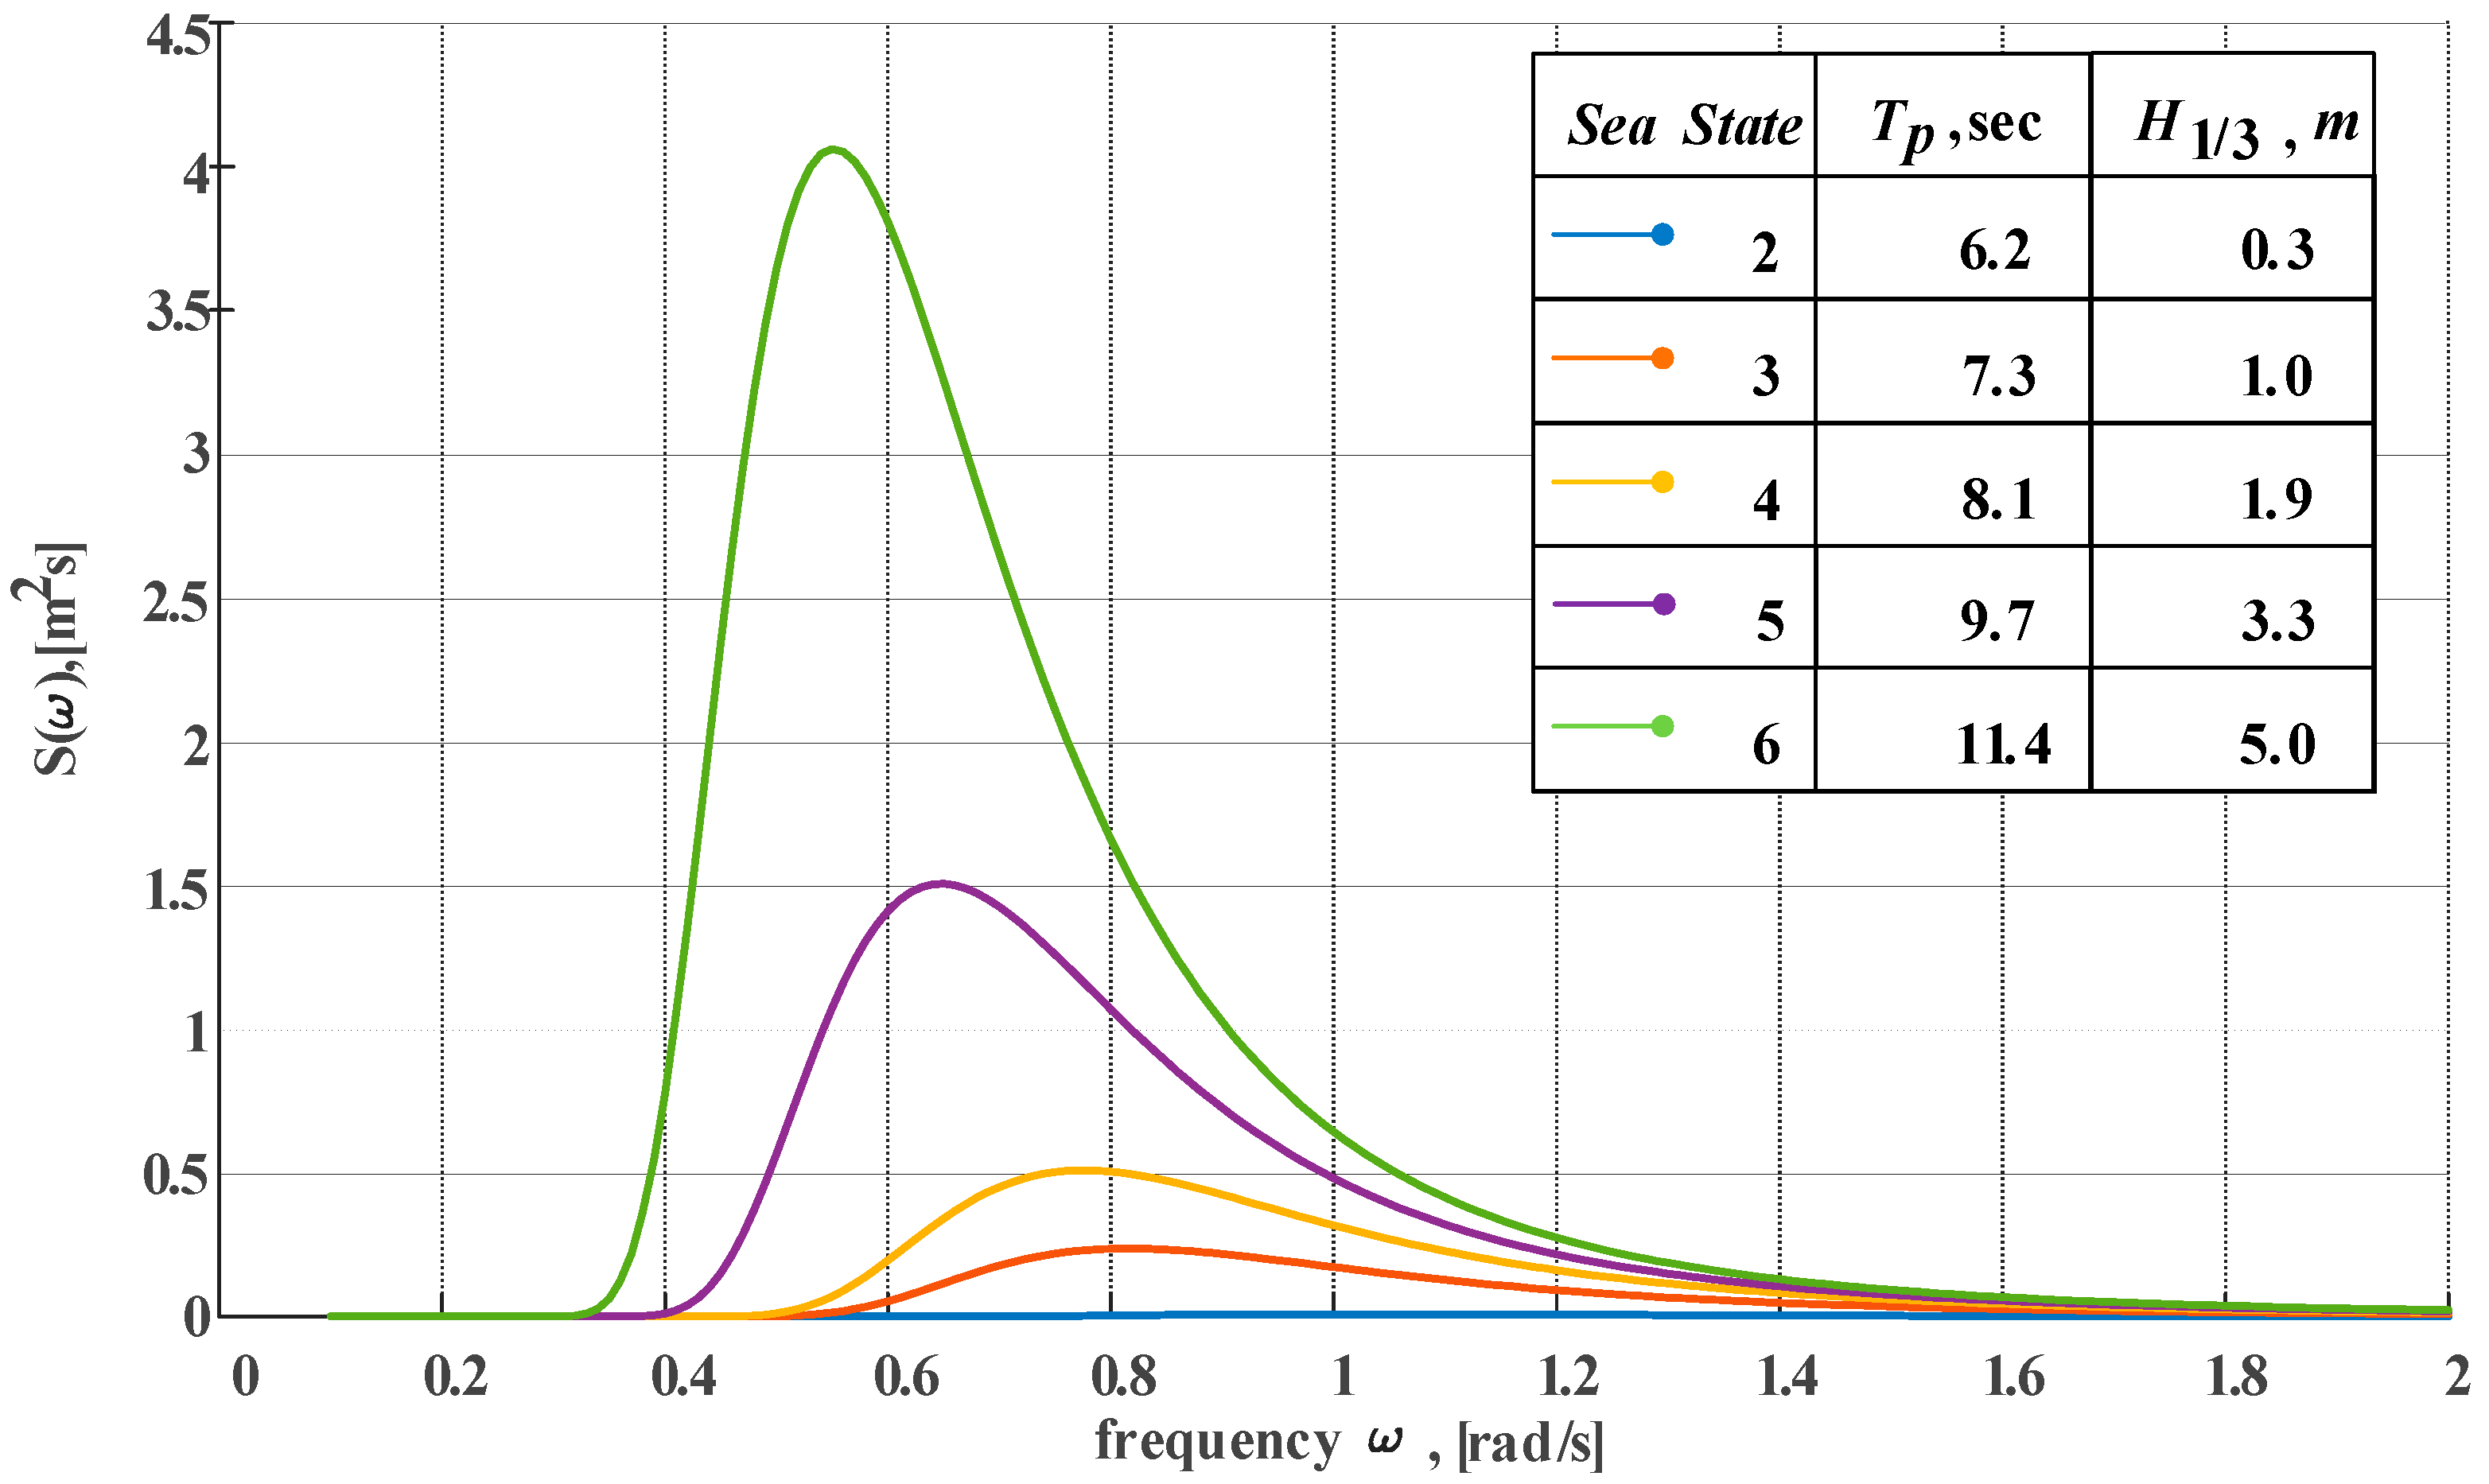
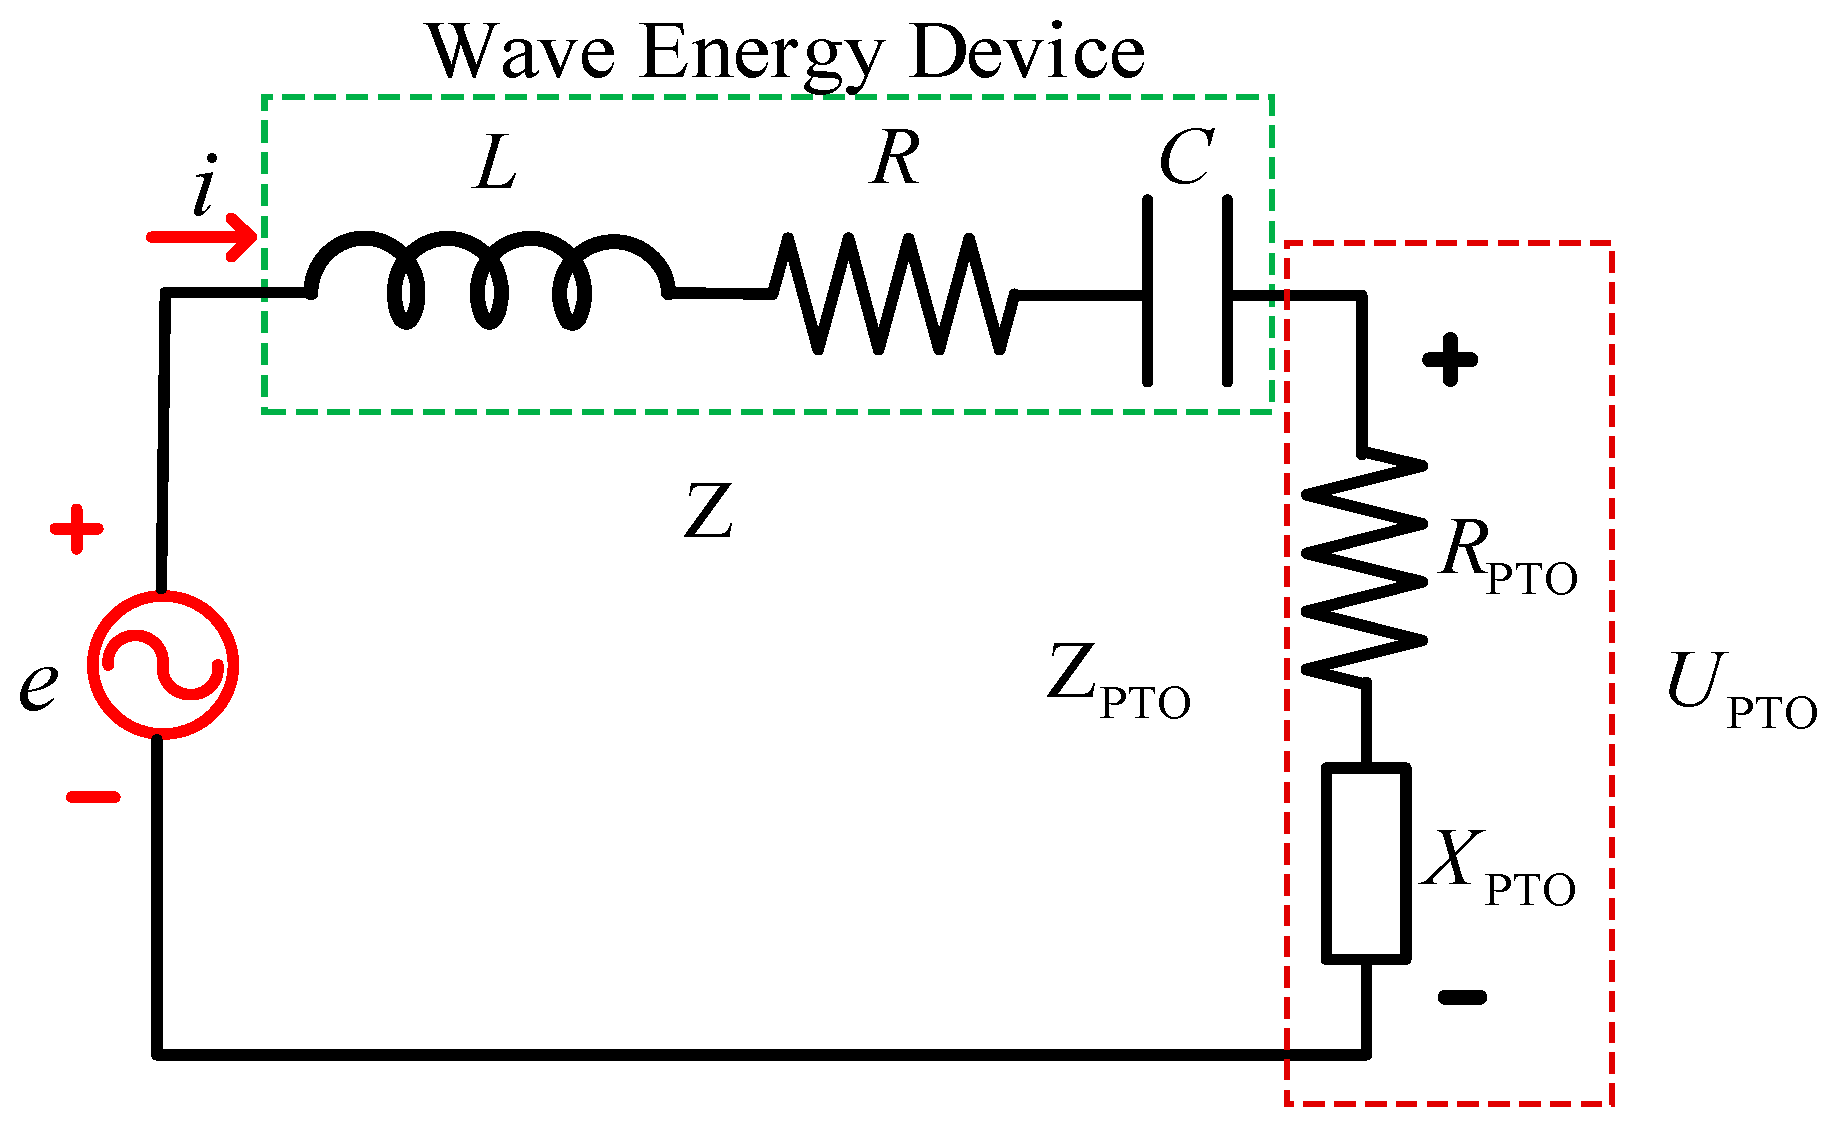
2.2. Analysis of Power Curve of Wave Power Generation System Under Irregular Wave Condition

Based on the existing literature, in order to better understand the hydrodynamic model of wave power generation system, according to Equations (4) and (5), the system can be equivalent to an RLC circuit given in Figure 4.
Figure 4 shows the equivalent electric model of the WEC, where the wave excitation force F exc corresponds to the supply voltage e, the velocity of buoy s ˙ represents the current i, the mass term ( M + m ) stands for the inductance term (L) of the WEC impedance, the spring term (K) coefficient stands for the capacitive (C), and the real component of the radiation damping ( H rad ( ω ) ) represents the resistive (R). The force applied by the PTO corresponds to the load voltage of U PTO .
Let
Z ( ω ) = R ( ω ) + j X ( ω ) = ( H rad ( ω ) ) + j [ ω ( M + m ) K ω ]
where Z ( ω ) represents the inherent mechanical impedance of the wave energy device, which is equal to the ratio of force to velocity and only related to waves and buoys, and X ( ω ) represents the reactance of the wave energy device. From (6), it can be seen that Z ( ω ) is frequency dependent, which means that each frequency corresponds to a different optimal value of Z ( ω ) . Thus, a question is raised on how to specify PTO impedance for irregular oceans with mixed frequencies.
The mechanical properties of a permanent magnet synchronous machine can be expressed by mechanical impedance,
Z PTO ( ω ) = R PTO ( ω ) + j X PTO ( ω )
where Z PTO ( ω ) is termed the equivalent mechanical impedance of the permanent magnet synchronous motor, the resistive force R PTO ( ω ) provided by the permanent magnet synchronous motor is equal to the radiation damping term, and the imaginary permanent magnet synchronous motor component X PTO ( ω ) is responsible for ensuring the resonant operating conditions [40].
When the exciting force of the wave power generation system is under irregular wave conditions, the voltage e can be expressed as follows by Equation (3),
e ( t ) = n = 1 N E n cos ( ω n t + α n )
where ω n , α n are the wave frequency and impedance angle of the nth wave frequency of the irregular wave, respectively. A phasor method is used on each frequency to derive the current and PTO load voltage of the circuit model at each frequency.
Based on Equations (7) and (8), the equivalent current and voltage in Figure 4 can be expressed as,
I ˙ n = E n cos ( ω n t + α n ) ( R n + R PTO ) + j [ X n ( ω n ) 1 ω n X PTO ]
U ˙ PTO n = E ˙ n I ˙ n Z n α n
where Rn, Zn are the resistance and impedance of the nth wave frequency of the irregular wave, respectively.
Based on (9) and (10), U PTO and i can be expressed as, PTO-n
U PTO ( t ) = n = 1 N U PTO n cos ( ω n t + φ n )
i ( t ) = n = 1 N I n cos ( ω n t + θ n )
where φ n , θ n are the phase shift angles at the nth wave frequency of irregular waves. The produced average power can be written using (11) and (12) as,
P PTO = 1 T 0 T U PTO ( t ) i ( t ) d t = 1 T 0 T [ n = 1 N U PTO n cos ( ω n t + φ n ) ] · [ n = 1 N I n cos ( ω n t + θ n ) ] d t
In the circuit model, when the voltage and current of the PTO load are generated by the same frequency wave, the average power obtained can be expressed as,
P PTO = 1 T 0 T n = 1 N U PTO n I n cos ( ω n t + φ n ) cos ( ω n t + θ n ) = 1 2 n = 1 N U PTO n I n cos ( φ n θ n )
When the voltage and current of the PTO load are generated by different frequency waves, the average power obtained can be expressed as,
P PTO = 1 T 0 T U i I j cos ( ω i t + φ i ) cos ( ω j t + φ j ) = 0 ( i j )
According to Equations (13)–(15), superimposing the average power at each frequency is the average power captured by the PTO load in the case of irregular waves. After simplification, the average power captured in the frequency domain is as follows,
P PTO ( ω ) = n = 1 N [ E n cos ( ω n t + α n ) ] 2 8 R n [ 1 1 | Z ( ω ) Z PTO ( ω ) Z ( ω ) + Z PTO ( ω ) | 2 ]
Figure 5 depicts the average power and power peak-to-average ratio curves of the system with two control variables (i.e., the damping coefficient (RPTO) and the stiffness coefficient (XPTO)), which the significant wave height (H1/3 = 1.2 m), the spectrum peak period (Tp = 7.5 s) and parameters of wave power generation device from references [40]. Figure 5a shows that the curve of function PPTO—(RPTO, XPTO) is a multi-extreme point function and the MPP is the extreme value within the range of control variables. Figure 5b shows that the power peak-to-average ratio mapped with RPTO and XPTO. Maximum average power is expected to be obtained with a small power peak-to-average ratio. Therefore, searching for the maximum average power and simultaneously reducing the power peak-to-average ratio becomes a new challenge.
The relationship between the equivalent mechanical impedance of the permanent magnet synchronous motor (i.e., RPTO and XPTO) and the extracted power of the system can be obtained. In Equations (6) and (16), the parameters such as Z, ω, En and Rn are determined by wave period and physical characteristics of the sea state. The maximum average power extracted from the ocean is deduced as follows,
P PTO max ( ω ) = n = 1 N [ E n cos ( ω n t + α n ) ] 2 8 R n
where the following conditions must be met as,
Z PTO ( ω ) = Z ( ω )
The physical meaning of the Functions (17) and (18) is that when the equivalent mechanical impedance of the permanent magnet synchronous motor matches the inherent mechanical impedance of the point-absorbing type WEC, the oscillation of the buoy resonates with the wave motion, and the power extracted by the system reaches a maximum from the wave. Therefore, the damping coefficient (RPTO) and the stiffness coefficient (XPTO) of the permanent magnet synchronous motor need be controlled. According to Equations (6), (7) and (18), the following conditions should be met as,
R PTO = ( H rad ( ω ) ) X PTO = K ω ω ( M + m )
However, the added mass and the damping coefficient are nonlinear functions with respect to the wave period [38]. According to the optimal control technique with two control variables, the equivalent mechanical impedance of the permanent magnet synchronous motor must be changed to match the wave frequency to extract the maximum average power. When the wave frequency changes, the control side of the permanent magnet synchronous motor should select the corresponding impedance based on the wave frequency to match the wave frequency. Furthermore, there is still a difference between the hydrodynamic parameters obtained by simulation software, such as ANSYS-AQWA, and the actual hydrodynamic parameters. The WEC control methods, which can adapt to changes in hydrodynamic parameters and working conditions, and automatically to track the MPP, is the key to promoting wave power technique applications.
In this paper, the parameters of the controller can be regulated by the FPA directly and change with hydrodynamic parameters and working conditions automatically, which means that the wave period of irregular waves or the accurate knowledge of the incoming wave excitation force need not be identified anymore.

3. FPA and Its Implementation

3.1. Flower Pollination Algorithm

The FPA developed by Yang [41] is a recent meta-heuristic optimization technique, which is inspired by the nature of flower pollination processing. The pollination refers to a phenomenon of transferring pollen from one species to another. This process helps the emergence of new species of flowers. There are two methods of pollination, (1) cross-pollination, where the pollen transfer occurs between two different species, and pollinators are bees, insects or birds, (2) self-pollination, where pollens come from the same flower, and no pollinator is needed [41]. According to the algorithm tests on the FPA, genetic algorithm and particle swarm optimization, the FPA has the best performance.
As introduced in [42], for the FPA, the pollination method of pollen is determined by the probability switch of P, and P = 0.8 works better for most applications. The flower constancy that can be considered as the reproduction probability is proportional to the similarity of two flowers involved. To implement FPA, the characteristics of the pollination process and pollinator behavior are summarized as the following rules:
Rule 1: Cross-pollination is considered to be a global pollination process, where pollinators, such as insects that carry pollen, perform L’evy flight. The first rule can be represented mathematically as,
x i t + 1 = x i t + L ( g b e s t x i t )
where x i t is the pollen i or solution vector x i at iteration t, g b e s t is the current best solution found in the current population, and L is the L’evy flying step size and is subject to uniform distribution as,
L = λ Γ ( λ ) sin ( π λ / 2 ) π 1 S 1 + λ ( S > > S 0 > 0 )
where Γ ( λ ) is the standard gamma function which is valid for large steps S > 0, and S is the L’evy flying step. To ensure faster convergence, λ = 1.5 works better for most applications.
Rule 2: Self-pollination represents the local pollination process. The characteristic equation for local pollination is obtained as follows,
x i t + 1 = x i t + ε ( x j t x k t )
where x j t and x k t are pollens from different flowers of the same plant species, ε is characterized by the local search in distribution, and ε [ 0 , 1 ] .
The FPA algorithm is well suited to solve nonlinear optimization problems [34]. In addition, this approach works best for MPPT applications, because it is explored globally and exploits locally in a single iteration. Unlike other bio-inspired algorithms, the best part of this algorithm is that the FPA introduces randomness in each iteration by self-pollination. Thus, the FPA is best suitable for maximum energy extraction of the point-absorbing type WEC. Moreover, this method does not rely on the accuracy of the excitation force and the dominant frequency characteristics of the irregular waves.

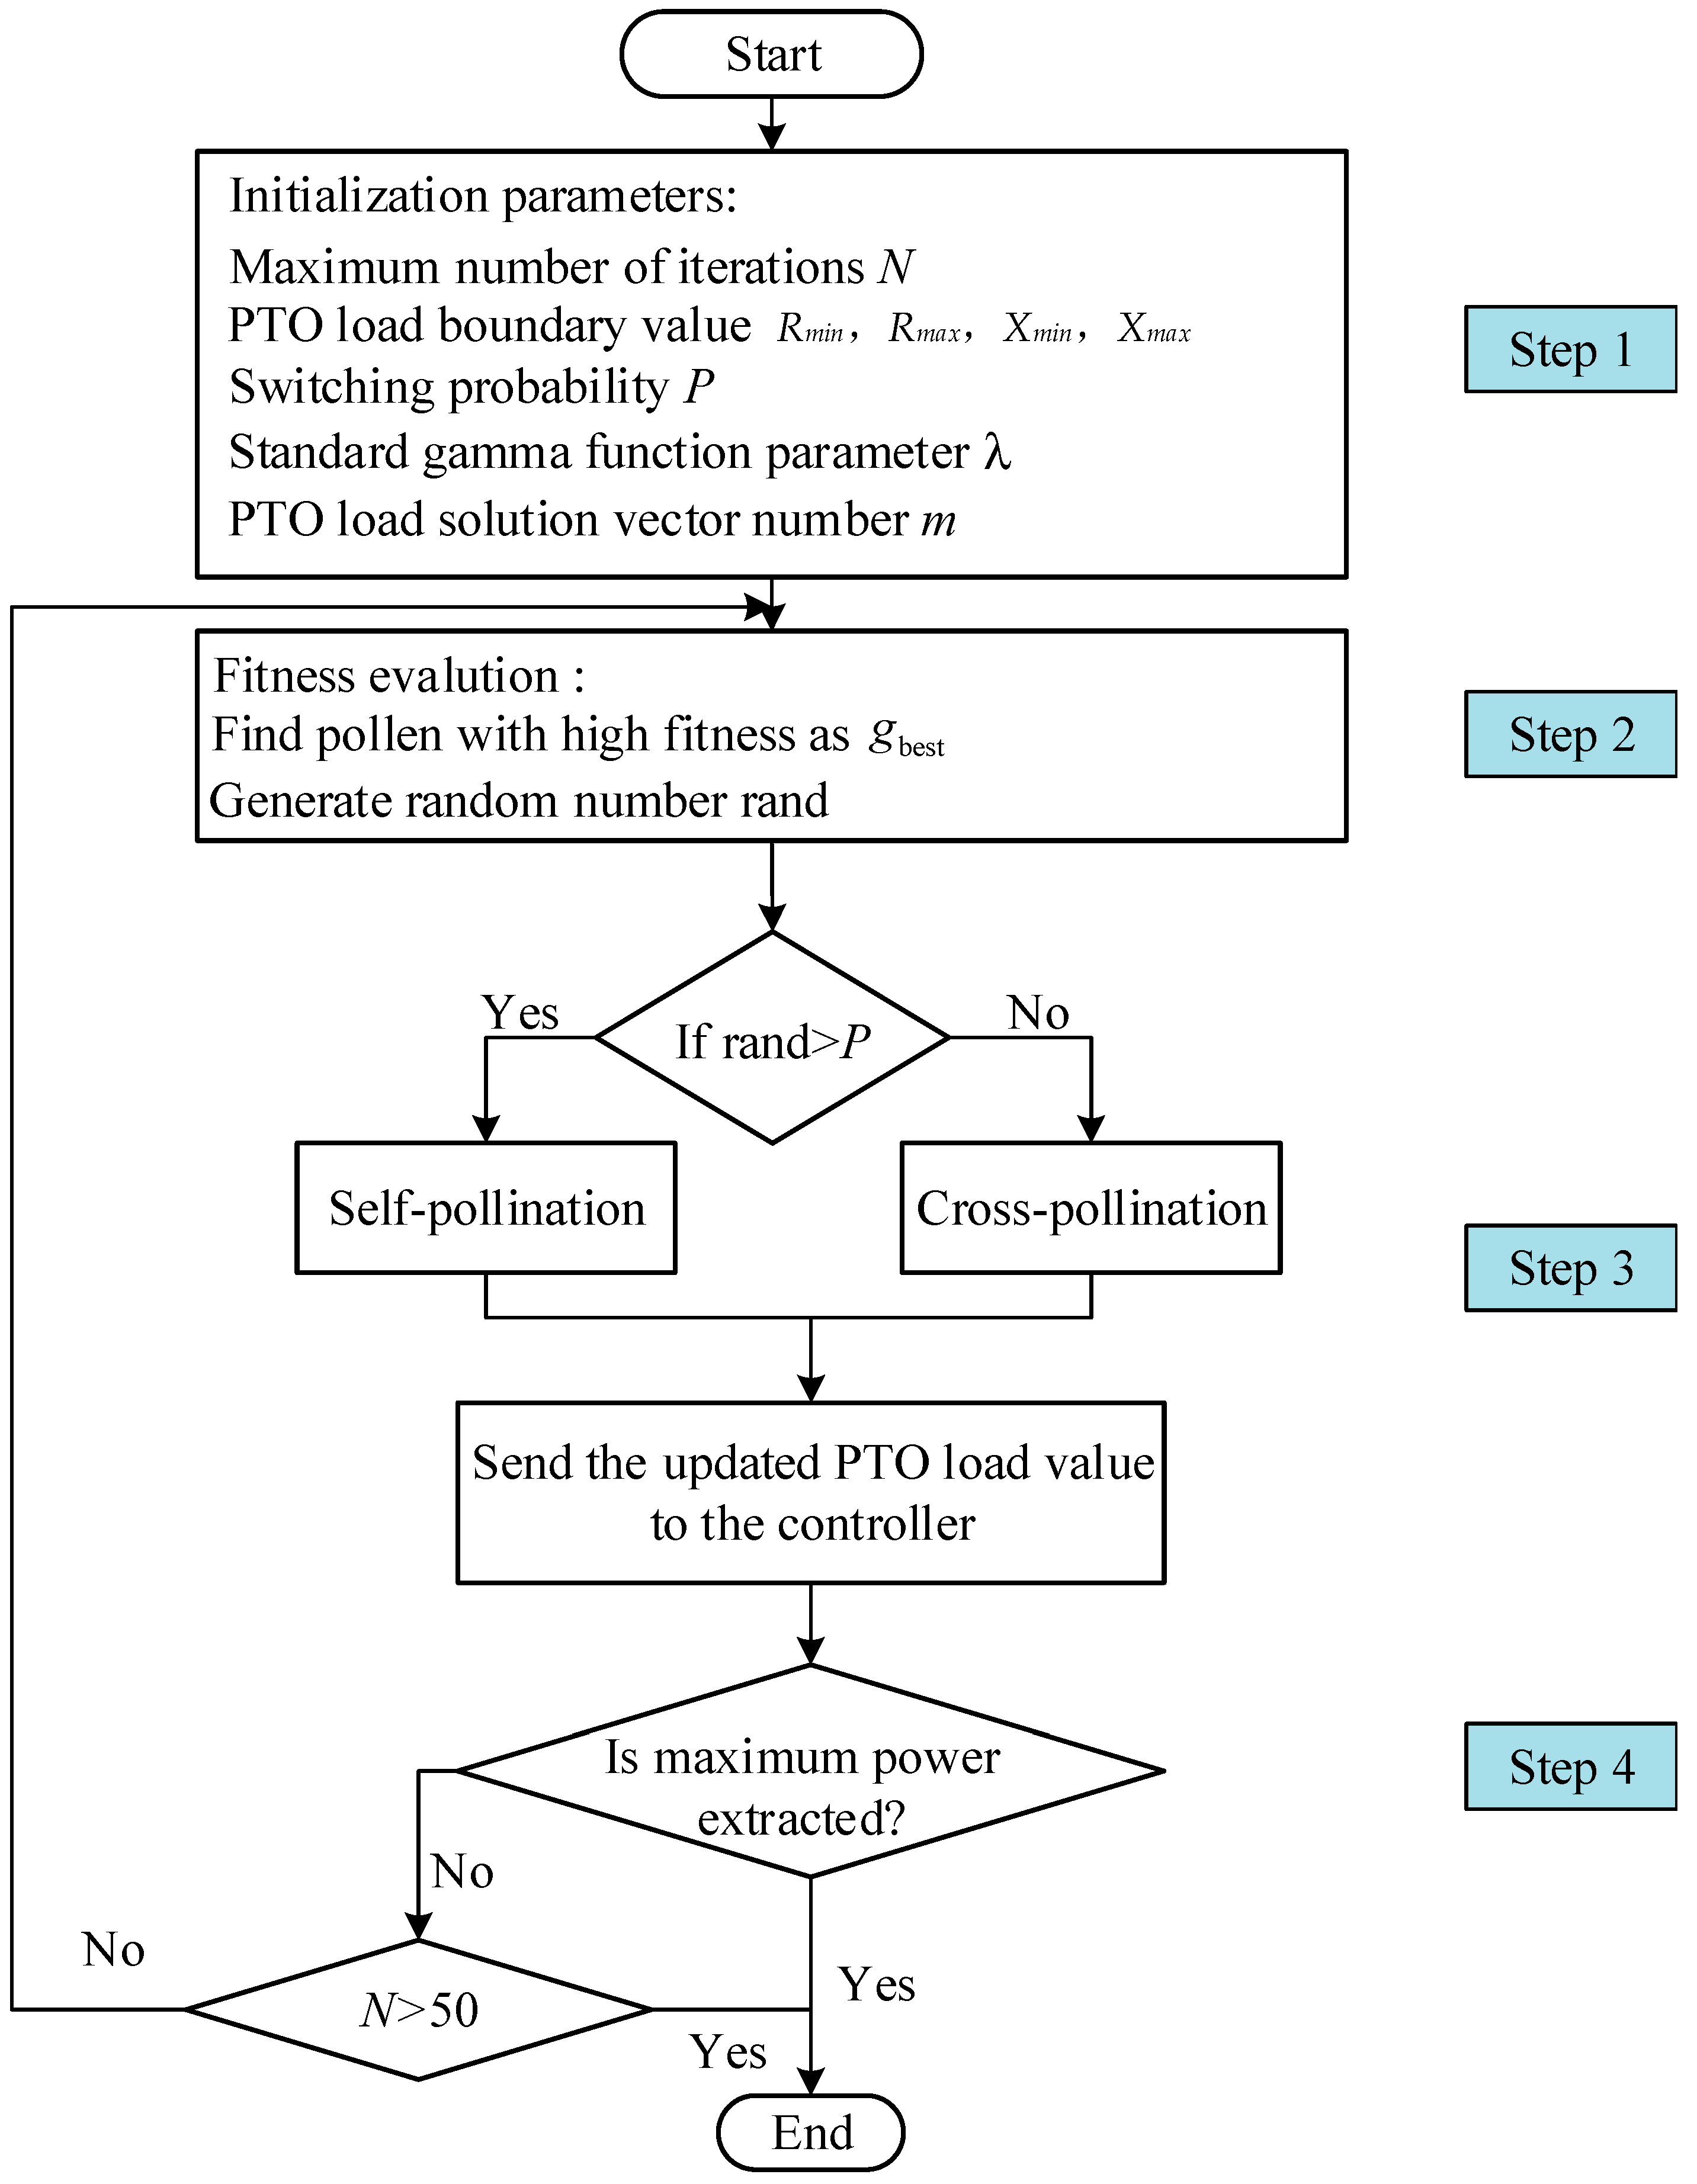
3.2. FPA Implemented for MPPT

The complete flowchart for the proposed method is pictured in Figure 6. For FPA implemented in MPPT control, it can be explained in four steps:
Step 1: Initialize parameters, including the maximum number of iterations (N), PTO load boundary value (Rmin, Rmax, Xmin, Xmax), switching probability of pollination (P), standard gamma function parameter λ , PTO load solution vector number (m), and the objective function as shown in (13), where five different PTO loads are considered as the pollen or solution vector as following,
x 5 × 2 = [ R 5 × 1 , X 5 × 1 ]
Step 2: Evaluate the fitness, where the pollen’s suitability is assessed by using the fitness function. The pollen with high fitness is selected as g b e s t , and then a random number named rand is generated.
Step 3: Start the pollination process, where the condition of self-pollination (if rand > P) or cross-pollination (if rand ≤ P) is determined. Note that all pollens in the population must undergo cross-pollination or self-pollination.
Step 4: Confirm the termination conditions, and continuously continue Step 2 to Step 4 until the maximum power point is captured or the maximum number of iterations appears. Note that the maximum number of iterations is set as 50 in our case.

4. Simulation Results

In order to validate the proposed MPPT control method based on FPA used in WEC system, a complete model of the WEC system and the controller were constructed. Three cases were studied, where the parameters, the related average power absorption and peak-to-average ratio are listed in Table 1, by using the FPA and the hill-climbing method, respectively.
For irregular waves, the previous analysis was verified by MATLAB/Simulink simulation according to the buoy parameters and sea conditions in Table 2 [40], and only considered the buoy oscillating in heave.
In order to detailly analyze the results obtained by the FPA and the hill-climbing method, the average power, the damping coefficient and the stiffness coefficient of Case 1 are depicted in Figure 7 and Figure 8, respectively. It can be observed that the maximum average power is obtained at the 16th iteration and the values of the damping coefficient and the stiffness coefficient finally converges to the best solution. However, the hill-climbing method requires approximately 250 steps to converge and cannot converge to the MPP. Therefore, the damping coefficient and the stiffness coefficient obtained by the hill-climbing method are suboptimum solutions.
In order to extract the maximum wave energy, in theory, the excitation force should be in phase with the buoy velocity at any incident wave frequency, where the product of the excitation force and the wave speed is exact extracted power. Thus, the WEC operates at resonant conditions, and the wave power generation system extracts the instantaneous maximum power. This performance can be evaluated from Figure 9, where the extreme-seeking control technique based on FPA has better performance in most areas than the hill-climbing method. The reason that the performance of the hill-climbing method is insufficient is mainly due to the slow convergence rate and easy trapping in a local optimum.
Figure 10 presents the simulated instantaneous power and average power absorption when the wave power generation system operates at maximum energy extraction states. As seen from Figure 10, when the wave power generation system works in the optimal state, in order to maximize the average power, the permanent magnet synchronous motor provides energy at some time, and the energy is transferred from the motor side to the float side. In the rest time, the wave provides energy, which is transferred from the buoy side to the motor side. Compared with the hill-climbing method, the MPPT method based on the FPA can capture more average power and reduces power peak-to-average ratio. The simulated results have proven the advantages of FPA in terms of convergence time, efficiency and accuracy, compared with the hill-climbing method.
Figure 11 shows the average power (active power) spectrum and the apparent power spectrum captured by the wave power generation system, where the rest power at low frequency is ignored due to the small values. The seventh frequency is the dominant wave frequency of input excitation force wave. More apparent power is extracted in the range near the dominant wave frequency by the hill-climbing method, which means that more reactive power is generated near the dominant wave frequency, leading to a higher peak-to-average ratio. Although the proposed method cannot make the wave power generation system resonate at the dominant wave frequency, the system can capture more power at the other frequencies.
Moreover, the robustness of the proposed technique is further validated, when the sea state suddenly changes as shown in Figure 12. After captured by the wave power generation system repeatedly, the average power can be re-converged to the optimal value. Figure 12 shows the optimal average power search curve for the wave power generation system when Sea condition 1 is changed to Sea condition 3 as listed in Table 1. Among them, the sudden change of the sea state occurs in the 24th iteration, and the system detects the change in the 25th iteration, and then re-searches the optimal power point, indicating that the proposed control method has strong adaptability and immunity.

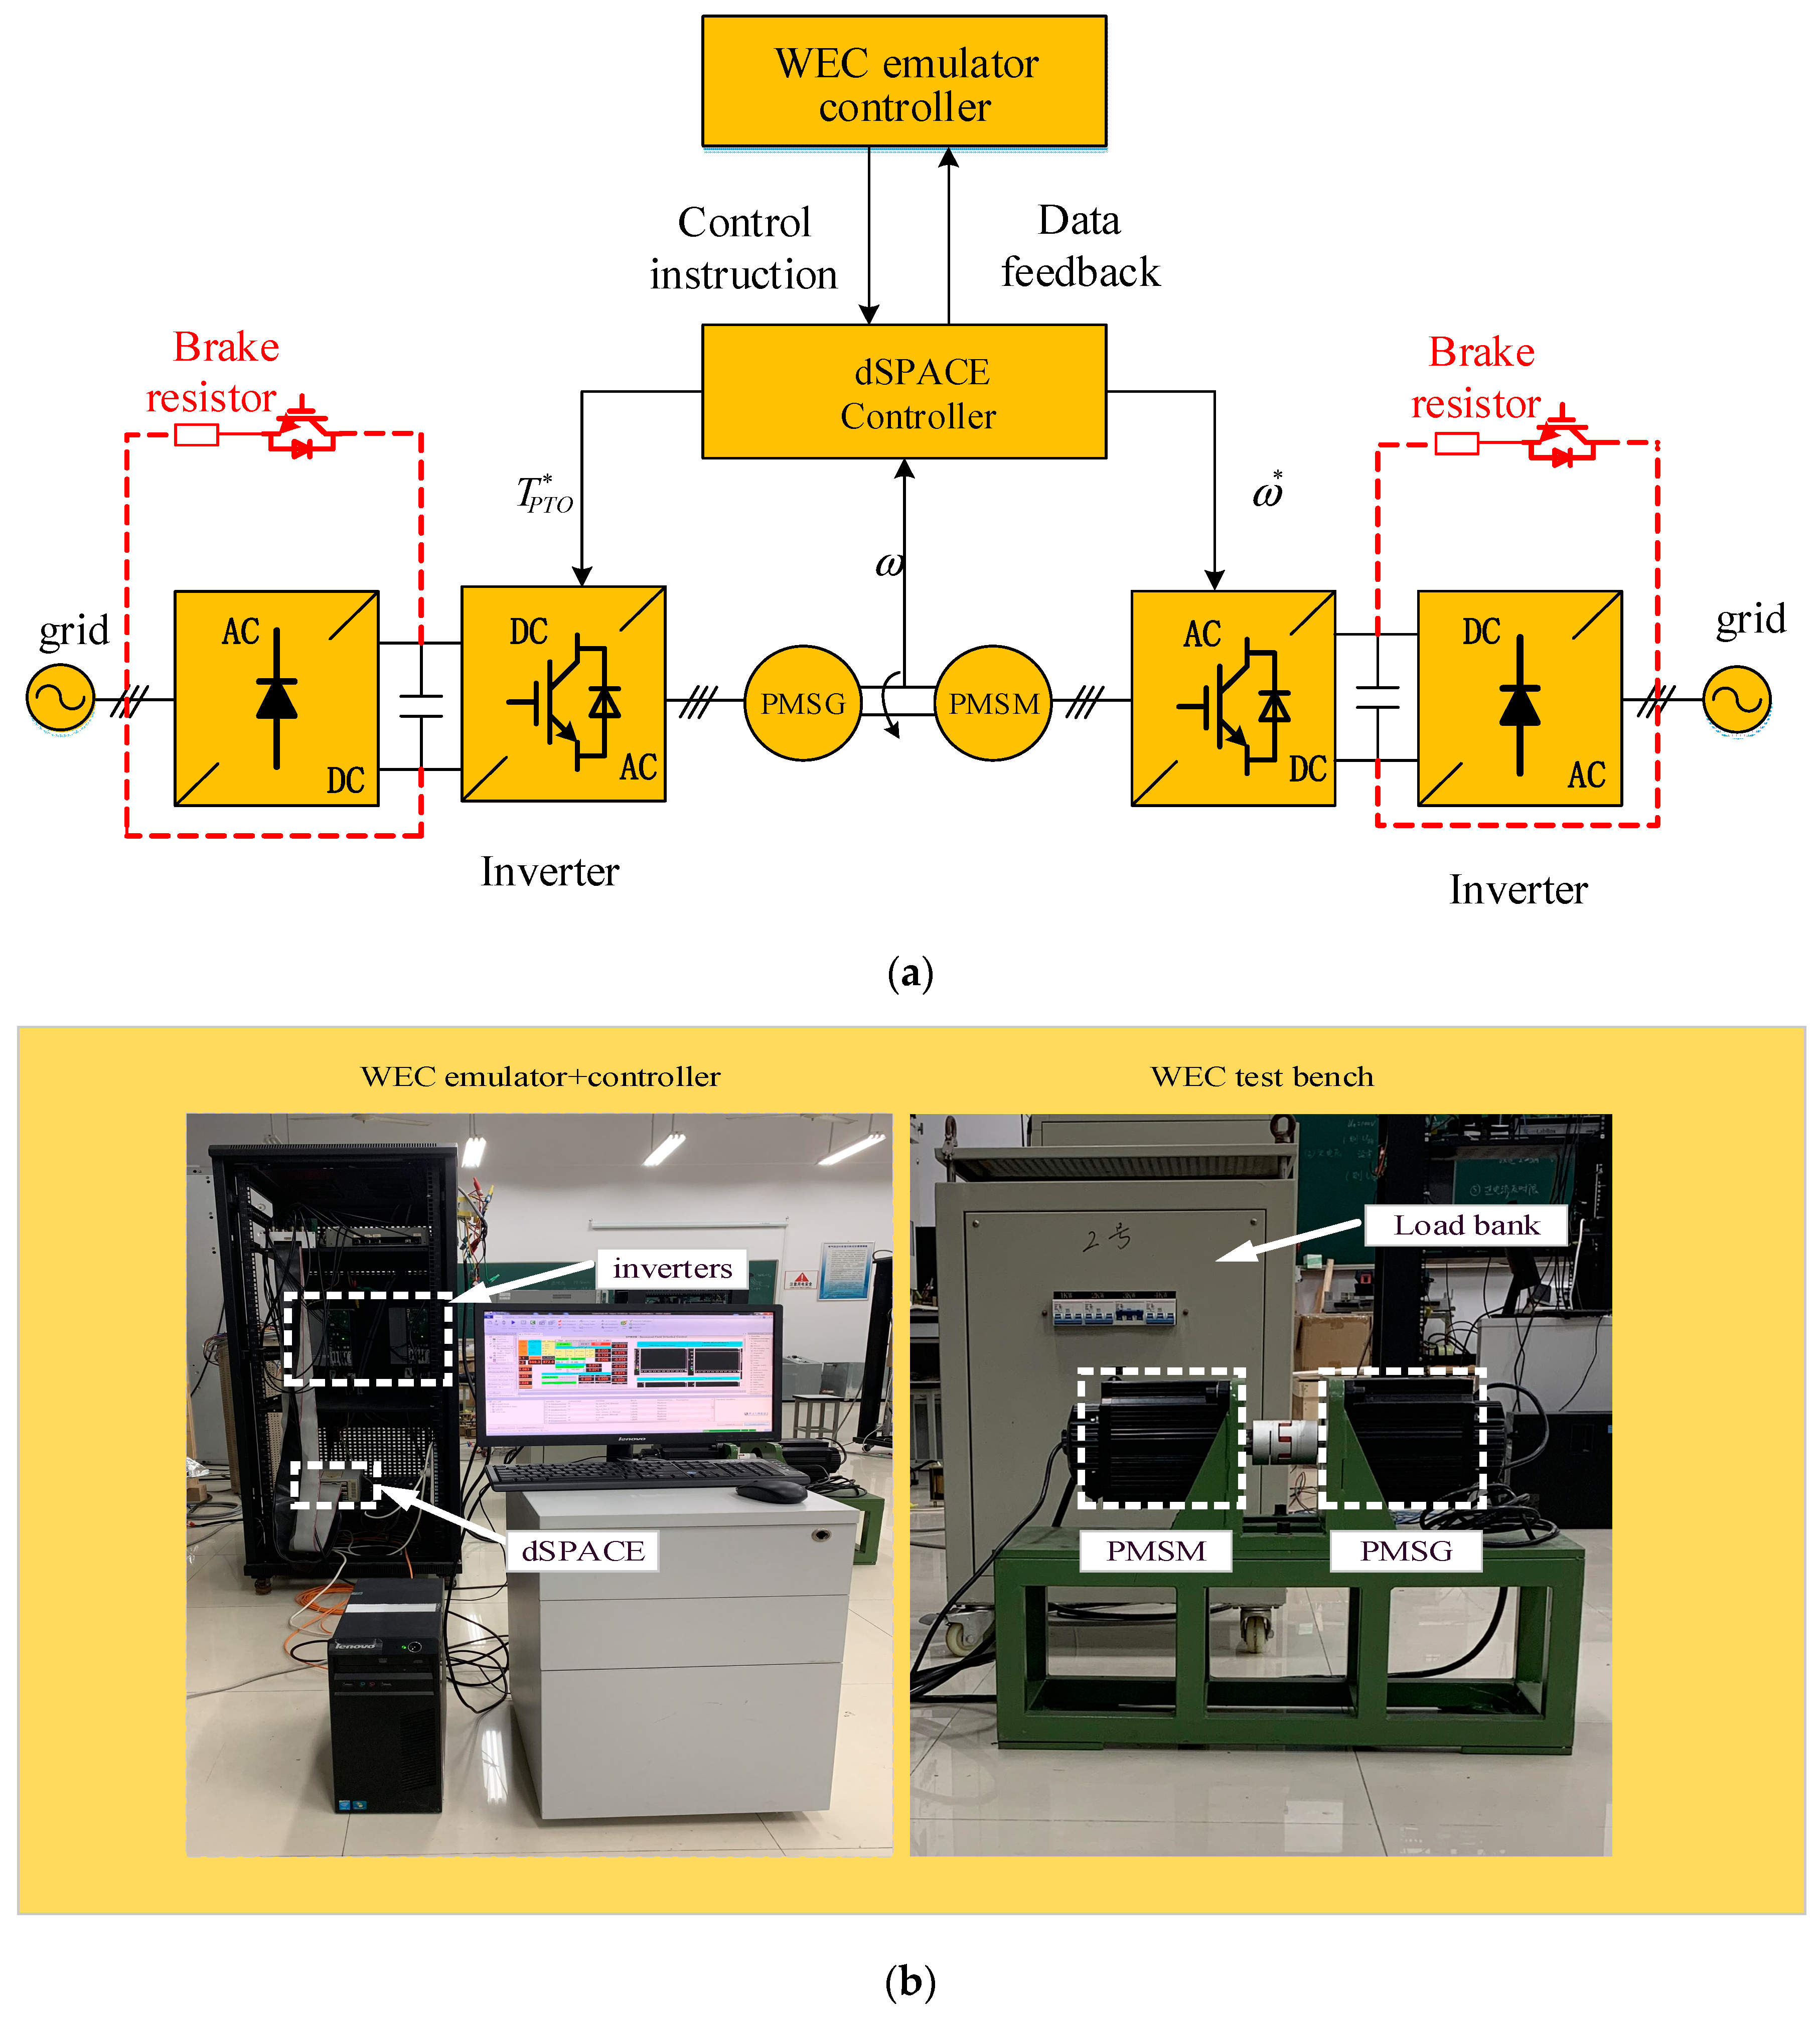
5. Experimental Result

In order to study the practicability of the proposed control strategy, a test bench shown in Figure 13 is constructed by using conventional dynamometer system together with two converters, whose parameters are listed in Table 3.
In this system, there is a permanent magnet synchronous motor (PMSM) to provide the required load torque for the generator shaft, and a permanent magnet synchronous generator (PMSG) to ensure the required mechanical speed is achieved. The speed and torque controllers are incorporated in the PMSM and PMSG drives, respectively. Due to the logistic limitations of constructing the real point-absorbing WEC prototype, the buoy, the transmission device and the controller of the entire wave power generation system are constructed in the dSPACE real-time system, according to the previous simulation model. The buoy model is operated under the given sea conditions as listed in Table 1. The wave power generation system controller calculates the torque required for power capture, applies this torque to the transmission, and then monitors the buoy velocity. The generator side converter tries to extract the maximum power from the wave. The irregular wave data from the irregular excitation force lookup table are used for the wave mechanical character analysis. The position and speed of the generator are measured by a position sensor. Note that due to the limitations of experimental conditions and protecting the experimental device, the model data is scaled down within a reasonable range.
The point-absorbing WEC performance is analyzed to determine whether the system has met the predefined setup specifications. Figure 14 shows the PMSG speed under Case 1 sea condition. It can be seen that the speed controller has reached the expected performance, although there is a small measurement error caused by the encoder accuracy and switching frequency.
Figure 15 shows the instantaneous mechanical power applied to the shaft of the synchronous test bench by FPA and the Hill-climbing method, respectively. Compared with Figure 15 and Figure 10, it can be seen that the measured instantaneous power is very similar to the simulated result. It is only numerically reduced, due to limitations of experimental conditions.
Figure 16 shows the measured WEC velocity and excitation force. It can be seen that the buoy velocity applied by the FPA is mostly in phase with the excitation force, while there is some phase shifting between the buoy velocity and the excitation force applied by the hill-climbing method. Table 4 lists the average power and the peak-to-average ratio, applied by the FPA and the hill climbing method respectively, under three kinds of sea conditions. It can be seen that the FPA-MPPT is a more suitable technology than the hill-climbing method for point-absorbing type WEC applications since the more average power and the smaller peak-to-average ratio can be achieved.

6. Conclusions

In this paper, a new point absorption WEC control strategy is proposed, which is based on the extremum-seeking controller with FPA. The proposed MPPT search algorithm has been compared with the hill-climbing method. The following conclusions can be drawn:
  • Similar to the hill-climbing method, the proposed method is independent of the wave period of irregular waves, the accurate knowledge of the incoming wave excitation force, and the parameters of the point-absorbing type WEC.
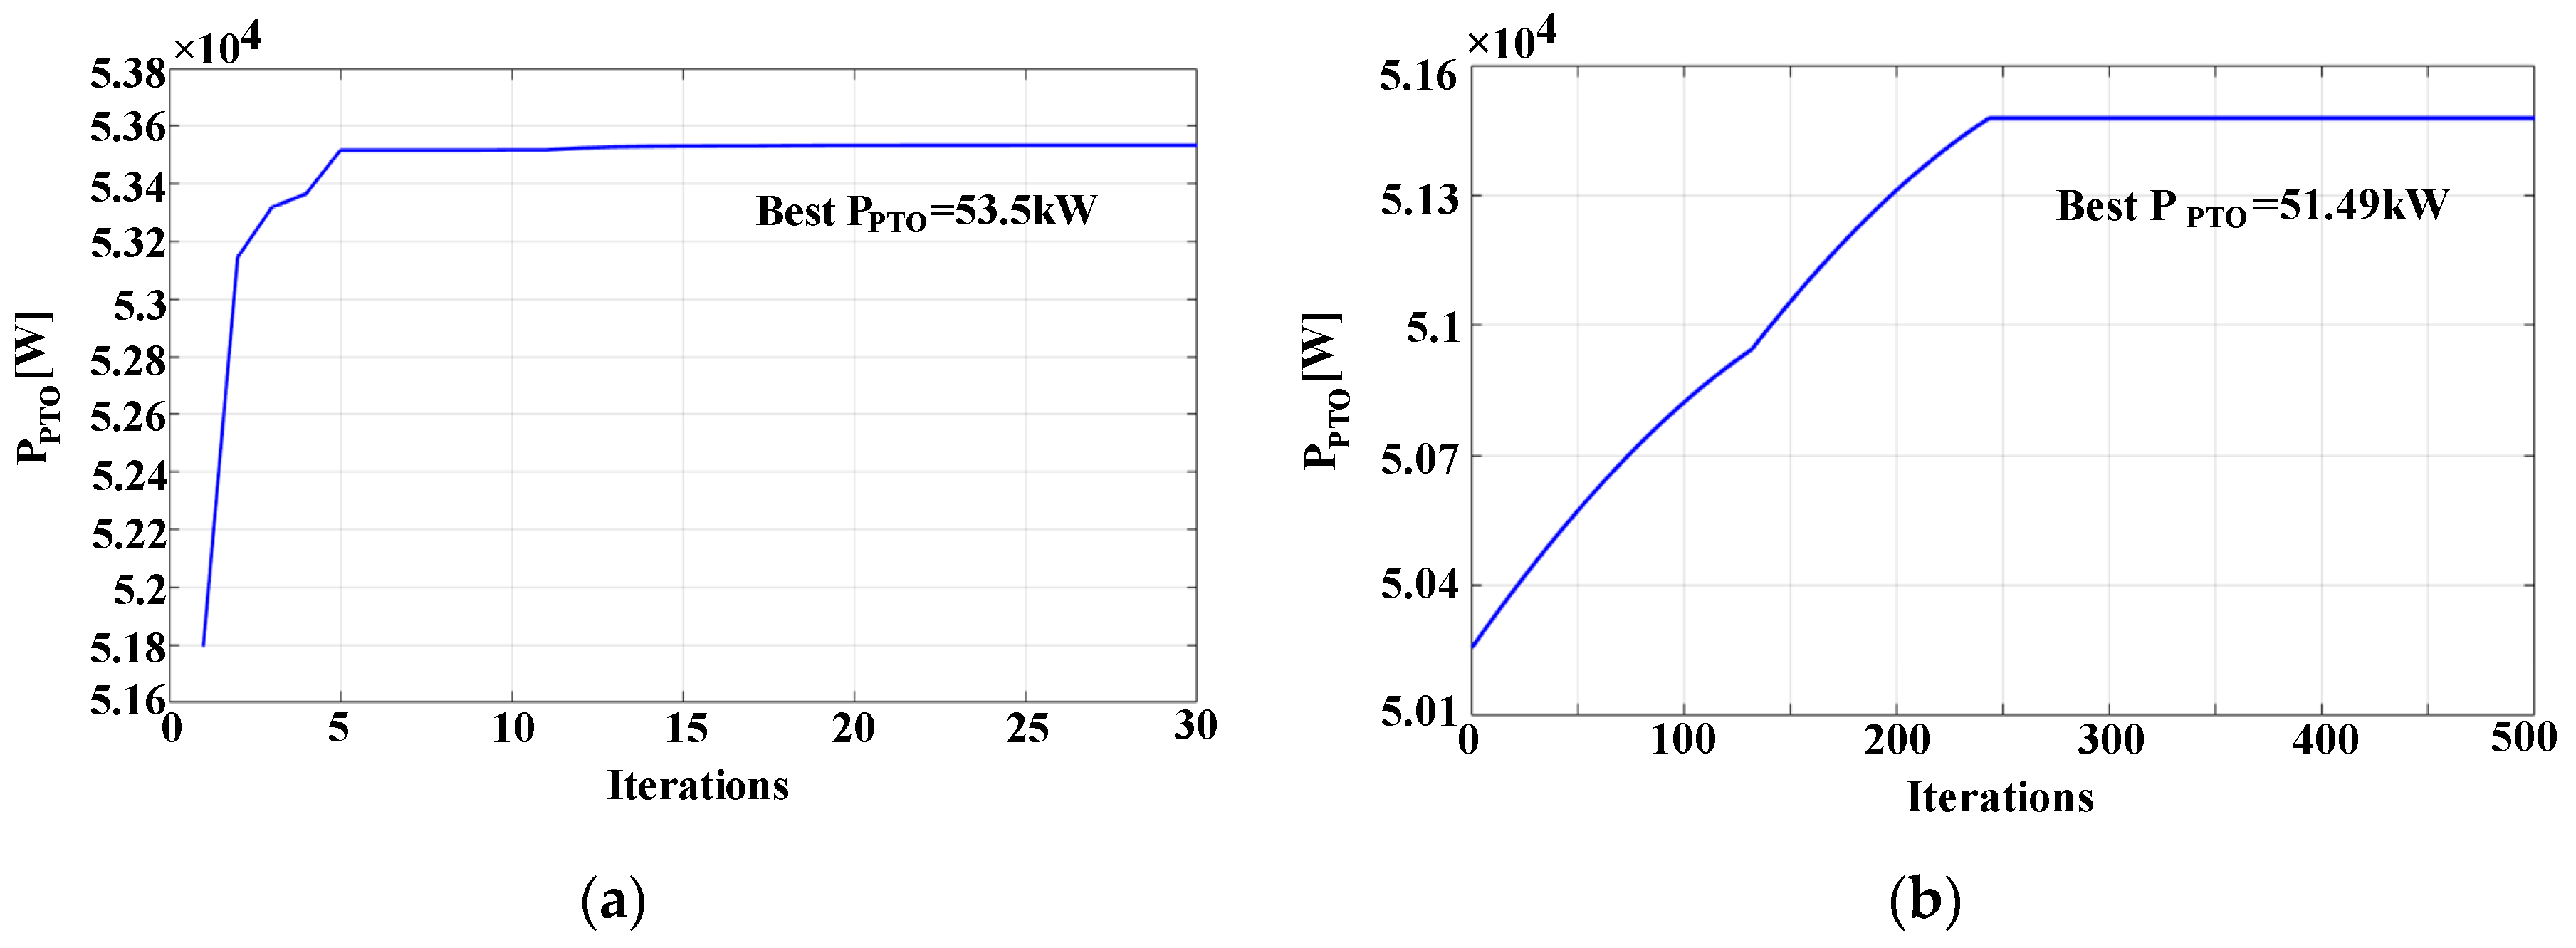
  • When using the proposed MPPT control technique, a system starting from a non-optimal state can operate stably at the MPP after several iterations. Moreover, the system can rapidly respond to the MPP deviations caused by ocean wave changes and operate under the new MPP.
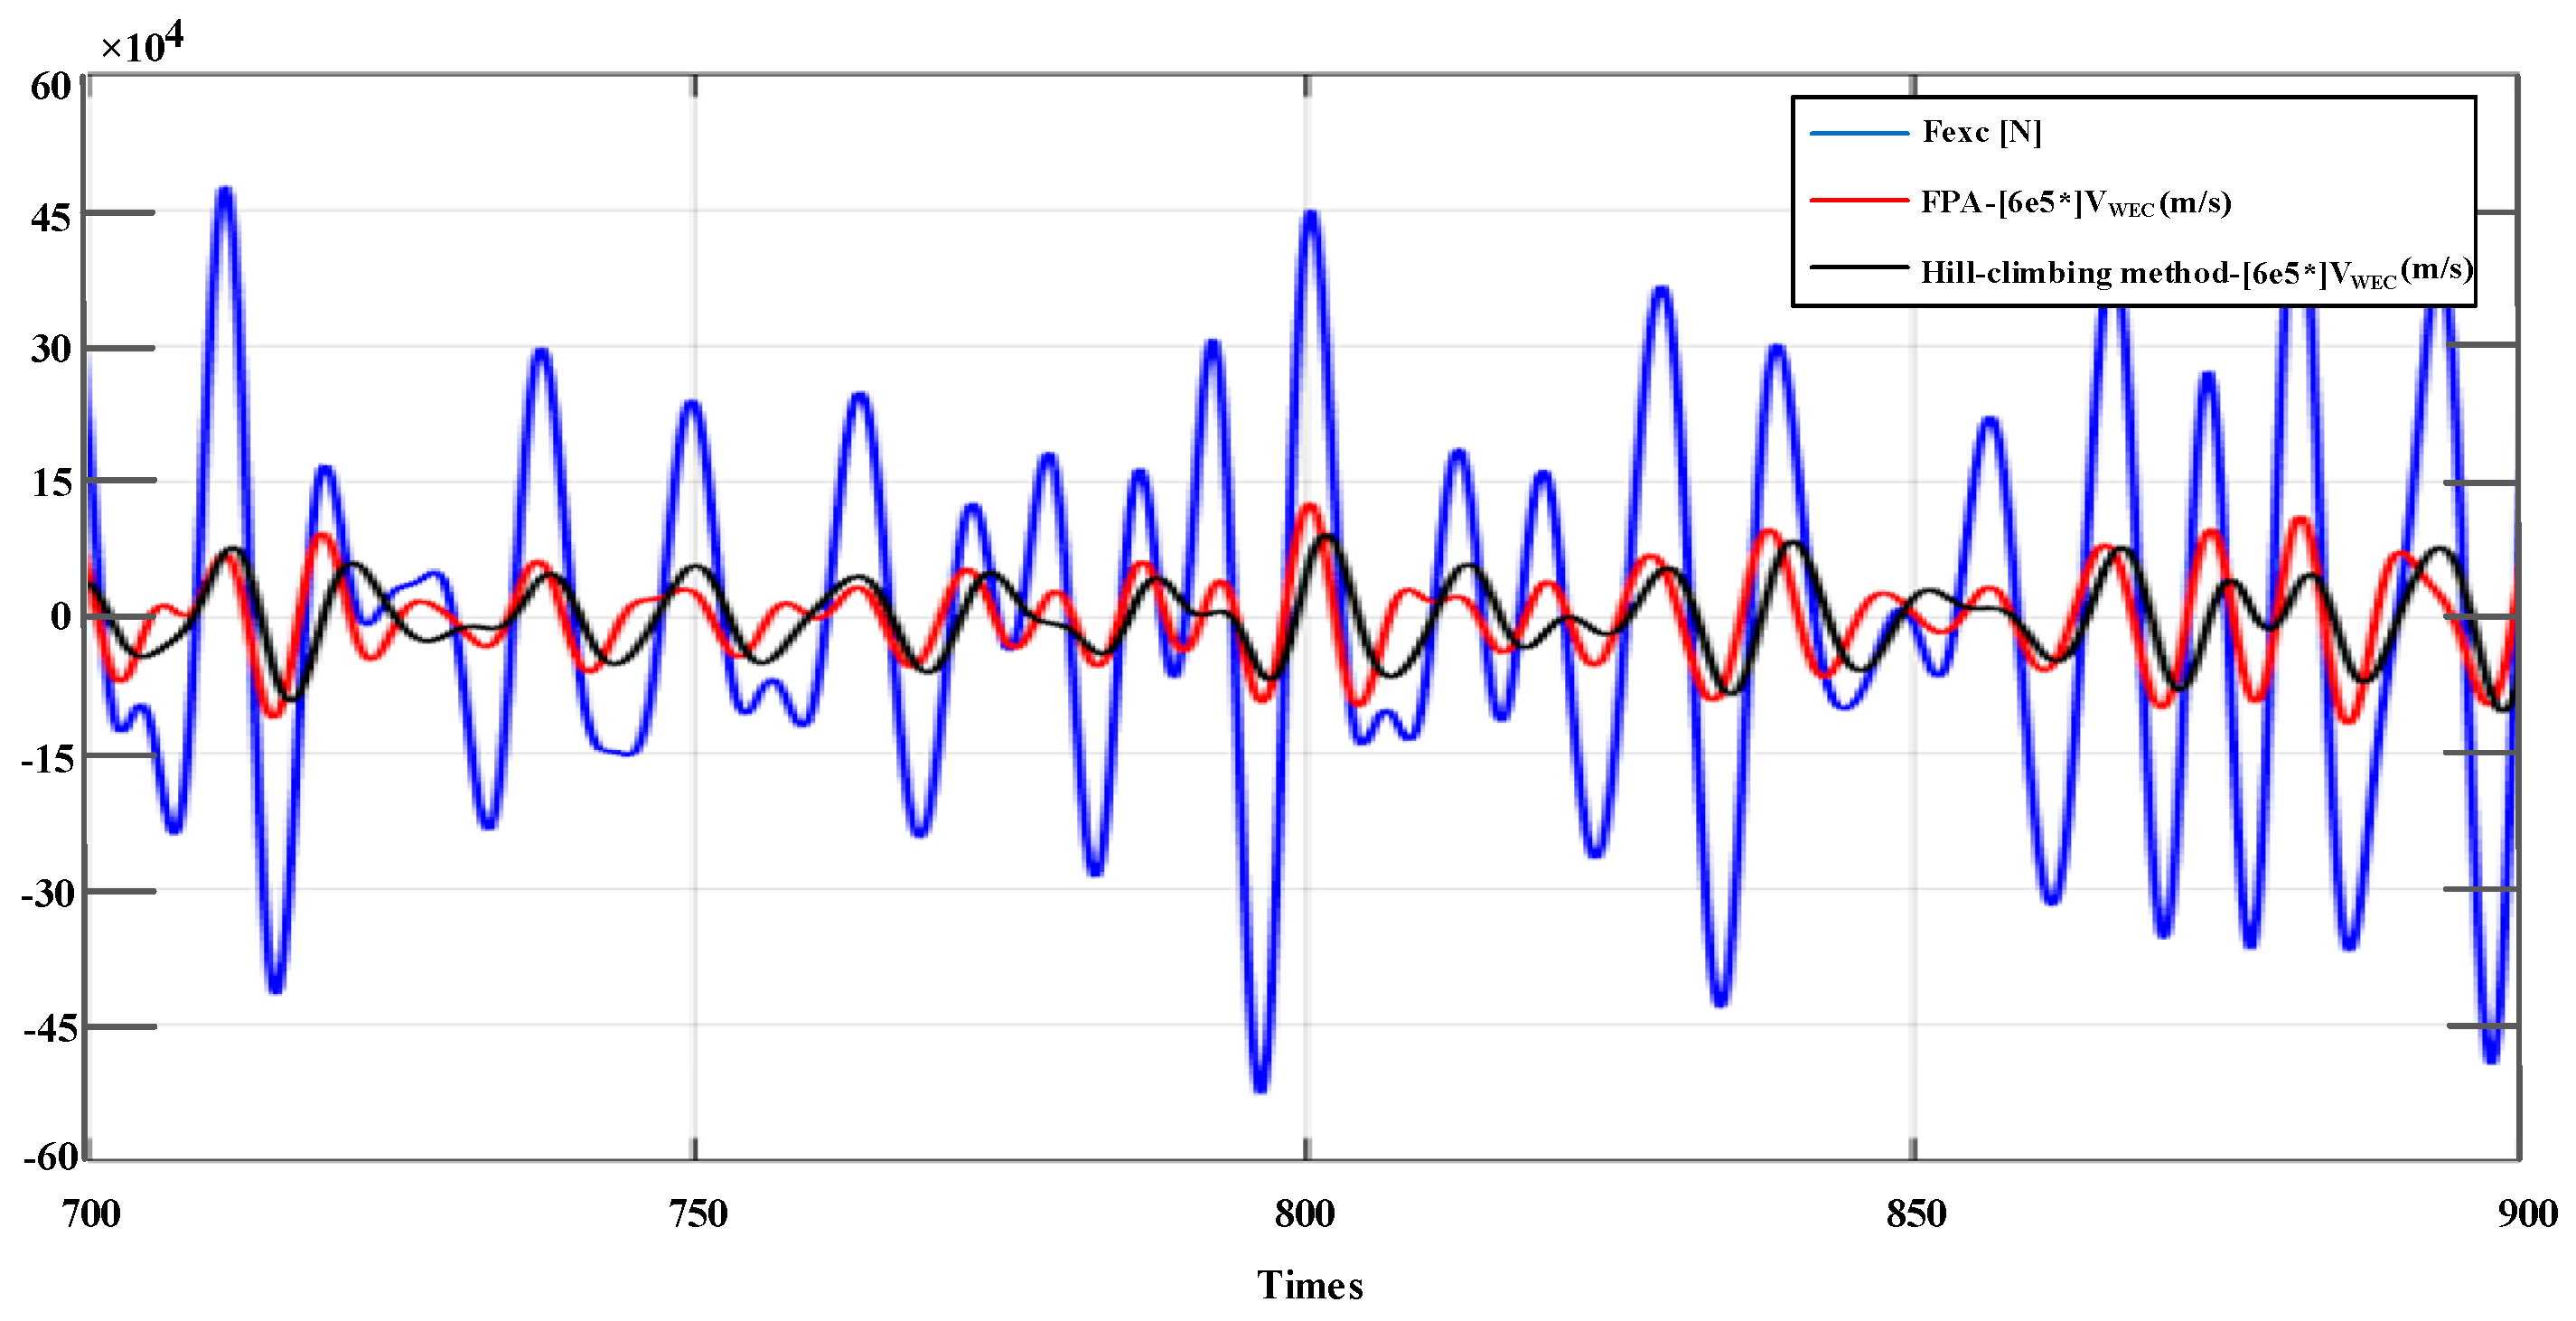
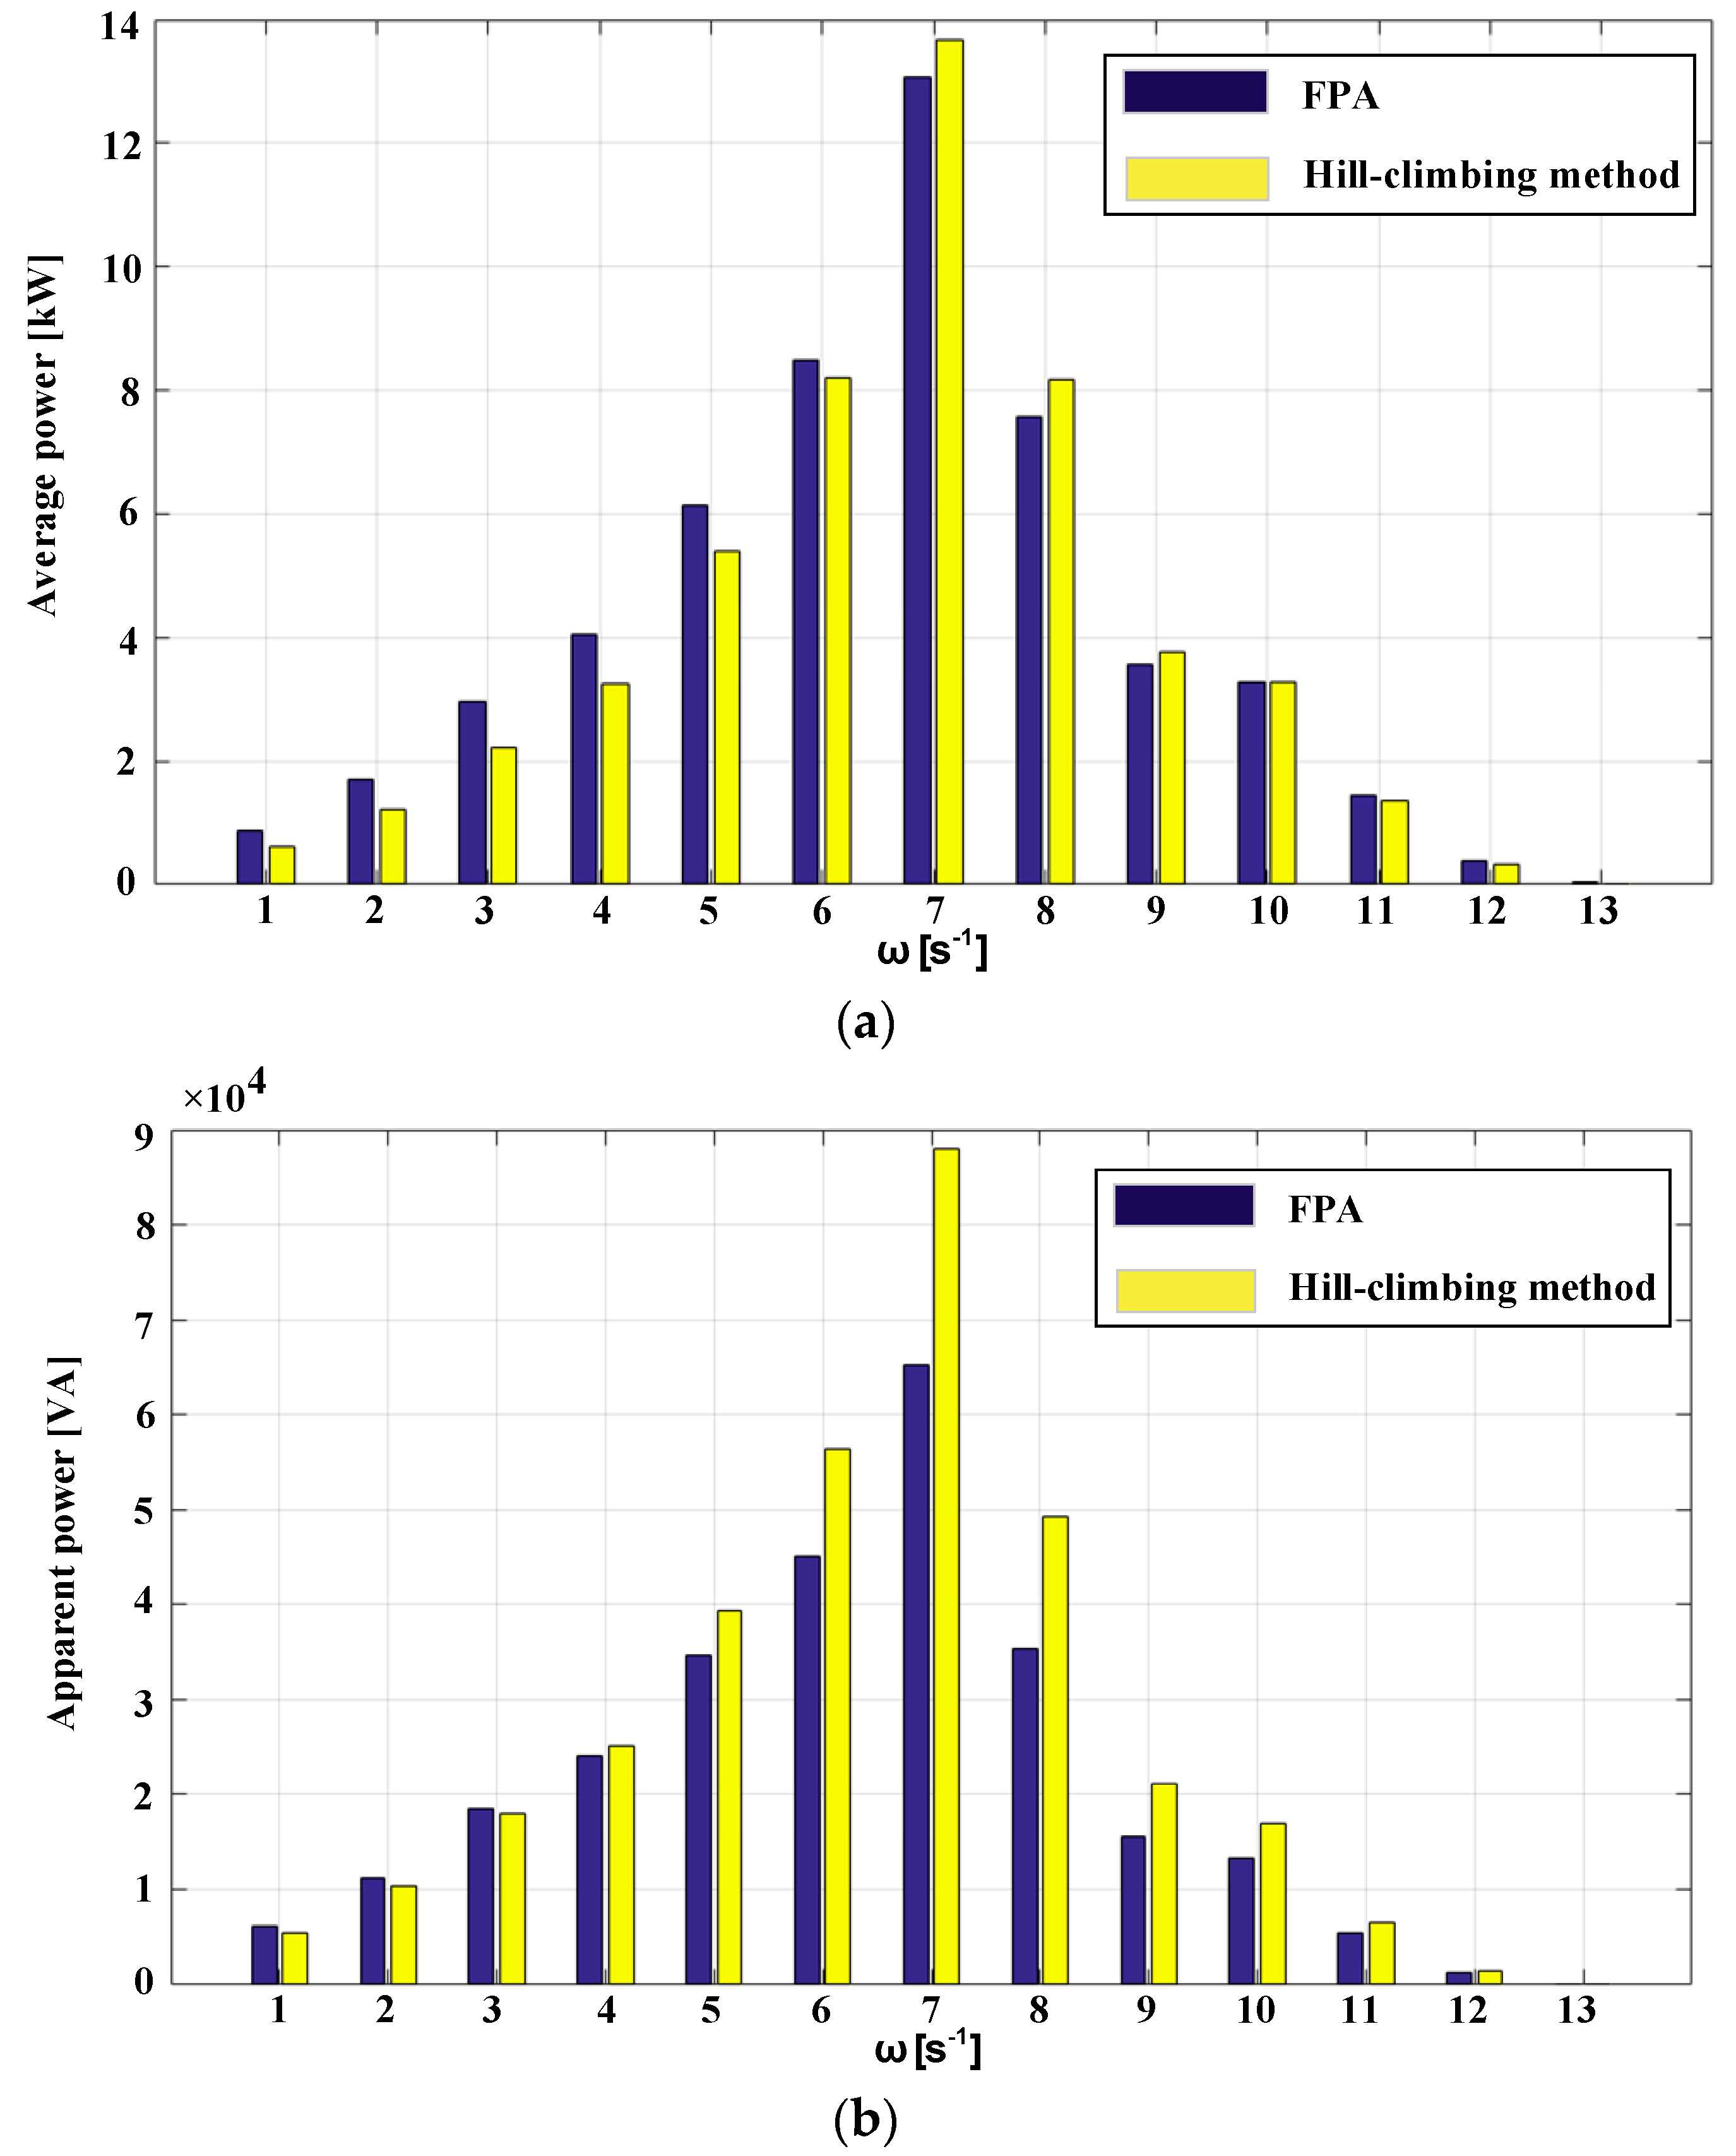
  • Compared with the hill-climbing method, the proposed FPA can track the global maximum power under irregular wave conditions and produce faster convergence, better tracking, and higher efficiency. Therefore, the FPA-MPPT is a more suitable technology than the hill-climbing method for point-absorbing type WEC applications.

Author Contributions

A.Z. collected experimental data and worked in the simulation experiments. Z.S. contributed to the theoretical analysis of the FPA. L.Z. optimized the program. All authors analyzed the results and revised the paper.

Funding

This work was funded in part by National Natural Science Foundation of China, grant number 51477094, and in part by the Shanghai Science and Technology Commission, grant number 17040501500.

Conflicts of Interest

The authors declare no conflict of interest.

References

  1. Khan, N.; Kalair, A.; Abas, N.; Haider, A. Review of ocean tidal, wave and thermal energy technologies. Renew. Sustain. Energy Rev. 2017, 72, 590–604. [Google Scholar] [CrossRef]
  2. Uihlein, A.; Magagna, D. Wave and tidal current energy—A review of the current state of research beyond technology. Renew. Sustain. Energy Rev. 2016, 58, 1070–1081. [Google Scholar] [CrossRef]
  3. Astariz, S.; Iglesias, G. The economics of wave energy: A review. Renew. Sustain. Energy Rev. 2015, 45, 397–408. [Google Scholar] [CrossRef]
  4. Zheng, C.W.; Li, C.Y.; Pan, J.; Liu, M.Y.; Xia, L.L. An overview of global ocean wind energy resource evaluations. Renew. Sustain. Energy Rev. 2016, 53, 1240–1251. [Google Scholar] [CrossRef]
  5. Ozkop, E.; Altas, I.H. Control, power and electrical components in wave energy conversion systems: A review of the technologies. Renew. Sustain. Energy Rev. 2017, 67, 106–115. [Google Scholar] [CrossRef]
  6. Gaspar, J.F.; Calvário, M.; Kamarlouei, M.; Soares, C.G. Design tradeoffs of an oil-hydraulic Power Take-Off for Wave Energy Converters. Renew. Energy 2018, 129, 245–259. [Google Scholar] [CrossRef]
  7. Wen, Y.; Wang, W.; Liu, H.; Mao, L.; Mi, H.; Wang, W.; Zhang, G. A Shape Optimization Method of a Specified Point Absorber Wave Energy Converter for the South China Sea. Energies 2018, 11, 2645. [Google Scholar] [CrossRef]
  8. Kolios, A.; Di Maio, L.F.; Wang, L.; Cui, L.; Sheng, Q. Reliability assessment of point-absorber wave energy converters. Ocean Eng. 2018, 163, 40–50. [Google Scholar] [CrossRef]
  9. Meng, F.; Ding, B.; Cazzolato, B.; Arjomandi, M. Modal analysis of a submerged spherical point absorber with asymmetric mass distribution. Renew. Energy. 2019, 130, 223–237. [Google Scholar] [CrossRef]
  10. OPT—Ocean Power Technology. Available online: http://oceanpowertechnologies.com/ (accessed on 20 December 2018).
  11. Wavestar. Available online: http://wavestarenergy.com/ (accessed on 20 December 2018).
  12. Tom, N.M.; Madhi, F.; Yeung, R.W. Balancing power absorption and structural loading for an asymmetric heave wave-energy converter in regular waves. In ASME 2016 35th International Conference on Ocean, Offshore and Arctic Engineering; American Society of Mechanical Engineers: Busan, Korea, 19–24 June 2016. [Google Scholar]
  13. Ringwood, J.V.; Bacelli, G.; Fusco, F. Energy-maximizing control of wave-energy converters: The development of control system technology to optimize their operation. IEEE Control Syst. 2014, 34, 30–55. [Google Scholar]
  14. Tedeschi, E.; Molinas, M. Tunable control strategy for wave energy converters with limited power takeoff rating. IEEE Trans. Ind. Electron. 2012, 59, 3838–3846. [Google Scholar] [CrossRef]
  15. Park, J.S.; Gu, B.G.; Kim, J.R.; Cho, I.H.; Jeong, I.; Lee, J. Active Phase Control for Maximum Power Point Tracking of a Linear Wave Generator. IEEE Trans. Power Electron. 2017, 32, 7651–7662. [Google Scholar] [CrossRef]
  16. Têtu, A.; Ferri, F.; Kramer, M.; Todalshaug, J. Physical and Mathematical Modeling of a Wave Energy Converter Equipped with a Negative Spring Mechanism for Phase Control. Energies 2018, 11, 2362. [Google Scholar] [CrossRef]
  17. Liu, C.; Yang, Q.; Bao, G. Latching control using optimal control method for a raft-type wave energy converter. Ships Offshore Struct. 2018, 13, 138–154. [Google Scholar] [CrossRef]
  18. Temiz, I.; Leijon, J.; Ekergård, B.; Boström, C. Economic aspects of latching control for a wave energy converter with a direct drive linear generator power take-off. Renew. Energy. 2018, 128, 57–67. [Google Scholar] [CrossRef]
  19. Cantarellas, A.M.; Remon, D.; Rodriguez, P. Adaptive vector control of wave energy converters. IEEE Trans. Ind. Appl. 2017, 53, 2382–2391. [Google Scholar] [CrossRef]
  20. Song, J.; Abdelkhalik, O.; Robinett, R.; Bacelli, G.; Wilson, D.; Korde, U. Multi-resonant feedback control of heave wave energy converters. Ocean Eng. 2016, 127, 269–278. [Google Scholar] [CrossRef]
  21. Abdelkhalik, O.; Zou, S.; Robinett, R.D.; Bacelli, G.; Wilson, D.G.; Coe, R.; Korde, U. Multiresonant Feedback Control of a Three-Degree-of-Freedom Wave Energy Converter. IEEE Trans. Sustain. Energy 2017, 8, 1518–1527. [Google Scholar] [CrossRef]
  22. Anderlini, E.; Forehand, D.I.; Stansell, P.; Xiao, Q.; Abusara, M. Control of a point absorber using reinforcement learning. IEEE Trans. Sustain. Energy 2016, 7, 1681–1690. [Google Scholar] [CrossRef]
  23. Anderlini, E.; Forehand, D.I.; Bannon, E.; Abusara, M. Control of a realistic wave energy converter model using least-squares policy iteration. IEEE Trans. Sustain. Energy 2017, 8, 1618–1628. [Google Scholar] [CrossRef]
  24. Xu, Q.L.; Li, Y.; Lin, Z.L. An improved boundary element method for modelling a self-reacting point absorber wave energy converter. Acta Mech. Sin. 2018, 34, 1015–1034. [Google Scholar] [CrossRef]
  25. Xiao, X.; Huang, X.; Kang, Q. A hill-climbing-method-based maximum-power-point-tracking strategy for direct-drive wave energy converters. IEEE Trans. Ind. Electron. 2016, 63, 257–267. [Google Scholar] [CrossRef]
  26. Li, X.; Wen, H.; Jiang, L.; Xiao, W.; Du, Y.; Zhao, C. An improved mppt method for pv system with fast-converging speed and zero oscillation. IEEE Trans. Ind. Appl. 2016, 52, 5051–5064. [Google Scholar] [CrossRef]
  27. Ghasemi, M.A.; Foroushani, H.M.; Parniani, M. Partial shading detection and smooth maximum power point tracking of PV arrays under PSC. IEEE Trans. Power Electron. 2016, 31, 6281–6292. [Google Scholar] [CrossRef]
  28. Chen, Z.; Yin, M.; Zou, Y.; Meng, K.; Dong, Z. Maximum wind energy extraction for variable speed wind turbines with slow dynamic behavior. IEEE Trans. Power Syst. 2017, 32, 3321–3322. [Google Scholar] [CrossRef]
  29. Yang, X.S.; Deb, S.; Fong, S.; He, X.; Zhao, Y. Swarm intelligence: Today and tomorrow. In Proceedings of the 2016 3rd International Conference on Soft Computing & Machine Intelligence (ISCMI), Dubai, United Arab Emirates, 23–25 November 2016; pp. 219–223. [Google Scholar]
  30. Li, H.; Yang, D.; Su, W.; Lü, J.; Yu, X. An Overall Distribution Particle Swarm Optimization MPPT Algorithm for Photovoltaic System Under Partial Shading. IEEE Trans. Ind. Electron. 2019, 66, 265–275. [Google Scholar] [CrossRef]
  31. Mohanty, S.; Subudhi, B.; Ray, P.K. A new MPPT design using grey wolf optimization technique for photovoltaic system under partial shading conditions. IEEE Trans. Sustain. Energy 2016, 7, 181–188. [Google Scholar] [CrossRef]
  32. Li, X.; Wen, H.; Hu, Y.; Jiang, L.; Xiao, W. Modified beta algorithm for gmppt and partial shading detection in photovoltaic systems. IEEE Trans. Power Electron. 2018, 33, 2172–2186. [Google Scholar] [CrossRef]
  33. Sun, Z.; Zhao, A.; Zhu, L.; Lu, K.; Wu, W.; Blaabjerg, F. Extremum-seeking Control of Wave Energy Converters using Two-objective Flower Pollination Algorithm. In Proceedings of the 2018 IEEE International Power Electronics and Application Conference and Exposition (PEAC), Shenzhen, China, 4–7 November 2018; pp. 1–5. [Google Scholar]
  34. Yang, X.S.; Karamanoglu, M.; He, X. Multi-objective flower algorithm for optimization. Procedia Comput. Sci. 2013, 18, 861–868. [Google Scholar] [CrossRef]
  35. Ram, J.P.; Rajasekar, N. A new global maximum power point tracking technique for solar photovoltaic (PV) system under partial shading conditions (PSC). Energy 2017, 118, 512–525. [Google Scholar]
  36. Pei, T.; Hao, X.; Gu, Q. A Novel Global Maximum Power Point Tracking Strategy Based on Modified Flower Pollination Algorithm for Photovoltaic Systems under Non-Uniform Irradiation and Temperature Conditions. Energies 2018, 11, 2708. [Google Scholar] [CrossRef]
  37. Michel, W.H. Sea spectra revisited. Mar Technol. 1999, 36, 211–227. [Google Scholar]
  38. Ansari, K.A.; Khan, N.U. Computation of environmental forces for use in offshore vessel dynamic analysis. Int. J. Energy Res. 1989, 545–553. [Google Scholar] [CrossRef]
  39. Taghipour, R.; Perez, T.; Moan, T. Hybrid frequency–time domain models for dynamic response analysis of marine structures. Ocean Eng. 2008, 35, 685–705. [Google Scholar] [CrossRef]
  40. Tedeschi, E.; Carraro, M.; Molinas, M.; Mattavelli, P. Effect of control strategies and power take-off efficiency on the power capture from sea waves. IEEE Trans. Energy Convers. 2011, 26, 1088–1098. [Google Scholar] [CrossRef]
  41. Yang, X.S.; Karamanoglu, M.; He, X. Flower pollination algorithm: A novel approach for multi-objective optimization. Eng. Optim. 2014, 46, 1222–1237. [Google Scholar] [CrossRef]
  42. Ram, J.P.; Rajasekar, N. A novel flower pollination based global maximum power point method for solar maximum power point tracking. IEEE Trans. Power Electron. 2017, 32, 8486–8499. [Google Scholar]
Figure 1. Point-absorber type wave energy converter (WEC).
Energies 12 01343 g001
Figure 2. Wave energy spectrum according to Bretschneider model.
Energies 12 01343 g002
Figure 3. Time-domain excitation force for irregular waves.
Energies 12 01343 g003
Figure 4. Equivalent electric model of the WEC.
Energies 12 01343 g004
Figure 5. Average power and power peak-to-average ratio of the WEC under different damping and stiffness coefficients, (a) average power (b) power peak-to-average ratio.
Energies 12 01343 g005
Figure 6. Flow chart of maximum power point tracking (MPPT) control algorithm for point-absorbing type WEC based on flower pollination algorithm (FPA).
Energies 12 01343 g006
Figure 7. Simulated average power obtained by (a) FPA, (b) hill-climbing method.
Energies 12 01343 g007
Figure 8. Simulated damping coefficient and stiffness coefficient obtained by (a) FPA, (b) hill-climbing method.
Energies 12 01343 g008
Figure 9. Simulated excitation force and the velocity of the buoy.
Energies 12 01343 g009
Figure 10. Simulated instantaneous and average power obtained by (a) FPA and (b) hill-climbing method.
Energies 12 01343 g010
Figure 11. Simulated power spectrum of (a) average power, (b) apparent power.
Energies 12 01343 g011
Figure 12. Simulated power search in case of a sudden change in sea state.
Energies 12 01343 g012
Figure 13. Synchronous test bench, (a) overall control block diagram in the laboratory and (b) experimental setup.
Energies 12 01343 g013
Figure 14. Measured speed vs. the reference speed of permanent magnet synchronous generator (PMSG).
Energies 12 01343 g014
Figure 15. Measured instantaneous mechanical power of the synchronous test bench. (a) FPA and (b) hill-climbing method.
Energies 12 01343 g015
Figure 16. Measured excitation force and the velocity of buoy, (a) FPA and (b) hill-climbing method
Energies 12 01343 g016
Table 1. Comparison of average power absorption and peak-to-average ratio in simulation.
Case Number T p H 1 / 3 FPAHill-Climbing
Method
Case 17.5 s1.2 mPPTO = 53.5 kW
Ratio = 11.6
PPTO = 51.4 kW
Ratio = 14.8
Case 28 s1.6 mPPTO = 103.7 kW
Ratio = 12.1
PPTO = 98.3 kW
Ratio = 16.1
Case 36.5 s0.8 mPPTO = 28.7 kW
Ratio = 11.3
PPTO = 27.1 kW
Ratio = 13.8
Table 2. Data of the buoy and sea state.
QuantitySymbolValueUnits
Wave period T p 7.5[s]
Significant wave height H 1 / 3 1.2[m]
Buoy massM267040[Kg]
Added mass m 156940[Kg]
Spring stiffnessK785890[N/m]
Total buoy damping B r a d 91520[Kg/s]
Table 3. Permanent magnet synchronous motor parameters.
SymbolParameterValue
npPole number8
Pratrated power3000 [W]
Vratrated voltage220 [V]
Iratrated current12 [A]
nratrated speed1500 r/min
Tratrated torque19 [ N m ]
TmaxMaximum torque47 [ N m ]
fPWMPWM frequency5 kHz
Table 4. Comparison of average power absorption and peak-to-average ratio in experiments.
Case Number T p H 1 / 3 FPAHill-Climbing
Method
Case 17.5 s1.2 mPPTO = 123.2
WRatio = 12.4
PPTO = 117.8
WRatio = 15.4
Case 28 s1.6 mPPTO = 243.6
WRatio = 13.5
PPTO = 220.6
WRatio = 17.4
Case 36.5 s0.8 mPPTO = 61.8
WRatio = 11.8
PPTO = 56.4
WRatio = 14.5

