Article

An Optimization Study on Soot-Blowing of Air Preheaters in Coal-Fired Power Plant Boilers

1
School of Electrical and Control Engineering, North University of China, Taiyuan 030051, China
2
Department of Automation, Shanghai Jiao Tong University, and Key Laboratory of System Control and Information Processing, Ministry of Education of China, Shanghai 200240, China
3
School of Data Science and Technology, North University of China, Taiyuan 030051, China
4
Autonomous Systems and Intelligent Control International Joint Research Center, Xi’an Technological University, Xi’an 710021, China
*
Author to whom correspondence should be addressed.
Energies 2019, 12(5), 958; https://doi.org/10.3390/en12050958
Submission received: 28 January 2019 / Revised: 7 March 2019 / Accepted: 8 March 2019 / Published: 12 March 2019
(This article belongs to the Section I: Energy Fundamentals and Conversion)

Abstract

:
This paper presents a comprehensive approach for optimization of soot-blowing of air preheaters in a coal-fired power plant boiler. In the method, modeling of the cleanliness factor is firstly proposed to monitor the ash deposition status of the air preheaters. Then, the statistical fitting of the ash fouling status is subsequently obtained to analyze the ash fouling dynamics and assessment of optimized soot-blowing strategies. Soot-blowing strategies are finally developed to optimize the steam consumption and heat transfer efficiency. Our methods can achieve the fouling monitoring and soot-blowing optimization of air preheater (APH) by using the existing monitoring data, not requiring additional special instruments and complex computing systems. The methodology is validated with the actual operating data of a 300 MW coal-fired power plant boiler. The results show the effectiveness of the proposed method. It can be used for the soot-blowing optimization in most coal-fired power plant boiler with air preheaters.

1. Introduction

During the past decades, concern about energy conservation and environmental protection is growing all over the world. Coal-fired power plants are one of the heavy consumers of primary energy and pollutant emissions sources. Therefore, the interest on control and optimization for coal-fired power plant boiler has consequently become extremely relevant, aiming at increasing the thermal efficiency and reducing the pollutant emissions [1,2,3,4].
Deposition of ash on heat transfer equipment has always been one of main operation concerns in coal-fired power plant boiler [5]. The main problems caused by ash deposition include a reduction in boiler thermal efficiency, higher CO2 emissions, incomplete combustion with an increase in CO and NOx emissions, and corrosion caused by sulfides [6,7]. It has been estimated that ash deposition will be a significant source of losses of energy efficiency and availability in thermal power plants that may add up to 1 percent under typical operating conditions [8]. Therefore, deposition minimization is an essential purpose from both environmental and economic viewpoints [9,10].
The deposition of coal-fired power plant boiler is mainly classified into slagging and fouling [11,12]. Slagging is takes place where the temperature is high and radiative heat transfer is the dominant mechanism, i.e., furnace and roof superheaters. Fouling deposition is occurs when the temperature is relatively low and the main heat transfer mechanism is convective heat transfer, i.e., low temperature superheaters, reheaters, economizers, and air preheaters. Ash deposition depends on the coal mineral matter’s nature strongly.
The traditional method for a coal-fired power plant boiler to reduce boiler ash deposition is soot-blowing. There are many kinds of soot-blowing media, such as steam and acoustic wave. Generally, steam is always used to blow away the deposition. The consumption of steam increases the heat losses and reduces the turbines production, thereby decreasing plant efficiency. Although frequent operation of soot-blowing can increase heat transfer efficiency, it leads to the waste of steam, raised maintenance loss, and tube corrosion. On the contrary, too little blowing results in ash deposition accumulation and, as a result, reduces thermal efficiency. Soot blowers are continuously initiated according to predefined sequences and operating experiences in many coal-fired power plants. The soot-blowing strategies are not optimum without a proper boiler assessment in most cases. Therefore, optimization for soot-blowing system with actual on-load cleaning is essential to improve boiler operating performances [13]. Researchers and engineers focus on the optimization of the soot-blowing frequency [14] and soot-blowing durations to improve thermal efficiency and reduce combustion pollution [15].
Online monitoring of ash deposition status in different sections of boiler is the basis of soot-blowing optimization. It can be accomplished by using particular power plant instrumentation and online computations or a combination of both approaches. The particular power plant instrumentation, such as heat flux meters [16,17] and acoustic pyrometry [18], can easily show the status of the furnace’s heat absorption by providing continuous signals, while inducing a meaningful increase in cost of installation, maintenance, and the sensor. The fuzzy models and artificial neural network are well applied in the monitoring of ash fouling of boilers [7,19,20,21], but it is difficult for real time monitoring because of great sum of calculations. A statistical model of ash deposition was proposed by Zheng et al. in a pulverized-coal boiler by an exact simulation Monte Carlo approach [22,23].
Air Preheater (APH) of a coal-fired power plant boiler is an important piece of engineering equipment, which is designed to heat air with the primary objective of increasing boiler thermal efficiency. Nevertheless, there are neither special instruments like heat flux meters nor systematic research in monitoring and quantification of ash fouling characteristic in APH. Yan et al. proposed a flue gas differential pressure approach for APH ash fouling monitoring [24], there exist some difficulties in application in some power plant due to flue gas density fluctuations caused by the coal quality fluctuations. As a consequence of the lack of accurate fouling level monitoring, soot blower are usually working in a nonoptimal state. There are still some coal-fired power plant boilers without intelligent soot-blowing systems in China. The over soot-blowing state results in increased steam consumption and accelerates the deterioration of tube surfaces; the less soot-blowing state results in a loss of heat absorption and a decrease in the thermal efficiency of the boiler. On the other hand, due to the fact that the quality of coal burned in the furnace is different from the designed coal quality in some power plants in China, the ash content is higher. Moreover, the operation conditions of the boiler are constantly changing with the fluctuation of load. Some intelligent soot-blowing systems based on design parameters cannot track these changes well which may cause some not timely or excessive soot-blowing. Therefore, it is necessary to study the real-time soot-blowing optimization strategies to improve soot-blowing efficiency.
In this paper, a comprehensive approach is proposed for optimization of soot-blowing of APH in a coal-fired power plant boiler, aiming at increasing the boiler efficiency and decreasing the steam consumption. The approach is initially focused on the monitoring of ash fouling of the APH based on the dynamic energy balance approach. Then, the dynamic monitoring model is developed through the statistical analysis of the fouling rates under different operation conditions. Lastly, soot-blowing optimization strategies are proposed in order to minimize the steam consumption in the ash cleaning process in APH, in which the soot-blowing frequencies and soot-blowing durations are decided. The method can be used to guide soot-blowing operations to improve APH performance, while no complex computing systems and additional instruments are required. The soot-blowing strategy is convenient to guide and assess the existing soot-blowing operations of boilers without an intelligent soot-blowing system. It is also a good supplement for some power plant boilers with an intelligent soot-blowing system.
This paper is organized as follows. Section 2 gives a brief description on case study coal-fired power plant boiler, related air preheaters, and its soot-blowing system. In Section 3, the online monitoring model to calculate the ash fouling level of the APH from available plant data is summarized. Section 4 shows the monitoring results and statistical analysis about the ash fouling level of the APH. Soot-blowing optimization strategies for durations and frequencies are discussed in Section 5. The paper finishes with conclusions.

2. Case Study

The comprehensive approaches described in this paper have been validated with actual data acquired from the unit 2 at QianXi power station in China. The boiler is a design of 300 MW unit load of drum type with steam reheating. The nominal main steam production of the boiler is 909.6 t/h at the rated operating conditions. It is a subcritical unit of natural circulation design and balanced draft, W-shaped flame combustion. The main heat transfer structures of the boiler are a double arch single furnace, three stages of superheaters, a single reheating system with high and low temperatures reheaters, two economizers, and two air preheaters. The steam output temperature from first superheater is 313 ℃ and the steam output temperature from the final superheater is 540 ℃. The boiler’s main relevant operation values are listed in Table 1.
The boiler uses coal as fuel. The design checked coal of the boiler is Qianxi anthracite coal. The coal’s main properties are listed in Table 2.
This paper focuses on the ash fouling monitoring and soot-blowing optimization of APH. The regenerative APHs are used in most of the coal-fired power plants in China. There are two main types of regenerative APHs: the rotating plate regenerative APH and the stationary plate regenerative APH. The APHs in this study’s power plant use the rotating plate design which comprises a central rotating plate element that is installed within a casing divided into triple-sectors that contain seals around the element. The seals allow the element to rotate through all the sectors, but minimize the gas leakage while providing flue gas pathways and separated gas air through each sector.
The largest sector is connected to the boiler hot flue gas outlet. It is used to absorb the energy of hot flue gas by means of the hot gas runs past the central element. The second sector is small and is connected to the secondary air. When the APH rotates into the sectors, the secondary air is heated before being carried to furnace for combustion. The smallest sector is also connected to the primary air which is routed in the pulverizers and used to heat the pulverized coal and carry them into the furnace for combustion. Thus, the total air heated in the rotating plate regenerative APH provides three functions: One effect is to remove the moisture from the pulverized coal dust using heat from the air. The second function is carrying the pulverized coal to the boiler burners. The last function is to provide the primary air for combustion. The APH rotates quite slowly to first allow optimum heat transfer from the hot exhaust gases to the element, then, as is rotates, from the element to the cooler air in the other sectors. The schematic diagram of the APH is shown in Figure 1.
The APHs in the case study boiler are equipped with 4 IK-AH soot blowers aiming at the on-load ash cleaning by steam. The soot-blowing operations are mainly based on operators’ experiences and following a fixed sequence.

3. Ash Fouling Monitoring and Soft Measurement

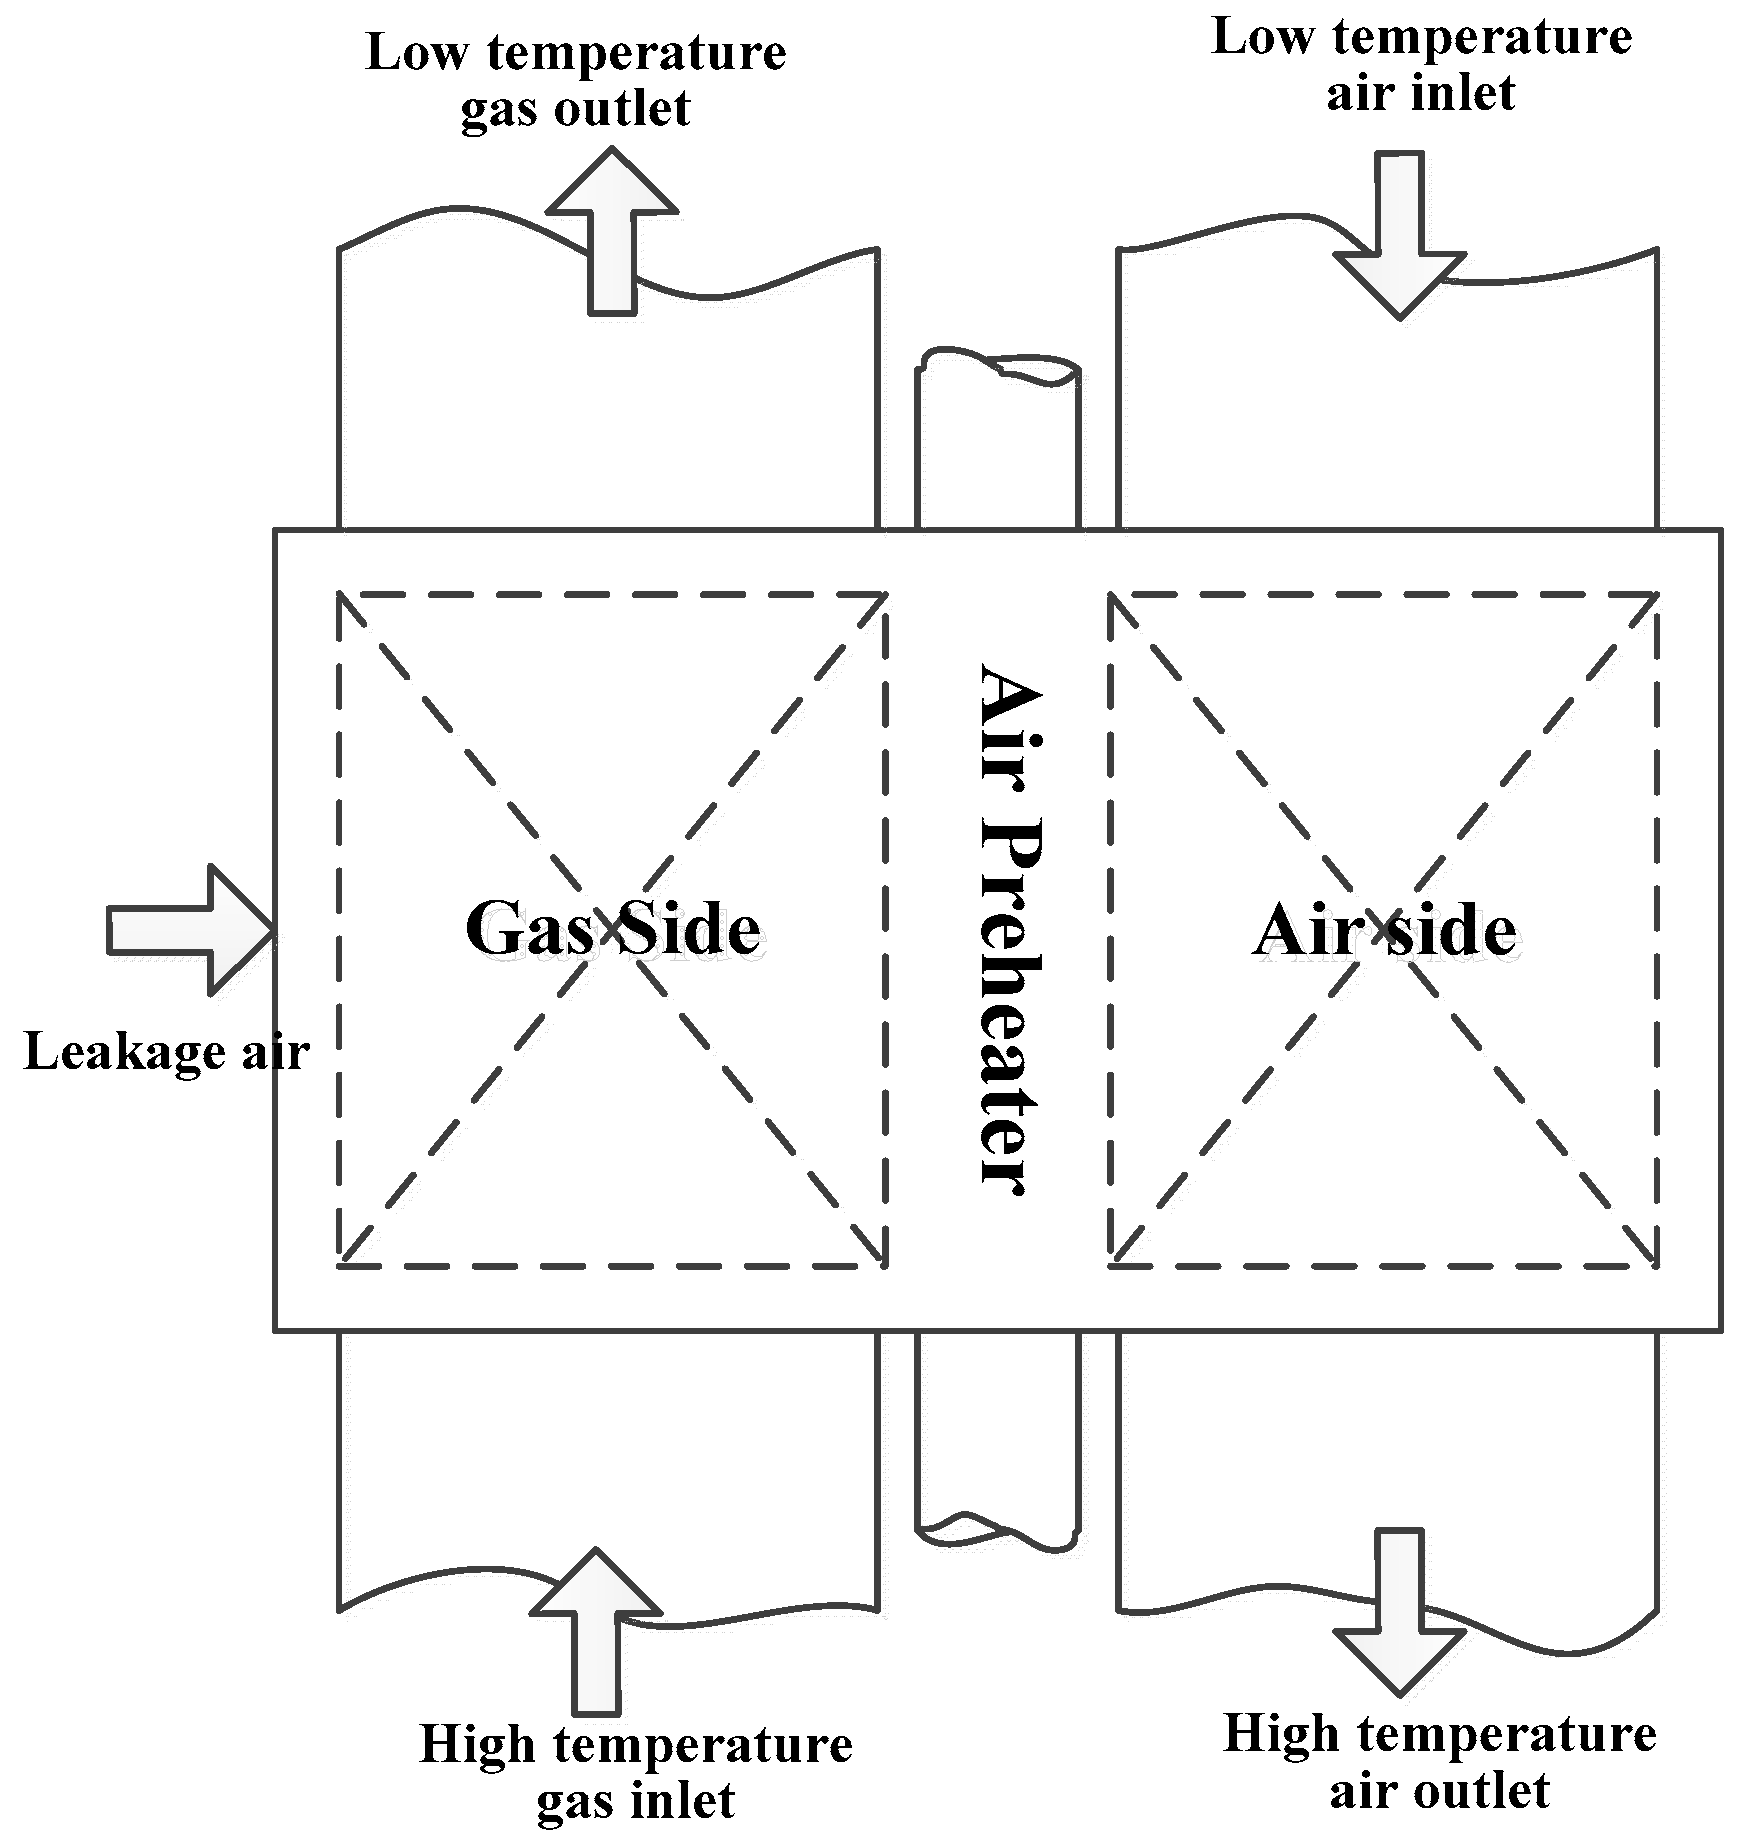
Monitoring and simulation of heat transfer of coal-fired power plant boiler can be undertaken as a set of heat transfer equipment due to the different heat transfer forms and distributed structures. APH is an independent heat recovery system which has its own separate soot-blowing system. There is no any particular instrumentation to assess ash deposition effects on heat transfer efficiency in APH. Only standard measurements of pressures and temperatures of primary air, secondary air, and flue gas are available in both inlet and outlet of the APH.

3.1. Ash Fouling Monitoring

Ash fouling monitoring provides an opportunity to know the operation status of the APHs of the boiler. It is also the basis for the optimization of soot-blowing and maintenance.
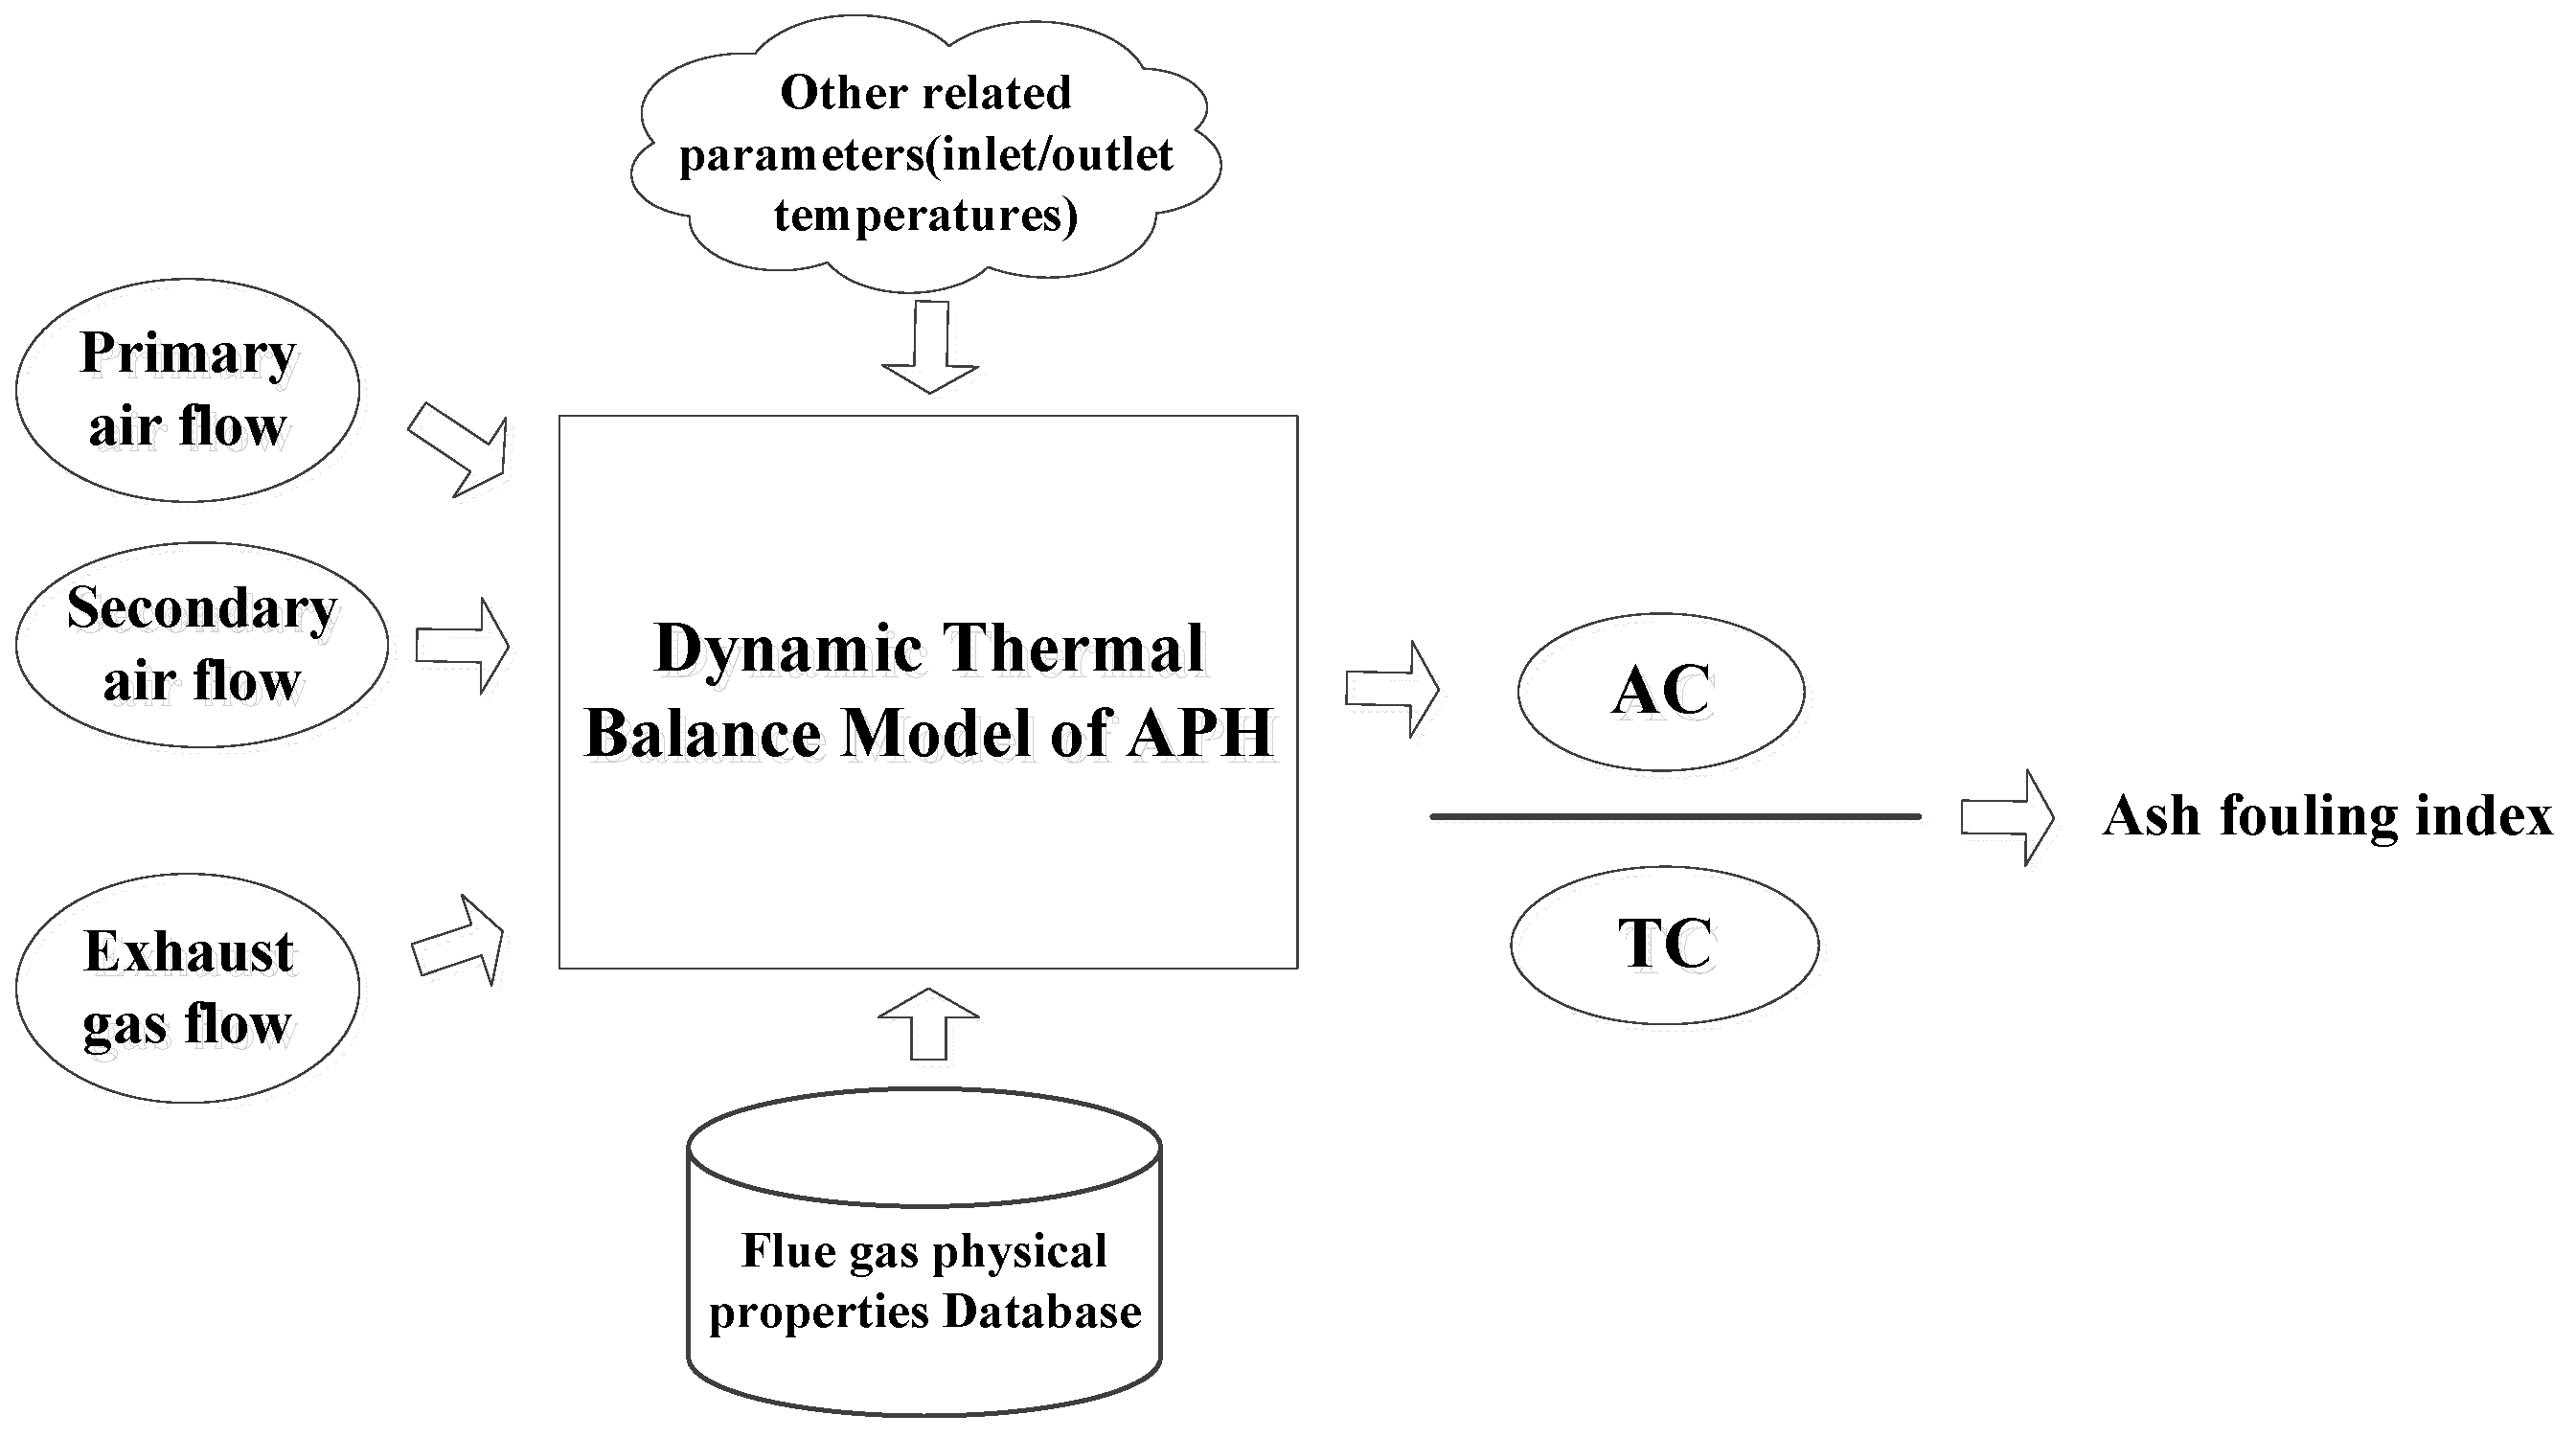
Figure 2 depicts the calculation structure. In this model, the energy transferred from the hot gas side to the cold air side can be calculated by means of an energy balance approach once the available temperatures, pressures, and mass flows are known. In actual working conditions, the working efficiency of the APH depends on ash deposition status but also on working status, especially the load variations. Therefore, to take away from the unwanted impacts, the energy storage variations in the mental elements are considered. The actual heat transfer coefficient (AC) is calculated by the dynamic energy balance model. Furthermore, the theoretical heat transfer coefficient (TC) is obtained. The cleanliness factor, which is the ratio of AC and TC, can be used to reflect the state of ash fouling.
For the air preheater, the heat transfer rate in gas side is determined as follows
q g = m g C g ( T g i T g o )
where q g is heat transfer rate of gas side, m g is mass flow rate of flue gas, C g is the approximate mean specific heat of flue gas, T g i   and   T g o are the gas temperatures in the APH gas inlet and outlet, respectively.
For the air side the heat transfer rate is
q a = m a 1 C a 1 ( T a 1 o T a 1 i ) + m a 2 C a 2 ( T a 2 o T a 2 i )
where q a is heat transfer rate of air side, m a 1   and   m a 2 are mass flow rate of primary air and secondary air, C a 1   and   C a 2 are the mean specific heat of primary air and secondary air, and T a 1 i   ,   T a 1 o   ,   T a 2 i   and   T a 2 o are air temperatures in the APH primary air and secondary air inlet and outlet, respectively.
Traditionally, the energy released in the gas side equals the energy absorbed in the air side.
q a = q g
However, the energy storage of the metal of heat transfer surfaces is always varying with the load fluctuations. Therefore, we introduce the following equation to deal with these uncertainties in this study.
q a = q g ± Δ q j
where Δ q j is the energy storage change of the metal of heat transfer surfaces in the air preheater.
Δ q j = C j m j T j t
where C j , m j , and T j are the average specific heat capacity, mass, and temperature of the metal of air preheater, respectively.
Due to the air leakage, Equation (1) can be rewritten as
q g = m g C g ( T g i T g o ) + β h l f
where β is the air leakage rate and h l f is the heat absorbed by the leakage air.
Thus, the actual heat transfer coefficient of air preheater can be calculated as follows
K r = q r A Δ T = q a A Δ T
where q r is the actual heat absorption rate of the heat transfer surface, A is the area of the heat transfer surface, and Δ T is the log mean temperature difference, which can be described as follows
Δ T = [ ( T g i T a o ) ( T g o T a i ) ] [ ln ( T g i T a o ) / ln ( ( T g o T a i ) ]
To a certain degree, K r can reflect the fouling level of the heat transfer surface. However, assuming that the fouling level of the heat transfer surface is stable, with the increase of unit load and fuel quality, K r will increase while the fouling level is unchanged. Therefore, we introduced the cleanliness factor which is the ratio of actual heat transfer coefficient K r and theoretical heat transfer coefficient K 0 .
The TC K 0 represents the ideal heat transfer efficiency under clean status, which is usually calculated by the sum of theoretical radiation heat transfer coefficient α f and theoretical convection heat transfer coefficient α d .
K 0 = α f + α d
Generally,
α f = 5.7 × 10 8 a g b + 1 2 a h T 3 × ( 1 ( T g b T ) 4 / 1 T g b T )
α d = 0.65 C s C z λ d ( w d υ ) 0.64 Pr 0.33
where a g b and a h are the blackness of the heat transfer surface and the flue gas, respectively, T and T g b are the temperature of the heat transfer surface and the flue gas, respectively, C s and C z are the horizontal and vertical structure parameters of the heat transfer surface, respectively, λ is the heat conductivity coefficient of the flue gas, d is the pipe diameter of the exchanger, ω is the gas flow rate, υ is the dynamic viscosity coefficient of the flue gas, and Pr is Prandtl constant.
The heat transfer in APHs is convection dominated form. Thus,
K 0 α d
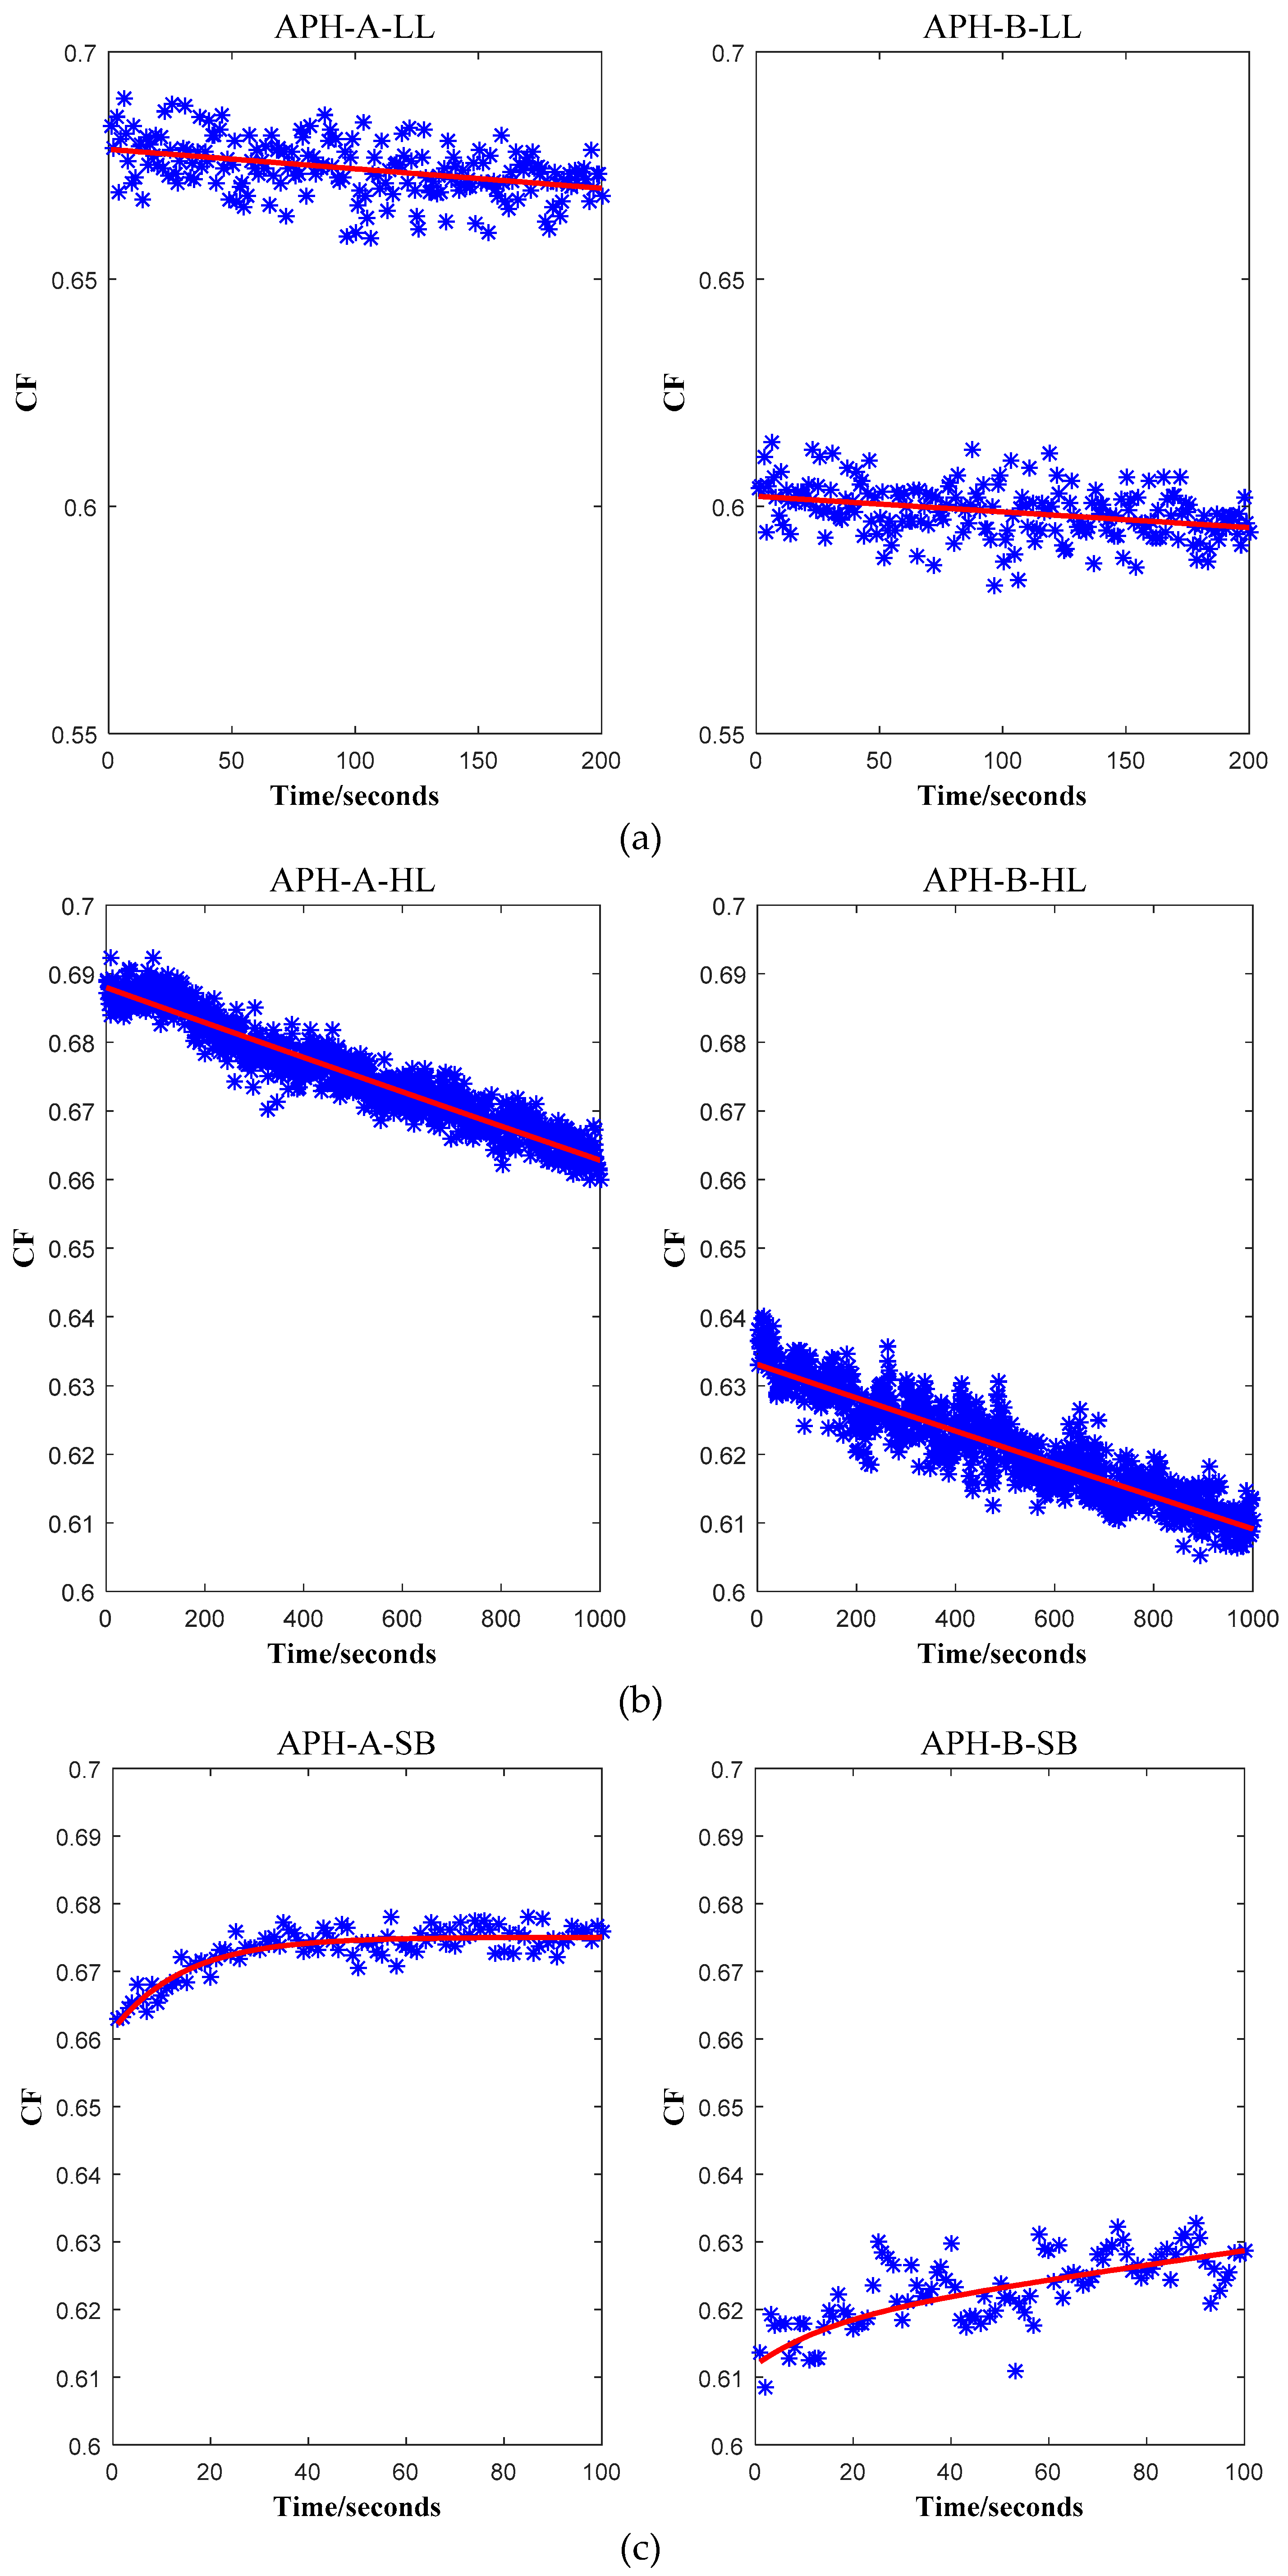
Therefore, the ash fouling status of APH can be described by Cleanliness Factor (CF) as follows
CF aph = K r K 0
Obviously, the value of CF aph should range from 0 to 1, with 1 corresponding to the clean status of APH. In fact, CF will not be 1.0 or 0. Only in the ideal conditions will CF be close to 1.0 or 0.

3.2. Soft Measurement of Air Leakage Rate

The air leakage rate is always approximately determined based on gas inlet and outlet oxygen analysis [25]. Firstly, the air leakage coefficient is determined as follows
κ = χ i n χ o u t
where χ i n and χ o u t are the excess air coefficient of the APHs inlet and outlet, respectively.
Generally,
χ i n = 21 21 O 2 i ,   χ o u t = 21 21 O 2 o
where O 2 i and O 2 o are the oxygen content in exhaust gas of the APHs inlet and outlet, respectively.
Therefore, the air leakage rate can be calculated as
β = κ χ i n · 90 % = O 2 i ( O 2 i O 2 o ) 0.9 · ( 21 O 2 i ) ( 21 O 2 o )
Figure 3 shows the soft measurement results of air leakage rates in case study APHs, where the sample frequency is 5 seconds. The air leakage condition of APH-A is better than APH-B, due to the fact that APH-A was repaired a few days prior to testing. As mentioned above, this model can be used in the online calculation of CF in APHs.

4. Model Validation and Analysis

In this section, the thermal model is validated and analyzed with actual operational data acquired from the 300 MW coal-fired power plant boiler. The process data under routine operation has been retrieved from the distributed control system (DCS) and sample frequency of measured variables is 30 seconds. The monitoring results of CFs in APHs are depicted in Figure 4, together with the unit load and soot-blowing signals. The calculation procedure was carried out in three days.
It is observed that the fouling level of each APH evolves with distinguishing dynamics. The CFs of both APHs decrease much faster during high load than low load. It is observed that soot-blowing under high load begins when the CFs reach a lower level and stops at a higher level. The fact that the heat transfer efficiencies of APHs are higher after soot-blowing illustrates the soot-blowing effect and dynamics. Therefore, it shows that our methods can be efficiently used to monitor the work status of the APHs in real-time.
The fouling level dynamics of APHs can be classified into three different cases: fouling deposited case during low load (LL) or high load (HL) and in the soot-blowing case (SB). In most cases, the CFs dynamics are approximated by an exponential function or straight line.
The fitting models and the actual data of CFs under each condition (LL, HL, and SB) are shown in Figure 5. Figure 5a,b indicate the fitting models and actual fouling level evolution during LL and HL, where the fitting functions are a straight line during LL and an exponential function during HL. Figure 5c compare the fitting model of exponential function with the actual CFs during soot-blowing interval. The parameters of the dynamical models in different cases are shown in Table 3. The fitting models can be used for prediction of the fouling levels in APHs and soot-blowing optimization.

5. Optimization of Soot-Blowing in APHs

In order to remove the ash deposition, a large proportion of power plant boilers in China use superheated steam to blow the ash, called ‘soot-blowing’. In the actual soot-blowing process, the exhaust gas temperature is usually used as an indicator whether to conduct soot-blowing. However, there are many other factors that influence the exhaust gas temperature. It is difficult for operators to estimate the ash deposition status by gas temperature. Soot-blowing operations are always set to predefined frequency and fix durations in a large part of power plants boilers in China. As described in the introduction, insufficient or excessive soot-blowing of the heat transfer surfaces is not desirable.
Thus, it is quite necessary to accurately grasp the fouling states of heat transfer surfaces and adjust the soot-blowing operations in time. The main effects for optimization of soot-blowing are maintaining thermal efficiency of heat transfer surfaces and reducing steam consumptions. It is always helpful to reduce the friction losses and improve the remaining useful life of the heat transfer surfaces.

5.1. Optimization of Soot-Blowing Frequency

In this subsection, a soot-blowing strategy for optimizing the soot-blowing frequency is discussed, which maximizes the net benefits of soot-blowing. Soot-blowing can reduce the fouling of APH and increase the heat absorption accordingly. We defined them as soot-blowing benefits. The soot-blowing losses considered in this study are the steam losses.
In Figure 6, the variable of the abscissa t in Figure 6 represents the soot-blowing duration, while the ordinate represents the losses and benefits caused by soot-blowing operations. Thus, the net benefits of soot-blowing can be expressed as follows
B n = B s L = f b ( t ) f l ( t )
where B n ,   B s   and   L are the net benefits, benefits, and losses of soot-blowing, respectively. f b ( t )   and   f l ( t ) are the corresponding functions of benefits and losses of soot-blowing, respectively.
Therefore, the main objective of optimization for soot-blowing is to find the optimal time t o p to obtain the maximum net benefits M a x ( B n ) .
The losses during one soot-blowing cycle can be expressed as follows
L = 0 t 1 f ( t ) d t + Q s b = 0 t 1 f ( t ) d t + m s t s ( h s i h s o ) .
where t 1   and   t s are cycle time and soot-blowing time, respectively, and f ( t ) is the loss function of heat transfer efficiency of each heat transfer surface dedicated to the ash fouling.
The soot-blowing losses considered in this study are steam consumption. Thus, soot-blowing losses Q s b in each soot-blowing cycle can be calculated as follows
Q s b = m s t s ( h s i h s o )
where m s ,   t s ,   h s o   and   h s i are the steam mass flow rate, soot-blowing durations, steam enthalpy of condenser inlet, and soot-blower inlet, respectively.
The calculation results for APHs in the case study boiler are shown in Table 4.
As shown in Table 4, we can clearly find that the existing soot-blowing cycles in the APHs are too long. The soot-blowing is insufficient for all APHs.

5.2. Optimization of Soot-Blowing Durations

The next step of the optimization for soot-blowing of the APHs is to determine the soot-blowing durations.
Figure 7 shows the soot-blowing benefits in the durations. The heat absorbed by APHs without a soot-blowing operation can be expressed as follows
Q n = A t 0 t 1 + t s f n ( t ) Δ T d t
The actual heat absorbed by heat transfer surfaces with soot-blowing operation is
Q b = A t 0 t 1 + t s f s ( t ) Δ T d t
where t 0 is the soot-blowing start time, A is area of the heat transfer surface, Δ T is log mean temperature difference, f n ( t )   and   f s ( t ) are CF functions without soot-blowing and with soot-blowing operation, respectively. Obviously, f s ( t ) = K r ( t ) , and the CF curve can be approximated as an exponential functions or straight line. The detail of fitting model under each operation conditions can be seen in Section 4.
Therefore, the soot-blowing benefits can be calculated as follows
B = Δ Q = Q b Q n = A { t 0 t 1 + t s K r ( t ) Δ T d t t 0 t 1 + t s f n ( t ) Δ T d t } = A Δ T t 1 t 1 + t s [ K r ( t ) f n ( t ) ] d t
Accordingly, the net benefits are as follows
B n = B Q s b = A Δ T t 1 t 1 + t s [ K r ( t ) f n ( t ) ] d t m s t s ( h s o h s i )
Then the optimal soot-blowing duration t o p to be solved are given as follows
M a x   B n s . t .   t 1 > 0 ,   t s > 0
The corresponding optimal cleanliness factor C F o p can be obtained as
C F o p = K r ( t o p ) K 0
Table 5 shows the optimization results of the soot-blowing durations of each APH. We can see clearly that the optimum soot-blowing duration of each APH is different, of which the fouling status of APH-B is more serious than APH-A. This conclusion is consistent with Figure 3. We can draw the conclusion that soot-blowing for each APH is in sufficient. It is quite necessary to increase the soot-blowing time for the APHs in the case study boiler.
From what have been mentioned above, the implementation procedure and development of soot-blowing optimization consequently is as follows
Step 1: Ash fouling monitoring. Firstly, the ash fouling status of each APH is expressed as CFs and monitored online.
Step 2: Fitting models parameters determination. Determine the model functions and related parameters under different operation conditions.
Step 3: Soot-blowing optimization model calculating. Thirdly, calculate the optimal soot-blowing cycle. Consequently, the optimal cleanliness factor C F o p will be calculated by solving M a x   B n in Equation (24).
Step 4: Constraints judgments. In this step, the soot-blowing operation’s required constraints will be considered. Is the unit load is stable? Will the CF reach its optimal degree?
Step 5: Start soot-blowing. Start soot-blowing if the conditions above are satisfied.
Step 6: Determine the optimal soot-blowing durations. Calculate the optimal soot-blowing duration t o p .
Step 7: End soot-blowing and enter the next cycle. If the soot-blowing time reaches the optimal time, t o p , end soot-blowing and the enter next cycle. If not, continue soot-blowing.
The methodology proposed in this section can calculate the optimum soot-blowing duration and critical soot-blowing point for each APH real time. It is effective to assess the actual soot-blowing operations and guide the next operations.

6. Conclusions

The comprehensive approaches, which were proved theoretically and practically to be feasible and effective in monitoring ash fouling status and optimization of soot-blowing in APHs in a coal-fired power plant boiler, are presented in this paper. The approach combines online modeling of heat transfer efficiency to monitor the fouling level, statistical fitting to characterize the CFs’ dynamics, and soot-blowing optimization aiming at steam consumption conservation. Our methods can achieve the fouling monitoring and soot-blowing optimization of APH by using the existing monitoring data. The method can be used to guide soot-blowing operations to improve the APH’s performance, while no complex computing systems and additional instruments are required. The soot-blowing strategy is convenient to guide and assess the existing soot-blowing operations of the boilers without intelligent soot-blowing system. It is also a good supplement for some power plant boilers with an intelligent soot-blowing system.
The validation results show that the ash fouling monitoring model can provide a good assessment of ash fouling of APHs in a relatively economical and simple way.

Author Contributions

Y.S. and J.W. conceived the theme; Y.S. and J.W. designed and performed the numerical simulations; and Y.S. and F.C. analyzed the results and wrote the original manuscript.

Funding

This research was funded by the National Natural Science Foundation of China (No. 61533013), the key Program of Research and Development of ShanXi Province (No.201703D111011), the Natural Science Foundation of ShanXi Province (No.201801D121159), the Youth Natural Science Foundation of ShanXi Province (No.201801D221208), the Natural Science Foundation of North University of China (No.2016032 and 2017025), and the Shaanxi Provincial Key Project (2018ZDXM-GY-168).

Conflicts of Interest

The authors declare no conflicts of interest.

Abbreviations

The following abbreviations are used in this manuscript.
B benefits
C specific heat capacity (kJ/(kg·K))
d diameter (m)
K heat transfer coefficient (kJ/(m2·s))
L losses
m mass flow rate (kg/s)
Pr Planck constant (J/s)
Q energy (kJ)
q heat transfer rate (kJ/s)
T temperature (°C)
Greek symbols
β air leakage rate (%)
Δ increment
χ excess air coefficient
λ heat conductivity coefficient (W/(m·K))
ω gas flow rate (m/s)
υ dynamic viscosity coefficient (m2/s)
Subscripts/Superscripts
0 theoretical values
a air side
a r as received basis
g gas side
i / i n inlet section
j mental section
l loss values
l f leakage air
n net values
o / o u t outlet section
o p optimal values
r actual values
s / s b soot-blowing operation
Abbreviations
BECRBoiler Economic Continuous Rating
APHair preheater
CFcleanliness factor
HLhigh load
LLlow load
SBsoot-blowing

References

  1. Sandberg, J.; Fdhila, R.B.; Dahlquist, E.; Avelin, A. Dynamic simulation of fouling in a circulating fluidized biomass-fired boiler. Appl. Energy 2011, 88, 1813–1824. [Google Scholar] [CrossRef]
  2. DíEz, L.I.; Cortés, C.; Arauzo, I.; Valero, A. Combustion and heat transfer monitoring in large utility boilers. Int. J. Therm. Sci. 2001, 40, 489–496. [Google Scholar] [CrossRef]
  3. Yan, Q.; Wang, Y.; Baležentis, T.; Sun, Y.; Streimikiene, D. Energy-Related CO2 Emission in China’s Provincial Thermal Electricity Generation: Driving Factors and Possibilities for Abatement. Energies 2018, 11, 1096. [Google Scholar] [CrossRef]
  4. Han, Y.; Xu, C.; Xu, G.; Zhang, Y.; Yang, Y. An Improved Flexible Solar Thermal Energy Integration Process for Enhancing the Coal-Based Energy Efficiency and NOx Removal Effectiveness in Coal-Fired Power Plants under Different Load Conditions. Energies 2017, 10, 1485. [Google Scholar] [CrossRef]
  5. Harding, N.S.; O’Connor, D.C. Ash deposition impacts in the power industry. Fuel Process. Technol. 2007, 88, 1082–1093. [Google Scholar] [CrossRef]
  6. Shao, Y.; Wang, J.; Preto, F.; Zhu, J.; Xu, C. Ash Deposition in Biomass Combustion or Co-Firing for Power/Heat Generation. Energies 2012, 5, 5171–5189. [Google Scholar] [CrossRef]
  7. Romeo, L.M.; Gareta, R. Neural network for evaluating boiler behaviour. Appl. Therm. Eng. 2006, 26, 1530–1536. [Google Scholar] [CrossRef]
  8. Valero, A.; Cortés, C. Ash fouling in coal-fired utility boilers. Monitoring and optimization of on-load cleaning. Prog. Energy Combust. Sci. 1996, 22, 189–200. [Google Scholar] [CrossRef]
  9. Dong, M.; Han, J.; Li, S.; Pu, H. A Dynamic Model for the Normal Impact of Fly Ash Particle with a Planar Surface. Energies 2013, 6, 4288–4307. [Google Scholar] [CrossRef]
  10. Dong, M.; Li, S.; Xie, J.; Han, J. Experimental Studies on the Normal Impact of Fly Ash Particles with Planar Surfaces. Energies 2013, 6, 3245–3262. [Google Scholar] [CrossRef]
  11. Barrett, R.E.; Tuckfield, R.C.; Thomas, R.E. Slagging and Fouling in Pulverized-Coal-Fired Utility Boilers: Volume 1, A Survey And Analysis of Utility Data: Final Report; EPRI: Palo Alto, CA, USA, 1987. [Google Scholar]
  12. Williams, A. Understanding slagging and fouling during PF combustion: Gordon Couch IEA Coal Research, London, 1994, pp. 109, ISBN 92-9029-240-7, £85. Fuel 1995, 74, 1541. [Google Scholar] [CrossRef]
  13. Peña, B.; Teruel, E.; Díez, L.I. Towards soot-blowing optimization in superheaters. Appl. Therm. Eng. 2013, 61, 737–746. [Google Scholar] [CrossRef]
  14. Pattanayak, L.; Ayyagari, S.P.K.; Sahu, J.N. Optimization of sootblowing frequency to improve boiler performance and reduce combustion pollution. Clean Technol. Environ. Policy 2015, 17, 1897–1906. [Google Scholar] [CrossRef]
  15. Macek, K.; Endel, P.; Cauchi, N.; Abate, A. Long-term predictive maintenance: A study of optimal cleaning of biomass boilers. Energy Build. 2017, 150, 111–117. [Google Scholar] [CrossRef]
  16. Hu, Z.; Matovic, D. Heat Flux Monitoring in Biomass-Fired Boilers: Possible Areas of Improvement. In Proceedings of the 4th IASTED International Conference on Environmental Management and Engineering, Banff, AB, Canada, 6–8 July 2009; pp. 33–38. [Google Scholar]
  17. Diez, L.; Cortes, C.; Campo, A. Modelling of pulverized coal boilers: Review and validation of on-line simulation techniques. Appl. Therm. Eng. 2005, 25, 1516–1533. [Google Scholar] [CrossRef]
  18. Zhang, S.; Shen, G.; An, L.; Li, G. Ash fouling monitoring based on acoustic pyrometry in boiler furnaces. Appl. Therm. Eng. 2015, 84, 74–81. [Google Scholar] [CrossRef]
  19. Teruel, E.; Cortés, C.; Díez, L.I.; Arauzo, I. Monitoring and prediction of fouling in coal-fired utility boilers using neural networks. Chem. Eng. Sci. 2005, 60, 5035–5048. [Google Scholar] [CrossRef]
  20. Peña, B.; Teruel, E.; Díez, L.I. Soft-computing models for soot-blowing optimization in coal-fired utility boilers. Appl. Soft Comput. 2011, 11, 1657–1668. [Google Scholar] [CrossRef]
  21. Jidong, L.; Liu, D.; Liu, G.; Kai, S. Research on fuzzy model for the soot blowing optimization in utility boilers. J. Huazhong Univ. Sci. Technol. 2005, 33, 35–37. [Google Scholar]
  22. Zheng, S.; Zeng, X.; Qi, C.; Zhou, H. Mathematical modeling and experimental validation of ash deposition in a pulverized-coal boiler. Appl. Therm. Eng. 2017, 110, 720–729. [Google Scholar] [CrossRef]
  23. Zheng, S.; Zeng, X.W.; Qi, C.B.; Zhou, H.C. Modeling of ash deposition in a pulverized-coal boiler by direct simulation Monte Carlo method. Fuel 2016, 184, 604–612. [Google Scholar] [CrossRef]
  24. Yan, W.; Chen, B.; Liang, X.; Xue, Y.E.; Wang, L.; Zhao, B. Investigation on Ash Monitoring Model for Rotary Air Heater in Utility Boiler. Power Eng. 2002, 22, 1708–1710. [Google Scholar]
  25. Chinese Utility Boiler Performance Test Code; GB10184-88; Chinese GB Standard: Shanghai, China, 1988.
Figure 1. The schematic diagram of the air preheater.
Energies 12 00958 g001
Figure 2. Schematic diagram of the monitoring model.
Energies 12 00958 g002
Figure 3. Air leakage rate measurement results.
Energies 12 00958 g003
Figure 4. Monitoring results of Cleanliness Factor (CF) curves in air preheater-A (APH-A) and air preheater-B (APH-B), with some examples of different operational conditions.
Energies 12 00958 g004
Figure 5. CF curves and fitting models in different cases: (a) LL, (b) HL, and (c) SB.
Energies 12 00958 g005
Figure 6. Schematic diagram of soot-blowing optimization.
Energies 12 00958 g006
Figure 7. Soot-blowing benefits.
Energies 12 00958 g007
Table 1. Boiler main operation values.
ParametersUnitsValue
BECRMW300
Coal mass flow ratekg/s35.4
Main steam mass flow ratet/h909.6
Superheated steam pressureMPa17.25
Superheated steam temperature°C540
Reheated steam flow ratet/h743.2
Reheated steam pressureMPa3.18
Reheated steam temperature°C540
Feed water temperature°C270
Total air flow ratekg/s295
BECR—Boiler Economic Continuous Rating.
Table 2. Coal analysis properties in case study power plant.
C a r / % A a r / % O a r / % H a r / % S a r / % N a r / % M a r / % Q d w / kJ / kg
58.0227.670.891.90.690.831020992
C a r —carbon content as received basis, A a r —ash content as received basis, O a r —oxygen content as received basis, H a r —hydrogen contend as received basis, S a r —sulfur content as received basis, N a r —nitrogen content as received basis, M a r —water content as received basis, Q d w —low heat value as received basis.
Table 3. Parameters of the functions in Figure 6.
APHParametersLLHLSB
f n ( t ) a x + b a exp ( d x ) ( a x + b ) ( c exp ( d x ) )
APH-Aa4.277 × 10−50.6881.374 × 109
b0.6785-0.01374
c--49.13
d-3.729 × 10−50.06832
APH-Ba3.436 × 10−50.63311.091 × 106
b0.6022-0.6366 × 10²
c--97.1
d-3.865 × 10−50.06467
Table 4. Optimum cycle time of the air preheaters (APHs).
APHS-B Losses
Q s b ,   kJ / min
S-B Time
t s ,   min
Optimal Time
t c ,   min
Soot-blowing Cycle
t b ,   min t c t b
APH-A2.04 × 105157661200−434
APH-B2.04 × 105157311200−469
Table 5. Optimum soot-blowing durations of the APHs.
APHS-B Losses
Q s b ,   kJ / min
S-B Time
t s ,   min
Optimal Soot-Blowing Durations
t op ,   min
Difference
t s t o p ,   min
APH-A2.04 × 1051519.9−4.9
APH-B2.04 × 1051520.4−5.4

