An Investigation of a Root Zone Heating System and Its Effects on the Morphology of Winter-Grown Green Peppers

 , , , and
Abstract
:1. Introduction
2. Materials and Methods
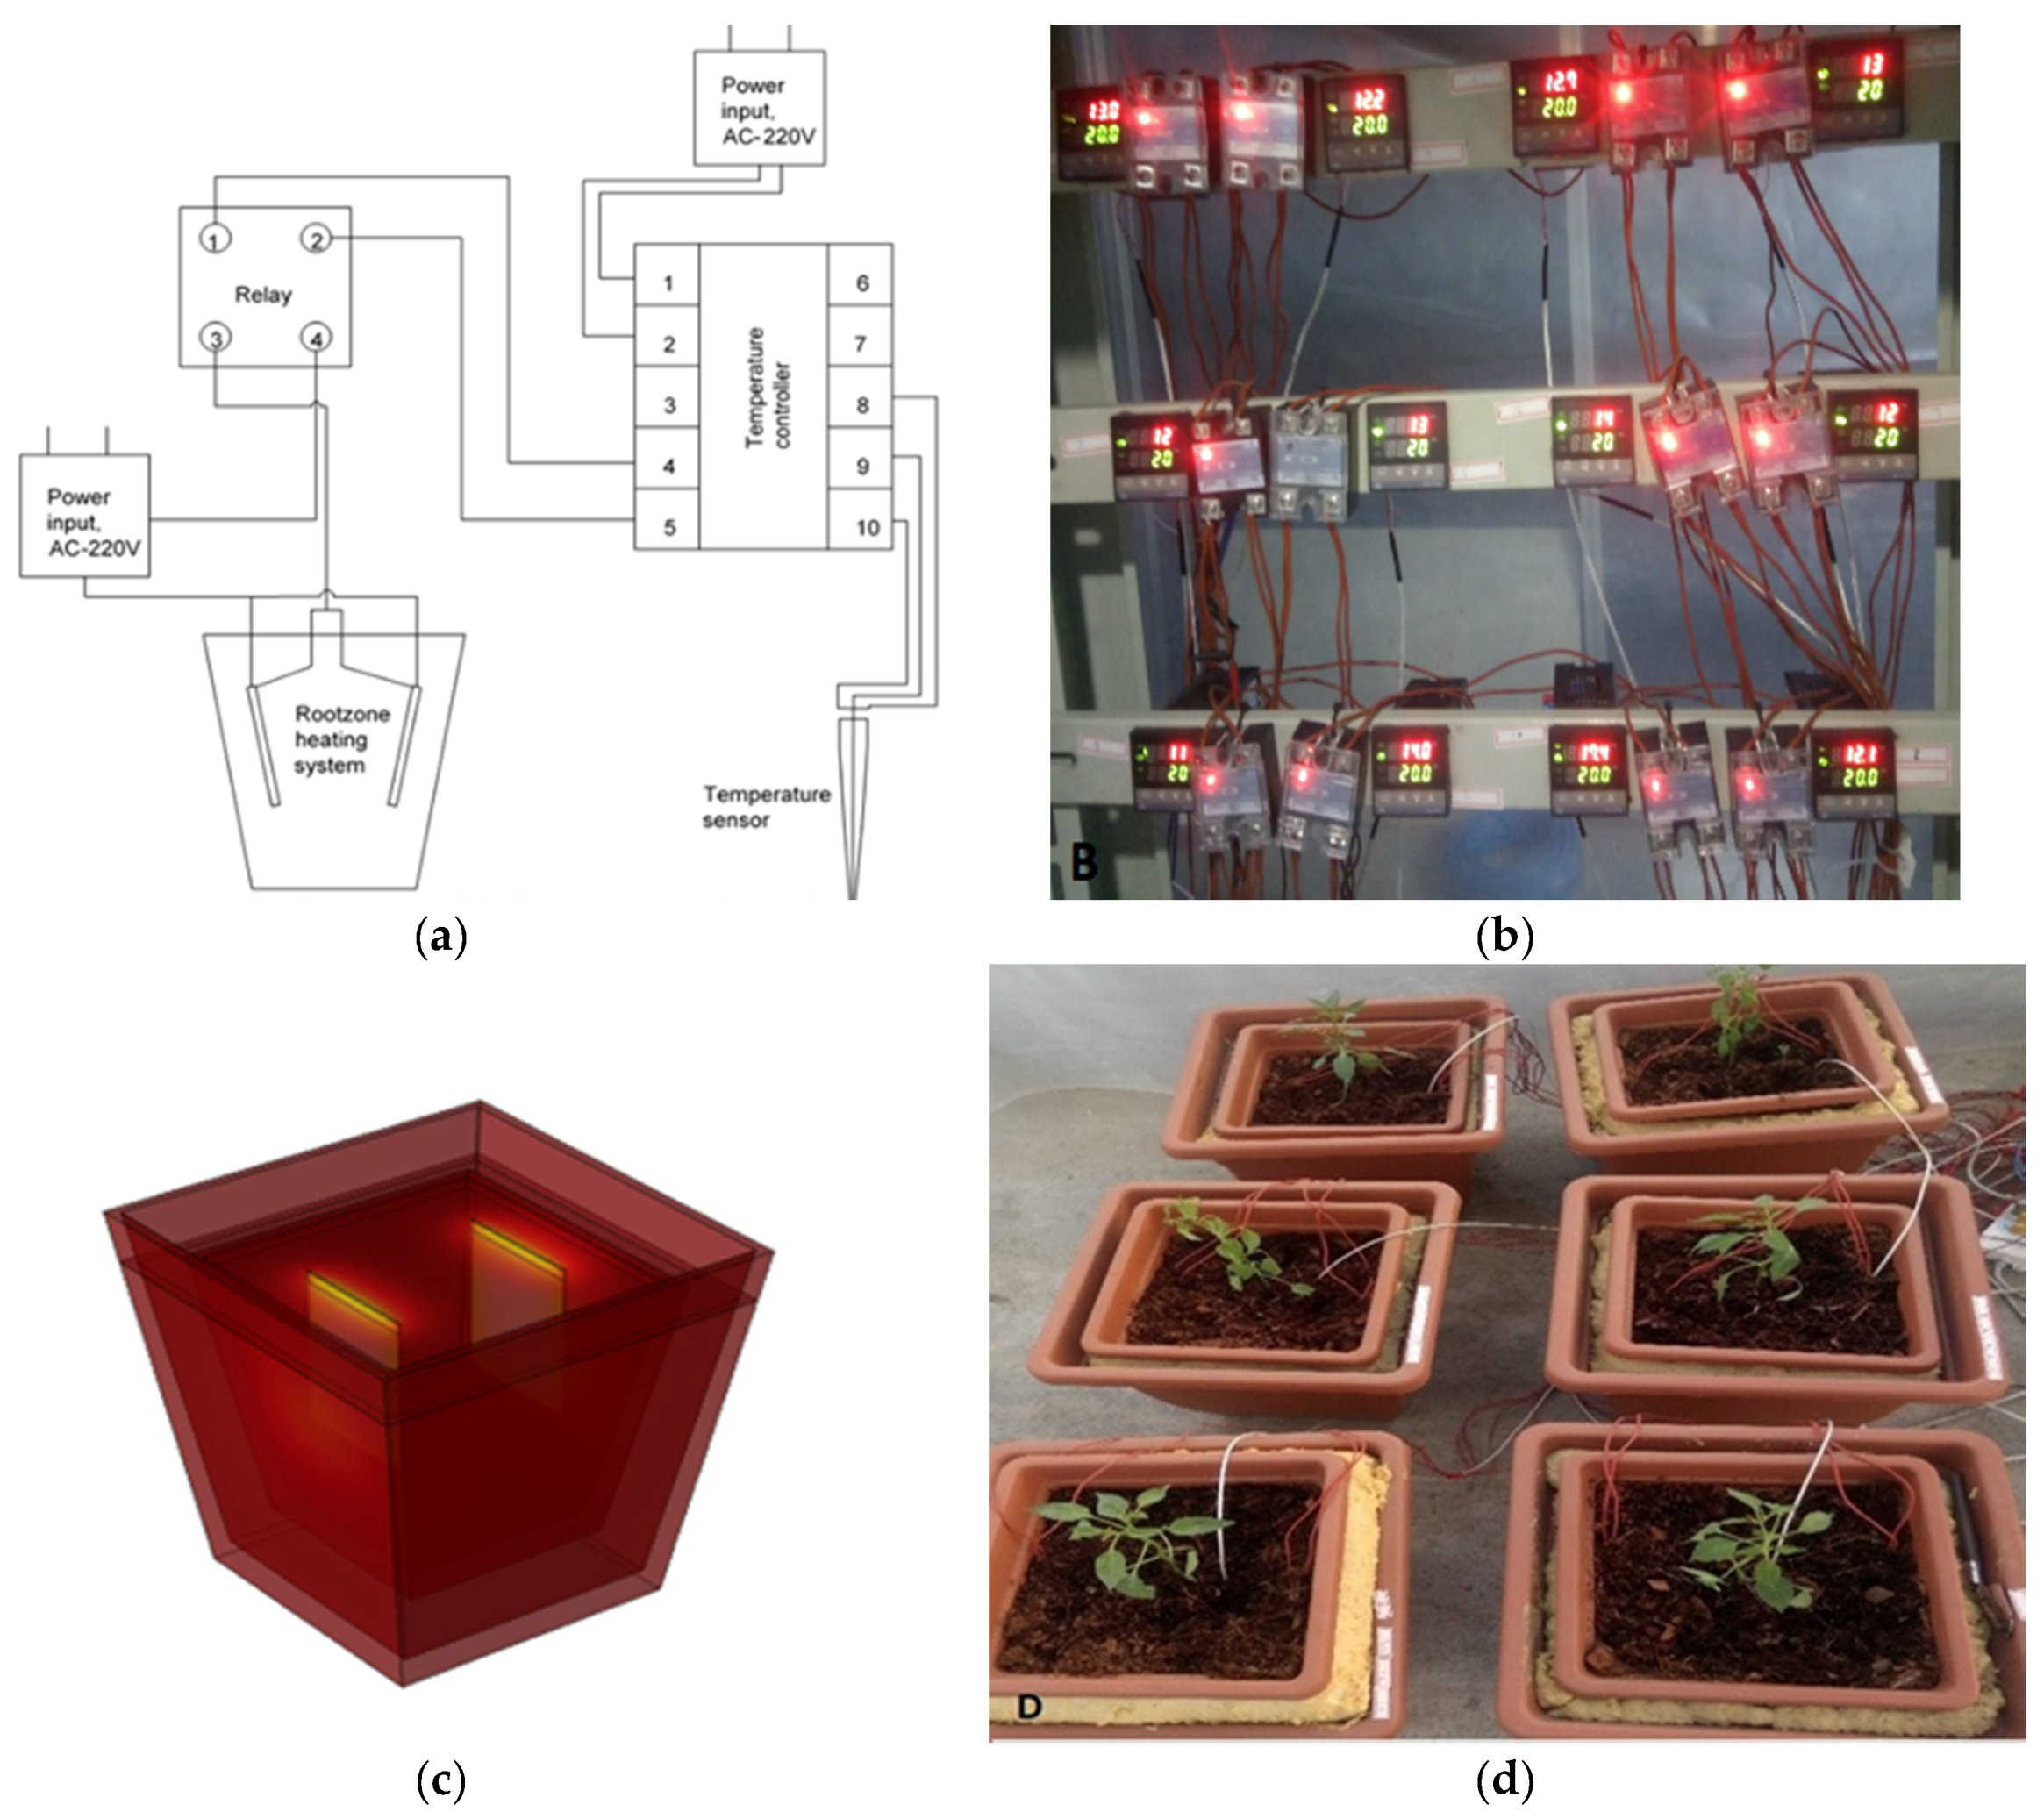
2.1. Experimental Setup
2.2. Plant Material and Growth Conditions
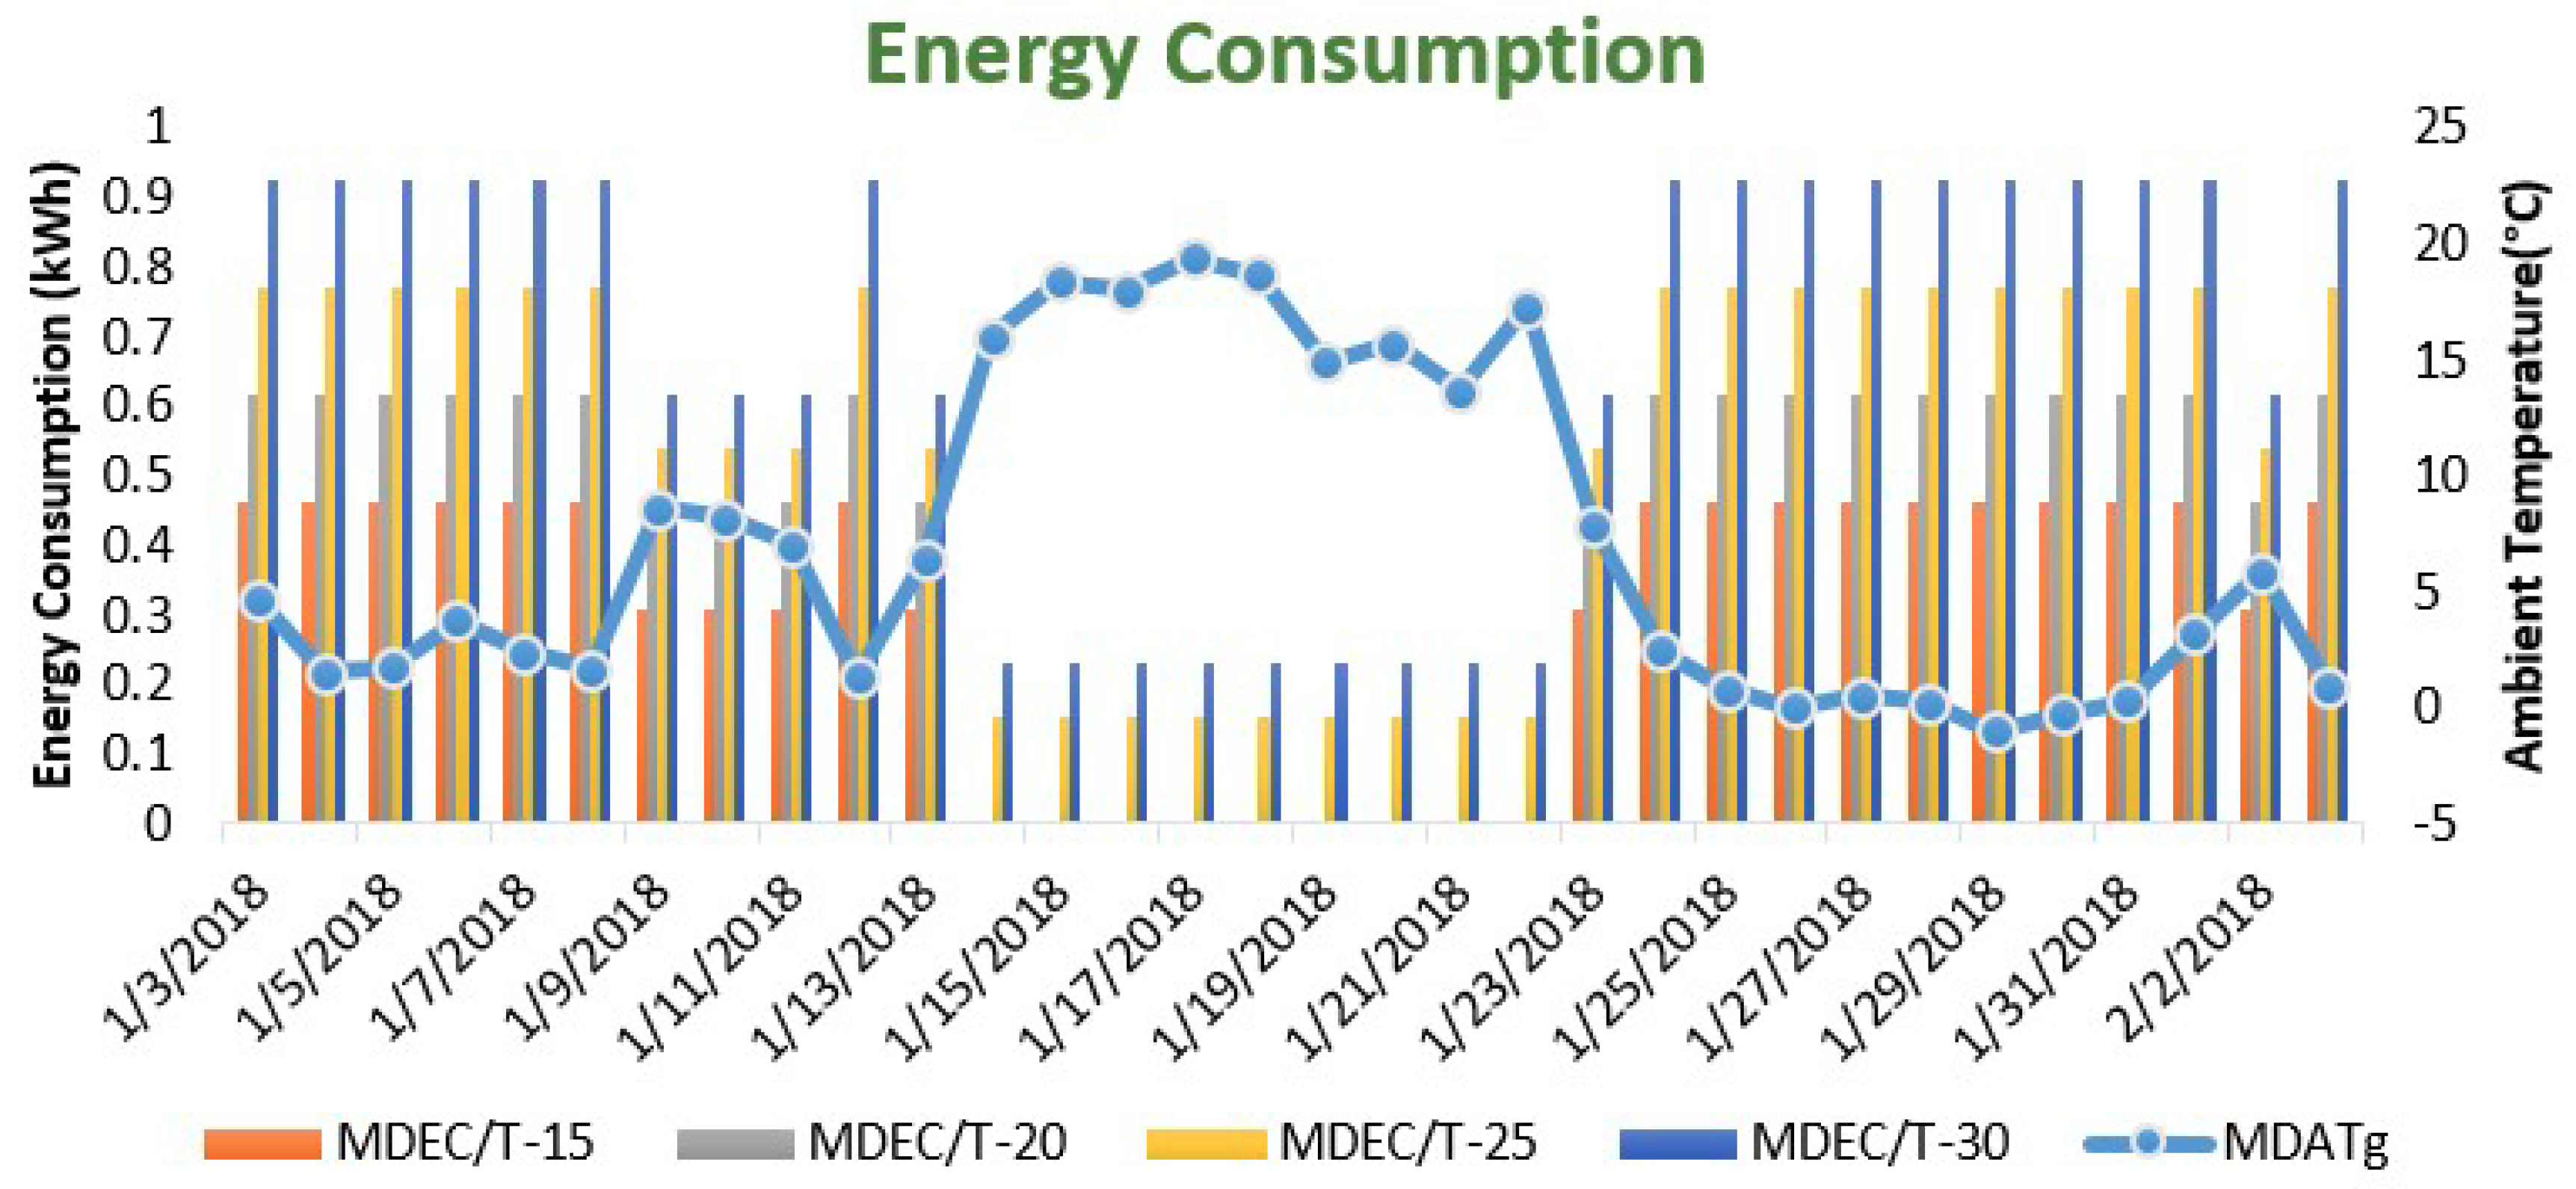
2.3. Energy Consumption
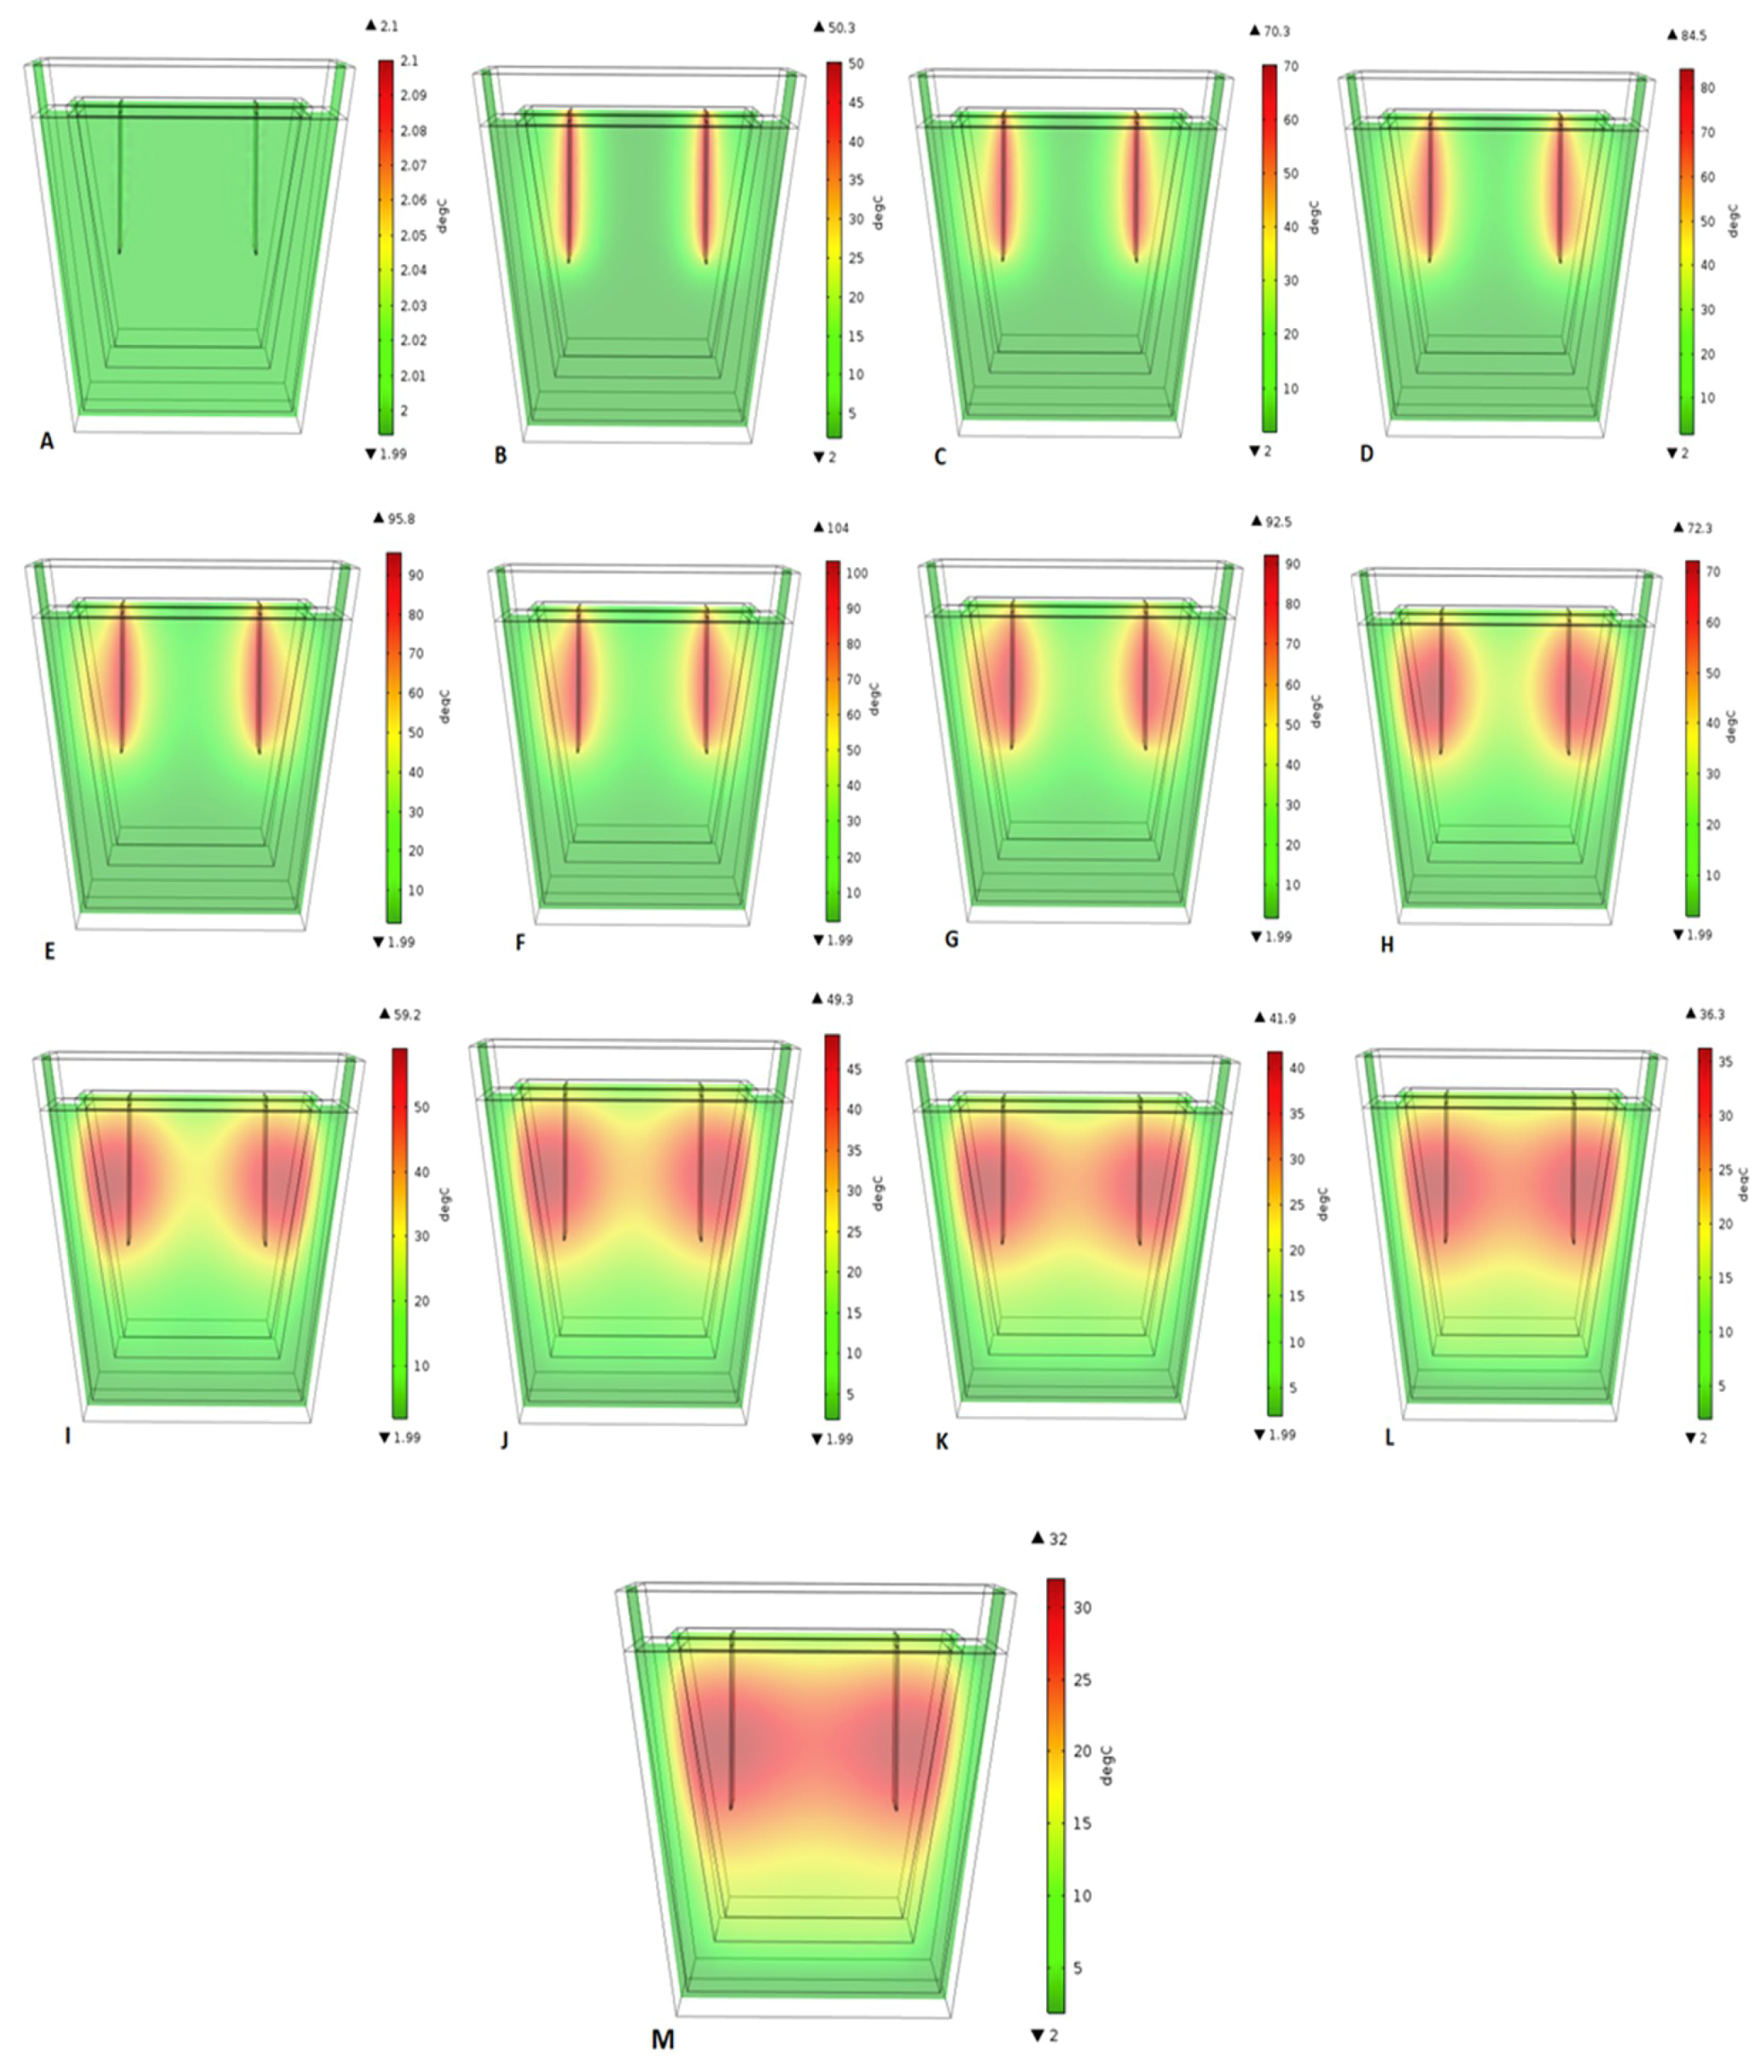
2.4. Simulation
2.5. Statistical Analysis
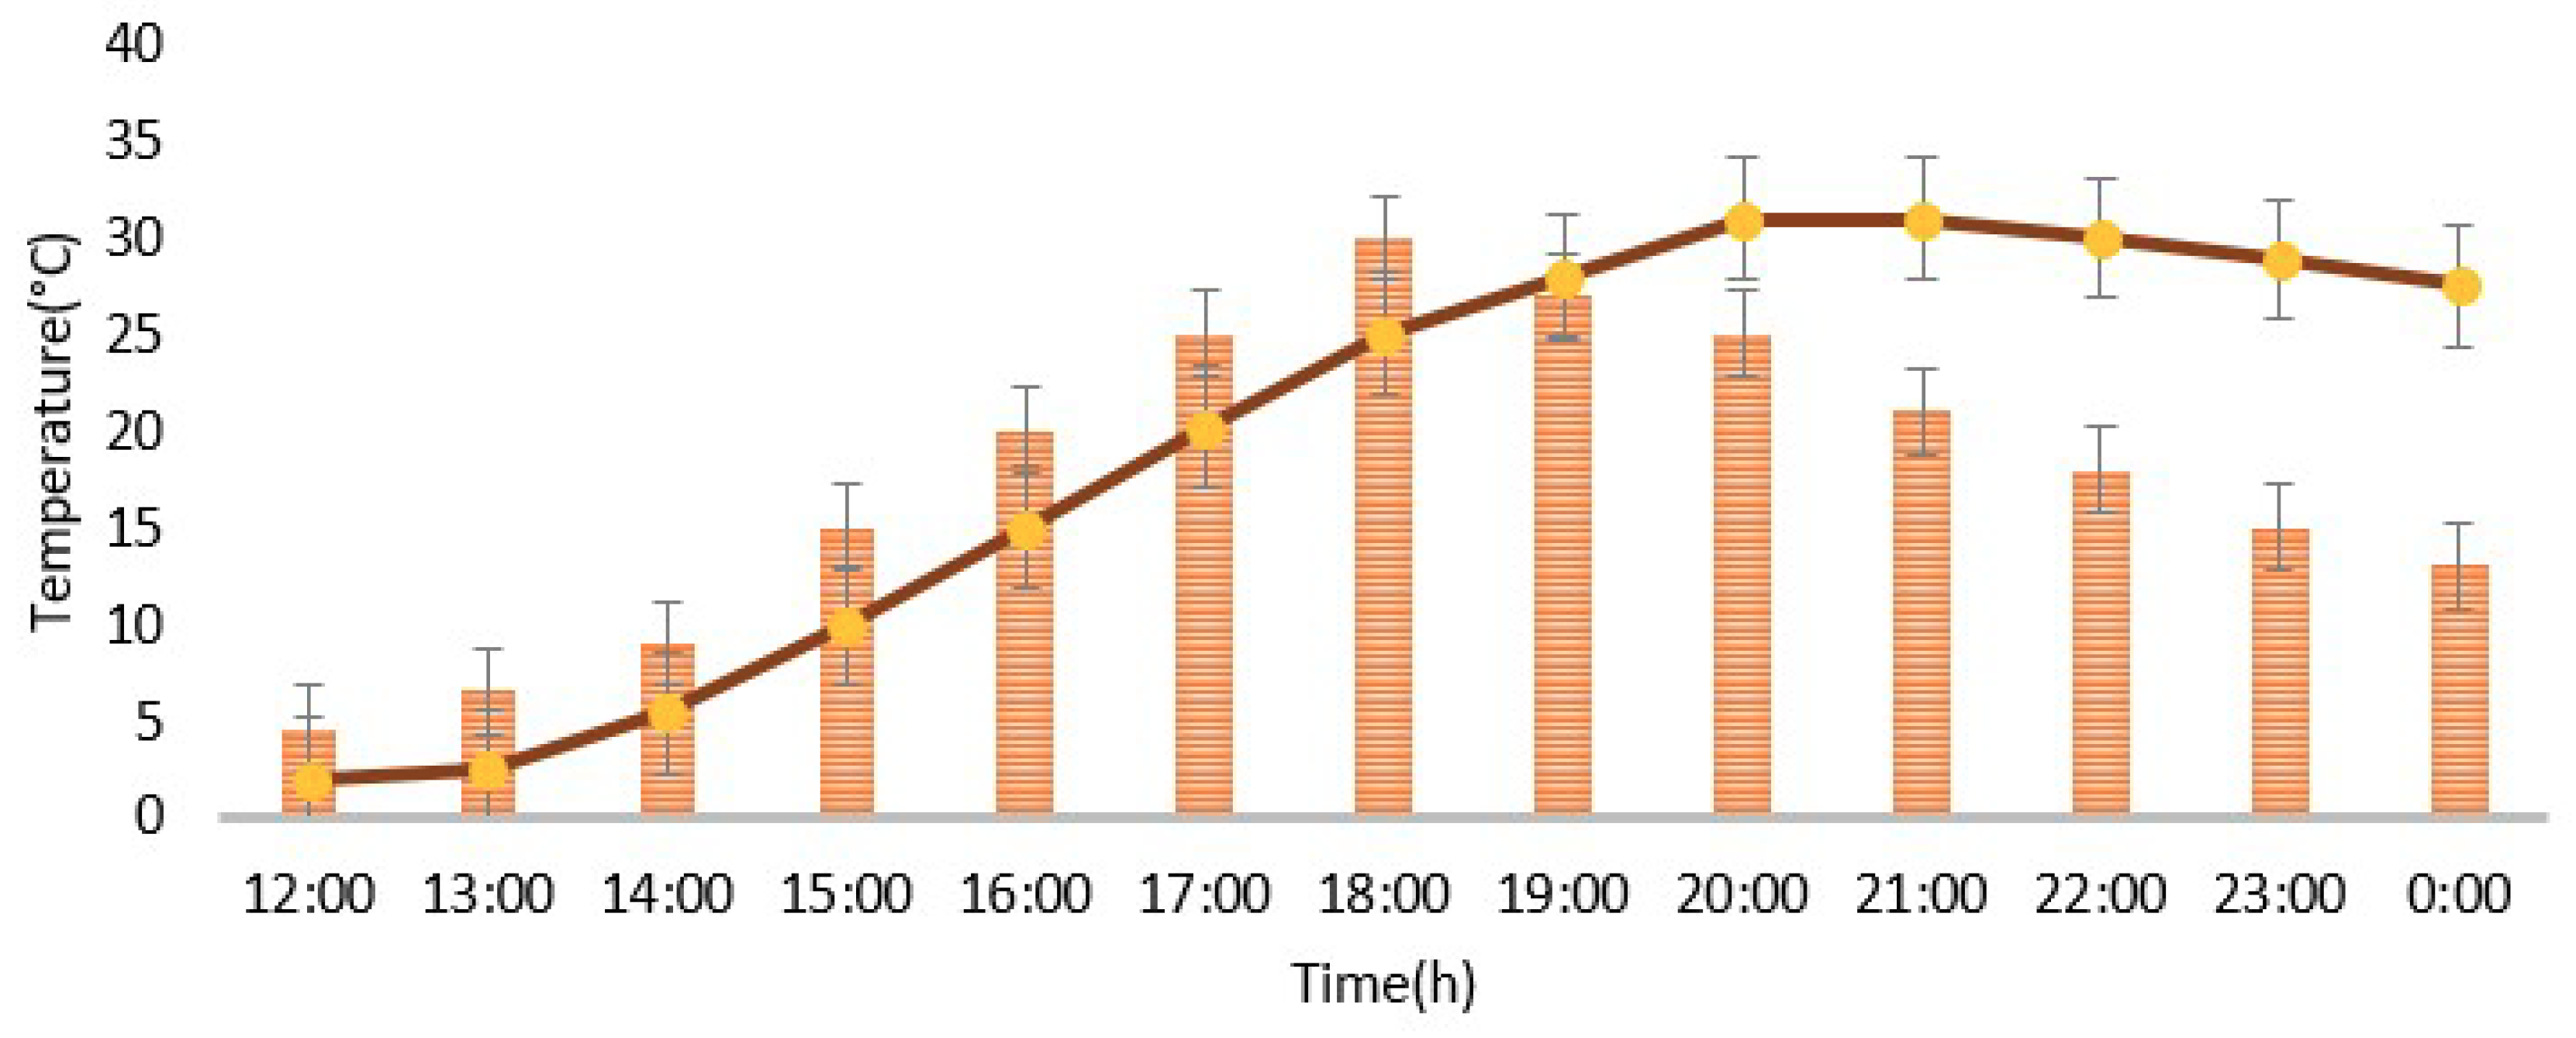
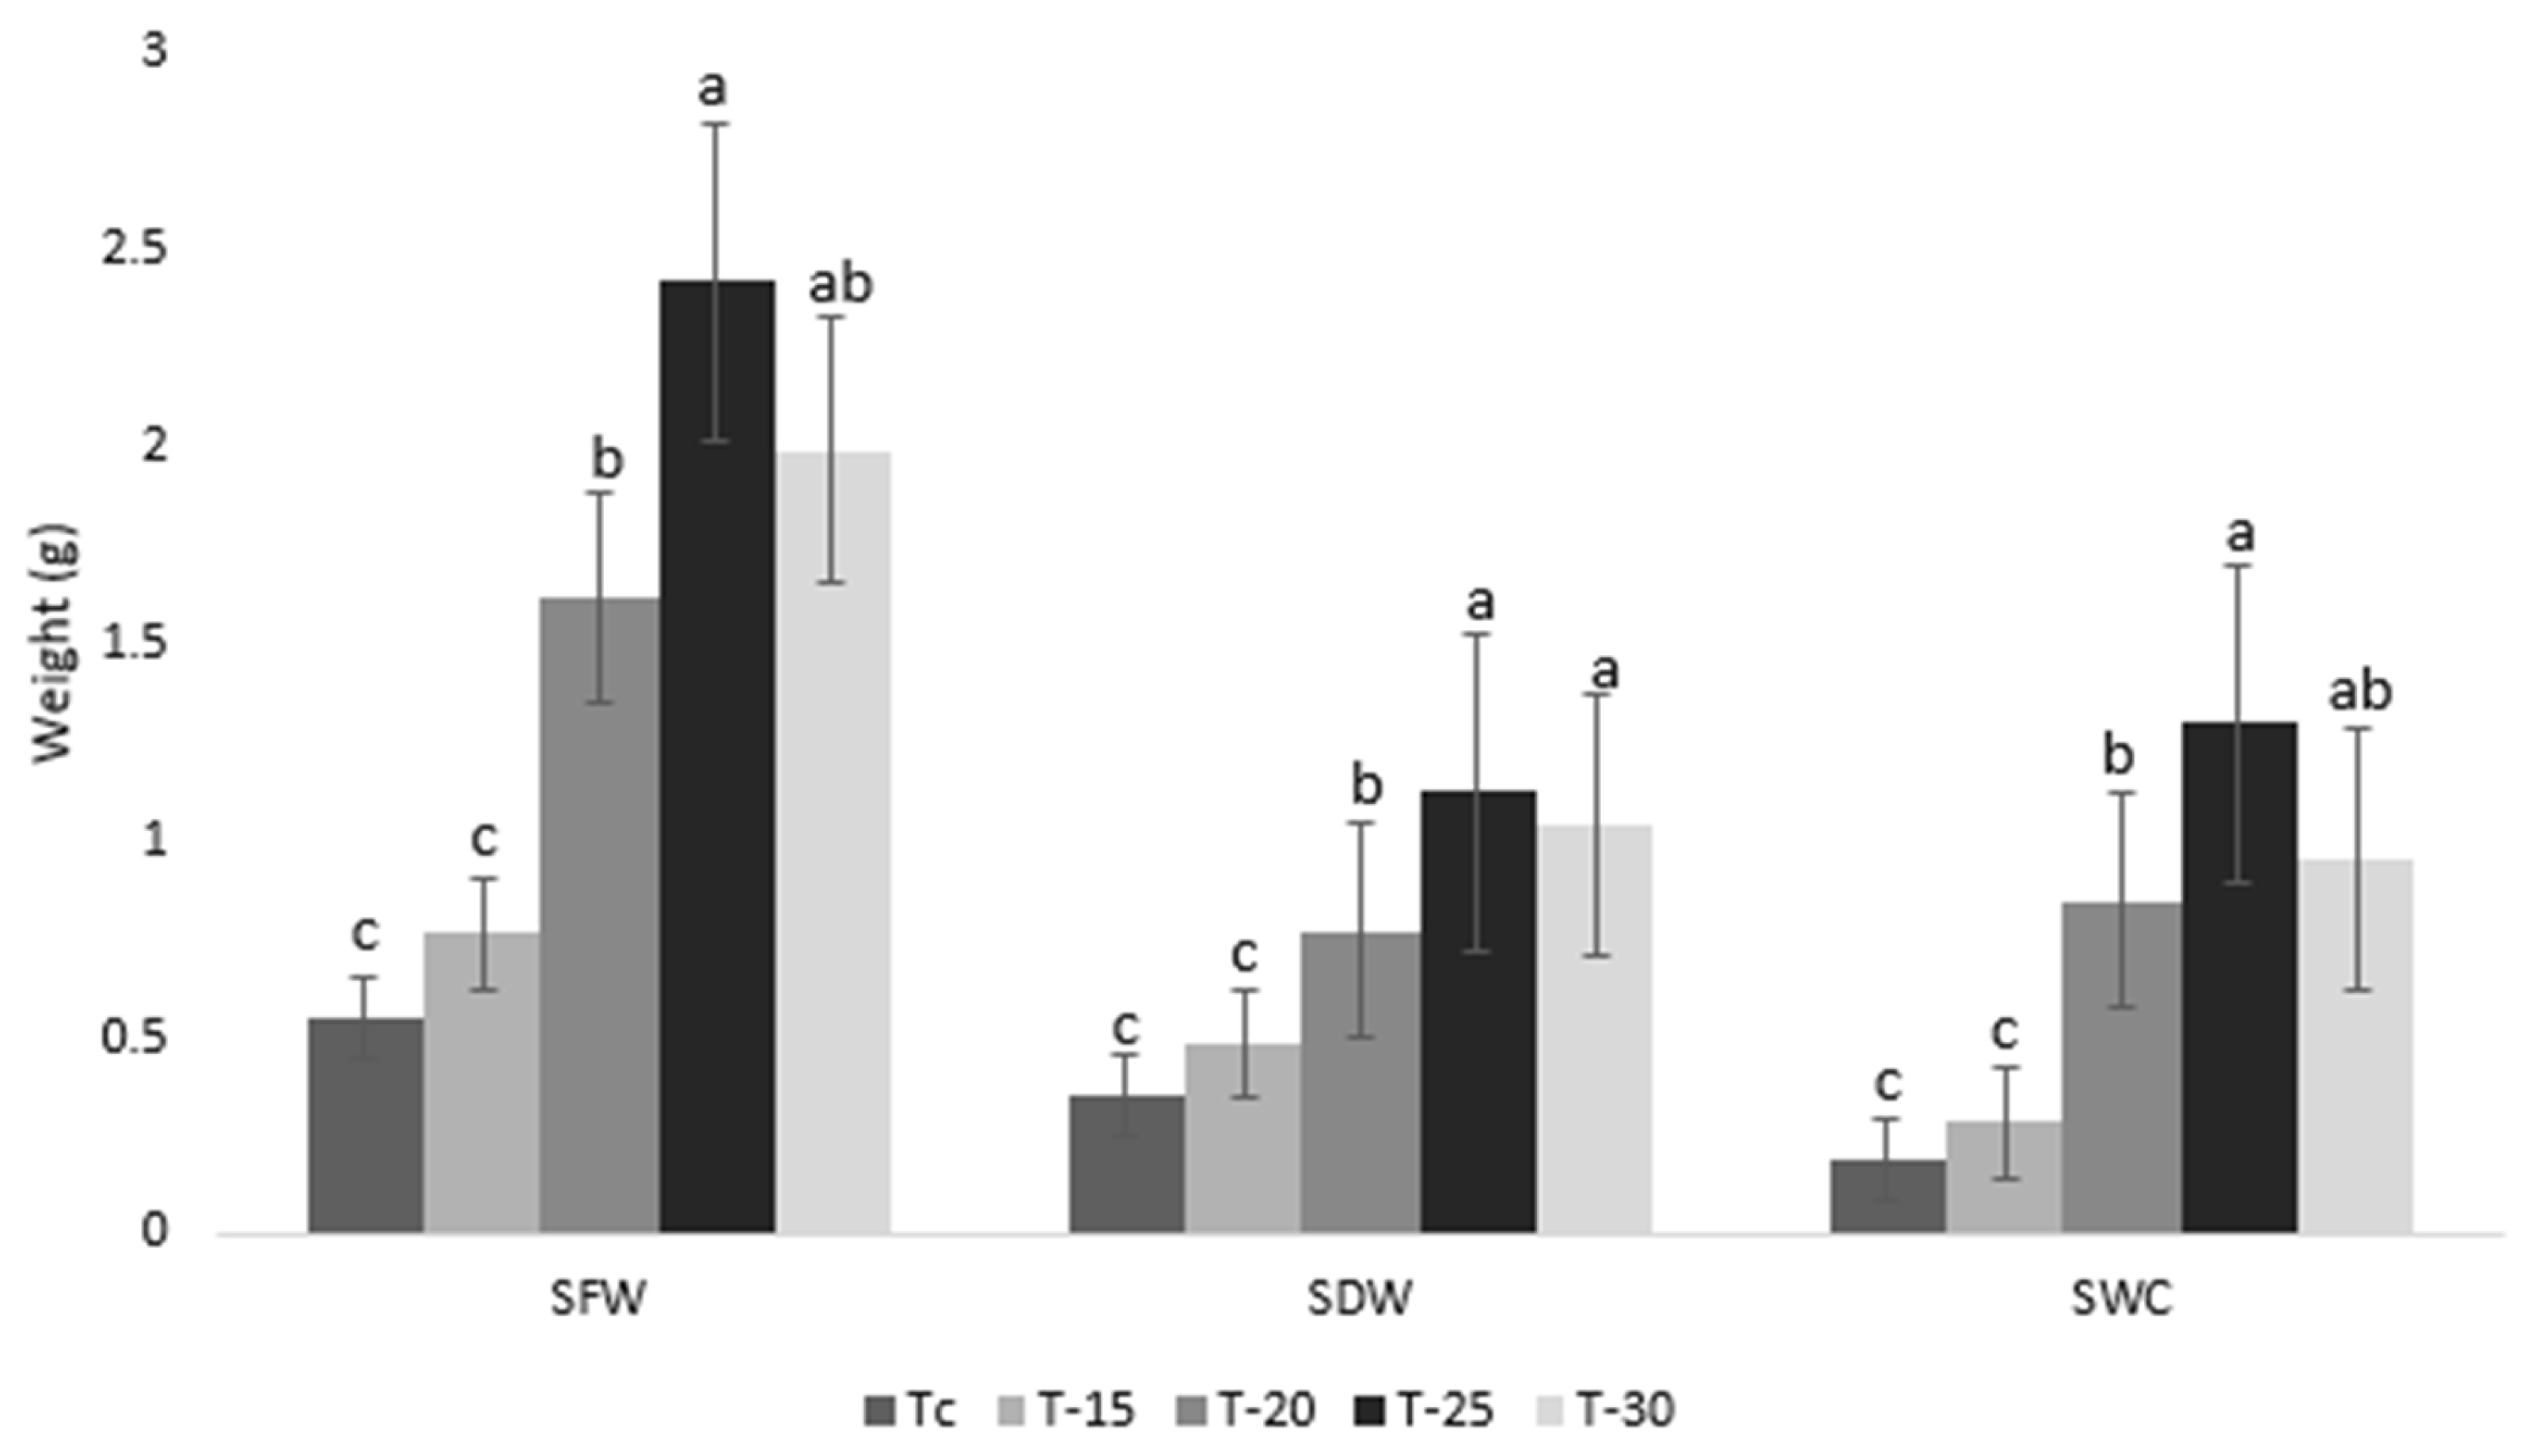
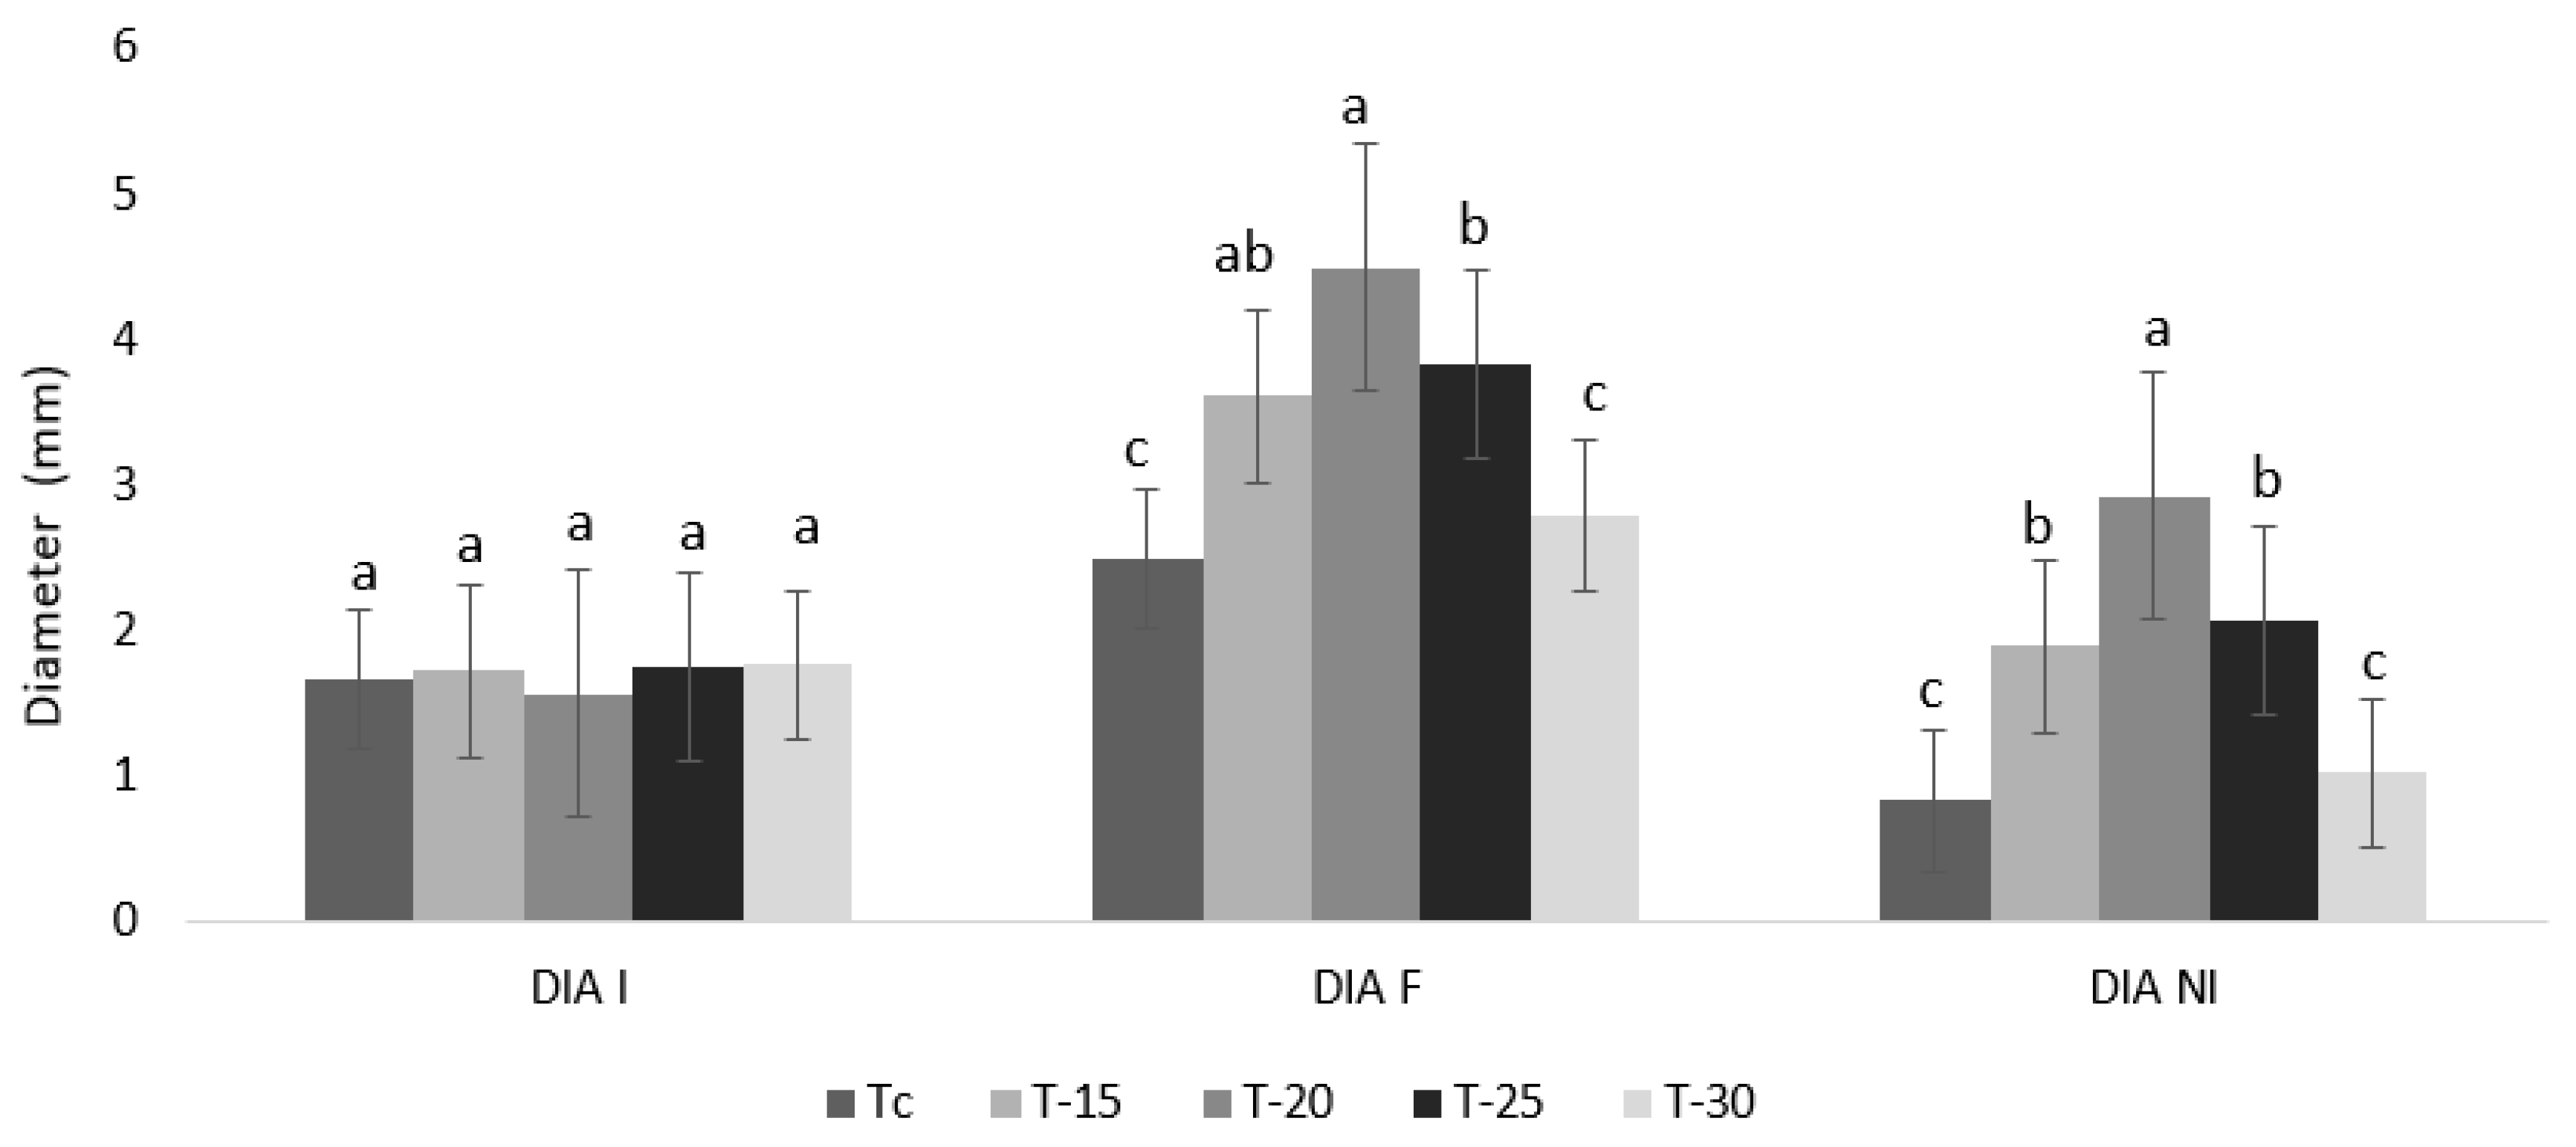
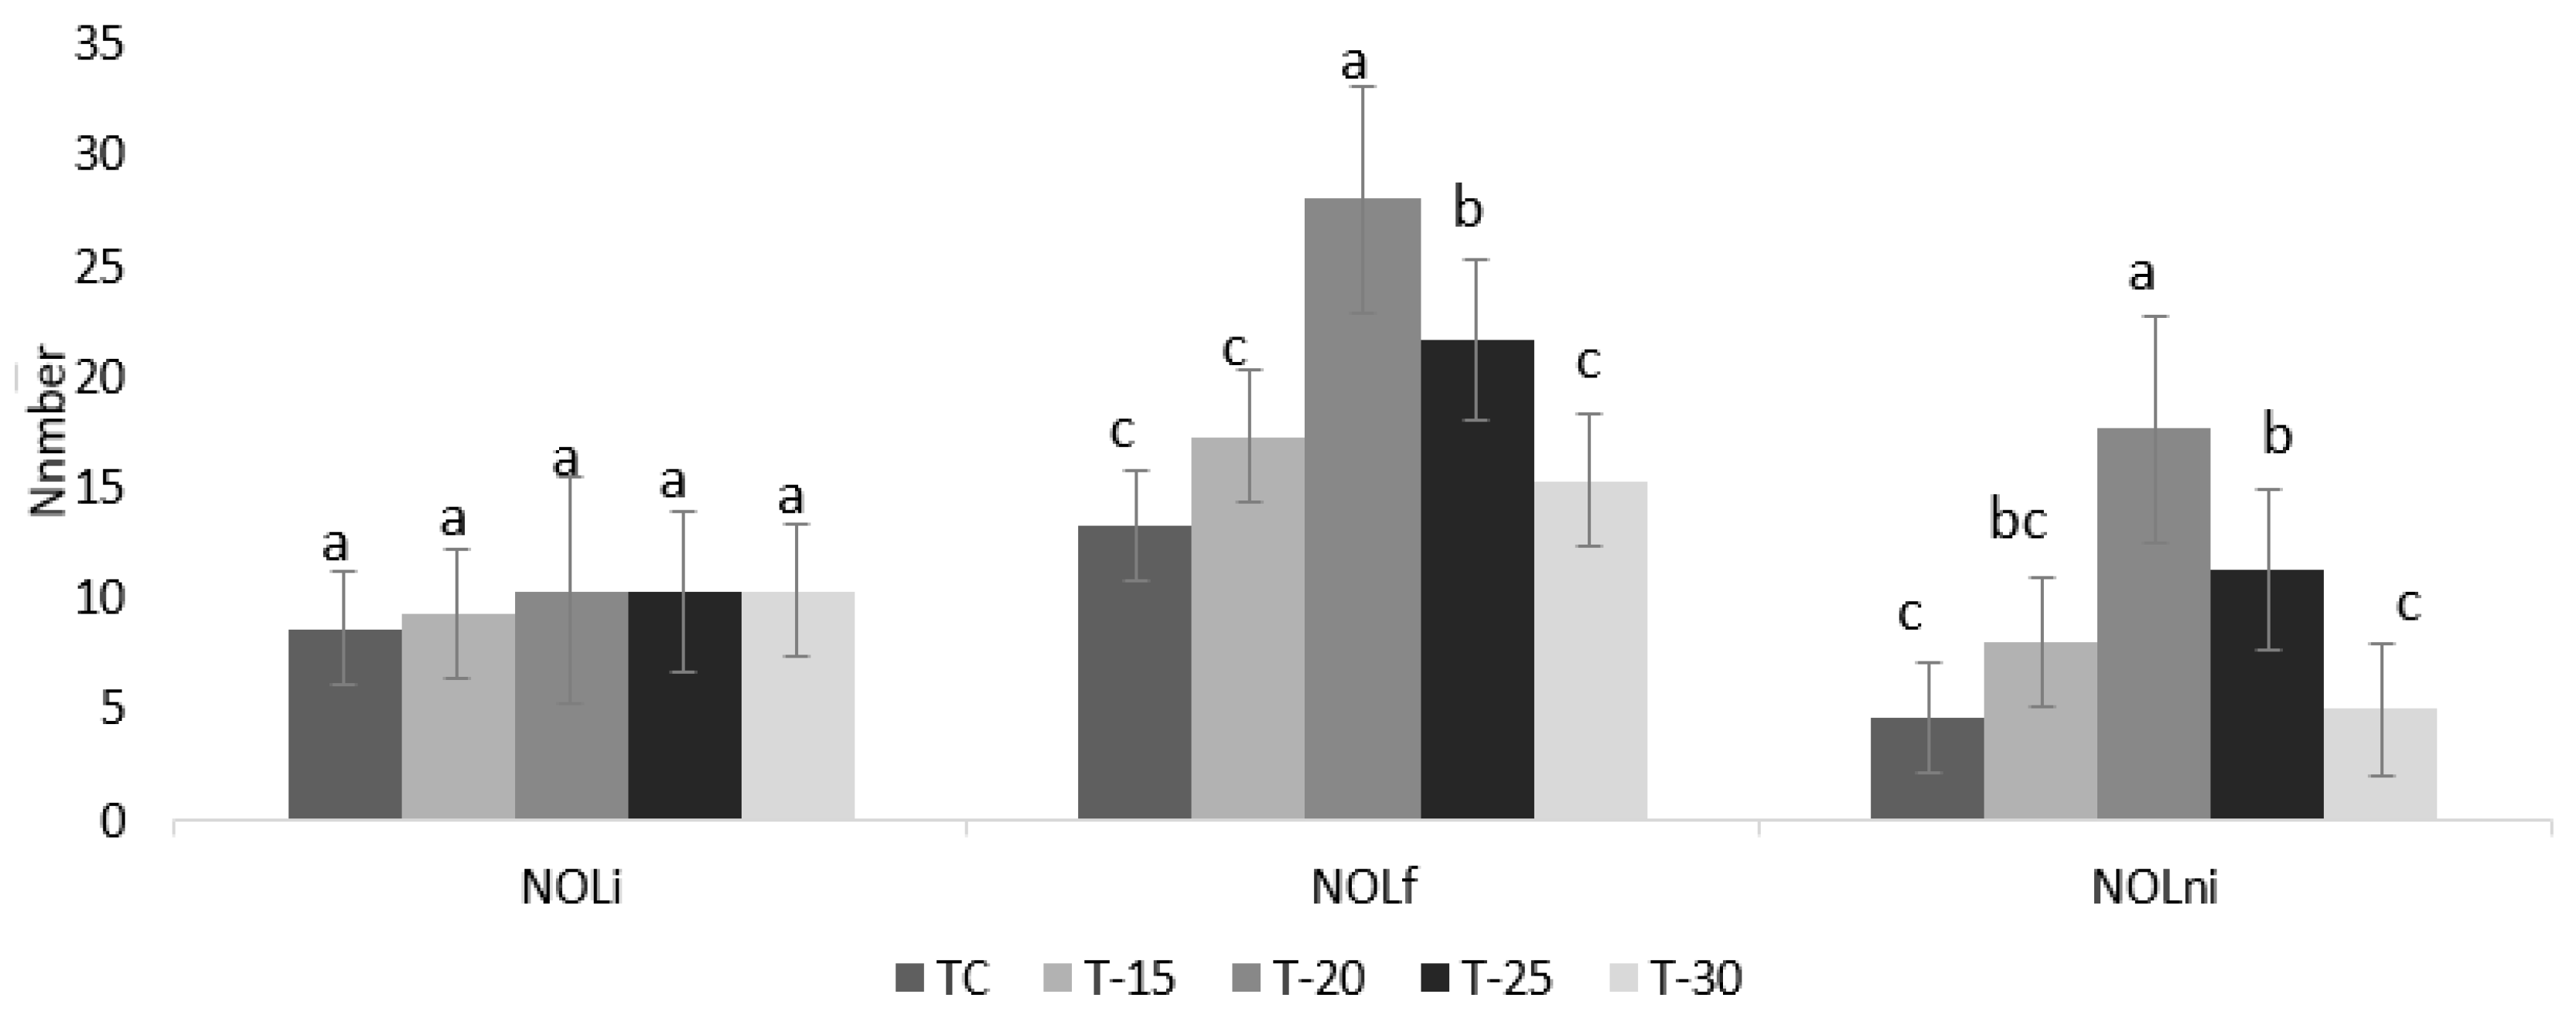
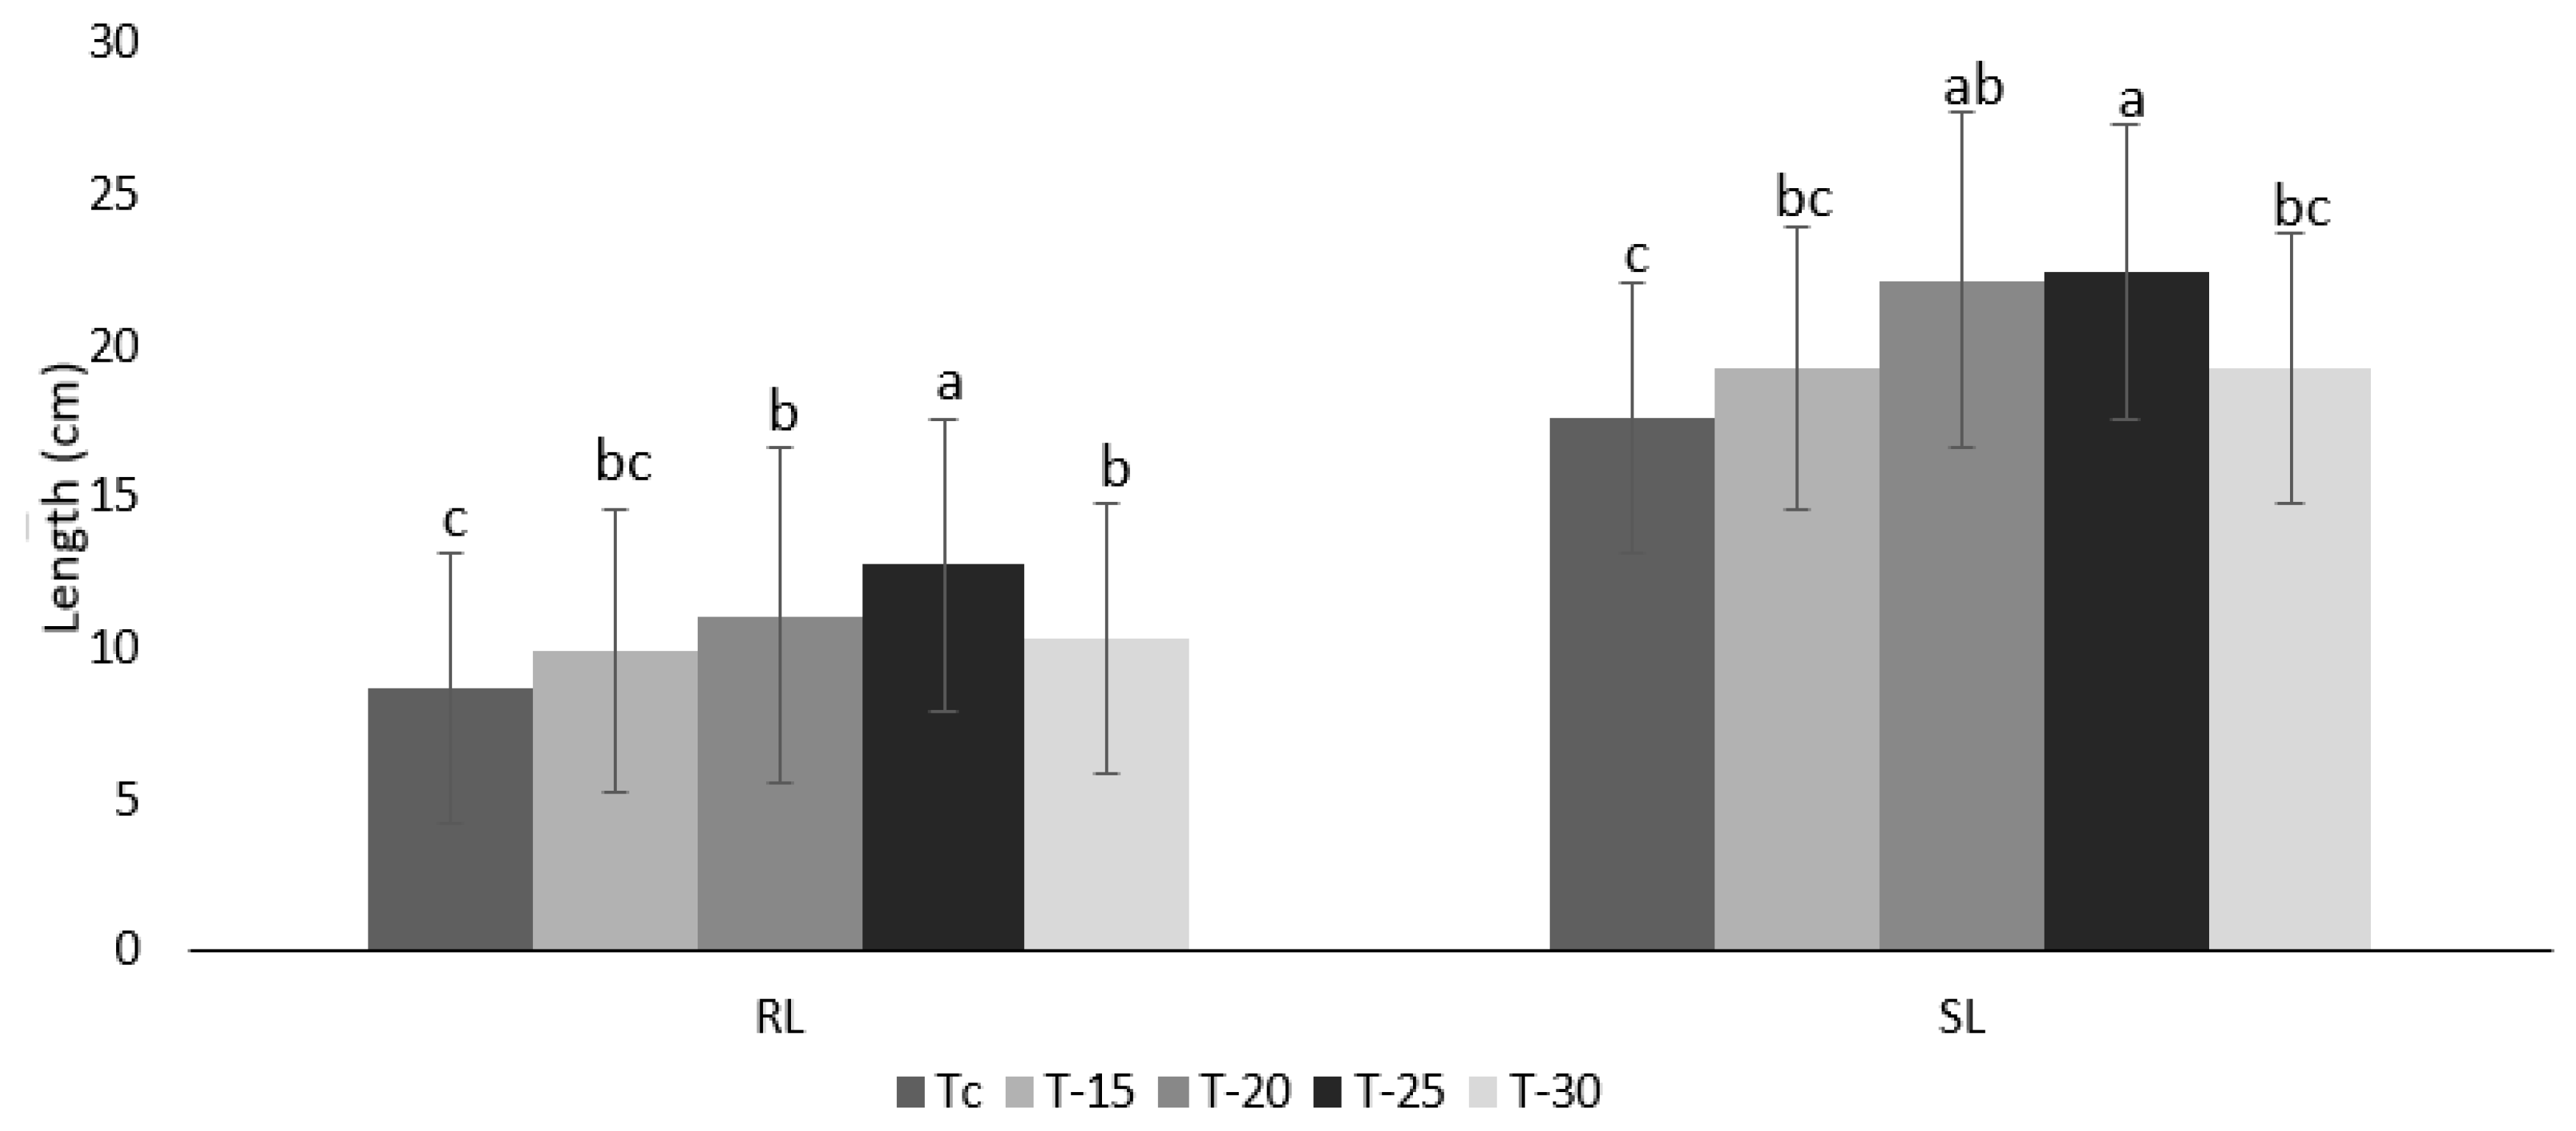
3. Results and Discussion
4. Conclusions
Author Contributions
Funding
Conflicts of Interest
References
- Gu, C.; Hu, L.; Zhang, X.; Wang, X.; Guo, J. Climate change and urbanization in the Yangtze River Delta. Habitat Int. 2011, 35, 544–552. [Google Scholar] [CrossRef]
- Li, X.; Lu, W.; Hu, G.; Wang, X.C.; Zhang, Y.; Sun, G.X.; Fang, Z. Effects of light-emitting diode supplementary lighting on the winter growth of greenhouse plants in the Yangtze River Delta of China. Bot. Stud. 2016, 57, 2. [Google Scholar] [CrossRef] [PubMed]
- Wu, C.C. The analysis and regionalization of climate for vegetable in protected cultivation in China. Agric. Sci. Technol. 2011, 2, 1–55. [Google Scholar]
- Rivas-San Vicente, M.; Plasencia, J. Salicylic acid beyond Defence: Its role in plant growth and development. J. Exp. Bot. 2011, 62, 3321–3338. [Google Scholar] [CrossRef] [PubMed]
- Pianta, C. Is Root Zone Heating Really Necessary? Maximum Yield: Nanaimo, BC, USA, 2012; pp. 152–158. Available online: https://www.maximumyield.com/is-root-zone-heating-really-necessary-part-one-the-basics/2/922 (accessed on 18 April 2018).
- Rosenthal, E. Root Zone Temperature. 2002. Available online: http://www.pot.tv/articles/2565.html (accessed on 12 June 2018).
- Bodnaruk, W.H., Jr.; Mills, T.W.; Ingram, D.L. Response of four foliage plants to heated soil and reduced air temperatures. Proc. Fla. State Hort. Soc. 1981, 94, 104–107. [Google Scholar]
- Ameen, M.; Xiaochan, W.; Yaseen, M.; Umair, M.; Yousaf, K.; Yang, Z.; Soomro, S.A. Performance Evaluation of Root Zone Heating System Developed with Sustainable Materials for Application in Low Temperatures. Sustainability 2018, 10, 4130. [Google Scholar] [CrossRef]
- Richards, S.J.; Hagan, R.M.; McCalla, T.M. Soil Temperature and Plant Growth. In Soil Physical Conditions and Plant Growth; Shaw, B.T., Ed.; Academic Press: New York, NY, USA, 1952. [Google Scholar]
- Jenkins, B.M.; Sachs, P.M.; Forister, G.W.; Sisto, I. Thermal Response of Greenhouses Under Bench and Perimeter Heating; ASAE Paper No.89-4038; ASAE: St. Joseph, MI, USA, 1989. [Google Scholar]
- Sachs, R.M. Plant response and energy savings for bench-top heated green houses. Sci. Hortic. 1992, 49, 135–146. [Google Scholar] [CrossRef]
- Christenbury, G.D. Energy Management with Root-Zone Heating; Miscellaneous Publication #295; University of Georgia: Athens, GA, USA, 1990; pp. 1–2. [Google Scholar]
- Lee, S.K.; Cheong, S.C. Inducing head formation of iceberg lettuce (Lactuca sativa L.) in the tropics through root-zone temperature control. Trop. Agric. 1996, 73, 34–42. [Google Scholar]
- He, J.; Lee, S.K. Growth and photosynthetic characteristics of lettuce (Lactuca sativa L.) under fluctuating hot ambient temperatures with the manipulation of cool root-zone temperature. J. Plant Physiol. 1998, 152, 387–391. [Google Scholar]
- Cooper, A.J. Root Temperature and Plant Growth; Commonwealth Agriculture Bureaux: Farnham Royal, UK, 1973. [Google Scholar]
- Hagan, R.M. Temperature and Growth Processes. In Soil Physical Conditions and Plant Growth; Shaw, B.T., Ed.; Academic Press Inc.: New York, NY, USA, 1952; pp. 336–366. [Google Scholar]
- Miller, D.E. Root systems in relation to stress tolerance. HortScience 1986, 21, 963–970. [Google Scholar]
- Nielsen, K.F. Roots and Root Temperature. In The Plant Root and Its Environment; Carson, E.W., Ed.; University Press of Virginia: Charlottesville, VA, USA, 1974; pp. 293–333. [Google Scholar]
- Gossellin, A.; Trudel, M.J. Root-zone temperature effects on pepper. J. Am. Soc. Hortic. Sci. 1986, 111, 220–224. [Google Scholar]
- Mercado, J.A.; Reid, M.S.; Valpuesta, V.; Quesada, M.A. Metabolic changes and susceptibility to chilling stress in Capsicum annuum plants grown at suboptimal temperature. Aust. J. Plant Physiol. 1997, 24, 759–767. [Google Scholar] [CrossRef]
- Yousaf, K.; Abbas, A.; Xuejing, Z.; Shakeel, A.S.; Muhammad, A.; Chen, K. Effect of multi-stage drying on energy consumption, the rate of drying, rice quality and its optimization during parboiling process. Fresenius Env. Bull. 2018, 27, 8270–8279. [Google Scholar]
- Yousaf, K.; Chen, K.; Chen, C.; Adnan, A.; Huang, Y.; Chaudhry, A.; Zhang, X. The optimization and mathematical modeling of quality attributes of parboiled rice using a response surface method. J. Food Qual. 2017, 2017, 5960743. [Google Scholar] [CrossRef]
- Bear, J.; Bachmat, Y. Introduction to Modeling of Transport Phenomena in Porous Media, 1st ed.; Springer: Dordrecht, The Netherlands, 1990; ISBN 978-0-7923-1106-5. [Google Scholar]
- Minkowycz, W.J.; Haji-Sheikh, A.; Vafai, K. On departure from local thermal equilibrium in porous media due to a rapidly changing heat source: The Sparrow number. Int. J. Heat Mass Transf. 1999, 42, 3373–3385. [Google Scholar] [CrossRef]
- Amiri, A.; Vafai, K. Transient analysis of incompressible flow through a packed bed. Int. J. Heat Mass Transf. 1998, 41, 4259–4279. [Google Scholar] [CrossRef]
- Carbonell, R.G.; Whitaker, S. Heat and Mass Transfer in Porous Media BT. In Fundamentals of Transport Phenomena in Porous Media; Bear, J., Corapcioglu, M.Y., Eds.; Springer: Dordrecht, The Netherlands, 1984; pp. 121–198. ISBN 978-94-009-6175-3. [Google Scholar]
- Glass, A.D.M.; Siddiqi, M.Y. Nitrate inhibition of chloride influx in barley: Implications for a proposed chloride homestat. J. Exp. Bot. 1985, 36, 556–566. [Google Scholar] [CrossRef]
- Breteler, H.; Nissen, P. Effect of exogenous and endogenous nitrate concentration on nitrate utilization by dwarf bean. Plant Physiol. 1982, 70, 754–759. [Google Scholar] [CrossRef] [PubMed]
- Epstein, E. Mechanisms of ion transport through plant cell membranes. Int. Rev. Cytol. 1973, 34, 123–168. [Google Scholar]
- Fujishige, N.; Sugiyama, T. Effect of soil temperature on growth of seedlings of a few fruit vegetables. Preliminary report. J. Jpn. Soc. Sci. 1968, 37, 221–226. [Google Scholar] [CrossRef]
- Jones, D.A.G.; Sandwell, I.; Talent, C.J.W. The Effect of soil temperature when associated with low air temperatures on cropping of early tomatoes. Acta Hortic. 1978, 76, 167–171. [Google Scholar] [CrossRef]
- Sandwell, I. Warm rooted tomatoes crop satisfactorily at 5 °C. Grower 1977, 88, 605. [Google Scholar]
- Gosselin, A.; Trudel, M. Interactions between air and root temperatures in greenhouse tomatoes: Growth, Development, and yield. Am. Soc. Hortic. Sci. 1983, 108, 901–905. [Google Scholar]
- Ryyppo, A.; Iivonen, S.; Rikala, R.; Sutinen, M.L.; Vapaavuori, E. Responses of scots pine seedlings to low root zone temperature in spring. Physiol. Plant. 1998, 102, 503–512. [Google Scholar] [CrossRef]
- Rouphael, Y.; Colla, G.; Battistelli, A.; Moscatello, S.; Proietti, S.; Rea, E. Yield, water requirement, nutrient uptake and fruit quality of zucchini squash grown in soil and closed soilless culture. J. Hortic. Sci. Biotechnol. 2004, 79, 423–430. [Google Scholar] [CrossRef]
- Maboko, M.M.; Plooy CP, D.; Bertling, I.; Rodríguez-Delfín, A.; Martínez, P.F. Comparative performance of tomato on soilless vs in-soil production systems. Acta Hortic. 2009, 843, 319–326. [Google Scholar] [CrossRef]
- Dalla Costa, L.; Tomasi, N.; Gottardi, S. The effect of growth medium temperature on corn salad (Valerianella locusta (L.) Laterr) baby leaf yield and quality. HortScience 2011, 46, 1619–1625. [Google Scholar] [CrossRef]
- Chu, C.B.; Toop, E.W. Effects of substrate potassium, substrate temperature and light intensity on growth and uptake of major cations by greenhouse tomato plants. Can. J. Plant. Sci. 1975, 55, 121–126. [Google Scholar] [CrossRef]
- Díaz-Pérez, J.C.; Gitaitis, R.; Mandal, B. Effects of plastic mulches on root zone temperature and on the manifestation of tomato spotted wilt symptoms and yield of tomato. Sci. Hortic. 2007, 114, 90–95. [Google Scholar] [CrossRef]
- Nxawe, S.; Laubscher, C.P.; Ndakidemi, P.A. Effect of regulated irrigation water temperature on hydroponics production of spinach (Spinacia oleracea L.). Afr. J. Agric. Res. 2009, 4, 1442–1446. [Google Scholar]
- Bravo, F.P.; Uribe, E.G. Temperature dependence of the concentration kinetics of absorption of phosphate and potassium in corn roots. Plant Physiol. 1981, 67, 815–819. [Google Scholar] [CrossRef]
- Dodd, I.C.; He, J.; Turnbull, C.G.; Lee, S.K.; Critchley, C. The influence of supra-optimal root-zone temperature on growth and stomatal conductance in Capsicum annuum L. J. Exp. Bot. 2000, 51, 239–248. [Google Scholar] [CrossRef] [PubMed]


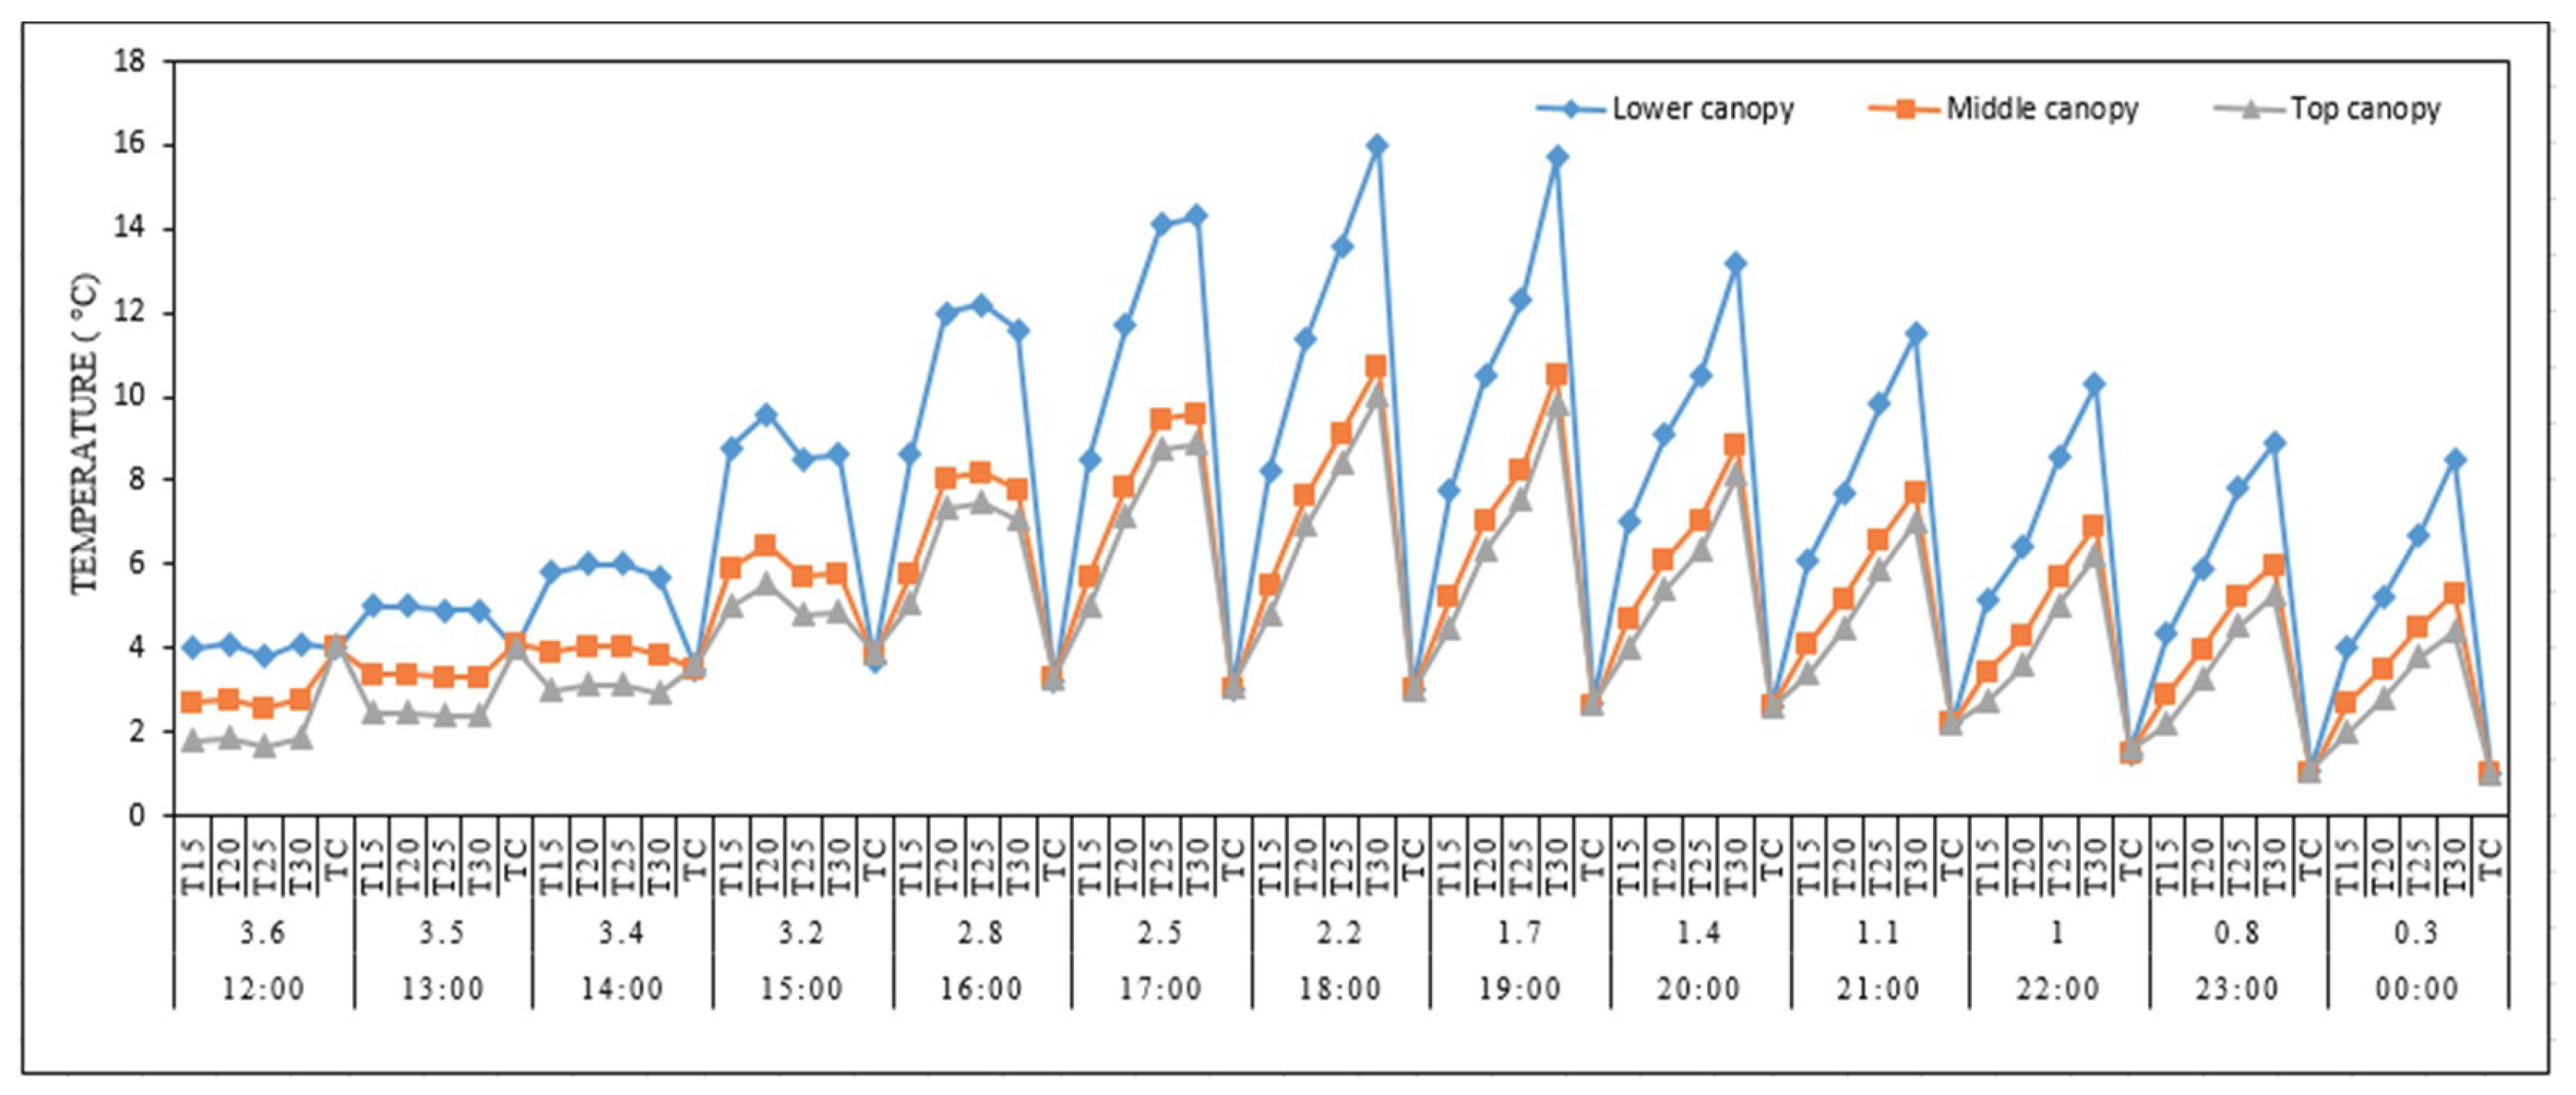
| Time | Root Zone Temperature (°C) | ||||
|---|---|---|---|---|---|
| Non-Heated | Heated | ||||
| TC | T-15 | T-20 | T-25 | T-30 | |
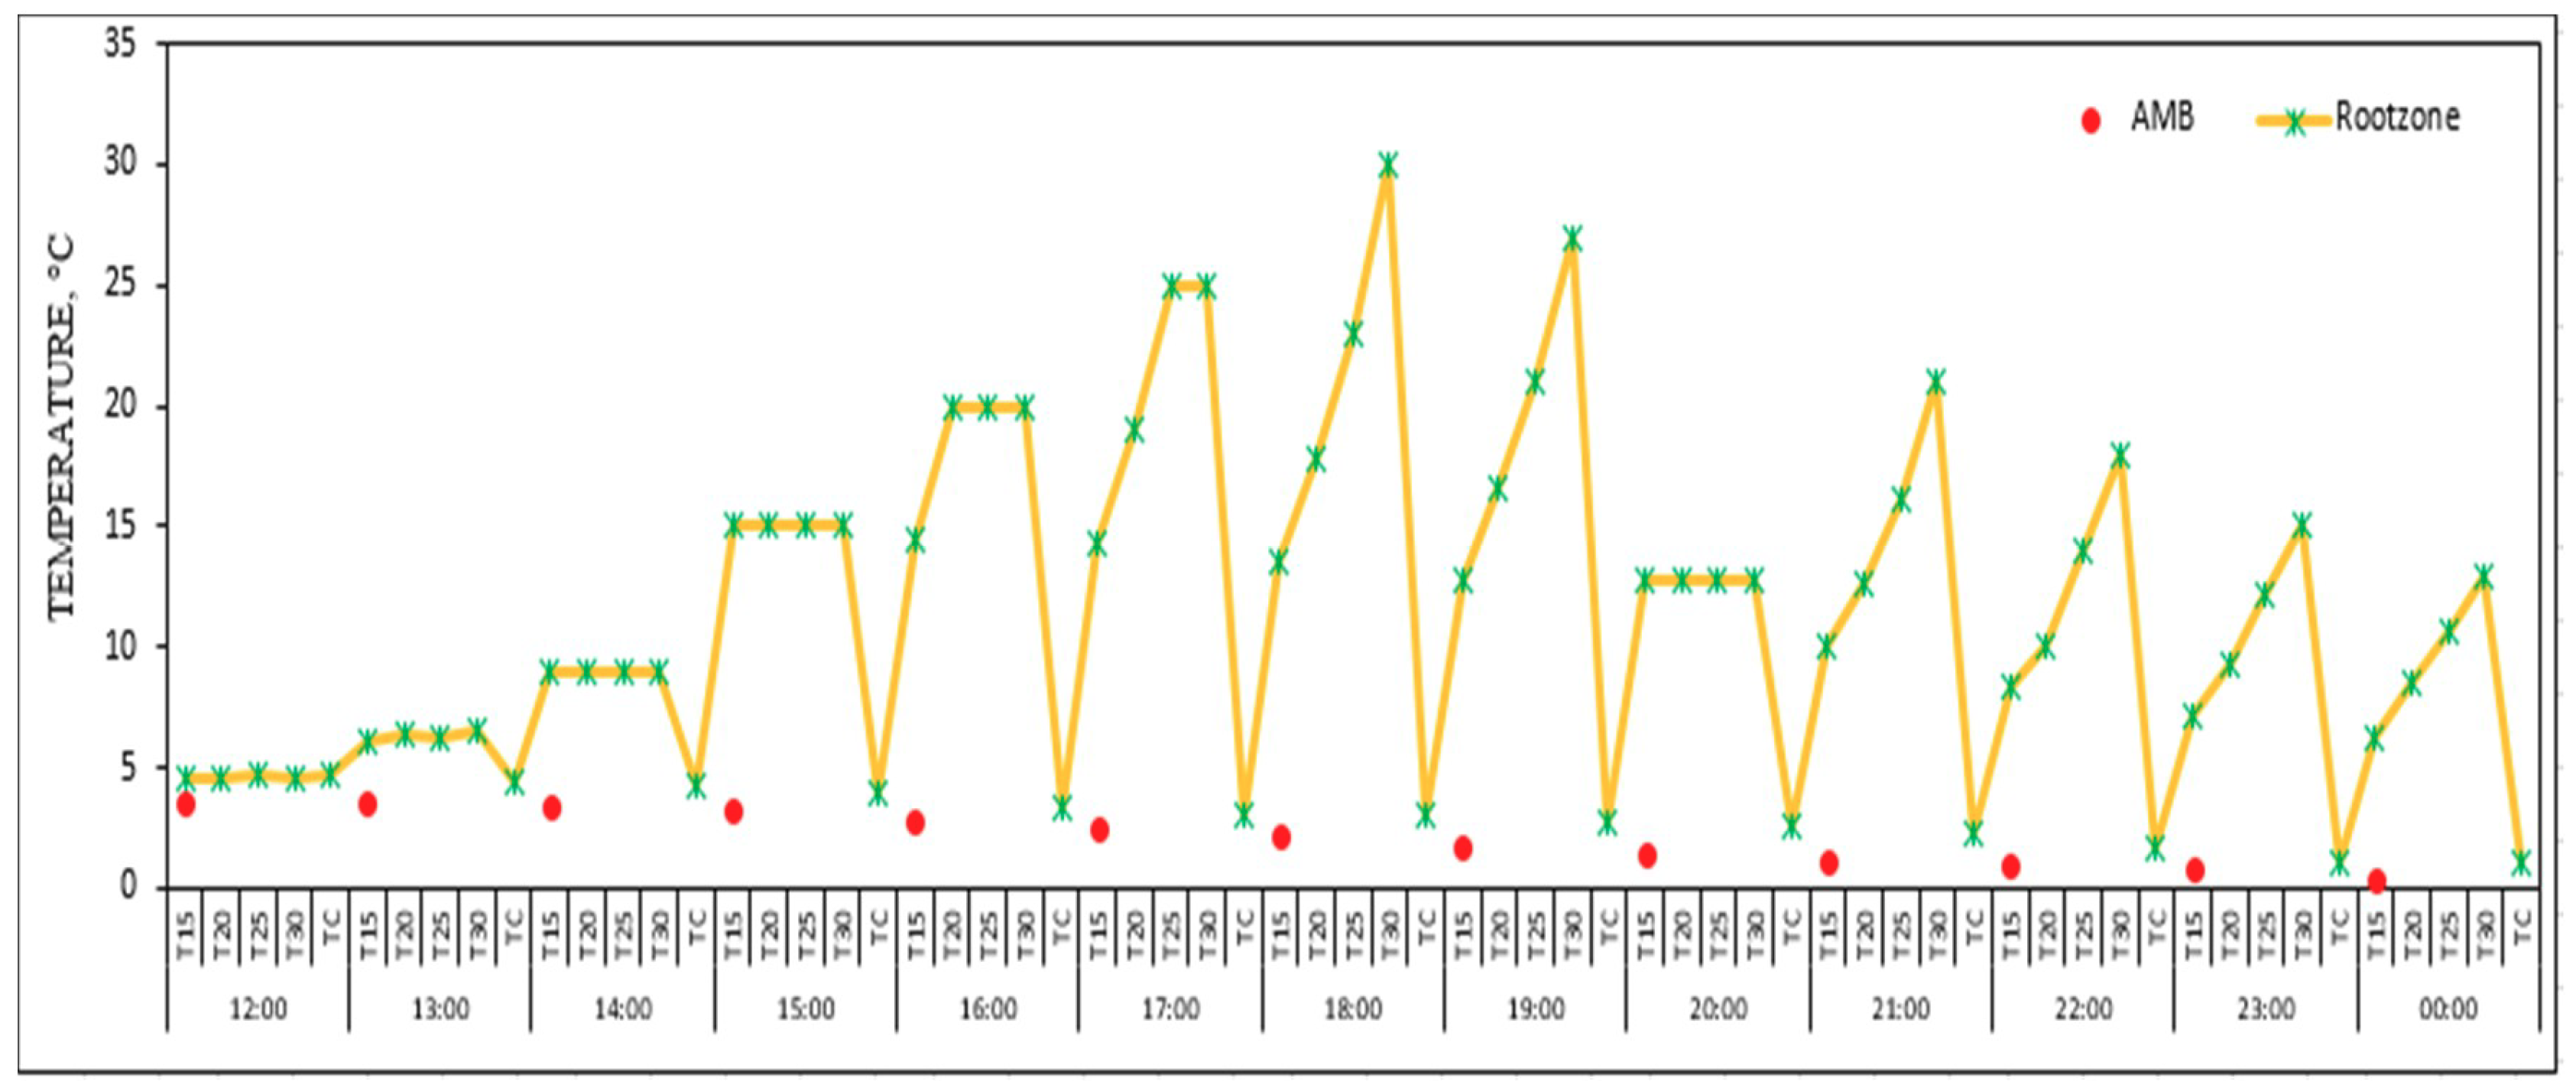
| 12:00 | 4.7 ± 0.11 | 4.6 ± 0.17 | 4.5 ± 0.20 | 4.7 ± 0.11 | 4.6 ± 0.22 |
| 13:00 | 4.4 ± 0.11 | 6.1 ± 0.12 | 6.4 ± 0.17 | 6.2 ± 0.20 | 6.5 ± 0.10 |
| 14:00 | 4.2 ± 0.20 | 9.0 ± 0.10 | 9.0 ± 0.26 | 9.1 ± 0.27 | 9.3 ± 0.26 |
| 15:00 | 3.9 ± 0.14 | 15.0 ± 0.30 | 15.0 ± 0.20 | 15.0 ± 0.3 | 15.0 ± 0.31 |
| 16:00 | 3.3 ± 0.30 | 14.5 ± 0.26 | 19.9 ± 0.60 | 20.1 ± 0.26 | 19.9 ± 0.35 |
| 17:00 | 3.1 ± 0.10 | 14.3 ± 0.17 | 19.0 ± 0.27 | 24.9 ± 0.35 | 25.0 ± 0.43 |
| 18:00 | 3.0 ± 0.11 | 13.6 ± 0.20 | 17.8 ± 0.20 | 23.0 ± 0.26 | 30.0 ± 0.39 |
| 19:00 | 2.8 ± 0.09 | 12.7 ± 0.15 | 16.6 ± 0.11 | 21.0 ± 0.54 | 27.1 ± 0.43 |
| 20:00 | 2.6 ± 0.12 | 11.4 ± 0.40 | 14.0 ± 0.44 | 18.1 ± 0.34 | 25.0 ± 0.36 |
| 21:00 | 2.3 ± 0.11 | 10.0 ± 0.43 | 12.6 ± 0.11 | 16.1 ± 0.12 | 21.3 ± 0.47 |
| 22:00 | 1.5 ± 0.15 | 8.4 ± 0.12 | 10.0 ± 0.10 | 14.0 ± 0.43 | 18.1 ± 0.12 |
| 23:00 | 1.1 ± 0.11 | 7.1 ± 0.17 | 9.2 ± 0.20 | 12.1 ± 0.14 | 15.0 ± 0.32 |
| 00:00 | 1.0 ± 0.12 | 6.2 ± 0.30 | 8.5 ± 0.35 | 10.3 ± 0.20 | 12.9 ± 0.13 |
| Specific Energy Consumption (Roots) | |||
|---|---|---|---|
| Treatment | Dry Mass (g) | Total Energy Consumption (kWh) | Specific Energy Consumption (kWh/g) |
| T-15 | 0.2513 | 9.702 | 38.61 |
| T-20 | 0.4713 | 13.244 | 28.1 |
| T-25 | 0.5077 | 17.71 | 34.88 |
| T-30 | 0.1717 | 21.483 | 125.11 |
© 2019 by the authors. Licensee MDPI, Basel, Switzerland. This article is an open access article distributed under the terms and conditions of the Creative Commons Attribution (CC BY) license (http://creativecommons.org/licenses/by/4.0/).
Share and Cite
Ameen, M.; Zhang, Z.; Wang, X.; Yaseen, M.; Umair, M.; Noor, R.S.; Lu, W.; Yousaf, K.; Ullah, F.; Memon, M.S. An Investigation of a Root Zone Heating System and Its Effects on the Morphology of Winter-Grown Green Peppers. Energies 2019, 12, 933. https://doi.org/10.3390/en12050933
Ameen M, Zhang Z, Wang X, Yaseen M, Umair M, Noor RS, Lu W, Yousaf K, Ullah F, Memon MS. An Investigation of a Root Zone Heating System and Its Effects on the Morphology of Winter-Grown Green Peppers. Energies. 2019; 12(5):933. https://doi.org/10.3390/en12050933
Chicago/Turabian StyleAmeen, Muhammad, Zhuo Zhang, Xiaochan Wang, Muhammad Yaseen, Muhammad Umair, Rana Shahzad Noor, Wei Lu, Khurram Yousaf, Fahim Ullah, and Muhammad Sohail Memon. 2019. "An Investigation of a Root Zone Heating System and Its Effects on the Morphology of Winter-Grown Green Peppers" Energies 12, no. 5: 933. https://doi.org/10.3390/en12050933