Article

Sensitivity Analysis of Rock Electrical Influencing Factors of Natural Gas Hydrate Reservoir in Permafrost Region of Qilian Mountain, China

1
Institute of Geophysical and Geochemical Exploration, CAGS, Langfang 065000, China
2
National Modern Geological Exploration Technology Research Center, Langfang 065000, China
3
School of Geosciences, China University of Petroleum, Qingdao 266580, China
4
Institutes of Petroleum Engineering, School of Energy, Geoscience, Infrastructure and Society, Heriot-Watt University, Edinburgh EH 14 4AS, UK
*
Author to whom correspondence should be addressed.
Energies 2019, 12(23), 4592; https://doi.org/10.3390/en12234592
Submission received: 14 October 2019 / Revised: 29 November 2019 / Accepted: 2 December 2019 / Published: 3 December 2019
(This article belongs to the Special Issue Advances in Natural Gas Hydrates)

Abstract

:
It has been found that the relatively low abundance of gas hydrate in the Muli area of the Qilian Mountain causes gas hydrate reservoirs to have low-resistivity characteristics similar to those of low-resistivity oil and gas reservoirs. Therefore, it has great significance to research the main controlling factors affecting the electrical properties, and then come up a new logging identification and evaluation model for low-resistivity gas hydrate reservoirs. In this investigation, the rock samples of sandstone from gas hydrate reservoirs were scanned by CT and combined with gas hydrate distribution characteristics. The three-dimensional digital rocks with different hydrate saturation were constructed using the diffusion limited aggregation (DLA) model, and the resistivity was simulated via the finite element method. After sorting out the influencing factors of electrical characteristics, the sensitivity of the factors affecting electrical properties was evaluated using orthogonal analysis, using variance analysis and trend analysis to quantitatively evaluate the influencing factors of rock electrical sensitivity, so as to distinguish the main and secondary factors affecting rock electrical sensitivity. The results show that the sensitivity of rock electrical properties to the six influencing factors from strong to weak are: formation water salinity, water film thickness, shale content, conductive mineral content, micropores, and average coordination number.

1. Introduction

Natural gas hydrate is a non-stoichiometric crystal of cage-like ice formed by water molecules and gas molecules under certain temperature and pressure conditions. It is widely distributed in terrestrial permafrost and seabed sediments. With high calorific value, it is considered as the new clean energy with the most promising prospects and can effectively solve the energy crisis and environmental problems [1,2]. Although only some local highly-concentrated gas hydrate accumulation may be of economic interest [3,4,5], gas hydrate also has great potential for alternative energy in the future. The Qilian Mountain Muli area is the only terrestrial frozen soil area in China, where gas hydrates are found. This area is characterized by dense lithology and low porosity. The hydrate is produced in the form of flakes in the fractures or in the pores [6]. However, gas hydrate distributed in the sediments is mainly produced in loose unconsolidated strata. Therefore, no matter the occurrence environment or production mode, there are obvious differences between Muli permafrost area and sea area gas hydrate, which has great research value.
Previous studies have shown that the resistivity values of hydrate reservoirs in the Muli area range from 75 Ω·m to 490 Ω·m, showing low resistance characteristics. The resistivity values are only about twice as large as those of non-reservoir layers, which is related to the sea area or the extremely permafrost area. Compared with a difference of more than 50-fold, the abnormal characteristics are not obvious [7]. In the meantime, the reservoir rock sample was significantly different from the homogeneous sandstone with high porosity and permeability in terms of microstructure characteristics via the computer tomography (CT) scanning images, showing un-uniform distribution of pore throat, poor pore connectivity, low porosity, and permeability. These phenomena make it difficult to accurately identify gas hydrate reservoir by logging and saturation precise calculation.
The electrical properties of rocks play an important role in logging interpretation and reservoir evaluation, and there are many factors that affect the electrical properties, such as rock particle size, pore size, micropores, water film thickness, wettability, argillaceous content, conductive minerals, formation water salinity, etc. In addition, it is difficult to quantitatively test, characterize, and control the above factors in rock resistivity experiment. So, digital rock technology is an effective method to solve these problem [8]. For this reason, this paper selected typical sandstone rock from research area, and then construct three-dimensional digital rock models with different hydrate saturation using the diffusion limited aggregation (DLA) model [9,10,11], and calculated the electrical properties using the finite element method [12,13] to explore the sensitivity of electrical properties to various influencing factors. The results can be used to study the conductivity of rocks, establish different conductivity models and log interpretation models, and lay a theoretical foundation for evaluating hydrate saturation and calculating reserves [14,15,16,17].

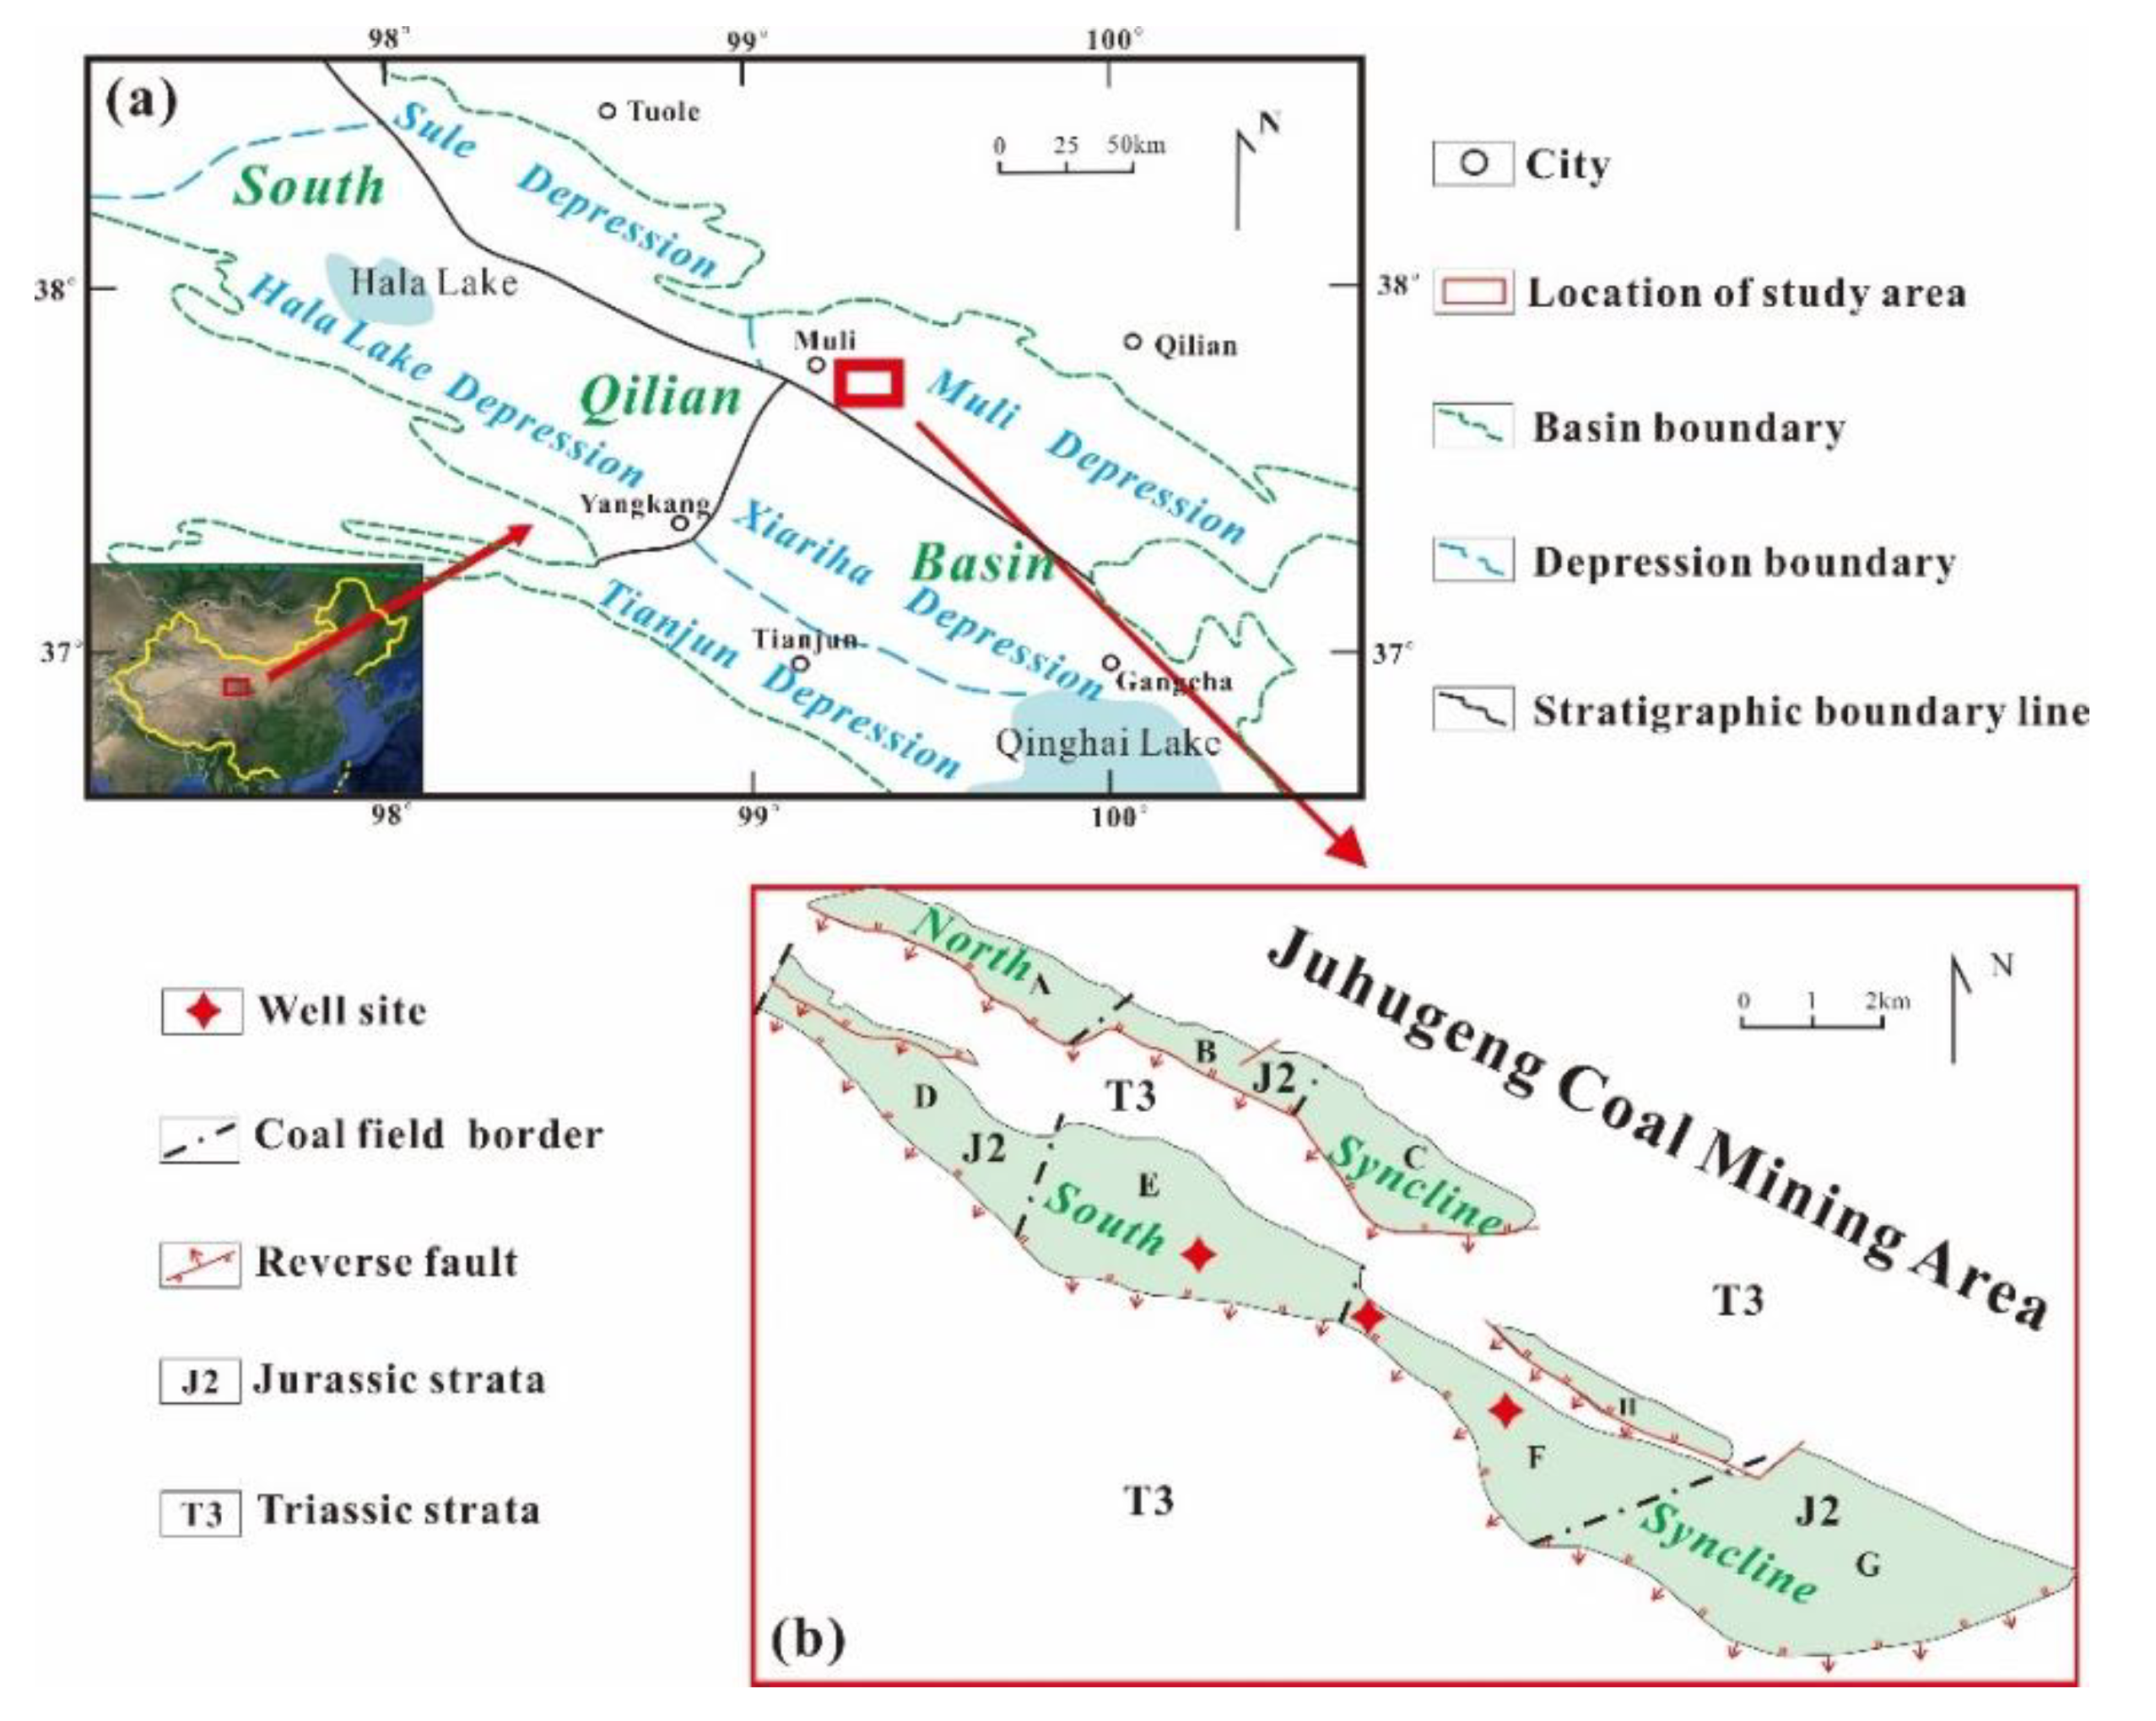
2. Geological Background

The gas hydrate research target area is located in the southern margin of Qilian Mountain, Qinghai Province, China. Its tectonic unit is the western end of the Muli depression in the South Qilian Basin, and it is located in the Juhugeng coal mining area (Figure 1a).
Previous geological surveys have proved that the Muli depression has good gas source conditions, and it can form sufficient hydrocarbon gas, such as coalbed gas, hydrocarbon source rock and oil shale, which provide abundant gas sources for the formation of gas hydrate [18]. The study area is in the range of from 4100 m to 4300 m, with an annual average temperature of −5.1 °C, and the permafrost layer is widely developed. The thickness of the frozen soil layer was determined to be about 70 m to 120 m through investigating the well temperature curves. Therefore, the study area has the temperature, pressure, gas source and frozen soil conditions for forming gas hydrates.
Owing to the tectonic action and its evolutionary results, the central part of the Juhugeng coal mining area in the study area is an anticline composed of Triassic (Figure 1b), and the north and south sides are two synclines composed of Jurassic coal-bearing strata [19]. Among them, the north syncline is composed of three coal fields, and the south syncline is composed of four coal fields.
The lower part of the Muli formation in the exposed stratum is a set of coarse clastic deposited in the alluvial plain of the braided river, and the bottom conglomerate is developed. The upper part is dominated by the lake-swamp environment, and the development area is mainly the recoverable coal seam. The lower section of the Jiangcang formation is mainly delta-lacustrine sedimentary environment, containing two layers to six layers of coal. The upper section is dominated by shallow lake-semi-deep lake environment and is a set of fine clastic mudstone and siltstone without coal [20,21,22]. The boreholes studied in this research are all located in E and F coal fields (Figure 1b), and the hydrates encountered are from the Jiangcang formation and the Muli formation of the middle Jurassic.

3. Methods

The sensitivity analysis of influencing factors of rock electrical properties is used to quantitative analyze the correlation between each influencing factor and the simulation results, that is, to analyze the influence of changes in influencing factors on the electrical properties [23]. At present, the most widely used sensitivity analysis method is generally the single-factor analysis method, which has obvious limitations, and can only roughly calculate the impact of each influencing factor on the target index, with large amounts of calculation and complicated data preparation. The orthogonal analysis method can make up for the deficiency of the single-factor analysis method. In this investigation, the orthogonal analysis method was used to study the sensitivity of electrical properties to various influencing factors, and was then used to distinguish the main and secondary factors that affect rock electrical properties.
Orthogonal analysis is actually a statistical method which uses existing orthogonal tables to arrange multifactor experiments, and then statistical analysis of the experimental results [24,25,26]. This method can mainly solve the following two problems: judging the size order of the influence of each influencing factor on the investigated index and the mutual relationship between each influencing factor and the investigated index.
The procedure of orthogonal analysis is summarized as follows. First, choose the appropriate orthogonal table Ln(rm) according to the actual situation, where L is the orthogonal table symbol, r is the number of states that affect the factors, n is the number of rows in the orthogonal table, that is, the number of calculations, and m is the number of columns in the orthogonal table. The calculation scheme can be determined by orthogonal table under the given conditions of each influencing factor level [27]. Next, experiments are carried out according to the determined calculation scheme and the results are calculated. Finally, the analysis of variance is adopted to analyze the results of the experimental scheme. The F test is conducted by comparing the variation sum of squares and error sum of each influencing factor, so as to judge the significance of the influence of each influencing factor.
An orthogonal table was used to arrange the experiment, and the number of horizontal experiments for each factor was t. n is equal to the product of r and t, and the experimental results are R1, R2, R3, ……, Rn. They are independent of each other and subject to a normal distribution with a variance of σ2, that is, Ri ~ N (ui, σ) and i = 1, 2, ……, n. The analysis of variance for Ri can be attributed to the significance test of hypothesis H0: u1 = u2 = …… = un.
Then, we constructed the statistics for the F test, and the squared sum of the total deviations of the experimental results is:
S T = i = 1 n ( R i R ¯ ) 2 = i = 1 n R i 2 T 2 n
S j = t i = 1 r ( K ¯ i j R ¯ ) 2 = 1 t i = 1 r K i j 2 T 2 n
where, R ¯ = 1 n i = 1 n R i , T = i = 1 n R i , K i j = k = 1 t R i j , k , K i j ¯ = K i j t . Sj is the sum of squared deviations of the influencing factors in column j, Kij is the statistical parameters of the influencing factor j at the i level, and Rij,k is the target parameter value of the kth experiment under the influence factor j at the i level.
In the orthogonal analysis, there are,
S T = j = 1 m S j
The degrees of freedom of ST and Sj are, respectively:
f T = n 1
f j = r 1
The constructed statistics are:
F j = S j f j / S e f e = S j ¯ f e ~ F ( f j , f e )
For the given significance level α, if FjF1−α(fj, fe), it is considered that this factor has significant influence on the test results. Otherwise, it is not significant. If FjF0.99(fj, fe), it represents the highly significant influence of factor j. If F0.95(fj, fe) ≤ Fj < F0.99(fj, fe), it represents the significant influence of factor j. If F0.90(fj, fe) ≤ Fj < F0.95(fj, fe), it represents the more significant influence of factor j. If Fj < F0.90(fj, fe), it indicates that the influence of factor j is not significant.

4. Results and Discussion

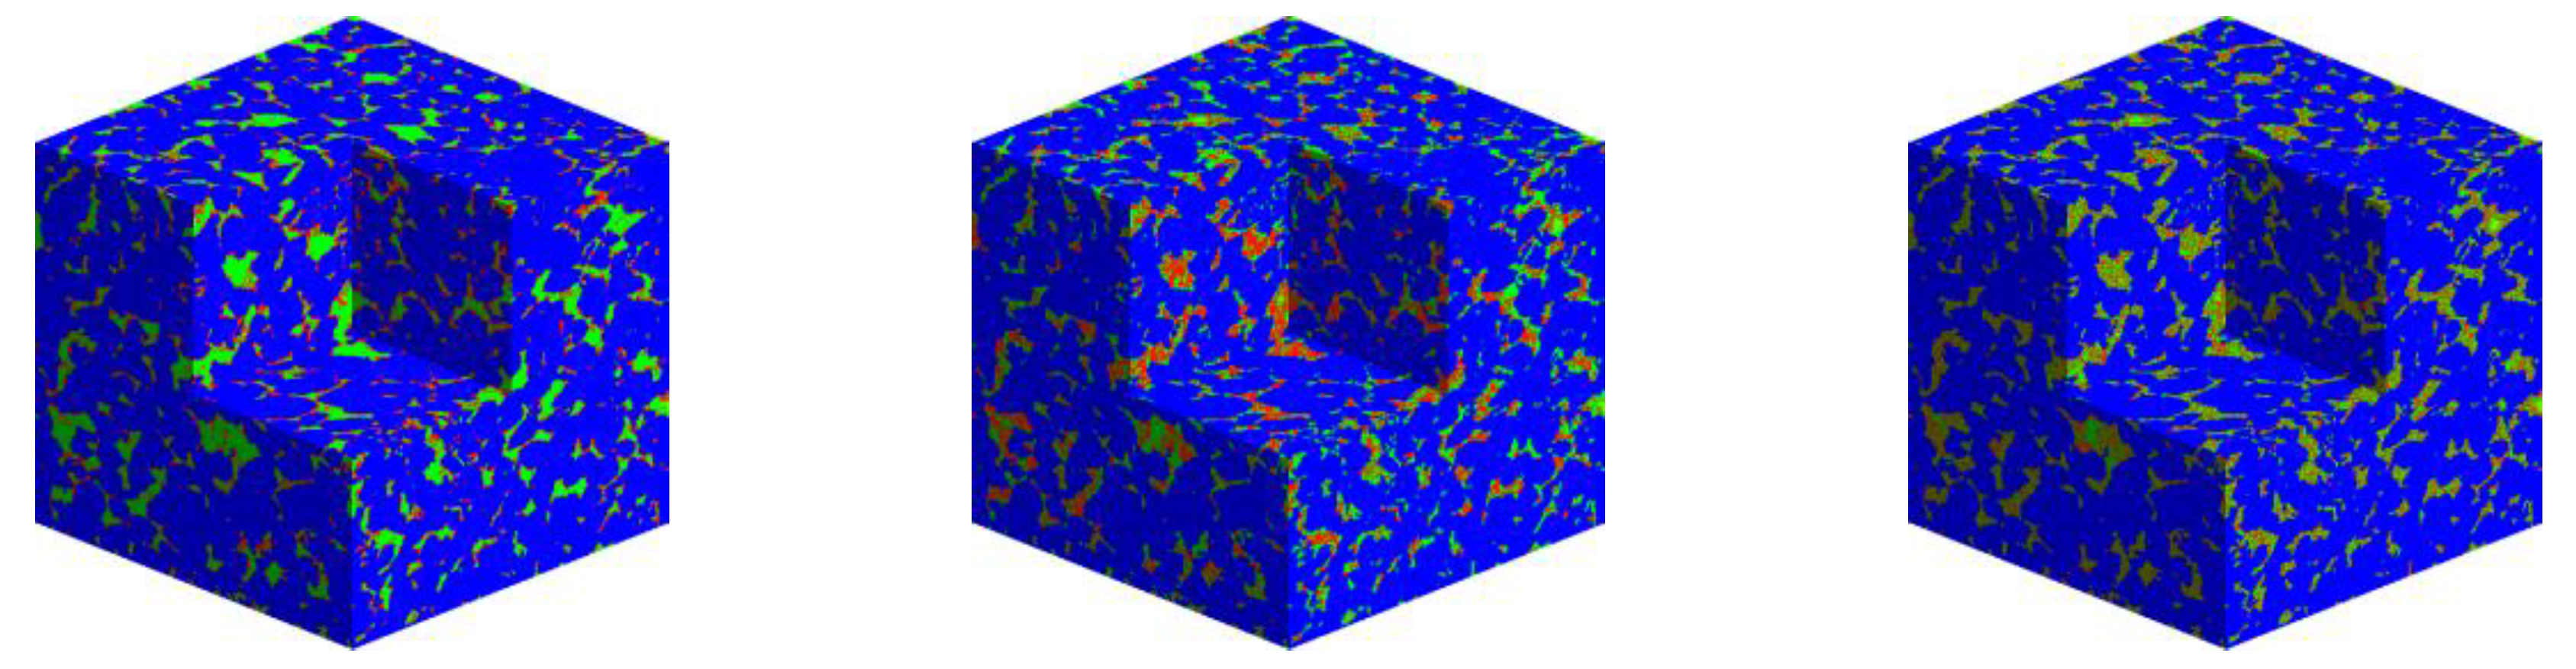
4.1. Digital Rock Models Construction

CT scanning experiment was performed on the rock samples (shale content and conductive mineral content are 8.912% and 3.942%, respectively) to obtain the two dimensional grayscale images of the rock. The grayscale images were binarized by selecting a reasonable threshold interval and converted into binary images [28,29]. The corresponding digital rock models could be obtained through physical space superposition of the two dimensional images [30] The detection of X-ray online scanning technology was realized in the Nikon 225 XTH high resolution microfocus CT imaging system (Nikon, Qingdao, China). The scanning resolution was 1.331 μm/voxel.
Gas hydrate digital rock models (Figure 2) were constructed using the diffusion limited aggregation model (DLA) via the digital rock constructed. The size of the digital rock was (400 voxel)3. Based on the actual pore structure, important information such as hydrate microscopic distribution (cemented type, adhesive type, and scattered hydrate) and hydrate saturation were taken as input parameters to construct the hydrate digital rock, which proved the existence of ideal distribution characteristics under Dong et al [31].

4.2. Rock Electrical Properties Sensitivity Analysis

When selecting the indexes of rock electrical sensitivity orthogonal analysis, the specific operability and general principle of orthogonal analysis are fully considered [32,33,34,35] through careful analysis and selection, six factors, namely shale content, conductive mineral content, formation water salinity, micropore content, average coordination number, and water film thickness, were selected as the sensitivity indexes to analyze the influencing factors. The level of influencing factors of the orthogonal analysis is as shown in Table 1. The third level of influencing factors was the physical parameters of the rock. That is, the shale content was 8.725%, the conductive mineral was 3.672%, the formation water salinity was 8000 mg/L, the micropore content was 4.364%, the average coordination number was 7.341, and the water film thickness was 0.264 μm. The corresponding parameters of other influencing factors were calculated based on the third level of the standard influencing factors. The values are shown in Table 1.
According to the design principles of orthogonal analysis, the orthogonal table was selected as L25(56). In order to comprehensively analyze the sensitivity of rock electricity to various influencing factors, 25 tests needed to be arranged to achieve the expected research purpose. The designed calculation scheme is shown on the right side of Table 2.
According to the resistivity values of rock with different water saturation, the results of various statistical variables of rock resistivity values with different water saturation can be calculated. Among them, the calculation results of various statistical variables of rock resistivity when water saturation is 14.73% and 72.96% are shown in Table 3 and Table 4.
According to the calculation results of various statistical variables of rock resistivity values under different water saturation, ANOVA was conducted. The deviation sum of squares Sj, degree of freedom fj, mean square sum, and Fj of each column could be calculated by Equation (1). The results of variance analysis of various statistical variables of rock resistivity when water saturation was 14.73% and 72.96% are shown in Table 5.
When selecting the significance level α, respectively, as 0.01, 0.05 and 0.1, referencing the F distribution table, it can be obtained that F0.99(4,4) = 16.00, F0.95(4,4) = 6.39, F0.90(4,4) = 4.11 referenced the F distribution table. If Fj ≥ 16.00, it indicates that the influence of factor j is highly significant. If 6.39 ≤ Fj < 16.00, it represents that the influence of facto j is mostly significant. If 4.11 ≤ Fj < 6.39, it represents that the influence of factor j is significant, and if Fj < 4.11, it represents that the influence of factor j is not significant.
When water saturation was 14.73%, 36.71%, 53.46%, and 72.96%, the variation trend of the influence factor level of rock electrical property and the average value of the statistical variable of rock resistivity at this level were as follows (Figure 3).
The following can be seen from Figure 3.
(1)
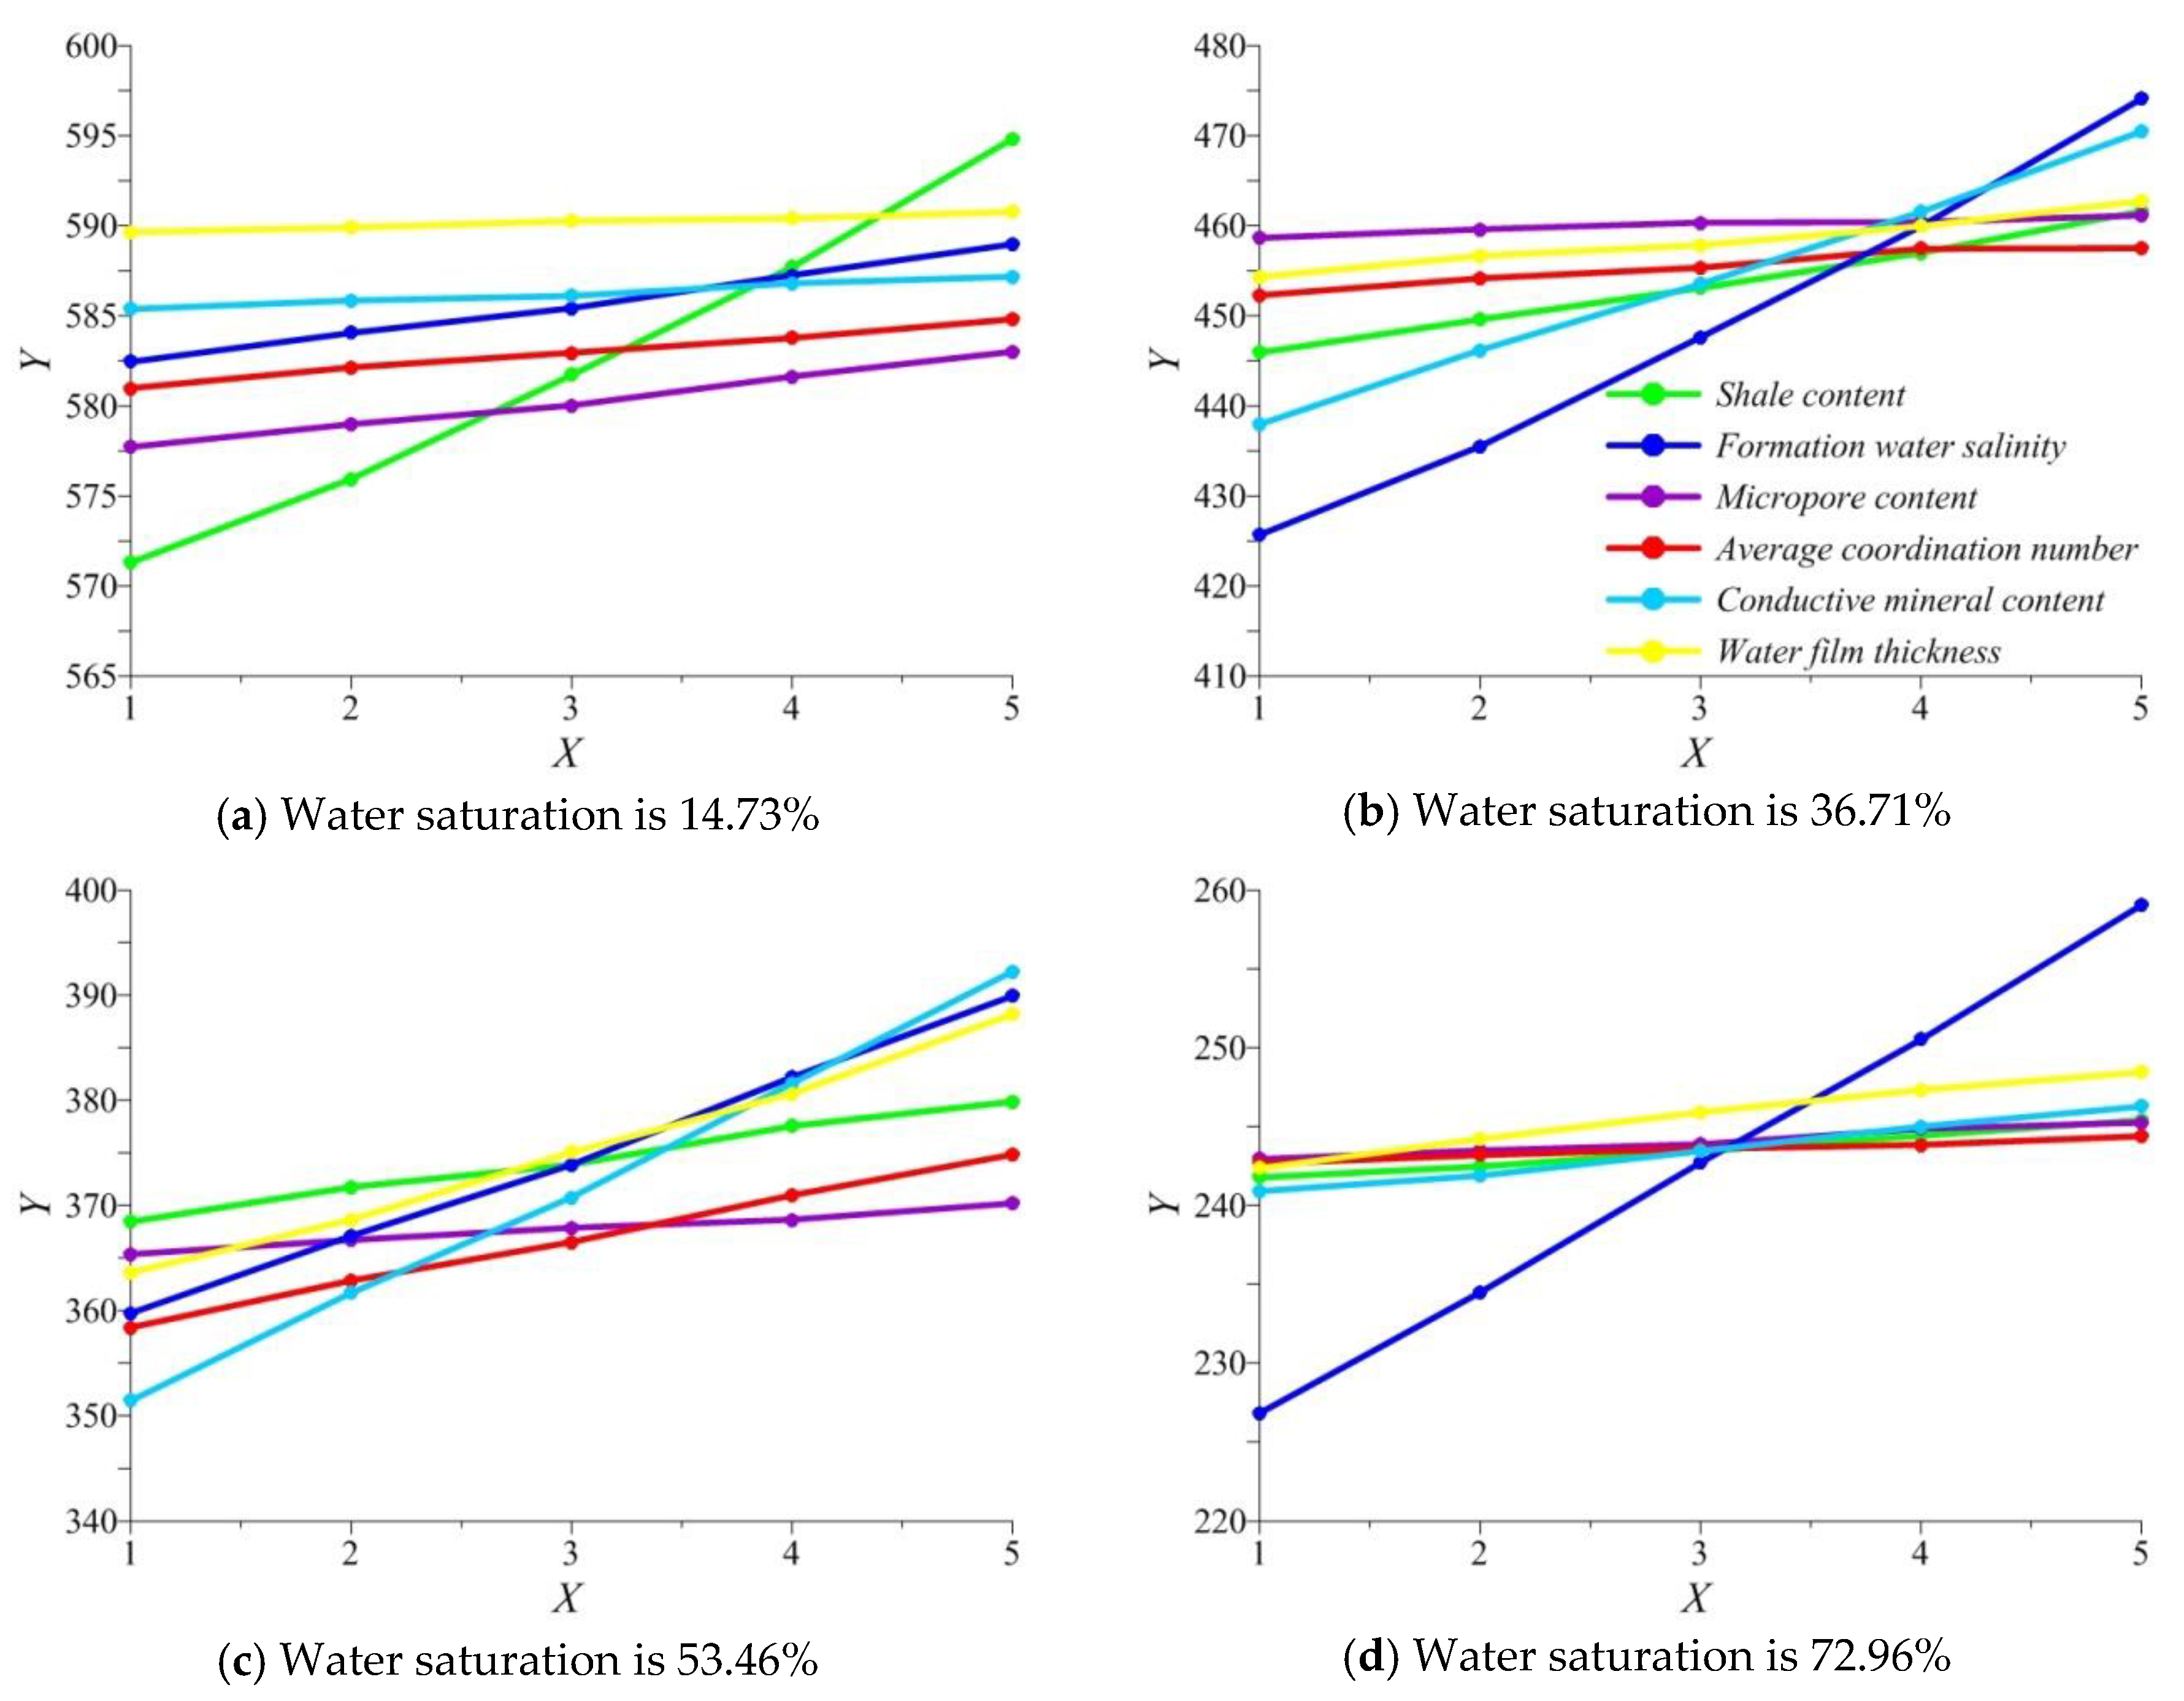
Under different water saturation conditions, with the increase of the level difference of the influencing factors, there was a difference in the average value of the resistivity statistical variables. The greater the increase, the stronger the sensitivity of the rock electrical properties to the influencing factors.
(2)
At low water saturation (Sw < 30%), the largest increase in amplitude was the shale content and the smallest was the water film thickness. It is speculated that at low water saturation, the shale will form an additional conductive path, forming a double conductive path with the formation water, which has an important influence on the resistivity of the rock, so it is the most sensitive factor at this time. In contrast, due to the additional conductive action of the mud, the conductivity of the water film is greatly impaired, so the water film thickness is the most inferior to the resistivity.
(3)
In moderate water saturation (30% ≤ Sw ≤ 60%), the largest increase in amplitude was the formation water salinity and the smallest was the micropore content. It is speculated that in the case of moderate water saturation, since the hydrate fills part of the pore space of the rock, the micropores lose their conductivity, so it is the least sensitive factor at this time. In contrast, the formation water salinity has an important influence on the conductive properties of rocks.
(4)
At high water saturation (Sw > 60%), the maximum increase in amplitude was the formation water salinity, and the smallest was the average coordination number. It is speculated that in the case of high water saturation, the rock pore space is almost occupied by the formation water, so the formation water mineralization degree is the most sensitive, because the formation water mineralization has great influence on the conductivity, especially if the conductive path is relatively thin, even if the coordination number is higher, it has no effect on conductivity, so it is in the most insensitive position.
It can be seen from the above discussion of the actual simulation results that the sensitivity degree of each influencing factor is different for different reservoirs and different types rocks, which is not invariable.

5. Conclusions

There are many factors affecting the electrical properties of hydrate reservoir rocks, and the effects of each factor on the electrical properties are not simply the sum of algebraic superpositions, their interactions are very complex. For different reservoirs and different types of rocks, the sensitivity degree of each influencing factor is different. There are many questions in the process of the single factor analysis method used to study the sensitivity of the influencing factors, including large workload, which is difficult, complicated and not easy to complete.
In this investigation, the orthogonal analysis method was applied to the sensitivity analysis of various influencing factors affecting the electrical properties. It did not need a large number of electrical simulation samples. To some extent, it greatly reduced the number of electrical simulation rock samples, and effectively distinguished the main and secondary factors affecting the electrical properties. For the selected reservoir rock samples, the sensitivity ranking of the six selected rock-affecting factors from strong to weak was as follows: formation water salinity, conductive mineral content, shale content, water film thickness, micro-porosity and average coordination number.
This indicates that in the rock conductive network, due to the parallel relationship between the formation water and the rock components, the formation water salinity plays a decisive role in the conductivity of the rock, and the water film thickness, the shale content (the argillaceous particles adsorb large quantities of bound water), and micropore content (micropores contain large amounts of capillary water), etc. are closely related to formation water. In the meantime, because the reservoirs in the study area are often severely broken, it is difficult to collect complete rock samples. The resistivity of the rock fractured wells is not accurate, and the laboratory cannot measure the resistivity by rock physical measurement. Therefore, the research method in this investigation can effectively remedy this defect, and explore unknown scientific problems from the perspective of rock electrical properties.

Author Contributions

Methodology, H.D.; writing—original draft, Z.L. and H.D.; funding acquisition, J.S. and X.W.; validation, H.F.

Funding

This research was supported by National Special Research Plan (Grant No. 2018YFF01013504), National Nonprofit Institute Research Grant of IGCE (Grant No. AS2019P01), National Nature Science Foundation of China (Grant no. 41874138), Fundamental Research Funds for the Central Universities (Grant no. 18CX06027A), Geological Survey Program of CGS (Grant No. DD20160224).

Conflicts of Interest

The authors declare no conflict of interest.

References

  1. Kvenvolden, K.A.; Lorenson, T.D. The Global Occurrence of Natural Gas Hydrate; American Geophysical Union: Washington, DC, USA, 2001; pp. 2–10. [Google Scholar]
  2. Dong, H.; Sun, J.; Zhu, J.; Liu, L.; Lin, Z.; Golsanami, N.; Cui, L.; Yan, W. Developing a new hydrate saturation calculation model for hydrate-bearing sediments. Fuel 2019, 248, 27–37. [Google Scholar] [CrossRef]
  3. Milkov, A.A.; Sassen, R. Economic geology of offshore gas hydrate accumulations and provinces. Mar. Pet. Geol. 2002, 19, 1–11. [Google Scholar] [CrossRef]
  4. Milkov, A.V.; Sassen, R. Preliminary assessment of resources and economic potential of individual gas hydrate accumulations in the Gulf of Mexico continental slope. Mar. Pet. Geol. 2003, 20, 111–128. [Google Scholar] [CrossRef]
  5. Milkov, A.V. Global estimates of hydrate-bound gas in marine sediments: How much is really out there? Earth Sci. Rev. 2004, 66, 183–197. [Google Scholar] [CrossRef]
  6. Fang, H.; Xu, M.; Lin, Z.; Zhong, Q.; Bai, D.; Liu, J.; Pei, F.; He, M. Geophysical characteristics of gas hydrate in the Muli area, Qinghai province. J. Nat. Gas Sci. Eng. 2017, 37, 539–550. [Google Scholar] [CrossRef]
  7. Lin, Z.; Pan, H.; Fang, H.; Gao, W.; Liu, D. High-altitude well log evaluation of a permafrost gas hydrate reservoir in the Muli area of Qinghai, China. Sci. Rep. 2018, 8, 12596. [Google Scholar] [CrossRef] [PubMed]
  8. Arns, C.H.; Bauget, F.; Ghous, A. Digital core laboratory: Petrophysical analysis from 3D images of reservoir core fragments. Petrophysics 2005, 46, 260–277. [Google Scholar]
  9. Witten, T.A.; Sander, L.M. Diffusion-limited aggregation, a kinetic critical phenomenon. Phys. Rev. Lett. 1981, 47, 1400–1403. [Google Scholar] [CrossRef]
  10. Lee, H.; Shin, J.; Ha, S. Frost formation on a plate with different surface hydrophilicity. Int. J. Heat Mass Transf. 2004, 47, 4881–4893. [Google Scholar] [CrossRef]
  11. Qu, K.; Komori, S.; Jiang, Y. Local variation of frost layer thickness and morphology. Int. J. Heat Mass Transf. 2006, 45, 116–123. [Google Scholar] [CrossRef]
  12. Liu, X.; Sun, J.; Wang, H. Numerical simulation of rock electrical properties based on digital cores. Appl. Geophys. 2009, 6, 1–7. [Google Scholar] [CrossRef]
  13. Kong, Q.; Zhou, C.; Zhang, Y.; Li, X.; Li, C.; Hu, F. Numerical simulation methods of rock electrical properties based on digital cores: A review. Prog. Geophys. 2015, 30, 718–724. [Google Scholar]
  14. Collett, T.S.; Lee, M.W. Gulf of Mexico gas hydrate joint industry project leg II logging-while-drilling data acquisition and analysis. Mar. Pet. Geol. 2012, 34, 41–61. [Google Scholar] [CrossRef]
  15. Ning, F.; Liu, L.; Li, S. Well logging assessment of natural gas hydrate reservoirs and relevant influential factors. Acta Pet. Sin. 2013, 34, 591–606. [Google Scholar]
  16. Max, M.D.; Johnson, A.H. Hydrate petroleum system approach to natural gas hydrate exploration. Pet. Geosci. 2014, 20, 187–199. [Google Scholar] [CrossRef]
  17. Majumdar, U.; Ann, E.C.; Mackenzie, S. Semi-quantitative gas hydrate assessment from petroleum industry well logs in the northern Gulf of Mexico. Mar. Pet. Geol. 2017, 85, 233–241. [Google Scholar] [CrossRef]
  18. Zhu, Y.; Zhang, Y.; Wen, H.; Lu, Z.; Wang, P. Gas hydrate in the Qilian Mountain permafrost and their basic characteristics. Acta Geol. Sin. 2010, 31, 7–16. [Google Scholar]
  19. Pang, S. Relationship Between Tectonic, Sedimentation Characteristics and Distribution of Gas Hydrate in Muli Coalfield of Qilian Mountain; China University of Geosciences: Beijing, China, 2012; p. 58. [Google Scholar]
  20. Lu, Z.; Zhu, Y.; Zhang, Y. Basic geological characteristics of gas hydrates in Qilian Mountain permafrost area, Qinghai Province. Miner. Depos. 2010, 29, 182–191. [Google Scholar]
  21. Lu, Z.; Li, Y.; Wang, W. Study on the accumulation pattern for permafrost-associated gas hydrate in sanlutian of Muli, Qinghai. Geoscience 2015, 29, 1014–1023. [Google Scholar]
  22. Wen, H.; Lu, J.; Shang, L. A sequence stratigraphic discussion of the jurassic coal measures in the Juhugeng coalmine area in Qinghai Province. Coal Geol. China 2006, 18, 19–21. [Google Scholar]
  23. Cai, Y.; Xing, Y.; Hu, D. On sensitivity analysis. J. Beijing Norm. Univ. (Nat. Sci.) 2008, 44, 9–16. [Google Scholar]
  24. Chen, Q. Analysis on limit state equations for reliability design of side slope of embankment and parameter sensitivity. Rock Soil Mech. 1995, 16, 13–21. [Google Scholar]
  25. Zhang, X.; Gong, X.; Xu, R. Orthogonality analysis method of sensibility on factor of slope stability. China J. Highw. Transp. 2003, 16, 36–39. [Google Scholar]
  26. Ji, D.; Yang, Q. Studies on sensibilities of factors influencing on reinforced uniform slope stability. Rock Soil Mech. 2004, 25, 1089–1092. [Google Scholar]
  27. Zhang, Y.; Du, X. Simple sensitivity measures of reliability to system parameters. J. TongJi Univ. 1996, 24, 475–480. [Google Scholar]
  28. Hsu, C.; Yang, C.; Wang, H. Multi-threshold level set model for image segmentation. EURASIP J. Adv. Signal Process. 2010, 2010, 950438. [Google Scholar] [CrossRef] [Green Version]
  29. Zhang, Y.; Xu, X.; Lebedev, M.; Sarmadivaleh, M.; Barifcani, A.; Iglauer, S. Multi-scale x-ray computed tomography analysis of coal microstructure and permeability changes as a function of effective stress. Int. J. Coal Geol. 2016, 165, 149–156. [Google Scholar] [CrossRef] [Green Version]
  30. Dong, H.; Sun, J.; Lin, Z.; Cui, L.; Yan, W. Quantitative characterization and characteristics analysis of microscopic pore structure in natural gas hydrate based on CT scanning. J. China Univ. Pet. 2018, 42, 40–49. [Google Scholar]
  31. Dong, H.; Sun, J.; Lin, Z.; Fang, H.; Li, Y.; Cui, L.; Yan, W. 3D pore-type digital rock modeling of natural gas hydrates for permafrost and numerical simulation of electrical properties. J. Geophys. Eng. 2018, 15, 275–285. [Google Scholar] [CrossRef] [Green Version]
  32. Lv, H.; Li, X.; Gu, B. Origins and log responses of neogene of low-resistivity oil pays in Bohai sea. China Offshore Oil Gas 2006, 18, 97–102. [Google Scholar]
  33. Deng, J.; Wang, Z.; Gao, C. Estimation of sensitivity of Chang 2 reservoir in Zhanghan area. J. North West Univ. (Nat. Sci. Ed.) 2011, 41, 285–290. [Google Scholar]
  34. Feng, J. An analysis of the factors to influence electrical properties of rocks based on a digital petrophysical experiment: A case of the middle-shallow sandstone reservoirs in Pearl river mouth basin (the eastern area). China Offshore Oil Gas 2012, 24, 12–16. [Google Scholar]
  35. Meng, Z.P.; Zhang, J.X.; Liu, H. Productivity model of CBM wells considering the stress sensitivity and its application analysis. J. China Coal Soc. 2014, 39, 593–599. [Google Scholar]
Figure 1. Study area location and geological structure schematic diagram. (a) Qilian mountain geological structure; (b) Juhugeng coal mining area geological structure.
Energies 12 04592 g001
Figure 2. The pore hydrate digital rock constructed by the diffusion limited aggregation model. Rock skeleton is blue, formation water is green and hydrate is red.
Energies 12 04592 g002
Figure 3. Influence factor level and coefficient index trend diagram of rock sample under different water saturations. Note: X is ‘The influence factor level of rock electrical property’, Y is ‘The average value of the statistical variable of rock resistivity’.
Energies 12 04592 g003
Table 1. Rock influencing factors level table.
Influence Factor LevelInfluencing Factors
Shale Content (%)Conductive Mineral Content (%)Formation Water Salinity (mg/L)Micropore Content (%)Average Coordination NumberWater Film Thickness (um)
1+20%
(10.470)
+20%
(4.406)
+20%
(9600)
+20%
(5.237)
+20%
(8.809)
+20%
(0.317)
2+10%
(9.598)
+10%
(4.039)
+10%
(8800)
+10%
(4.800)
+10%
(8.075)
+10%
(0.290)
30%
(8.725)
0%
(3.672)
0%
(8000)
0%
(4.364)
0%
(7.341)
0%
(0.264)
4−10%
(7.853)
−10%
(3.305)
−10%
(7200)
−10%
(3.928)
−10%
(6.607)
−10%
(0.238)
5−20%
(6.980)
−20%
(2.938)
−20%
(6400)
−20%
(3.491)
−20%
(5.873)
−20%
(0.211)
Note: The numbers outside the brackets are the difference between each level and the standard influence level, and the values inside the brackets are the values of the parameters at this level.
Table 2. Orthogonal analysis calculation scheme and results.
Calculation SchemeInfluencing FactorsRock Resistivity
Shale ContentConductive Mineral ContentFormation Water SalinityMicropore ContentAverage Coordination NumberWater Film ThicknessWater Saturation
12345614.73%72.96%
1111111333.220104.496
2122222356.301111.178
3133333384.360118.014
4144444418.197124.476
5155555457.893130.667
6212345364.890113.273
7223451393.076121.002
8234512427.412128.659
9245123429.735135.731
10251234366.786107.990
11313524403.096123.621
12324135402.340132.680
13335241437.083141.502
14341352379.830110.945
15352413406.179118.312
16414253410.955136.060
17425314446.940147.001
18431425392.275113.866
19442531420.935121.618
20453142416.102130.750
21515432460.085151.657
22521543404.812116.471
23532154398.357124.259
24543215427.312133.643
25554321460.719144.842
Note: The corresponding values of each influencing factors are the corresponding influencing factors under different schemes.
Table 3. Calculation results of various statistical variables when the rock water saturation is 14.73%.
Influencing FactorShale ContentConductive Mineral ContentFormation Water SalinityMicropore ContentAverage Coordination NumberWater Film Thickness
K1j2856.692926.392911.892887.532905.472948.44
K2j2880.182928.522918.892893.632909.872948.32
K3j2906.462930.422926.352899.982914.012950.20
K4j2937.872932.272934.982907.182918.212951.28
K5j2972.662934.162944.252914.182922.402952.62
K1j571.34585.28582.38577.51581.09589.69
K2j576.04585.70583.78578.73581.97589.86
K3j581.29586.08585.27579.99582.80590.04
K4j587.57586.45586.99581.42583.64590.26
K5j594.53586.83588.85582.84584.48590.52
Sj1499.55356.591427.6069357.8429.25622.79
Table 4. Calculation results of various statistical variables when the rock water saturation is 72.96%.
Influencing FactorShale ContentConductive Mineral ContentFormation Water SalinityMicropore ContentAverage Coordination NumberWater Film Thickness
K1j1209.991204.211135.351215.111214.841213.34
K2j1214.261210.811173.371217.721217.241221.13
K3j1218.231217.521214.501220.481219.471229.10
K4j1222.421224.661253.731223.541221.861236.73
K5j1226.501231.691296.241226.641224.581243.99
K1j241.99240.84227.07243.02242.97242.67
K2j242.85242.16234.67243.54243.45244.23
K3j243.65243.50242.90244.10243.89245.82
K4j244.48244.93250.75244.71244.37247.35
K5j245.30246.34259.25245.33244.92248.79
Sj11840.97122.873230.3113.659.37793.75
Table 5. Rock variance analysis results.
Water SaturationInfluencing FactorDeviation Sum of Squares/SjDegree of Freedom/fjMean Sum of Square/SjFj ValueSignificance
14.73%Shale content1499.554374.8959.02Highly sensitive
Conductive mineral content356.59489.1514.03Very sensitive
Formation water salinity1427.604356.9056.19Highly sensitive
Micropore content69,357.84417,339.462729.72Highly sensitive
Average coordination number29.2547.311.15Insensitive
Water film thickness622.794155.7024.51Very sensitive
72.96%Shale content11,840.9742960.241597.54Highly sensitive
Conductive mineral content122.87430.7216.58Highly sensitive
Formation water salinity3230.314807.58435.82Highly sensitive
Micropore content13.6543.411.84Insensitive
Average coordination number9.3742.341.26Insensitive
Water film thickness793.754198.44107.09Highly sensitive

