1. Introduction
Due to global warming, more and more drastic actions are being taken to reduce greenhouse gas emissions. The European Commission, newly appointed in 2019, wants carbon dioxide emissions to be reduced by at least 50% by the year 2030. In contrast, in Poland, an increase in CO
2 emissions has been observed for the last four years. According to the latest BP (British Petroleum) statistical report [
1], Poland has released 292.9 (in 2015), 305.6 (in 2016), 315.4 (in 2017), and 322.5 (in 2018) million tonnes of this gas into the atmosphere. This is the fifth highest value in Europe in terms of CO
2 emissions, after Germany (725.7 MtCO
2e/year), the United Kingdom (394.1 MtCO
2e/year), Turkey (389.9 MtCO
2e/year), and Italy (336.3 MtCO
2e/year). The obvious reason for this phenomenon is that the base fuel in the Polish energy sector is still coal. Under pressure from other European Union members, Poland will have to radically adapt its policy related to reducing the amount of greenhouse gases emitted. The only reasonable step in this direction will be a radical increase in financial support for the development of renewable energy sources. This undertaking must be preceded by precise economic analysis. The purpose of this article is to present a simple but accurate method for determining the amount of energy that can be obtained from solar collectors.
The energy yield from solar water heating (SWH) systems, in which the direct conversion of solar energy takes place, can be estimated using different methods [
2]. The first and simplest approach for the assessment of solar thermal systems can be used when the operating temperature of panels is possible to estimate and the amount of the mean overall solar radiation on a horizontal surface is known. The Utilizability Method developed by Gordon and Rabl [
3] and Pareira et al. [
4] can serve as a representative example. The critical radiation intensity above which the energy yield from the solar installation can be obtained is determined in this method. The calculation algorithm allows the monthly amount of energy supplied by the system to be obtained, taking into account the amount of incident solar radiation, outdoor temperature and energy demand by the user. This method is based on the results of experimental data which were collected over a period of 40 years. The second category contains methods that are developed on the basis of the analysis of multi-variant detailed computer simulations and are in the form of—sometimes very complex—correlations. The f-Chart method [
5] is a representative example in this group. It is a widely used design tool for assessing the energy efficiency of the popular technical layouts of the solar installations. The calculation algorithm is based on a function that determines the share of solar energy in covering the energy demand for hot water preparation. There are two independent dimensionless variables in this function. Two groups of design and operational parameters affect the value of these variables. The error of the f-Chart method, depending on the accuracy of the assumptions, is estimated to be 5% to 10% [
6]. The third and last category includes energy computer simulations. The most popular computer programs, such as TRNSYS, EnergyPlus, T*SOL, Polysun, RETScreenl, GetSolar, and many others, are used for modelling the operation of solar systems supporting hot water preparation. The calculations are usually carried out on an annual basis with an hour or shorter time step and use domestic hot water usage schedules. Detailed data containing basic parameters of outdoor air and solar radiation contained in a typical meteorological year (TMY) ensure the high accuracy of this type of computer simulations. A slightly different approach to thermal performance analyses of SWH systems is shown in this article. Using the method presented here, a designer can easily determine the required number or the area of solar collectors. The calculation algorithm consists of not very complicated mathematical relationships, which are presented in Chapter 3. The most important parameter, which is the energy yield from solar collectors, is only dependent on the panel type and its location. This value can be determined on the basis of the contour charts or tabular data shown in Chapter 3. The main advantage and the novelty of this new method is the greater simplicity of calculations and that it ensures high accuracy when estimating the annual energy output of liquid-based solar collectors. It should be noted that the above-mentioned building energy simulation computer programs are used to simulate the operation of SWH systems over longer periods of time; i.e., for transient modelling. The method presented here is dedicated to the installation design and not to the analysis of its parameters in unstable conditions.
2. Description of the Method to Determine the Annual Useful Energy Produced by Solar Collectors
The total solar radiation is the main parameter of the surrounding environment that affects the energy yield from SWH systems. The second factor which determines the amount of heat loss and also reduces the efficiency of solar panels is the outdoor air temperature. Therefore, it was decided to develop a function that would allow these values to correlate with each other.
For this purpose, the multiple regression method was used. It allows the quantification of the relationships between independent variables (solar radiation, outdoor temperature) and the dependent variable (useful energy). The regression model formula is determined in such a way as to minimize the difference between the modelled (predicted) value and the actual (resultant) value of the dependent variable.
In order to create a database of these independent parameters to develop the correlation, it was decided to perform a number of computer simulations. The real solar domestic hot water (SDHW) system, located on the roof of the Hotel for Research Assistants on the campus of Bialystok University of Technology (BUT) (Poland), shown in
Figure 1, was the model object.
The SDHW system in the test includes 21 evacuated tube collectors (seven rows of three panels in each), 35 flat plate collectors (seven rows of five panels in each) with a total gross area of 146.3 m
2, and eight tanks (four for each loop) with a total capacity of 8 m
3.
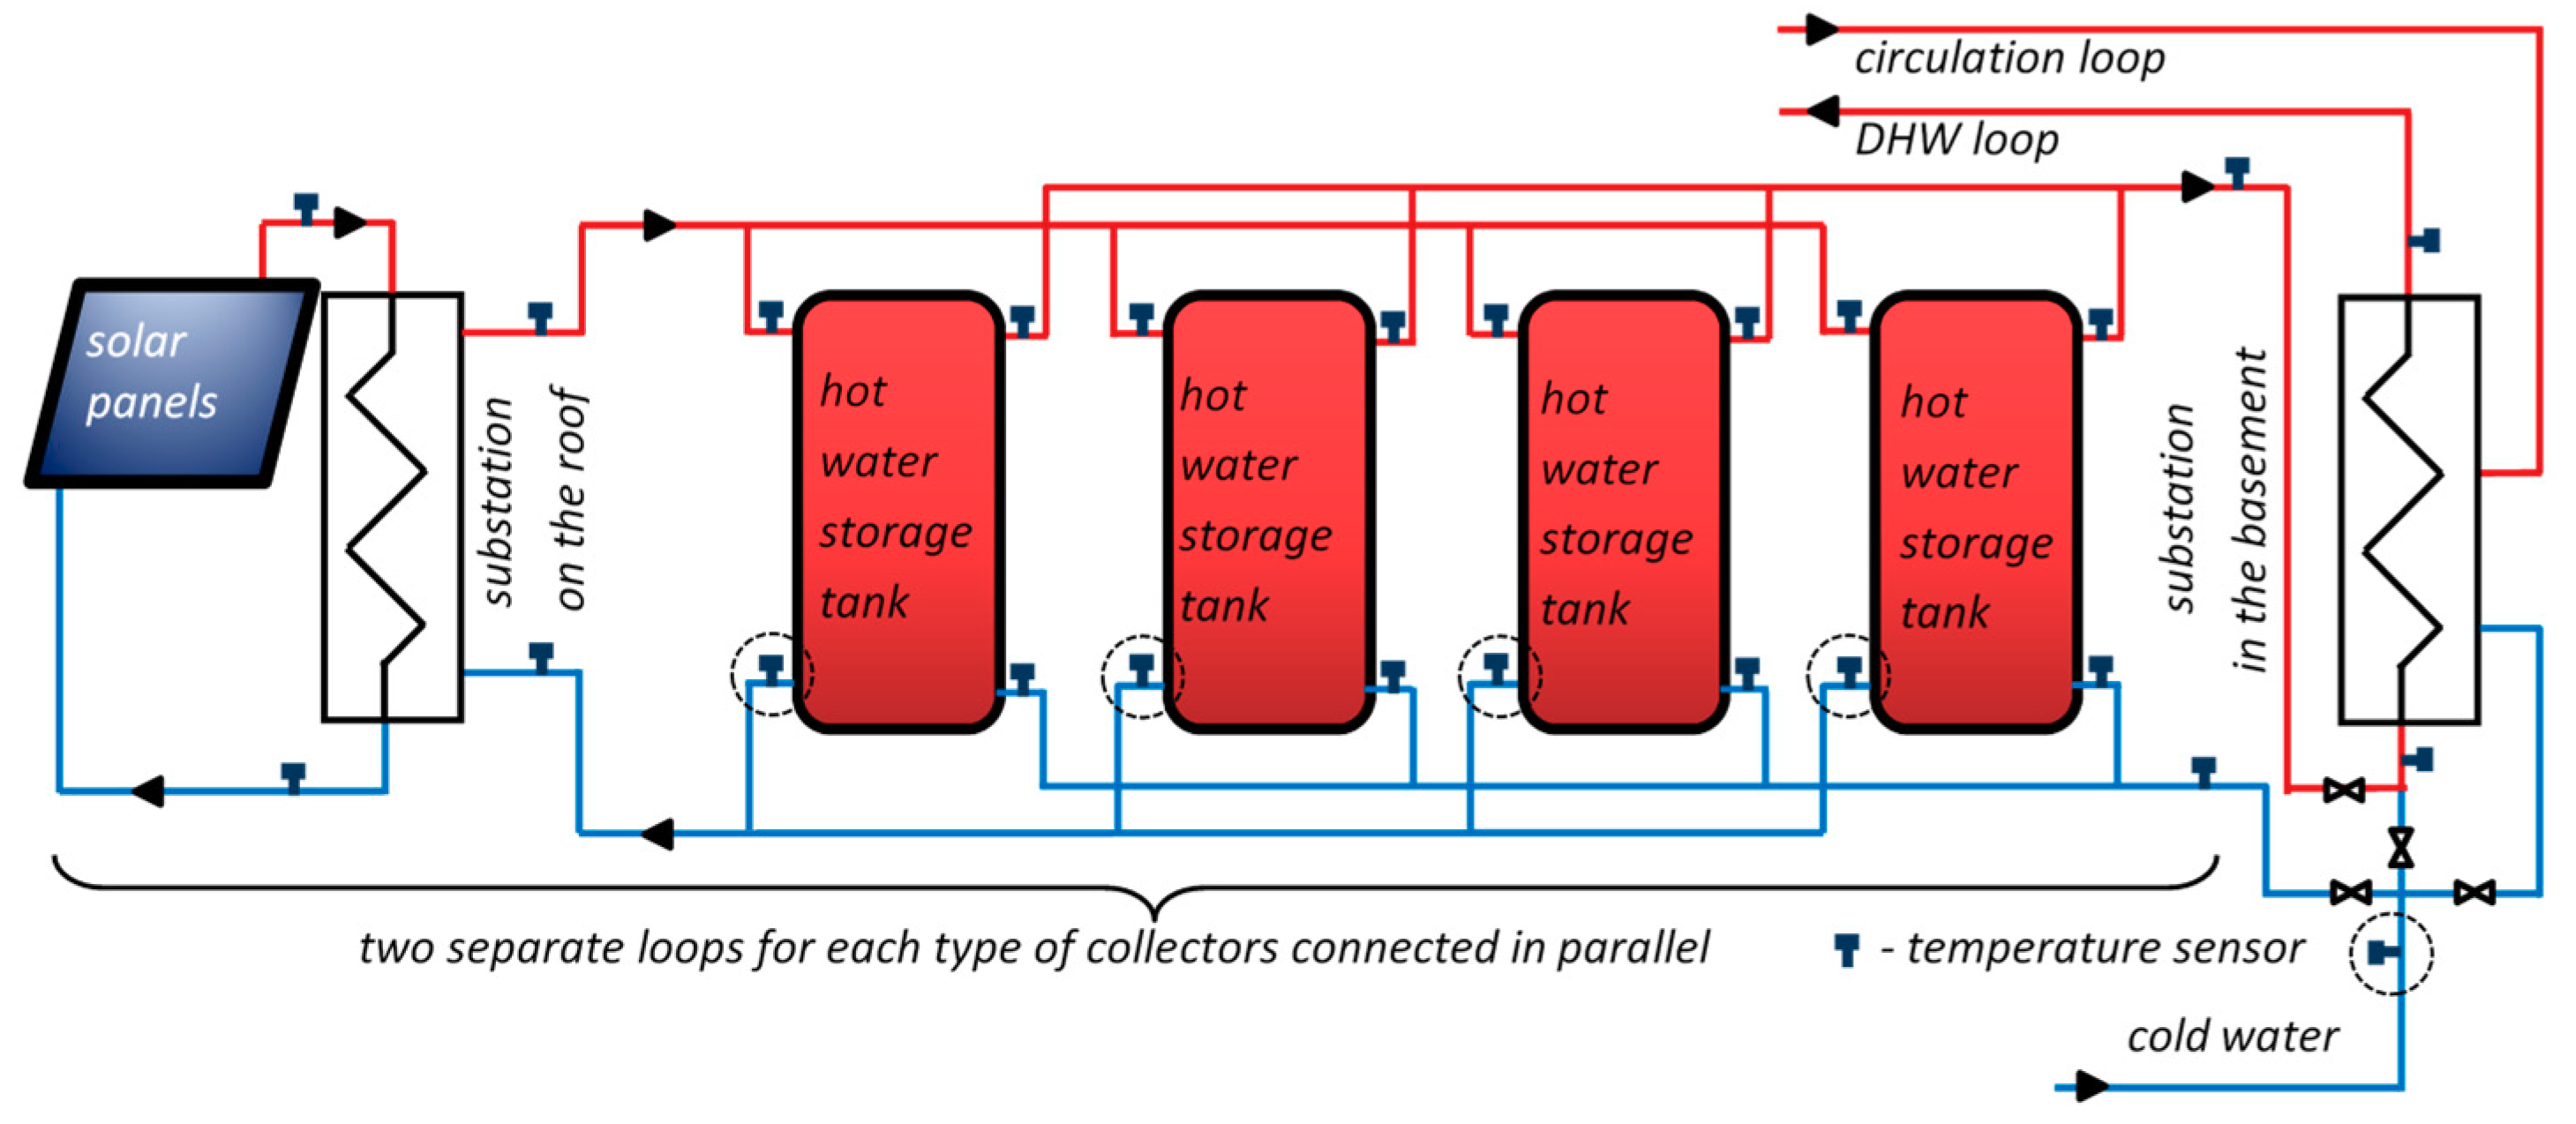
Figure 2 shows a simplified hydraulic diagram of the analysed water heating system supported by solar collectors. This installation is equipped with a measuring system consisting of 17 heat meters, 42 resistance temperature sensors and four recorders of electricity consumption. In addition, the data acquisition system reads the basic parameters of outdoor air and solar radiation every 5 s from a weather station which is located near the collectors. A detailed description of the project and the solar system implemented under this project are included in [
7,
8].
In the first stage, it was decided to develop a model of the SDHW system in the EnergyPlus environment. The following assumptions were made by creating this 3D model:
The SDHW system was composed of solar collectors, storage tanks, pipes connecting devices and an auxiliary water heater.
The main parameters of the solar panels are as shown in
Table 1.
The calculations were made separately for each type of solar collector over a period of 8760 h (all year) with a one-hour time step.
The storage tank features a volume of 4 m3 for each loop, a dead-band temperature difference of 5 °C (an auxiliary energy source switches on when the water temperature in the storage tank is equal the set-point temperature minus the dead-band temperature difference), a loss coefficient to ambient temperature 5.1 of W/K, and a well-mixed water tank model.
Water parameters: hot water is stored at 60 °C; the mixed temperature with tap water is 50°C; the temperature of the network (cold) water is calculated for each month separately based on the method recommended by National Renewable Energy Laboratory (NREL), in which the value of cold water fluctuation is a function of the maximum difference in average monthly temperature and the average annual temperature [
9,
10]; and the annual DHW consumption for the flat plate collector loop of 2501 m
3 and evacuated tube collector loop of 2501 m
3.
Data for a typical meteorological year for the Bialystok station were taken from the EnergyPlus WeatherData programming database from the file POL_Bialystok.122950_IMGW.epw prepared with a one-hour step.
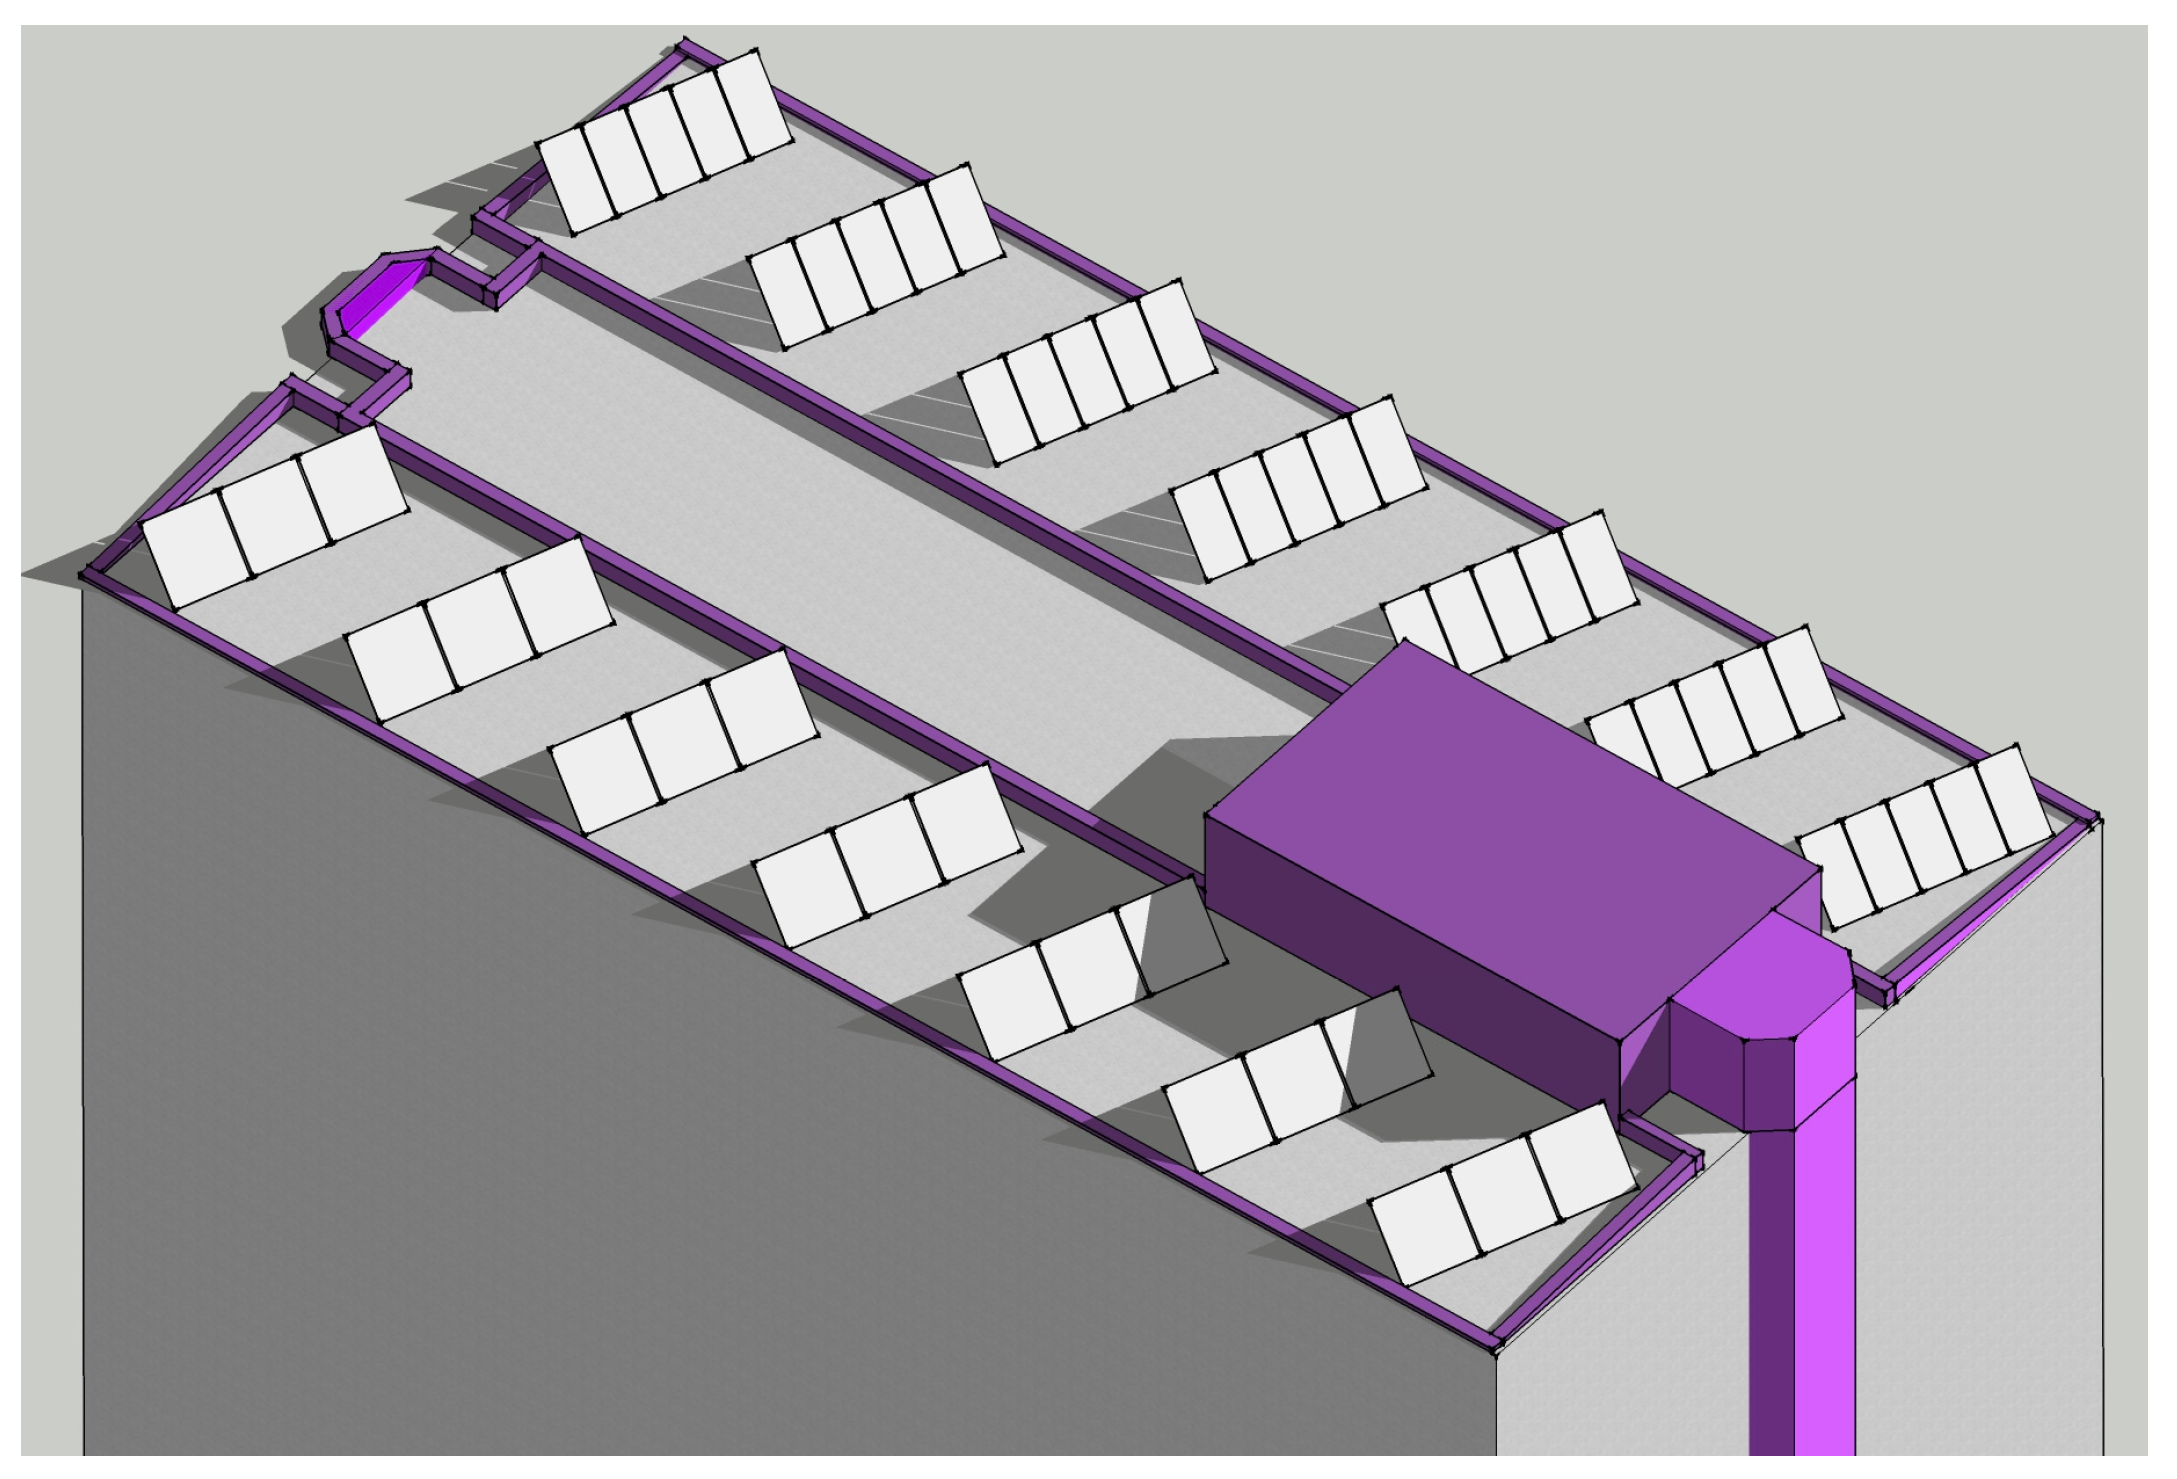
The arrangement of collectors and shading elements assumed in the SDHW model in a 3D view is presented in
Figure 3.
The results of computer calculations were compared with the measurements taken in 2015–2017 to validate the developed model. The difference between the measured amount of energy produced by the solar installation and the calculation results was about 7% for evacuated tube collectors and only from 4% to 5% for flat plate panels. These discrepancies are caused by a greater or lesser match between the actual optical–thermal characteristics and the parameters of the panels given by the manufacturer. However, both values are within the allowable error for this type of energy simulation. Thus, the model can be assessed as accurate for the purpose of all kinds of economic analyses. The detailed procedure and results that were used to evaluate the accuracy of the EnergyPlus model can be found in the doctoral dissertation of Paulina Radzajewska [
11].
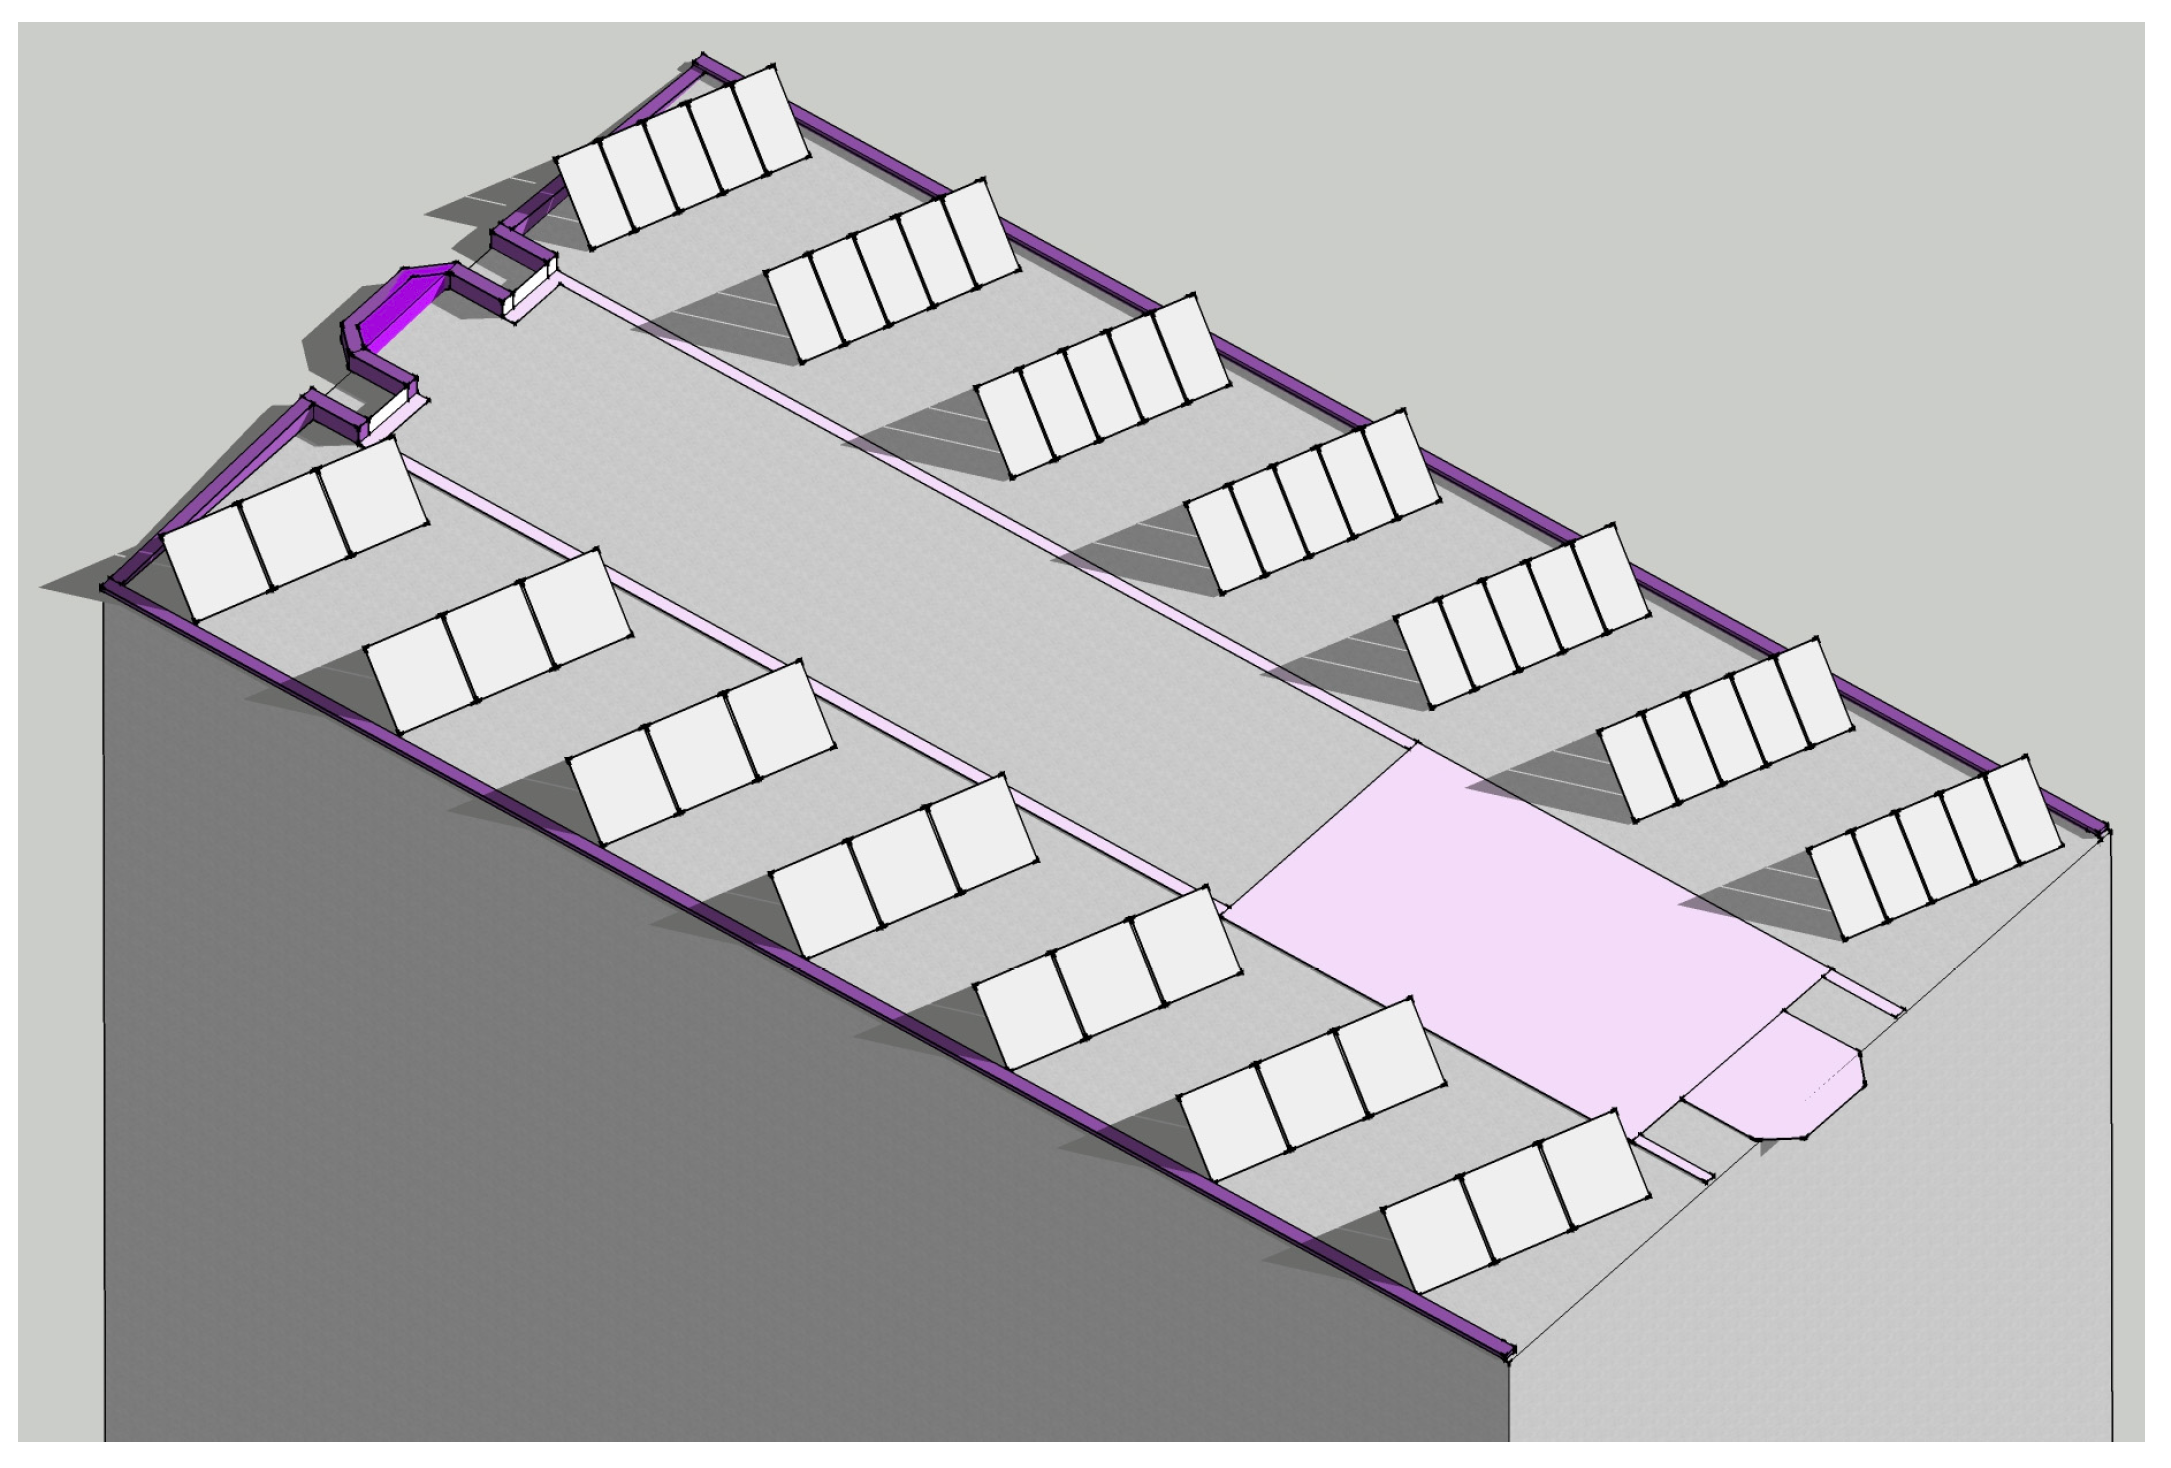
In the next stage of this project, it was decided to estimate the energy yields from the SDHW system in other locations in Poland. All shading elements (
Figure 4) which are located on the roof of the hotel were removed from the model to obtain more objective results.
3. Results and Discussion
The EnergyPlus software (version 8.3) was used to carry out the simulations for 24 locations in Poland. The cities were selected in this way to evenly cover the entire area of the country. The calculation results were collected in the form of a matrix (
Table 2) containing the following parameters:
Annual energy yield per square metre of two types of solar collectors—ESC;
Total solar radiation—ES;
Average annual temperature of the outdoor air—θO.
Table 2 gives
ESC values for 24 cities in Poland. If the designer performs calculations for another location, they must read this value from the contour graph shown in the following part of this chapter.
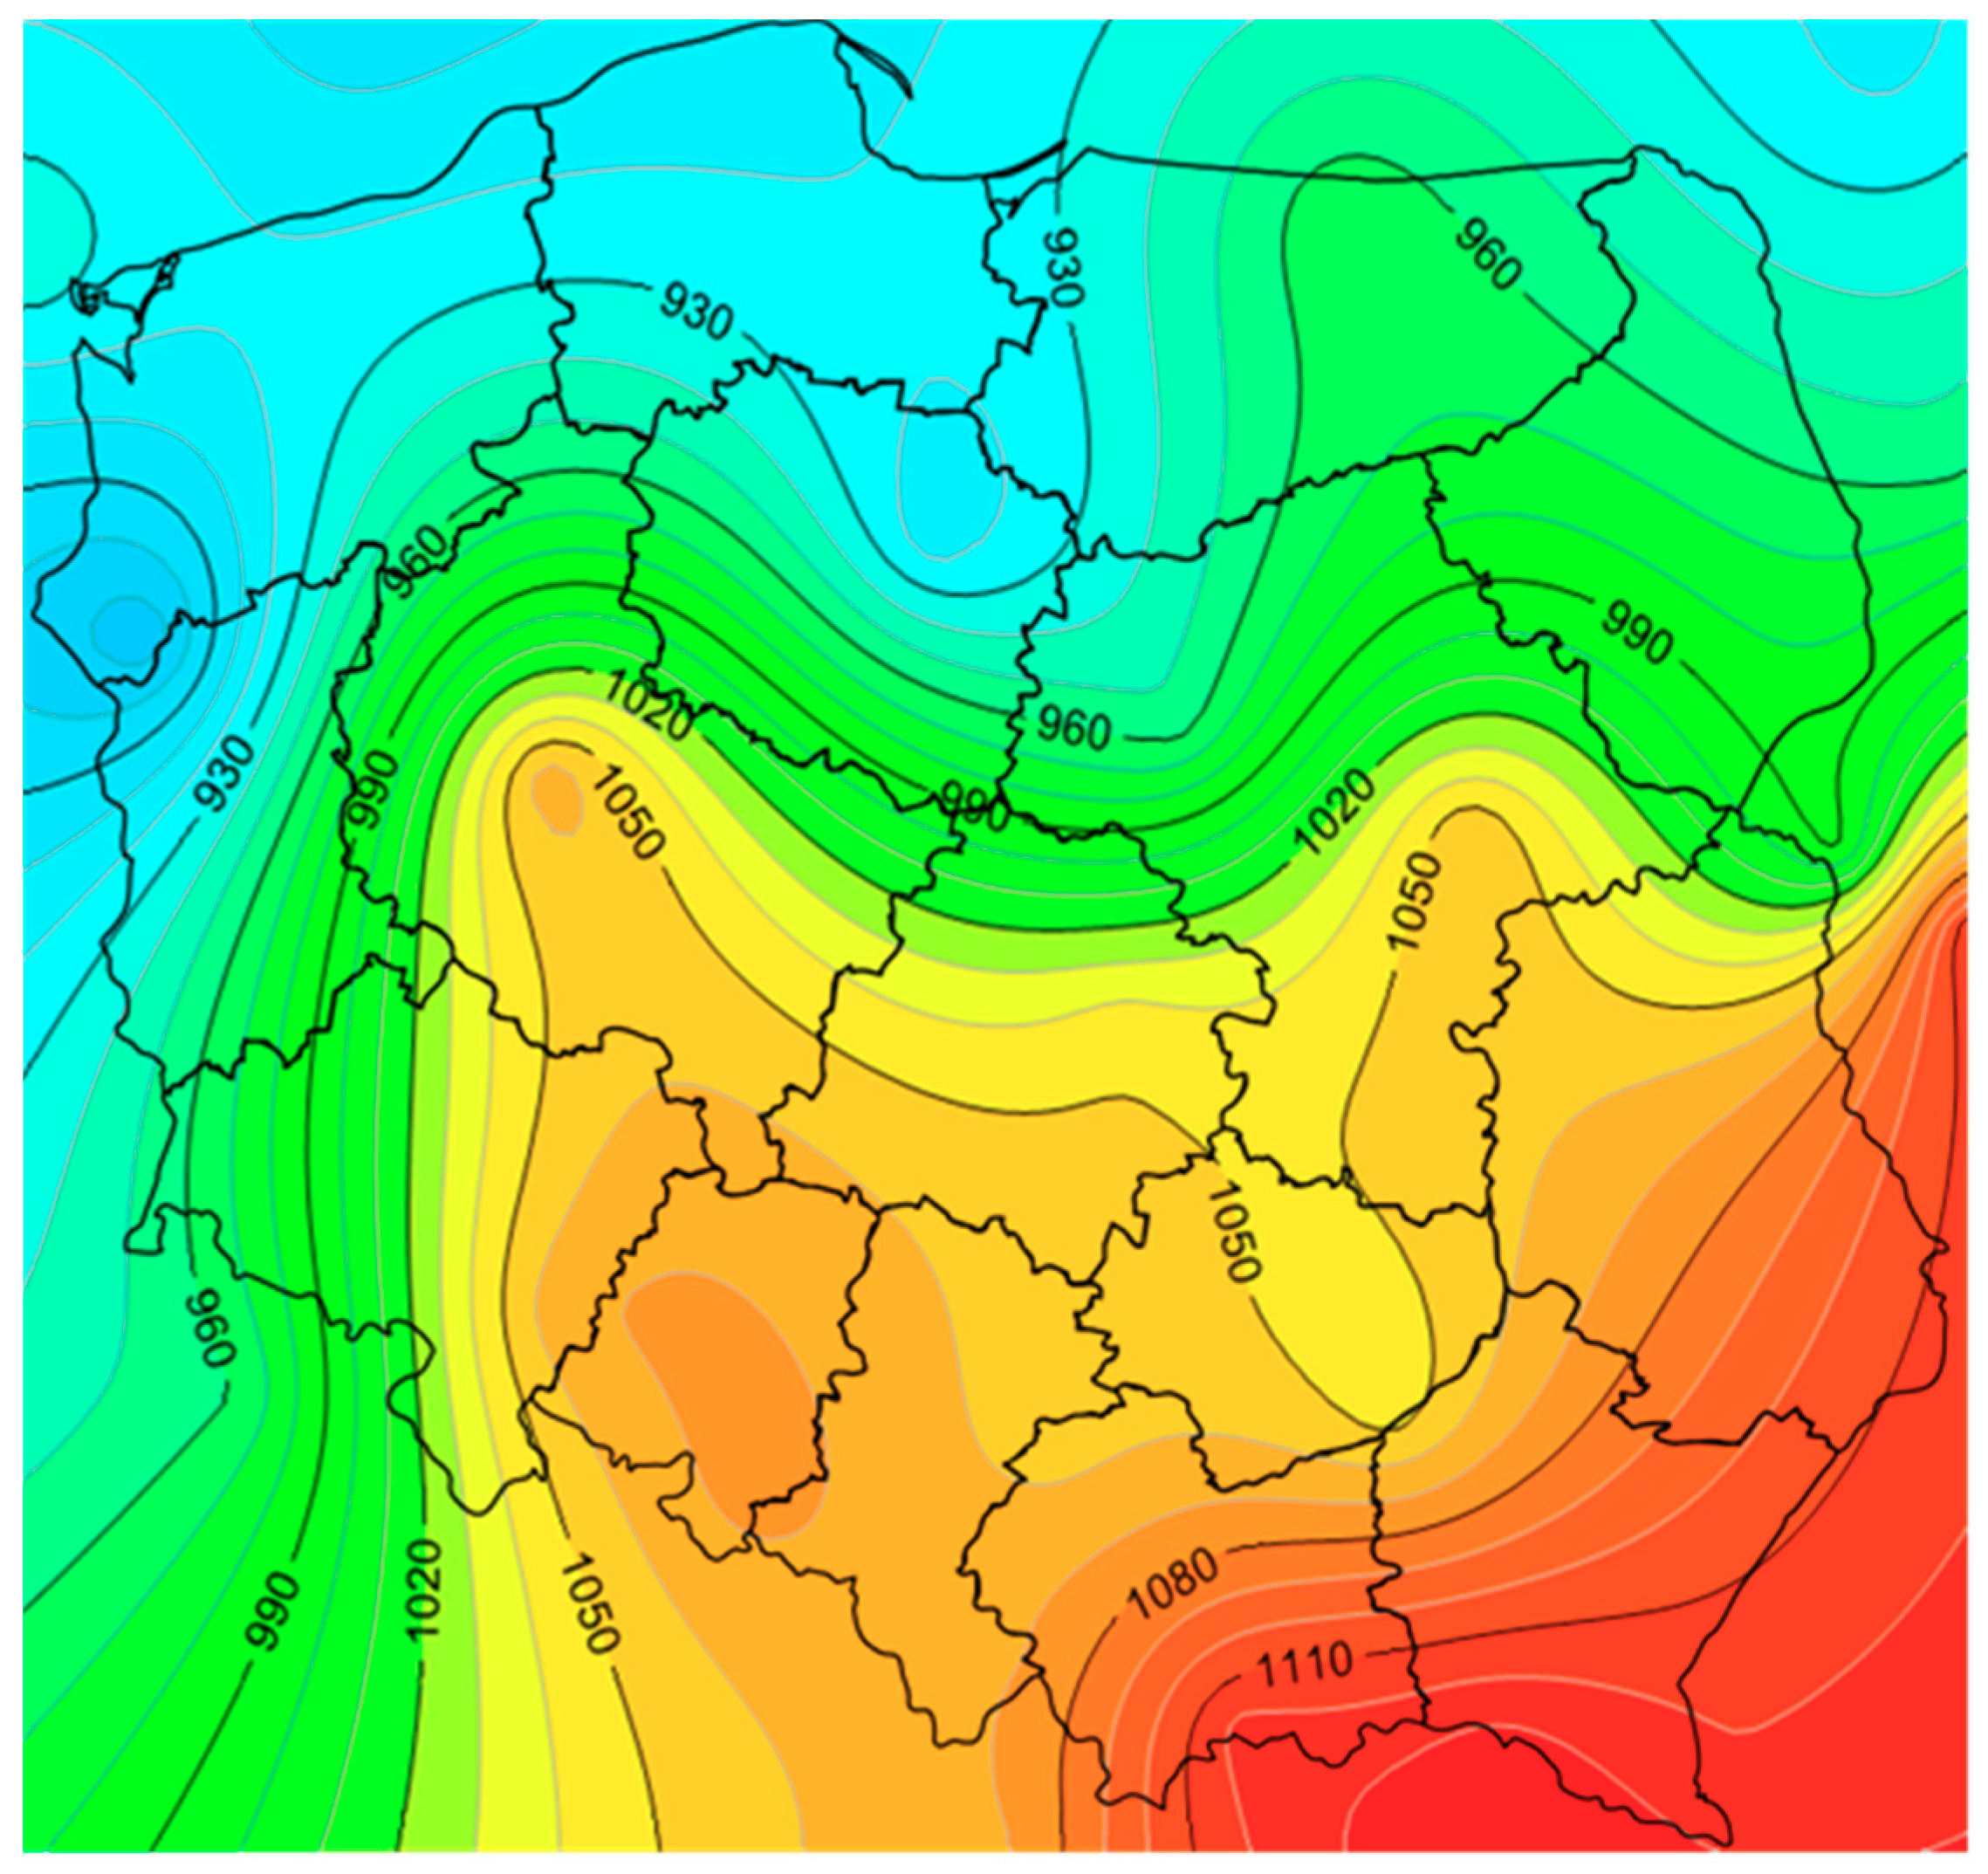
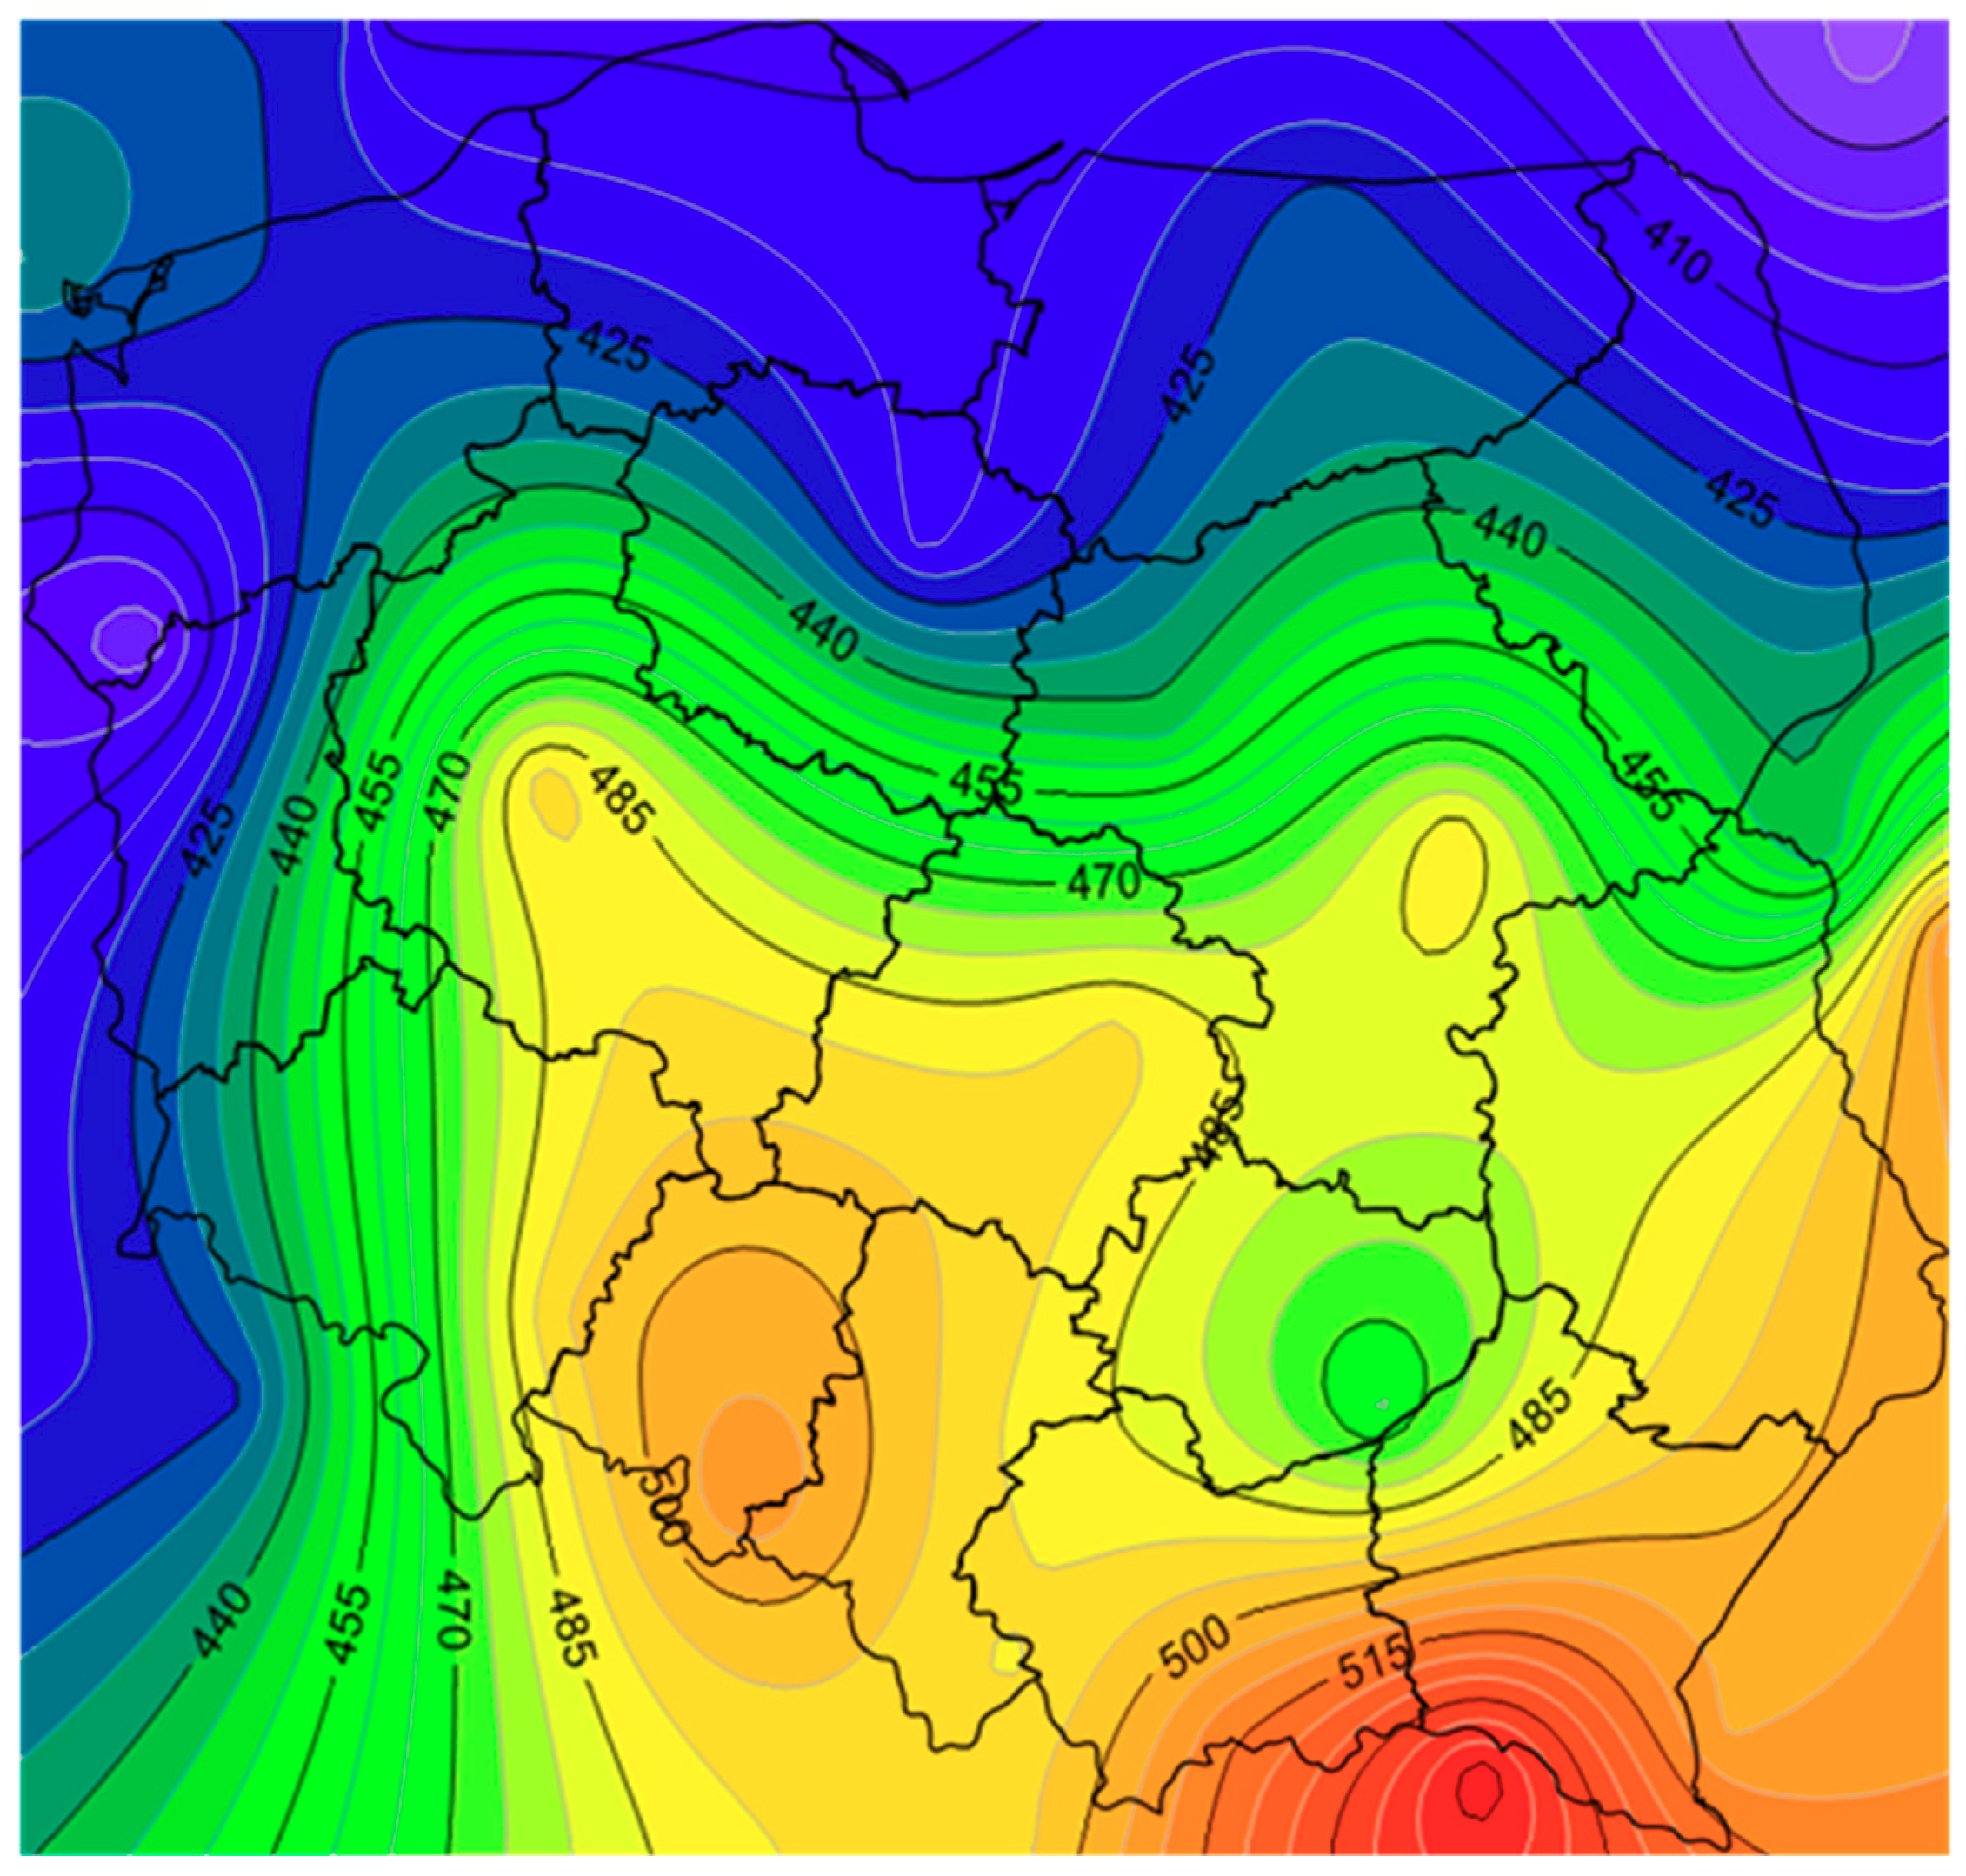
The main parameter affecting the
ESC value is the total solar radiation, which is a function of the latitude and local weather conditions. As can be seen in
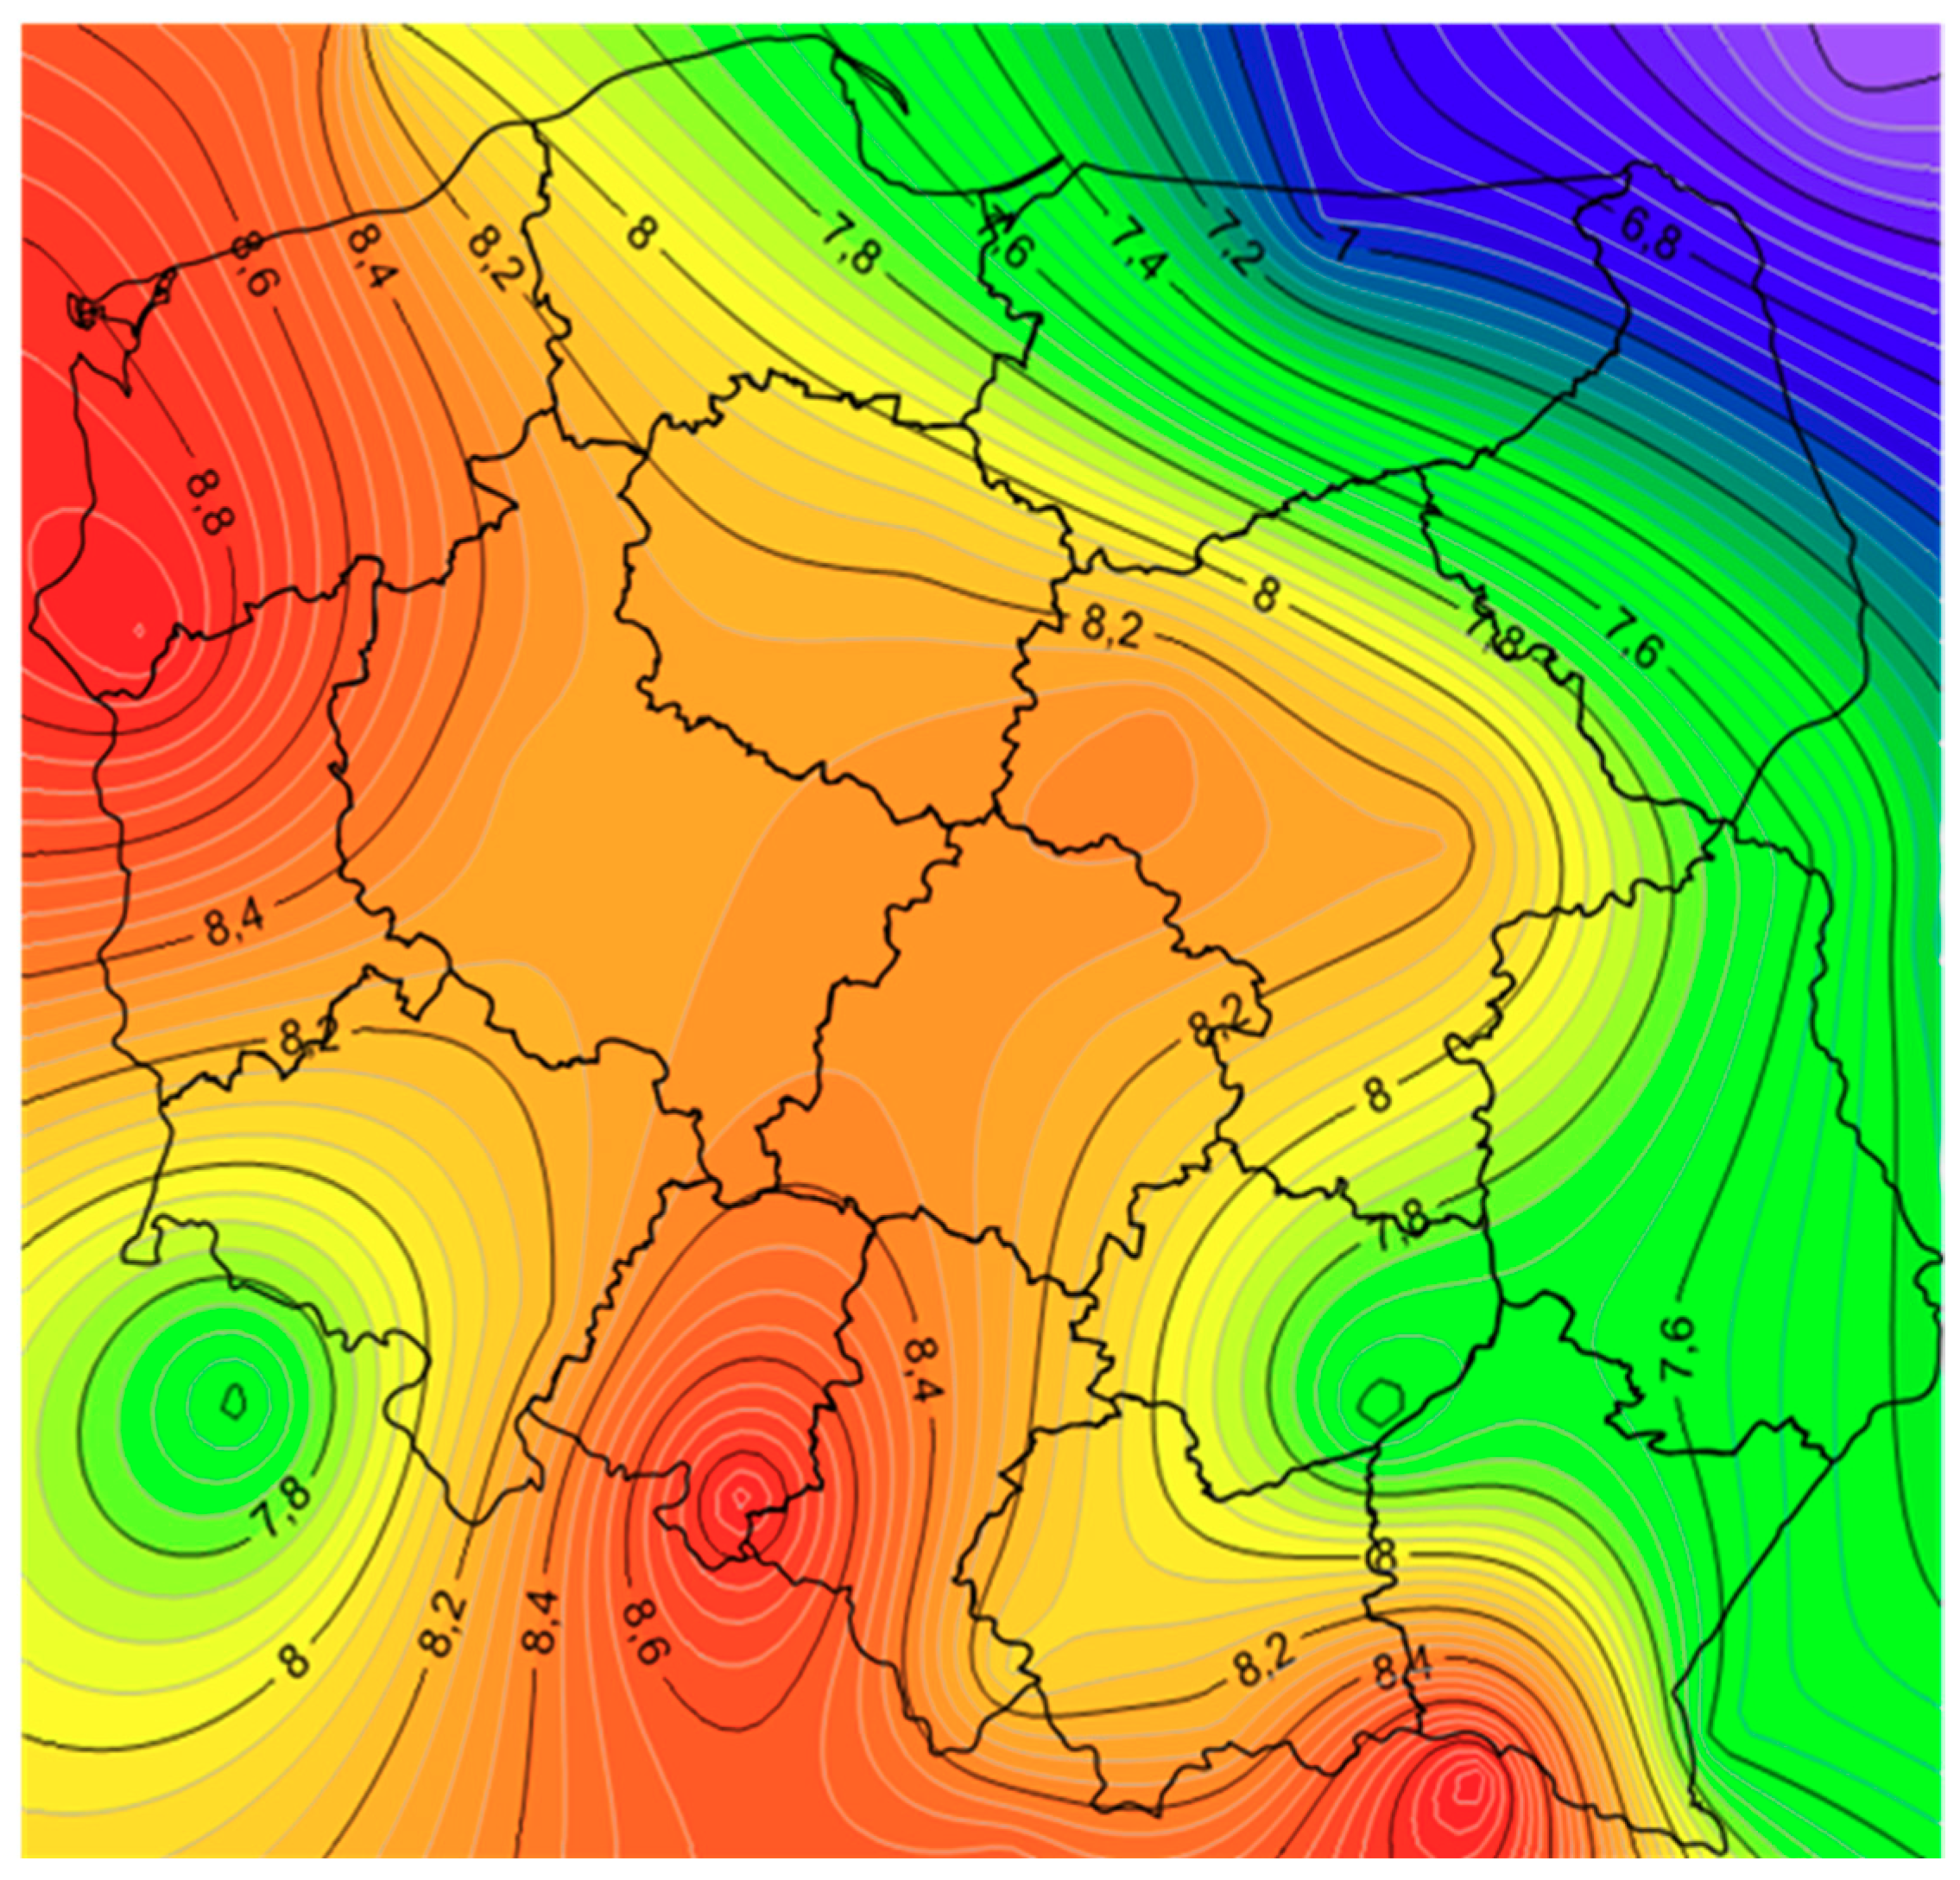
Figure 5, the best conditions in terms of the use of solar collectors occur in the region of south-eastern Poland. The outdoor temperature also affects the efficiency of solar panels, because heat losses depend on it. The distribution of the average annual ambient air temperature in Poland is presented in
Figure 6. As can be seen, the lowest temperature occurs in the north-eastern region, while the highest is in western Poland.
The next step was to develop a function of ES and θO that would allow the calculation of the energy gains from 1 m2 of solar panels. For this purpose, a multiple regression method was applied. This is a statistical method and is used to predict the value of a dependent variable (in this case, ESC) based on the knowledge of the value of two or more independent variables. The regression formula is determined in such a way as to minimize the difference between the modelled (predicted) value and the actual (measured) values using the least squares estimation. As a result of calculations made in Statistica v.13.1 software package (TIBCO Software Inc., Palo Alto, CA, USA), two functions were obtained: Equation (1) for flat plate collectors, and Equation (2) for vacuum tube collectors.
Based on these two functions, the annual energy output for 1 m2 of absorber surface can be determined. Both functions can be used in the following ranges of variable values: an annual total irradiation ES in the range of 873–1140 kWh/m2, and the annual average outdoor temperature θO must be between 6.4 °C and 9 °C. These are the minimum and maximum values for the Polish climate. The use of out-of-range parameters may be associated with an increase in calculation error.
The quality of multiple regression analysis is estimated on the basis of the following two parameters:
The R2 determination coefficient, which is an indicator of the quality of the model’s fit to the data, takes values from the range [0, 1]—a higher R2 value shows that the model is better fitted;
The correlation coefficient R, which is the square root of the coefficient of determination. Its value expresses the degree to which two or more independent variables are related to the dependent variable, taking values from 0 to 1 (where 0 means no correlation, and 1 indicates an ideal linear relationship).
In this case, the determination coefficient R2 was 0.986 (R = 0.993) for Equation (1) and R2 was 0.987 (R = 0.994) for Equation (2). Thus, it can be said that the quality of the fit of these two regressions is at a high level.
It should be noted that the method proposed here is based on the results of measurements that were carried out for a specific system. In this case, the angle of inclination of the collectors is 40°. Its change can affect the amount of converted solar energy. This kind of analysis was made by Zukowski and presented in [
12]. It has been proven that a change in the tilt angle between 30° and 40° causes a change in the amount of energy yield by only 2.8%, and a change between 40° and 50° reduces this value by less than 5.6%. Thus, it can be stated that this is a small value and falls within the allowable error in engineering calculations.
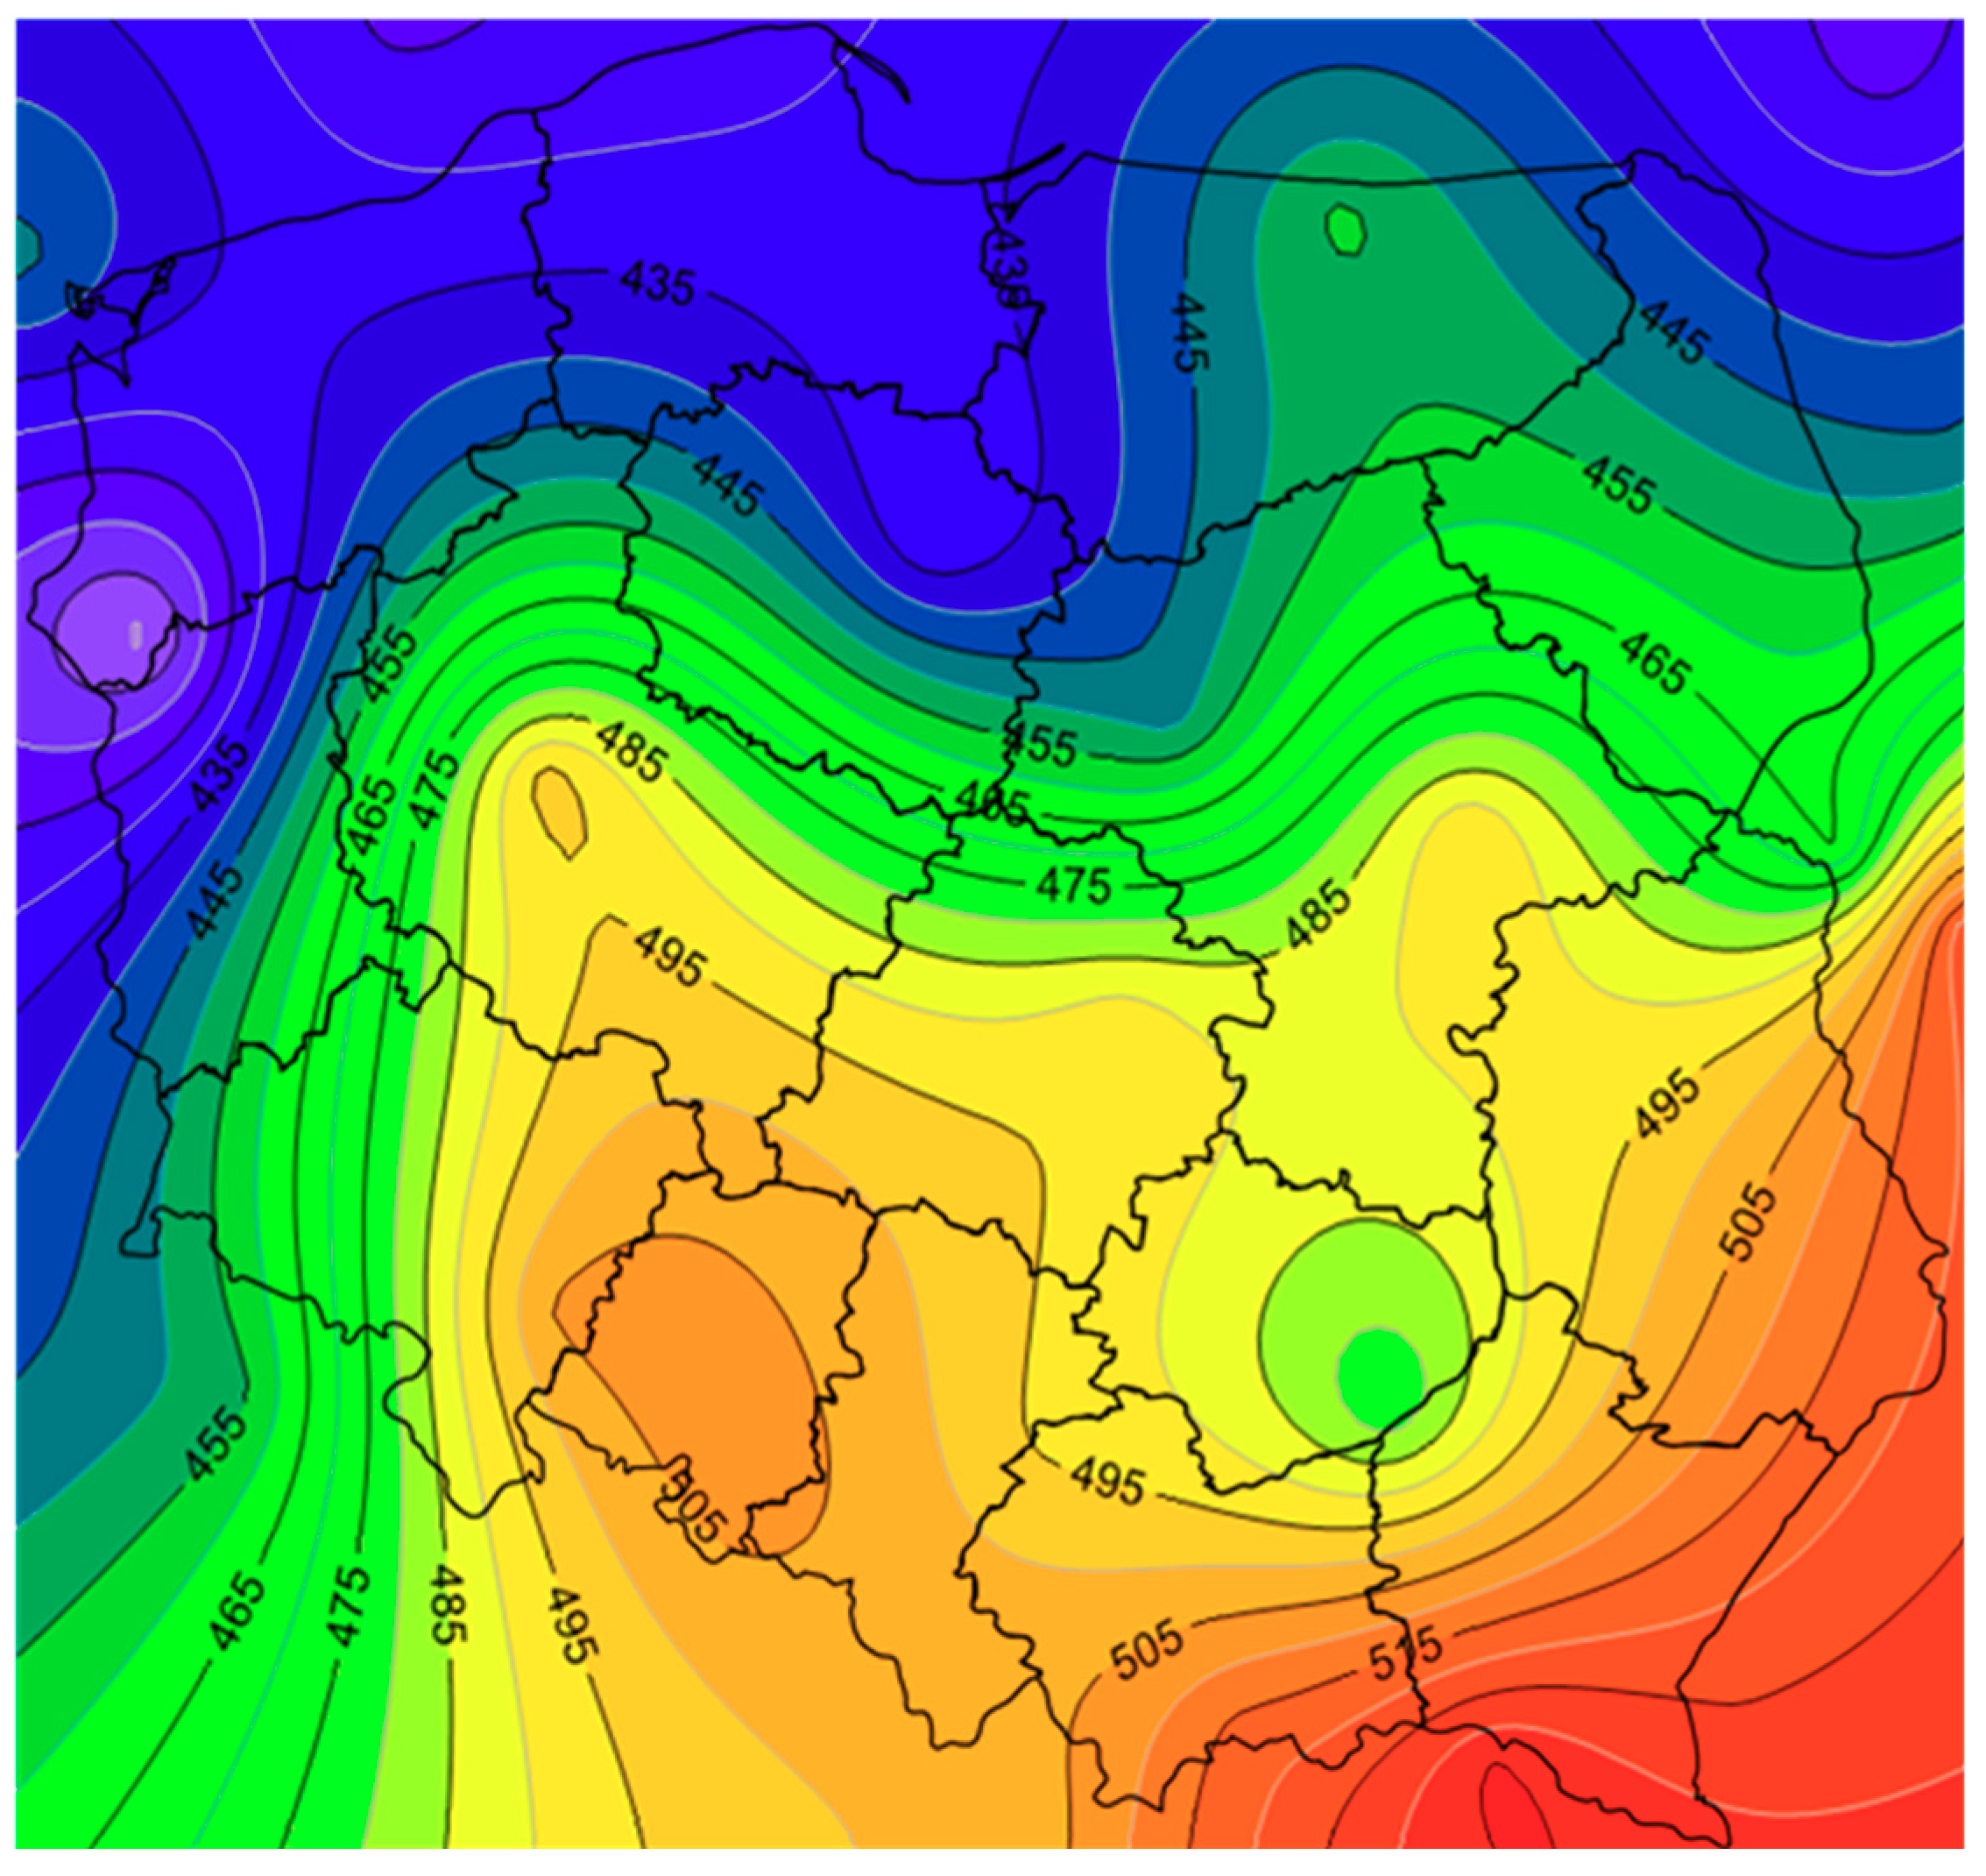
To estimate the amount of energy output from solar panels for locations not listed in
Table 2, one can use the two contour graphs specially created for this purpose.
Figure 7 shows the distribution of
ESC in Poland referring to flat plate panels, and
Figure 8 applies to evacuated tube collectors.
The procedure for estimating the required area or number of solar collectors based on the Esc value is described below.
After determining the demand of domestic hot water
EDHW and the solar fraction coefficient [
8] and calculating the
Esc value from Equation (1) or Equation (2), one can determine the required area of solar collectors
:
The annual energy output (
Figure 7 and
Figure 8) is estimated for a specific type of solar collector. If other devices are applied, the
factor must be calculated. This is defined by Equation (4) as the ratio of the yearly potential of solar energy yields. As the numerator, we have used the value for the designed solar panel
, and as the denominator, we have used the value for the base collector
equal to 525 kWh/year, which should be inserted. The “based” index in Equation (4) refers to the characteristics of the solar collectors (
Table 1) that were used to develop this method, and the value of 525 kWh/year was estimated by the Institut fur Solarenenergieforschung GmbH Hameln.
The annual solar coverage factor (
SCF) in Equation (5) can be defined as
where
The assumption of the optimal value of the
SCF factor is a key element in the correct design of the SDHW system [
13]. It depends on many parameters which are sometimes difficult to predict. Mostly designers assume an
SCF value between 40% and 60%. This factor has lower values for tall buildings due to the small roof area in relation to the number of inhabitants [
8]. In the case of a very good intensity of solar radiation, sometimes even 100% energy coverage for hot water by the solar collector system is analysed [
14].
Based on the next relationship, one can specify the amount of energy that is used to heat up the hot water:
where
VDHW—annual consumption of the hot water (m3);
cP—heat capacitance of the water (J/kg/K);
ρCW—density of the water (kg/m3);
θDHW—DHW temperature (°C);
θCW—cold water temperature (°C).
The value of the potential annual energy output is estimated in kWh per year for each type of solar collector in attestations issued by certified research laboratories.
In the last step of this procedure, the required number of collectors
nSC can be calculated after determining the absorber surface
:
Based on the results of research from 2015 to 2017, it can be concluded that, in the period from April to September, flat solar collectors provided 83% of total annual energy yield, while evacuated tube collectors provided 79%. Thus, in a cool half-year period—i.e., from October to March—the performance of the system is very poor. This conclusion applies to the climatic conditions of Poland. Additionally, the authors propose the following “seasonal” approach to design that allows a further increase in the accuracy of calculations. The annual energy yield ESC of flat plate solar collectors can be multiplied by 0.83 and 0.79 in the case of evacuated tube panels. It should be noted that, during the calculation of EDHW (Equation (6)), we have to take only half of its value.
The hot water temperature affects the overall performance of a solar collector system. However, the authors did not analyze this issue because the DHW temperature was assumed in accordance with the standard EN 12831-3 [
15].
The method described above can be used as part of the procedure when designing SDHW systems and also for an economic analysis of this type of solar installations.


