Article

Threshold Pore Pressure Gradients in Water-Bearing Tight Sandstone Gas Reservoirs

1
Department of Thermal Science and Energy Engineering, University of Science and Technology of China, Hefei 230026, Anhui, China
2
Exploration and Development Research Institute, Shengli Oilfield Company, SINOPEC, Dongying 257015, Shandong, China
3
School of Petrochemical & Energy Engineering, Zhejiang Ocean University, Zhoushan 316022, Zhejiang, China
4
United National-Local Engineering Laboratory of Harbor Oil & Gas Storage and Transportation Technology, Zhejiang Ocean University, Zhoushan 316022, Zhejiang, China
*
Author to whom correspondence should be addressed.
Energies 2019, 12(23), 4578; https://doi.org/10.3390/en12234578
Submission received: 22 October 2019 / Revised: 28 November 2019 / Accepted: 29 November 2019 / Published: 1 December 2019

Abstract

:
Tight gas reservoirs commonly occur in clastic formations having a complex pore structure and a high water saturation, which results in a threshold pressure gradient (TPG) for gas seepage. The micropore characteristics of a tight sandstone gas reservoir (Tuha oilfield, Xinjiang, China) were studied, based on X-ray diffraction, scanning electron microscopy and high pressure mercury testing. The TPG of gas in cores of the tight gas reservoir was investigated under various water saturation conditions, paying special attention to core permeability and water saturation impact on the TPG. A mathematical TPG model applied a multiple linear regression method to evaluate the influence of core permeability and water saturation. The results show that the tight sandstone gas reservoir has a high content of clay minerals, and especially a large proportion of illite–smectite mixed layers. The pore diameter is distributed below 1 micron, comprising mesopores and micropores. With a decrease of reservoir permeability, the number of micropores increases sharply. Saturated water tight cores show an obvious non-linear seepage characteristic, and the TPG of gas increases with a decrease of core permeability or an increase of water saturation. The TPG model has a high prediction accuracy and shows that permeability has a greater impact on TPG at high water saturation, while water saturation has a greater impact on TPG at low permeability.

Graphical Abstract

1. Introduction

Tight gas reservoirs have been the highest potential exploration and development field of natural gas in China [1,2]. The resources of tight gas reservoirs are abundant in China, and mainly distributed in Sichuan, Ordos, Songliao, Qaidam, Bohai Bay, Tarim and Junggar basins [3,4]. In recent years, the productions of tight gas reservoirs in China have been increasing year by year, and nearly 80% of the newly proved reserves of PetroChina are in tight gas reservoirs [5]. Therefore, the efficient development of tight gas reservoirs has been of great significance to the development of China’s natural gas industry. Tight gas reservoirs have a complex structural characteristic of low permeability and porosity. Compared with the conventional reservoirs which are mainly developed with millimeter–micron pore throats, the pore throats in tight gas reservoirs are mainly developed with the order of micron to nanometer, which strongly affects the seepage ability of gas in tight gas reservoirs [6]. In addition, it also has a characteristic of high water saturation in tight gas reservoirs, the influence of water saturation on gas seepage is very significant, and a complex relationship between water and gas will be formed [7]. The water in the pores of tight gas reservoirs forms a thin hydration film at the small pore throats, or small water droplets gather and block at the throats to produce the Jamin effect of gas seepage, which will increase the seepage resistance of gas [8,9,10]. These make gas seepage show a characteristic of non-linear seepage and a threshold pressure gradient (TPG) phenomenon in water-bearing tight gas reservoirs [11,12]. Therefore, on the basis of recognizing their micropore structures, it is necessary to study the TPG characteristic of gas in water-bearing tight gas reservoirs.
The TPG of gas in water-bearing tight gas reservoirs has been accepted by most scholars, and a lot of researches have been carried out. Wojnarowski et al. [13] performed lots of liquid and gas permeability measurements on rock samples, contrasted the values of water and corrected-gas permeability, and found that water permeability was overestimated by Klinkenberg permeability, with difference in range of 11–24%. Tanikawa et al. [14] studied intrinsic permeability of sedimentary rocks using nitrogen gas and distilled water, found that gas permeability was greater than water permeability, increasing with an increase of pore pressure. Song et al. [15] investigated the influences of permeability heterogeneity on production characteristics in water-bearing tight gas reservoirs, established the productivity mathematical model considering the TPG, and found that the impact of TPG in water-bearing tight gas reservoirs could not be ignored to obtain the accurate well productivity. Zeng et al. [16] presented a novel linear seepage model to analyze transient rate and pressure of multifractured horizontal wells in heterogeneous tight sand reservoirs considering the TPG, and found that the small TPG values had a tiny effect on the well performance, and but the relatively large TPG values should not be neglected because of the influence on well production in the reservoir simulation process. Tian et al. [17] investigated the different influencing factors of the TPG in water-bearing tight sandstone gas reservoirs and found that the TPG values increased exponentially with either an increase of water saturation or a decrease of core permeability. Ding et al. [18] performed an experimental approach to investigate the TPG in tight gas reservoirs with high water saturation, demonstrating that a phenomenon of ‘Dynamic TPG Effect’ existed in the development process of tight gas reservoir, and that the TPG of tight gas reservoirs was influenced by pore pressure, namely, the TPG increased with a decrease of pore pressure. However, these studies did not investigate the quantitative relationship between the TPG and interfering factors.
Therefore, in this paper, the micropore characteristics of core samples obtained from a tight sandstone gas reservoir (Tuha oilfield, Xinjiang, China) were studied by using X-ray diffraction (XRD), scanning electron microscopy (SEM), and high pressure mercury porosimetry. The seepage law curves of gas in cores of the tight gas reservoir were determined under different water saturation conditions, taking note of core permeability and water saturation effect on the seepage law curves. The TPG values of gas in tight sandstone gas reservoir were calculated using a data processing method proposed by Feng [19]. A mathematical TPG model was established by a multiple linear regression method to estimate the impact of core permeability and water saturation. The above researches will be expected to provide reference and basis for correctly understanding the micropore structures and the TPG characteristics in water-bearing tight sandstone gas reservoirs.

2. Materials and Methods

2.1. Materials

Potassium chloride, sodium sulphate, calcium chloride, magnesium chloride and sodium bicarbonate, which were reagents of analytical grade, were purchased from Sinopharm Chemical Reagent Co., Ltd., Beijing, China for preparation of simulated formation water. All the solutions were newly prepared using distilled water. Nine cores were obtained from a tight gas reservoir (Tuha oilfield, Xinjiang, China) to carry out seepage experiments, and their parameters are shown in Table 1. The synthetic formation water used for the seepage experiments was a brine with a total dissolved solids (TDS) value of 16,303 mg/L, where the mass concentrations of K+ + Na+, Ca2+, Mg2+, HCO3, Cl and SO42− were 5821, 107, 107, 1770, 8304 and 194 mg/L, respectively. The type of formation water is NaHCO3, and its pH value is 7.0. The experimental gas was nitrogen with purity greater than 99.999% and was purchased from a local supplier.

2.2. Characterizations of Tight Cores

The mineral compositions of the tight cores were detected using a D8 Discover X-ray diffractometer. The micromorphologies of the tight cores were recorded on a Tescan Vega II scanning electron microscope. The pore distribution curves of the tight cores were performed on an AutoPore 9510-IV mercury porosimeter with pressure ranging from 0 to 100 MPa. Tight cores with the lengths of 2.0 cm and the diameters of 2.5 cm were used for the pore distribution measurement.

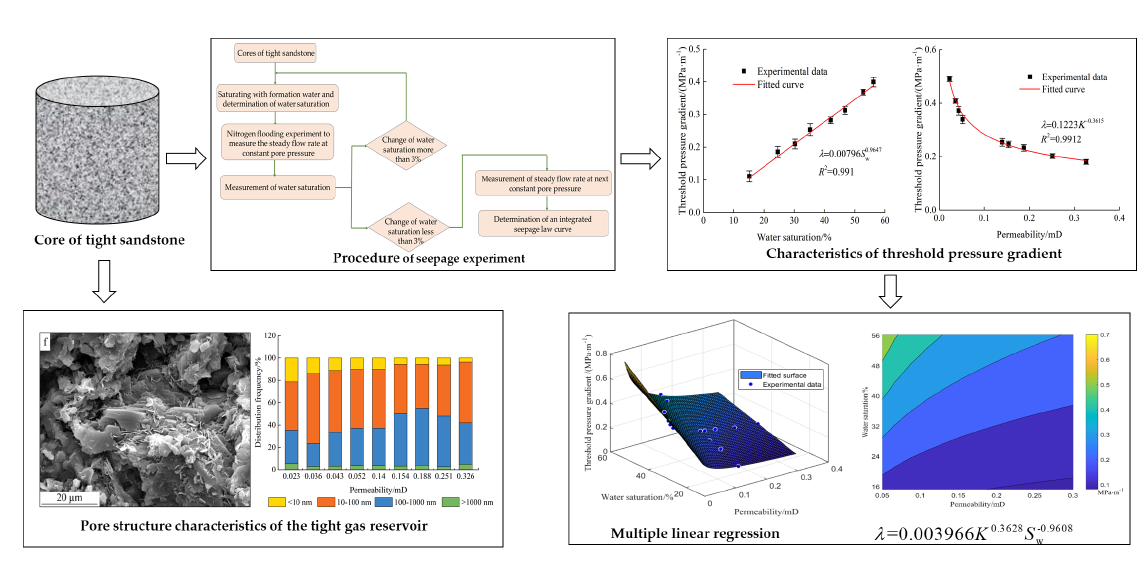
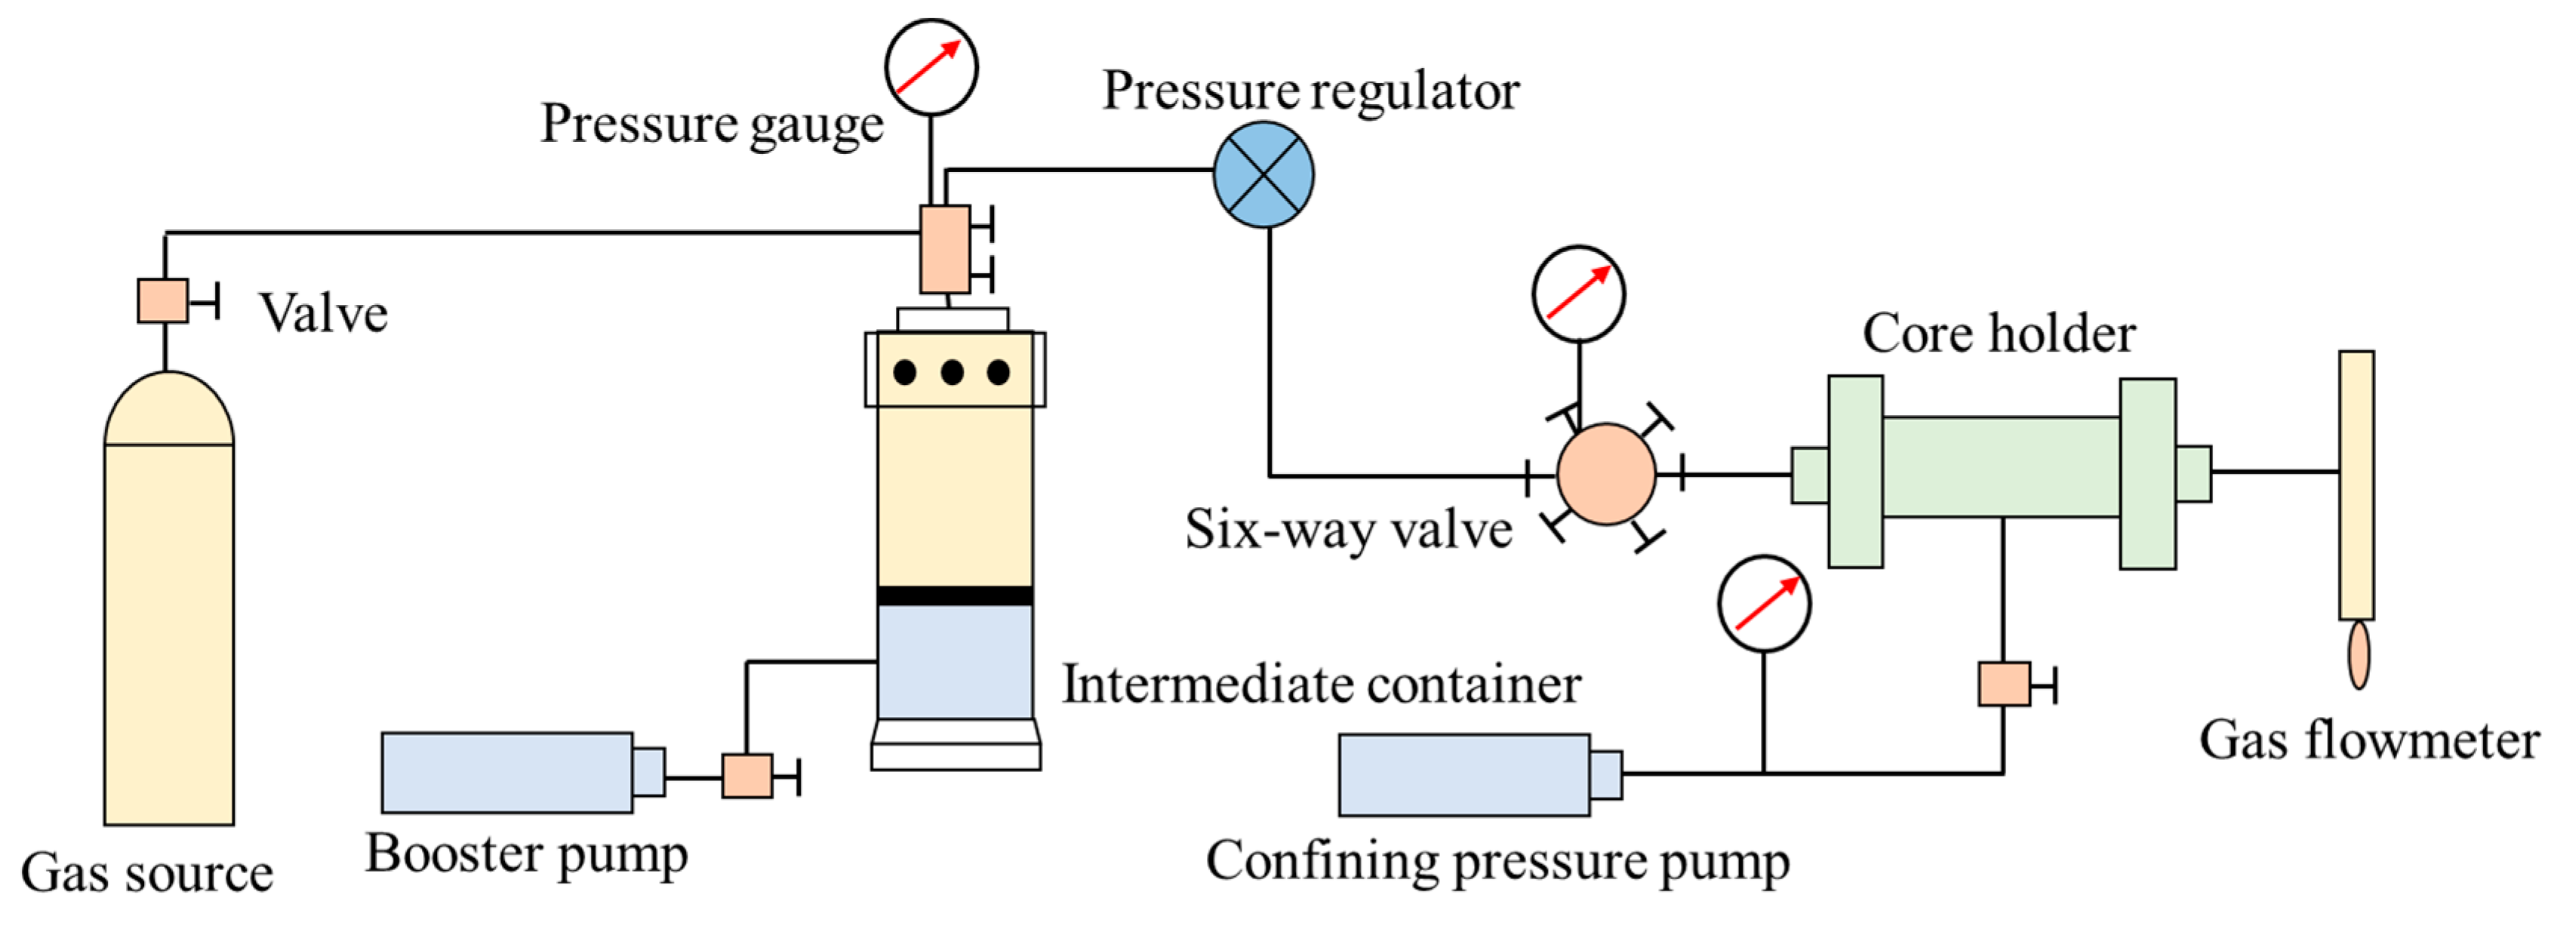
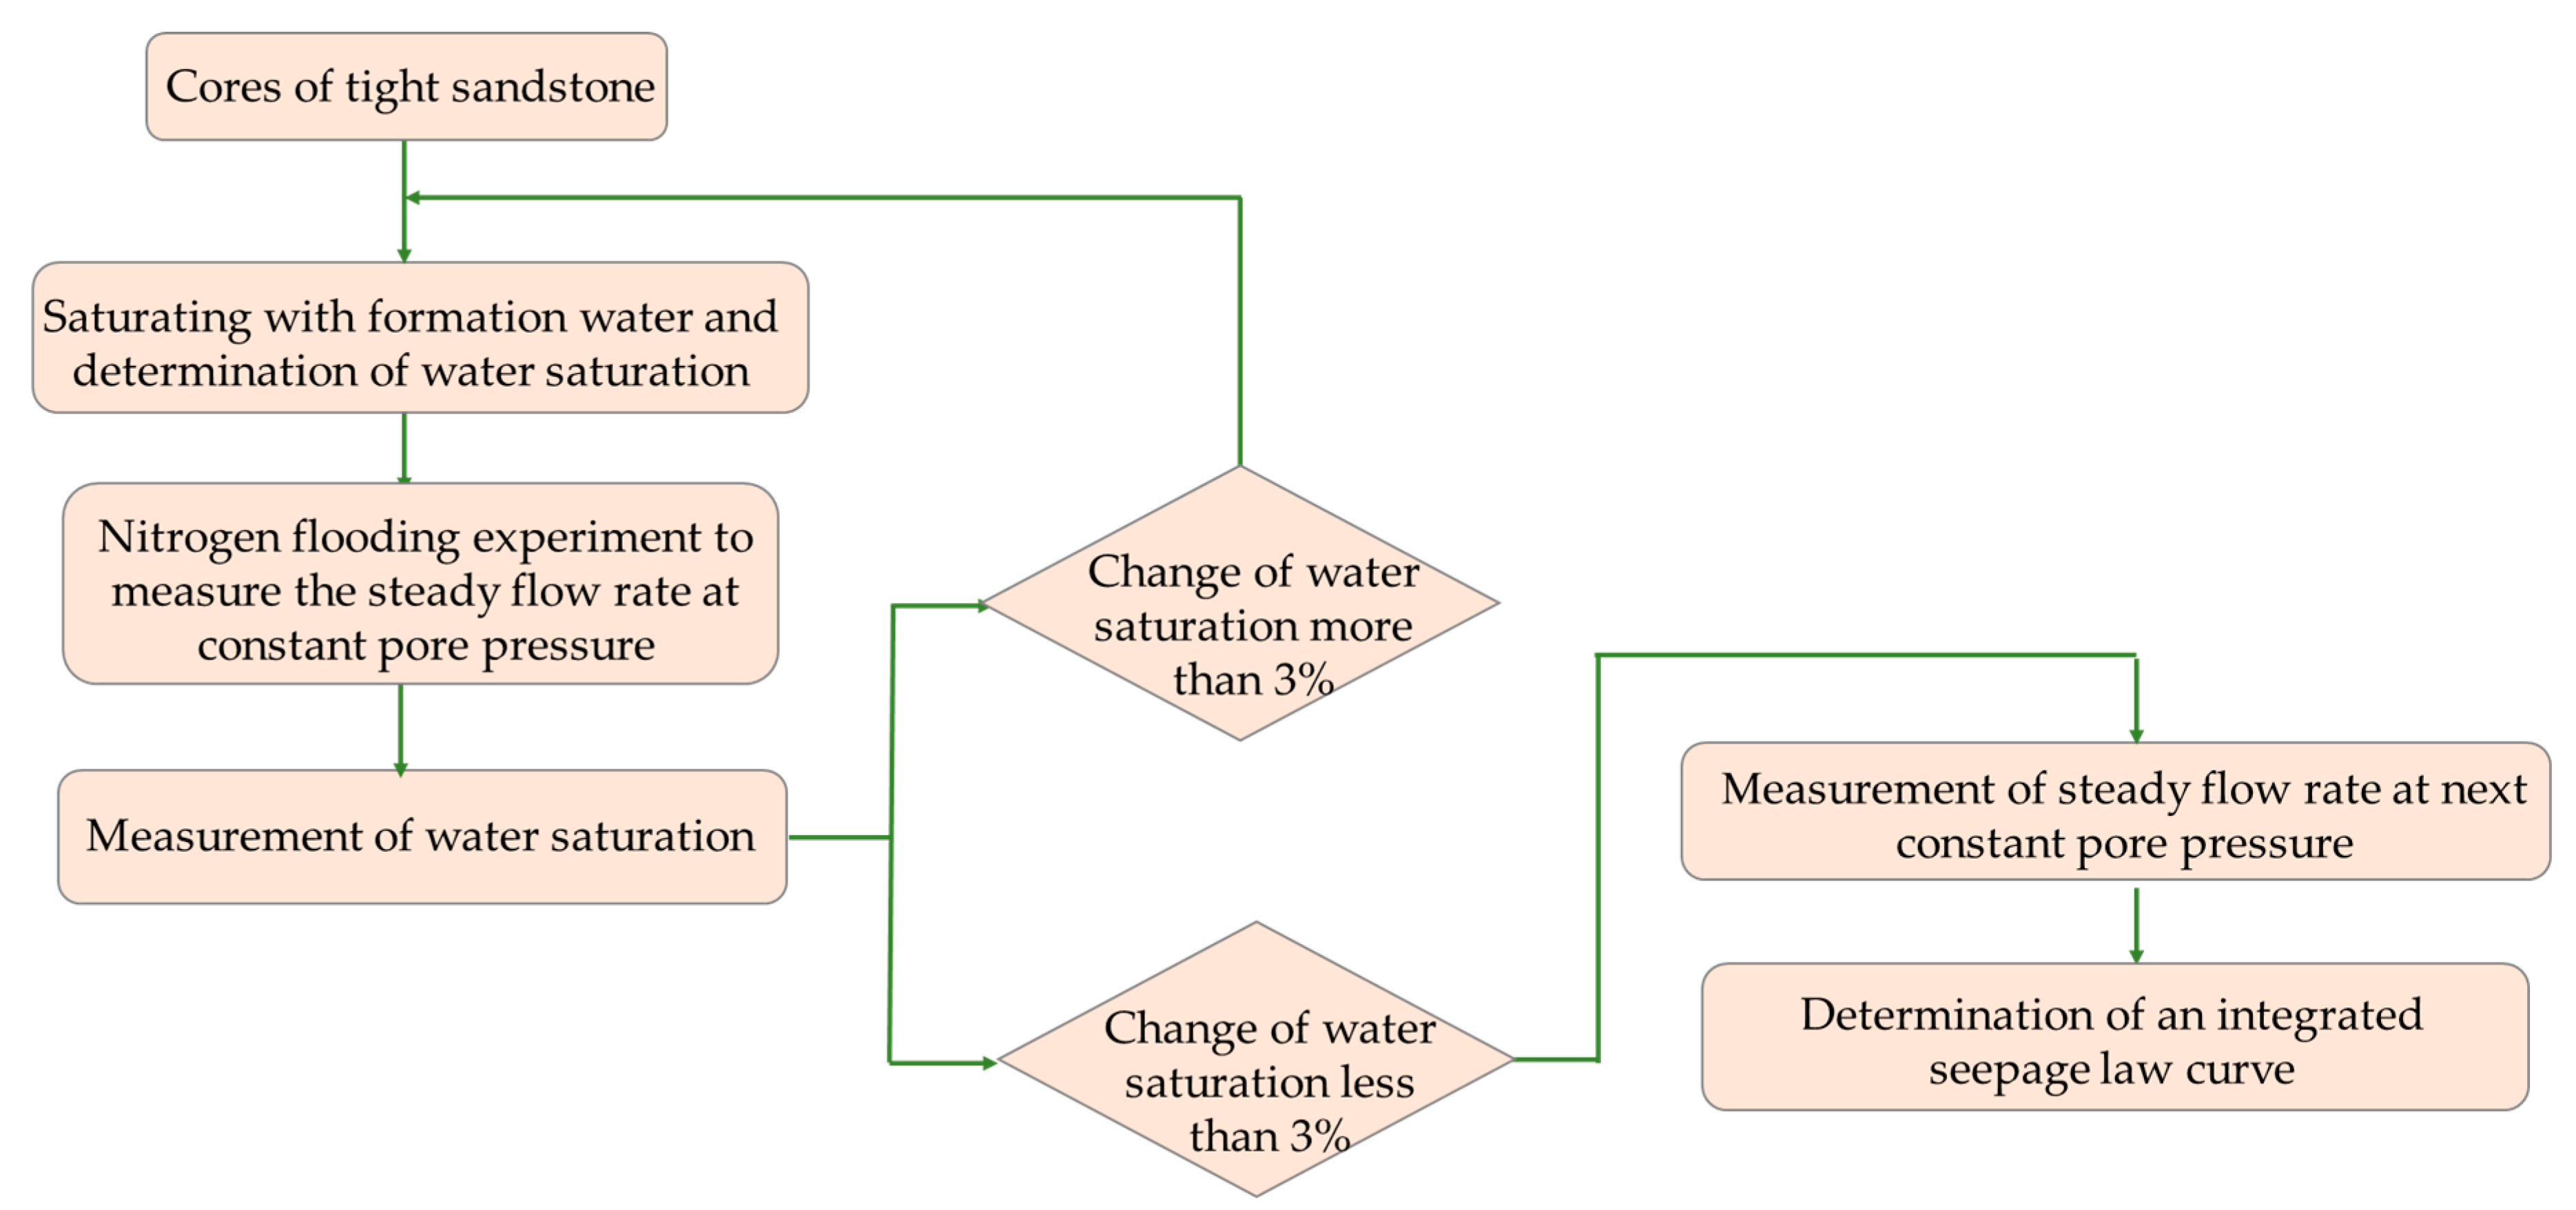
2.3. Seepage Experiments of Gas in Tight Cores

The experimental set-up used for the core-flooding experiments to determine seepage law curves of gas is shown in Figure 1. Before commencing seepage experiments, cores were properly cleaned and dried at 150 °C for 72 h. Their porosities were measured using the weight method, and permeability measurements were conducted using Darcy’s law. In each seepage experiment, the core was first dried and weighed, then vacuumized, saturated with formation water and weighed once more to calculate water saturation; finally, the core was mounted in a hydrostatic core holder at a confining pressure of 5.0 MPa. After that, nitrogen was used to inject into the core that was continuously weighed until it reached the expected water saturation (S1) with an error of less than 3%. Subsequently, nitrogen was injected into the core at constant pore pressure (P1); the steady value was determined and recorded after the flow rate of nitrogen was stable at the outlet of core holder. The water saturation (S2) in core was measured again after the steady value of flow rate was determined. Based on the water saturation (S1), if the change of water saturation (S2) in core was less than 3%, the gas seepage in core could be considered as single-phase flow and the steady value of flow rate might be measured at the next constant pore pressure (P2). However, if the change of water saturation (S2) was greater than 3%, the gas seepage could be considered as two-phase flow. This necessitated the core to be resaturated with formation water to the expected value, and the seepage experiment was carried out again to determine the steady value of flow rate at the original pore pressure (P1). According to the above steps and requirements, a series of steady values of flow rate could be measured at various pore pressures, and then an integrated seepage law curve could be plotted to represent the relationship between flow rate and pore pressure. Finally, the seepage law curves of gas in cores with different permeabilities could be measured at about 35% water saturation, and those of gas in core with about 0.14 mD could be determined at various water saturations as well. The general workflow to the experimental procedure is shown in Figure 2.

2.4. TPG Calculation Method

In order to obtain the TPGs of gas in tight gas reservoirs, the seepage law curves were plotted at various water saturations and core permeabilities, and the TPGs were calculated using the data processing method proposed by Feng [19]. The relationship between the measured flow rate and the pore pressure square difference gradient is expressed as follows:
q = 10 3 A K a 2 μ Z p 2 p 1 2 p 2 2 L .
Inside,
K a = K ( 1 λ L p 1 p 2 ) ,
where q is the flow rate, m3·s−1; A is the cross-sectional area of core, m2; Ka is the apparent permeability of core, μm2; K is the permeability of core, μm2; μ is the viscosity of gas, mPa·s; Z is the deviation coefficient of gas, the gas is considered as an ideal gas, and the value of Z is 1 in this experiment; λ is the TPG of gas, MPa·m−1; L is the length of core, m; p1 and p2 are the pressures at the inlet and outlet of the core, respectively, MPa. Therefore, according to the experimental data, the apparent permeabilities (Ka) under different experimental conditions could be calculated using Equation (1). Then, the relationship curves between Ka and 1/(p1p2) could be plotted according to Equation (2), the linear fitting could be carried out for these curves, and the TPGs were obtained according to the slopes of the fitted lines.

3. Pore Structure of Tight Gas Reservoirs

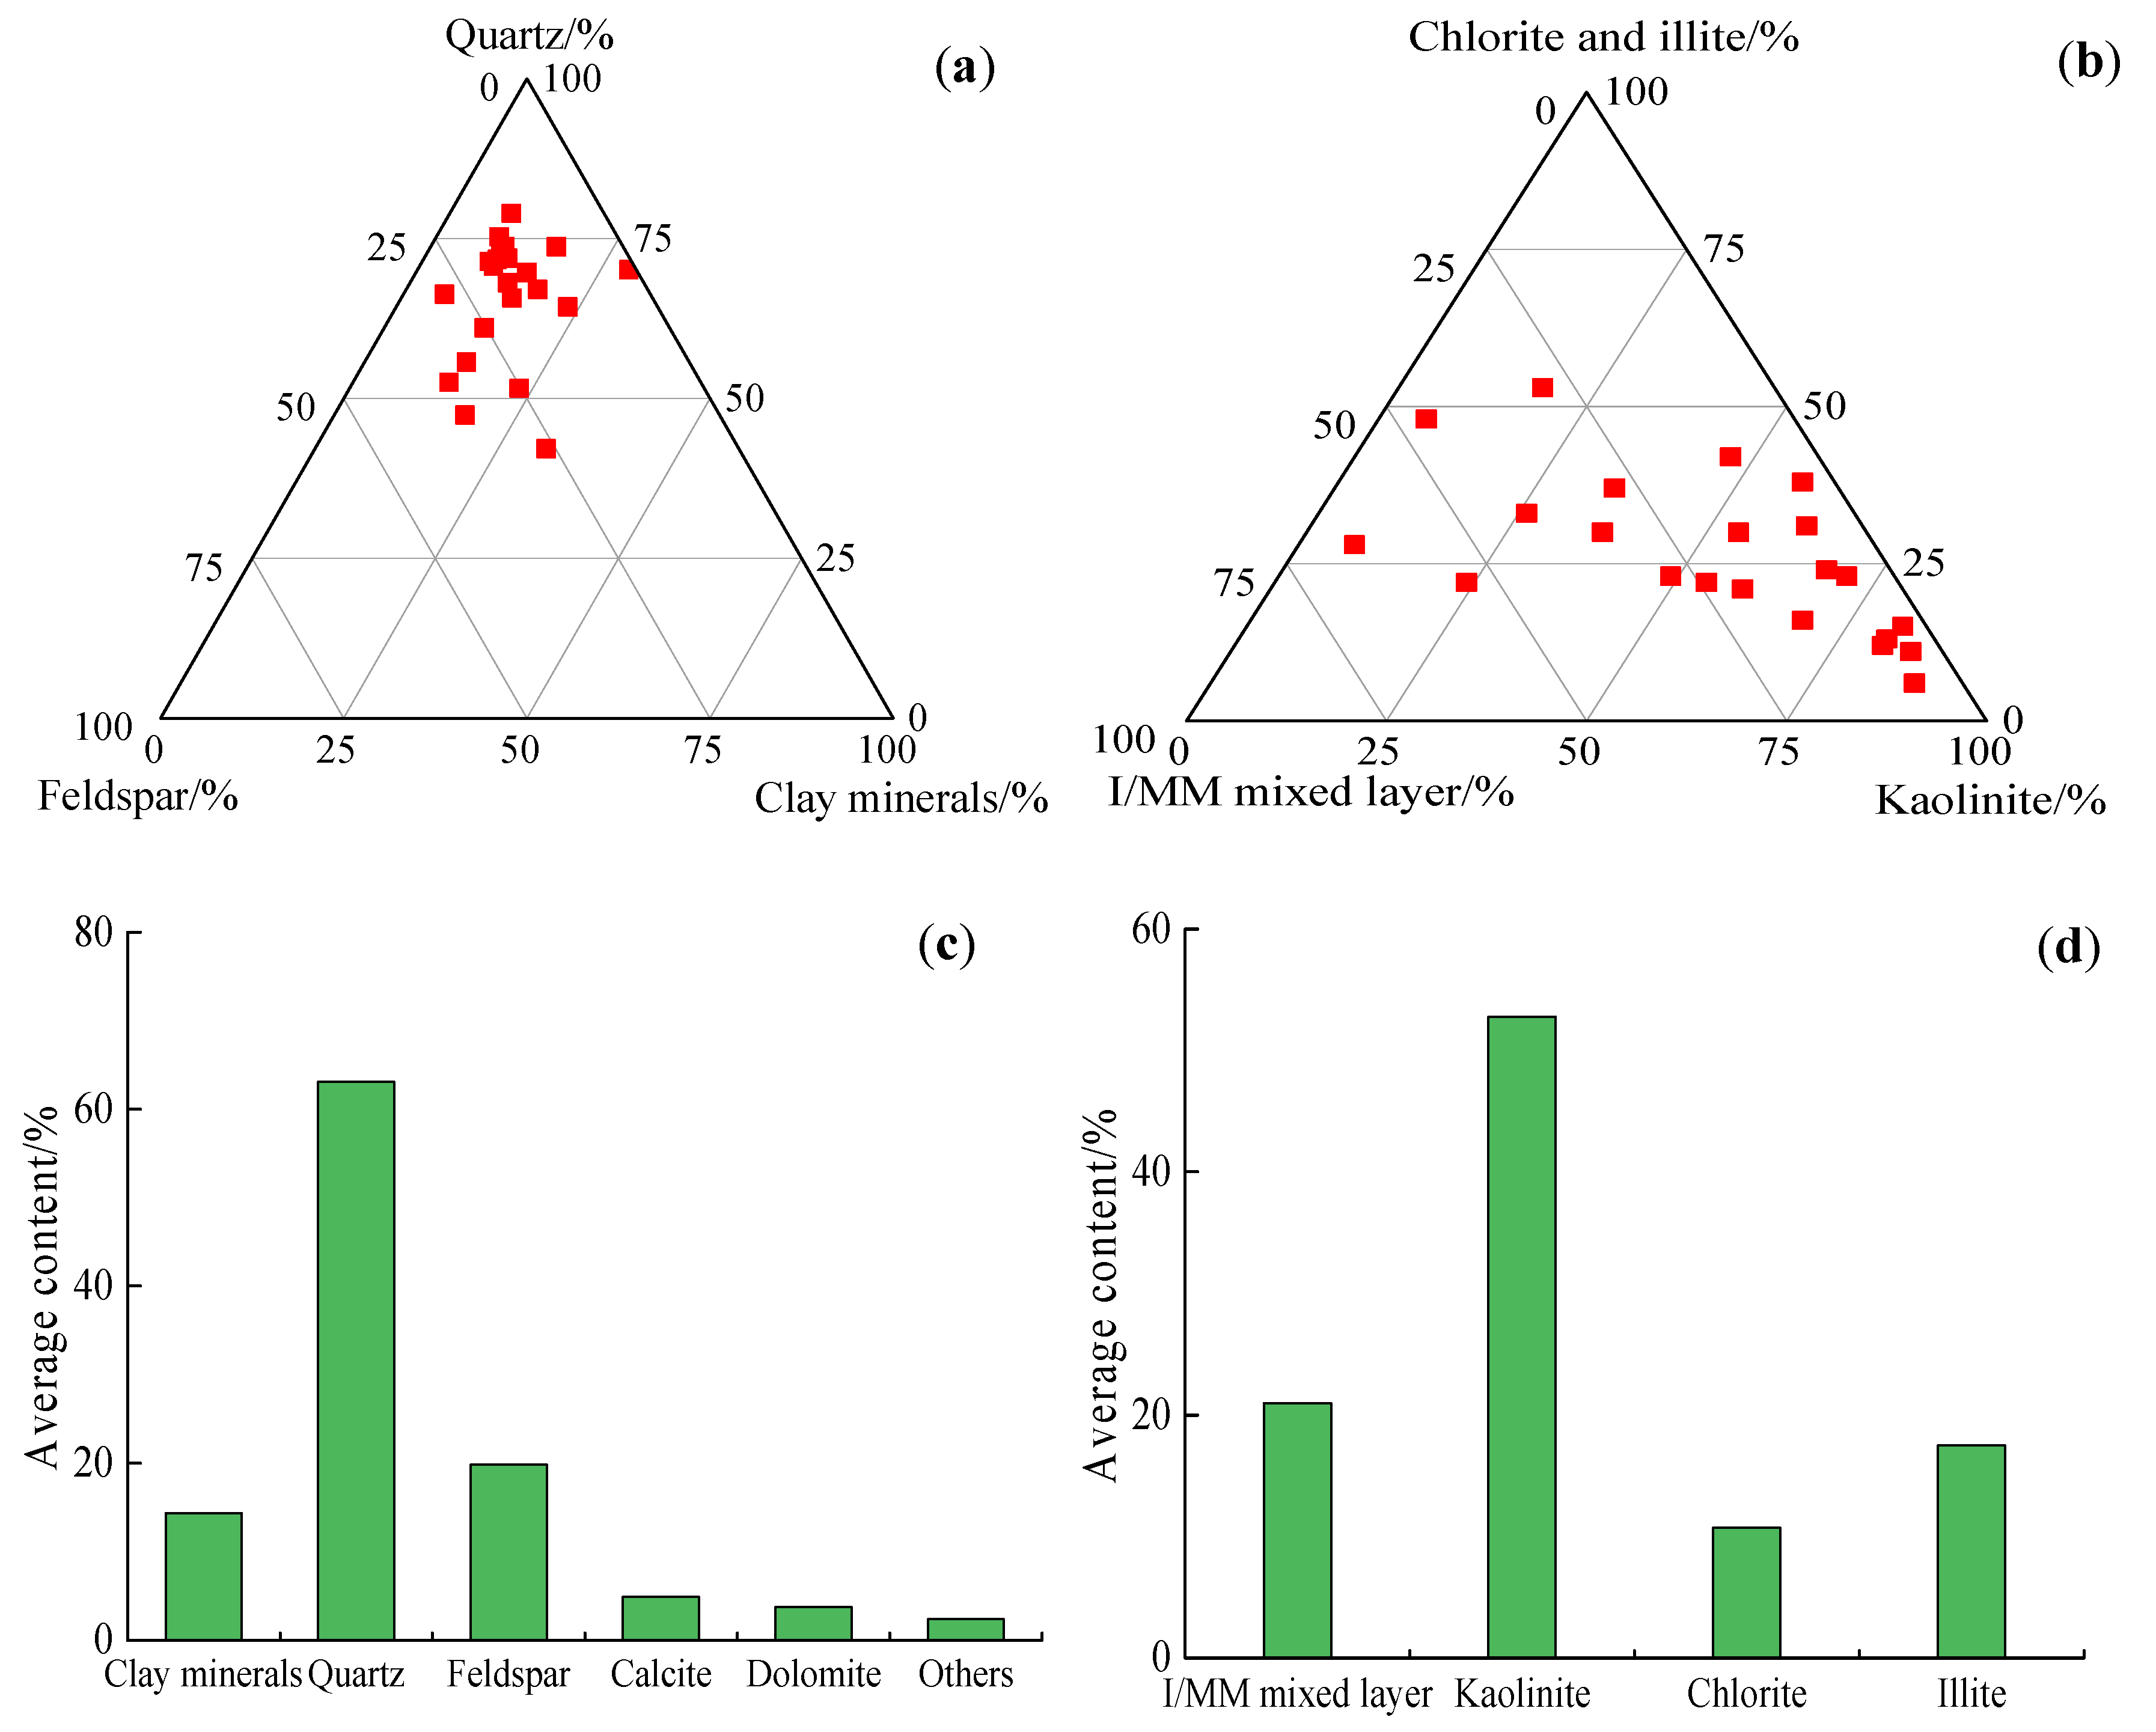
3.1. Mineral Compositions

The mineral compositions of tight cores were determined by XRD and are shown in Figure 3. According to Figure 3, the rock minerals of tight cores are mainly composed of quartz, feldspar and clay minerals, with a small amount of calcite, dolomite and other minerals (siderite). The mineral compositions of tight cores are mainly distributed in the middle and upper part of the triangulation diagram of whole rock mineral composition, indicating that the main mineral composition is quartz, with a content of 40–75% (an average of 63.14%). In addition, the rock minerals also include 1–34% feldspar (with an average of 18.64%), and 5–30% clay minerals (an average of 14.36%). The clay minerals are mainly composed of kaolinite, chlorite, illite and illite/montmorillonite mixed layer (I/MM mixed layers). The clay mineral compositions are mainly distributed in the lower right part of the triangulation diagram of clay mineral composition, indicating that the main clay mineral is kaolinite, with a content of 6–88% (an average of 52.77%). Besides, the clay minerals also include 3–65% I/MM mixed layer (with an average of 20.95%), 0–32% chlorite (with an average of 10.72%), and 6–28% illite (with an average of 17.50%). In these tight cores, there is a high content of water-sensitive mineral (I/MM mixed layer), which can absorb water to swell, leading to a decline of permeability in tight gas reservoirs. Therefore, it will be more difficult to start gas migration in tight gas reservoirs under water-bearing condition.

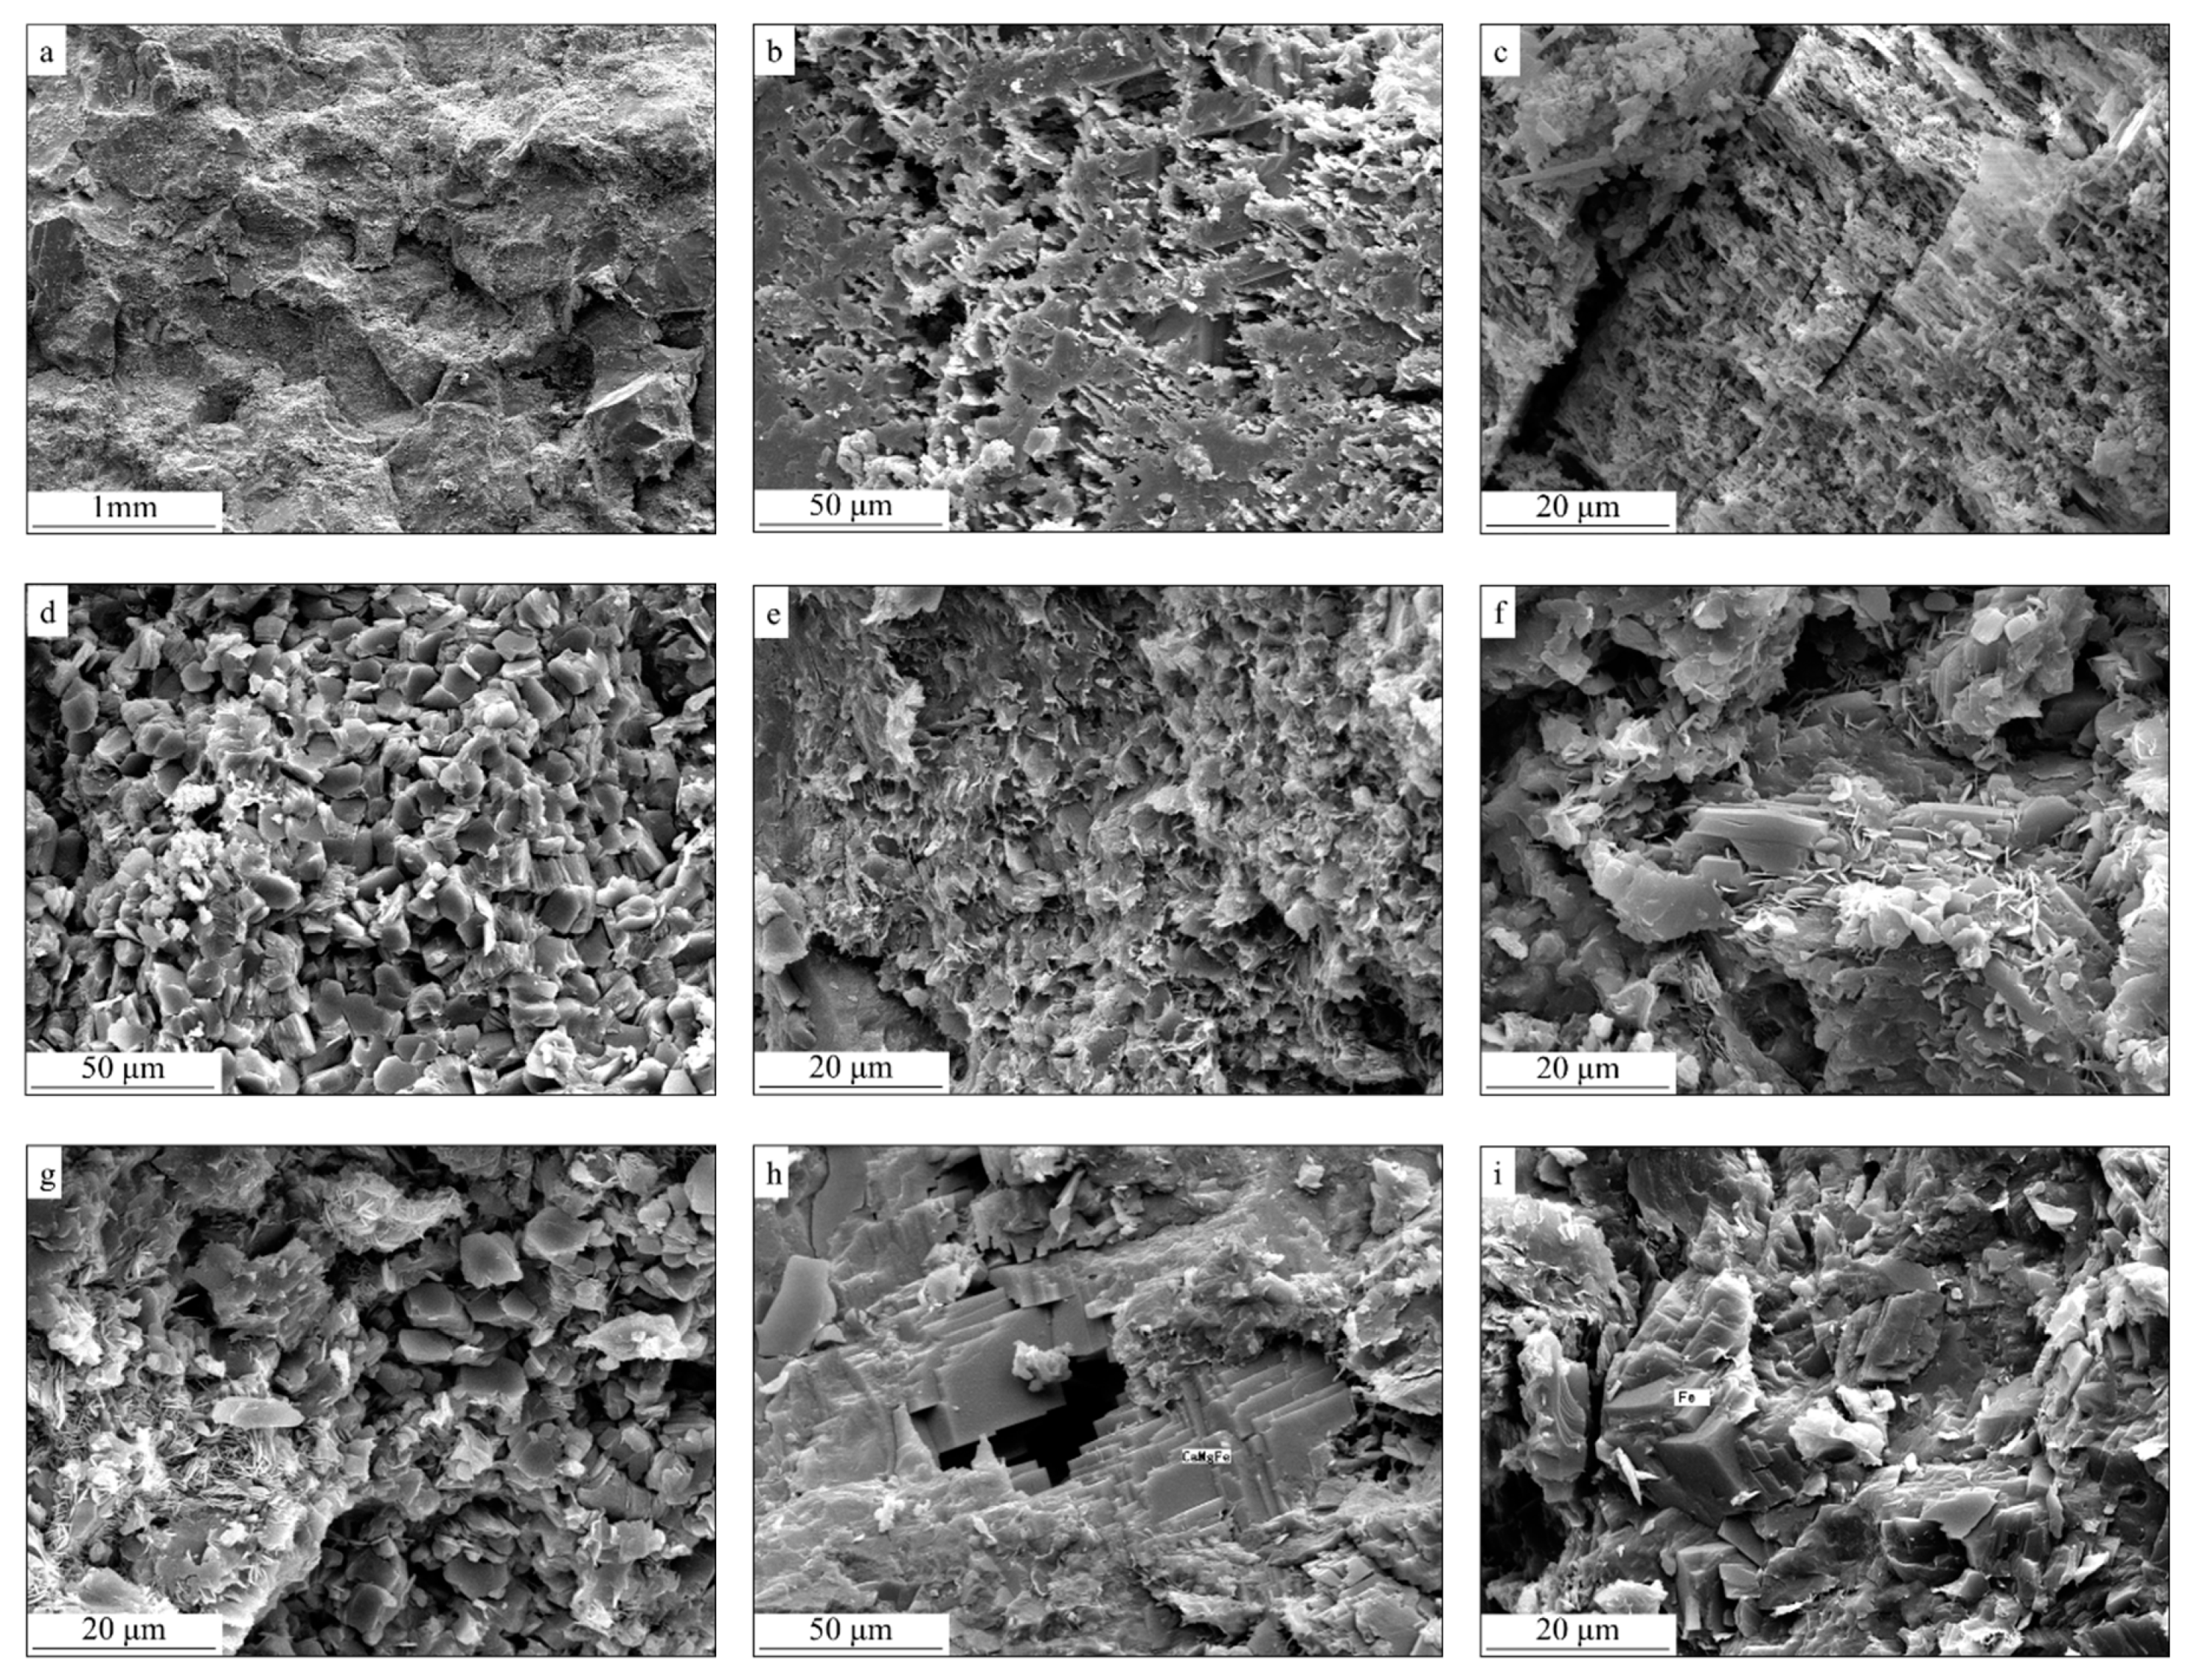
3.2. Microscopic Morphologies

The microscopic morphologies of tight cores were determined by SEM and are shown in Figure 4. According to Figure 4, the overall pores of tight cores formed by quartzes are not developed, and only a few intergranular pores (seen in Figure 4a) are found, with pore sizes ranging from tens to hundreds of microns. The pores and slit pores formed by dissolution of feldspars are relatively well developed (seen in Figure 4b,c), with pore sizes ranging from several microns to dozens of microns. The pores formed by filling of clay minerals such as kaolinite, illite, chlorite and I/MM mixed layers are also well developed, with pore sizes of about ten microns. For example, a lot of intergranular pores formed by page-like kaolinites (seen in Figure 4d), curved filamentous illites and I/MM mixed layers (seen in Figure 4e), page-like kaolinites and leaf-like chlorites (seen in Figure 4f), and leaf-like chlorites (seen in Figure 4g) are found in tight cores. In addition, a small amount of intergranular pores consisting of dolomites and siderites are found locally (seen in Figure 4h,i). Therefore, it can be seen that the pore development of these tight cores is mainly related to the clastic minerals such as quartz and feldspar, and clay minerals such as kaolinite, illite, chlorite and I/MM mixed layers, which leads to a complex pore structure characteristic.

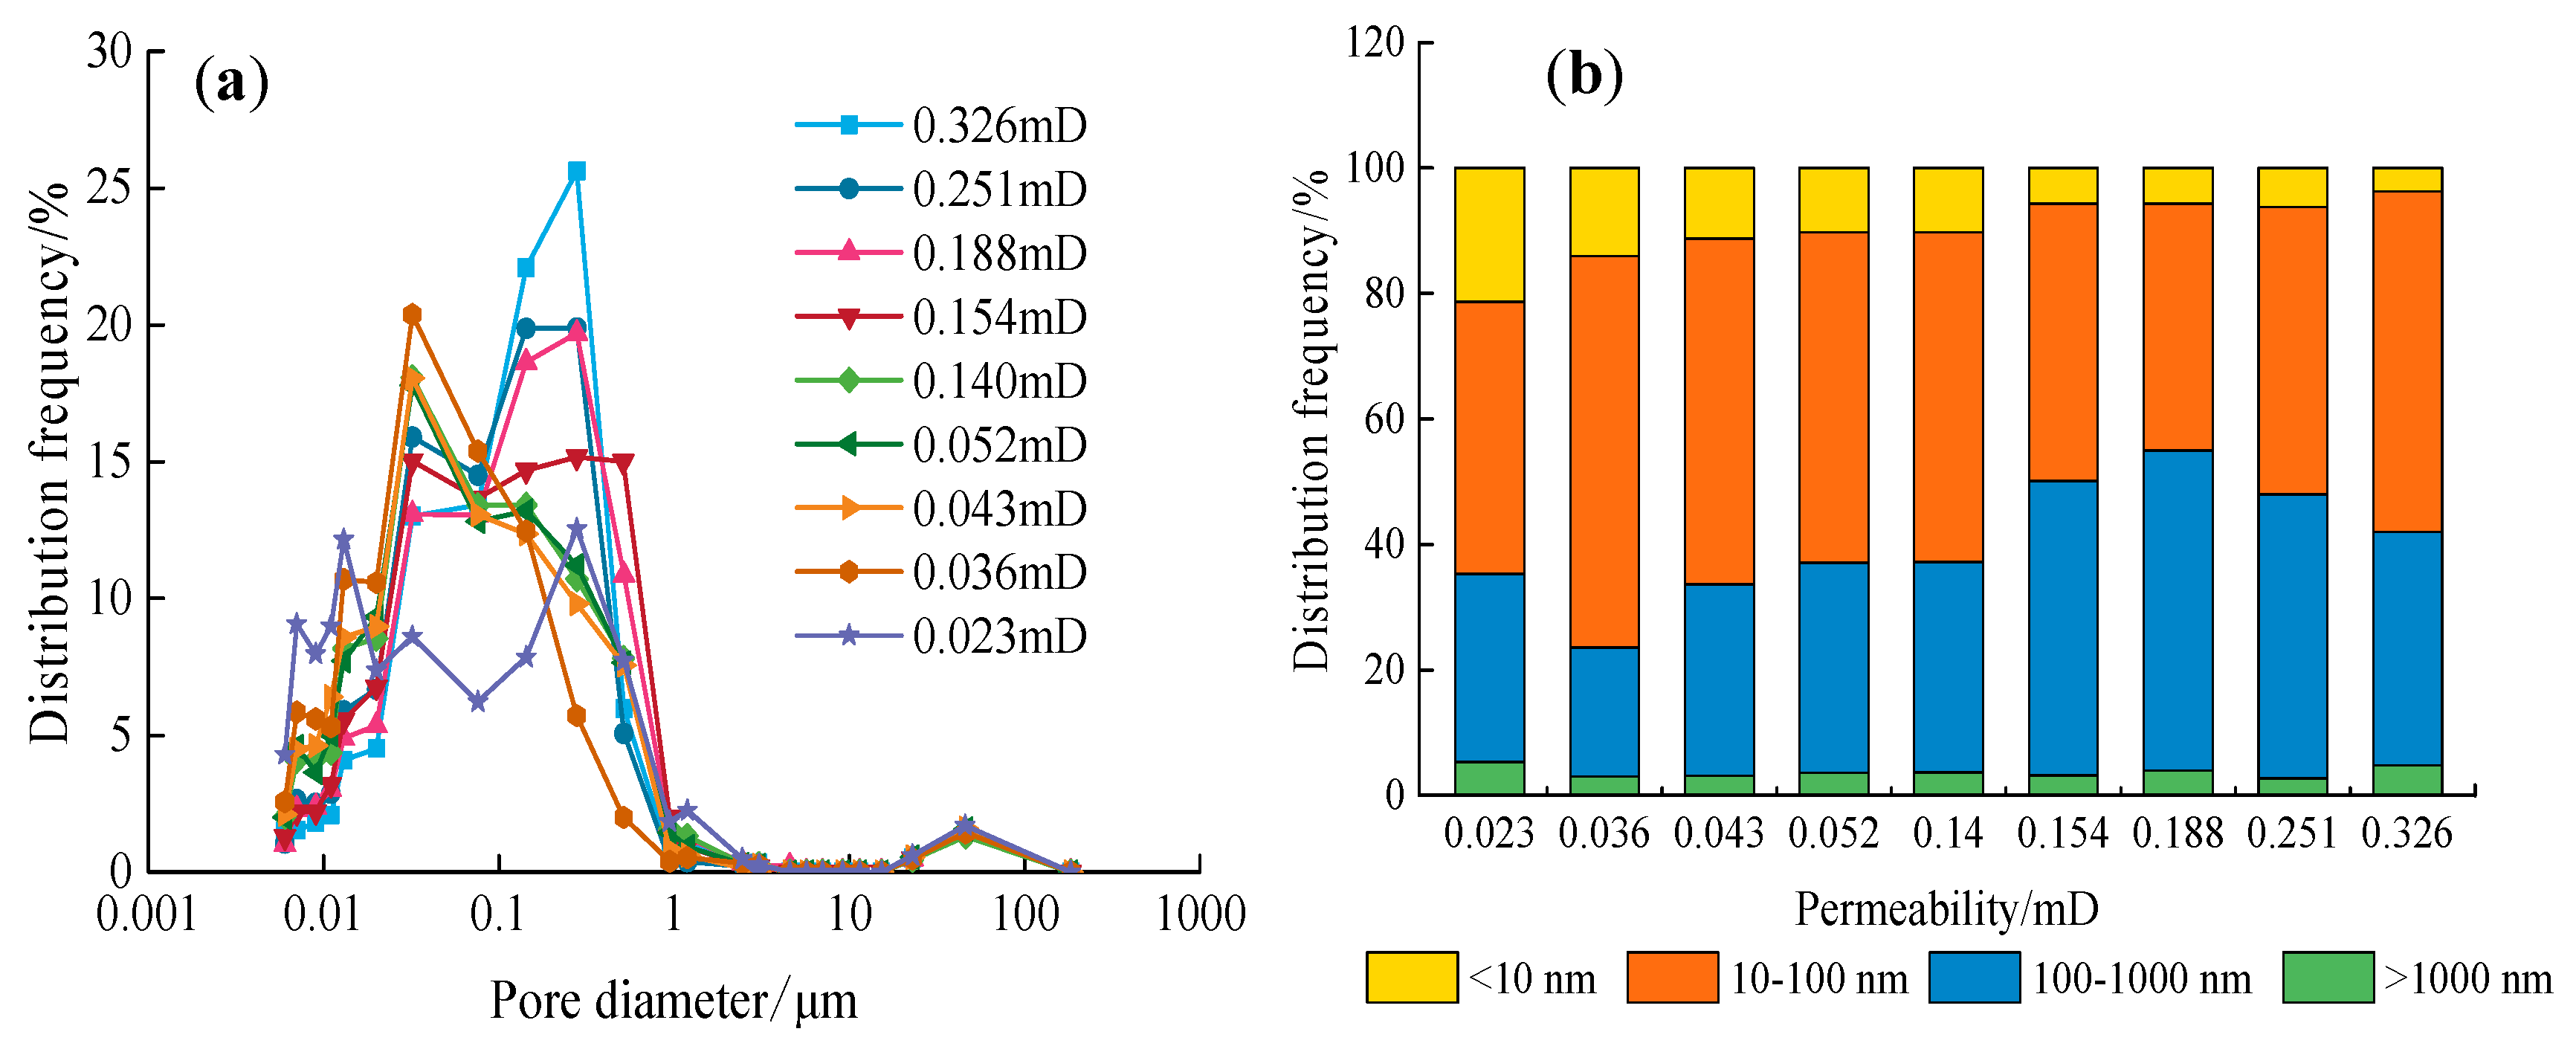
3.3. Pore Distributions

The tight cores have poor physical properties, large specific surfaces, high irreducible water saturations and obvious capillary forces [20,21]. The shape, size, distribution and connectivity of pores and throats directly affect the permeability of reservoir [22]. Thus, the pore distributions of tight cores were determined by high pressure mercury porosimetry, as shown in Figure 5. According to Figure 5a, the pore size distribution curves of tight cores have multiple peaks and have certain differences for cores with various permeabilities. Especially for cores with permeability of 0.023 mD, their pore size distribution curves show continuous jumps with multiple peaks. The pore diameter of tight cores is mainly distributed below 1 micron, and the pores with diameter greater than 1 micron are very small. The pores with diameter ranging from 0.01 to 1 micron are largely developed, and the related distribution curves show multipeak states. The pores with diameter ranging from 1 to 10 microns are almost nonexistent, while a small number of pores range in diameter from 10 to 200 microns. According to pore classification criteria proposed by Хoдo [23] that macropore is greater than 1000 nm in diameter, mesopore is between 100–1000 nm in diameter, small pore is between 0–100 nm in diameter, and micropore is less than 10 nm in diameter, the pores of tight cores were classified and analyzed, as shown in Figure 5b. Figure 5b shows that there are many mesopores and small pores with less macropores and micropores in tight cores. As the core permeability decreases, the proportion of micropores in tight cores gradually increases, resulting in more difficult and complex gas flow in tight gas reservoirs.

4. Characteristics of the TPG in Tight Gas Reservoirs

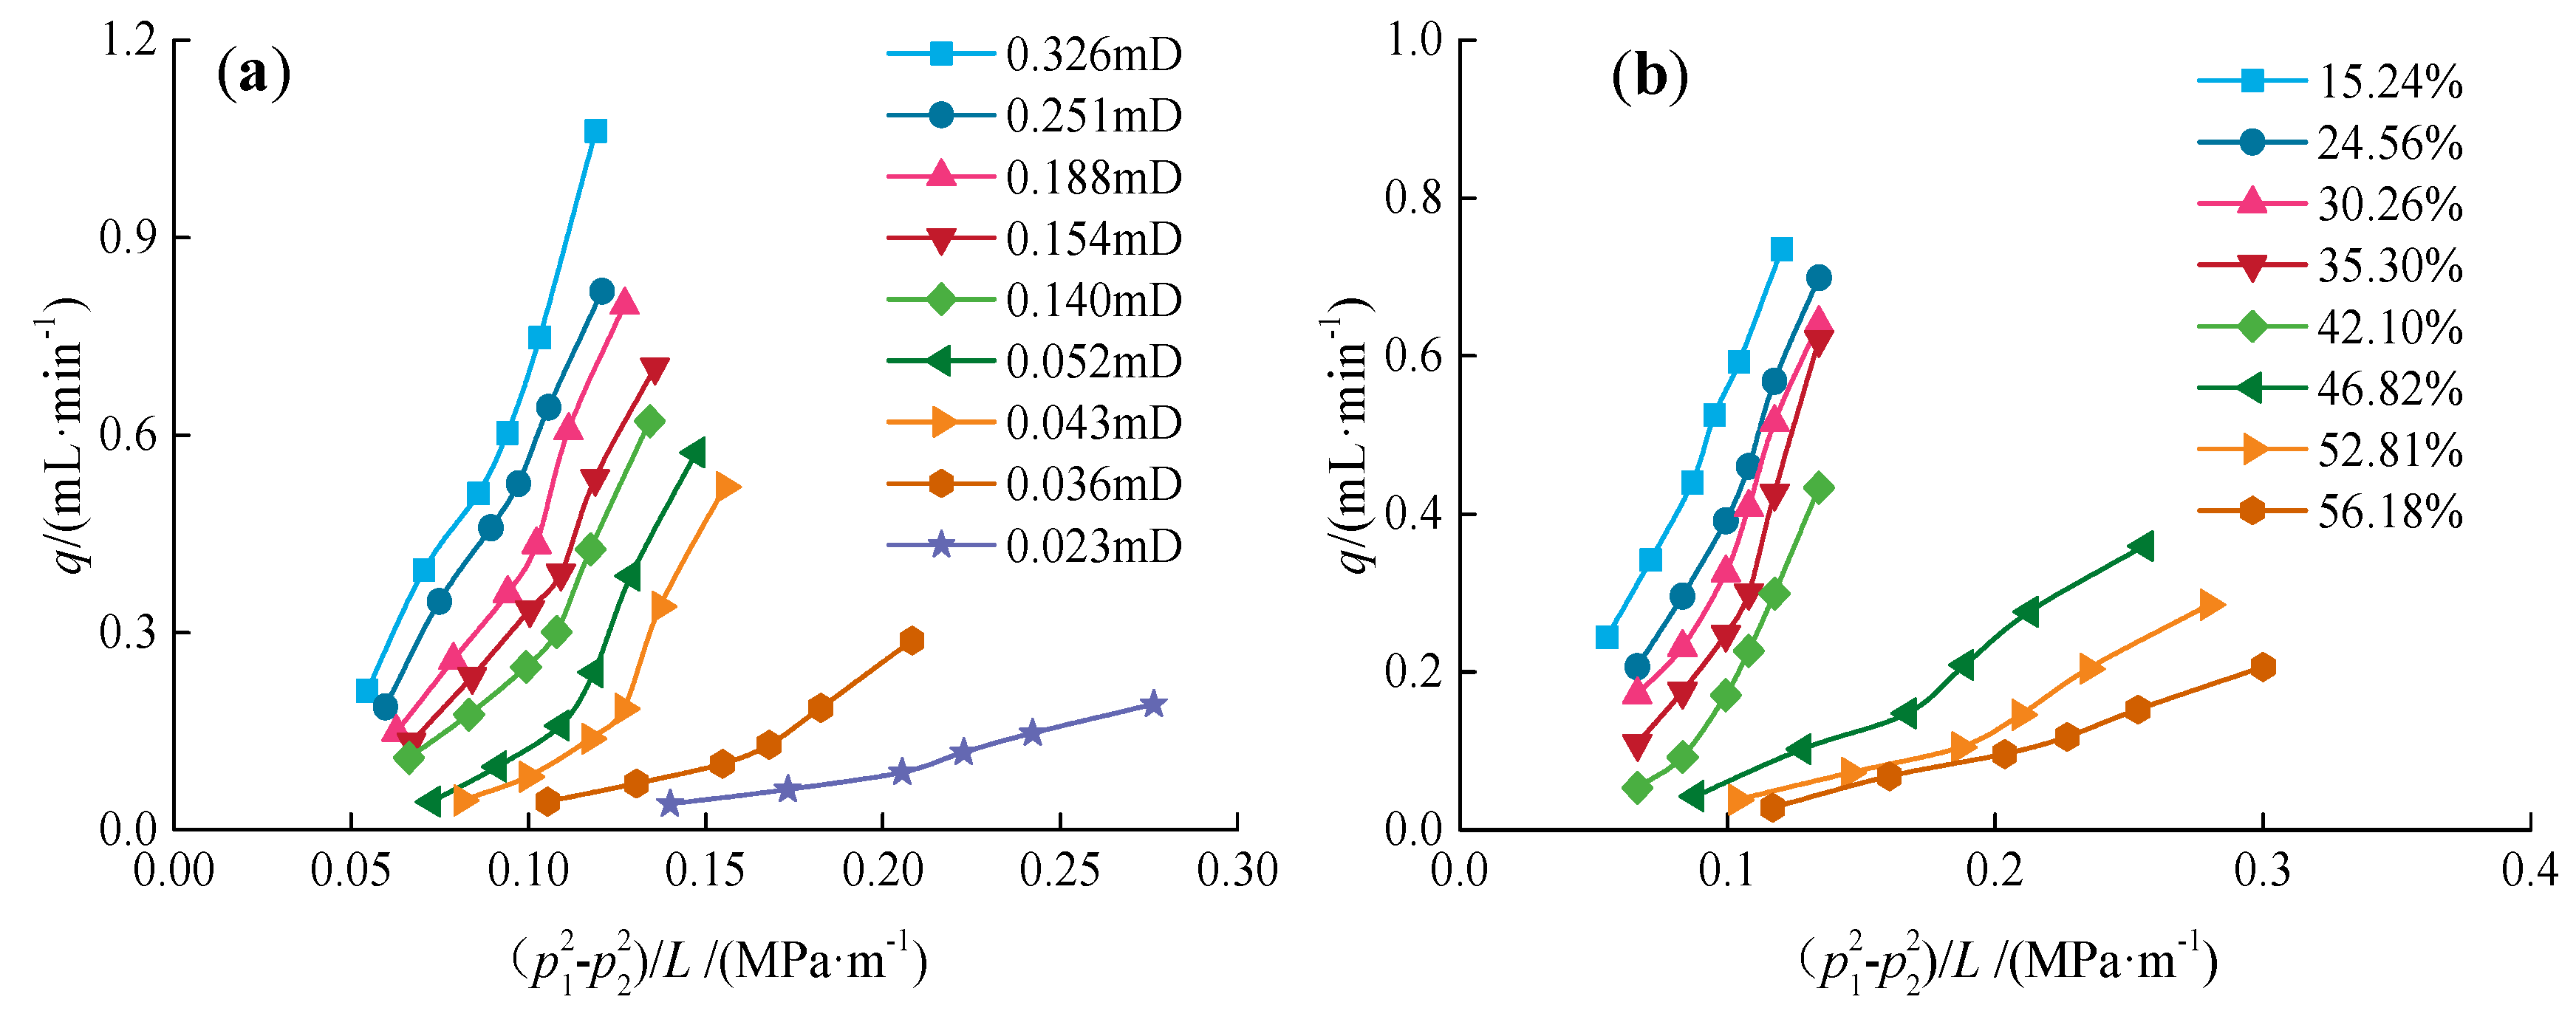
4.1. Nonlinear Seepage Characteristics of Gas in Tight Gas Reservoirs
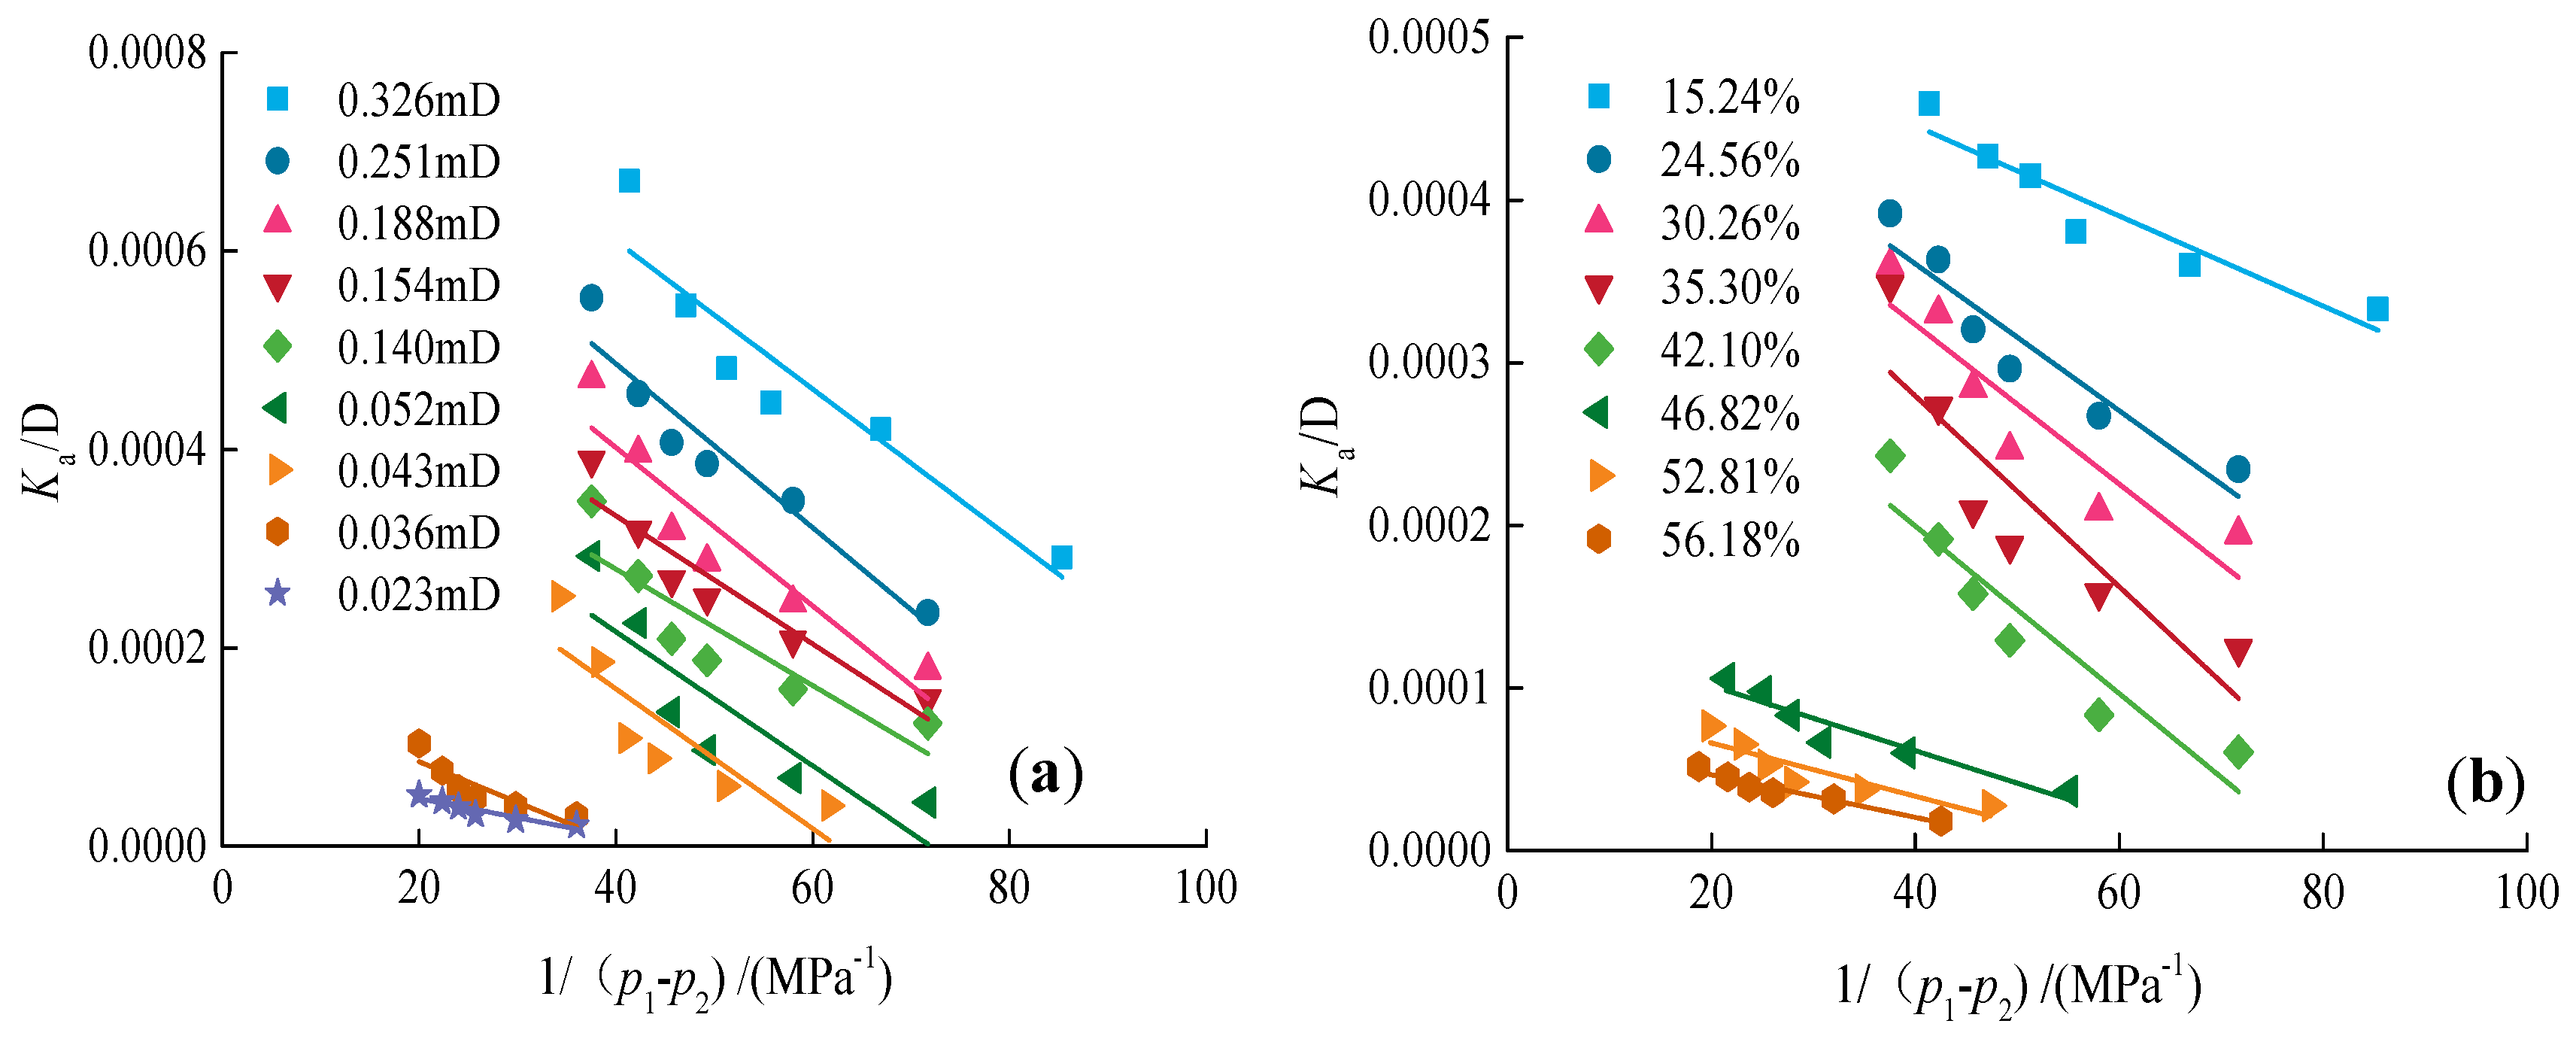
The seepage curves of gas in tight cores with different permeabilities (at about 35% water saturation) and at various water saturations (in core with about 0.14 mD) are shown in Figure 6. It can be seen from Figure 6 that the seepage curves of gas in tight cores under water-bearing conditions do not show a linear relationship, instead showing a nonlinear seepage characteristic, indicating that gas seepage has an obvious TPG characteristic. Under water-bearing conditions, gas can make contact with water in the channel walls and pores of tight cores, and the capillary force will make the gas flow very complicated in tight reservoirs [24,25]. On the one hand, the pores of tight cores are mainly composed of quartz, feldspar and other clastic minerals as well as clay minerals. The pores are mainly mesopores and small pores, and the number of macropores is very small. Thus, the flow channels of fluid in tight cores have a narrow and poor connectivity characteristic. It is easy for the water in core pores to form a continuous and thin layer of hydration film at the narrow pore throats, coupled with the swelling of water-sensitive clay minerals, which leads to a great increase of the seepage resistance of gas [26]. On the other hand, gas in cores cannot form a continuous phase under the influence of water but is divided into many small bubbles for migration. Under the action of capillary force, these small bubbles will produce Jamin effect at the throats, leading to an increase of seepage resistance as well [27]. Therefore, in order to overcome these additional resistances, the TPG in tight gas reservoirs is generated before gas can flow continuously.
In addition, it can be seen from Figure 6a that, under the same pressure square difference gradient, the gas velocity decreases with a decrease of permeability. With a decrease of permeability, a decrease in size of flow channels leads to the enhancement of the interaction between gas and hydration film, and an increase of the Jamin effect at the throats, which increases the seepage resistance of gas. Figure 6b shows that, under the same pressure square difference gradient, the gas velocity decreases with an increase of water saturation. With an increase of water saturation, an increase of water film thickness in the flow channel results in the enhancement of the interaction between gas and hydration film, and an increase of the Jamin effect at the throats as well, thus increasing the seepage resistance of gas.

4.2. TPG Analysis

Based on the experimental data in Figure 6, the apparent permeabilities (Ka) of gas under different permeabilities or water saturations were calculated according to the Equation (1), and then the relationship curves of Ka and 1/(p1p2) were plotted, as seen in Figure 7. According to Figure 6, the relationship curves of Ka and 1/(p1p2) could be linearly fitted with a high correlation coefficient. The TPGs of gas under different experimental conditions were obtained by the Equation (2) and the slopes of fitted curves, as shown in Figure 8. According to Figure 8, the TPG of gas increases either with a decrease of core permeability or with an increase of water saturation. In particular, when core permeability is less than 0.1 mD, the TPG of gas decreases sharply with an increase of core permeability; whereas it decreases slowly when core permeability is greater than 0.1 mD. The TPG of gas has a good power function relationship with core permeability or water saturation, with high fitted correlation coefficients (R2) of 0.9912 and 0.991, respectively, indicating that core permeability and water saturation are both the main influencing factors on the TPG of gas.

4.3. Mathematical TPG Model and Its Verification

From the analysis results of Figure 8, the relationship between the TPG and core permeability or water saturation complies with the power function, which are expressed as follows:
λ = a K b ,
λ = c S w d ,
where Sw is the water saturation, %; a, b, c and d are the fitted parameters, dimensionless. Under these experimental conditions, parameters a, b, c and d are 0.1223, −0.3615, 0.00796 and 0.9647, respectively.
By taking natural logarithms of the Equations (3) and (4), the following equations can be obtained:
ln λ = bln K + ln a ,
ln λ = dln S w + ln c .
As can be seen in Equations (5) and (6), lnλ satisfies a linear relationship with lnK or lnSw. According to the principle of multiple linear regression, lnλ should also abide by a linear relationship with the sum of lnK and lnSw. Its binary linear regression equation can be written as follows:
ln λ = gln K + f ln S w + h ,
where g and f are the regression coefficients, h is the regression constant.
Order m = e h , the Equation (7) can be changed to the following equation:
λ = m K g S w f .
A multivariate statistical analysis of the experimental data was carried out to obtain these fitted parameters by fitting the experimental data to the Equation (8) using MATLAB software (R2019b, MathWorks, Natick, MA, USA). Figure 9 shows a fitted surface of the TPG versus permeability and water saturation. Parameters g, f and m are −0.3628, 0.9608 and 0.003966, respectively, obtained using multivariate statistical analysis with correlation coefficient R2 = 0.992.
The theoretical values of the TPG under the experimental conditions can be calculated by Equation (8) and fitted experimental parameters and compared with the experimental values. The relative errors between theoretical values and experimental values can be calculated, as shown in Figure 10. As seen in Figure 10, the relative errors between theoretical values and experimental values of the TPG are in the range of −4.83% to 4.74%. The absolute value of maximum relative error is 4.83%, the absolute value of minimum relative error is 0.01%, and the average relative error is −0.03%. Therefore, it can be seen that the theoretical values calculated by the empirical formula are in good agreement with the experimental values, which indicates that the mathematical TPG model, paying special attention to core permeability and water saturation impact on the TPG, has a high prediction accuracy. Furthermore, the isograms of the TPG versus permeability and water saturation are plotted in Figure 11 using the TPG model. According to Figure 11, with the change of permeability, the distribution of isograms at high water saturation is more intensive than at low water saturation, which illustrates that permeability has a greater impact on TPG at high water saturation. With the change of water saturation, the distribution of isograms at low permeability is more intensive than at high permeability, which suggests that water saturation has a greater effect on TPG at low permeability.

5. Conclusions

In this study, laboratory experiments have been conducted to investigate the micropore characteristic of a tight sandstone gas reservoir, and the influence of core permeability and water saturation on the TPG. Some conclusions can be drawn from this study, and are as follows:
(1)
The pore development in the tight gas reservoir is mainly related to clastic minerals such as quartz and feldspar, and small pores formed by various clay minerals are widely developed. The diameter of pores in the tight gas reservoir mainly is distributed below 1 micron, comprising mostly mesopores (100–1000 nm in diameter) and small pores (10–100 nm in diameter). The proportion of micropores (less than 10 nm in diameter) increases with a decrease of permeability in the tight gas reservoir. The water-sensitive mineral (I/MM mixed layer) and the complex pore structure will both make gas seepage in the tight gas reservoir more difficult under water-bearing conditions.
(2)
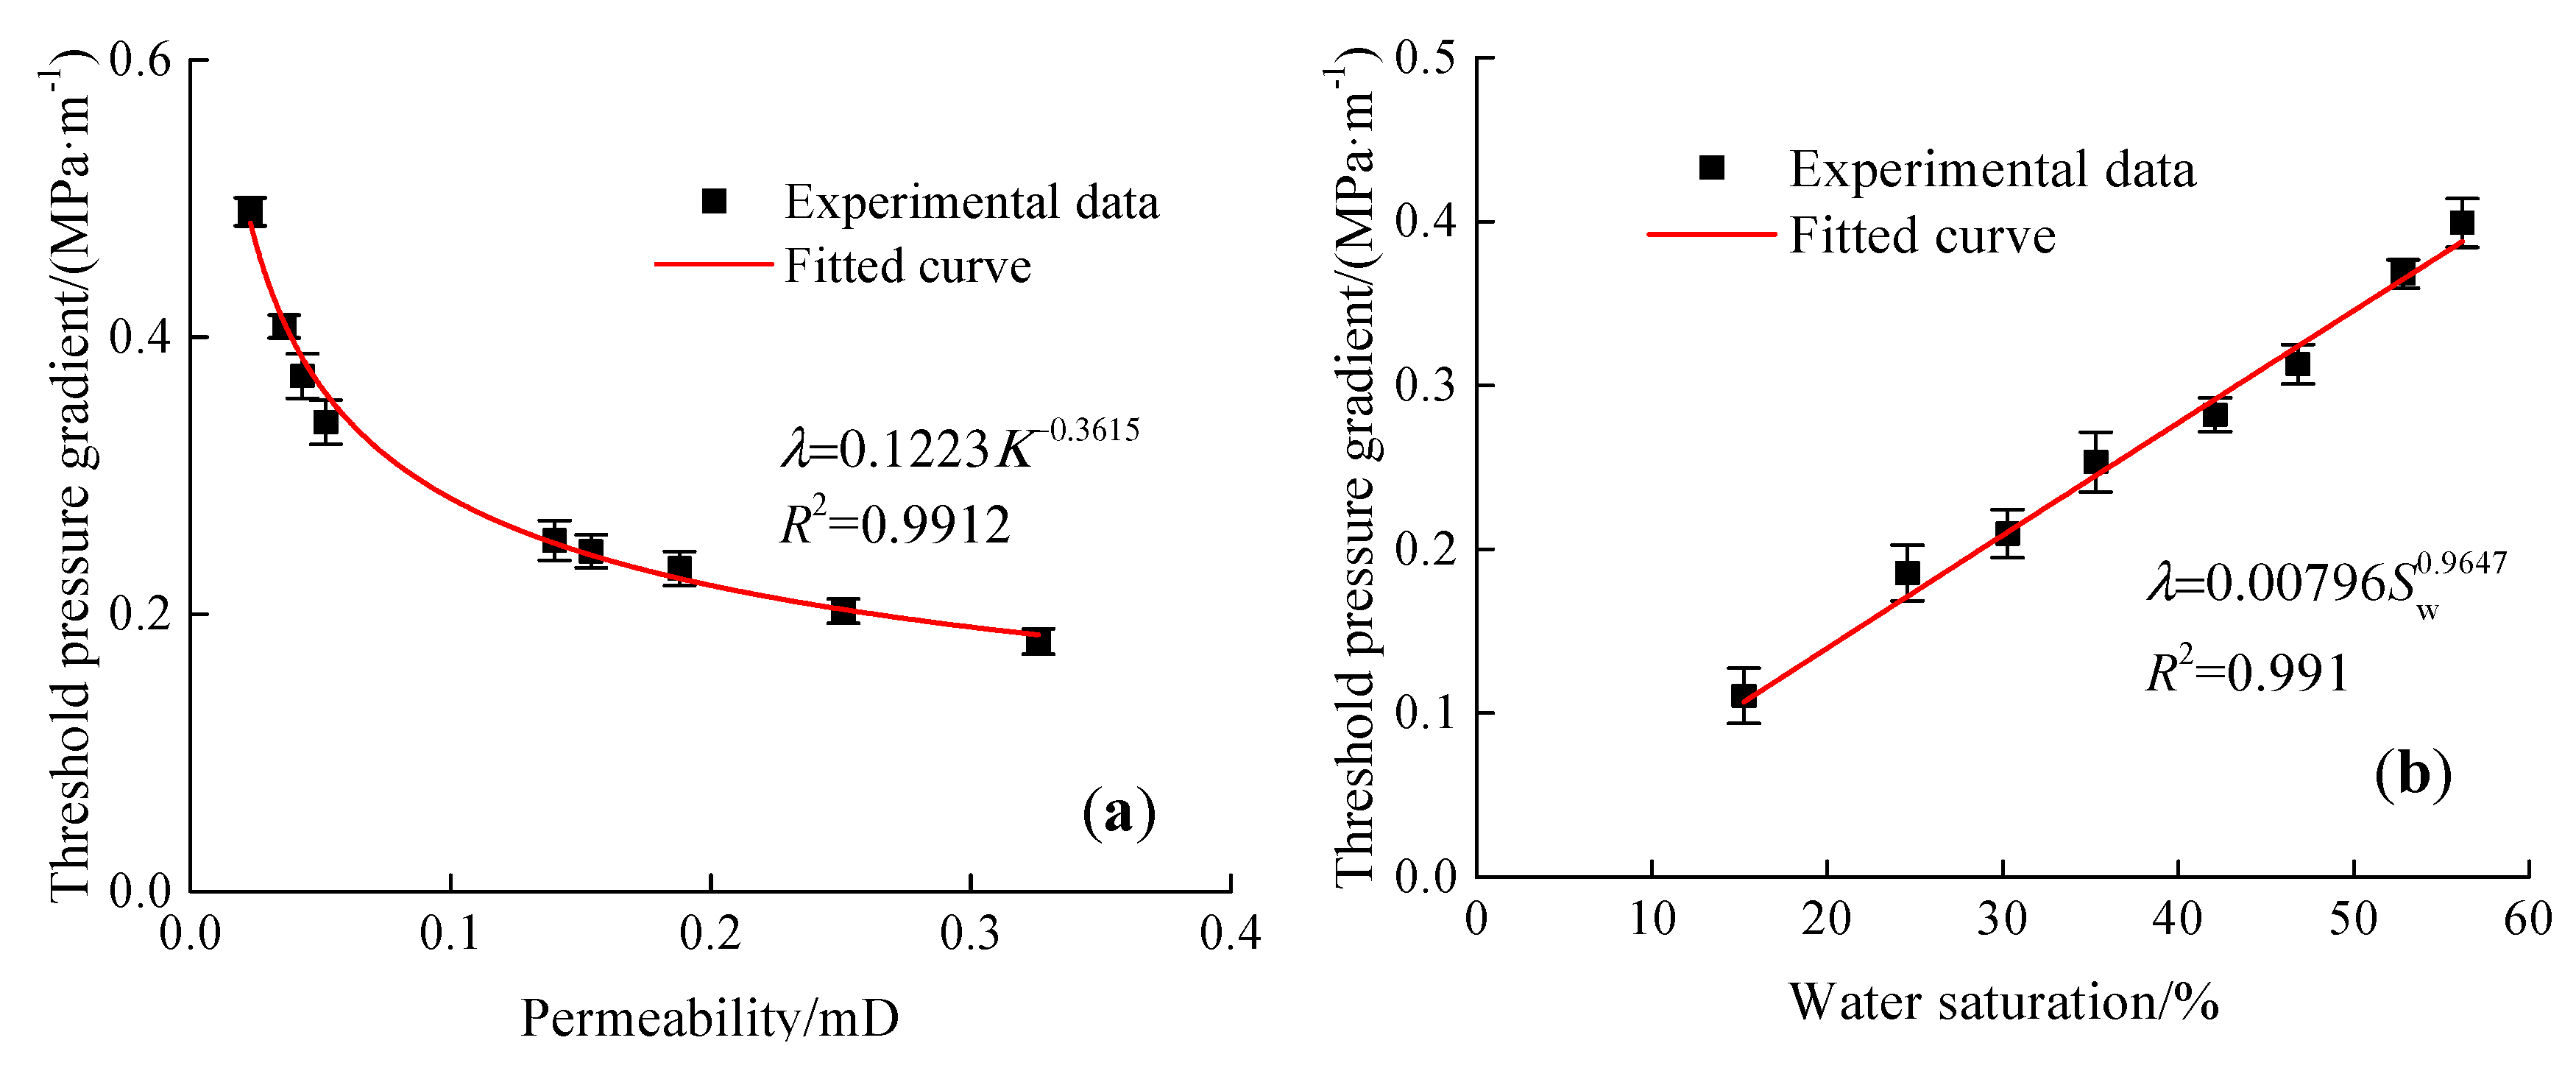
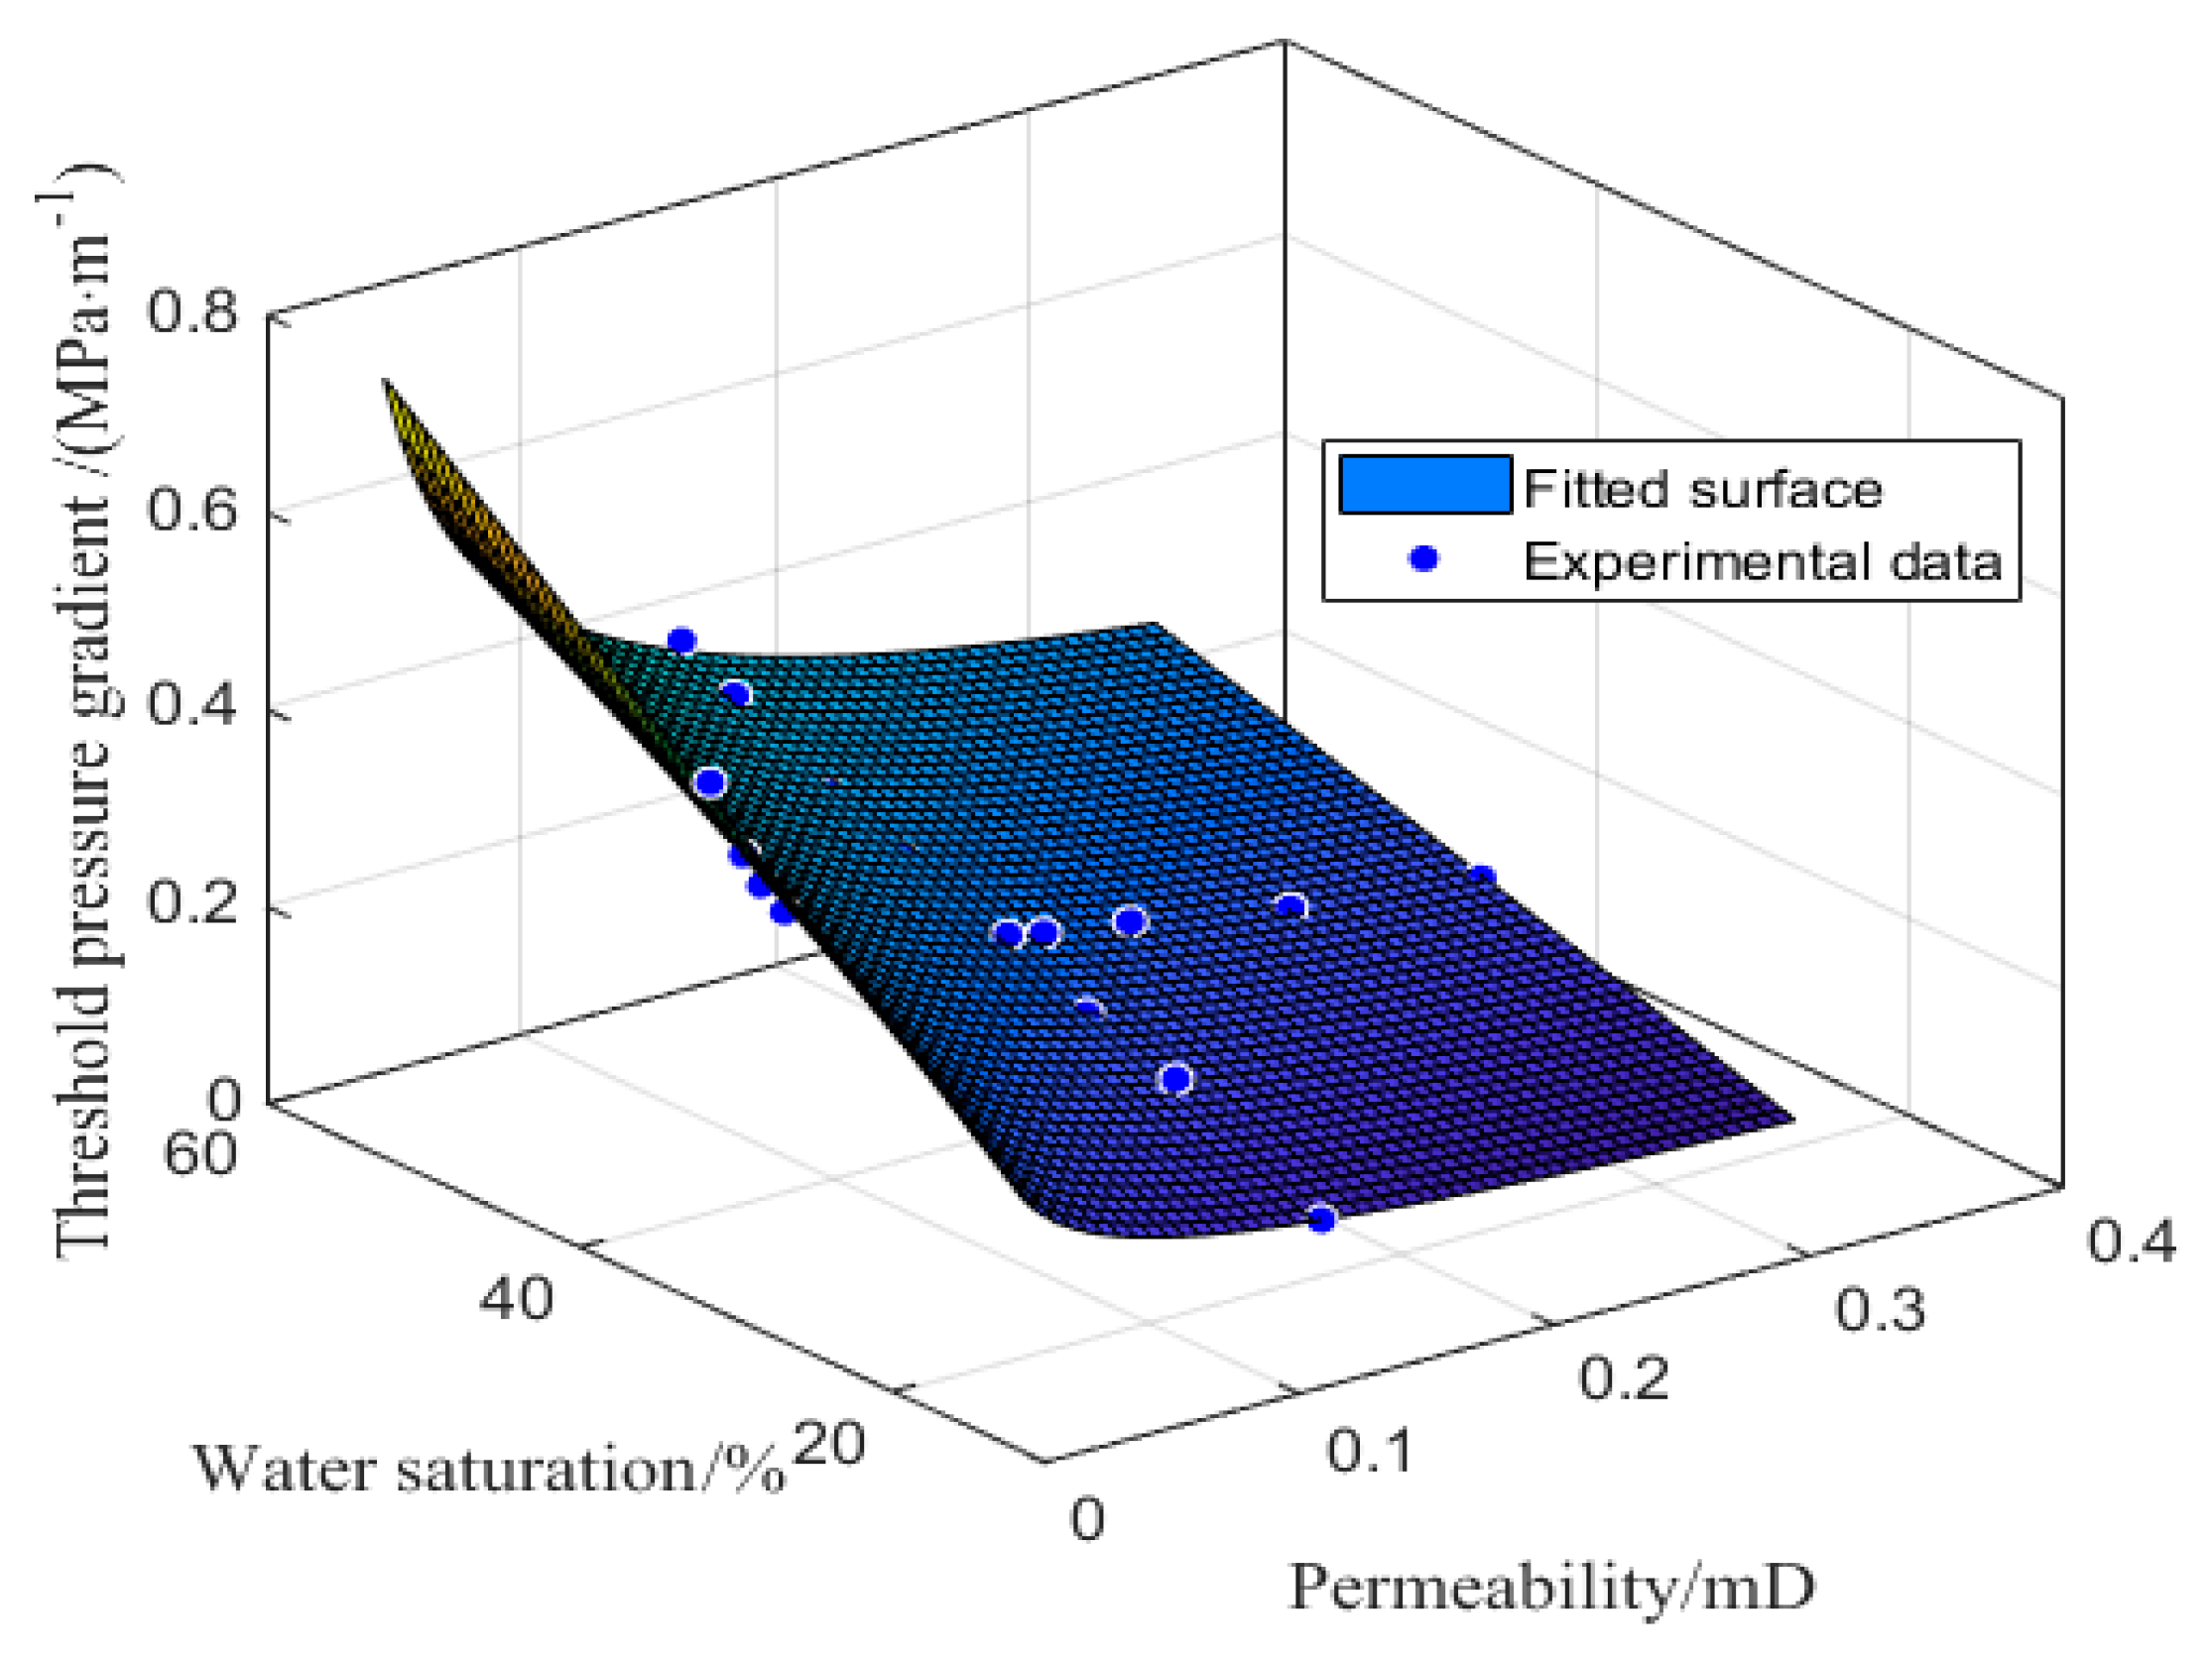
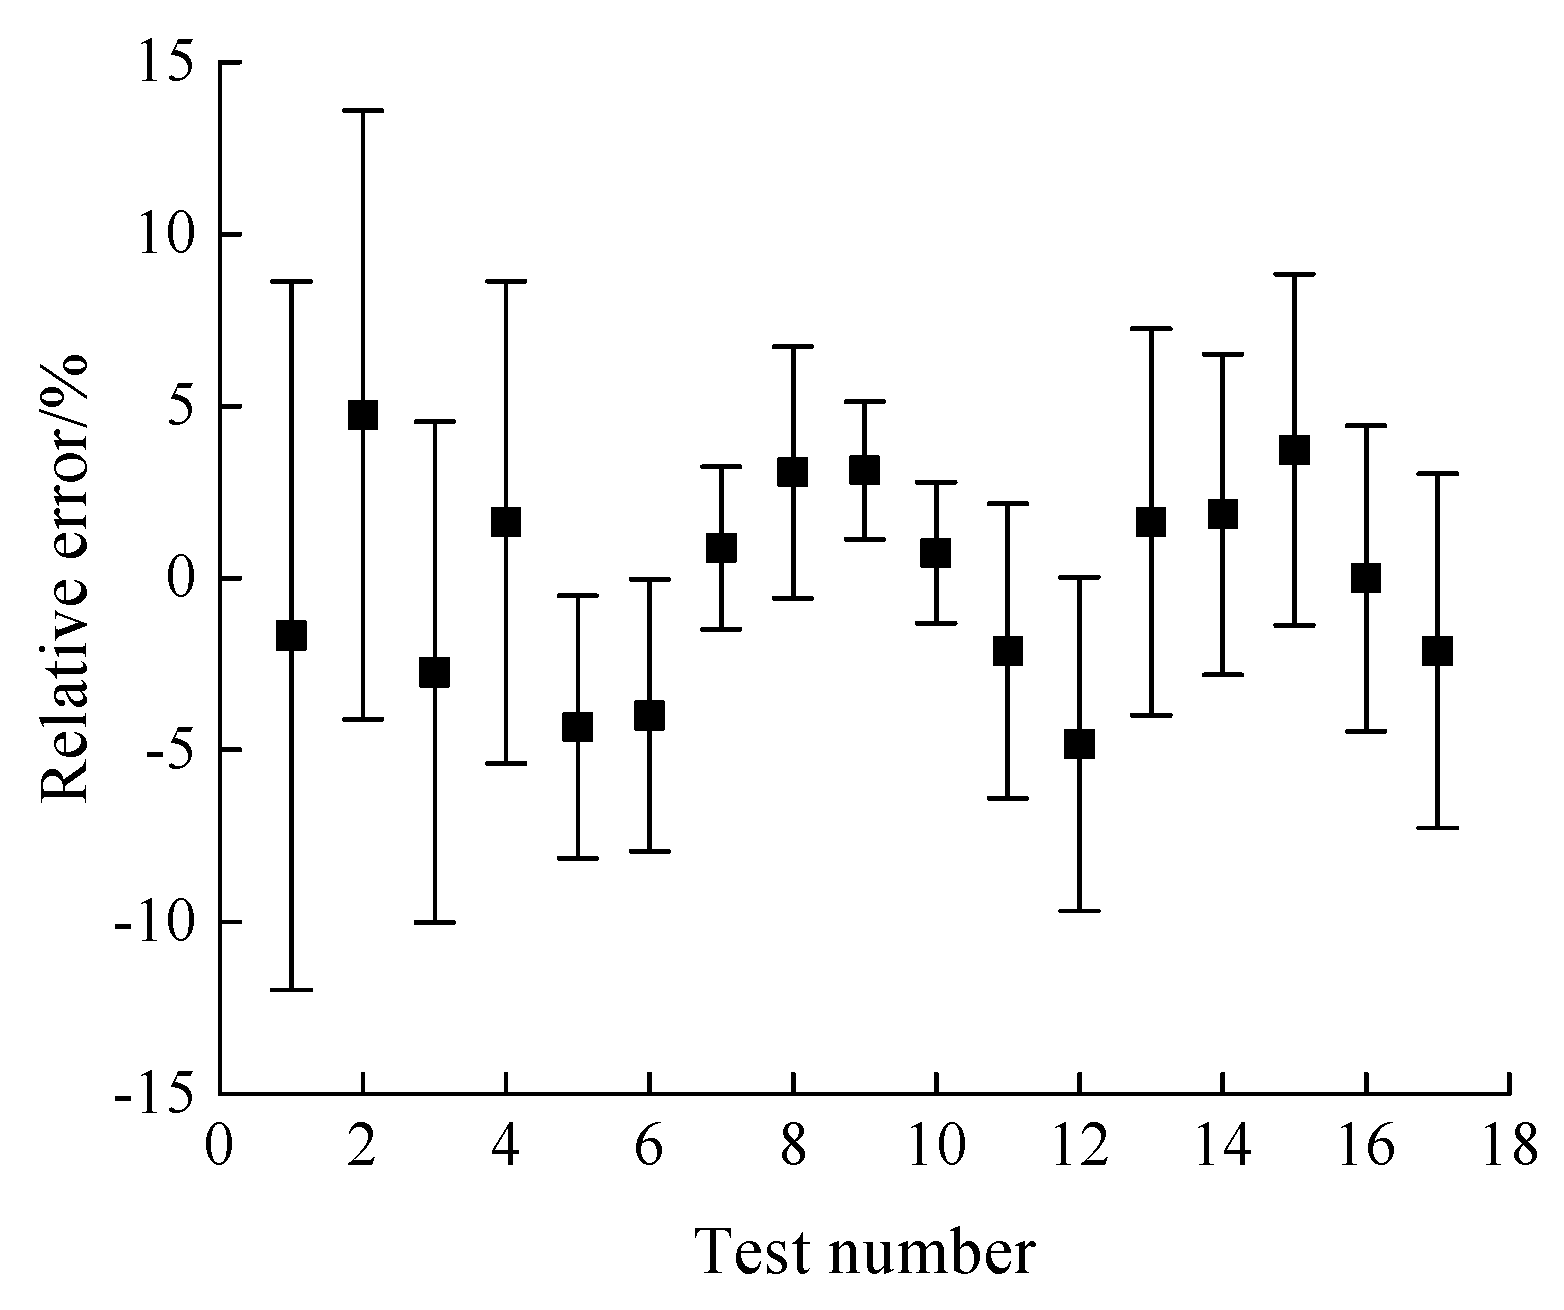
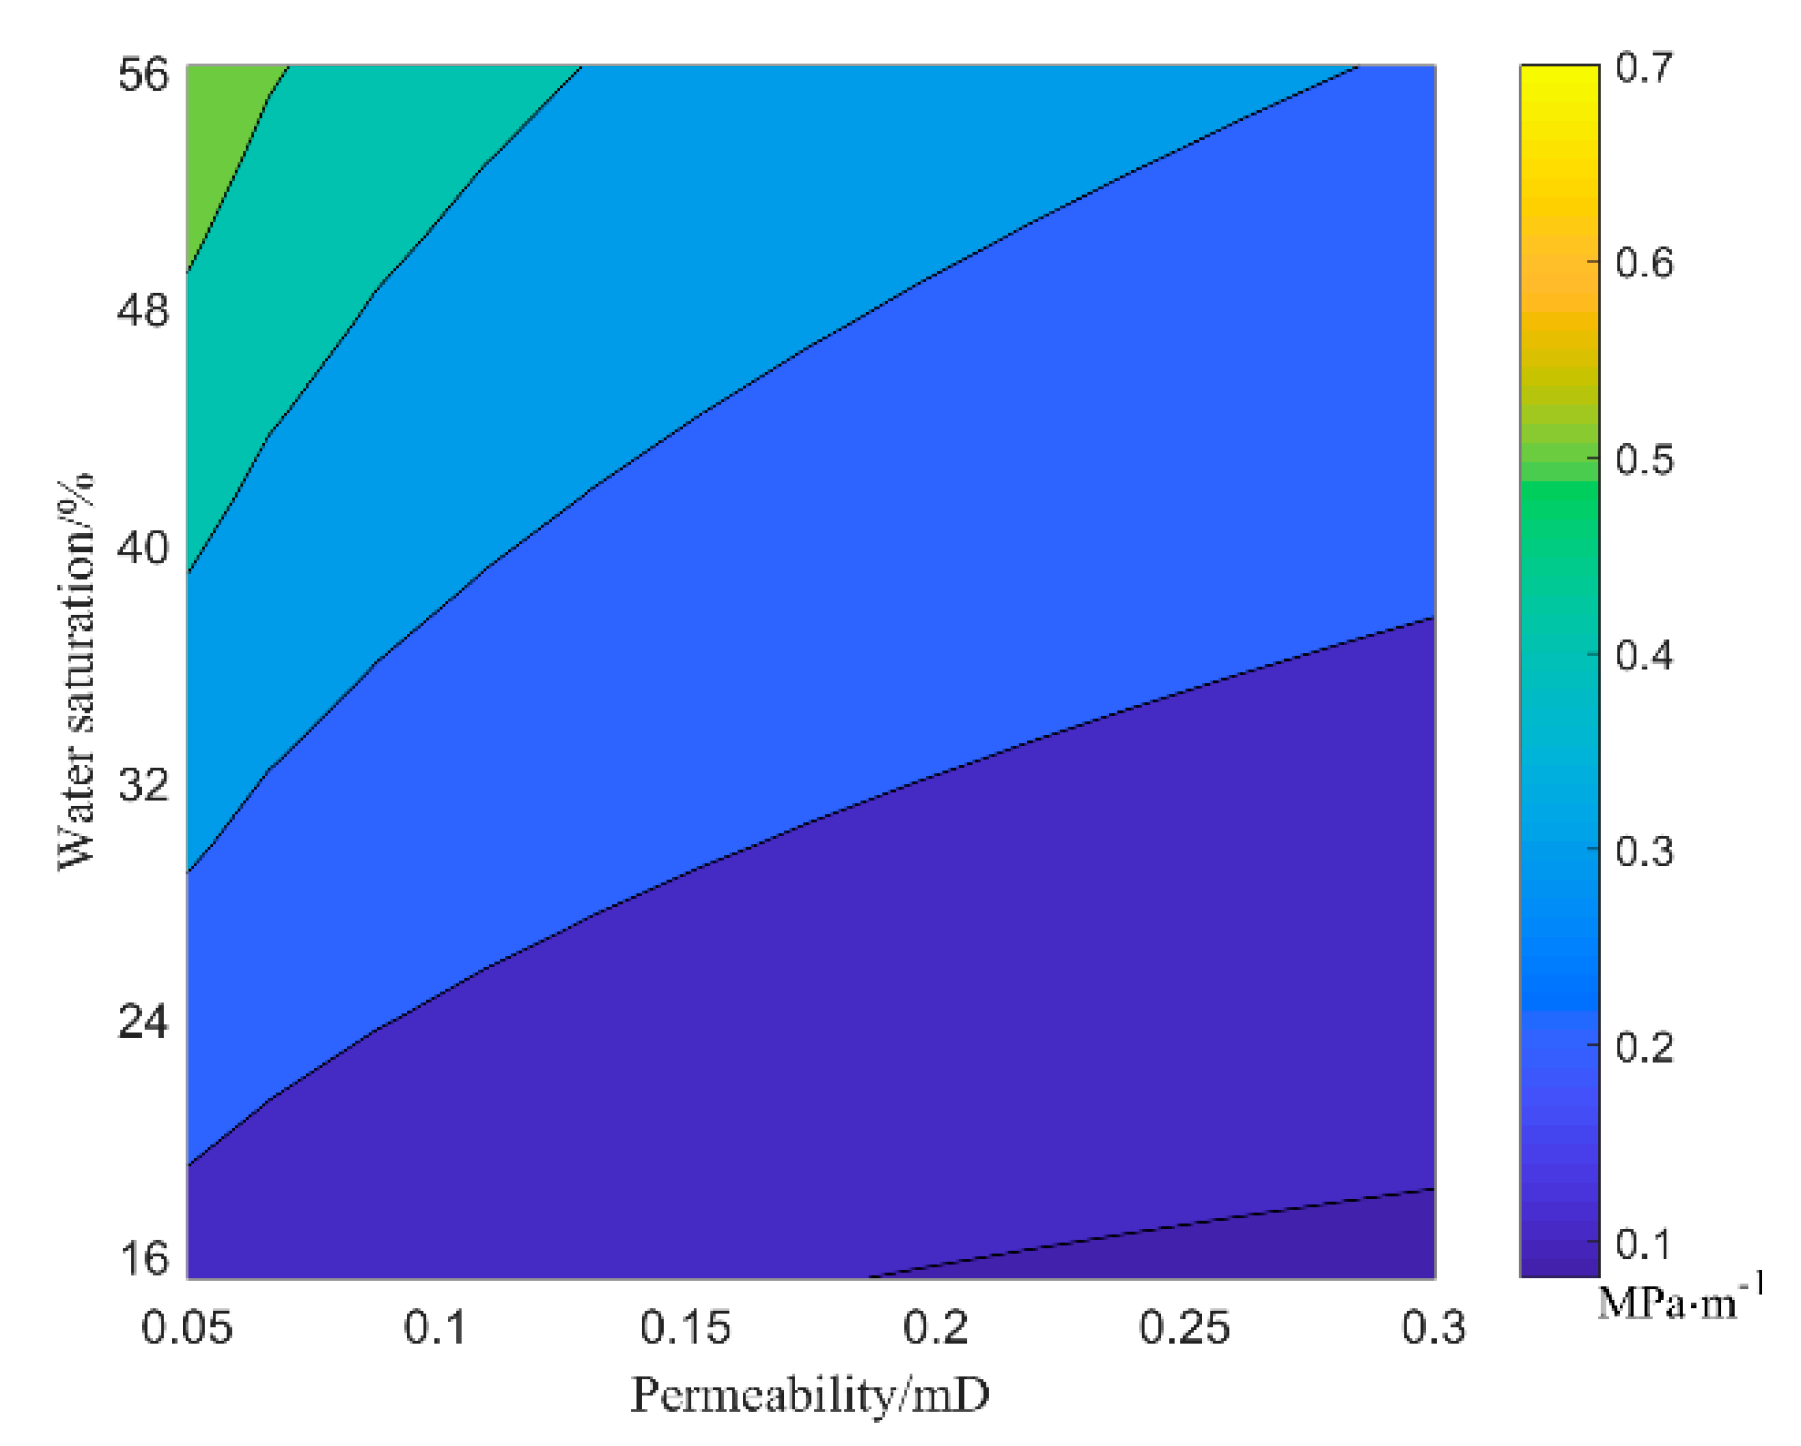
The gas seepage in the tight gas reservoir under water-bearing conditions shows a non-linear seepage characteristic, resulting in a TPG. The TPG of gas in the tight gas reservoir increases either with a decrease of core permeability or with an increase of water saturation. The TPG of gas has a power function of high correlation with core permeability or water saturation. The mathematical TPG model, paying special attention to the impact of core permeability and water saturation, reveals that permeability has a greater effect on TPG at high water saturation, while water saturation has a greater effect on TPG at low permeability.

Author Contributions

Y.L. designed the experiments; Y.W. and S.Z. performed the experiments; Y.W. and Y.L. analyzed the data; Y.S., X.W. and F.S. assisted with the characterizations; Y.W. and Y.L. established and analyzed the mathematical model; Y.W. and Y.L. wrote, revised, and edited the paper.

Funding

This work was financially supported by the National Science and Technology Major Project of China (Project No. 2017ZX05072), the National Natural Science Foundation of China (Project No. 11602221), the Natural Science Foundation of Zhejiang Province (Project No. LY19A020004), the General Research Projects of Zhejiang Provincial Department of Education (Project No. Y201840296) and Zhoushan Science and Technology Project (Project No.: 2019C21028).

Conflicts of Interest

The authors declare no conflicts of interest.

References

  1. Ji, G.; Jia, A.L.; Meng, D.W.; Guo, Z.; Wang, G.T.; Cheng, L.H.; Zhao, X. Technical strategies for effective development and gas recovery enhancement of a large tight gas field: A case study of Sulige gas field, Ordos Basin, NW China. Petrol. Explor. Dev. 2019, 46, 629–641. [Google Scholar] [CrossRef]
  2. Zhang, H.; Zhong, Y.; Kuru, E.; Kuang, J.C.; She, J.P. Impacts of permeability stress sensitivity and aqueous phase trapping on the tight sandstone gas well productivity-A case study of the Daniudi gas field. J. Petrol. Sci. Eng. 2019, 177, 261–269. [Google Scholar] [CrossRef]
  3. Huang, H.X.; Sun, W.; Ji, W.M.; Zhang, R.H.; Du, K.; Zhang, S.H.; Ren, D.Z.; Wang, Y.W.; Chen, L.; Zhang, X. Effects of pore-throat structure on gas permeability in the tight sandstone reservoirs of the Upper Triassic Yanchang formation in the Western Ordos Basin, China. J. Petrol. Sci. Eng. 2018, 162, 602–616. [Google Scholar] [CrossRef]
  4. Sun, L.D.; Fang, C.L.; Li, F.; Zhu, R.K.; He, D.B. Petroleum exploration and development practices of sedimentary basins in China and research progress of sedimentology. Petrol. Explor. Dev. 2010, 37, 385–396. [Google Scholar]
  5. Zhang, L.F.; Zhou, F.J.; Zhang, S.C.; Li, Z.; Wang, J.; Wang, Y.C. Evaluation of permeability damage caused by drilling and fracturing fluids in tight low permeability sandstone reservoirs. J. Petrol. Sci. Eng. 2019, 175, 1122–1135. [Google Scholar]
  6. Zhang, D.J.; Kang, Y.L.; Selvadurai, A.P.S.; You, L.J.; Tian, J. The role of phase trapping on permeability reduction in an ultra-deep tight sandstone gas reservoirs. J. Petrol. Sci. Eng. 2019, 178, 311–323. [Google Scholar] [CrossRef]
  7. Shen, J.; Qin, Y.; Li, Y.P.; Wang, G. Experimental investigation into the relative permeability of gas and water in low-rank coal. J. Petrol. Sci. Eng. 2019, 175, 303–316. [Google Scholar] [CrossRef]
  8. Fan, X.Q.; Wang, G.W.; Dai, Q.Q.; Li, Y.F.; Zhang, F.S.; He, Z.B.; Li, Q.B. Using image logs to identify fluid types in tight carbonate reservoirs via apparent formation water resistivity spectrum. J. Petrol. Sci. Eng. 2019, 178, 937–947. [Google Scholar] [CrossRef]
  9. Song, H.Q.; Liu, Q.P.; Yang, D.W.; Yu, M.X.; Lou, Y.; Zhu, W.Y. Productivity equation of fractured horizontal well in a water-bearing tight gas reservoir with low-velocity non-Darcy flow. J. Nat. Gas Sci. Eng. 2014, 18, 467–473. [Google Scholar] [CrossRef]
  10. Qin, S.F.; Li, F.; Li, W.; Zhou, Z.; Zhou, G.X. Formation mechanism of tight coal-derived-gas reservoirs with medium-low abundance in Xujiahe Formation, central Sichuan Basin, China. Mar. Petrol. Geol. 2018, 89, 144–154. [Google Scholar] [CrossRef]
  11. Cheng, Y.; Zhang, C.; Zhu, L.Q. A fractal irreducible water saturation model for capillary tubes and its application in tight gas reservoir. J. Petrol. Sci. Eng. 2017, 159, 731–739. [Google Scholar] [CrossRef]
  12. Yang, X.; Meng, Y.F.; Shi, X.C.; Li, G. Influence of porosity and permeability heterogeneity on liquid invasion in tight gas reservoirs. J. Nat. Gas Sci. Eng. 2017, 37, 169–177. [Google Scholar] [CrossRef]
  13. Wojnarowski, P.; Czarnota, R.; Janiga, D.; Stopa, J. Novel liquid-gas corrected permeability correlation for dolomite formation. Int. J. Rock. Mech. Min. 2018, 112, 11–15. [Google Scholar] [CrossRef]
  14. Tanikawa, W.; Shimamoto, T. Comparison of Klinkenberg-corrected gas permeability and water permeability in sedimentary rocks. Int. J. Rock. Mech. Min 2009, 46, 229–238. [Google Scholar] [CrossRef]
  15. Song, H.Q.; Cao, Y.; Yu, M.X.; Wang, Y.H.; Killough, J.E.; Leung, J. Impact of permeability heterogeneity on production characteristics in water-bearing tight gas reservoirs with threshold pressure gradient. J. Nat. Gas Sci. Eng. 2015, 22, 172–181. [Google Scholar] [CrossRef]
  16. Zeng, J.; Wang, X.Z.; Guo, J.C.; Zeng, F.H.; Zhang, Q.S. Composite linear flow model for multi-fractured horizontal wells in tight sand reservoirs with the threshold pressure gradient. J. Petrol. Sci. Eng. 2018, 165, 890–912. [Google Scholar] [CrossRef]
  17. Tian, W.B.; Li, A.F.; Ren, X.X.; Josephine, Y. The threshold pressure gradient effect in the tight sandstone gas reservoirs with high water saturation. Fuel 2018, 226, 221–229. [Google Scholar] [CrossRef]
  18. Ding, J.C.; Yang, S.L.; Nie, X.R.; Wang, Z.L. Dynamic threshold pressure gradient in tight gas reservoir. J. Nat. Gas Sci. Eng. 2014, 20, 155–160. [Google Scholar] [CrossRef]
  19. Feng, X.; Zhong, B.; Liu, X.X. Diagnosing and parsing techniques on nonlinear effects of gas seepage. Nat. Gas Ind. 2008, 28, 127–129. [Google Scholar]
  20. Zhang, F.; Jiang, Z.X.; Sun, W.; Li, Y.H.; Zhang, X.; Zhu, L.; Wen, M. A multiscale comprehensive study on pore structure of tight sandstone reservoir realized by nuclear magnetic resonance, high pressure mercury injection and constant-rate mercury injection penetration test. Mar. Petrol. Geol. 2019, 109, 208–222. [Google Scholar] [CrossRef]
  21. Guo, X.B.; Huang, Z.L.; Zhao, L.B.; Han, W.; Ding, C.; Sun, X.W.; Yan, R.T.; Zhang, T.H.; Yang, X.J.; Wang, R.M. Pore structure and multi-fractal analysis of tight sandstone using MIP, NMR and NMRC methods: A case study from the Kuqa depression, China. J. Petrol. Sci. Eng. 2019, 178, 544–558. [Google Scholar] [CrossRef]
  22. Xi, K.L.; Cao, Y.C.; Haile, B.G.; Zhu, R.K.; Jahren, J.; Bjørlykke, K.; Zhang, X.X.; Hellevang, H. How does the pore-throat size control the reservoir quality and oiliness of tight sandstones? The case of the Lower Cretaceous Quantou Formation in the southern Songliao Basin, China. Mar. Petrol. Geol. 2016, 76, 1–15. [Google Scholar] [CrossRef]
  23. Lu, S.F.; Li, J.Q.; Zhang, P.F.; Xue, H.T.; Wang, G.L.; Zhang, J.; Liu, H.M.; Li, Z. Classification of microscopic pore-throats and the grading evaluation on shale oil reservoirs. Petrol. Explor. Dev. 2018, 45, 452–460. [Google Scholar] [CrossRef]
  24. Mosavat, N.; Hasanidarabadi, B.; Pourafshary, P. Gaseous slip flow simulation in a micro/nano pore-throat structure using the lattice Boltzmann model. J. Petrol. Sci. Eng. 2019, 177, 93–103. [Google Scholar] [CrossRef]
  25. Sakhaee-Pour, A.; Agrawal, A. Integrating acoustic emission into percolation theory to predict permeability enhancement. J. Petrol. Sci. Eng. 2018, 160, 152–159. [Google Scholar] [CrossRef]
  26. Awadh, S.M.; Ali, K.K.; Alazzawi, A.T. Geochemical exploration using surveys of spring water, hydrocarbon and gas seepage, and geobotany for determining the surface extension of Abu-Jir Fault Zone in Iraq: A new way for determining geometrical shapes of computational simulation models. J. Geochem. Explor. 2013, 124, 218–229. [Google Scholar] [CrossRef]
  27. Sakran, S.; Nabih, M.; Henaish, A.; Ziko, A. Structural regime and its impact on the mechanism and migration pathways of hydrocarbon seepage in the southern Gulf of Suez rift: An approach for finding new unexplored fault blocks. Mar. Petrol. Geol. 2016, 71, 55–75. [Google Scholar] [CrossRef]
Figure 1. Schematic diagram of seepage experiment. The experimental set-up consisted of a hydrostatic core holder, a pump to maintain confining pressure, a pump to compress gas for boosting pressure, and a gas flowmeter for determining flow rate of gas.
Energies 12 04578 g001
Figure 2. General workflow to experimental procedure.
Energies 12 04578 g002
Figure 3. Rock mineral compositions of tight gas reservoirs: (a) triangulation diagram of whole rock mineral composition; (b) triangulation diagram of clay mineral composition; (c) whole rock mineral composition; (d) clay mineral composition.
Energies 12 04578 g003
Figure 4. Rock micromorphologies of tight cores: (a) a few intergranular pores formed by quartzes; (b) pores formed by dissolution of feldspars; (c) slit pores formed by dissolution of feldspars; (d) intergranular pores formed by page-like kaolinites; (e) intergranular pores formed by curved filamentous illites and illite/montmorillonite (I/MM) mixed layers; (f) intergranular pores formed by page-like kaolinites and leaf-like chlorites; (g) intergranular pores formed by leaf-like chlorites; (h) intergranular pores formed by dolomites; (i) intergranular pores formed by siderites.
Energies 12 04578 g004
Figure 5. (a) Pore size distributions of cores with different permeabilities and (b) classification of pore size distributions.
Energies 12 04578 g005
Figure 6. Effects of (a) core permeability (at Sw = 35%) and (b) water saturation (K = 0.14 mD) on the seepage law curves of gas under water-bearing conditions.
Energies 12 04578 g006
Figure 7. Influences of (a) core permeability (at Sw = 35%) and (b) water saturation (K = 0.14 mD) on relation curves of Ka and 1/(p1p2).
Energies 12 04578 g007
Figure 8. Relationship curves between the threshold pressure gradient (TPG) of gas versus (a) core permeability (at Sw = 35%) and (b) water saturation (K = 0.14 mD).
Energies 12 04578 g008
Figure 9. Fitted surface of the TPG versus permeability and water saturation.
Energies 12 04578 g009
Figure 10. Relative error between experimental values and theoretical values of the TPG calculated by empirical formula.
Energies 12 04578 g010
Figure 11. Isograms of the TPG versus permeability and water saturation.
Energies 12 04578 g011
Table 1. Physical parameters of the tight cores for seepage experiments.
Core NumberLength (cm)Diameter (cm)Porosity (%)Permeability (mD)
14.752.525.910.188
24.452.507.600.154
34.522.504.300.023
44.502.525.920.140
54.302.526.320.043
64.102.526.820.052
76.002.527.810.036
84.552.507.520.326
95.002.505.700.251

