Article

Energy and Emission Characteristics of Biowaste from the Corn Grain Drying Process

Department of Power Engineering and Transportation, Faculty of Production Engineering, University of Life Sciences in Lublin, Gleboka 28, 20-612 Lublin, Poland
*
Author to whom correspondence should be addressed.
Energies 2019, 12(22), 4383; https://doi.org/10.3390/en12224383
Submission received: 4 October 2019 / Revised: 31 October 2019 / Accepted: 15 November 2019 / Published: 18 November 2019
(This article belongs to the Special Issue Bioelectrochemical Systems (BES) for Sustainable Energy Production)

Abstract

:
This paper presents the results of the evaluation of the energy potential of waste from the process of drying corn grain in the form of corn cobs, damaged grains, corn grain husks, and mixtures of starting materials. A technical and elementary analysis was performed for the biomass under investigation. The elemental composition of ash and the tendencies for slagging and boiler slagging were determined, and the emission factors were estimated based on the elemental analysis performed. The tests showed the highest calorific value among the starting materials for corn cobs (CCs) (14.94 MJ·kg−1) and for the mixture of corn cobs with corn husk (CC–CH) (13.70 MJ·kg−1). The estimated emission factors were within ranges of 38.26–63.26 kg·Mg−1 for CO, 936–1549 kg·Mg−1 for CO2, 0.85–4.32 kg·Mg−1 for NOx, 0.91–1.03 kg·Mg−1 for SO2, and 3.88–54.31 kg·Mg−1 for dust. The research showed that the creation of mixtures from starting materials leads to materials with lower potential for negative environmental impact as well as a reduced risk of slagging and fouling of biomass boilers. However, taking into account all the parameters determined for the biomass under study, the highest energy potential was characteristic for corn cobs and the mixture of corn cobs with corn husk.

1. Introduction

Continually growing concerns about the impact of fossil fuel use on climate change and the prospect of exhaustion have led to the need to look for cleaner energy production methods. The creation of new renewable fuels is driven mainly by the need to replace the main types of fossil fuels (coal, heating oil, and natural gas) as well as to dispose of post-production waste [1]. Biomass, which is a huge potential around the world, is one of the promising alternatives to fossil fuels [2]. All types of biomass should be considered as a potential source of renewable energy such as post-production waste generated in various industries including the agri-food industry. Their storage in landfills, due to the fact of high diversity, results in the loss of resources and environmental burden. Enterprises producing waste incur fees for its disposal which have to be accounted [3].
Agri-food processing also results in the creation of various types of residues. As a result of agricultural activity and agri-food industry, mainly organic residues of vegetable and animal origin with specific energy and nutrient properties are created [4].
More and more often, agri-food waste (biomass waste) is used in energy systems and chemical synthesis [5] which is a way to solve problems related to its management in accordance with the principles of sustainable development [6]. In this perspective, the production of energy from renewable sources will help in achieving the goals of sustainable development through access to clean, safe, reliable, and economically attractive energy [7].
Thermal treatment of waste means its use as fuel in the processes of combustion (oxidation), pyrolysis, gasification [8] or plasma process [9]. The improvement of energy efficiency through the thermal transformation of waste products is increasingly common around the world. The use of waste for the production of thermal energy [10] and electricity [11] mitigates the negative effects of climate change, depletion of fossil resources, and removal of industrial waste [12].
Organic waste (biomass) can be transformed into energy using thermochemical processes, the selection of which depends on the type and quantity of available material, the desired form of energy, the environmental regulations and economic conditions [13]. There is still a large amount of waste that has not been properly assessed as a substitute fuel for wood. However, elemental analysis is necessary to assess its potential, because the composition of lignocellulosic material is different for different species, varieties, parts of plants, and growing conditions [14].
In addition to biological and environmental elements, the composition of raw materials is also influenced by other factors such as harvest time and storage methods and conditions. The variability of lignocellulosic material creates problems when selecting or developing effective methods for its processing [15].
The research available in the literature indicates a high carbon content in waste biomass from agri-food processing which translates into its high calorific value. It was found that the carbon content in industrial tomato residues was 59.64% and HHV (higher heating value) 27.08 MJ⋅kg−1 (in dried mass) [16]; spent coffee ground: 53.05% and LHV (lower heating value) 18.8 MJ⋅kg−1 (with a moisture content around 15%) [17]; hazelnut and walnut husk: 46.28% and 48.29% and LHV 46.28 MJ⋅kg−1, respectively; sunflower husk: 49.23% and LHV 17.41 MJ⋅kg−1 (at a moisture content in the range 7.80–11.94%) [18]. A lower carbon content was found in selected fore crop plant species, from 29.11% to 39.34% and LHV from 9.64 to 12.99 MJ⋅kg−1; however, these crops may constitute an additional source of biomass intended also for energy purposes [19]. Investigations were also made on the pressure processes of the agglomeration of solid agri-food waste, as a result of which fuel was obtained in the form of pellets or briquettes of a fixed geometric form. Buckwheat hulls and potato pulp [20], oat bran and apple pomace [21], wheat straw and sugar beet molasses [22], para-rubber tree residues and oil palm [23] were successfully pelleted.
In addition to the benefits of using biomass as a fuel source, technical problems related to the inorganic part of biomass fuels should also be taken into account [10]. The main ash-forming components are easily released and react with other ash elements to form compounds with a low melting point, resulting in ash sintering, contamination, and high-temperature corrosion [24]. The growing interest in burning various types of biomass also requires research on the issue of emissions of toxic exhaust components which is indispensable from the point of view of health and environmental impact assessments. There is still considerable uncertainty in the assessment of the impact of pollutant emissions accompanying the combustion of biomass on air quality on a local scale [25]. This is caused not only by the lack of data on the amount of biomass burned, but also the lack of emission factors that would characterize real combustion. Only a comprehensive assessment of the parameters related to the use of various types of biomass for energy purposes, including post-production waste from agri-food industry, will allow to achieve the maximum biomass energy efficiency with the minimum effort necessary to obtain it and the maximum reduction of negative environmental impact.
Agricultural solid biomass has been widely recognized as an important source of renewable energy with huge production potential. Among other things, a huge energy potential was found in maize stalks [9,26]. In the process of obtaining biomass directly from corn for energy purposes [27], various types of waste [28] are created, which constitute a potential source of energy as indicated by References [10,29]. The use of corn for grain also leads to the production of several types of waste associated with the process of obtaining grain [30] and their further processing. Due to the high moisture content of the obtained grains, the drying process is of particular importance. Therefore, due to the large amount of waste biomass arising in the drying process of corn grain, which is a problem in the management and utilization by dryers, an attempt was made to evaluate the energy potential for these materials. Corn residues are problematic biowaste due to the fact of their low density and high operating costs related to management, transport, and storage. Nevertheless, corn waste is a valuable potential energy resource that can be used in both thermochemical and biochemical conversion processes. In previous research, the pyrolysis of corn cobs [31,32] and corn stalks [33] as well as their gasification [34] and combustion [35] was realized. Increasing the density of waste biomass through pressure agglomeration (pelleting, briquetting) allows its volume to be reduced and its properties as a solid biofuel to improve. Technical problems in the production of fuel granulates from post-production corn waste are presented in Reference [36]. However, there are no studies which describe the use of corn residue in relation to the complex challenges of their use as a renewable fuel. The energy characteristics of corn waste, emission factors, and slagging indicators are of utilitarian significance for their potential use for energy purposes. Therefore, the aim of this work was to determine the suitability of waste from the process of drying corn grain for energy purposes based on the characteristics of energy parameters and the assessment of estimated solid and gaseous emissions for this biomass.
The aim of the work was to determine the physiochemical properties of corn drying residues and their mixtures as a potential biofuel and as an alternative way to utilize organic waste from industrial dryers.

2. Materials and Methods

2.1. Material

This study covered 8 types of biomass which were the by-products from the process of corn kernels drying and mixtures of these materials in ratios of 4:1 v/v:
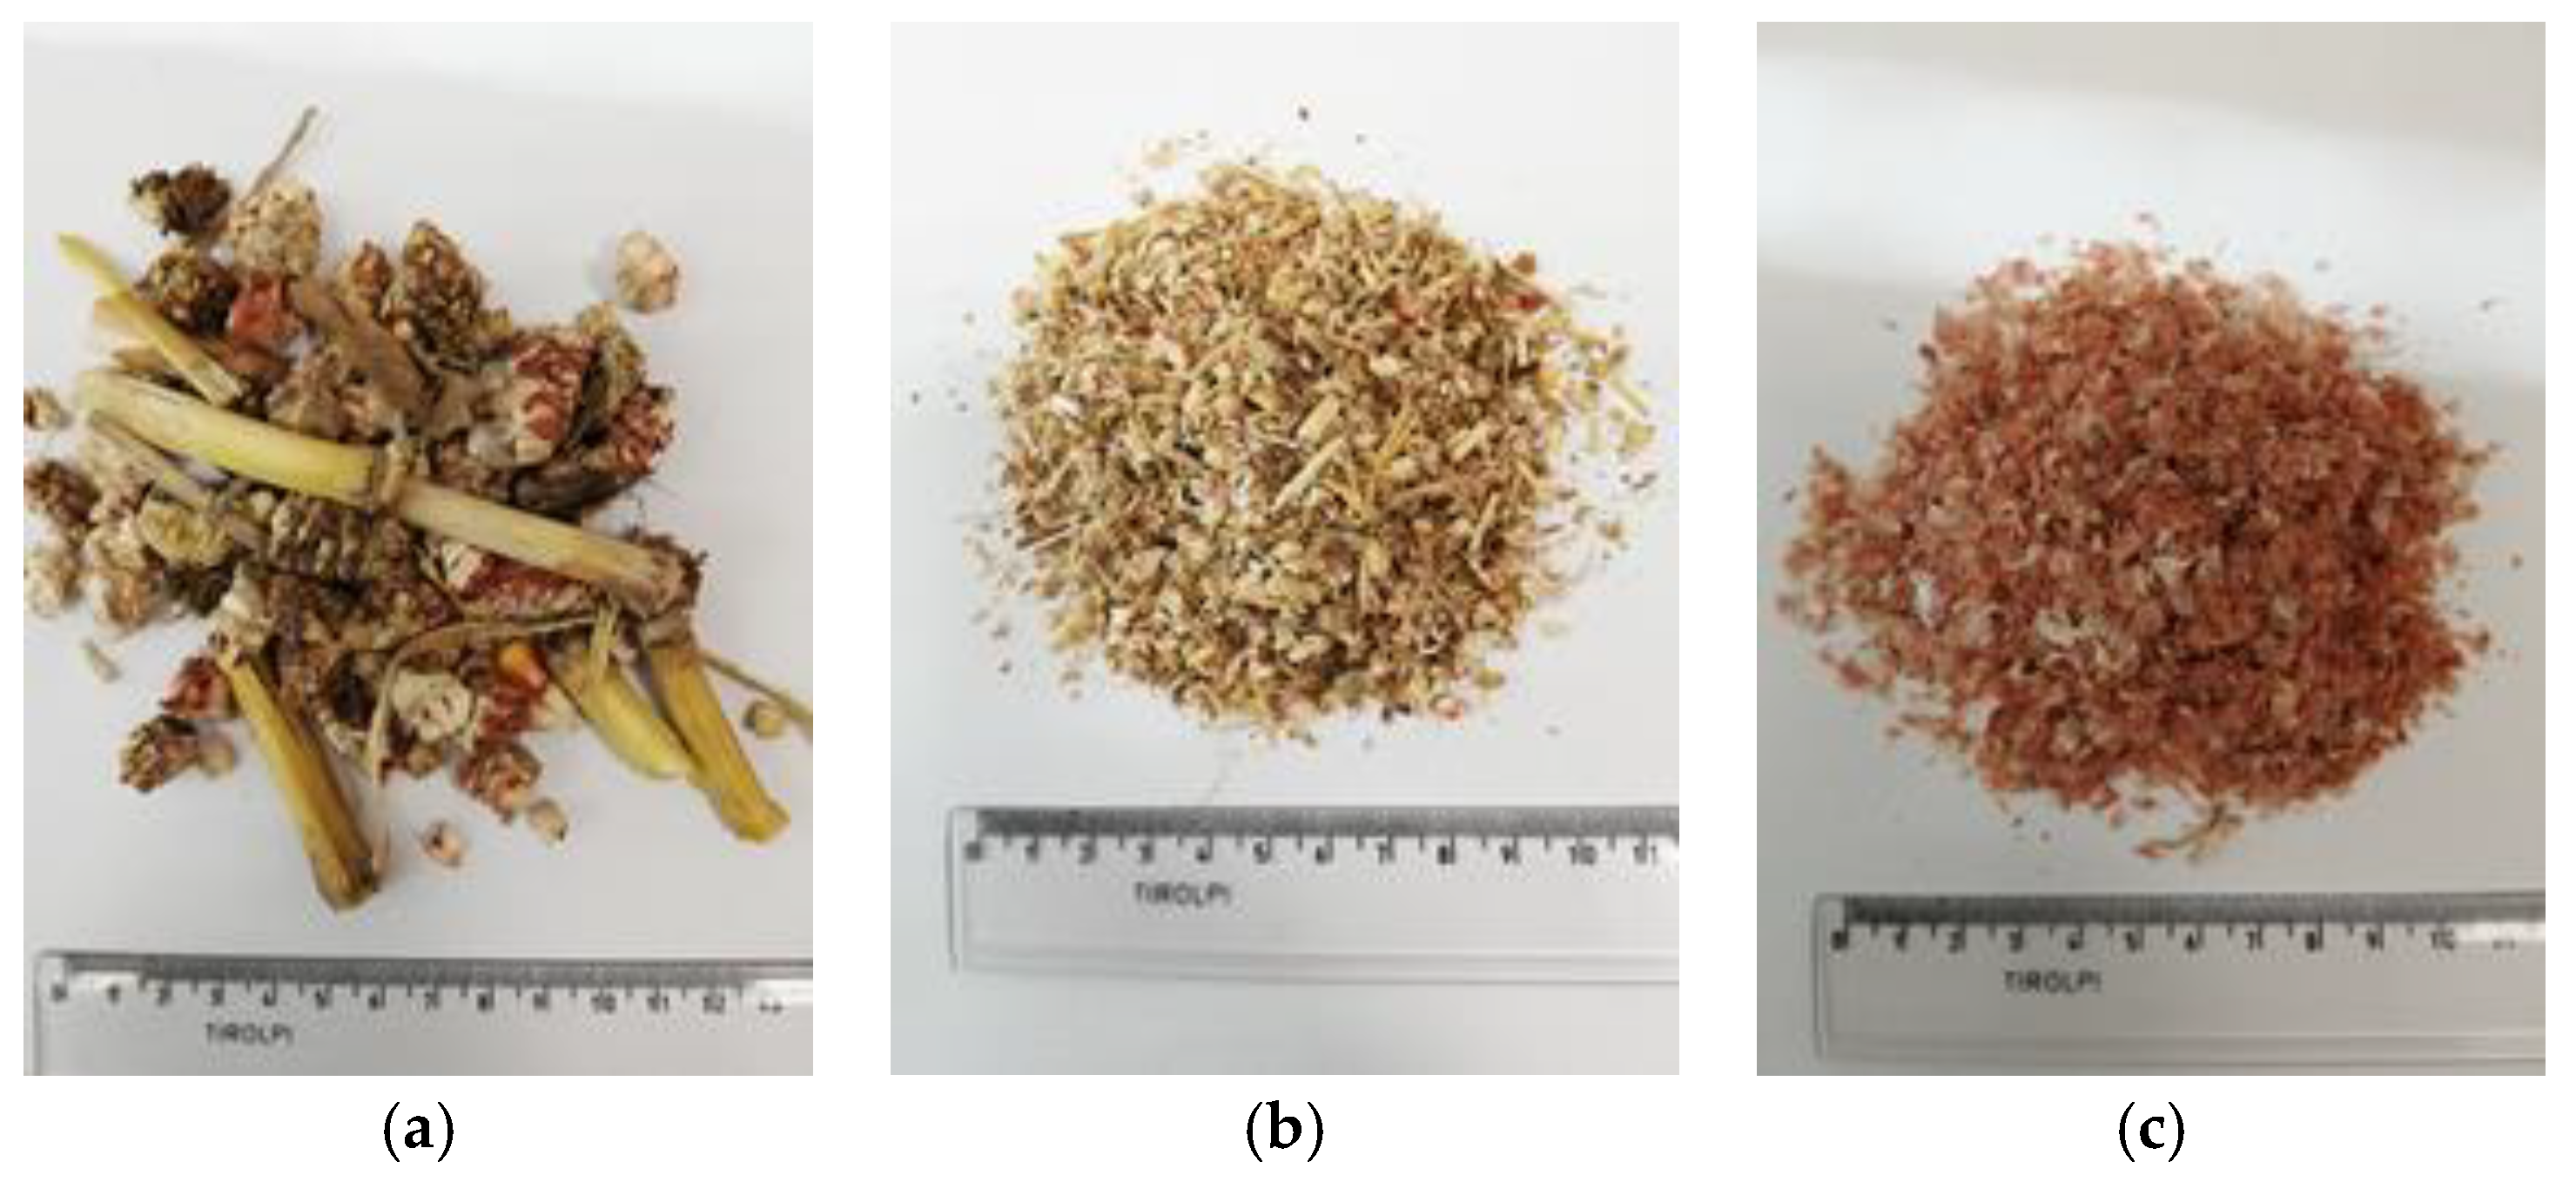
  • Corn Cobs (CCs)—the remains of corn cobs without grain (Figure 1a);
  • Corn Grains (CGs)—grain residues from the process of drying and cleaning corn kernels (Figure 1b);
  • Corn Husk (CH)—waste in the form of the husks of the corn grains (Figure 1c);
  • Corn Cobs and Corn Husk 4:1 v/v (CC–CH);
  • Corn Grains and Corn Cobs 4:1 v/v (CG–CC);
  • Corn Cobs and Corn Grains 4:1 v/v (CC–CG);
  • Corn Husk and Corn Grains 4:1 v/v (CH–CG);
  • Corn Husk and Corn Cobs 4:1 v/v (CH–CC);
  • Corn Grains and Corn Husk 4:1 v/v (CG–CH).
Mixtures were prepared in volume (v/v) relations due to the application nature of the research in the grain drying industry. This approach simplifies the process of preparing mixtures for other processes (e.g., compaction) and reduces the need to weigh the material for biofuel preparation. The use of a mass ratio would require in-preparation of the fuel based on the tested materials to use additional work, which would increase the cost-effectiveness of waste utilization.
The creation of the mixtures of starting materials was aimed at determining the optimal composition of biofuels with high energy potential, low solid and gas emissions as well as good combustible properties in biomass boilers. The materials were obtained from a cereal dryer from the Lublin Province, Poland, and it came from the 2018 harvest 2018.

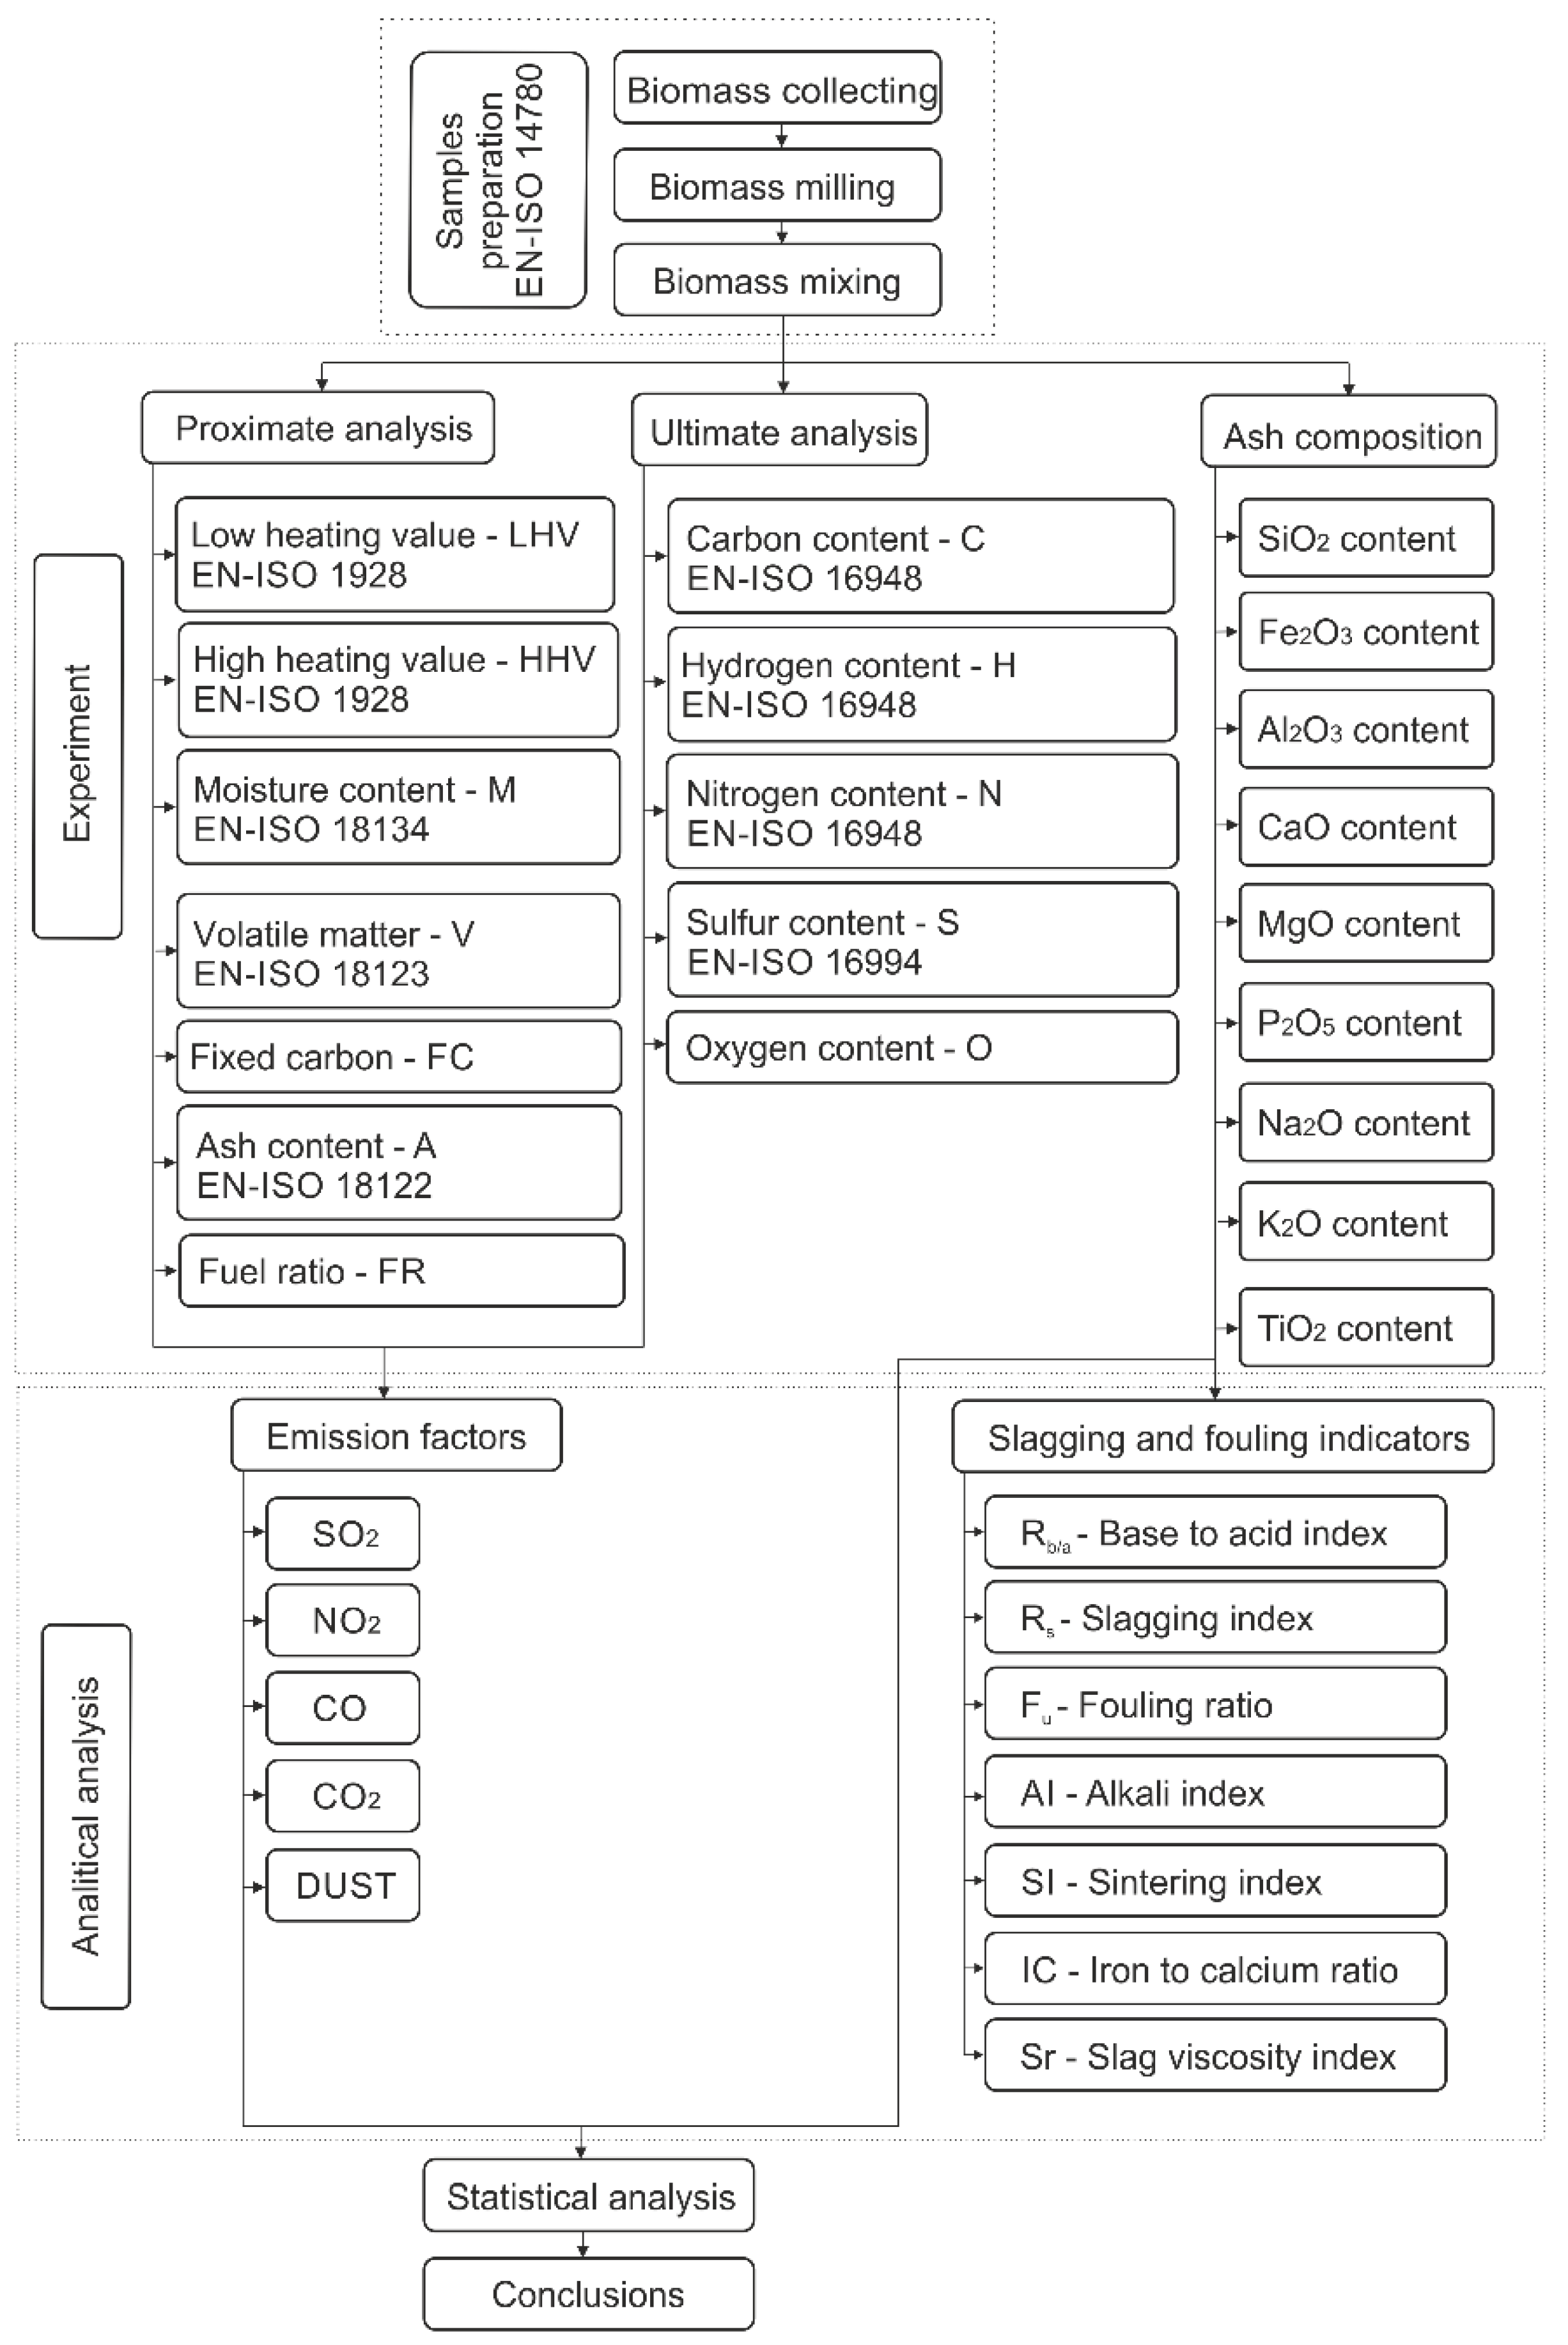
2.2. Experimental Procedures

The research material was prepared in accordance with EN-ISO 14780. The mixtures were prepared using a universal mixer, mixing appropriate proportions of starting materials for 2 min. The recovered material was ground in an analytical mill (IKA A11, IKA-Werke GmbH & Co. KG, Staufen, Germany). The material was milled from 0.5 to 1 mm fraction. A scheme of the experimental procedure is shown in Figure 2.
The quality of the analytical results regarding their accuracy was verified using standard certified materials. In order to obtain accurate and stable experimental data, each experiment was repeated at least three times.

2.3. Proximate Analysis

The determination of moisture content (M) was carried out by the thermogravimetric method in accordance with the requirements of EN ISO 18134, volatile compounds (V) EN ISO 18123, ash (A) EN ISO 18122 using a LECO TGA 701 thermogravimeter (LECO Corporation, Saint Joseph, MI, USA). The higher heating value (HHV) was determined using a LECO AC 600 isoperibolic calorimeter (LECO Corporation, Saint Joseph, MI, USA) according to EN-ISO 1928. The lower heating value (LHV) was calculated on the basis of combustion heat. The determinations were carried out on dry samples.

2.4. Ultimate Analysis

The carbon, hydrogen, nitrogen, and sulfur contents were determined using a LECO CHNS 628 elemental analyzer (LECO Corporation, Saint Joseph, MI, USA). The bound carbon content (FC) was defined as shares up to 100%. The elemental composition (i.e., C, H, N, S) of the flammable substance was determined in dry samples.
The content of carbon, hydrogen, and nitrogen in the dry biomass was determined by instrumental methods (C and H by high-temperature combustion with IR detection, N by means of the katharometer method) according to EN-ISO 16948; 0.1 g of material was weighed according to the analysis requirements. The sulfur content was determined by the high-temperature combustion method with IR detection in accordance with EN-ISO 16994 in which 0.3 g of material was weighed. The oxygen content (O) was added as shares up to 100%. The fuel ratio (FR) was defined as the ratio of fixed carbon (FC) to volatile content (V).

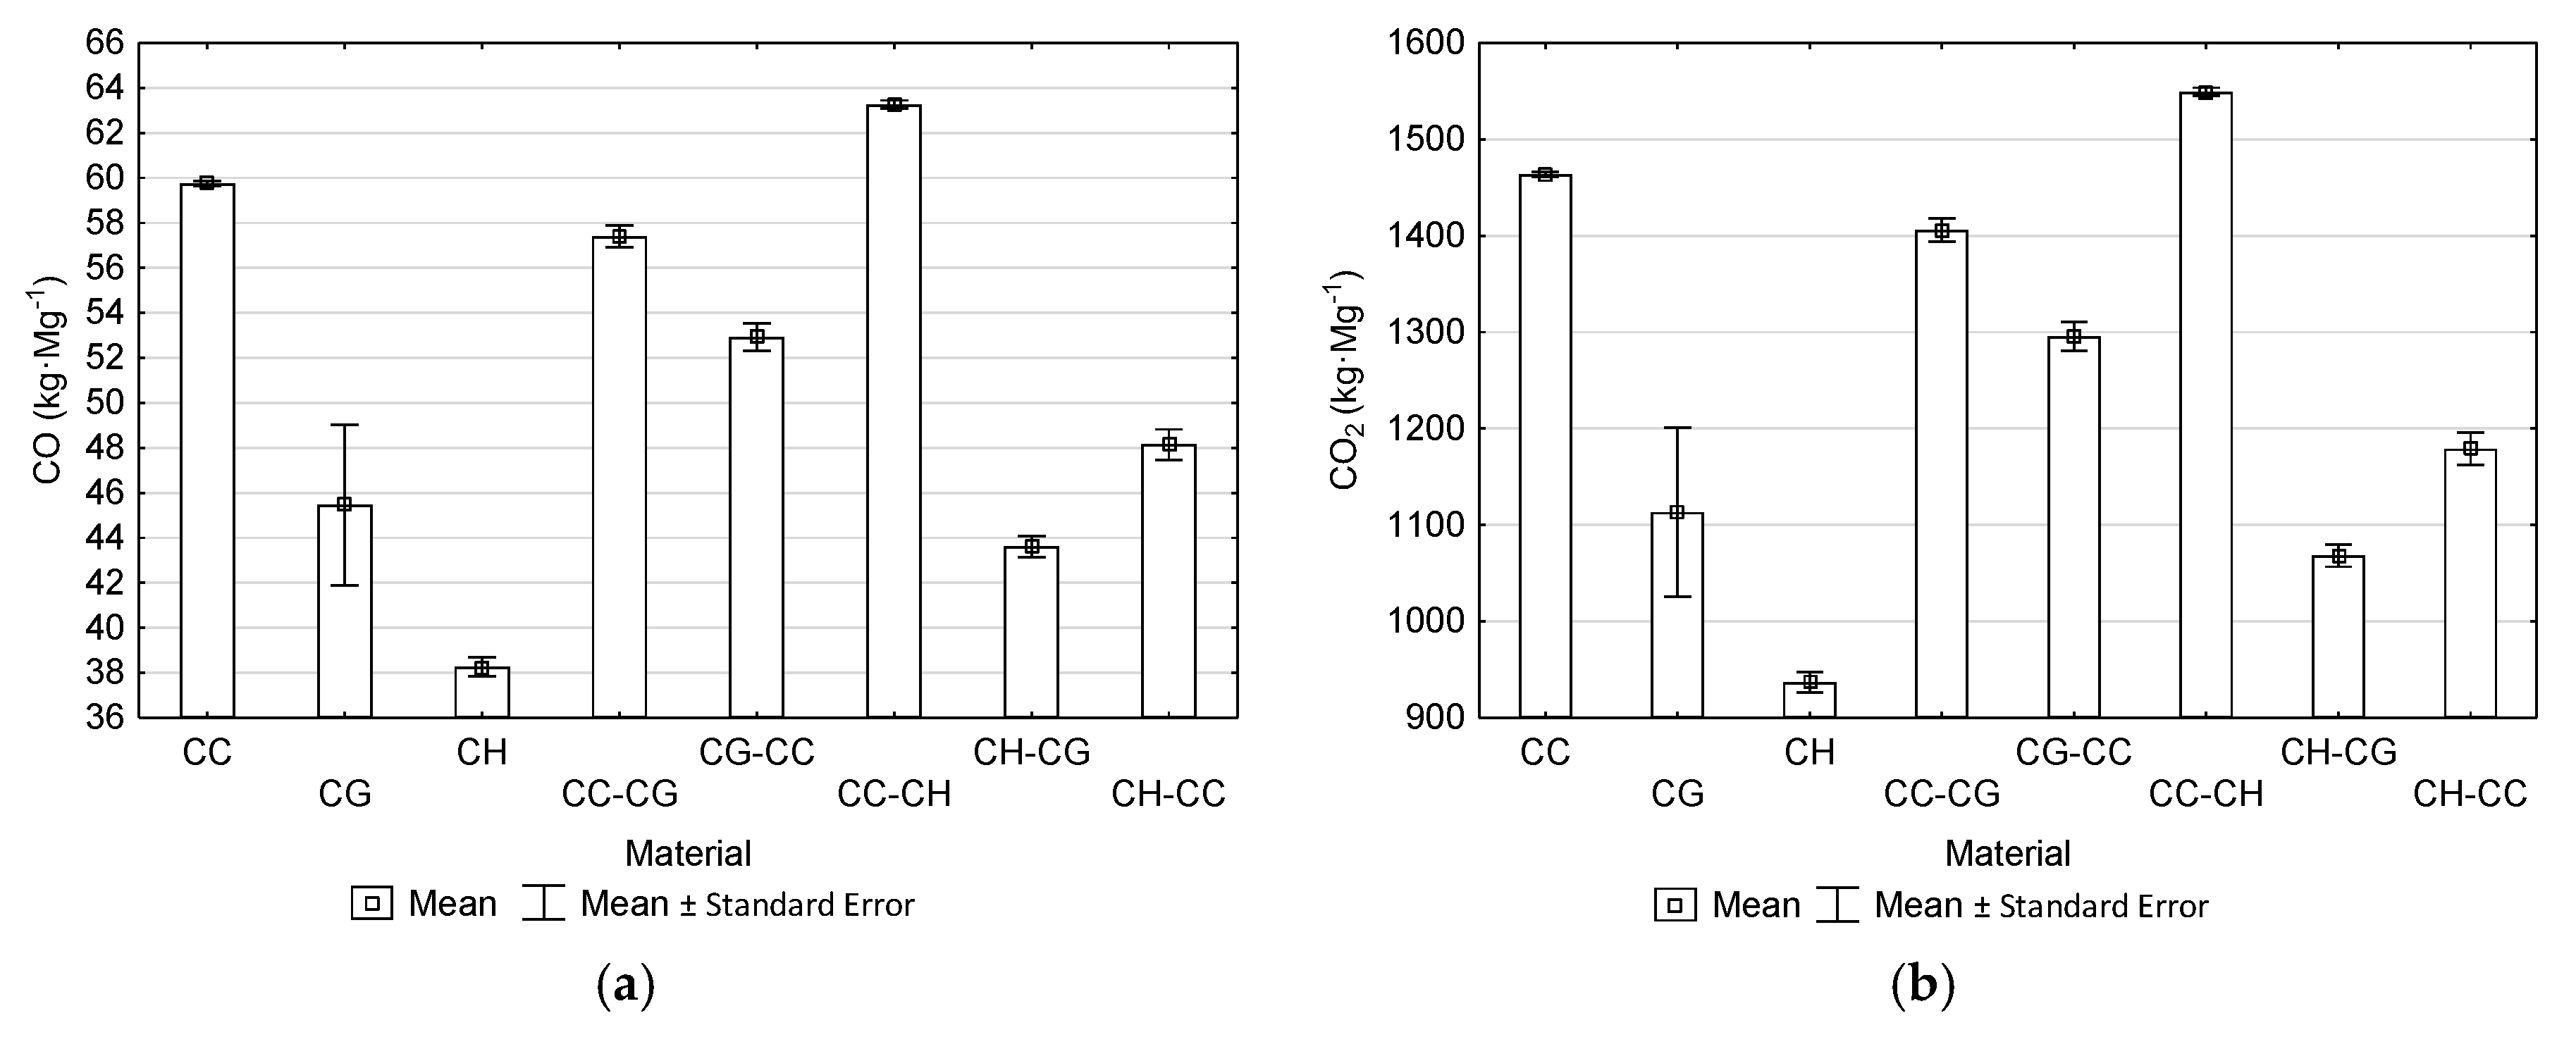
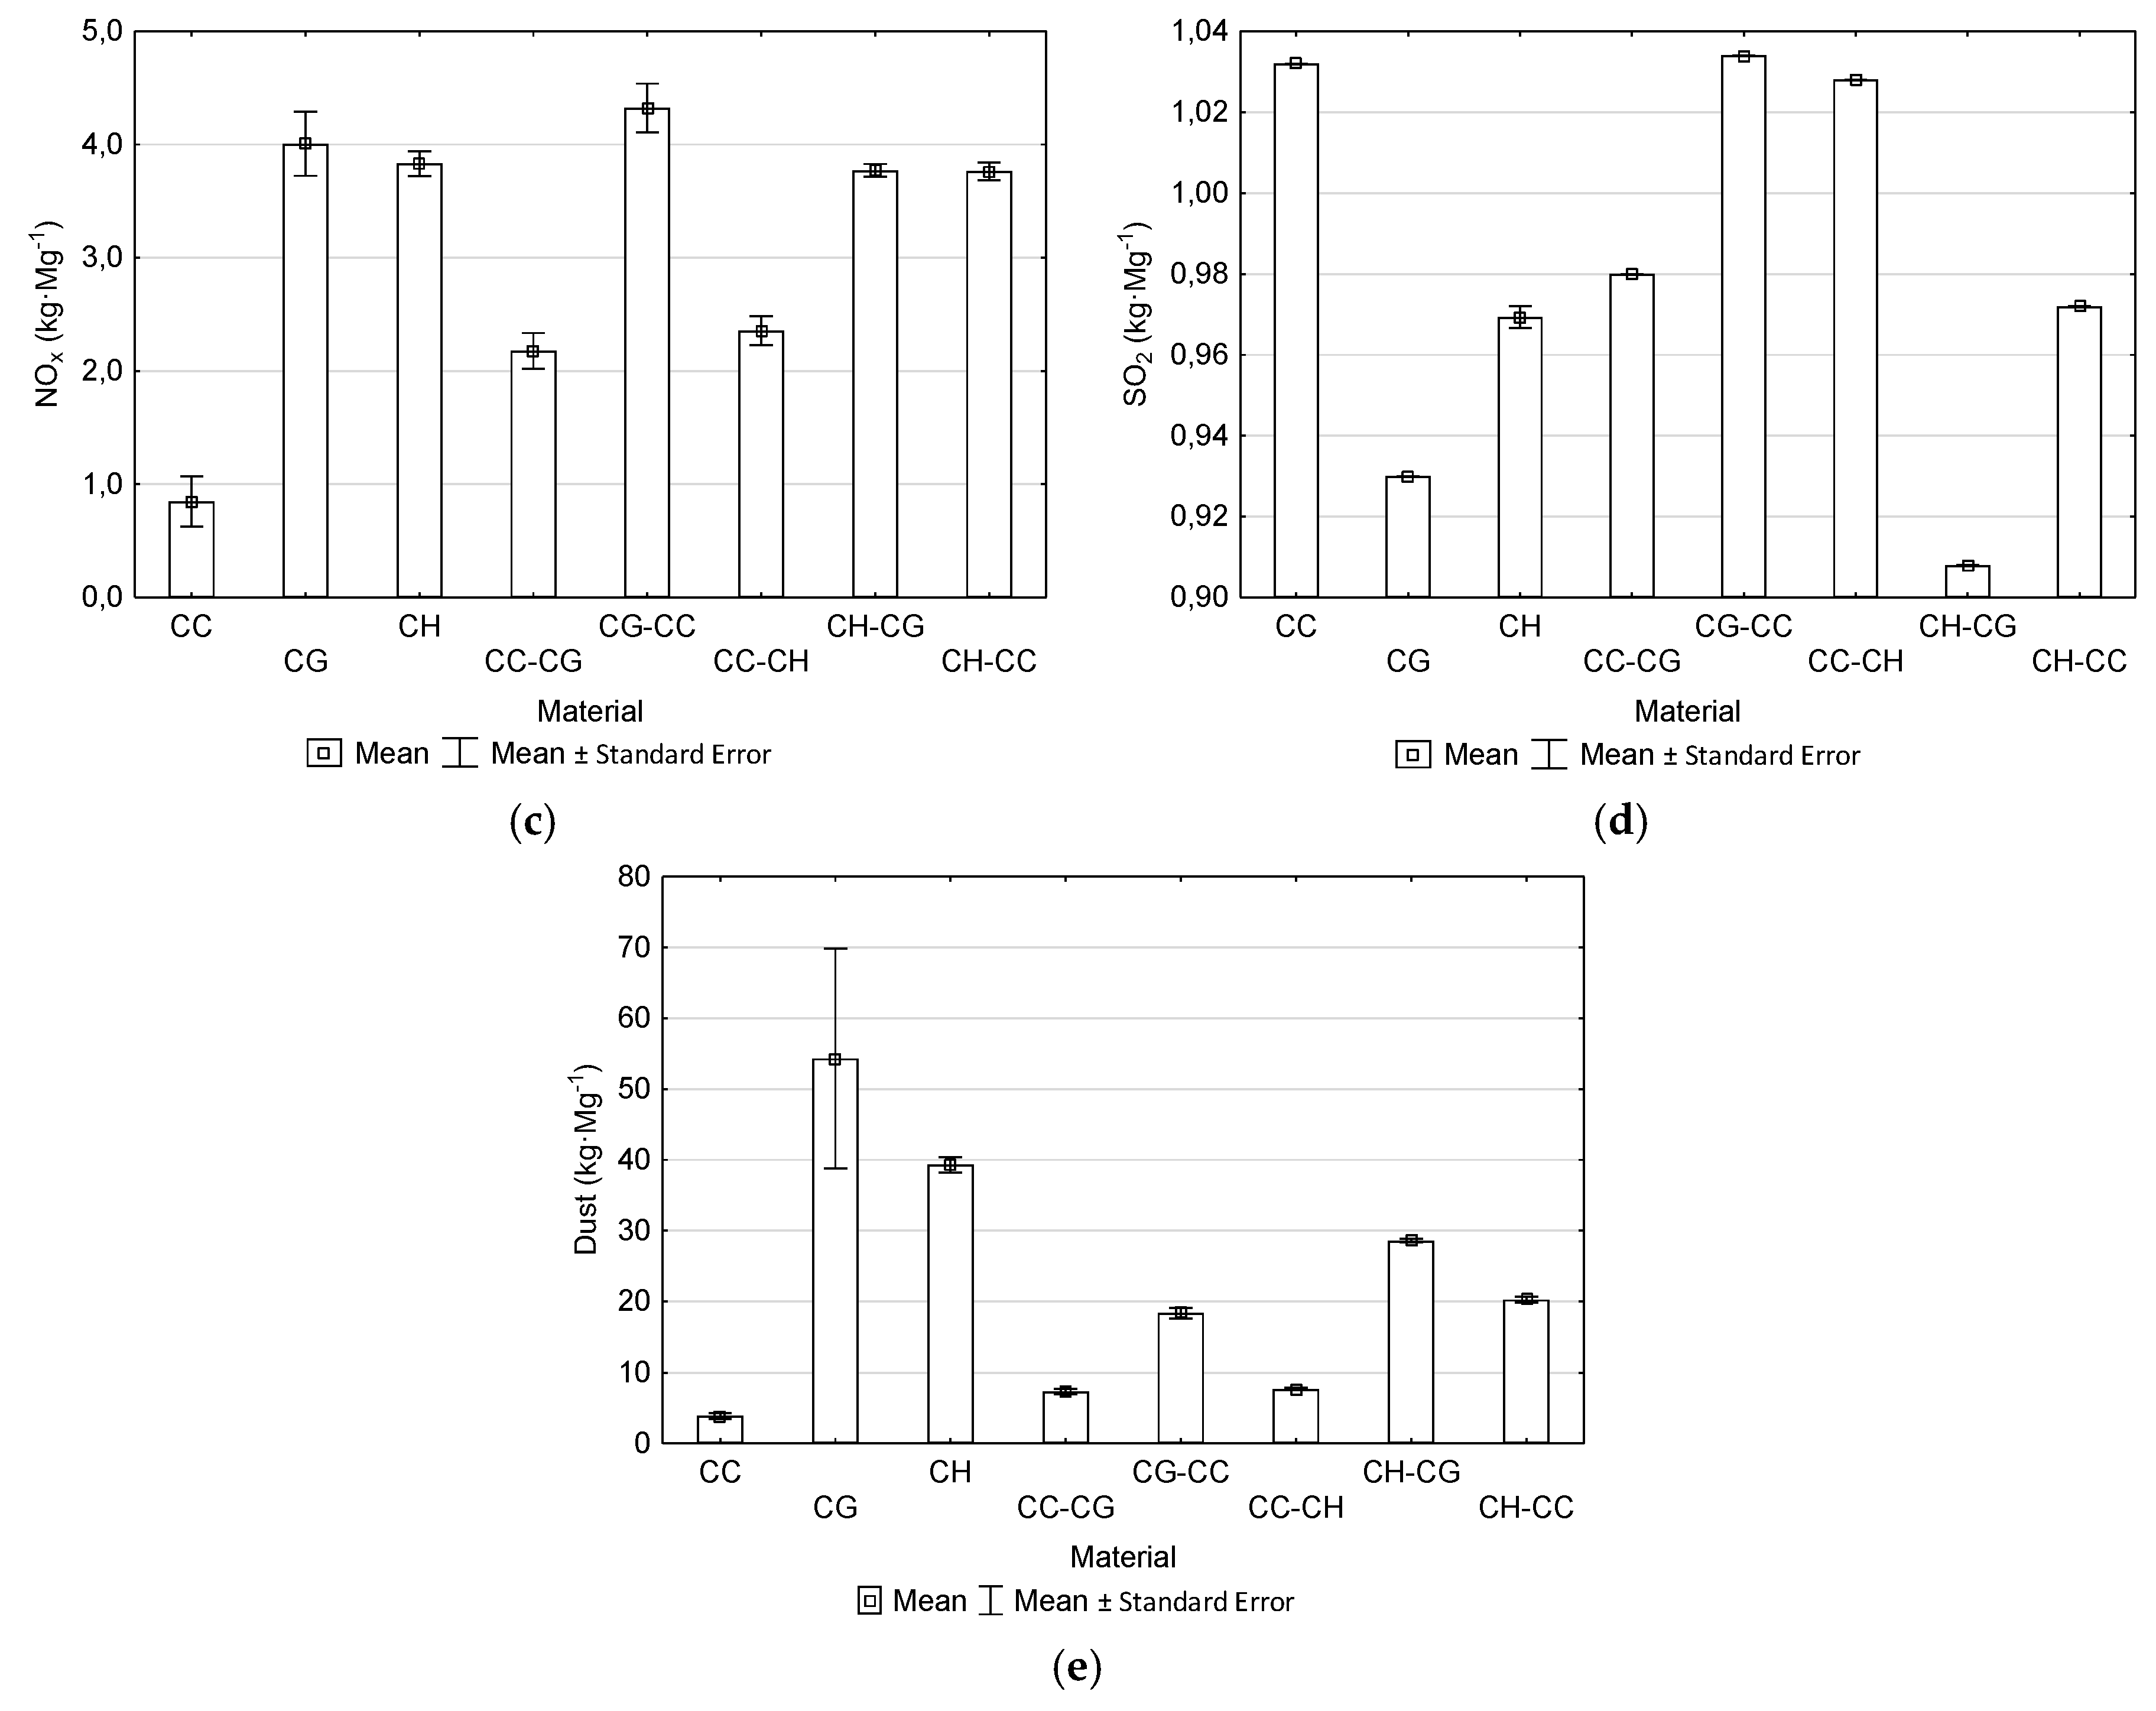
2.5. Emission Factors

Emission levels for individual materials were estimated on the basis of the indicator method of emission estimation [37]. Equations (1)–(10) [38] were used to estimate the volume of individual emissions.
SO2:
E = B w S
NO2/CO/CO2:
E = B w
Dust:
E = B w A 100 / ( 100 K )
where: E—amount of emission (kg), B—fuel consumption (Mg), S—sulfur content in fuel (%), A—ash content in fuel (%), K—combustible components content in dust (5% for biomass) (%), w—emission factor.
The determination of CO emission factor (kg·kg−1) was determined using Equation (4):
CO = 28 12 E c ( C _ CO / C )
where: 28/12—molar mass ratio of carbon monoxide and carbon, EC—emission of chemically pure coal (kg·kg−1), C_CO/C—part of the carbon emitted as CO (biomass = 0.06).
The chemically pure coal index (kg·kg−1) was estimated with Equation (5):
E c = c u c
where: uc—part of carbon oxidized in the combustion process (biomass = 0.88).
To estimate the CO2 emission factor (kg·kg−1), Equation (6) was used:
CO 2 = 44 12 ( E c 12 28 CO 12 16 E CH 4 26.4 31.4 E NMVOC )
where: 44/12—molar mass ratio of carbon dioxide and pure coal, 12/28—molar mass ratio of carbon dioxide and carbon monoxide, 12/16—molar mass ratio of carbon and methane, ECH4—methane emission factor, ENMVOC—emission index of non-methane VOCs (biomass = 0.009).
The CH4 emission factor (kg·kg−1) was estimated with Equation (7):
E CH 4 = 16 12 E c ( C _ CH 4 / C )
where: 16/12—molar mass ratio of methane and coal, C_CH4/C—part of the carbon emitted as CH4 (biomass = 0.005).
Equation (8) allowed the estimation of NOx emissions factor (kg·kg−1):
NO x = 46 14 E c N / C ( N _ NO x / N )
where: 46/14—molar mass ratio of nitrogen dioxide to nitrogen, N/C—nitrogen to carbon ratio in biomass, N_NOx/N—part of nitrogen emitted as NOx (biomass = 0.122).
The sulfur dioxide emission factor (kg·kg−1) was estimated according to Equation (9):
SO 2 = 2 S 100 ( 1 r )
where: 2—molar mass ratio of SO2 and sulfur, S—sulfur content in fuel (%), r—coefficient determining the part of total sulfur retained in the ash.
Rising factor and dust emission factor Edust (kg·Mg−1) was calculated according to Equation (10):
E dust = 1.5 A 100 η 0 100 k
where: 1.5·A—rising index, indicating the amount of dust formed during combustion (kg·Mg−1), 1.5—coefficient denoting 15% of the ashes rising in the form of volatile dust, A—ash content in fuel (%), η0—dust removal efficiency (biomass = 20%), k—content of flammable parts in the dust (biomass = 5%).

2.6. Ash Chemical Composition

Thermogravimetry was used to incinerate biomass samples. Approximately 2 g of biomass was put into the ceramic crucible which was heated from ambient temperature to the incineration temperature (550 °C) at the heating rate of 10 °C·min−1 in the air stream. The heated samples were then kept at the incineration temperature for 4 h. After lowering the temperature to about 100 °C, the ash was removed and placed in a desiccator, then cooled to ambient temperature. The prepared ash was dosed directly into the measuring cups of the device and analyzed. The content of the oxides of the elements in the ash was determined using the EDXRF method using a NEX QC+QuantEZ elemental analyzer (RIGAKU Americas Holding Company, Inc., Austin, TX, USA). The obtained oscillograms were directly analyzed by the camera’s software. The content of silicon as SiO2, iron as Fe2O3, aluminum as Al2O3, calcium as CaO, magnesium as MgO, phosphorus as P2O5, sodium as Na2O, potassium as K2O, and titanium as Ti2O were determined in ashes.

2.7. Slagging and Fouling Indicators

Based on the ash chemical composition expressed as major oxides, the ultimate and proximate analysis was conducted, and the ash slagging and pollution indices were computed according to the correlations (Equations (11)–(17)) referred to in related papers [39,40]:
(a)
Base to Acid Index (Rb/a):
R b / a = Fe 2 O 3   +   CaO   +   MgO   +   Na 2 O   +   K 2 O SiO 2   +   Al 2 O 3
(b)
Slagging Index (Sulfur Ratio) (Rs):
R s = R b / a S d
where: Sd—percentage of S in dry fuel.
(c)
Fouling Ratio (Fu):
Fu = R b / a ( Na 2 O   +   K 2 O )
(d)
Alkali Index (AI):
AI = ( K 2 O   +   Na 2 O ) A HHV
where: A—the percentage of ash obtained at 550 °C; HHV—higher heating value (MJ·kg−1).
(e)
Sintering Index (SI):
SI = CaO   +   MgO Na 2 O   +   K 2 O
(f)
Iron-to-Calcium Ratio (IC):
IC = Fe 2 O 3 CaO
(g)
Slag Viscosity Index (Sr):
Sr = SiO 2 100 SiO 2   +   Fe 2 O 3   +   CaO   +   MgO
Table 1 presents the ranges of indicators determining the risk level for slagging and ash tracking, according to the data in the literature, based on Equations (11)–(17) presented above.
Depending on the obtained values of tendency to track and slag ash from the examined biomass, the risk was marked as extremely high (E), high (H), medium (M), and low (L).

2.8. Statistical Analysis

The test results were statistically analyzed using Statistica 13 software (Dell Inc. (2016), Dell Statistica (data analysis software system) version 13. Tulsa, OK, USA). The Shapiro–Wilk compliance test checked the normality of the distribution of the examined features. Using the ANOVA test (Fisher-Snedecor distribution), the influence of the type of material on the obtained heat of combustion and calorific values, ash content, volatile substances, levels of C, H, N, and S content of elements in ash and emission factors were tested. The Levene test was used to determine the homogeneity of variance. The Tukey test (HSD) determined the significant differences among the examined groups of features (small letters in the rows in the tables show significant differences among features in the group). To illustrate the estimated emission factors, box-plots charts were used. All statistical analyses were performed at the significance level of α = 0.05.

3. Results and Discussion

3.1. Proximate and Ultimate Analysis of the Tested Biomass

The suitability of by-products from the agri-food industry for energy use depends on the chemical and physical properties of the biomass. Individual types of tested materials differed not only in properties, but also in the amount of chemical substances contained. Determination of the chemical composition of the waste from drying corn grain allows for comparison with other types of biomass. However, it should be noted that biomass as plant material is not a chemically homogeneous substance, and even a systematic analysis does not allow for a complete assessment of its technical usefulness. Table 2 summarizes the results of the technical-elemental analysis of the tested raw materials (calorific value and heat of combustion, moisture content, ash, volatiles as well as the content of carbon, hydrogen, nitrogen, and sulfur).
The results obtained for CH and its mixtures were different than those quoted in the literature for similar materials. This situation was a result of the testing waste materials obtained from the grain drying process and not clean materials. It should be noted that the data given in the literature refer to purified materials; however, the purpose of the work was to indicate the energy potential of the waste material found in dryers in real conditions. Material purification would be expensive and would not reflect the actual properties of the biomass being tested.
The moisture content of the tested raw materials varied and ranged from 7.83% to 12.91%. At the same time, it should be noted that it was not high, considering the suitability of the tested biomass for combustion as these values (below 20%) predestine materials as solid biofuels. According to Reference [38,39], waste in which the ash content is below 60%, the content of organic parts above 40%, and moisture content below 50% incinerate autonomously. At the same time, it is expected that the higher the content of organic (combustible) substances and the lower the ash and moisture content, the higher the calorific value [42].
Comparison of the calorific value (LHV) of the tested raw materials showed that the values of this parameter were very diverse and ranged from 9.69 MJ⋅kg−1 for CH to 14.94 MJ⋅kg−1 for CCs, and on average they amounted to 12.69 MJ⋅kg−1. This value was much lower than the calorific value of wood and also lower than the calorific value of agrobiomass. In Reference [43], the average calorific value for coniferous wood was 20.24 MJ⋅kg−1, and References [44,45] state the calorific value of hardwood in the range of 18.7–19 MJ⋅kg−1. High calorific value was also found for agri-food by-products in the form of walnut husk, hazelnut husk, and sunflower husk (17.4–19.13 MJ⋅kg−1) [21], coffee grounds (18.5 MJ⋅kg−1) [17], and (20.5 MJ⋅kg−1) [46], and post-production tomato residues (19.5 MJ⋅kg−1) [47] and waste from palm oil production (shells and palm fibers) (16.38 MJ⋅kg−1) [48]. On the other hand, energy plant biomass [49] and agrobiomass [50] have a similar calorific value (15.6–18.3 MJ⋅kg−1).
The ash content in the tested biomass ranged from 5.12% in CG to 31.11% in CH. It was also high in several other cases (CH–CG 22.62%, CH–CC 16.03%) and deviated from the average content in other types of biomass. The average ash content in various types of by-products from the agri-food industry is 5%, and in the agrobiomass and biomass of herbaceous plants, 5.7%, with the average content in all types of biomass 6.8% [51].
The volatile matter content ranged from 49.98% in CH to 69.24% in CCs. As stated in Reference [51], which is a review of the research results on the chemical composition of biomass, the average content of volatiles in various types of by-products from the agri-food industry is 74%, in agrobiomass and biomass of herbaceous plants 75.2%, with a very similar average content in all biomass types at 75.4%.
Due to the fact that the amount and type of pollution generated in the biomass combustion process depend not only on process factors but also on the type of biomass burned [52], it is important to know its elemental composition [53]. It affects the emissions resulting from their combustion and also their use in stoves and boilers [54]. The content of carbon, hydrogen, nitrogen, and sulfur in the tested raw materials did not differ from the content of these elements in other types of biomass. The carbon content ranged from 31.06% in CH to 48.51% in CCs. As stated in Reference [55], the carbon content in various types of biomass ranges from 38.45% in rice straw to 57% in birch bark. The average carbon content in various types of by-products from the agri-food industry is 50.2%. In agrobiomass and biomass of herbaceous plants it is 49.9% with an average content in all biomass types of 51.3% [51].
The obtained level of hydrogen content ranged from 3.63% in CH to 6.39% in CG. The content of hydrogen in biomass varies and ranges from 3.2% in waste from pepper production to 10.2% in tamarack bark [55]. The average hydrogen content in various types of by-products from the agri-food industry is 6.3%. In agrobiomass and biomass of herbaceous plants it is 6.2% with an average content in all biomass types of 6.3% [51].
The nitrogen content ranged from 0.29% in CCs to 1.34% in CG. The nitrogen content in biomass is small and ranges from 0.1% in wood sawdust and rice husk to 1.6% in olive husk [55]. The average content of nitrogen in various types of by-products from the agri-food industry is 1.4%, while in agrobiomass and biomass of herbaceous plants it is 1.2% with the same average content in all types of biomass [51].
The sulfur content in the tested biomass was similar. It ranged from 0.45% in the CH–CG mix to 0.52% in the CCs. In general, the sulfur content of biomass was low, ranging from 0% in spruce wood and hazelnut shell to 0.6% in pepper waste [55]. The average sulfur content in various types of by-products from the agri-food industry is 0.16%. In the agrobiomass and biomass of herbaceous plants it is 0.15% with an average content in all biomass types of 0.19% [51]. It should be noted that the sulfur content of a biofuel is a very important parameter and should be systematically monitored, because the level of SO2 emission depends on the sulfur turnover in the fuel burned. The higher it is, the higher the SO2 charge introduced into the environment.
Based on the fuel indicator (FR), it can be concluded that the tested kinds of biomass differ from one another other as a potential fuel. This indicator ranges from 0.19–0.39. Such a differentiation of the fuel indicator allows us to state that CH and the mixture of CH and damaged corn grains (CH–CG) are the materials with low energy potential. In contrast, the mixture of corn cobs with corn husk (CC–CH) and the mixtures of corn grain with corn husk (CG–CH) deserve special attention.
The statistical analysis showed the effect of the type of material on all the tested characteristics except for oxygen content. Statistically significant differences among the groups were noted, in particular for CG.

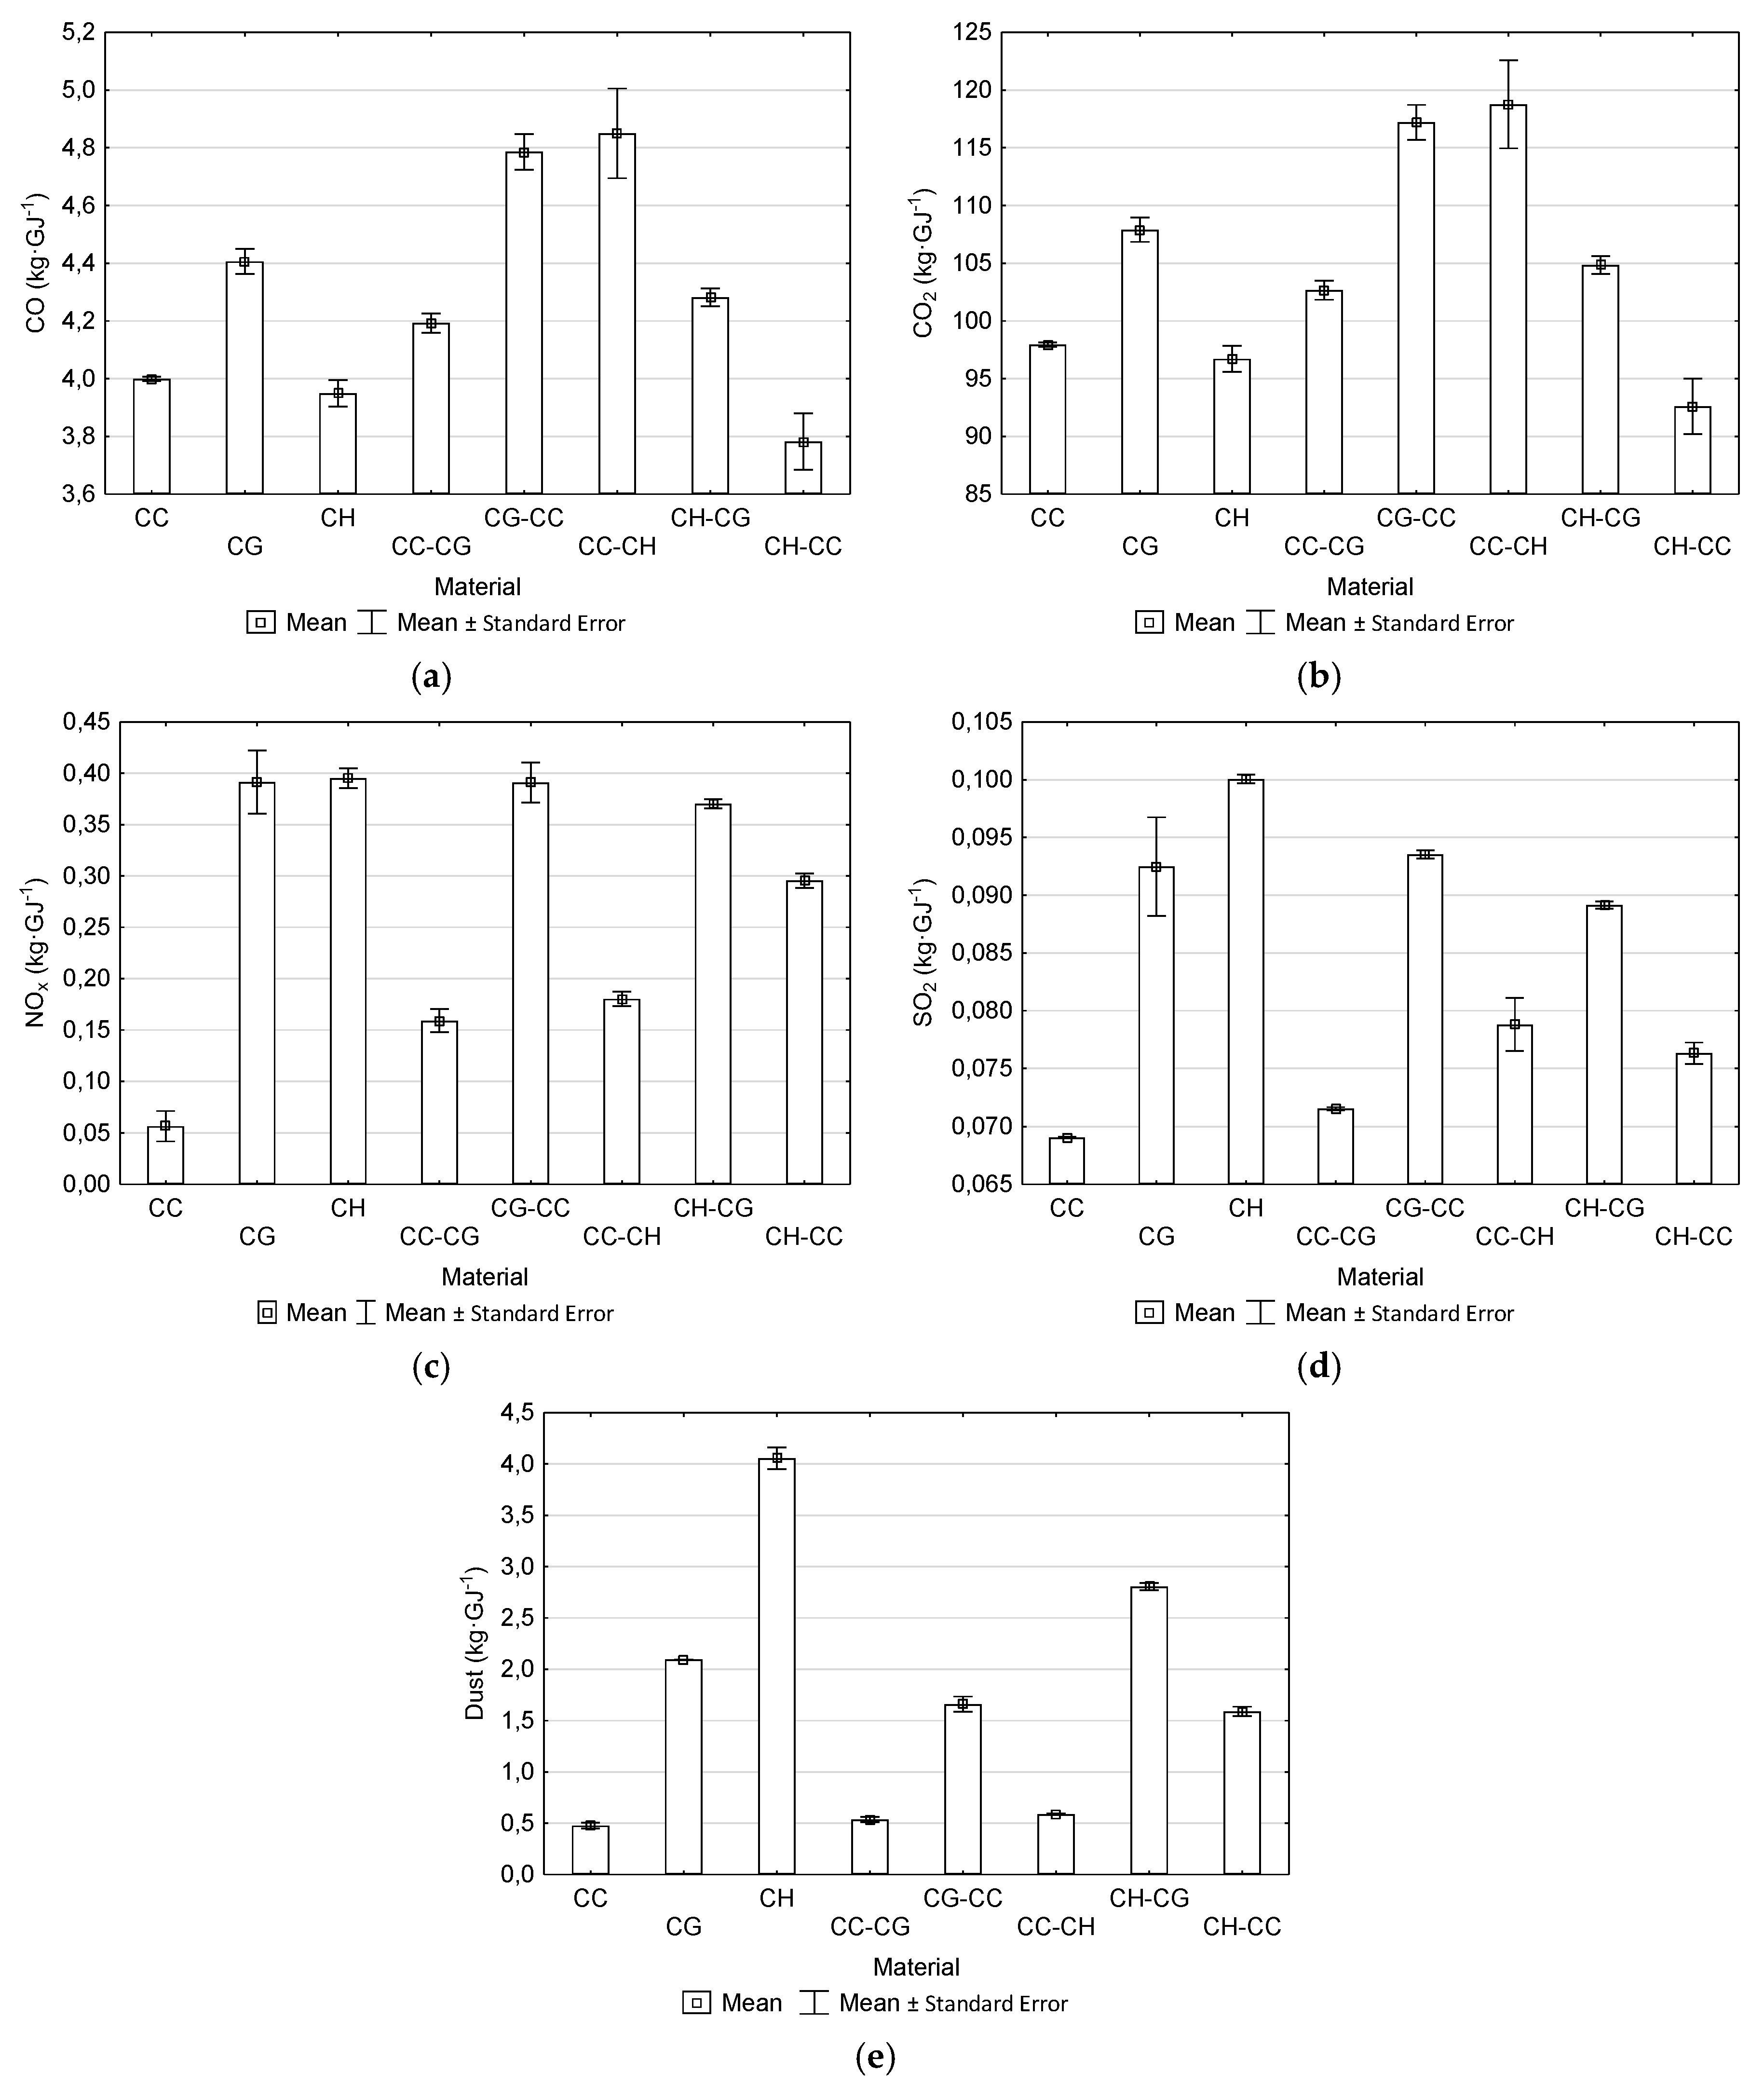
3.2. Emission Factors

It should be noted that the use of waste biomass from the drying process of grain for energy purposes can be included in the last phase of the life cycle of primary biomass. By using this type of waste as a biofuel, we gain a life cycle closure for corn grain. Wholesome grain goes to feed or consumer use, while waste generated from the treatment of this material can be used for energy purposes which is indicated in this work. Therefore, it is necessary to determine the degree of emissions for the use of waste biomass from the corn grain drying process for energy purposes, as it is an additional element outside the primary life cycle of the product (i.e., consumer or feed) which in waste does not participate.
Figure 3 and Figure 4 present the estimated emission factors (Equations (1)–(10)) for the tested biomass per unit of mass and energy.
The indicator method using technical and elemental analysis for the tested biomass allowed the estimation of emission factors in the field of CO, CO2, NOx, SO2, and dust. Data analysis indicates that carbon monoxide emission levels were different for the tested raw materials (38–63 kg·Mg−1). In the case of carbon dioxide, the highest emission rate was recorded for the CC–CH mixture, while the lowest was recorded for CH with a difference of up to 60.4%.
Analyzing the NOx emission for the tested biomass, the highest emission was observed for the CG, while the lowest (5 times lower) for CC corn cobs. Research has shown that CC, CG, CG–CC mix, and CC–CH mix had the highest SO2 emission rates. The lowest emission was found for the CH–CG mixture and it was 10% lower compared to the highest one. High dust emission rates were determined for CH and its mixtures due to the high ash content obtained in this raw material. The lowest dust emission was shown for CG, and it was over six times lower than the emission for CH. Comparing the emission factors obtained with reference to the literature [56], it should be noted that, for the tested biomass, most indicators were at a similar level as compared to other types of biomass. Only in the scope of sulfur oxides, were higher emission and dust rates recorded for CH as well as its mixtures.
The statistical analysis of the emission factors showed the impact of the type of material on the volume of emissions in all cases studied. Noteworthy was the dust emission index for CH and husk mixtures. Such high values for this indicator somewhat eliminate this type of material as a potential biofuel in the energy sector. The very low NOx and dust emission index estimated for CC should be considered positive which, in turn, indicates the pro-environmental properties of this type of biomass. For emission factors per unit of energy, a particularly significant difference should be noted for CH.

3.3. Ash Chemical Composition

Two basic aspects related to biomass combustion are the extension and improvement of basic knowledge on the composition and properties of biomass ashes and the use of this knowledge for innovative and sustainable use [57]. Inorganic matter and some elements forming ash from biomass can cause numerous technological and environmental problems during biomass processing [58].
The composition and properties of biomass depend on many factors: the type of biomass, the method and time of its transport and storage as well as the combustion technology used. Herbaceous plant biomass and agricultural biomass usually have a higher ash content than woody biomass, because this type of biomass is characterized by diverse biodiversity and organic structure, rapid metabolism, and it consumes much more nutrients during growth periods [59]. The chemical composition of biomass ash is an important feature that allows for the assessment of the behavior of elements during the combustion and use of ash.
The content of Si, Al, Ti, Fe, Na, K, Ca, Mg, and P in the tested ashes, expressed in the form of oxides, referring to the percentage of dry ash content and normalized to 100%, is presented in Table 3. The tested materials were characterized by a very diverse ash composition. A very high content of SiO2 silica was found at the same time with a wide variation in its content from 10.14% in ash from CG to 64.93% in ash from the CH–CC mixture. Also, the content presented in Reference [59] is within wide limits. The SiO2 content in CC ash is 36.95%, the average content in ashes from various seeds is 25.40%, the average content in herb and agricultural biomass ashes 33.09%, with the average content in ashes from all types of biomass at 29.41%.
A large variation was also found for K2O, from 2.94% in corn grain ash to 31.13% in CC ash. Vassiliev et al. [59] state that the content of this oxide in the corn cob ash is at the level of 47.92%, the average content in the ashes of herbal and agricultural biomass at the level of 26.81%, with the average content in the ash of all types of biomass at 17.13%. In addition, it is pointed out that the unusually high concentration of K2O is characteristic of corn cob ash [10].
The level of P2O5 content was from 4.32% in corn grain ash CG to 10.9% in corn husk ash. According to the literature, the content of P2O5 [59] is 4.86% in corn cob ash, the average content in the husk of various seeds is 3.69%, the average content in ashes from herb and agricultural biomass is 6.30%, with the average content in ashes from all types of biomass at 5.56%. It should be kept in mind that a significant amount of P can be supplied in agricultural and herbaceous biomass by natural P fertilizers such as wood ash [60] or minerals (hydroxylapatite) [61].
A large variation in the CaO content in the tested materials was found, 1.36% in ash from corn grain to 14.27 in ash from corn husk. According to the literature, the content of CaO in corn cob ash is 2.14%, the average content in the ashes of husks of various plants is 18.63%, the average content in the ashes of herb and agricultural biomass is 14.82%, and the average content in the ashes of all types of biomass is 25.86% [59]. An extremely low CaO content is typical for corn cob ashes. Nevertheless, significant amounts of Ca can be supplied in agricultural and herbaceous biomass by P fertilizers (hydroxylapatite) [40].
On the other hand, the Na2O content in the ashes of the examined raw materials ranged from 0.21% in the corn husk ash to 2.24% in the ash from corn cobs. It was a value close to that reported in the literature [59] which was 0.28% for corn cob ash. The average density in the ashes of various seeds was 5.74%, and the average density in the ashes from the herb and agricultural biomass was 2.78% with the average density in the ashes of all types of biomass at 2.63%. A very low Na2O content is typical for corn straw and rapeseed ashes.
The smallest differentiation among the examined materials was characteristic of the contents of Fe2O3, MgO, and TiO2. The MgO content ranged from 0.08% in ash of the CH–CG mix to 0.82% in CG ash. The content of this oxide given in the literature [59] is significantly higher and amounts to 1.99% in corn cob ashes, 5.52% in ashes from various seeds, and 5.69% in ashes from herbal and agricultural biomass with an average content of the ashes from all types of biomass at 5.77%.
The percentage of TiO2 was not high (similar to MgO, below 1%) and ranged from 0.35% in ash from CC to 0.58% in ash from CH. The content in corn cob ashes from Reference [59] is at the level of 0.06%, the average content in the husk of various seeds is 0.14%, the average content in ashes from herb and agricultural biomass is 0.22%, and the average content in ashes from all types of biomass is 0.57%.
The ash composition of the mixtures of the tested materials resulted from the content of the dominant component. Due to the dominant SiO2 content in ash from CH, the dominant component of this material mixture was silica, while in the case of the mixture with corn cobs (CH–CC), an enrichment of 64.93% was found, and in the case of the mixture with corn grain (CH–CG), SiO2 content reduced to 48.85%. Similar changes were noted in the case of the corn grains mixtures. In corn cob ash, K2O dominated and, therefore, in the mixture with corn grains (CG–CC), this component was dominant, while in the CC–CH mixture, there was enrichment in SiO2 and this component became the dominant.
From the point of view of biomass combustion for energy purposes, the high content of K and Ca is unfavorable because they easily react with other elements (e.g., Si) to form alkali with very low melting points (approximately 700 °C). Increased K content may increase the slag potential of deposits [62].

3.4. Slagging and Fouling Indicators

On the basis of Equations (11)–(17), the slag indicators for the analyzed biomass were determined (Table 4), the degree of slag hazard and slagging was determined based on the levels of the values of the indicators listed in Table 1.
Ash deposits generated during biomass combustion worsen the combustion process and heat exchange, cause high temperature corrosion, and may cause mechanical failure of the boiler. Predicting the behavior of ash during biomass combustion is essential for the proper operation of boilers. The most commonly used method for predicting ash behavior is the method of slag indices based on ash composition [63].
Acidic ash components such as SiO2, Al2O3, and TiO2 generally lead to a high ash melting point. However, basic oxides such as Fe2O3, CaO, MgO, Na2O, and K2O give low ash melting points. Therefore, higher Rb/a values generally lead to an increased risk of slag formation in the biomass combustion process. The high Rb/a index for CC corn ash resulting from the high content of K2O and CaO indicates a very high potential slagging for this material. Also, mixtures of this material showed a high propensity for slagging. Other materials have a lower content of basic oxides; hence, their Rb/a ratios are considered low.
Alkalis play an important role in fuel ash issues, potentially reacting with Si to form low temperature melting alkali metal silicates or by reacting with S and Cl to form alkali metal sulphates or chlorides on heat exchange surfaces, respectively. The Alkaline Index (AI), expressing the amount of alkali oxides in a fuel per unit of fuel energy, is a commonly used threshold indicator for fouling. The calculated AI was, for most materials, above the 0.34 threshold except for CG and its mixture with corn husk (CG–CH). This may indicate that these materials contained a sufficient amount of alkali for the ashes to melt during combustion and/or the compounds to evaporate and condense on the boiler exchangers. Therefore, a high risk of slagging is expected for these materials.
The estimated Fu values for corn cobs were extremely high, and mixtures containing this material (CC–CH, CC–CG, CG–CC) gave a high risk. Other materials were estimated at a low level.
Another important parameter is the Fe/Ca ratio expressed by the IC index. The fluidizing action between iron and calcium is a complex phenomenon. Usually at a low Fe2O3/CaO ratio, the tracing potential decreases. Above the 0.3 threshold, indicating high risk of slagging, were corn gain and the CG–CH mixture.
Due to the low sulfur content in the tested biomass, the Rs index indicates a low tendency to slag with the exception of CC, just like the Sr index which also gave the average value of CC only. In the case of the SI index, all the materials had a low value.
Taking into account the three most commonly used indicators to predict ash behavior, i.e., Rb/a, I, and Fu, CC and the mixtures of this material (CC–CH, CC–CG) will pose the greatest risk during combustion. Corn grain and its mixtures (CG–CC, CG–CH) showed a medium risk of slagging and fouling. Corn husk and its mixtures (CH–CC, CH–CG) showed the least potential problems.
However, it should be kept in mind that the indicators set do not provide fully reliable information on the growth rate of deposits on boilers, as they depend only on the chemical composition of biomass. In addition, even with regard to a specific biomass, the soil conditions, harvest periods, and different parts of biomass may affect the varying amount and chemical composition of ash [64].

4. Conclusions

The need to diversify energy sources forces the search for new energy carriers through which we strive to replace fossil fuels with alternative fuels. By-products of the agri-food industry often pose a problem related to the costs of their disposal and storage, and at the same time they can be a potential biofuel.
Analysis of the results obtained shows that, among the three materials tested, CC have the highest energy potential which is indicated by both the lower heating value of 14.94 MJ⋅kg−1 as well as the ash content of 5.64% and low emission of toxic exhaust components. Slag indicators, however, indicate the possibility of a burning problem in boilers. The lowest energy potential was shown by CH. This material had the lowest lower heating value of 9.69 MJ⋅kg−1 and a very high ash content of 31.11%, which results in a high rate of dust emission factor at 39 kg·Mg−1. For a comprehensive management of corn drying waste, the possibility of using these materials in mixtures were tested. Analysis of the six prepared mixtures showed that mixing materials with unfavorable indicators with materials with the best factors allowed to obtain biofuels with medium or good energy potential. This is illustrated by the example of a mixture of corn cobs with corn grains (CC–CG). This mixture obtained a lower heating value of 13.70 MJ⋅kg−1 and an ash content of 5.82%, while obtaining a moderate tendency to slag and fouling with good emission factors. However, mixtures with a predominant husk content (CH) did not allow for the obtention of material with satisfactory energy parameters. For those mixtures, the ash content remained high: CH–CG—22.62% and CH–CC—16.03%, with the lowest LHVs of 10.19 MJ⋅kg−1 and 13.09 MJ⋅kg−1, respectively.
During the drying process of corn grain, considerable amounts of organic waste are generated in the form of damaged grains, husks, and cobs. The conducted research indicates that biowaste in the form of corn cobs can be a potential biofuel. The use of grain and husk as admixtures to this biofuel will allow full management of waste while maintaining the energy parameters of the fuel. The use of this type of biomass for energy purposes is justified and can complement the energy balance of the dryer, serving as an energy carrier for the drying medium.
Just like with any research, especially those empirical in nature, the analysis presented in this article has its limitations. The research was limited to mixtures of one proportion only. However, promising results point to the need for further research. The determination of the slag propensity and fouling was based only on indicators and this will require experimental confirmation. Further research will aim to determine the optimal biofuel obtained from corn drying residues with a high energy potential and low environmental impact. Consideration should also be given to the possibility of compacting the raw materials for easier application in combustion systems. This approach contributes to effective use of waste generated in the process of drying corn.

Author Contributions

Conceptualization, G.M. and G.Z.; methodology, G.M., P.K. and G.Z.; validation, G.Z. and J.S.-B.; formal analysis, G.M.; investigation, G.Z., J.S.-B. and T.S.; resources, G.M. and P.K.; writing—original draft preparation, G.M., G.Z. and J.S.-B.; writing—review and editing, G.M., G.Z., J.S.-B., T.S. and P.K.; supervision,. G.M.; project administration, G.M. and W.P.; funding acquisition and project conceptualization, G.M. and P.K.

Funding

Research was performed within the project “Developing of innovative air purification methods for grain and seed drying, along with pollutant emissions reduction—ECO-Dryer” co-funded by the National Center for Research and Development (NCBiR) within the framework of the Strategic Research and Development Program “Environment, Agriculture and Forestry”—BIOSTRATEG3/344490/13/NCBR/2018.

Conflicts of Interest

The authors declare no conflict of interest.

References

  1. Vershinina, K.; Nyashina, G.; Dorokhov, V.; Shlegel, N. The prospects of burning coal and oil processing waste in slurry, gel, and solid state. Appl. Therm. Eng. 2019, 156, 51–62. [Google Scholar] [CrossRef]
  2. Stolarski, M.J.; Krzyżaniak, M.; Warmiński, K.; Tworkowski, J.; Szczukowski, S. Willow Biomass Energy Generation Efficiency and Greenhouse Gas Reduction Potential. Pol. J. Environ. Stud. 2015, 24, 2627–2640. [Google Scholar] [CrossRef]
  3. Wąsowicz, M.; Deszczka-Tarnowska, M. Racjonalne gospodarowanie odpadami jako przedsięwzięcie na rzecz bezpieczeństwa ekonomicznego kraju. J. Mod. Sci. 2015, 231–247. [Google Scholar]
  4. Czyżyk, F.; Strzelczyk, M. Rational utilization of production residues generated in agri-food. Arch. Waste Manag. Environ. Prot. 2015, 17, 99–106. [Google Scholar]
  5. Nayak, A.; Bhushan, B. An overview of the recent trends on the waste valorization techniques for food wastes. J. Environ. Manag. 2019, 233, 352–370. [Google Scholar] [CrossRef] [PubMed]
  6. Onsree, T.; Tippayawong, N.; Williams, T.; McCullough, K.; Barrow, E.; Pogaku, R.; Lauterbach, J. Torrefaction of pelletized corn residues with wet flue gas. Bioresour. Technol. 2019, 285, 121330. [Google Scholar] [CrossRef]
  7. Yang, Y.; Ni, J.-Q.; Zhu, W.; Xie, G. Life Cycle Assessment of Large-scale Compressed Bio-natural Gas Production in China: A Case Study on Manure Co-digestion with Corn Stover. Energies 2019, 12, 429. [Google Scholar] [CrossRef]
  8. Hawrot-Paw, M.; Zmuda, A.; Koniuszy, A. Thermochemical biomass conversion processes and their impact on the environment. Przem. Chem. 2019, 98, 1126–1129. [Google Scholar]
  9. Bilandzija, N.; Voca, N.; Jelcic, B.; Jurisic, V.; Matin, A.; Grubor, M.; Kricka, T. Evaluation of Croatian agricultural solid biomass energy potential. Renew. Sustain. Energy Rev. 2018, 93, 225–230. [Google Scholar] [CrossRef]
  10. Okot, D.K.; Bilsborrow, P.E.; Phan, A.N. Briquetting characteristics of bean straw-maize cob blend. Biomass Bioenergy 2019, 126, 150–158. [Google Scholar] [CrossRef]
  11. Golimowski, W.; Krzaczek, P.; Marcinkowski, D.; Gracz, W.; Wałowski, G. Impact of Biogas and Waste Fats Methyl Esters on NO, NO2, CO, and PM Emission by Dual Fuel Diesel Engine. Sustainability 2019, 11, 1799. [Google Scholar] [CrossRef]
  12. Iakovou, E.; Karagiannidis, A.; Vlachos, D.; Toka, A.; Malamakis, A. Waste biomass-to-energy supply chain management: A critical synthesis. Waste Manag. 2010, 30, 1860–1870. [Google Scholar] [CrossRef] [PubMed]
  13. Bonassa, G.; Schneider, L.T.; Canever, V.B.; Cremonez, P.A.; Frigo, E.P.; Dieter, J.; Teleken, J.G. Scenarios and prospects of solid biofuel use in Brazil. Renew. Sustain. Energy Rev. 2018, 82, 2365–2378. [Google Scholar] [CrossRef]
  14. Templeton, D.W.; Sluiter, A.D.; Hayward, T.K.; Hames, B.R.; Thomas, S.R. Assessing corn stover composition and sources of variability via NIRS. Cellulose 2009, 16, 621–639. [Google Scholar] [CrossRef]
  15. Welker, C.; Balasubramanian, V.; Petti, C.; Rai, K.; DeBolt, S.; Mendu, V. Engineering plant biomass lignin content and composition for biofuels and bioproducts. Energies 2015, 8, 7654–7676. [Google Scholar] [CrossRef]
  16. Celma, A.R.; Cuadros, F.; López-Rodríguez, F. Characterization of pellets from industrial tomato residues. Food Bioprod. Process. 2012, 90, 700–706. [Google Scholar] [CrossRef]
  17. Kang, S.B.; Oh, H.Y.; Kim, J.J.; Choi, K.S. Characteristics of spent coffee ground as a fuel and combustion test in a small boiler (6.5 kW). Renew. Energy 2017, 113, 1208–1214. [Google Scholar] [CrossRef]
  18. Szyszlak-Barglowicz, J.; Zajac, G.; Kuranc, A.; Slowik, T.; Dudziak, A.; Stoma, M.; Wasilewski, J. Chemical properties of selected agri-food industry waste products in the aspect of their use for energetics purposes. Przemysl Chem. 2018, 97, 779–783. [Google Scholar]
  19. Maj, G.; Krzaczek, P.; Stamirowska-Krzaczek, E.; Lipińska, H.; Kornas, R. Assessment of energy and physicochemical biomass properties of selected forecrop plant species. Renew. Energy 2019, 143, 520–529. [Google Scholar] [CrossRef]
  20. Obidziński, S.; Piekut, J.; Dec, D. The influence of potato pulp content on the properties of pellets from buckwheat hulls. Renew. Energy 2016, 87, 289–297. [Google Scholar] [CrossRef]
  21. Hejft, R.; Obidziński, S.; Jałbrzykowski, M.; Markowski, J. Production of heating pellets with apple pomace content. J. Res. Appl. Agric. Eng. 2016, 61, 29–34. [Google Scholar]
  22. Mišljenović, N.; Čolović, R.; Vukmirović, Đ.; Brlek, T.; Bringas, C.S. The effects of sugar beet molasses on wheat straw pelleting and pellet quality. A comparative study of pelleting by using a single pellet press and a pilot-scale pellet press. Fuel Process. Technol. 2016, 144, 220–229. [Google Scholar] [CrossRef]
  23. Wattana, W.; Phetklung, S.; Jakaew, W.; Chumuthai, S.; Sriam, P.; Chanurai, N. Characterization of mixed biomass pellet made from oil palm and Para-rubber tree residues. Energy Procedia 2017, 138, 1128–1133. [Google Scholar] [CrossRef]
  24. Wang, L.; Skreiberg, Ø.; Becidan, M. Investigation of additives for preventing ash fouling and sintering during barley straw combustion. Appl. Therm. Eng. 2014, 70, 1262–1269. [Google Scholar] [CrossRef]
  25. Pastorello, C.; Caserini, S.; Galante, S.; Dilara, P.; Galletti, F. Importance of activity data for improving the residential wood combustion emission inventory at regional level. Atmos. Environ. 2011, 45, 2869–2876. [Google Scholar] [CrossRef]
  26. Oniszczuk, T.; Kupryaniuk, K.; Smurzynska, A.; Brzoski, M.; Wojtowicz, A.; Mitrus, M.; Oniszczuk, A.; Combrzynski, M.; do Carmo, I.E.P. Effect of Extrusion-Cooking Parameters on Energetic Efficiency of Corn Straw During Methane Fermentation. In Proceedings of the 3rd International Conference on Energy and Environment (ICEE 2017), Porto, Portugal, 29–30 June 2017; pp. 307–312. [Google Scholar]
  27. Morato, T.; Vaezi, M.; Kumar, A. Assessment of energy production potential from agricultural residues in Bolivia. Renew. Sustain. Energy Rev. 2019, 102, 14–23. [Google Scholar] [CrossRef]
  28. Djatkov, D.; Martinov, M.; Kaltschmitt, M. Influencing parameters on mechanical–physical properties of pellet fuel made from corn harvest residues. Biomass Bioenergy 2018, 119, 418–428. [Google Scholar] [CrossRef]
  29. Miranda, M.; Sepúlveda, F.; Arranz, J.; Montero, I.; Rojas, C. Analysis of pelletizing from corn cob waste. J. Environ. Manag. 2018, 228, 303–311. [Google Scholar] [CrossRef]
  30. Bajus, P.; Mraz, M.; Rigo, I.; Findura, P.; Fürstenzeller, A.; Kielbasa, P.; Malaga-Tobola, U. The influence of drying temperature and moisture of corn seeds planted on their damage. Agric. Eng. 2019, 23, 5–12. [Google Scholar] [CrossRef]
  31. Mullen, C.A.; Boateng, A.A.; Goldberg, N.M.; Lima, I.M.; Laird, D.A.; Hicks, K.B. Bio-oil and bio-char production from corn cobs and stover by fast pyrolysis. Biomass Bioenergy 2010, 34, 67–74. [Google Scholar] [CrossRef]
  32. Wongsiriamnuay, T.; Panyoyai, N.; Tantikul, S. Design and fabrication of a pyrolysis reactor for corn cobs. Agric. Sci. J. 2012, 43, 179–182. [Google Scholar]
  33. Ioannidou, O.; Zabaniotou, A.; Antonakou, E.V.; Papazisi, K.M.; Lappas, A.A.; Athanassiou, C. Investigating the potential for energy, fuel, materials and chemicals production from corn residues (cobs and stalks) by non-catalytic and catalytic pyrolysis in two reactor configurations. Renew. Sustain. Energy Rev. 2009, 13, 750–762. [Google Scholar] [CrossRef]
  34. Lu, Y.J.; Guo, L.J.; Ji, C.M.; Zhang, X.M.; Hao, X.H.; Yan, Q.H. Hydrogen production by biomass gasification in supercritical water: A parametric study. Int. J. Hydrogen Energy 2006, 31, 822–831. [Google Scholar] [CrossRef]
  35. Sittisun, P.; Tippayawong, N.; Wattanasiriwech, D. Thermal degradation characteristics and kinetics of oxy combustion of corn residues. Adv. Mater. Sci. Eng. 2015, 2015, dx. [Google Scholar] [CrossRef]
  36. Wongsiriamnuay, T.; Tippayawong, N. Effect of densification parameters on the properties of maize residue pellets. Biosyst. Eng. 2015, 139, 111–120. [Google Scholar] [CrossRef]
  37. Maj, G. Emission Factors and Energy Properties of Agro and Forest Biomass in Aspect of Sustainability of Energy Sector. Energies 2018, 11, 1516. [Google Scholar] [CrossRef]
  38. Borycka, B. Towaroznawcze Studium Nad Żywnościową i Energetyczną Użytecznością Bogatobłonnikowych Odpadów Przemysłu Owocowo-Warzywnego; Wyd. Politechniki Radomskiej: Radom, Poland, 2008. [Google Scholar]
  39. Bryers, R.W. Fireside slagging, fouling, and high-temperature corrosion of heat-transfer surface due to impurities in steam-raising fuels. Prog. Energy Combust. Sci. 1996, 22, 29–120. [Google Scholar] [CrossRef]
  40. Vamvuka, D.; Zografos, D. Predicting the behaviour of ash from agricultural wastes during combustion. Fuel 2004, 83, 2051–2057. [Google Scholar] [CrossRef]
  41. Pronobis, M. Evaluation of the influence of biomass co-combustion on boiler furnace slagging by means of fusibility correlations. Biomass Bioenergy 2005, 28, 375–383. [Google Scholar] [CrossRef]
  42. Komilis, D.; Kissas, K.; Symeonidis, A. Effect of organic matter and moisture on the calorific value of solid wastes: An update of the Tanner diagram. Waste Manag. 2014, 34, 249–255. [Google Scholar] [CrossRef]
  43. Telmo, C.; Lousada, J.; Moreira, N. Proximate analysis, backwards stepwise regression between gross calorific value, ultimate and chemical analysis of wood. Bioresour. Technol. 2010, 101, 3808–3815. [Google Scholar] [CrossRef] [PubMed]
  44. Dhyani, V.; Bhaskar, T. A comprehensive review on the pyrolysis of lignocellulosic biomass. Renew. Energy 2018, 129, 695–716. [Google Scholar] [CrossRef]
  45. Haykiri-Acma, H.; Yaman, S. Interaction between biomass and different rank coals during co-pyrolysis. Renew. Energy 2010, 35, 288–292. [Google Scholar] [CrossRef]
  46. Allesina, G.; Pedrazzi, S.; Allegretti, F.; Tartarini, P. Spent coffee grounds as heat source for coffee roasting plants: Experimental validation and case study. Appl. Therm. Eng. 2017, 126, 730–736. [Google Scholar] [CrossRef]
  47. Kraiem, N.; Lajili, M.; Limousy, L.; Said, R.; Jeguirim, M. Energy recovery from Tunisian agri-food wastes: Evaluation of combustion performance and emissions characteristics of green pellets prepared from tomato residues and grape marc. Energy 2016, 107, 409–418. [Google Scholar] [CrossRef]
  48. Husain, Z.; Zainac, Z.; Abdullah, Z. Briquetting of palm fibre and shell from the processing of palm nuts to palm oil. Biomass Bioenergy 2002, 22, 505–509. [Google Scholar] [CrossRef]
  49. Szyszlak-Barglowicz, J.; Zajac, G.; Piekarski, W. Energy biomass characteristics of chosen plants. Int. Agrophysics 2012, 26, 175–179. [Google Scholar] [CrossRef] [Green Version]
  50. Szyszlak-Barglowicz, J.; Zajac, G.; Słowik, T. Research on Emissions from Combustion of Pellets in Agro Biomass Low Power Boiler. Rocz. Ochr. Srodowiska 2017, 19, 715–730. [Google Scholar]
  51. Vassilev, S.V.; Baxter, D.; Andersen, L.K.; Vassileva, C.G. An overview of the chemical composition of biomass. Fuel 2010, 89, 913–933. [Google Scholar] [CrossRef]
  52. Rajczyk, R.; Bień, J.; Palka, H.; Pogodziński, A.; Smorąg, H. Co-Combustion of Municipal Sewage Sludge and Hard Coal on Fluidized Bed Boiler WF-6. Arch. Environ. Prot. 2014, 40, 101–113. [Google Scholar] [CrossRef]
  53. Zajemska, M.; Musiał, D.; Radomiak, H.; Poskart, A.; Wyleciał, T.; Urbaniak, D. Formation of Pollutants in the Process of Co-Combustion of Different Biomass Grades. Pol. J. Environ. Stud. 2014, 23, 1445–1448. [Google Scholar]
  54. García-Maraver, A.; Popov, V.; Zamorano, M. A review of European standards for pellet quality. Renew. Energy 2011, 36, 3537–3540. [Google Scholar] [CrossRef]
  55. Saidur, R.; Abdelaziz, E.A.; Demirbas, A.; Hossain, M.S.; Mekhilef, S. A review on biomass as a fuel for boilers. Renew. Sustain. Energy Rev. 2011, 15, 2262–2289. [Google Scholar] [CrossRef]
  56. Maj, G. Analysis of energy properties and emissions factors of selected plant biomass and peat. In Proceedings of the IX International Scientific Symposium Farm Machinery and Processes Management in Sustainable Agriculture: Symposium Proceedings, Lublin, Poland, 22–24 November 2017; pp. 222–227. [Google Scholar]
  57. Zając, G.; Szyszlak-Bargłowicz, J.; Gołębiowski, W.; Szczepanik, M. Chemical Characteristics of Biomass Ashes. Energies 2018, 11, 2885. [Google Scholar] [CrossRef] [Green Version]
  58. Zając, G.; Szyszlak-Bargłowicz, J.; Szczepanik, M. Influence of Biomass Incineration Temperature on the Content of Selected Heavy Metals in the Ash Used for Fertilizing Purposes. Appl. Sci. 2019, 9, 1790. [Google Scholar] [CrossRef] [Green Version]
  59. Vassilev, S.V.; Baxter, D.; Vassileva, C.G. An overview of the behaviour of biomass during combustion: Part I. Phase-mineral transformations of organic and inorganic matter. Fuel 2013, 112, 391–449. [Google Scholar] [CrossRef]
  60. Park, B.B.; Yanai, R.D.; Sahm, J.M.; Lee, D.K.; Abrahamson, L.P. Wood ash effects on plant and soil in a willow bioenergy plantation. Biomass Bioenergy 2005, 28, 355–365. [Google Scholar] [CrossRef]
  61. Vamvuka, D.; Hahladakis, J.; Pentari, D. Leaching of toxic elements from lignite and agroresidue ashes in cultivated soils of Crete. Energy Fuels 2005, 19, 807–812. [Google Scholar] [CrossRef]
  62. Monti, A.; Di Virgilio, N.; Venturi, G. Mineral composition and ash content of six major energy crops. Biomass Bioenergy 2008, 32, 216–223. [Google Scholar] [CrossRef] [Green Version]
  63. Vega-Nieva, D.J.; Ortiz Torres, L.; Míguez Tabares, J.L.; Morán, J. Measuring and Predicting the Slagging of Woody and Herbaceous Mediterranean Biomass Fuels on a Domestic Pellet Boiler. Energy Fuels 2016, 30, 1085–1095. [Google Scholar] [CrossRef]
  64. Niu, Y.; Tan, H.; Hui, S. Ash-related issues during biomass combustion: Alkali-induced slagging, silicate melt-induced slagging (ash fusion), agglomeration, corrosion, ash utilization, and related countermeasures. Prog. Energy Combust. Sci. 2016, 52, 1–61. [Google Scholar] [CrossRef]
Figure 1. Material used in the study before mixing: (a) corn cobs (CCs), (b) corn grains (CGs), (c) corn husks (CHs).
Energies 12 04383 g001
Figure 2. Scheme of the experiment procedure.
Energies 12 04383 g002
Figure 3. Emission factors for the tested materials (kg·Mg−1 dry mass): (a) CO; (b) CO2; (c) NOx; (d) SO2; (e) dust.
Energies 12 04383 g003aEnergies 12 04383 g003b
Figure 4. Emission factors per energy unit for the tested materials (kg·GJ−1 dry mass): (a) CO; (b) CO2; (c) NOx; (d) SO2; (e) dust.
Energies 12 04383 g004
Table 1. Relationships between indicator values and levels of slagging and fouling tendencies [41].
IndexRangeSlagging and Fouling Inclinations
Rb/a<0.5Low
0.5–1Medium
1–1.75High
>1.75Extremely high
Rs<0.6Low
0.6–2Medium
2–2.6High
>2.6Extremely high
AI<0.17Low
0.17–0.34Medium
>0.34High
SI>0.6Low
0.6–2Medium
<2High
IC<0.3Low
0.3–3High
Sr>72Low
65–72Medium
<65High
Fu<0.6Low
0.6–40High
>40Extremely high
Table 2. Results of the technical and elemental analysis of the tested biomass (dry mass).
ParameterMaterialF
CCCGCHCC–CGCG–CCCC–CHCH–CGCH–CCCG–CH
LHV (MJ·kg−1) ± Sx14.94 ± 0.01 d13.23 ± 0.17 b,c9.69 ± 0.09 a13.70 ± 0.04 c13.36 ± 0.04 b,c13.07 ± 0.64 b,c10.19 ± 0.06 a13.09 ± 0.01 b,c12.90 ± 0.01 b165.59 *
HHV (MJ·kg−1) ± Sx17.05 ± 0.01 g16.87 ± 0.09 g10.96 ± 0.10 a16.18 ± 0.30 f16.92 ± 0.05 g15.53 ± 0.01 e11.39 ± 0.07 b14.72 ± 0.08 c15.15 ± 0.10 d1065.24 *
M (%) ± Sx7.83 ± 0 a12.91 ± 0.05 f9.49 ± 0.26 c10.68 ± 0.04 d10.40 ± 0.21 d8.75 ± 0.09 b11.61 ± 0.16 e8.94 ± 0.03 b12.55 ± 0.05 f539.25 *
A (%) ± Sx5.64 ± 0.60 a5.12 ± 0.02 a31.11 ± 1.49 d5.82 ± 0.48 a5.42 ± 0.27 a6.09 ± 0.25 a22.62 ± 0.35 c16.03 ± 0.54 b6.51 ± 0.01 a731.88 *
V (%) ± Sx69.24 ± 0.48 g68.57 ± 0.14 g49.98 ± 0.73 a63.41 ± 0.17 f68.94 ± 0.30 g61.41 ± 0.33 e55.45 ± 0.07 b60.22 ± 0.47 d58.52 ± 0.02 c953.25 *
C (%) ± Sx48.51 ± 0.16 g40.65 ± 0.45 d31.06 ± 0.60 a46.60 ± 0.68 f42.95 ± 0.86 e47.35 ± 0.25 f35.40 ± 0.66 b39.08 ± 0.95 c,d38.76 ± 0.16 c352.20 *
H (%) ± Sx5.90 ± 0.01 d,e6.39 ± 0.03 e3.63 ± 0.42 a5.70 ± 0.08 d5.74 ± 0.21 d5.15 ± 0.09 c4.85 ± 0.10 b,c4.87 ± 0.13 b,c4.56 ± 0.15 b66.17 *
N (%) ± Sx0.29 ± 0.04 a1.34 ± 0.13 d1.09 ± 0.05 c0.62 ± 0.08 b1.23 ± 0.11 c,d0.67 ± 0.06 b1.07 ± 0.03 c1.07 ± 0.04 c1.12 ± 0.02 c70.35 *
S (%) ± Sx0.52 ± 0 b0.51 ± 0.04 b0.48 ± 0 a,b0.49 ± 0 a,b0.51 ± 0 b0.51 ± 0 b0.45 ± 0 a0.49 ± 0 a,b0.48 ± 0.02 a,b6.47 *
O (%) ± Sx39.14 ± 0.50 c45.99 ± 0.41 d,e32.63 ± 2.30 a40.77 ± 0.56 d44.15 ± 0.88 d40.22 ± 0.21 b,c35.60 ± 0.44 b38.47 ± 1.56 b,c48.62 ± 0.36 f76.85 *
FC (%) ± Sx17.29 ± 0.14 d13.40 ± 0.17 b9.41 ± 0.51 a20.09 ± 0.36 e15.24 ± 0.70 c23.75 ± 0.55 g10.32 ± 0.23 a14.81 ± 0.12 c22.44 ± 0.06 f521.61 *
FR0.250.200.190.320.220.390.190.250.38-
Sx—standard deviation; * means significance at α = 0.05; different horizontal letters indicate significance differences at p < 0.05 according to Tukey’s test.
Table 3. Ash composition in the analyzed biomass (dry mass).
Elements (%)MaterialsF
CCCGCHCC–CHCG–CCCC–CGCH–CGCH–CCCG–CH
K2O31.13 ± 0.21 i2.94 ± 0.02 a6.86 ± 0.02 e15.96 ± 0.06 g9.18 ± 0.03 f20.08 ± 0.04 h5.18 ± 0.02 c6.41 ± 0.09 d3.82 ± 0.01 b39,920.04 *
CaO10.43 ± 0.12 e1.36 ± 0.05 a14.27 ± 0.06 h10.27 ± 0.06 e4.32 ± 0.03 b5.63 ± 0.06 d11.21 ± 0.05 f12.32 ± 0.06 g5.19 ± 0.01 c9658.05 *
Fe2O31.20 ± 0.01 c0.83 ± 0.01 a2.16 ± 0.01 e2.27 ± 0 f1.03 ± 0.01 b1.19 ± 0.01 c2.16 ± 0.03 e2.83 ± 0.02 g1.58 ± 0.02 d7731.10 *
Al2O31.23 ± 0.01 a3.45 ± 0.01 d5.29 ± 0.05 h4.51 ± 0.10 f3.07 ± 0.02 c1.46 ± 0.01 b5.03 ± 0.02 g6.66 ± 0.06 i4.13 ± 0.05 e4658.17 *
MgO0.11 ± 0 d0.82 ± 0.02 e0.09 ± 0 a,b,c0.10 ± 0 b,c,d0.09 ± 0.01 a,b0.11 ± 0 d0.08 ± 0 a0.11 ± 0 c,d0.81 ± 0 e10,957.66 *
Na2O2.24 ± 0.07 g1.13 ± 0.01 d0.21 ± 0.02 a2.16 ± 0.01 f,g1.28 ± 0.02 e2.13 ± 0.06 f0.53 ± 0.01 b0.47 ± 0 b0.96 ± 0.06 c1341.65 *
P2O57.19 ± 0.07 f4.32 ± 0.02 a10.90 ± 0.06 h6.44 ± 0.05 e5.43 ± 0.01 c12.02 ± 0.02 i8.34 ± 0.06 g6.17 ± 0.02 d4.92 ± 0.09 b9173.42 *
SiO219.63 ± 0.15 e10.14 ± 0.20 a51.70 ± 0.30 h22.17 ± 0.17 f10.98 ± 0.04 b18.94 ± 0.03 d48.85 ± 0.06 g64.93 ± 0.21 i15.46 ± 0.11 c59,873.37 *
TiO20.35 ± 0.01 b0.11 ± 0 a0.58 ± 0.01 f0.53 ± 0.01 e0.47 ± 0.01 d0.43 ± 0 c0.66 ± 0.01 g0.68 ± 0 h0.33 ± 0.01 b1532.99 *
* means significance at α = 0.05; different horizontal letters indicate significance differences at p < 0.05 according to Tukey’s test.
Table 4. Indicators of heating device contamination by ash from the tested biomass.
IndexMaterial
CCCGCHCC–CHCG–CCCC–CGCH–CGCH–CCCG–CH
Rb/avalue2.130.520.411.131.101.400.350.310.62
riskEMLHHHLLM
Rsvalue1.110.260.20.580.690.960.160.150.30
riskMLLLLMLLL
AIvalue1.960.240.651.170.621.370.490.470.32
riskHMHHHHHHM
Srvalue62.5477.1175.7963.6866.8773.2078.4180.9867.10
riskHLLHMLLLM
ICvalue0.110.610.150.220.240.210.160.230.30
RiskLHLLLLLLH
SIvalue0.320.542.030.570.420.261.981.801.26
riskLLHLLLMMM
Fuvalue70.12.102.920.4711.4531.082.012.112.97
riskELLHHHLLL

