Tidal Current Energy Resource Distribution in Korea

Department of Naval Architecture and Ocean Engineering, Inha University, Incheon 22212, Korea
*
Author to whom correspondence should be addressed.
Energies 2019, 12(22), 4380; https://doi.org/10.3390/en12224380
Submission received: 16 September 2019
/
Revised: 13 November 2019
/
Accepted: 16 November 2019
/
Published: 18 November 2019
(This article belongs to the Section A: Sustainable Energy)
Abstract
:Korea is a very well-known country for having abundant tidal current energy resources. There are many attractive coastal areas for the tidal current power that have very strong currents due to the high tidal range and the acceleration through the narrow channels between islands in the west and south coasts of the Korean peninsula. Recently, the Korean government announced a plan that aims to increase the portion of electricity generated from renewable energy to 20% by 2030. Korea has abundant tidal current energy resources; however, as reliable resource assessment results of tidal current energy are not sufficient, the portion of tidal current power is very small in the plan. Therefore, a reliable resource assessment should be conducted in order to provide a basis for the development plan. This paper describes the resource assessment of tidal current energy in Korea based on the observational data provided by KHOA (Korean Hydrographic and Oceanographic Agency) and numerical simulation of water circulation. As the observational data were unable to present the detailed distribution of the complicated tidal current between islands, numerical simulation of water circulation was used to describe the detailed distribution of tidal current in Incheon-Gyeonggi and Jeollanam-do, where the tidal energy potentials are abundant. The west and south coastal areas of Korea were divided into seven regions according to the administrative district, and the theoretical tidal current potential was calculated using average power intercepted. The results of this research can provide the insight of the tidal current energy development plan in Korea.
1. Introduction
Tidal energy is advantageous to grid management with high energy density, reliability, and predictability [1]. Especially, power extracted from tidal energy can be exactly estimated in advance, using harmonic analysis. The west coast of Korea, where tidal range is up to 10 m, has abundant tidal energy. Moreover, Korea has approximately 3600 islands which form narrow channels between islands, where tidal current is concentrated and accelerated. Thus, the west and south coasts of Korea have many exploitable areas with strong tidal current. Several tidal farm development plans were announced in these areas.
In 2007, Jeollanam-do agreed to develop a 300 MW tidal farm in the Wando strait area, and in 2009, the Incheon tidal farm project, a 200 MW tidal farm project, was launched to develop near Deokjeok Island [2]. There are also some other tidal farm projects, such as the Shinan tidal farm project, the Daebang tidal farm project, the Maenggol tidal farm project, and the Jangjuk tidal farm project [3].
In 2017, the Korean Government announced a plan to increase the portion of electricity generated from renewable energy to 20% by 2030. This is nearly double the target of 11.7% proposed by the previous master plan. In addition, the Korean Government intended to increase the renewable generation target of RPS (renewable portfolio standard) to 28% by 2030. In order to achieve this goal, a realistic and viable development plan for the available renewable energy sources should be established based on the reliable resource assessment results.
When it comes to ocean energy, several studies were conducted regarding the resource assessment in Korea. Jo et al. [2] introduced the present and planned tidal farm projects in Korea and described the background and environmental conditions of these projects. Jo et al. [3] introduced average power intercepted to estimate the tidal current energy potential in Korea based on ocean survey data. Kim et al. [4] described an overview of resource assessment of ocean energy potentials around Korea. Byun et al. [5] conducted a preliminary resource assessment of the tidal current potentials of the south and west coasts of Korea based on the observational records from 264 stations. Kim et al. [6] presented the wave energy distribution around the Korean peninsula based on hindcast wave data during the period of 1979–2003.
However, these previous studies were partially conducted with a coarse spatial resolution, and the results of them are not enough to be the basis of the development plan for ocean energy. The Korean Government has a very conservative point of view about the ocean energy development because of the lack of reliable results of ocean energy resource assessment in Korea. Hence, though Korea has plenty of tidal energy resources, the portion of ocean energy in the plan is considerably small. To establish a realistic and viable development plan for ocean energy, there needs to be a reliable resource assessment.
Also, there are resource assessment results for ocean energy in other areas worldwide. Lewis et al. examined the tidal energy potential of the Irish Sea, using a high-resolution three-dimensional (3D) hydrodynamic model [7]. Guillou et al. investigated tidal energy resources around France based on a 250 m resolution harmonic database [8]. Neill et al. described theoretical and technical tidal and wave energy resources around Scotland [9]. Guiberteau et al. and Pastor and Liu depicted the wave energy in the Gulf of Mexico (GOM) [10,11]. Melikoglu described the studies on resource assessment of ocean energy as an up-to-date global review [12].
Many organizations announced methodologies for the energy resource assessment, introducing three to five steps which can be categorized as theoretical, technical, and economic potentials [3]. Theoretical potential is defined as the total natural energy in a region, and technical potential is the extractable energy from the theoretical potential using the present technology, considering device efficiency, utilization factor, water depth limitation, cut-in speed, etc. Market potential is the practical energy potential considering financial feasibility, including energy demand, standard market price, and regulated areas due to sea route, military, protection of environment, fishery, port facility, etc. Also, government support based on FIT (feed in tariff) or RPS can be considered to evaluate the market potential.
In this paper, the tidal current energy distribution in Korea was investigated based on the observational data provided by KHOA (Korean Hydrographic and Oceanographic Agency). In addition, numerical simulation of water circulation was conducted to improve the spatial resolution and describe the detailed distribution of the tidal current in Incheon-Gyeonggi and Jeollanam-do, where tidal energy potentials are abundant. Theoretical and technical potentials of tidal current energy in Korea were estimated based on these data, yet market potential is excluded because it includes economic considerations. The average power intercepted, which has been applied in the wind power resource assessment, was introduced to estimate tidal energy potentials of each region from power density.
2. Study Area
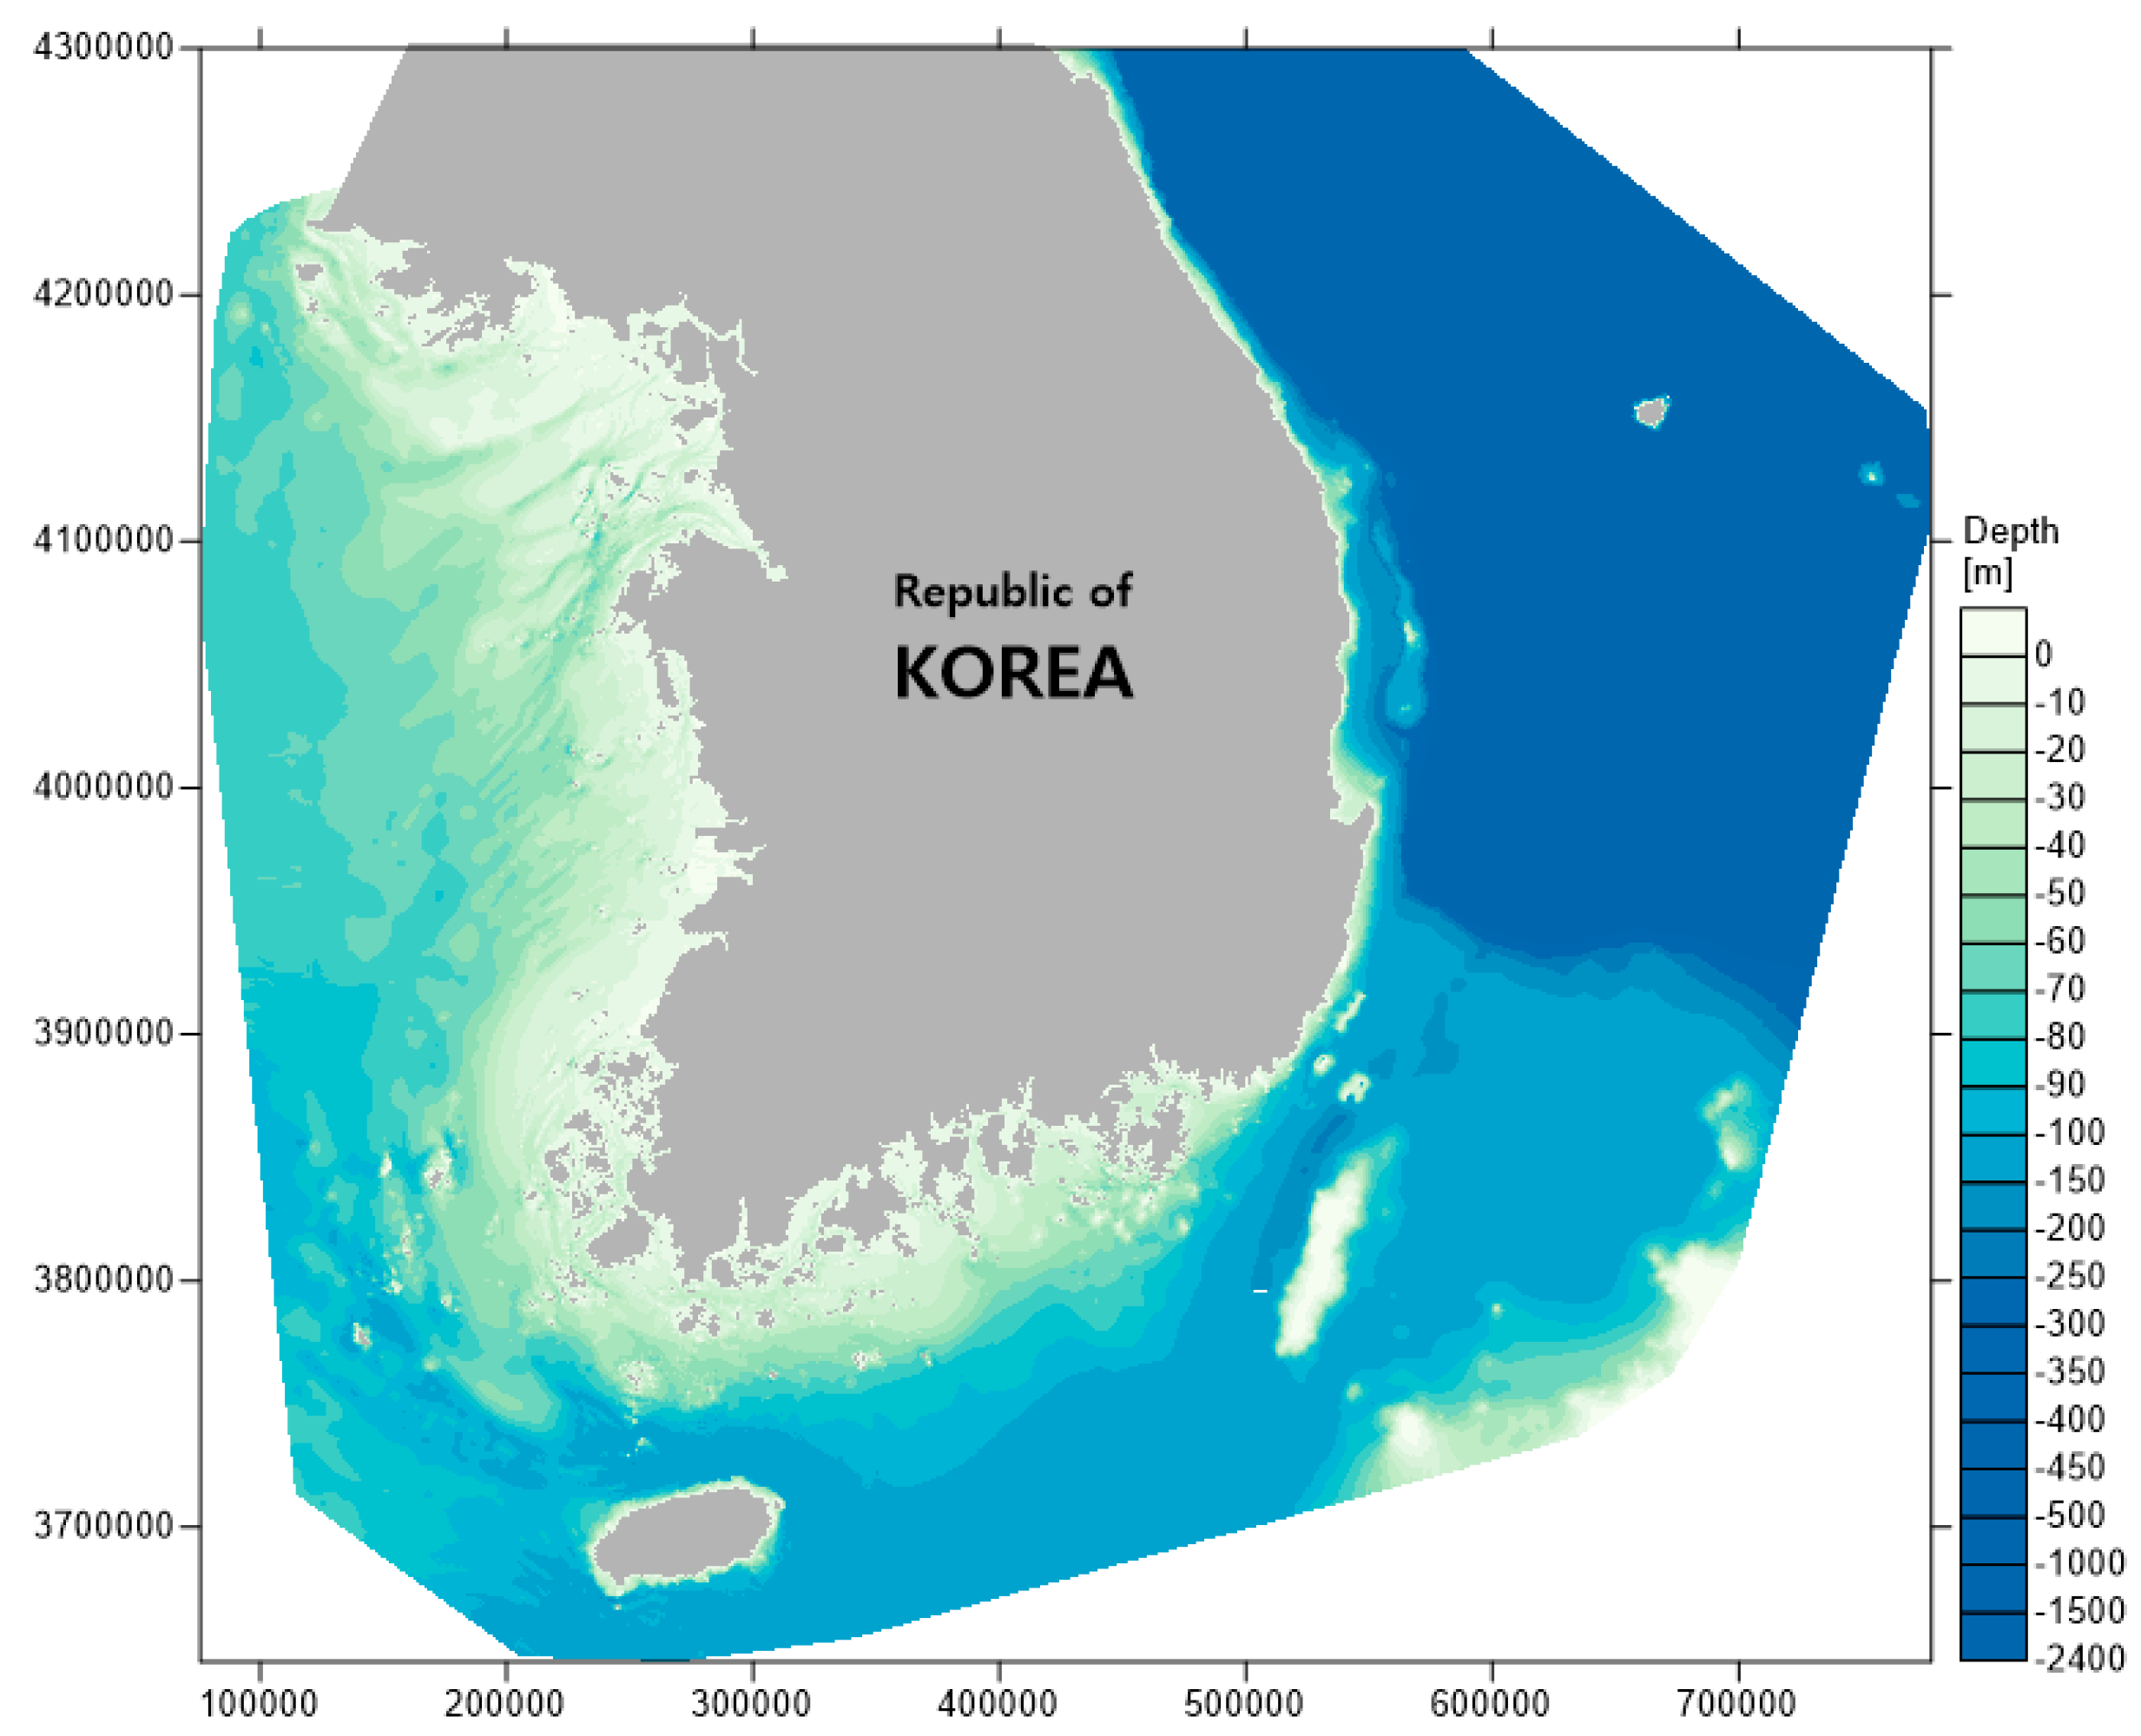
2.1. Bathymetry
A bathymetry chart of Korea was drawn by merging coastlines, depth contours, and soundings from 110 electronic nautical charts distributed by KHOA, as shown in Figure 1 [13,14]. The west and south coasts of Korea are rias coasts, which have a lot of islands and complex coastlines. On the contrary, the east coast of Korea is an emerged coast, which has a simple coastline and gets rapidly deeper, so it is hard to install a tidal device in this area. Moreover, due to its very low tidal current speed with low tidal range, the east coast is regarded to have negligibly little tidal current energy potential and thus is excluded from the study area. Therefore, in this study, only the west and south coasts were investigated to show the tidal current distribution and estimate tidal current energy potentials of Korea.
2.2. Study Area
For a state that has special rights to explore and use marine resources, including energy resources from water and wind over EEZ (exclusive economic zone), the resource assessment of ocean energy at the national scale could cover EEZ. However, it is unrealistic to develop tidal current energy of EEZ, which entails enormous cost when it is deep and far from the coastline. Therefore, in this study, the study area was limited to the territorial sea extending, at most, 12 nautical miles from the baseline of a coastal state.
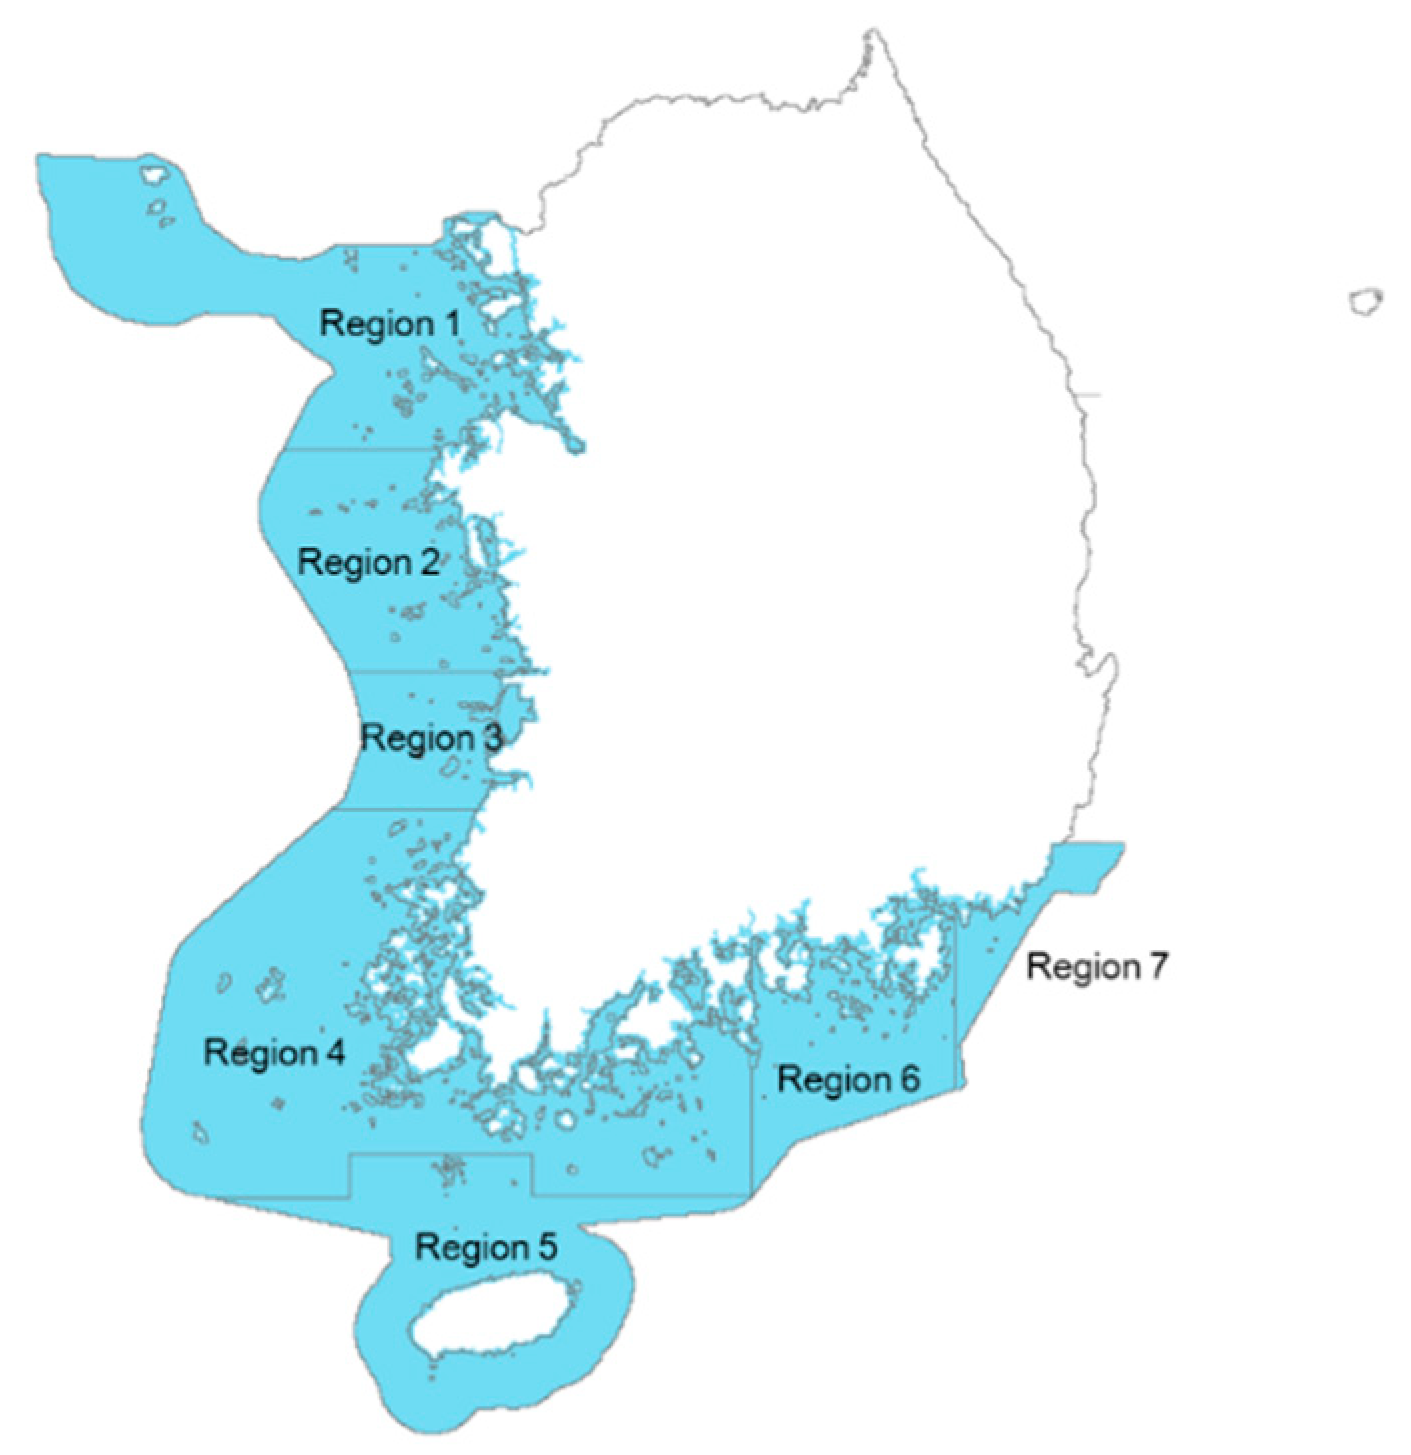
2.3. Division of Study Area
The west and south coastal areas of Korea were divided into seven regions according to the administrative district, as shown in Figure 2. For the jurisdictional sea area of each region which has not been officially decided, the division of coastal areas was roughly conducted. Territorial sea is divided into 1 km2 grids and the sea area of each region was estimated according to the division, as shown in Table 1.
3. Tidal Current Data
3.1. Observational Data
Since 1960, KHOA has measured the tidal currents around Korea in order to provide the information of tidal currents, mainly for the safety of navigation [5]. The observational data of 1973 measuring points were provided by KHOA and used to estimate the tidal energy distribution in Korea, 457 measuring points among these data were observed during about 30 days and the others were observed during more than one day.
Generally, maximum speed is used to describe tidal current distribution for tidal current power. When it comes to resource assessment, tidal current energy density is overestimated with maximum tidal current speed because tidal current speed varies sinusoidally with time. This can be corrected by using utilization factor and calculating technical potential. However, utilization factor is determined by the distribution function of tidal current speed, which is affected by regional characteristics such as tidal phenomena and submarine topography. It causes unnecessary error to apply a utilization factor for an entire survey area with maximum tidal current speed. Therefore, these observational time series data were converted to the average surface velocity of each measuring point.
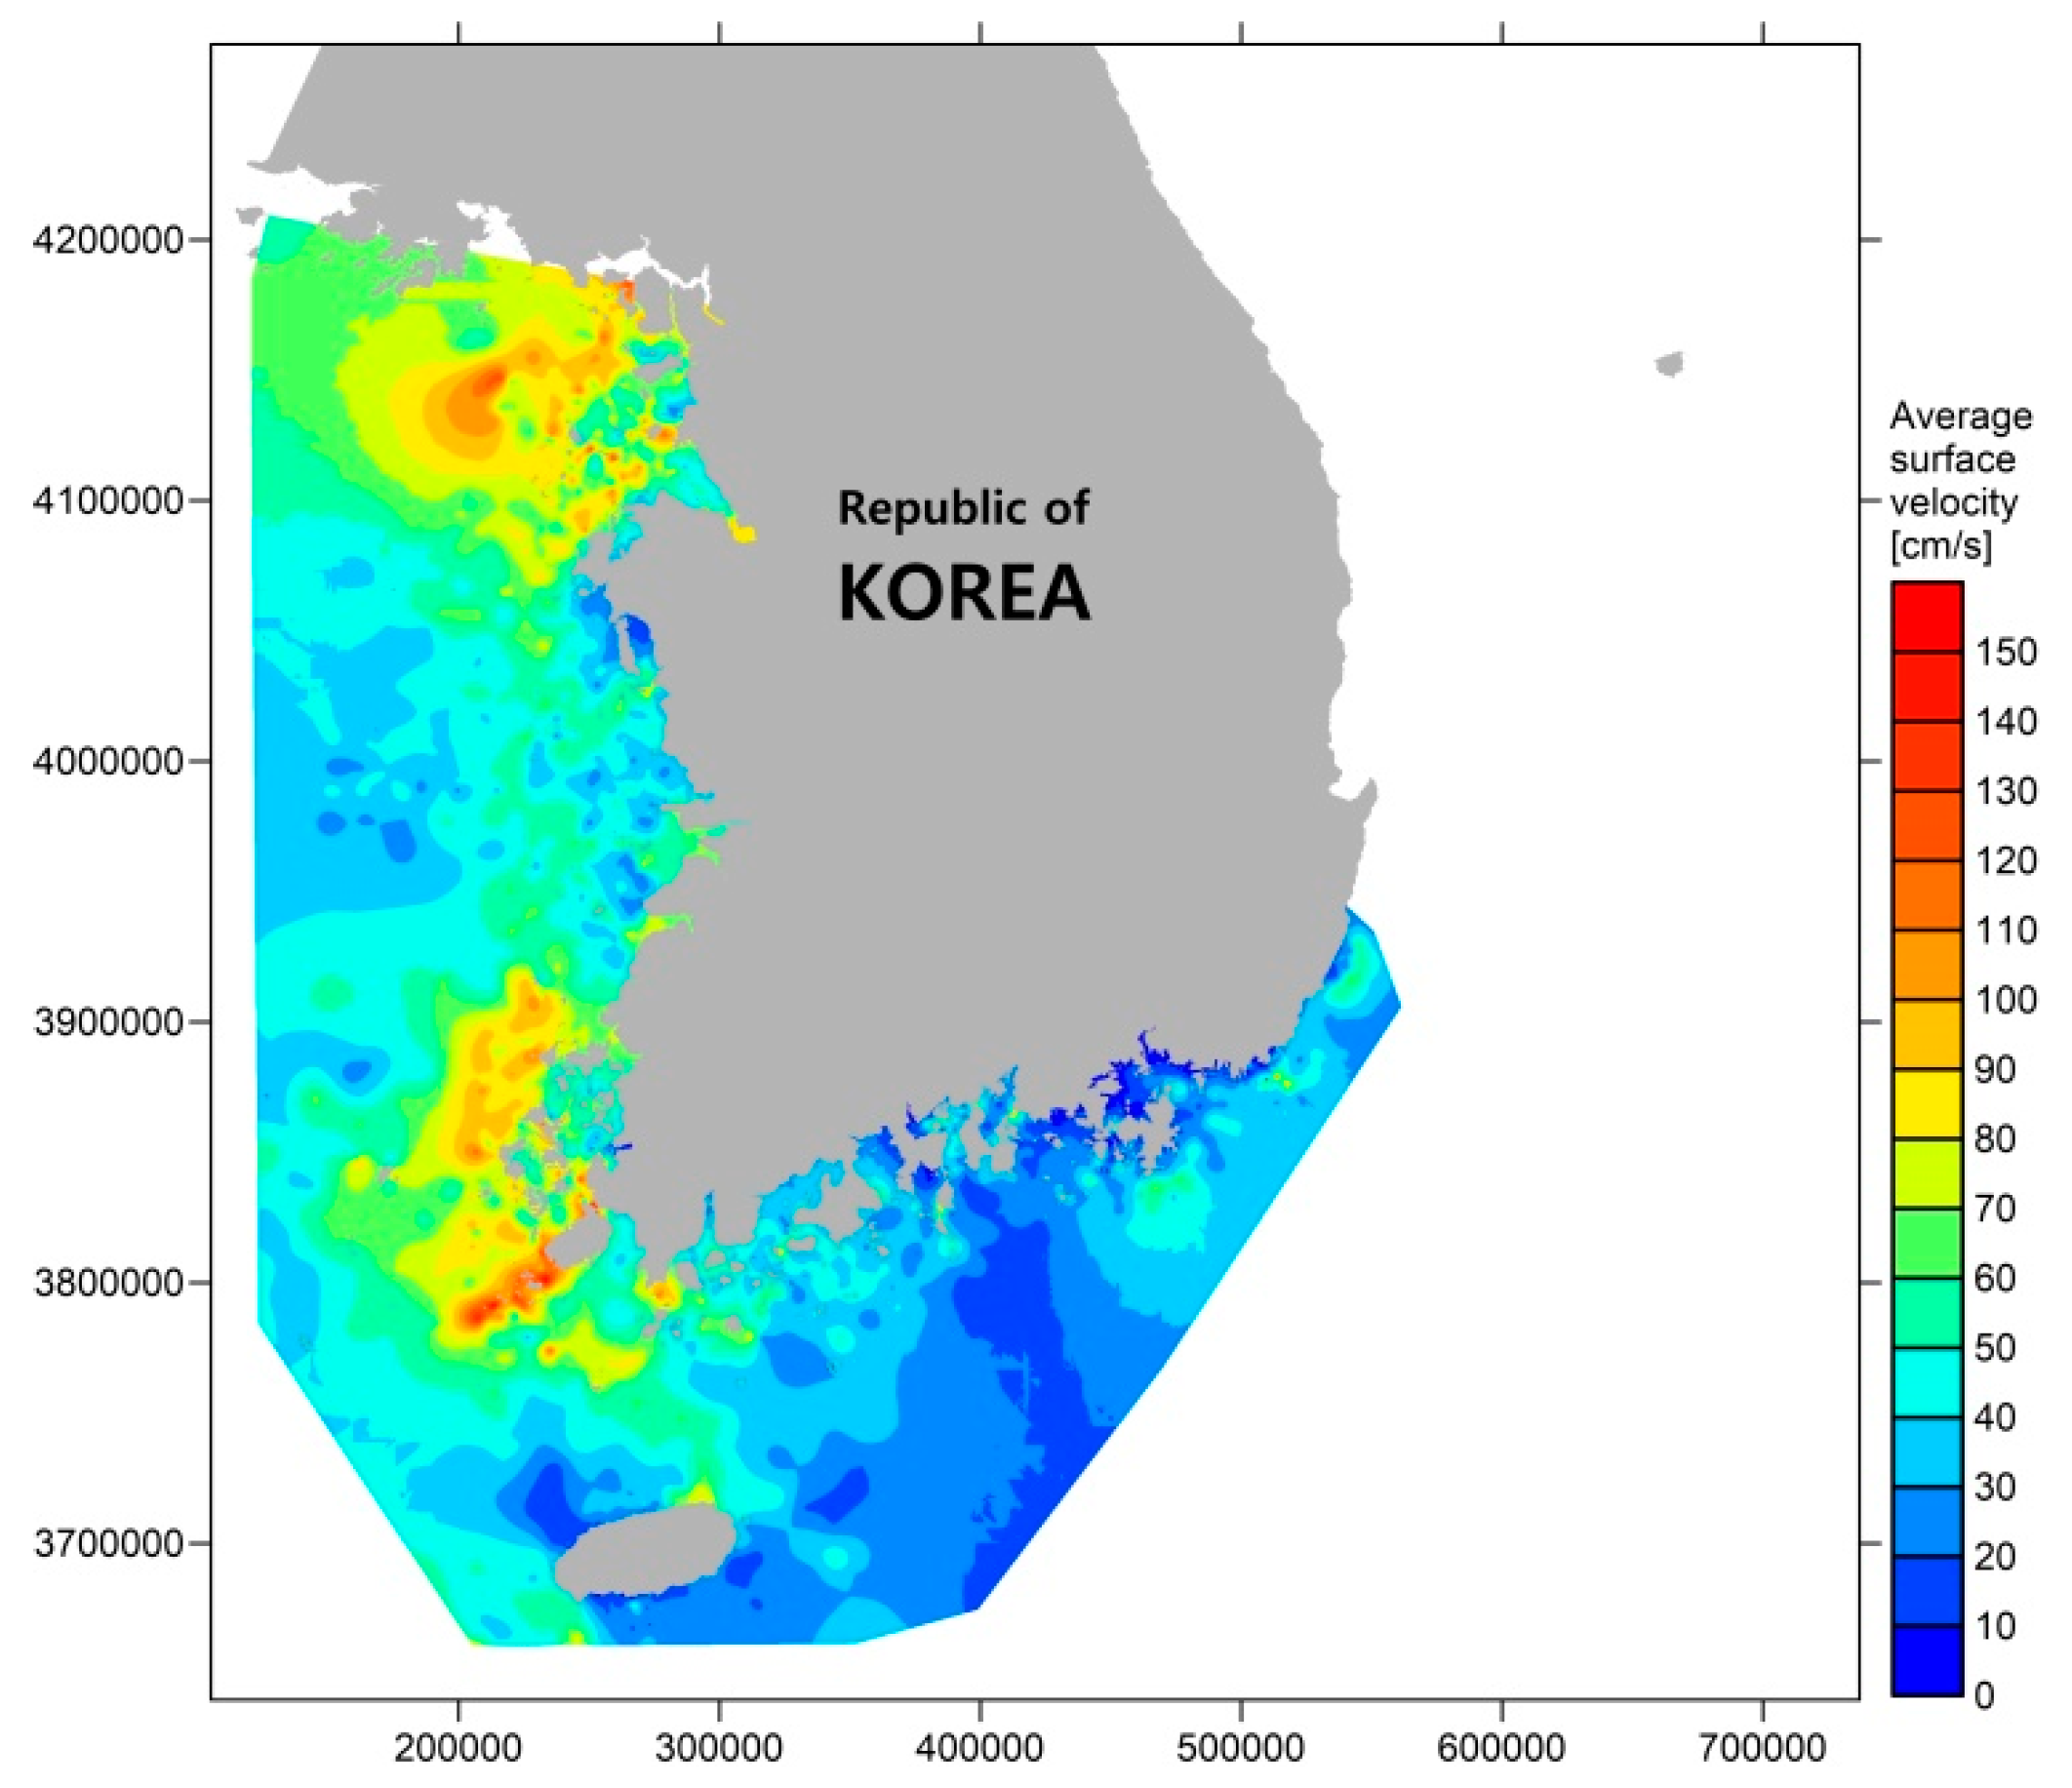
The tidal current speed distribution in Korea based on observational data is shown in Figure 3, which shows that regions 1 and 4 have many attractive coastal areas that have a very strong current. These regions have numbers of islands which boost the tidal current speed and affect the direction of the tidal current, whereas the other areas have relatively lower current speed than these two regions.
In regions 2 and 3, there are not many islands which form channels where tidal current is accelerated. Thus, although the tidal range of these regions is greater than region 4, the tidal current speed is slower and has a simpler distribution than that of region 4. When it comes to regions 5, 6, and 7, there is not enough tidal current energy due to the small tidal difference. Therefore, regions 1 and 4 are key for the tidal energy resource assessment in Korea.
The observational data are unable to describe the detailed distribution of current velocity of such regions due to the low spatial resolution. As shown in Figure 3, the tidal current speed distribution based on the observational data can show where the tidal current speed is high but cannot describe the exact flow characteristics and distribution of that area. Therefore, a numerical simulation of water circulation was conducted in regions 1 and 4 in order to increase spatial resolution of these regions and evaluate reliable tidal energy resources in Korea.
3.2. Numerical Simulation of Water Circulation
3.2.1. Study Site
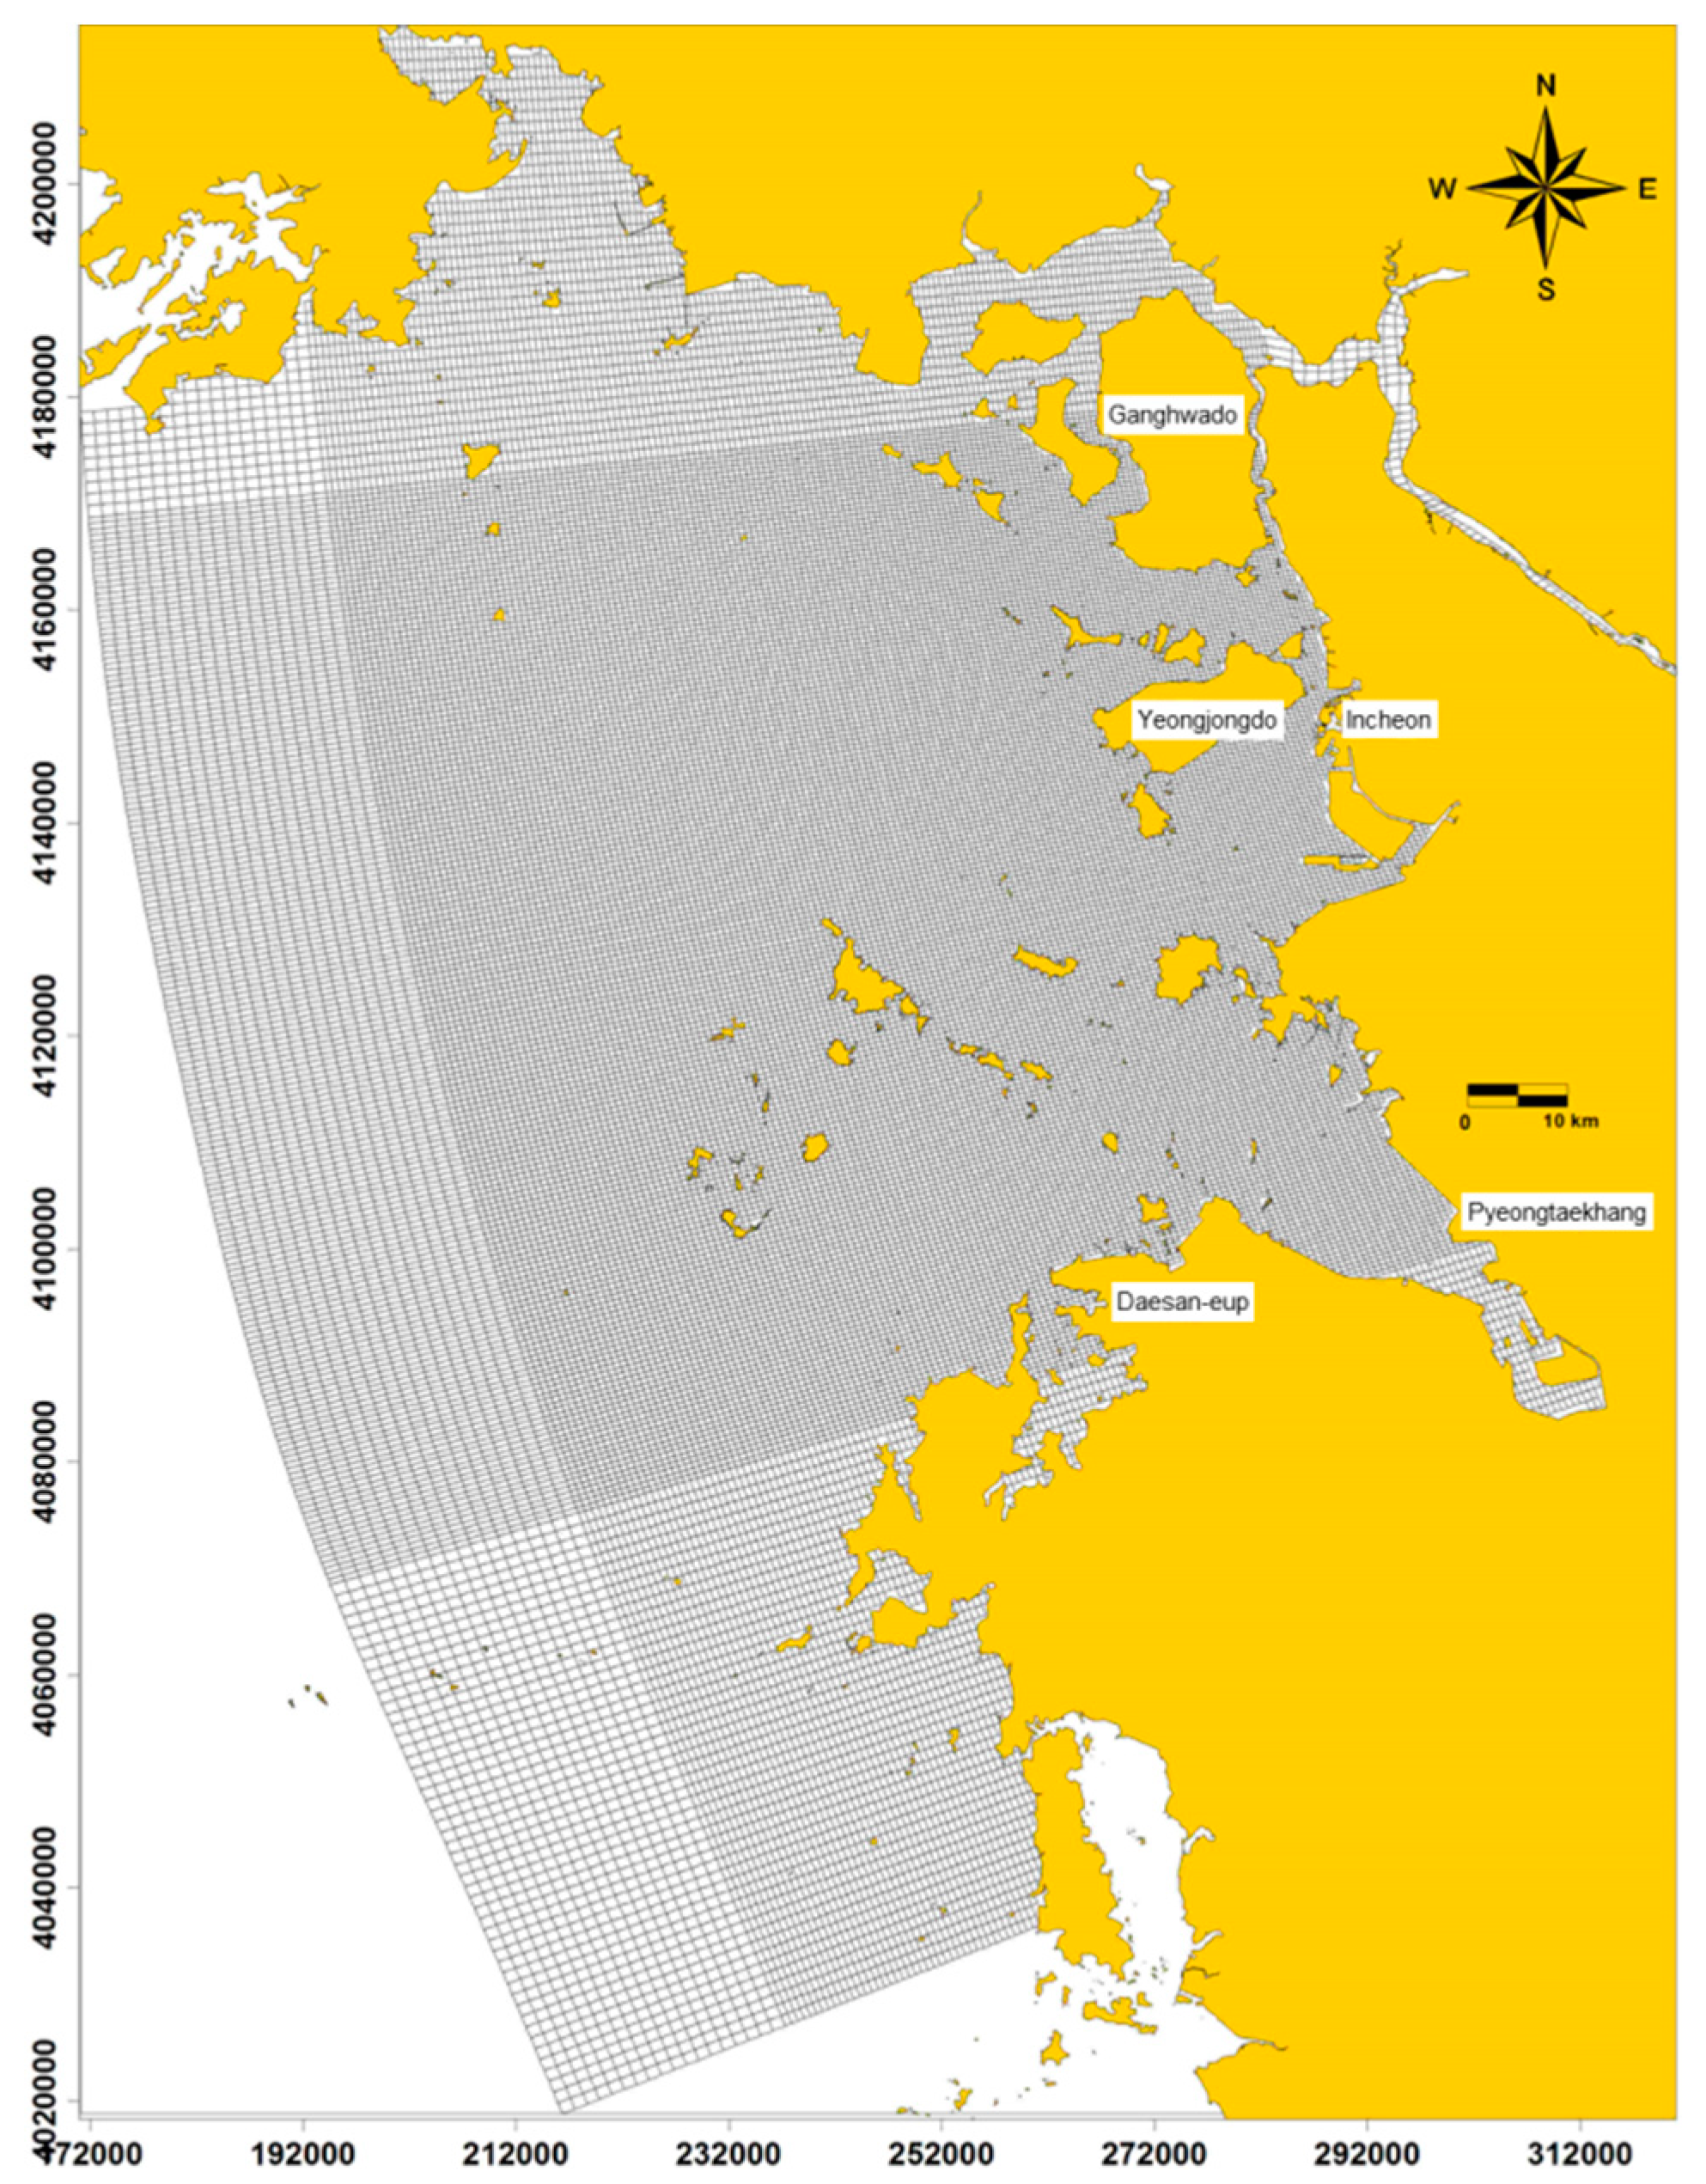
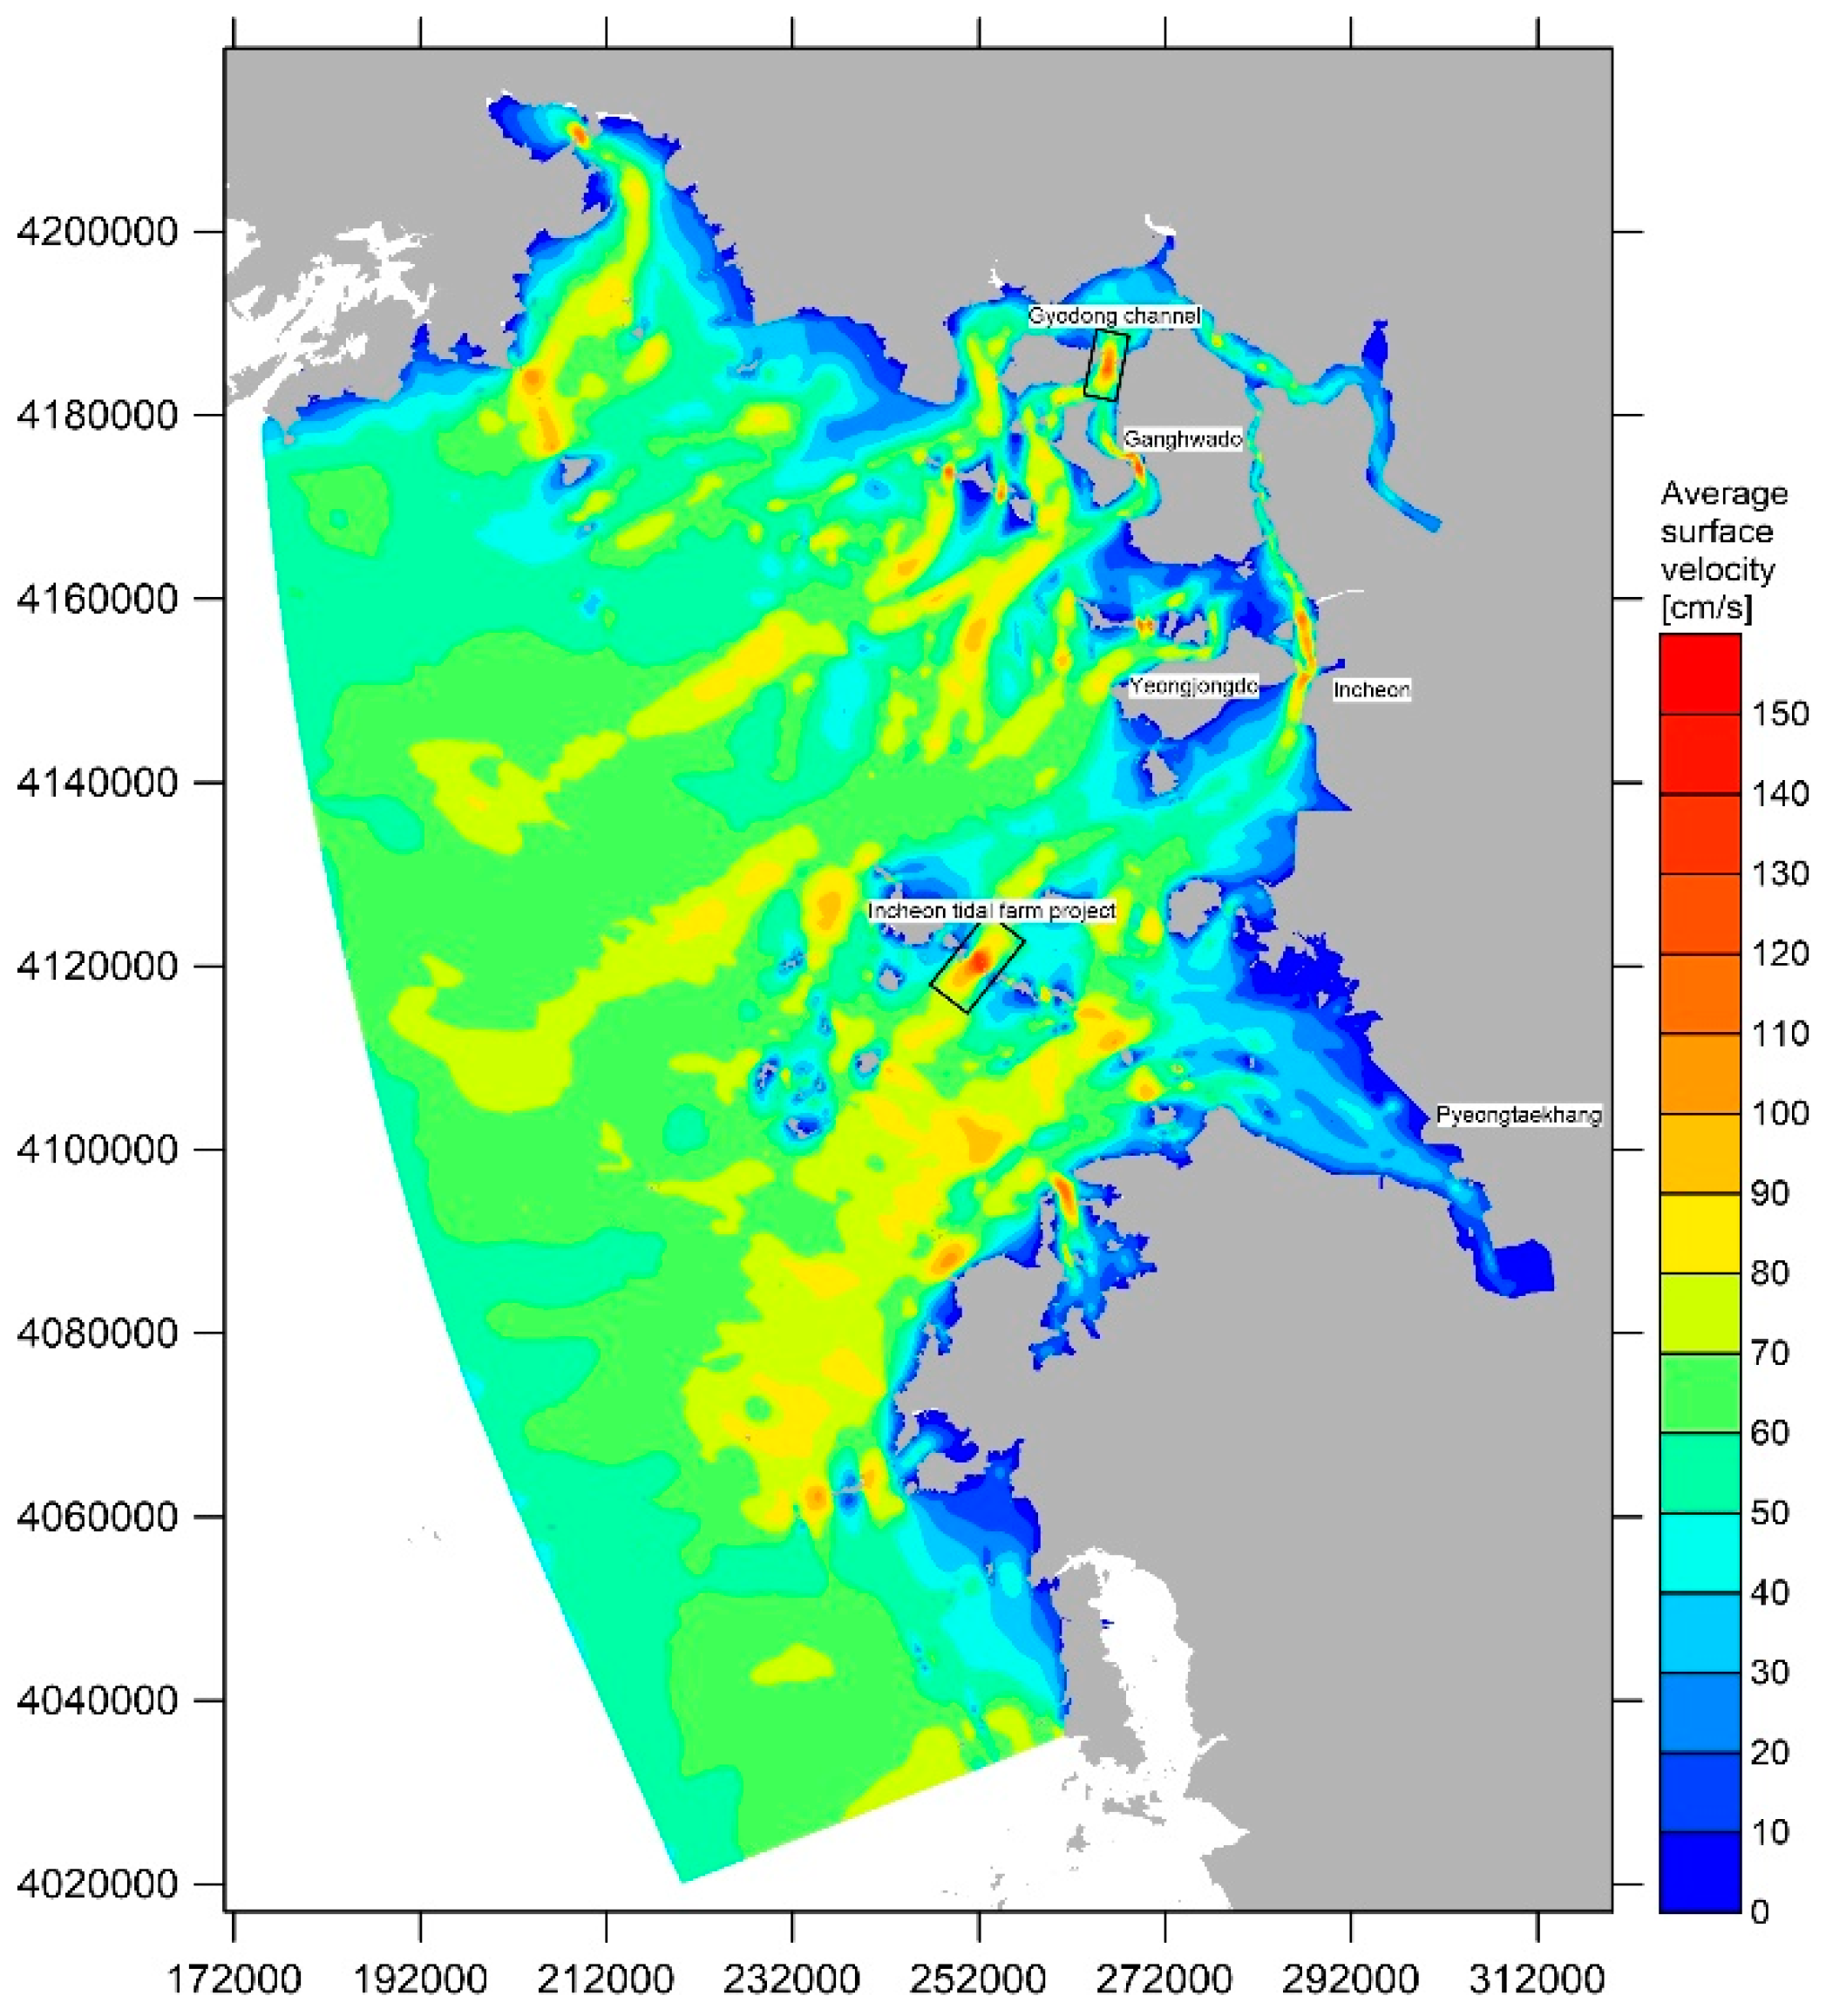
Region 1 is located at the middle of the west coast of Korea, where tidal difference reaches 10 m at maximum and thus, has abundant tidal current energy. This area is one of the most promising regions for tidal energy development in the world [4]. There are two big islands, Ganghwado and Yeongjongdo, and many small islands, which increase tidal current velocity around them. On the other hand, this region is characterized by shallow water less than 80 m deep and gently sloping submarine topography that is ideal for tidal current power development.
The domain of region 1 covers an area of 150 × 190 km, including the whole sea area of region 1, as shown in Figure 4. The Curvilinear orthogonal grids were composed to represent the complex geometry of the shore of the study area. The study domain was divided by 196 × 297 grid points and the grids consist of 34,250 nodes in the horizontal direction with a sigma stretched vertical layer. The size of the inner grid is about 500 m.
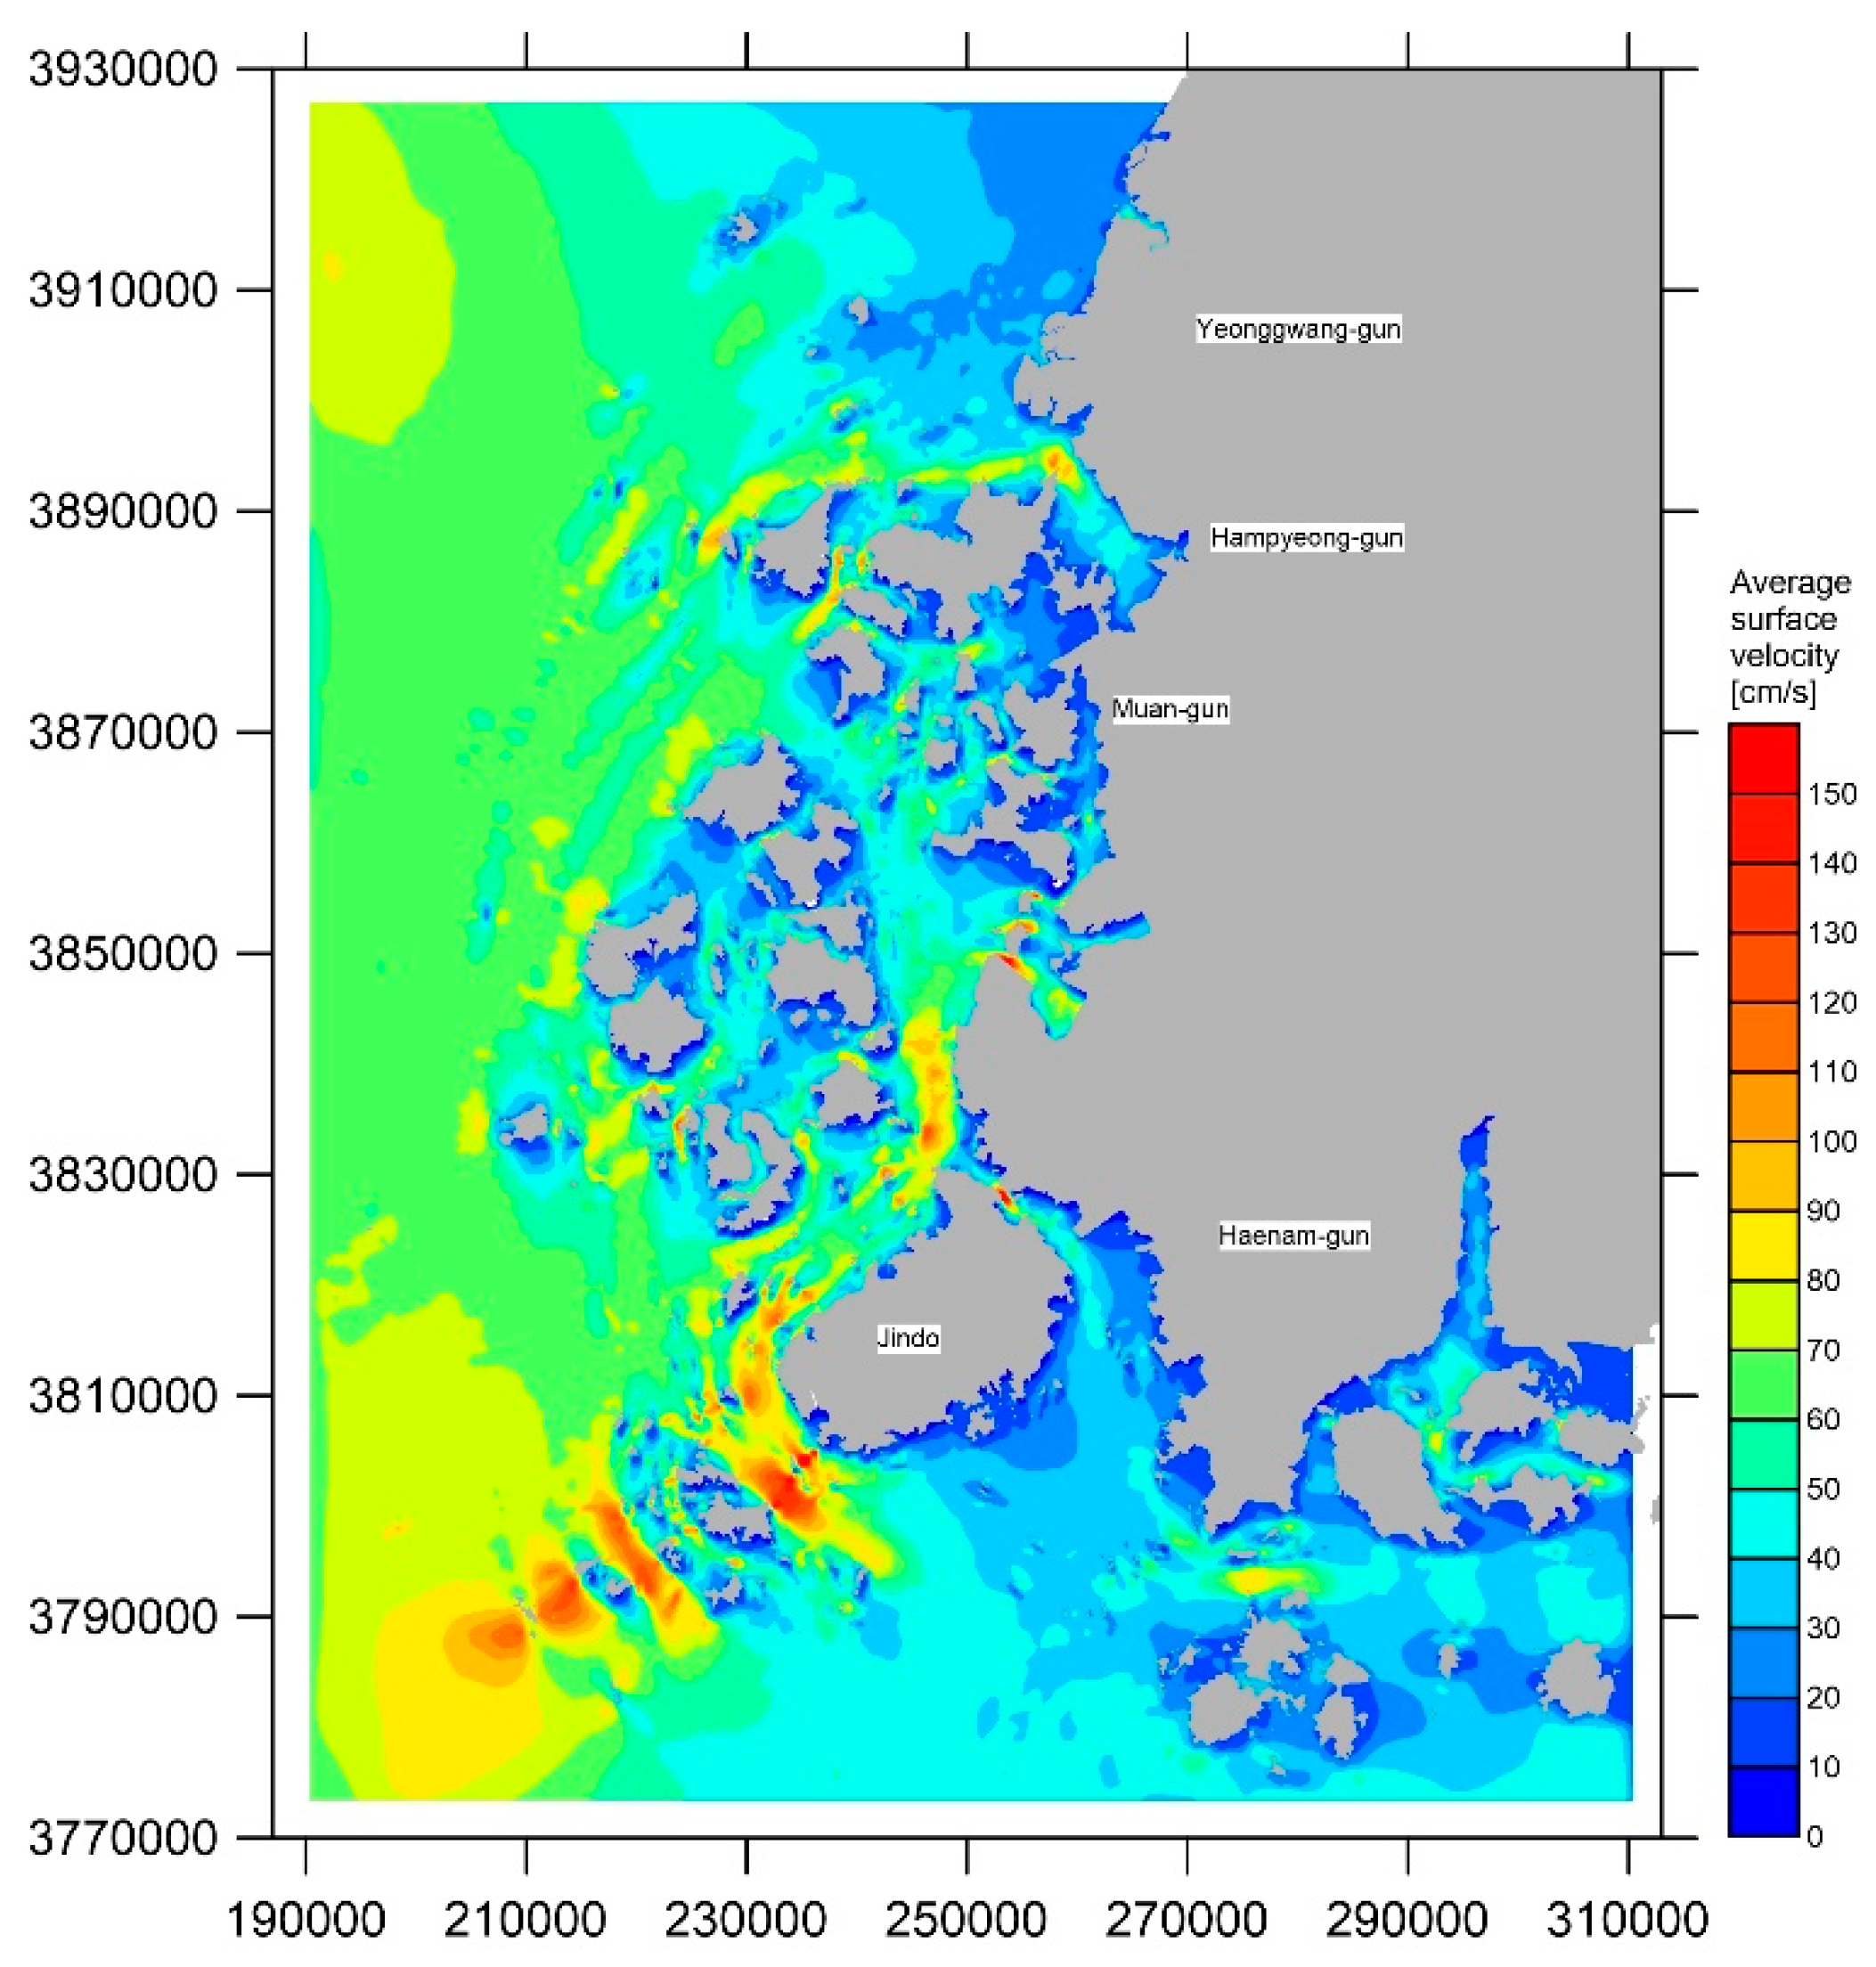
In Korea, there are about 3400 islands, and 60% of them are located in the southwest coast, including region 4 [15]. Therefore, there are many potential sites for tidal energy development, where tidal energy is concentrated as sea flows are channeled around or through constraining topographies formed by these islands, such as Uldolmok, Geocha channel, Jangjuk channel, Maenggol channel, and Heonggan channel.
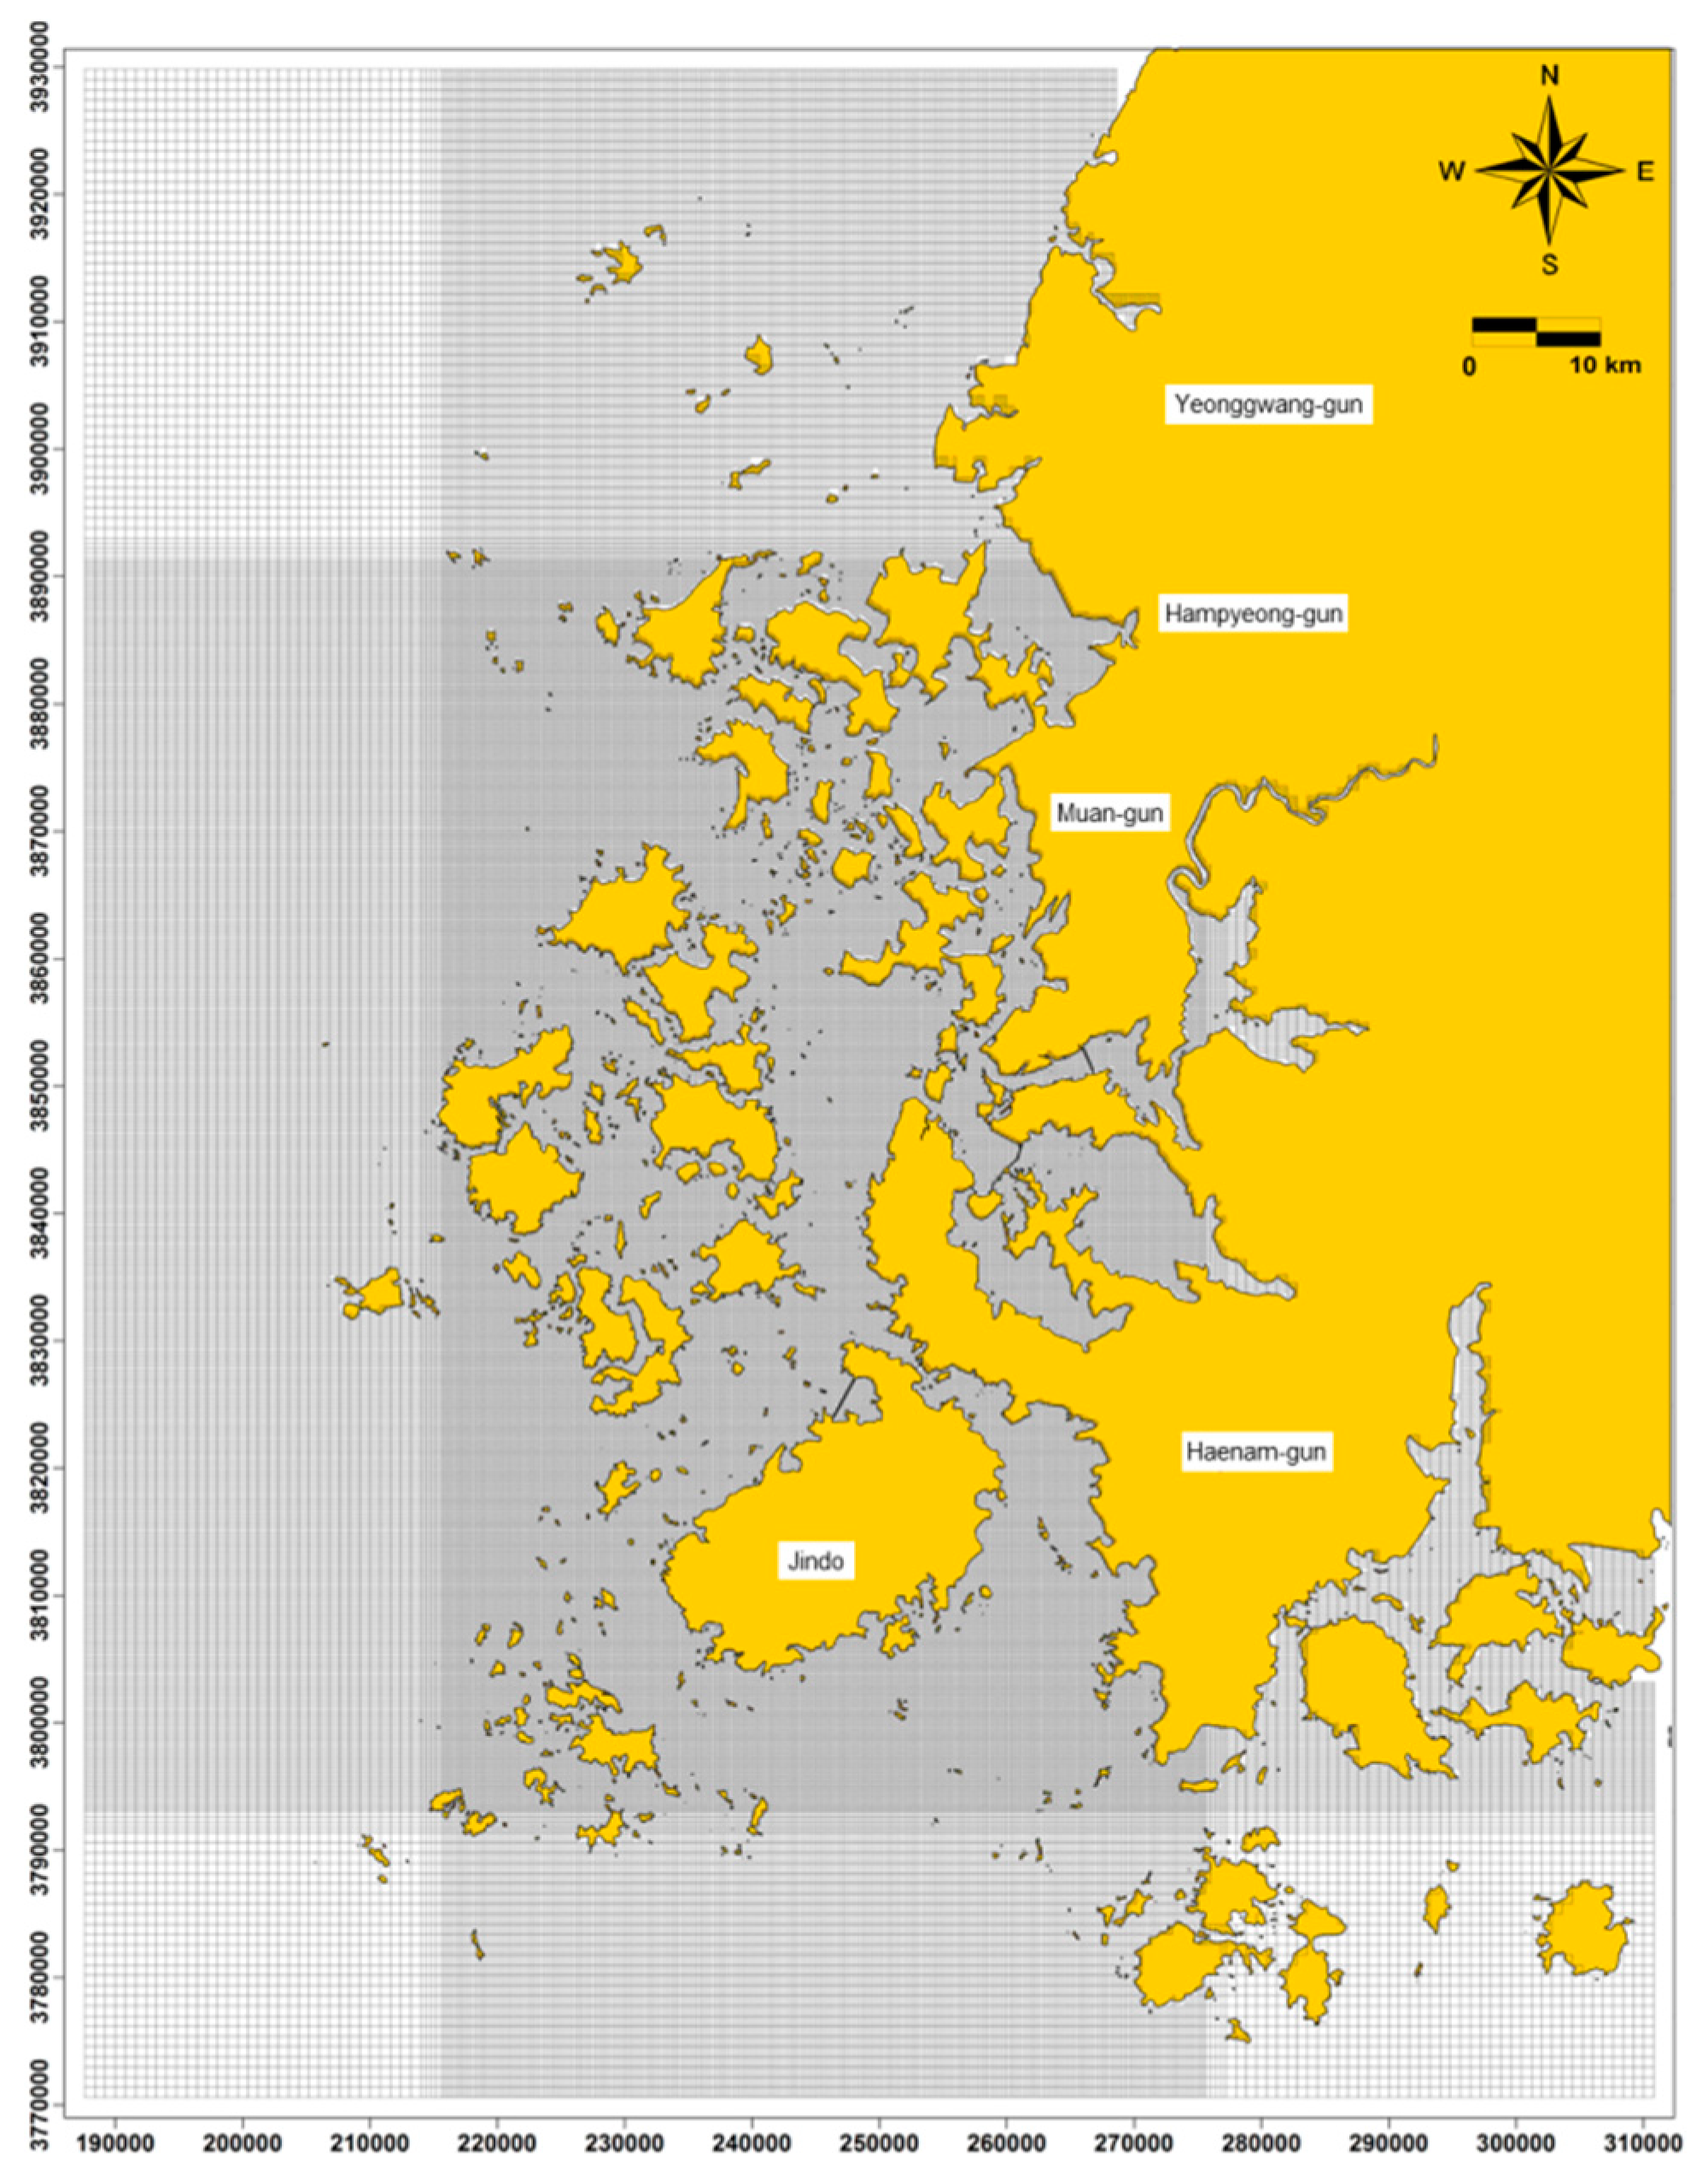
The domain of region 4 covers an area of 126.5 × 163 km, as shown in Figure 5, which includes the inner sea area of region 4 where a strong tidal current is observed, as shown in Figure 3. Considering the features of the study area, Cartesian grids were adopted because the complex geometry of the shoreline with 2000 or so islands is unable to be modelled using a curvilinear-orthogonal grid. The study domain was divided by 387 × 576 grid points and the grids consist of 141,662 nodes in the horizontal direction with a sigma stretched vertical layer. The size of the inner grid is about 200 m.
3.2.2. Environmental Fluid Dynamics Code (EFDC) Model
The environmental fluid dynamics code (EFDC), which was developed by the Virginia Institute of Marine Science (VIMS) in the United States, was used to simulate three-dimensional tidal currents of the study domains. O’Donncha et al. developed a numerical model of Cobscook Bay, a designated tidal energy test site, using EFDC, and validated it by comparing it with NOAA (National Oceanographic and Atmospheric Administration) data [16].
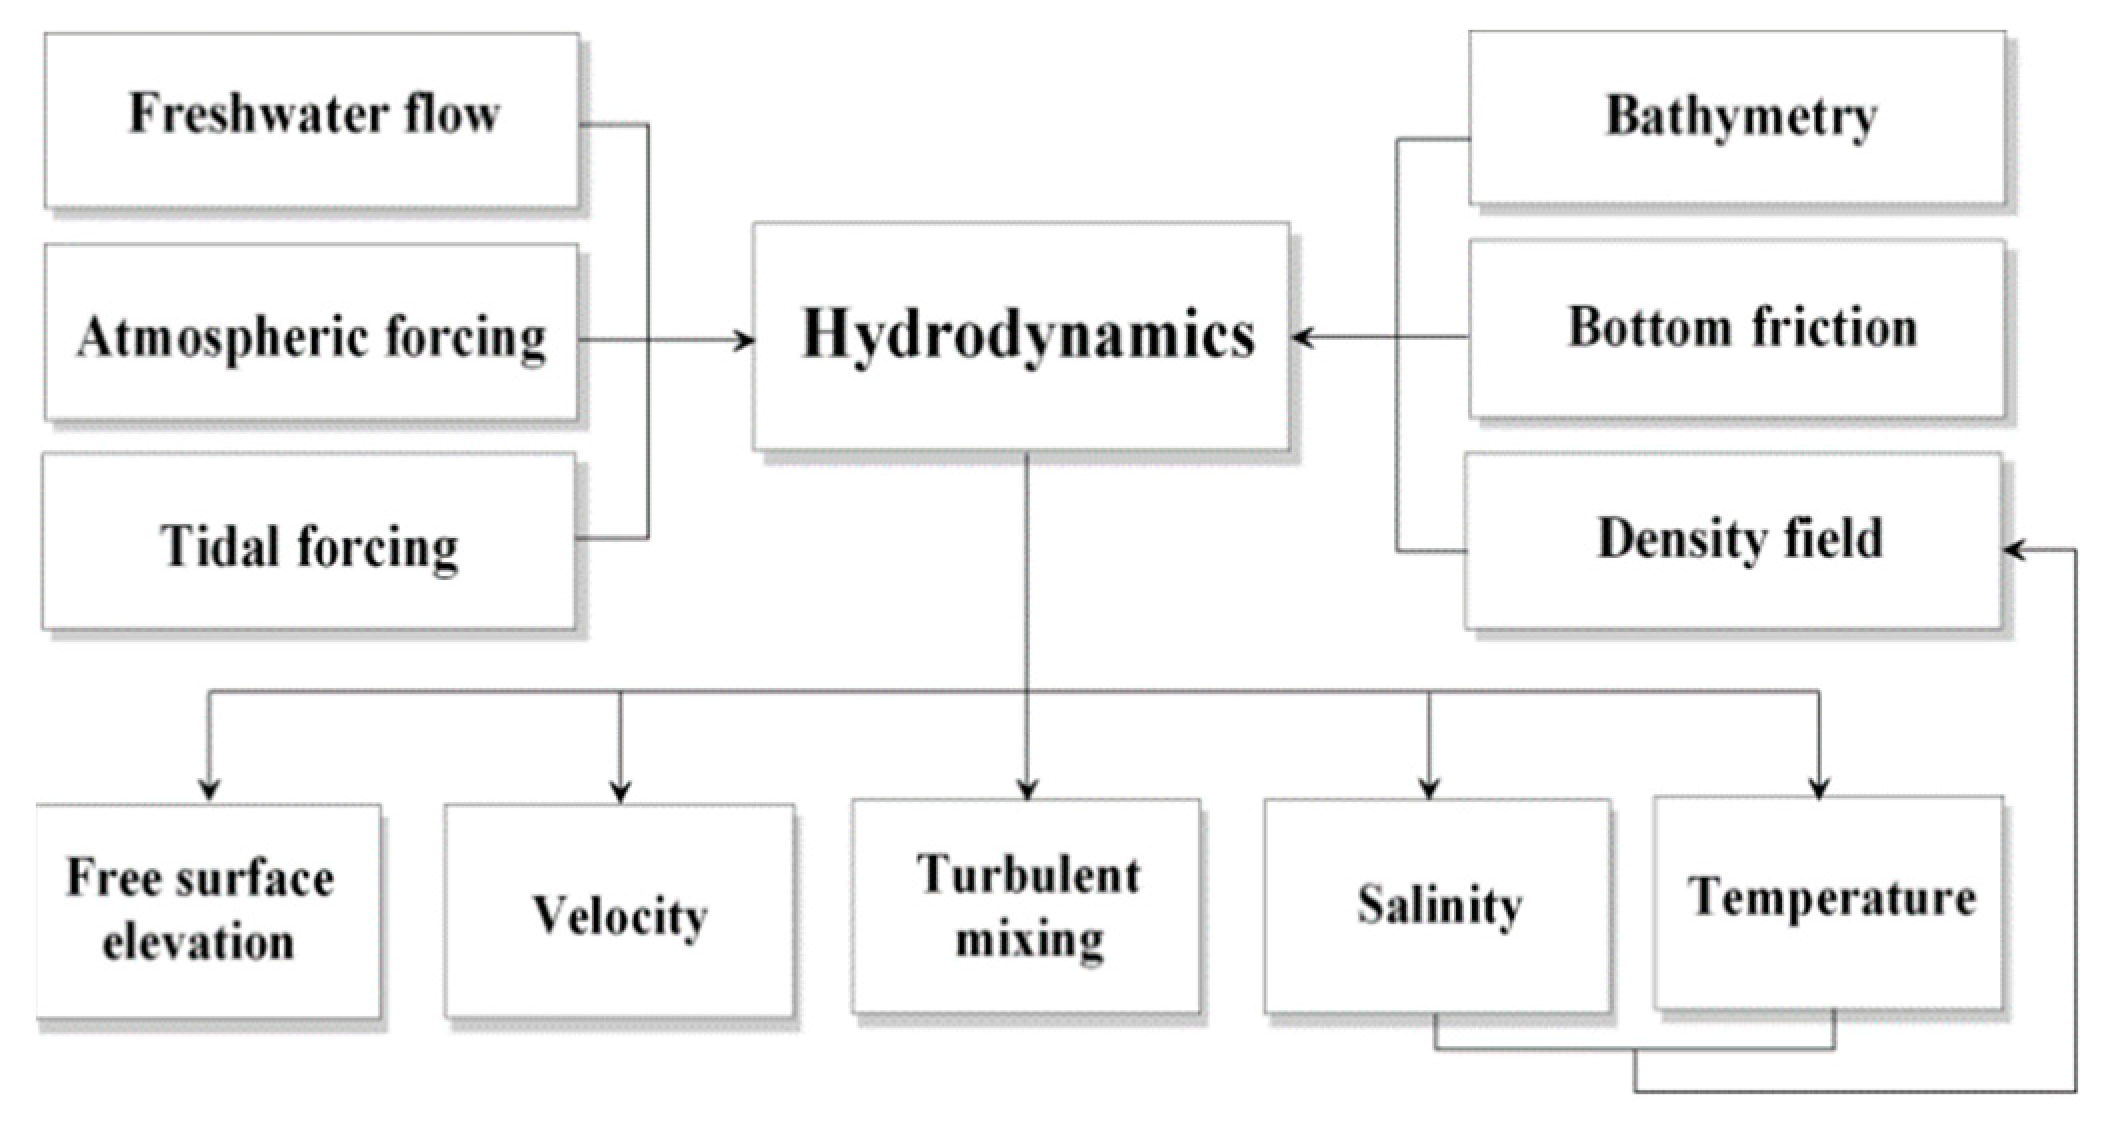
The EFDC solves the equations of motion and transport equations [17]. The equations of motion are vertically hydrostatic, free surface, variable density, and turbulent-averaged. The transport equations are for turbulence intensity and length scale, salinity, and temperature. A flow chart of the hydrodynamic model of the EFDC model is shown in Figure 6.
The EFDC model solves the shallow water equations by finite volume and finite difference techniques [17,18]. The turbulent equations of motion are transformed, and the Boussinesq approximation is utilized.
The continuity equation is:
where u, v, and w are velocity components in the coordinates x, y, and z; mx and my are the square roots of the diagonal elements of the metric tensor; m is the Jacobian or square root of the metric tensor determinant; H is the total depth; −h is the water depth and ζ is the physical vertical coordinates of the free surface.
The momentum equations are:
where p is the excess of the reference hydrostatic pressure divided by the reference density; ρ is density, and ρ0 is the reference density; f is the Coriolis parameter; Av is the vertical turbulent viscosity; Qu and Qv are momentum source-sink terms and b is buoyancy.
The transport equations for salinity and temperature are:
where S is salinity; T is temperature; QS and QT are the source and sink terms and Ab is the vertical turbulent diffusivity. Mellor and Yamada developed the second momentum turbulence closure, which was modified by Galperin et al., and it was used to provide the vertical turbulent viscosity and diffusivity [19,20]. On the other hand, the horizontal turbulent diffusion and the horizontal diffusion coefficient are determined as suggested by Smagorinsky [21].
In order to estimate the long-term power generation potential, it requires an observation or simulation period of at least 30 days [22]. In this study, the simulation period was set to 31 days, generating output every half hour.
A constant elevation of mean sea level was adopted as the initial condition for the water surface, and the tidal currents were set to zero across the domain. As the model was run for a cold start, the hydrodynamic processes within the model domain were forced by boundary condition [23]. The hydrodynamic model was run with a time step of 5 s to satisfy the CFL (Courant-Friedrichs-Lewy) condition, which the explicit schemes have to follow in the hydrodynamic computation.
3.2.3. Results
Average surface velocities over the one month simulation were calculated for the regions 1 and 4, as shown in Figure 7 and Figure 8. The results of numerical simulation show the detail distribution of tidal current of each region due to the increased spatial resolution compared to the observational data. Especially, numerical simulation results of a complex and accelerated tidal current in the channels between the islands where tidal energy potentials are abundant are accurate enough to be the basis of resource assessment of tidal current energy.
Tidal current distribution in region 1 based on numerical simulation is shown in Figure 7. The Incheon tidal farm project is the most promising site for tidal current power in region 1. Average surface velocity of the middle of the site reaches 140 cm/s and peak velocity is 286 cm/s. The Gyodong channel is another well-known site for its strong tidal current [5]. Average surface velocity of the middle of the site reaches 125 cm/s and peak velocity is 243 cm/s.
Tidal current distribution in region 4 based on numerical simulation is shown in Figure 8. Uldolmok, which has a narrow channel with maximum velocity of 6.5 m /s, is well known for its strong tidal current speed, and the 1 MW tidal current power facility was constructed in 2009 [2]. The average surface velocity of Uldolmok reaches 228 cm/s. Jangjuk channel, Geocha channel, and Maenggol channel are located in the southwest of Uldolmok and between islands in Dadohaehaesang National Park. Although tidal current velocities of these channels are not faster than Uldolmok, their area is wider than Uldolmok. The average surface velocity of Jangjuk channel reaches 169 cm/s, Geocha channel 128 cm/s, and Maenggol channel 137 cm/s.
The results of numerical simulation can describe the detailed distribution of the tidal current velocity of these regions due to the increased spatial resolution, as expected. Especially, these data represent the effect of constraining topographies on tidal current which concentrate tidal current at a specific area, thus increasing the tidal current energy potential of a region, while the observational data only represents each point and is unable to describe the detailed distribution of tidal current speed. Thus, the tidal current speed distribution of Korea was produced by merging the results of observational data and numerical simulation of water circulation.
4. Tidal Current Data
4.1. Average Power Intercepted
When resource assessment is conducted for kinetic energy from a fluid stream, the power density (PD) is useful to depict energy distribution [3]. The power density of kinetic energy is the amount of power per unit turbine disk area with upstream velocity (U) which is given by:
The power density of tidal current energy defines the kinetic energy flux as a function of tidal current speed. This is a useful definition to estimate the quality of energy at the particular point. Since the power density is unable to describe the quantity of energy in the region, the additional definition is necessary to assess the tidal energy potential.
The average power intercepted (API) is theoretically the extractable energy per unit area that has been used to estimate the wind power potential [24]. Since tidal current power has a largely similar mechanism with wind power, the method can be applied to the tidal current energy. The power density can be converted to average power intercepted as:
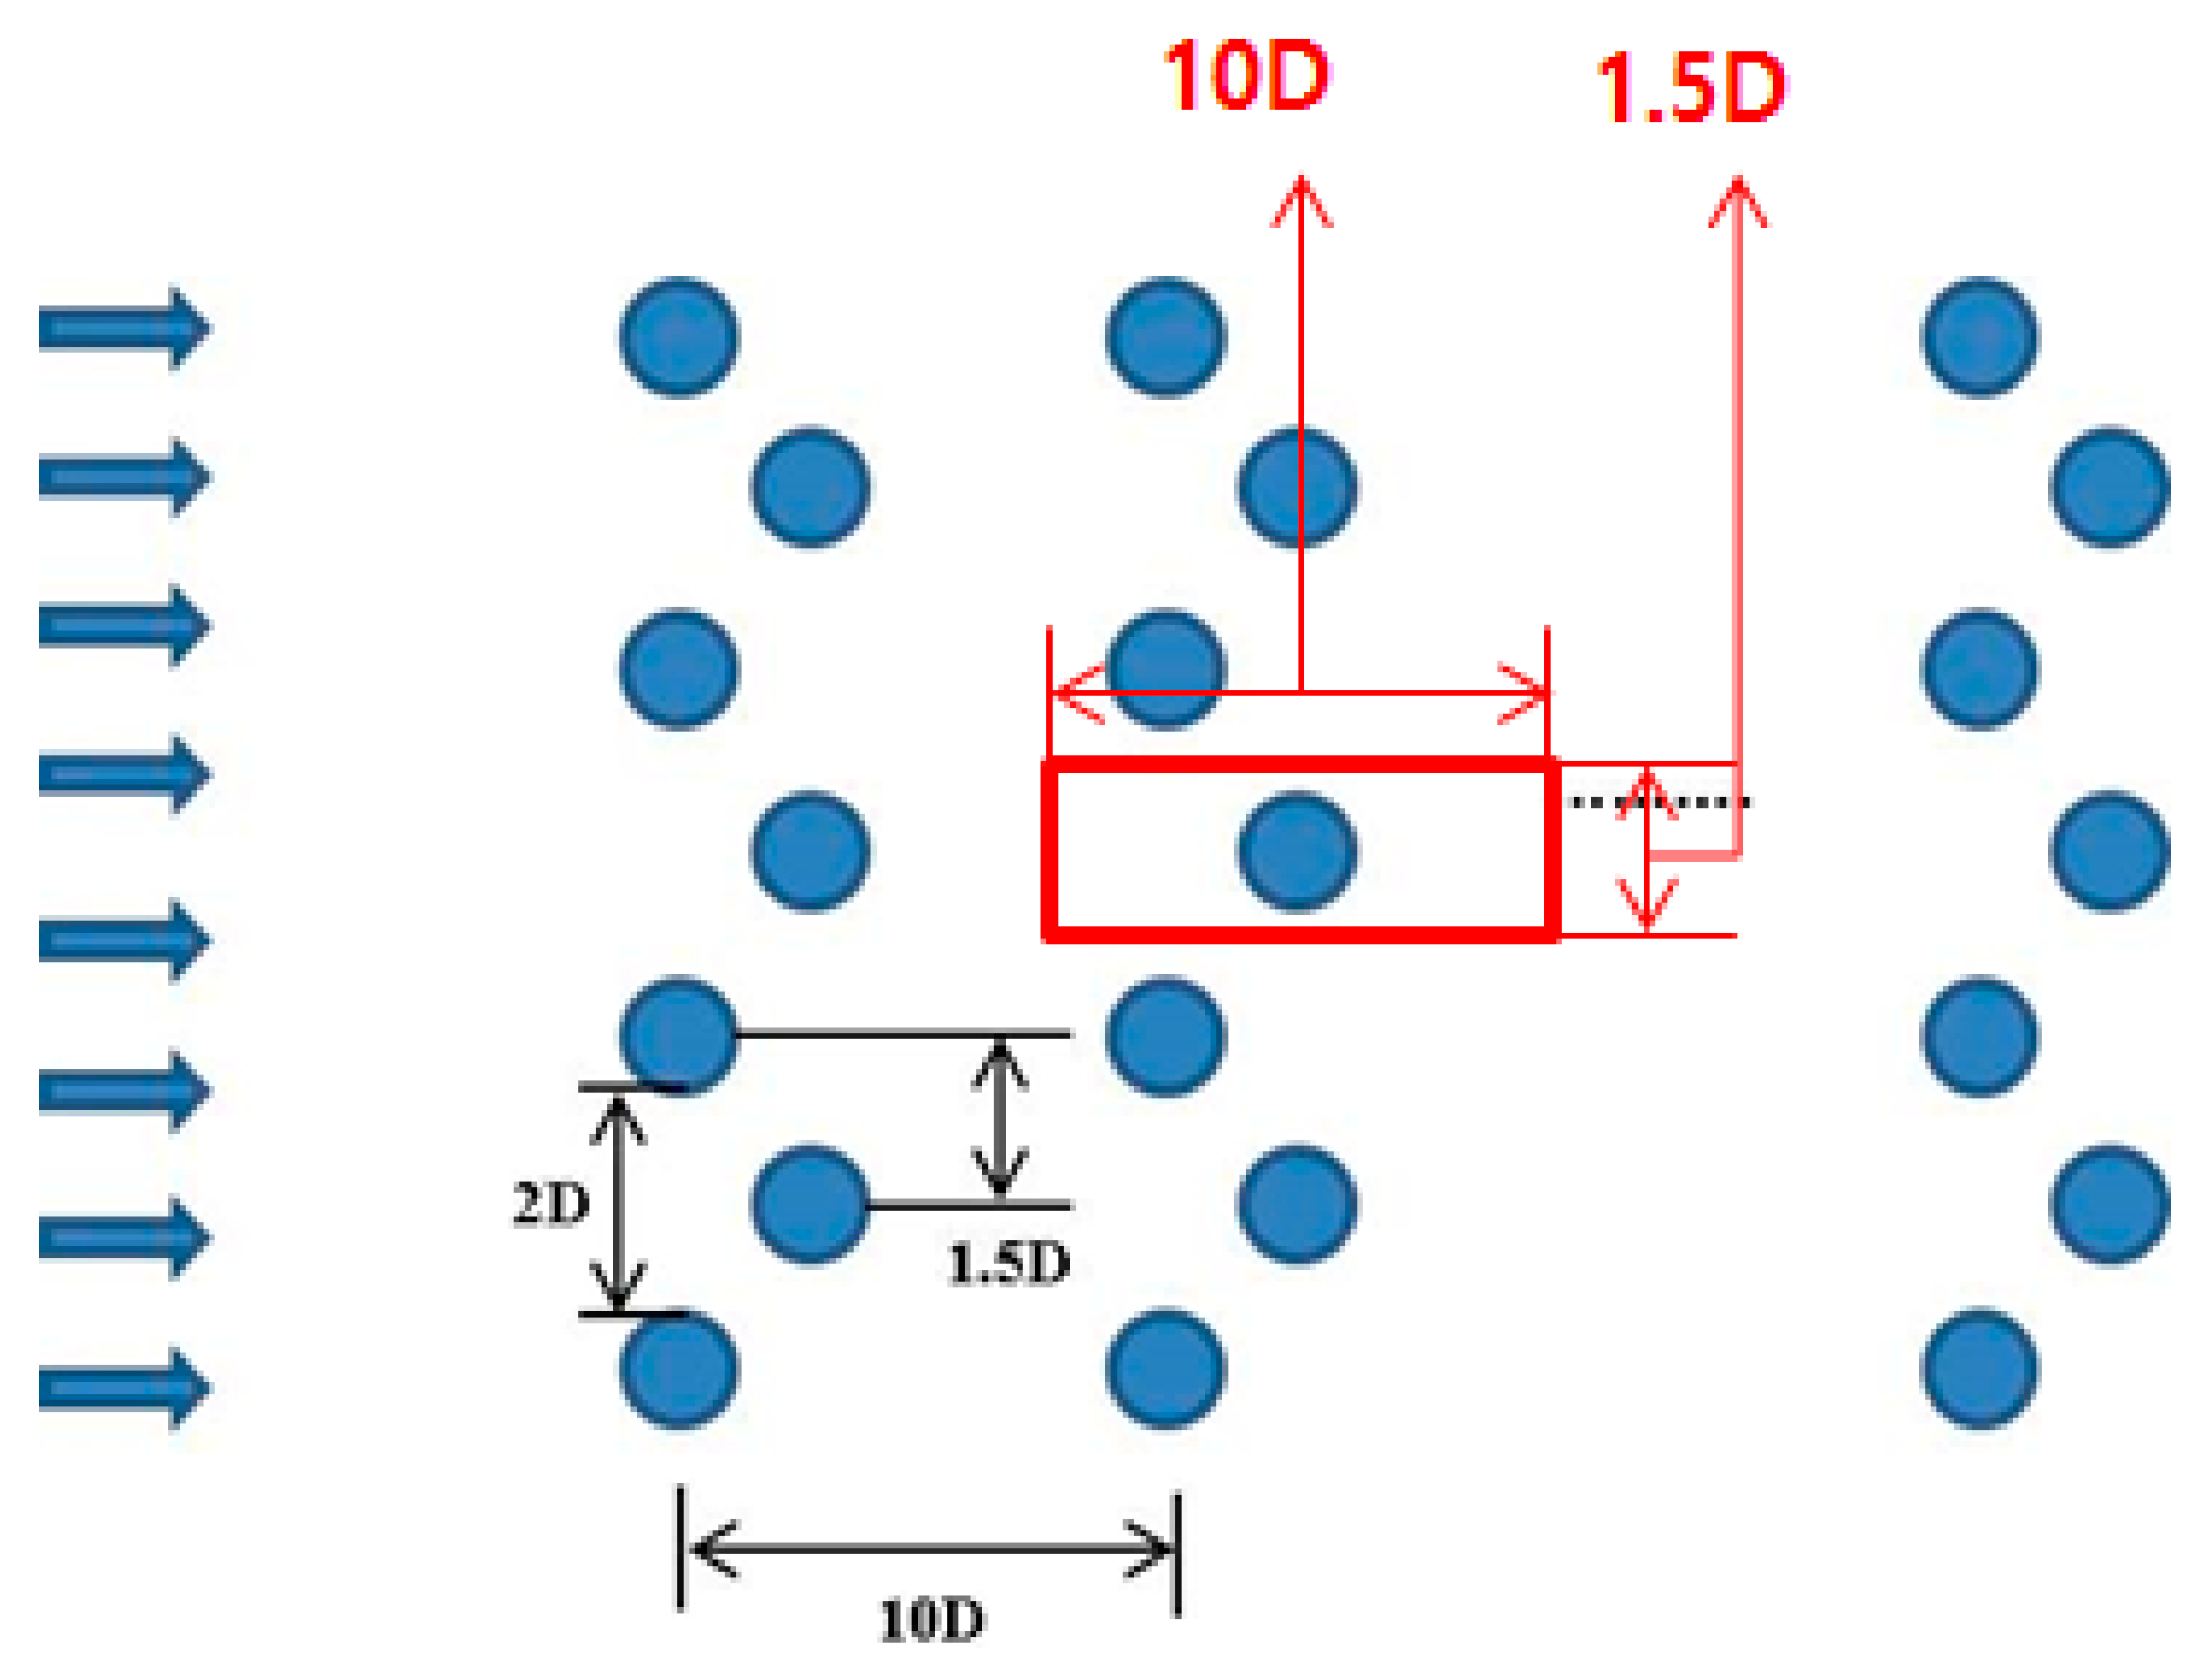
The swept area (Aswept) of a tidal turbine is used to calculate the kinetic energy passing through the turbine. When a turbine diameter is D, the swept area is given by:
The occupied area per tidal device (Aoccupied) was determined according to the recent research [25,26]. The optimum lateral space was set to 2D and downstream distance was 10D, as shown in Figure 9. Therefore, each turbine occupies 15D2 (10D∙1.5D) area.
It is assumed that the kinetic energy flux passing through a turbine is the energy potential for the occupied area of the device. Then, average power intercepted can be simplified with the function of power density as:
4.2. Evaluation Method
There are a few terms in energy potential definition, and it is installed generating capacity (IGC) and annual energy production (AEP) that have been used for renewable energy potential assessment in Korea [3]. These two definitions were used in this study to calculate tidal current potentials in order to evaluate potentials based on the same criteria with other renewable energies.
When it comes to theoretical potential, installed generating capacity is the utilizable tidal current potential in a region and can be calculated based on mean average power intercepted () and sea area of a region (A) as:
Annual energy production is the annual power generation of electricity from mean installed generating capacity and can be calculated as:
Technical potential can be evaluated, considering the efficiency of a tidal device and utilization factor. Installed generating capacity for technical potential can be calculated as:
where η is system efficiency of a tidal device.
Annual energy production for technical potential can be calculated as:
where ku is the utilization factor.
Zhou et al. summarized that the performance of the major industrialized large tidal turbines is about 40% [27]. Jeffcoate et al. conducted vessel-mounted full-scale testing of the SCHOTTEL tidal generator (STG) turbine, and the results show that the system efficiency reached 35% [28]. Therefore, in this study, efficiency of tidal device is assumed as 35% from a conservative point of view in order to not overestimate the tidal current energy potential. On the other hand, the utilization factor is set as 100% because average surface velocity is used to calculate average power intercepted.
5. Results
Table 2 shows the theoretical tidal energy potential in Korea. The mean average power intercepted was estimated as 5.6 MW/km2 and theoretical tidal current potential was calculated as installed generating capacity of 430 GW and annual energy production of 3766 TWh/y. The results show that region 1 and region 4 are promising areas for tidal current power in Korea. Region 1 has the highest tidal energy density with a large tidal range of about 10 m, and region 4 has the second highest tidal energy density with an acceleration among islands and also between the islands and the mainland.
Table 3 shows the technical tidal energy potential in Korea. The mean average power intercepted was estimated as 3.5 MW/km2, and technical tidal current potential was calculated as installed generating capacity of 109 GW and annual energy production of 957 TWh/y.
6. Discussion
Usually, the resource assessment of tidal energy is focused on the distribution of energy density. From this point of view, the power density is a convenient and useful concept because it is a function of tidal current speed. Moreover, the power generated from a tidal device at a point can be easily estimated by multiplying the power density by the turbine swept area. Therefore, many resource assessment studies used power density and described the energy distribution to show there are several areas with strong current speed. However, when a tidal device is operated at a point, it affects the flow field of the surrounding area. In this condition, energy density distribution using power density is changed. In addition, the power density is calculated by dividing the power of the turbine by the swept area of the turbine, it is not suitable for estimating the potential of a region, as pointed out in the previous chapter.
So, in this study, average power intercepted was introduced to convert power density to energy density for horizontal areas. The consideration of the optimum arrangement of tidal devices is included in average power intercepted calculation, the existence of tidal devices at a point is not affected by the energy density of the surrounding area. Moreover, because the swept area and occupied area of a turbine are proportional to the square of turbine diameter, average power intercepted is also a function of tidal current speed.
On the other hand, due to the consideration of optimum arrangement, average power intercepted can be affected by changing the arrangement. Although the same optimum arrangement is applied to the whole study area in this study, the optimum arrangement of the tidal turbine can be changed by the type and scale of the tidal device, tidal current speed, and turbulence intensity, topographies, etc. Therefore, a wide range of resource assessments, such as this study, should produce average power intercepted based on the optimal arrangement that is generally appropriate. However, in the case of local resource assessment, such as development planning or a feasibility study for a particular region, the optimum arrangement should be derived by considering the characteristics of that area.
According to the results of the resource assessment, regions 1 and 4 are promising for tidal current power in Korea. As shown in Table 2, region 1 has the highest theoretical tidal energy density of 11.2 MW/km2, with the highest tidal range up to 10 m in Korea. Although the tidal range of region 4 is about half of region 1, region 4 has the second highest theoretical tidal energy density of 6.6 MW/km2 due to the topographic advantage with many islands. Therefore, the theoretical tidal energy density of region 4 is about 59% of that of region 1. When it comes to technical potential, the tidal energy density of region 1 is decreased by 65% compared to the theoretical potential, while that of region 4 is decreased by 42%. Hence, the technical tidal energy density of region 4 is 97% of that of region 1.
As mentioned before, there are two key factors for tidal current energy potential. One is a tidal range that causes enormous movement of sea water, and another is constraining topographies, mainly formed by islands where tidal current is accelerated around and through. Since theoretical potential is the total nature energy of a region, it is mainly affected by a tidal range, which is proportional to the flow rate of the tidal current. On the contrary, since the technical potential is the extractable energy from theoretical potential, using the present technology, constraining topographies have more effect on technical potential than on theoretical potential. Therefore, when investigating the energy potential from a macroscopic perspective for a region, it is recommended to assess up to the technical potential step where both constraining topographies and tidal range are considered.
7. Conclusions
This article has provided insights into the resource assessment of tidal current energy in Korea. Resource assessment methodology was established based on average power intercepted which has been used for resource assessment of wind power. The west and south coastal region of Korea was divided into seven regions according to the administrative district, and east coastal regions were excluded due to their low tidal speed. Observational data from 1973 measuring points were used to describe the tidal current distribution. Numerical simulation of water circulation was additionally conducted to increase the spatial resolution of regions 1 and 4 where tidal current is abundant.
The results show that theoretical tidal current potential is installed generating capacity of 430 GW and annual energy production of 3766 TWh/y and technical potential is installed generating capacity of 109 GW and annual energy production of 957 TWh/y. There are many exploitable areas with a strong tidal current. Regions 1 and 4 are promising areas for tidal current power in Korea. Region 1 has the highest tidal energy density and region 4 has the second highest tidal energy density. Especially, the Incheon tidal farm project and Gyodong channel in region 1 and Uldolmok, Jangjuk channel, Geocha channel, and Maenggol in region 4 are the most promising for tidal current energy development. The procedure and methodology for resource assessment suggested in this study can provide guidelines, and the results of this research can provide insight into the tidal current energy development plan in Korea.
Author Contributions
Conceptualization, S.-J.H and C.H.J; methodology, S.-J.H and C.H.J; software, S.-J.H.; validation, C.H.J; formal analysis, S.-J.H.; Investigation, S.-J.H; resource, C.H.J.; data curation, S.-J.H; writing-original draft preparation, S.-J.H.; writing-review and editing, S.-J.H.; visualization, S.-J.H.; supervision, C.H.J.; project administration, C.H.J.; funding acquisition, C.H.J.
Funding
This work was supported by the Korea Institute of Energy Technology Evaluation and Planning(KETEP) and the Ministry of Trade, Industry & Energy(MOTIE) of the Republic of Korea (No. 20163030071850).
Conflicts of Interest
The authors declare no conflict of interest.
References
- Funke, S.W.; Farrell, P.E.; Piggott, M.D. Tidal turbine array optimisation using the adjoint approach. Renew. Energy 2014, 63, 658–673. [Google Scholar] [CrossRef]
- Jo, C.H.; Lee, K.H.; Rho, Y.H. Recent TCP (tidal current power) projects in Korea. Sci. China Technol. Sci. 2010, 53, 57–61. [Google Scholar] [CrossRef]
- Tidal Current Energy Resource Assessment Technique and Procedure Applied in Western Coastal Region. Available online: https://www.researchgate.net/publication/283162009_Tidal_Current_Energy_Resource_Assessment_Technique_and_Procedure_Applied_in_Western_Coastal_Region_South_Korea (accessed on 15 September 2019).
- Kim, G.W.; Lee, M.E.; Lee, K.S.; Park, J.S.; Jeong, W.M.; Kang, S.K.; Soh, J.G.; Kim, H.N. An overview of ocean renewable energy resources in Korea. Renew. Sustain. Energy Rev. 2012, 16, 2278–2288. [Google Scholar] [CrossRef]
- Byun, D.S.; Hart, D.E.; Jeong, W.J. Tidal current energy resources off the South and West coasts of Korea: Preliminary observation-derived estimates. Energies 2013, 6, 566–578. [Google Scholar] [CrossRef]
- Kim, G.W.; Jeong, W.M.; Lee, K.S.; Jun, K.C.; Lee, M.E. Offshore and nearshore wave energy assessment around the Korean Peninsula. Energy 2012, 36, 1460–1469. [Google Scholar] [CrossRef]
- Lewis, M.; Neill, S.P.; Robins, P.E.; Hashemi, M.R. Resource assessment for future generations of tidal-stream energy arrays. Energy 2015, 83, 403–415. [Google Scholar] [CrossRef]
- Guillou, N.; Neill, S.P.; Robins, P.E. Characterising the tidal stream power resource around France using a high-resolution harmonic database. Renew. Energy 2018, 123, 706–718. [Google Scholar] [CrossRef]
- Neill, S.P.; Vögler, A.; Goward-Brown, A.J.; Baston, S.; Lewis, M.J.; Gillibrand, P.A.; Waldman, S.; Woolf, D.K. The wave and tidal resource of Scotland. Renew. Energy 2017, 114, 3–17. [Google Scholar] [CrossRef]
- Guiberteau, K.L.; Liu, Y.; Lee, J.; Kozman, T.A. Investigation of developing wave energy technology in the Gulf of Mexico. Distrib. Gener. Altern. Energy J. 2012, 27, 36–52. [Google Scholar] [CrossRef]
- Pastor, J.; Liu, Y. Hydrokinetic Energy: Overview and it’s Renewable Energy Potential for the Gulf of Mexico. In Proceedings of the 2012 IEEE Green Technologies Conference, Tulsa, OK, USA, 19–20 April 2012; pp. 1–3. [Google Scholar]
- Melikoglu, M. Current status and future of ocean energy sources: A global review. Ocean Eng. 2018, 148, 563–573. [Google Scholar] [CrossRef]
- Korea Hydrographic and Oceanographic Agency (KHOA). Available online: http://www.khoa.go.kr/eng/ (accessed on 5 November 2019).
- Korea Hydrographic and Oceanographic Agency (KHOA). Nautical chart code KHOA-DPC103, 104, 166, 170, 171, 172, 173, 174, 175, 177, 178, 179, 204, 204A, 208, 2131, 2153, 2158, 2160, 2161, 2167, 2200, 2300, 2408, 2409, 2414, 2415, 243, 2431, 2432, 2439, 2462, 2467, 2470, 2477, 248, 2480, 2500, 252, 253, 2566, 2571, 2584, 2625, 266, 267, 2714, 2754, 2757, 2804, 3155, 305, 3521, 306, 307, 308, 3100, 311, 3111, 3112, 3113, 3114, 312, 313, 3137, 3139, 314, 315, 3183, 321, 3216, 323, 328, 331, 332, 333, 334, 335, 339, 341, 3411, 3412, 3413, 3418, 342, 3438, 3451, 3466, 3467, Nautical chart code KHOA-DPC103, 104, 166, 170, 171, 172, 173, 174, 175, 177, 178, 179, 204, 204A, 208, 2131, 2153, 2158, 2160, 2161, 2167, 2200, 2300, 2408, 2409, 2414, 2415, 243, 2431, 2432, 2439, 2462, 2467, 2470, 2477, 248, 2480, 2500, 252, 253, 2566, 2571, 2584, 2625, 266, 267, 2714, 2754, 2757, 2804, 3155, 305, 3521, 306, 307, 308, 3100, 311, 3111, 3112, 3113, 3114, 312, 313, 3137, 3139, 314, 315, 3183, 321, 3216, 323, 328, 331, 332, 333, 334, 335, 339, 341, 3411, 3412, 3413, 3418, 342, 3438, 3451, 3466, 3467, 347, 3470, 3471, 349, 3493, 3527, 353, 3531, 3550, 3562, 357, 359, 360, 3612, 3614, 3620, 3636, 3751, 3839, 6430, 732.
- Kim, J.E. Land use management and cultural value of ecosystem services in Southwestern Korean islands. J. Mar. Isl. Cult. 2013, 2, 49–55. [Google Scholar] [CrossRef]
- O’Donncha, F.; James, S.C.; Ragnoli, E. Modelling study of the effects of suspended aquaculture installations on tidal stream generation in Cobscook Bay. Renew. Energy 2017, 102, 65–76. [Google Scholar] [CrossRef]
- A Three-dimensional Environmental Fluid Dynamics Computer Code: Theoretical and Computational Aspects. Available online: https://www.semanticscholar.org/paper/A-Three-Dimensional-Environmental-Fluid-Dynamics-%3A-Hamrick/48f57bed9f5450d244e240614ea653f51e7c6a55 (accessed on 15 September 2019).
- Chan, S.N.; Thoe, W.; Lee, J.H. Real-time forecasting of Hong Kong beach water quality by 3D deterministic model. Water Res. 2013, 47, 1631–1647. [Google Scholar] [CrossRef] [PubMed]
- Mellor, G.L.; Yamada, T. Development of a turbulence closure model for geophysical fluid problems. Rev. Geophys. 1982, 20, 851–875. [Google Scholar] [CrossRef]
- Galperin, B.; Kantha, L.H.; Hassid, S.; Rosati, A. A quasi-equilibrium turbulent energy model for geophysical flows. J. Atmos. Sci. 1988, 45, 55–62. [Google Scholar] [CrossRef]
- Smagorinsky, J. General circulation experiments with the primitive equations: I. The basic experiment. Mon. Weather Rev. 1963, 91, 99–164. [Google Scholar] [CrossRef]
- Polagye, B.; Thomson, J. Tidal energy resource characterization: Methodology and field study in Admiralty Inlet, Puget Sound, WA (USA). Proc. Inst. Mech. Eng. Part A J. Power Energy 2013, 227, 352–367. [Google Scholar] [CrossRef]
- Abu-Bakar, A.; Ahmadian, R.; Falconer, R.A. Modelling the transport and decay processes of microbial tracers in a macro-tidal estuary. Water Res. 2017, 123, 802–824. [Google Scholar] [CrossRef]
- Elliott, D.L.; Wendell, L.L.; Gower, G.L. An Assessment of the Available Windy Land Area and Wind Energy Potential in the Contiguous United States (No. PNL-7789); Pacific Northwest Lab.: Richland, WA, USA, 1991. [Google Scholar]
- Myers, L.E.; Keogh, B.; Bahaj, A.S. Layout Optimization of 1st-Generation Tidal Energy Arrays. In Proceedings of the EWTEC 2011, Southampton, UK, 5–9 September 2011. [Google Scholar]
- Mycek, P.; Gaurier, B.; Germain, G.; Pinon, G.; Rivoalen, E. Experimental study of the turbulence intensity effect on marine current turbine behaviour. Part 1: One single turbine. Renew. Energy 2014, 66, 729–746. [Google Scholar] [CrossRef]
- Zhou, Z.; Benbouzid, M.; Charpentier, J.F.; Scuiller, F.; Tang, T. Developments in large marine current turbine technologies–A review. Renew. Sustain. Energy Rev. 2017, 71, 852–858. [Google Scholar] [CrossRef]
- Jeffcoate, P.; Starzmann, R.; Elsaesser, B.; Scholl, S.; Bischoff, S. Field measurements of a full scale tidal turbine. Int. J. Mar. Energy 2015, 12, 3–20. [Google Scholar] [CrossRef] [Green Version]
Figure 1.
Bathymetric chart of Korea.

Figure 2.
Division of the west and south coastal area of Korea.

Figure 3.
Tidal current speed distribution around Korea based on observational data.

Figure 4.
Computational grids for region 1.

Figure 5.
Computational grids for region 4.

Figure 6.
Flow chart of the environmental fluid dynamics code (EFDC) hydrodynamic model.

Figure 7.
Average surface velocity distribution of region 1.

Figure 8.
Average surface velocity distribution of region 4.

Figure 9.
Occupied area per tidal current device.


Table 1.
Territorial sea area of each region.
| Region | Administrative District | Area (km2) |
|---|---|---|
| Region 1 | Incheon-Gyeonggi | 15,008 |
| Region 2 | Chungcheongnam-do | 8811 |
| Region 3 | Jeollabuk-do | 4344 |
| Region 4 | Jeollanam-do | 28,266 |
| Region 5 | Jeju-do | 11,220 |
| Region 6 | Gyeongsangnam-do | 7415 |
| Region 7 | Busan | 2171 |
| Total | 77,219 |
Table 2.
Theoretical tidal energy potential in Korea.
| Region | Mean Average Power Intercepted (MW/km2) | Area (km2) | Installed Generating Capacity (GW) | Annual Energy Production (TWh/y) |
|---|---|---|---|---|
| Region 1 | 11.2 | 15,008 | 167.5 | 1467.6 |
| Region 2 | 3.6 | 8811 | 31.3 | 273.9 |
| Region 3 | 3.1 | 4344 | 12.9 | 112.7 |
| Region 4 | 6.6 | 28,266 | 185.4 | 1624.0 |
| Region 5 | 2.2 | 11,220 | 24.2 | 212.1 |
| Region 6 | 0.8 | 7415 | 5.8 | 51.1 |
| Region 7 | 1.3 | 2171 | 2.8 | 24.5 |
| Korea | 5.6 | 77,219 | 430 | 3766 |
Table 3.
Technical tidal energy potential in Korea.
| Region | Mean Average Power Intercepted (MW/km2) | Area (km2) | Installed Generating Capacity (GW) | Annual Energy Production (TWh/y) |
|---|---|---|---|---|
| Region 1 | 3.9 | 12,328 | 48.6 | 425.7 |
| Region 2 | 2.0 | 3241 | 6.4 | 56.3 |
| Region 3 | 1.5 | 1445 | 2.2 | 19.3 |
| Region 4 | 3.8 | 12,918 | 49.4 | 432.5 |
| Region 5 | 1.9 | 1239 | 2.4 | 21.4 |
| Region 6 | 1.7 | 116 | 0.2 | 1.6 |
| Region 7 | 4.2 | 24 | 0.1 | 0.5 |
| Korea | 3.5 | 31,312 | 109 | 957 |
© 2019 by the authors. Licensee MDPI, Basel, Switzerland. This article is an open access article distributed under the terms and conditions of the Creative Commons Attribution (CC BY) license (http://creativecommons.org/licenses/by/4.0/).
Share and Cite
MDPI and ACS Style
Hwang, S.-j.; Jo, C.H. Tidal Current Energy Resource Distribution in Korea. Energies 2019, 12, 4380. https://doi.org/10.3390/en12224380
AMA Style
Hwang S-j, Jo CH. Tidal Current Energy Resource Distribution in Korea. Energies. 2019; 12(22):4380. https://doi.org/10.3390/en12224380
Chicago/Turabian StyleHwang, Su-jin, and Chul H. Jo. 2019. "Tidal Current Energy Resource Distribution in Korea" Energies 12, no. 22: 4380. https://doi.org/10.3390/en12224380
Note that from the first issue of 2016, this journal uses article numbers instead of page numbers. See further details here.