Article

Conceptualization of CO2 Terminal for Offshore CCS Using System Engineering Process

1
Offshore Industries R&BD Center, Korea Research Institute of Ships & Ocean Engineering, Geoje 53201, Korea
2
Ocean Science & Technology School, Korea Maritime and Ocean University, Busan 49112, Korea
3
Global Cooperation Center, Korea Research Institute of Ships & Ocean Engineering, Daejeon 34103, Korea
*
Author to whom correspondence should be addressed.
Energies 2019, 12(22), 4350; https://doi.org/10.3390/en12224350
Submission received: 14 August 2019 / Revised: 16 October 2019 / Accepted: 11 November 2019 / Published: 15 November 2019
(This article belongs to the Special Issue Carbon Capture, Storage and Utilization)

Abstract

:
In this study, the basic configuration and operation concept of a CO2 terminal were identified by conducting a system engineering process. The performance goal of a CO2 terminal was determined by requirement analysis. Then, functions and timelines were derived by functional analysis to meet the performance goal. Equipment to perform the functions were defined and finally, a process flow block diagram of the CO2 terminal was acquired. The CO2 terminal in this study consisted of three parts. First, the CO2 loading/unloading part is responsible for liquid CO2 unloading from the carrier and loading vapor CO2 onto the carrier. Secondly, the liquid CO2 transmission part extracts liquid CO2 from the storage tanks and increases the pressure until it satisfies the offshore pipeline transportation condition. The vapor-treatment part collects boil-off gas, generates vapor CO2, and charges the storage tanks with vapor CO2 to control the pressure of the storage tanks that discharge liquid CO2. Finally, the study results were compared with a liquefied natural gas (LNG) terminal. The biggest difference between the CO2 terminal in this study and the LNG terminal is that a vaporizer is essential in the CO2 terminal due to the smaller storage capacity of the CO2 terminal and, therefore, the lower amount of boil-off gas.

Graphical Abstract

1. Introduction

Many efforts are underway worldwide to reduce atmospheric emissions of carbon dioxide (CO2), which is a dominant cause of global warming. To limit the global temperature increase to below 2 °C, the annual amount of greenhouse gas emissions should be less than approximately 14 Gt CO2 by 2050, which is about a 60% reduction compared with the current level [1]. Countries that have a manufacturing-oriented industrial structure or rely heavily on electricity production from fossil fuels may struggle to quickly switch to a low-carbon emission structure using renewable energy. Carbon capture and storage (CCS) can be an attractive greenhouse gas reduction option for these countries [2]. CCS basically consists of three parts: (1) separating and capturing CO2 from a large-scale emitter such as a power plant; (2) transporting CO2 through pipelines or carriers from capture stations to storage sites; and (3) injecting and storing CO2 into geological formations [3]. Many studies have focused on the capture and storage aspects, but few have focused on transportation [4,5]. However, interest is growing in the transportation aspect as it has been shown to be responsible for a high proportion of the costs in CCS projects [6].
Between pipelines and carriers, which are the two most common methods of CO2 transportation, pipelines have been the most widely used [5]. When transporting CO2 to a pipe, a variable CO2 transportation network is required for the flexible operation of the CCS chain, which is technically challenging [7,8]. Considering the flexibility of CO2 carriers, however, the significance of carriers is likely to increase in the near future [9,10,11,12,13]. A CO2 terminal is required when multiple sources and storage sinks are linked or when pipelines and carriers are linked in the CCS transportation chain [14,15,16,17]. In the future, once CCS is widely distributed as a CO2 emission reduction option, the likelihood of CCS projects using multiple sources and storage sites will be high [11]. This means that CO2 terminals will become important facilities within the whole CCS chain that can simultaneously contribute to the realization of CO2 carriers as a rational CO2 transportation option.
Unfortunately, research regarding the configuration, functions, and roles of CO2 terminals has been limited. Only a few studies [15,18,19,20,21,22,23] addressed CO2 terminals. It is worth mentioning the Norwegian full-scale CCS project named the Northern light project [20,22,24], which includes the concept of CO2 terminal. The terminal is located onshore and has a role of receiving and temporary storing of CO2 transported by a carrier. It is equipped with a vaporizer to maintain vapor and liquid CO2 balance during injection [24]. Vermeulen [15] suggested a CO2 liquid logistics shipping concept for a complex CCS chain connecting multiple CO2 emitters and storage sites. This concept uses complex CO2 terminals that can receive large amounts of CO2 through pipeline networks and barges from various emitters and can send CO2 out to multiple storage sites using carriers and pipelines. However, no study has defined an overall configuration of the terminal and its operational concept. Lee et al. [21] simulated a CO2 process flow in an intermediate storage facility attached to a capture site on the coast for loading CO2 to a carrier. The storage facility in their study consisted of a CO2 input process, a storage tank, a loading process, a recirculation process, and a boil-off gas (BOG) reliquefaction process. However, they did not clearly explain how they chose the components for the CO2 terminal. In a few studies about CO2 carrier transportation, CO2 terminals are considered part of the description of the CCS chain, but the research did not focus on CO2 terminals [18,19,25,26,27]. Several studies [28,29,30,31] focused on the direct injection of CO2 into geological formations from carriers did not consider the CO2 terminal. As such, the configuration of a CO2 terminal, reflecting its functions and roles, has rarely been studied. Conversely, considerable research has been conducted on liquefied natural gas (LNG) terminals [32,33,34,35,36,37,38,39,40,41,42,43], which can be thought of as similar to CO2 terminals. LNG terminals can be used in developing CO2 terminals, but a cautious approach is required as the transport characteristics of CO2 and LNG differ.
Designing a simple system or a precedent system without systematic design processes is possible. However, for a complex system or an unprecedented system like a CO2 terminal, it is highly recommended to follow a system engineering process (SEP), as shown in Figure 1.
The SEP consists of (1) requirements analysis, which transforms the stakeholder’s system needs into functional requirements from an engineering point of view; (2) functional analysis and allocation, which defines what functions are to be performed; and (3) design synthesis, which determines how these functions are combined into the design [44]. The SEP is completed when this series of processes is conducted. The strength of SEP during the concept development stage is that necessary functions are reflected, whereas unnecessary functions are removed in advance.
In this study, the conceptual design of a CO2 terminal was structurally and systematically developed using the SEP. Our conceptual design focuses on the configuration and basic operation concept of a CO2 terminal. In the requirement analysis (Figure 1), a CCS chain was analyzed to derive the goal and performance objectives of a CO2 terminal. For requirement analysis, specific conditions of the CCS demonstration project promoted in Korea were applied. Then, the functions were derived to meet the goal and performance objectives of the CO2 terminal using functional analyses. Several functional analyses were conducted to define the top-level functions and their basic operational concepts. Design synthesis was performed to determine the equipment that corresponds to each function. Based on the SEP, a process flow block diagram of the CO2 terminal was finally suggested that explicitly depicts the configuration of the CO2 terminal.

2. Description of CCS Chain

CO2 terminals have various forms depending on the connection methods between capture and storage sites [15]. Since the objective of this study was to demonstrate the basic configuration and operation concept of a CO2 terminal, a relatively simple form of a CCS chain was selected as a target system (Figure 2a). The concept of a CCS chain displayed in Figure 2 is identical to the 1-million-ton-scale demonstration project in Korea. This CCS chain liquefies captured CO2 at a thermal power plant located on the coast, and transports liquid CO2 (LCO2) to a CO2 terminal through CO2 carriers. CO2 is transmitted to an offshore platform through an offshore pipeline and injected into offshore geological formations.
The CCS chain can be expressed as a functional flow block diagram, as depicted in Figure 2b. Since we focused on the CO2 terminal, we omitted the explanation of a functional flow block diagram of the whole CCS chain. Contrary to other CCS chain descriptions, the return of CO2 carriers is included to consider the vaporized CO2 (VCO2) in returning carriers.
The specific conditions of the CCS project in Figure 2 are as follows. The annual transport amount is 1 million tons of CO2. The distance from the capture source to the CO2 terminal is 580 km. The temperature and pressure of CO2 are to be maintained at −27 °C and 16 bar, respectively, during the CO2 carrier and CO2 terminal operation. The CO2 in the terminal is to be pressurized and heated for offshore pipeline transportation.

3. System Engineering Process

In this study, the SEP in Figure 1 was followed to identify the basic configuration and operation concept of the CO2 terminal. System engineering is a useful method for designing new systems that are complex or did not exist previously. Figure 1 depicts the system engineering process presented by the U.S. Department of Defense, which is widely used in many fields [44]. The system engineering process involves requirement analysis, functional analysis and design synthesis, as shown in Figure 1. Requirement analysis, functional analysis and allocation, and design synthesis are iterative and mutually complementary [18]. A system analysis and control were performed to balance this series of procedures. A more detailed explanation of each procedure is provided below.

3.1. Requirement Analysis

Requirements analysis is the first step in the system engineering process, in which the system requirements definition process converts the stakeholder representation into a technical representation of the product. The requirement analysis can transforms the project’s needs into engineering language, which consequently enables the system designer to conduct the design concept [45]. During requirement analysis, the CCS chain is analyzed to derive the performance requirement of the CO2 terminal.

3.2. Functional Analysis

After identifying the system requirements, functional analysis is performed to define the logical architecture that can satisfy the identified requirements. Functional analysis is the step of defining the basic functions that the system should perform. This analysis focuses on “what” must be performed, not “how” functions will be performed. Notably, this analysis is function-oriented rather than equipment-oriented. In functional analysis, three functional analysis tools are used: a functional flow block diagram (FFBD), integration definition for function modeling (IDEF0), and timeline analysis (TLA). Through FFBD, the functional flow of the whole CCS transport chain is determined. The sequence and relationships between the functions of the CO2 terminal are defined by IDEF0. To consider the time durations of functions, TLA is used. The results of TLA support the operation concept of the CO2 terminal.

3.2.1. Functional Flow Block Diagram (FFBD)

FFBD is graphical tool used to show the sequence of all functions that the system should perform. FFBD focuses the sequence of each function, not the time required or the flow of time between functions [8]. In FFBD, each function represented by a block is identified in terms of inputs and outputs [45]. Each block can be expanded to a series of sub-functions. A function is represented by a rectangular block with the title of the function. The title of the function is composed of an action verb followed by a noun. Some functions may be performed in parallel when necessary.

3.2.2. Integration Definition for Function Modeling (IDEF0)

The IDEF0 diagram integrates the inputs, control, outputs, and mechanisms of functions. IEDF0 allows us to understand the correlation between functions derived from FFBD. In IDEF0, the block represents the function to be performed, and the left and right arrows show the input and output of the process, respectively. The up and down arrows indicate the controls and the mechanism of the function, respectively (Figure 3).

3.2.3. Timeline Analysis (TLA)

Although the FFBD and IDEF0 represent the logical sequence of functions, they cannot show the time duration of or between functions. TLA is a method for identifying specific time-related design or operating requirements, useful for reflecting the durations of time-critical functions, such as reaction time, turnaround time, time limits, etc., and to clarify time-related design constraints. TLA complements FFBD or IDEF0 [46].

3.3. Design Synthesis

Physical equipment that performs the functions of the system is specified in the final stage of the design synthesis. In this study, the requirement allocation sheet (RAS) was used for the design synthesis. In the RAS, the configuration or equipment that will perform the functions are derived by connecting the functions with the allocated performance and the physical system. Usually the functions are listed in the left column in the RAS, the performance or requirements that each function should meet are listed in the middle column, and the corresponding equipment that can perform each function is listed in the right column [47]. This methodology clearly indicates the interrelationships between the main equipment and minimizes the risk of missing key design variables.

4. Results

4.1. CO2 Carrier and CO2 Terminal Requirements

To derive the performance requirements of the CO2 terminal, we clearly defined the logistics concept, including carrier size, number of the carriers, carrier transportation cycle, etc., using the CCS chain conditions of the Korean project described in Section 2. This CCS chain aims to store 1 million tons of CO2 annually, which can be converted into a daily transport rate of 2740 tons/day.

4.1.1. Time for Carrier Round Trip and the Availability of Transport

The distance from the capture site to the CO2 terminal is about 580 km, and the carrier speed is usually about 14 knots. In other words, one day is required for one-way transportation. An additional day is required for berthing, purging the pipeline, and loading/unloading CO2 at the capture site and the CO2 terminal each. Therefore, a total of four days is required for one carrier to complete a round trip between the capture site and the CO2 terminal, including loading and unloading of LCO2. The availability of transport is assumed to be less than 80% considering the possibility of bad weather conditions.

4.1.2. Number of Carriers

In general, large carriers have lower capital expenditure (CAPEX) and operating expenditure (OPEX) per cargo volume than smaller carriers. Therefore, operating a small number of carriers is cost effective. In other words, the cost of one carrier is inexpensive comparing the cost of two half-sized carriers. A more detailed comparison of costs between one and two carriers is explained in Section 5.3.
When operating only one carrier, if an unexpected failure of the carrier occurs, the entire CCS chain will be stopped, making the continuous injection of CO2 difficult. Intermittent injection of CO2 lowers the CO2 injection capacity, reducing the efficiency of the entire CCS chain [48,49]. On the other hand, if two carriers are operated, one will be able to operate even if the other stops due to an unforeseen failure. Therefore, the entire CCS chain can be operated with a reduced injection rate while avoiding injection interruption, even if it is not able to satisfy the target storage amount of 1 million tons/year. Thus, this study determined the number of carriers as two even though it is inexpensive to operate one carrier. In the case of this study, even if one carrier fails to operate, it will be able to transport 75% of the normal transport rate if the maximum availability of the other carrier is maintained during the repair period.

4.1.3. Size of Carrier

With two carriers, four days of shipping time, and less than 80% shipping availability, the minimum amount of LCO2 carried by single transportation can be derived as follows:
1 × 10⁶ tons/(365 days × 80%/4 days)/2 carriers ≈ 6849 tons/carrier.
A total of 2.5 days are required to capture 6849 tons of LCO2 considering a capture rate of 2740 tons/day. However, the CCS transport chain can be both safe and simple if one carrier transports 3 days’ worth of captured CO2 at one time. Therefore, one carrier transports 8220 tons (2740 tons × 3 days) of LCO2. In this case, the availability is about 66%. Since one carrier transports 3 days’ worth of captured CO2, the carrier arrival cycle in the CO2 terminal is also 3 days.
The same volume of VCO2 must be loaded into the carrier’s cargo tank when unloading LCO2 from the carrier to the CO2 terminal. The carrier’s cargo tank is displaced by the VCO2 of the storage tanks at the terminal, while LCO2 fills the storage tanks. There are two reasons for loading VCO2 into the carrier’s cargo tank. The first is to allow the pressure and temperature of the cargo tank to be controlled during the unloading process. Constant pressure and temperature facilitate the process. The second reason is to prevent the rapid decrease in temperature due to Joule–Thomson cooling. This rapid decrease in temperature could lead to material damage [50]. The VCO2 and LCO2 density ratio is about 0.041 under conditions of −27 °C and 16 bar. Therefore, 337 tons of VCO2, which correspond to 4.1% of the 8220 tons of LCO2, is returned to the capture site. For the net transport amount of CO2 to be 8220 tons per carrier, this amount of CO2 should be additionally carried from the capture site. The total transport rate is, therefore, 8557 tons per carrier. Considering the BOG in the cargo tanks during the ship transportation, the cargo tanks should be approximately 95% filled and then, the total size of the CO2 cargo tanks would be increased to be ~9000 tons. In conclusion, two 9000-ton carriers that transport 8857 tons of LCO2 over four days in one shipment are needed in our CCS chain and two unloadings of CO2 in six days would be completed in the CO2 terminal.

4.1.4. Size and Number of Storage Tank in Terminal

Since the maximum capacity of a pressurized CO2 storage tank is 5000 tons, the size of the CO2 storage tanks in the CO2 terminal can be easily determined to be half the size of a carrier, 4500 tons. Two empty tanks should be ready before unloading the LCO2. The CO2 terminal should maintain an appropriate amount of buffer CO2 to operate smoothly, although the CO2 supplied by the carrier may be halted for at least 60 h due to typhoons or other events and conditions. The 60-h buffer corresponds to 6850 tons of CO2. At this stage, four CO2 storage tanks are required. The number of storage tanks will be checked again using TLA to determine if four tanks are sufficient for buffering CO2 in the next section. These requirements will be checked through functional analysis and allocation and design synthesis in the SEP in the following sections.

4.1.5. The Estimation of the Amount of BOG in the CO2 Storage Tank at Terminal

To maintain the pressure in the storage tank that emits LCO2 to the pipeline at the CO2 terminal, it is necessary to inject the same volume of VCO2 as the LCO2 is emitted. Since CO2 is stored at a low temperature in the storage tanks, the generation of BOG is inevitable. And in the CO2 terminal design, it is very important to compare the required VCO2 and BOG quantities. In other words, if the amount of BOG generated is less than the required VCO2, a vaporizer is needed, and if it is large, a reliquefier must be installed. Since this study focuses on the concept design of the CO2 terminal, BOG is simply estimated by assuming that the storage tanks are a thin-walled spherical tank of metal covered with a thick insulation layer on the outside as shown in Figure 4. The BOG generated in the storage tanks at the CO2 terminal was determined by assuming that all external heat ingress is converted into latent heat of vaporization of CO2, as shown in the equation below:
m ˙ = q h f g ,
where q is heat ingress from the surrounding atmosphere, m ˙ is vaporized mass of CO2, and hfg is latent heat of vaporization of CO2. Heat ingress is defined as the difference between the ambient air temperature and the temperature of CO2 in the tank divided by the sum of the thermal resistances [51], as shown in Equation (3):
q = T , 2 T , 1 R t o t ,
where T∞,1 and T∞,2 represent the temperature of CO2 in the storage tank and ambient air temperature, respectively. The ambient air temperature, T∞,2 is assumed to be 35 °C, which is the highest temperature in summer in Korea. Rtot is the total thermal resistance and consists of the conduction resistances and the convection resistance. The detailed equations are as follows:
R t o t = R c o n d ,   1 + R c o n d ,   2 + R c o n v
R c o n d ,   1 = 1 4 π k 1 ( 1 r 1 1 r 2 )
R c o n d ,   2 = 1 4 π k 2 ( 1 r 2 1 r 3 )
R c o n v = 1 h 4 π r 3 2
where Rcond,1 and Rcond,2 are the conduction resistances in the thin-walled spherical metallic tank whose material is SA537-cl2 and in the insulation layer, respectively. k1 and k2 are the thermal conductivities of SA537-cl2 and insulation material of perlite, whose values are 52 and 0.047 W/mK, respectively. r1, r2, and r3 are inner radius of thin-walled spherical tank, outer radius of thin-walled spherical tank, and radius of insulation outer surface, respectively. The inner radius of the spherical tank, r1, was calculated as 10.24 m to allow the spherical tank to have a volume of 4500 m3. The thickness was calculated to have a range of 39.9 to 44.4 mm by using the American Society of Mechanical Engineers (ASME) Boiler and Pressure Vessel Code Section VIII Division 2 [52]. This study assumes that the thickness of the thin-walled spherical tank is constant to 40 mm and the insulation material layer has a thickness of 0.2 m. Rconv is the convection resistance in the outer surface of tank and h is a heat transfer coefficient which is assumed as 20 W/m2K. From Equations (5)–(7), Rcond,1, Rcond,2, and Rconv were calculated as 5.05 × 10⁻⁷, 2.73 × 10⁻³, and 3.16 × 10⁻⁵ K/W, respectively. Since both Rcond,1 and Rconv are much smaller than Rcond,2, Rtot is almost the same as Rcond,2, where Rtot calculated by Equation (4) is 2.77 × 10⁻³ K/W.
The amount of BOG calculated by Equation (2) is 241 kg/h. Since the number of tanks in the CO2 terminal is 4, the total BOG is 965 kg/h. The amount of VCO2 required is 4.1% of the emitted CO2, which corresponds to 4680 kg/h. Since the amount of BOG in the storage tanks is about 20% of the required VCO2, a vaporizer is needed to fully obtain the required VCO2 [24]. It is noted that BOG generated per day a tank is 6.65 tons/day, which corresponds to about 0.16% of the CO2 storage capacity. It is also noted that the stratification phenomena inside of the CO2 tank [53] could increase the BOG generation, but the amount of BOG generated would be still smaller than the required amount.

4.2. Functional Analysis of the CO2 Terminal

4.2.1. FFBD of CO2 Transport Chain

To derive the basic functions of the CO2 terminal, a functional flow block diagram was used. Since the basic functions should be connected with the entire CCS chain, the three CO2-terminal-related functions—‘6.0 Unload LCO2 to CO2 terminal’, ‘7.0 Store LCO2 intermediately’, and ‘8.0 Pressurize’ (Figure 2b)—were set as the higher-level functions.
For the higher-level function of ‘6.0 Unload LCO2 to CO2 terminal’, the lower-level functions of ‘6.1 Unload LCO2’ and ‘6.2 Load VCO2’ are developed. The function ‘6.2 Load VCO2’ involves loading the VCO2 into the CO2 cargo tank on the carrier to prevent the rapid pressure decrease of cargo tanks on the carrier caused by unloading LCO2 from the carrier.
To achieve the function of ‘7.0 Store LCO2 intermediately’, LCO2 should be stored in the CO2 storage tank after unloading LCO2 from the carrier at adequate temperature and pressure, and then be transmitted for offshore pipeline transport. Therefore, ‘7.1 Receive LCO2’, ‘7.2 Store LCO2’, and ‘7.3 Transmit LCO2’ functions can be derived as lower-level functions. VCO2, which will be loaded onto the carrier, is supplied from the CO2 terminal, so the function of ‘7.4 Generate VCO2’ can also be derived. The temperature and pressure of LCO2 extracted from the storage tanks needs to be increased to meet the appropriate conditions for injection before transmission through the offshore pipeline. Therefore, the function of ‘8.1 Increase LCO2 T & P’ is included as the lower-level function of ‘8.0 Pressurize’. To summarize, seven basic functions are defined for the CO2 terminal: ‘6.1 Unload LCO2’, ‘6.2 Load VCO2’, ‘7.1 Receive LCO2’, ‘7.2 Store LCO2’, ‘7.3 Transmit LCO2’, ‘7.4 Generate VCO2’, and ‘8.1 Increase LCO2 T & P’, indicated by the blue region in Figure 5.

4.2.2. Integration Definition for Function Modeling (IDEF0) of CO2 Terminal

Through IDEF0, input and output between functions can be explicitly diagrammed. IDEF0 clearly demonstrates the correlations between the functions to be performed. These IDEF0 relationships are represented in Figure 6.
As the input of the system is LCO2 moved by a carrier, the function ‘6.1 Unload LCO2’ is the first function among the seven functions. When the carrier and the CO2 terminal are connected, LCO2 is unloaded from the carrier. The function ‘7.1 Receive LCO2’ is receiving the unloaded LCO2 at the CO2 terminal. Therefore, the output of function 6.1 is ‘Unloaded LCO2’, which becomes the input of function 7.1. Once LCO2 is received, LCO2 should be retained until transmitted to the offshore pipeline, and this function corresponds to function ‘7.2 Store LCO2’. To store the received LCO2 in storage tanks, the temperature and pressure of LCO2 should be maintained constantly until LCO2 is transmitted. In this study, we assumed that the temperature and pressure of LCO2 are controlled by extraction of BOG. Therefore, the outputs of the function ‘7.2 Store LCO2’ are ‘Stored LCO2’ and ‘Removed VCO2’.
After, the function ‘7.3 Transmit LCO2’ is completed, which is the transmission of the LCO2 from the storage tanks to offshore pipeline transportation and then the input of function 7.3 is ‘Stored LCO2’. When LCO2 is transmitted from the CO2 storage tanks, the pressure in the CO2 storage tanks decreases. To prevent this decrease in pressure, VCO2 should be supplied to the storage tanks and this function corresponds to ‘7.4 Generate VCO2’. To minimize the wasted CO2, we assumed that input of function 7.4 is the above-mentioned BOG. However, this might not provide a sufficient amount of VCO2. Therefore, we also assumed that the small amount of LCO2 transmitted from the CO2 storage tanks is the second input of function 7.4 and this LCO2 should be vaporized to meet the required VCO2 supply. Once LCO2 transmission is finished, the CO2 storage tank is again ready to receive the LCO2 that is transported by the next carrier.
When conducting ‘7.1 Receive LCO2’, the VCO2 filled in the CO2 storage tanks should be removed to receive LCO2. We assumed that the VCO2 in the CO2 storage tank is loaded into the carrier cargo for the safe return of the carrier to the capture site for the next LCO2 transport. This function corresponds to ‘6.2 Load VCO2’.
Most of the LCO2 transmitted from the CO2 storage tank is transported via offshore pipelines for injection. Before offshore pipeline transport, the temperature and pressure of LCO2 should be increased appropriately and this function corresponds to ‘8.1 Increase LCO2 T & P’. Then, the output of function 8.1, ‘The temperature and pressure increased LCO2’, becomes the input of function ‘9.0 Transport LCO2 through offshore pipeline’.

4.2.3. Timeline Analysis (TLA) of the CO2 Storage Tank Operation

For this study’s CO2 terminal, the CO2 is supplied by a CO2 carrier and then transmitted to an offshore pipeline. The CO2 terminal should have enough buffer CO2 to manage CO2 supply interruption. The transmission of CO2 from the CO2 terminal to the offshore pipeline is continuous, whereas the supply of CO2 from a carrier is intermittent. The amount of buffer CO2 should be balanced by both the continuous transmission and the intermittent supply of CO2; therefore, the simple calculation cannot assure the smooth operation of the CO2 terminal without any logistics problems. In this study, TLA, which was explained in Section 3, was used to verify the CO2 logistics supply concept, transmission and buffer amounts, and to determine the storage time of LCO2 and VCO2 per storage tank. In TLA, it is assumed that concurrent filling and transmitting of CO2 in the same tank is forbidden for operational safety reasons.
Figure 7 shows the TLA results. In Figure 7, each cell on the x-axis represents four hours, and the y-axis represents the seven functions derived in Section 4.1. The activating time of each function is specified by filling the correspondent time square in Figure 7. On the y-axis below the functions, rows are additionally inserted to show each LCO2 storage tank state and the arrows represent the transmission of CO2 to the pipeline. Each carrier shipping CO2 is distinguished by filling the time squares with green and blue colors. The yellow represents the initially filled CO2.
In our TLA, we assumed that the CO2 unloading work is conducted for four hours starting from 12:00 every three days. The normal operating period is days 1 to 12. As shown in Figure 7, the seven functions are performed successfully. In a normal operating period, immediately before and after unloading the LCO2, the lowest and highest amounts of buffer CO2 are 7130 and 15,212 tons, respectively. During a three-day cycle, two storage tanks retain VCO2 for 12 and 48 h, respectively, while the other two storage tanks store LCO2. This means that in case of emergency, it is possible to inspect any dysfunctional CO2 storage tank after evacuation of VCO2.
The period from days 13 to 15, marked in red in Figure 7, corresponds to an emergency period where the CO2 carrier arrives at the CO2 terminal 60 h late, but was originally scheduled to arrive on day 13 at noon. As shown in Figure 7, if the unloading of LCO2 from the carrier starts at 20:00 on day 15, it is possible to continuously transmit the LCO2 to the offshore pipeline without any gap. This means four storage tanks enable a buffer of 60 h. For longer buffer hours, additional storage tanks would be required.

4.3. Identification of Physical Equipment of CO2 Terminal

Identifying the equipment consisting of the system and the performance requirements is important in the system design. In this study, a RAS was used to determine the requirements related to the seven lower-level functions. Firstly, the functions and the related requirements are specified in the left columns in Table 1, which were obtained from Section 2 and the results of Section 4.1. Then, the derived requirements were written in the next column, which were derived from Section 4.2.1 and Section 4.2.2. Finally, the necessary equipment was determined and is listed in the right column in Table 1.

5. Discussion

5.1. Process Flow Block Diagram of CO2 Terminal

Based on the results obtained from the five analyses, a process flow block diagram of the CO2 terminal was derived (Figure 8). The solid lines and the dotted lines in Figure 8 represent flows of LCO2 and VCO2, respectively. Figure 8 shows that the CO2 terminal consists of three major parts. The first part is the CO2 loading/unloading part (Figure 8, yellow), including an LCO2 unloading system, a VCO2 loading system, and a VCO2 extracting system. According to the TLA result, the CO2 loading/unloading part operates for four hours during a three-day operating cycle. The VCO2 displaced from the storage tanks in the terminal is loaded into the cargo tanks in the carrier. This means the CO2 loading/unloading parts do not require any externally supplied VCO2. The second part is LCO2 transmission (Figure 8, blue), which controls the temperature and pressure of LCO2 for transmission to the offshore pipeline. The corresponding equipment systems are a low pressure (LP) pump, a heat exchanger, and a booster pump. It operates all the time for continuous injection of LCO2. The final part is the vapor-treatment part (Figure 8, red), which is necessary to control the temperature and pressure of the storage tanks for smoothly discharging LCO2 to the offshore pipeline. The most effective method is to recharge the storage tank with VCO2 in the same volume as the discharged LCO2. The vapor-treatment part aims to produce and charge the required VCO2. The vapor-treatment consists of a BOG removal system, a VCO2 charging system, and a VCO2 generating system. In this study, the required VCO2 can be obtained using two methods. The first method involves obtaining VCO2 by BOG from other tanks that are not under discharge. The system responsible for this function is a BOG removal system. The second method involves vaporizing a small portion of the discharged LCO2. This function is handled by a VCO2 generating system. A VCO2 charging system is responsible for injecting VCO2 determined by the above two methods into the storage tanks that discharge LCO2.
The process flow block diagram depicted in Figure 8 helps with understanding the entire CO2 flow and equipment groups. However, with the four CO2 storage tanks and the roles of each tank changing with time, it is difficult to understand the role of each tank using Figure 8 alone. The storage tanks block in Figure 8 is included in all three parts. Then, the storage tanks block is expanded in Figure 8 into four tanks to clarify the different roles of CO2 storage tanks explicitly, as shown in Figure 9.
Figure 9 shows the extended process block flow diagram when storage tanks 1 and 2 are being filled with LCO2 from the carrier during normal operation. This time corresponds to 12:00 to 16:00 on days 7 and 10 in Figure 7. These two CO2 storage tanks belong to the CO2 loading/unloading part (yellow) in Figure 8. Before the carrier has arrived, the two tanks are filled with VCO2 subsequent to the transmission of LCO2 to the offshore pipeline. After filling LCO2 into CO2 storage tanks 1 and 2, the function of CO2 storage tanks 1 and 2 are converted to the function ‘Store LCO2′ and the corresponding equipment in Figure 9 is ‘storage tank 3′. ‘Storage tank 3′ belongs to the vapor-treatment part in Figure 8 (red). At this time, the pressure and temperature in the CO2 storage tank are kept constant by extracting the BOG generated in the tank. The equipment responsible for this role is shown in Figure 8 and Figure 9 as ‘BOG removal system’. After a period of time, the LCO2 in the tank is then transmitted by the ‘LP pump’ and the corresponding tank is ‘storage tank 4′. ‘Storage tank 4′ belongs to the LCO2 transmission part in Figure 8 (blue). Most of LCO2 is sent to the ‘offshore pipeline’ via the ‘heat exchanger’ and a ‘booster pump’, and only a small portion of LCO2 is sent to a ‘vapor generating system’ to generate VCO2. Here, the ‘vapor generating system’ should also collect the BOG from the ‘BOG removal system’. The generated VCO2 is moved into ‘storage tank 4′ through the ‘vapor charging system’ to control the pressure of the tank being discharged. VCO2 is ultimately reloaded to the CO2 carrier through a ‘VCO2 extracting system’ and a ‘VCO2 loading system’.

5.2. Comparison with LNG Terminal

LNG terminals have already been commercialized, with many models available. The concepts CO2 and LNG terminals are similar for temporarily storing carrier-transported liquid in a storage tank and then sending it out through a pipeline. This similarity leads to the mis-prediction that the differences between the LNG terminal and the CO2 terminal are limited to size and operational pressure and temperature conditions. The LNG transport chain and CCS transport chain have considerable differences in transportation distance and transportation pressure and temperature conditions. The LNG transport chain typically has a long carrier transport distance of 6500 km on average [54] because the LNG production sites are distributed only in a specific area. However, a CCS chain’s carrier transport routes are relatively short because offshore CO2 storage sites are widely distributed around the world and the probability of offshore storage sites being near capture sites is high. The temperature and pressure conditions of LNG carriers are usually −162 °C and atmospheric pressure, respectively [55], but the temperature and pressure conditions of CO2 carriers range between the triple point of −56 °C and 5.1 bar and the critical point of 31 °C and 74 bar. Based on the results of this study, the differences in the transportation conditions between an LNG chain and a CCS chain lead to the following important differences in terminal design and operation:
(1)
Differences in the number of storage tanks due to the size limit: LNG carriers usually travel long distances and convey a large amount of LNG, so this necessitates a large amount of LNG storage. However, relatively less CO2 storage is required in a CO2 terminal. Since the LNG tanks are operated in cryogenic and atmospheric pressure conditions except for small-scale satellite terminals, one LNG storage tank can be as large as ~160,000 m3 [56]. However, the pressure of the CO2 storage tank should be higher than the triple-point pressure of 5.1 bar, meaning the CO2 storage tanks are pressurized tanks, which are hard to manufacture at capacity bigger than around 5000 tons. This means the CO2 terminal requires multiple tanks, and in many cases, the carrier-transported CO2 has to be unloaded into several storage tanks. In this study, the carrier transports ~9000 tons of CO2, which is unloaded into two tanks that are 4500 tons each. Because overfill is one of the common causes of operational accidents [57], the multiple tanks in the CO2 terminal pose a high risk of overfill. Therefore, ensuring a high level of safety is necessary.
(2)
Importance of vaporizer: The storage time in an LNG terminal is usually longer than in a CCS terminal due to the longer carrier transport cycle. In this case, the amount of BOG generated in LNG carriers or storage tanks is huge and needs to be re-liquefied at a high cost and requiring considerable amounts of energy [58]. However, the CO2 carrier transportation cycle and temporary storage period in the terminal are relatively short. In our study, the carrier-transported CO2 is sent to the offshore pipeline within six days according to the TLA results. The amount of BOG in the CO2 terminal is less than the required vapor for preventing the decrease in pressure in the CO2 storage tanks as LCO2 is discharged to the pipeline. Therefore, the vaporizer in a CO2 terminal is essential.

5.3. Cost Comparison between One and Two Carriers

This study has determined the number of carriers as two in Section 4.1.2 because operating two carriers is advantageous for continuous injection, although operating one carrier is economically more advantageous. If only one carrier is operated, the design of the terminal is also partially changed, so it is meaningful to check the costs according to the number of carriers operated, including the changes in the cost of terminal induced by the number of carriers.
In the case of operating one carrier, the carrier size and the number/size of storage tanks at the terminal were obtained by following the procedures in Section 4.1.3 and Section 4.1.4. According to Equation (1), the amount of CO2 transported during one cycle is 13,700 tons, when operating one carrier, which corresponds to the amount CO2 captured for 5 days. Taking into account the additional VCO2 required at the terminal and assuming that 95% of the cargo tank is filled, the carrier size can be determined as 15,200 tons. As mentioned in Section 4.1.4, the maximum size of one storage tank at the terminal is 5000 tons. Therefore, the number and size of storage tanks required for unloading of LCO2 at the CO2 terminal will be four and 3800 tons, respectively. Considering two buffer tanks and one emitting tank, the total number of required storage tanks is seven.
CAPEX for a CO2 carrier was calculated as $210,000,000 × (carrier capacity/155,000 tons) 0.65 by calibrating the price of LNG carrier of 155,000-ton size. OPEX for a CO2 carrier was calculated as the sum of 5% of CAPEX and fuel costs. Fuel costs for 9000-ton carrier and 15,000-ton carrier were determined as $5500 and $7100, respectively by applying the equation of the daily fuel cost × 365 days × availability. Assuming that only the number and capacity of storage tanks at the terminals are changed depending on the number of carriers, this study only considered storage tank costs at the CO2 terminal. CAPEX of one storage tank was estimated to be 3.46 times the metal price corresponding to the weight of a thin-wall spherical tank. The weight of the thin-walled spherical tank was obtained from its diameter and thickness, and the metal price was assumed to be $1,666 per ton. OPEX is assumed to be 5% of CAPEX.
To make the comparison between costs easier, CAPEX is converted into the capital recovery cost using the capital recovery factor. The capital recovery cost means the annual equivalent cost of CAPEX. The capital recovery factor is 0.061 with a repayment period of 20 years and an interest rate of 2%.
The calculation results are summarized in Table 2. As shown in Table 2, the annual cost of one carrier is $7.2 million, which is 72% of the cost of two carriers. However, if the storage tank cost is included, the total annual cost when operating one carrier increases to 80% of the total annual cost when operating two carriers. This is due to the increased number of storage tanks at the terminal when operating one carrier. The results show that the number of carriers is very closely related to the terminal design. Therefore, to make an accurate economic evaluation, it is necessary to consider the design parameters of carriers and terminal simultaneously.
It is still economical to operate one carrier even if the cost of the terminal increases. If the carrier’s failure rate can be reduced to very low values, operating one carrier would be a good option. Adopting novel technologies such as prognostics and health management which have been emerging recently, can minimize unexpected failure of carriers.

6. Conclusions

In this study, we aimed to derive the configuration and the operational concept of a CO2 terminal that connects CO2 carriers and an offshore pipeline using the SEP. This paper helps understanding a basic concept of a CO2 terminal. In addition it clearly shows how system engineering process is applied. The following points were derived by conducting the SEP:
(1)
FFBD was used to identify the seven basic functions of the CO2 terminal: ‘Unload LCO2′, ‘Load VCO2′, ‘Receive LCO2′, ‘Store LCO2′, ‘Transmit LCO2′, ‘Generate VCO2′, and ‘Increase LCO2 T&P’. Then, IDEF0 was used to identify the correlation between these functions.
(2)
The short and repetitive CO2 carrier transport affects the configuration of the CO2 terminal. The CO2 terminal here is operated with a three-day cycle and at least four 4500-ton storage tanks are needed. The four tanks allow for continuous CO2 transmission to an offshore pipeline even if a CO2 carrier could not arrive at the CO2 terminal due to the bad weather for 2.5 days. This operational concept of a CO2 terminal was verified by the TLA.
(3)
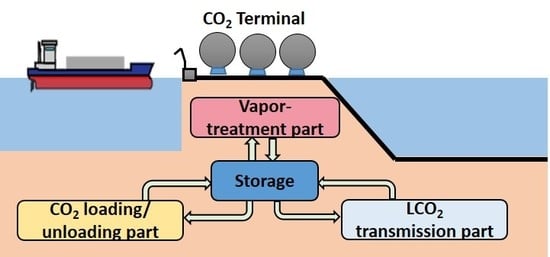
A process flow block diagram was derived from the results of the functional analysis and design synthesis. The configuration of the CO2 terminal consists of a CO2 loading/unloading part, an LCO2 transmission part, and a VCO2 treatment part. These results were used in the subsequent design phase.
(4)
In this study, VCO2 is required for two purposes. The first is for filling the carrier cargo tank with VCO2 when unloading LCO2 from the CO2 carrier. In this case, the required VCO2 is covered by displaced VCO2 as LCO2 fills the storage tanks in the terminal. The second purpose is for controlling the pressure in the storage tank that is transmitting LCO2 to offshore pipelines. The required VCO2 is supplied from BOG from the other three storage tanks and vaporized CO2 from the small portion of discharged LCO2.
(5)
The comparison of our results with an LNG terminal indicated that a vaporizer is important in the CO2 terminal. As mentioned above, the BOG alone cannot meet the required amount for discharging the VCO2 in a storage tank. Therefore, it is necessary to pay more attention to vaporization rather than reliquefaction in the CO2 terminal. The CO2 terminal requires multiple small-sized storage tanks, unlike the LNG terminal.
(6)
Major design factors, such as the number and capacity of storage tanks at terminal, change depending on the number of carriers. Therefore, in order to minimize costs, the design parameters of the carrier and the terminal must be considered simultaneously.

Author Contributions

Conceptualization, H.N. and K.K.; methodology, H.N.; validation, C.H. and S.J.H.; formal analysis, K.K.; investigation, H.N.; data curation, C.H.; writing—original draft preparation, H.N.; writing—review and editing, K.K.; visualization, H.N.; supervision, K.K.; project administration, H.K.; funding acquisition, S.-G.K.

Funding

This research was supported by a grant from Endowment Project of “Technology development of material handling and risk management for operation and maintenance service of offshore plant” funded by the Korea Research Institute of Ships and Ocean engineering (PES3081).

Acknowledgments

The authors are grateful for the full support from the Korea Research Institute of Ships & Ocean Engineering (KRISO).

Conflicts of Interest

The authors declare no conflict of interest.

References

  1. IEA. Energy Technology Perspectives 2016; OECD: Paris, France, 2015. [Google Scholar]
  2. Budinis, S.; Krevor, S.; Dowell, N.M.; Brandon, N.; Hawkes, A. An assessment of CCS costs, barriers and potential. Energy Strategy Rev. 2018, 22, 61–81. [Google Scholar] [CrossRef]
  3. IPCC. IPCC Special Report on Carbon Dioxide Capture and Storage; Cambridge University Press: Cambridge, UK; New York, NY, USA, 2005; p. 422. [Google Scholar]
  4. Jung, J.-Y.; Huh, C.; Kang, S.-G.; Seo, Y.; Chang, D. CO2 transport strategy and its cost estimation for the offshore CCS in Korea. Appl. Energy 2013, 111, 1054–1060. [Google Scholar] [CrossRef]
  5. Yoo, B.-Y. The development and comparison of CO2 BOG re-liquefaction processes for LNG fueled CO2 carriers. Energy 2017, 127, 186–197. [Google Scholar] [CrossRef]
  6. Kang, K.; Huh, C.; Kang, S.-G.; Baek, J.-H.; Noh, H.J. Estimation of CO2 Pipeline Transport Cost in South Korea Based on the Scenarios. Energy Procedia 2014, 63, 2475–2480. [Google Scholar] [CrossRef]
  7. Wetenhall, B.; Race, J.; Aghajani, H.; Fernandez, E.S.; Naylor, M.; Lucquiaud, M.; Chalmers, H. Considerations in the Development of Flexible CCS Networks. Energy Procedia 2017, 114, 6800–6812. [Google Scholar] [CrossRef]
  8. Spitz, T.; Avagyan, V.; Ascui, F.; Bruce, A.R.W.; Chalmers, H.; Lucquiaud, M. On the variability of CO2 feed flows into CCS transportation and storage networks. Int. J. Greenh. Gas Control 2018, 74, 296–311. [Google Scholar] [CrossRef]
  9. Kang, K.; Seo, Y.; Chang, D.; Kang, S.-G.; Huh, C. Estimation of CO2 Transport Costs in South Korea Using a Techno-Economic Model. Energies 2015, 8, 2176. [Google Scholar] [CrossRef]
  10. Seo, Y.; Chang, D.; Jung, J.-Y.; Huh, C.; Kang, S.-G. Economic Evaluation of Ship-based CCS with Availability. Energy Procedia 2013, 37, 2511–2518. [Google Scholar] [CrossRef]
  11. Yoo, B.-Y.; Choi, D.-K.; Kim, H.-J.; Moon, Y.-S.; Na, H.-S.; Lee, S.-G. Development of CO2 terminal and CO2 carrier for future commercialized CCS market. Int. J. Greenh. Gas Control 2013, 12, 323–332. [Google Scholar] [CrossRef]
  12. Yoo, B.-Y.; Lee, S.-G.; Rhee, K.-p.; Na, H.-S.; Park, J.-M. New CCS system integration with CO2 carrier and liquefaction process. Energy Procedia 2011, 4, 2308–2314. [Google Scholar] [CrossRef]
  13. Knoope, M.M.J.; Ramírez, A.; Faaij, A.P.C. Investing in CO2 transport infrastructure under uncertainty: A comparison between ships and pipelines. Int. J. Greenh. Gas Control 2015, 41, 174–193. [Google Scholar] [CrossRef]
  14. Brown, M.; Baddeley, A.; Coulthurst, A.; Taylor, S. The East Irish Sea CCS Cluster: A Conceptual Design; Eunomia Research & Consulting Ltd: Bristol, UK, 2011; pp. 1–19. [Google Scholar]
  15. Vermeulen, T.N. CO2 Liquid Logistics Shipping Concept (LLSC) Overall Supply Chain Optimization; Global CCS Institute: Canberra, Australia, 2011. [Google Scholar]
  16. Lauri, K.; Jouko, R.; Nicklas, N.; Sebastian, T. Scenarios and new technologies for a North-European CO2 transport infrastructure in 2050. Energy Procedia 2014, 63, 2738–2756. [Google Scholar] [CrossRef]
  17. Kujanpää, L.; Teir, S. Implications of the New EU Maritime Emission Monitoring Regulation on Ship Transportation of CO2. Energy Procedia 2017, 114, 7415–7421. [Google Scholar] [CrossRef]
  18. Brownsort, P. Ship Transport of CO2 for Enhanced Oil Recovery—Literature Survey; Murchison House: Edinburgh, UK, 2015. [Google Scholar]
  19. Emrah durusut, M.J. Shipping CO2—UK Cost Estimation Study; Suite 1 Bishop Bateman Court, Thompson’s Lane: Cambridege, UK, 2018. [Google Scholar]
  20. Furre, A.K.; Meneguolo, R.; Ringrose, P.; Kassold, S. Building confidence in CCS: From sleipner to the northern Lights project. First Break 2019, 37, 81–87. [Google Scholar]
  21. Lee, U.; Lim, Y.; Lee, S.; Jung, J.; Han, C. CO2 Storage Terminal for Ship Transportation. Ind. Eng. Chem. Res. 2012, 51, 389–397. [Google Scholar] [CrossRef]
  22. Riis, F. Norway CCS demonstration project: Evaluation of Jurassic reservoirs for safe CO2 injection and storage. In Proceedings of the 5th CO2 Geological Storage Workshop, Utrecht, The Netherlands, 21–23 November 2018. [Google Scholar]
  23. ZEP. The Costs of CO2 Transport; Zero Emission Platform: Brussels, Belgium, 2011. [Google Scholar]
  24. Northern Lights—Part of The Full-Scale CCS Project in Norway. Available online: https://northernlightsccs.com/en/about (accessed on 15 October 2019).
  25. Seo, Y.; Huh, C.; Lee, S.; Chang, D. Comparison of CO2 liquefaction pressures for ship-based carbon capture and storage (CCS) chain. Int. J. Greenh. Gas Control 2016, 52, 1–12. [Google Scholar] [CrossRef]
  26. Suzuki, T.; Toriumi, M.; Sakemi, T.; Masui, N.; Yano, S.; Fujita, H.; Furukawa, H. Conceptual Design of CO2 Transportation System for CCS. Energy Procedia 2013, 37, 2989–2996. [Google Scholar] [CrossRef]
  27. Tan, Y.; Nookuea, W.; Li, H.; Thorin, E.; Yan, J. Property impacts on Carbon Capture and Storage (CCS) processes: A review. Energy Convers. Manag. 2016, 118, 204–222. [Google Scholar] [CrossRef]
  28. Kokubun, N.; Ko, K.; Ozaki, M. Cargo Conditions of CO2 in Shuttle Transport by Ship. Energy Procedia 2013, 37, 3160–3167. [Google Scholar] [CrossRef]
  29. Miyazaki, T.; Osawa, H.; Matsuura, M.; Ohta, M.; Ozaki, M. Offshore Operational Availability of Onboard Direct Injection of CO2 into Sub-seabed Geological Formations. Energy Procedia 2013, 37, 3168–3175. [Google Scholar] [CrossRef]
  30. Nakazawa, N.; Kikuchi, K.; Ishii, K.-I.; Yamaguchi, T.; Ohta, M.; Ozaki, M. Ship-based CO2 Injection into Subseabed Geological Formations Using a Flexible Riser Pipe Pickup System. Energy Procedia 2013, 37, 3176–3183. [Google Scholar] [CrossRef]
  31. Ozaki, M.; Ohsumi, T.; Kajiyama, R. Ship-based Offshore CCS Featuring CO2 Shuttle Ships Equipped with Injection Facilities. Energy Procedia 2013, 37, 3184–3190. [Google Scholar] [CrossRef]
  32. Aneziris, O.N.; Papazoglou, I.A.; Konstantinidou, M.; Nivolianitou, Z. Integrated risk assessment for LNG terminals. J. Loss Prev. Process Ind. 2014, 28, 23–35. [Google Scholar] [CrossRef]
  33. Li, Y.; Li, Y. Dynamic optimization of the Boil-Off Gas (BOG) fluctuations at an LNG receiving terminal. J. Nat. Gas Sci. Eng. 2016, 30, 322–330. [Google Scholar] [CrossRef]
  34. Trotter, I.M.; Gomes, M.F.M.; Braga, M.J.; Brochmann, B.; Lie, O.N. Optimal LNG (liquefied natural gas) regasification scheduling for import terminals with storage. Energy 2016, 105, 80–88. [Google Scholar] [CrossRef]
  35. Bisen, V.S.; Karimi, I.A.; Farooq, S. Dynamic Simulation of a LNG Regasification Terminal and Management of Boil-off Gas. In Computer Aided Chemical Engineering; Eden, M.R., Ierapetritou, M.G., Towler, G.P., Eds.; Elsevier: Amsterdam, The Netherlands, 2018; Volume 44, pp. 685–690. [Google Scholar]
  36. Nagesh Rao, H.; Karimi, I.A. Optimal design of boil-off gas reliquefaction process in LNG regasification terminals. Comput. Chem. Eng. 2018, 117, 171–190. [Google Scholar] [CrossRef]
  37. Noh, Y.; Kim, J.; Kim, J.; Chang, D. Economic evaluation of BOG management systems with LNG cold energy recovery in LNG import terminals considering quantitative assessment of equipment failures. Appl. Therm. Eng. 2018, 143, 1034–1045. [Google Scholar] [CrossRef]
  38. Rao, H.N.; Karimi, I.A.; Farooq, S. Optimal Design of Boil-Off Gas Liquefaction in LNG Regasification Terminals. In Computer Aided Chemical Engineering; Eden, M.R., Ierapetritou, M.G., Towler, G.P., Eds.; Elsevier: Amsterdam, The Netherlands, 2018; Volume 44, pp. 2407–2412. [Google Scholar]
  39. Yoon, B.; Shin, J.; Lee, S. Technology assessment model for sustainable development of LNG terminals. J. Clean. Prod. 2018, 172, 927–937. [Google Scholar] [CrossRef]
  40. George, J.J.; Renjith, V.R.; George, P.; George, A.S. Application of fuzzy failure mode effect and criticality analysis on unloading facility of LNG terminal. J. Loss Prev. Process Ind. 2019, 61, 104–113. [Google Scholar] [CrossRef]
  41. Khan, M.S.; Effendy, S.; Karimi, I.A.; Wazwaz, A. Improving design and operation at LNG regasification terminals through a corrected storage tank model. Appl. Therm. Eng. 2019, 149, 344–353. [Google Scholar] [CrossRef]
  42. Pokkatt, P.P.; Srinivasan, R. Effect of Ambient Conditions on Boil Off Gas Generation in LNG regasification terminals. In Computer Aided Chemical Engineering; Kiss, A.A., Zondervan, E., Lakerveld, R., Özkan, L., Eds.; Elsevier: Amsterdam, The Netherlands, 2019; Volume 46, pp. 445–450. [Google Scholar]
  43. Reddy, H.V.; Bisen, V.S.; Rao, H.N.; Dutta, A.; Garud, S.S.; Karimi, I.A.; Farooq, S. Towards energy-efficient LNG terminals: Modeling and simulation of reciprocating compressors. Comput. Chem. Eng. 2019, 128, 312–321. [Google Scholar] [CrossRef]
  44. DoD. Systems Engineering Fundamentals: Supplementary Text; Systems Management College: Fort Belvoir, VA, USA, 2001. [Google Scholar]
  45. Grady, J.O. System Requirements Analysis, 2nd ed.; Elsevier: Oxford, UK, 2014; pp. 1–801. [Google Scholar]
  46. NASA. NASA Systems Engineering Handbook; NASA Headquarters: Washington, DC, USA, 2007.
  47. Grady, J.O. System Requirements Analysis; Elsevier: Amsterdam, The Netherlands, 2006. [Google Scholar]
  48. Spitz, T.; Chalmers, H.; Ascui, F.; Lucquiaud, L. Operating Flexibility of CO2 Injection Wells in Future Low Carbon Energy System. Energy Procedia 2017, 114, 4797–4810. [Google Scholar] [CrossRef]
  49. IEAGHG. Operational Flexibility of CO2 Transport and Storage; IEAGHG: Cheltenham, UK, 2016. [Google Scholar]
  50. DNV. CO2RISKMAN. Guideance on CCS CO2 Safety and Environment, Major Accident Hazard Risk Management, Level 4—Specific CCS Chain Guidance; DNV-GL: Oslo, Norway, 2013; p. 307. [Google Scholar]
  51. Incropera, F.P. Fundamentals of Heat and Mass Transfer; John Wiley: Hoboken, NJ, USA, 2007; p. 1032. [Google Scholar]
  52. ASME. BPVC Section VIII-Rules for Construction of Pressure Vessels Division 2-Alternative Rules; The American Society of Mechanical Engineers: New York, NY, USA, 2015. [Google Scholar]
  53. Yoo, B.-Y. An Experimental Study on the Thermocline Layer in a Cargo Tank of CO2 Carriers; Seoul National University: Seoul, Korea, 2011. [Google Scholar]
  54. Thomas, K. What Are the Prospects for LNG-Carrier Tonne-Mile Demand to 2020? Available online: http://www.lngworldshipping.com/news/view,what-are-the-prospects-for-lngcarrier-tonnemile-demand-to-2020_46622.htm (accessed on 2 February 2018).
  55. Niu, W.C.; Li, G.L.; Ju, Y.L.; Fu, Y.Z. Design and analysis of the thermal insulation system for a new independent type B LNG carrier. Ocean Eng. 2017, 142, 51–61. [Google Scholar] [CrossRef]
  56. Lv, D.; Tan, W.; Liu, L.; Zhu, G.; Peng, L. Research on maximum explosion overpressure in LNG storage tank areas. J. Loss Prev. Process Ind. 2017, 49, 162–170. [Google Scholar] [CrossRef]
  57. Casal, A.; Olsen, H. Operational risks in QRAs. Chem. Eng. Trans. 2016, 48, 589–594. [Google Scholar]
  58. Tan, H.; Zhao, Q.; Sun, N.; Li, Y. Enhancement of energy performance in a boil-off gas re-liquefaction system of LNG carriers using ejectors. Energy Convers. Manag. 2016, 126, 875–888. [Google Scholar] [CrossRef]
Figure 1. The systems engineering process (SEP).
Energies 12 04350 g001
Figure 2. The carbon capture and storage (CCS) chain process in this study: (a) graphical representation and (b) functional flow block diagram. L = liquid, V = vapor.
Energies 12 04350 g002
Figure 3. Integration definition for function modeling (IDEF0) shows the inputs, control, outputs, and mechanisms of functions.
Energies 12 04350 g003
Figure 4. Schematics of simplified storage tank for boil-off gas (BOG) calculation.
Energies 12 04350 g004
Figure 5. A functional flow block diagram of CCS project and scope of CO2 terminal functions (blue region).
Energies 12 04350 g005
Figure 6. IDEF0 of CO2 terminal.
Energies 12 04350 g006
Figure 7. Timelines for the activated functions and CO2 storage tanks status. The green and blue colors show each carrier shipping CO2. The yellow represents the initially filled CO2 and the red corresponds to an emergency period.
Energies 12 04350 g007
Figure 8. The process flow block diagram of the CO2 terminal. The yellow, red, and blue parts represent the CO2 loading/unloading, vapor-treatment, and LCO2 transmission parts, respectively.
Energies 12 04350 g008
Figure 9. The extended process flow block diagram of the CO2 terminal.
Energies 12 04350 g009
Table 1. The derived requirements and equipment corresponding to functions of the CO2 terminal.
No.FunctionsRequirementsEquipment
5.0
and
11.0
Transport LCO2 by carrier and
Return carrier to capture site
(1) Number of carriers = 2
(2) One-way transport time ≤ 1 day
(3) Availability of carriers < 80%
(4) Amount of CO2 per one carrier = 8549 tons
Two 9000-ton CO2 carriers
6.1Unload LCO2(1) Amount of unloaded LCO2 = 8549 tons
(2) Time required for unloading ≤ 4 h
LCO2 unloading system
6.2Load VCO2(1) Amount of loaded VCO2 = 329 tons
(2) Time required for loading ≤ 4 h
VCO2 extracting system
VCO2 loading system
7.1Receive LCO2(1) The size of 1 storage tank = 4500 tons4500-ton storage tanks
7.2Store LCO2(1) Temperature and pressure CO2 in storage tank are maintained at −27 ℃ and 16 bar, respectively, by removing BOG
(2) Buffer capacity = 60 h’ injection amount
(3) The required number of CO2 tanks = 4
BOG removal system
Four 4500-ton storage tanks
7.3Transmit LCO2
(1) Continuous extraction rate of LCO2 from storage tank ≥ 2740 tons/day LP Pump
7.4Generate VCO2(1) Daily required amount of VCO2 = 109.7 tons
(2) Prevent decrease in pressure of storage tanks by charging VCO2
VCO2 generating system
VCO2 charging system
8.1Increase LCO2 T & P(1) Target temperature = 3–5 ℃
(2) Target pressure ≥ 120 bar
Heat exchanger
Booster pump
Table 2. Summary of capacity, capital expenditure (CAPEX), and operating expenditure (OPEX) of carrier and CO2 terminal depending on the numbers of carriers.
No. of CarriersOne CarrierTwo Carriers
CarrierSize of one carrier (tons)15,0009000
CAPEX ($)51.7 M76.2 M
Capital Recovery Cost ($)2.8 M4.0 M
OPEX ($)4.4 M6.0 M
Annual cost of carrier ($)7.2 M10.0 M
TerminalNo. of storage tanks74
Size of storage tank (tons)38004500
CAPEX of Storage tanks ($)14.9 M9.5 M
Capital Recovery Cost ($)1.0 M0.6 M
OPEX of storage tanks ($)0.7 M0.5 M
Annual cost of storage tanks ($)1.7 M1.1 M
TotalSum of annual costs of carriers and storage tanks at terminal ($)8.8 M 11.0 M

