Article

Intelligent Energy Management Strategy for Automated Office Buildings

by
Simplice Igor Noubissie Tientcheu
*,
Shyama P. Chowdhury
and
Thomas O. Olwal
Department of Electrical Engineering, Tshwane University of Technology, Pretoria 0001, South Africa
*
Author to whom correspondence should be addressed.
Energies 2019, 12(22), 4326; https://doi.org/10.3390/en12224326
Submission received: 29 September 2019 / Revised: 29 October 2019 / Accepted: 30 October 2019 / Published: 13 November 2019

Abstract

:
The increasing demand to reduce the high consumption of end-use energy in office buildings framed the objective of this work, which was to design an intelligent system management that could be utilized to minimize office buildings’ energy consumption from the national electricity grid. Heating, Ventilation and Air Conditioning (HVAC) and lighting are the two main consumers of electricity in office buildings. Advanced automation and control systems for buildings and their components have been developed by researchers to achieve low energy consumption in office buildings without considering integrating the load consumed and the Photovoltaic system (PV) input to the controller. This study investigated the use of PV to power the HVAC and lighting equipped with a suitable control strategy to improve energy saving within a building, especially in office buildings where there are reports of high misuse of electricity. The intelligent system was modelled using occupant activities, weather condition changes, load consumed and PV energy changes, as input to the control system of lighting and HVAC. The model was verified and tested using specialized simulation tools (Simulink®) and was subsequently used to investigate the impact of an integrated system on energy consumption, based on three scenarios. In addition, the direct impact on reduced energy cost was also analysed. The first scenario was tested in simulation of four offices building in a civil building in South Africa of a single occupant’s activities, weather conditions, temperature and the simulation resulted in savings of HVAC energy and lighting energy of 13% and 29%, respectively. In the second scenario, the four offices were tested in simulation due to the loads’ management plus temperature and occupancy and it resulted in a saving of 20% of HVAC energy and 29% of lighting electrical energy. The third scenario, which tested integrating PV energy (thus, the approach utilized) with the above-mentioned scenarios, resulted in, respectively, 64% and 73% of HVAC energy and lighting electrical energy saved. This saving was greater than that of the first two scenarios. The results of the system developed demonstrated that the loads’ control and the PV integration combined with the occupancy, weather and temperature control, could lead to a significant saving of energy within office buildings.

1. Introduction

Due to the functional and operational requirements of the offices, in a normal office building, energy consumed is affected by the heating, ventilation, air conditioning and artificial lighting. In particular, the International Energy Agency [1] has focused attention on that artificial lighting consumes a large amount of energy than heating and cooling system do. The issue of developing energy saving strategies has certain challenges. In office buildings, some units require considerable energy, such as lighting and the Heating, Ventilating and Air Conditioning (HVAC) systems. These represent an important part of the total energy consumption in buildings. According to energy efficiency, building in South Africa consumes 17% of the total electric energy [2]. Thus, the need to optimally control and save energy has motivated interest in the energy consumption of buildings. Shweta Jain et al. developed a technique which uses participatory sensing to compute real-time occupant discomfort, forcing occupants to use portable foot heaters, distribution map within the office building and enable energy saving without additional hardware [3]. Vangelis et al. [4] presented a control tool that took into account the monitoring of energy consumption in building sector based on real time. Zanoli [5] developed a model predictive control for energy savings in building automation. The proposed system integrates energy consumption for heat and light power supply, with a green energy-supplying source.
Due to the lack of an important save of electric energy, this study investigates the use of photovoltaic (PV) to power the HVAC and lighting equipped with a suitable control strategy to improve energy saving within a building, especially in office buildings where there are reports of high misuse of electricity.
Multiples control system and algorithms have been d developed for HVAC and lighting system control in office buildings in order to reduce the energy consumption. An energy-saving lighting control system has been developed, in which the system detects the employee’s present position in the office and provides the corresponding brightness to the person [6]. An intervention study was done on energy saving which investigated the benefit of controlling ceiling lighting based on occupant presence information obtained at each desk [7]. Lighting energy saved due to the manual control relies on occupant awareness and attitude on energy efficiency. [8]. In his research, Tiller [9] for lighting control, used an intelligent system that gathering information from an occupancy detector. However, it was concluded that disturbances such as huge sensitivity detector and delay may reduce the savings target.
The presence of solar irradiation or daylight has a greater impact in the assessment of building energy consumption [10]. Luigi Martirano [11] took advantage of BAS (Building Automation System) and solar energy to validate a fuzzy logic approach to optimize the level of energy performance and comfort in an office space. Based on daylight and lighting of unoccupied spaces, the lighting control plays an important role by reducing the energy wasted in unoccupied hours in the building and automatically adjusts the electrical light level according to daylight based on the façade ([12,13]). In the above research the weather condition can be a problem for the use of the day light such as—sky covered, the season of the year particularly in winter.
HVAC system is assembled of distinct components that can be controlled isolatedly from one another. Control systems reveal that humidity, ventilation and zone temperature are the most significant element in an HVAC system. To solve problem that affect the HVAC electric energy consumed, such as occupancy, loads, temperature, some researchers examined the application of control algorithm based on occupancy because it has been find out that an HVAC system consumes energy even in an unoccupied space, inducing an important waste of energy. Benezeth et al. [14] designed an algorithm control system using a camera to track the presence of a human in an area. Lin Qiu et al. [15] used the control modules of America Automated Logic Corporation to establish applicable algorithmic modules to overcome the issue of bad indoor air quality which affects the energy saving.
Some of the researchers conducted work on the HVAC especially on its internal control algorithm but did not consider the occupancy into the control loop. Therefore, associating the motion sensor with the internal control of the HVAC would improve energy efficiency, which has been achieved by Reference [10]. Other researchers did not take the changes in electricity price and the ambient temperature into account but did consider the time delay and occupancy. Therefore, a control algorithm designed on any change in occupancy detection and weather conditions joined with the integration of a PV solar system will produce a significant result in terms of energy saving within an office building.
Integrated lighting control and HVAC control system have also been used to save the energy consumption within building. Martirano et al. [16] developed a fuzzy control technique for energy saving and for users’ comfort where the lighting system and the heating, ventilation and air conditioning systems were integrated. In their design, the amount of daylight and the comfort limit were managed by a shading system. This shading system, allows an amount of solar radiation to penetrate inside a room which will minimize the electric load, adjusting the HVAC and lighting system to match temperature and illuminance requirements ([17,18,19]).
In the above-mentioned technique, the weather conditions could be a user problem; this isbecause if there is not daylight, the lights and the HVAC will consume more electricity from the national grid. In this study, it was found that removing the daylight control system and combining it with a PV sensor produced a better result in terms of energy saving.
The reason for undertaking a passive technique prior to any HVAC or electrical installation design is viewed as a good approach to make sure that an underground building design is as efficient as possible to reduce the demand for additional heating or cooling or the reliance on too much artificial lighting, thereby reducing the energy requirement of the building from the start. The energy efficiency of a building can be enhanced by using active and passive design techniques. Active design techniques focus on using different equipment inside the building such as energy efficient HVAC systems and electrical installations such as artificial lighting control systems. An energy efficiency of Building layout, shape and building envelope have been improved due to a passive design technique [20]. The material used in the building envelope has a major effect on thermal comfort, energy used by the HVAC systems and lighting levels and therefore, special attention ought to be given to insulation materials, fenestration, shading devices and the walls and roofs of buildings [21]. In this regard, the building envelope system of a building and the insulation materials used can reduce the electrical energy consumption of an HVAC heating system in the warmer months of the year by up to 20%. ([22,23]). Many buildings have been constructed without taking their shape or envelope into consideration. In such buildings, an active design technique must be used to enable the HVAC control system and lighting control system to be based on an intelligent system that will assist in saving electric energy.
Energy management is very important in term of energy reduction as well as in its contribution to reducing fossil fuel consumption and earth warming [24]. There is a difference in energy management in the office building from energy management in a residential house as energy management in a public building does not give the worker an opportunity to take decisions in this regard [25]. Energy management implementation in the office can affect the budget so the decision is one that needs to be taken by top management.
Joelle et al. [26] proposed a method of energy management in public buildings, automatic advice based on algorithm is advised, their proposed model allows the Building Energy Management System (BEMS) to use the appropriate co-design of the system by following the enumerated procedures—the identification of key stakeholders, the pre-analysis of key stakeholder, face-to-face qualitative semi-directed interviews, workshop with the stakeholders, pilot of the Building Energy Management System in the building. To reduce the energy around the office building, some researchers have opted for smart meters [27] stated that having feedback from a smart meter can reduce energy consumption. Immediate feedback allows the user to be more efficient usage in term of energy reduction. A smart meter showing the energy consumed in terms of cost allows the consumers to see their efforts in energy efficiency and the environment.
The study reviewed above requires that the consumer be aware of the energy consumed or that the user has to act in saving energy. Due to the activities that may be demanded of workers in the workplace and the stress that can be experienced by workers in an office building, employees may be too distracted to engage in energy saving. This paper suggests that the most beneficial strategy is intelligent system management, where the components that have the highest consumption rate, such as HVAC light, are controlled by considering the temperature, the workers’ activities, the weather and the load itself, combined or integrated with a PV system.

2. Materials and Methods

This section covers the mathematical model or the system modelling, the material used and the simulation of the proposed intelligent system used to reduce electrical energy around the office building where each office has a length of 3.81 m (12.5 feet) and a width of 4.26 m (14 feet) with a sliding window of 2.5 m 2 see figure.
The mathematical relationship between energy consumption as a dependent variable and occupant activity, temperature and load consumption as the independent variable were modelled and the simulation using MATLAB Simulink was presented. The section also presents a developed intelligent integrated automatic switching system in term of occupant activities, temperature, weather condition, loads consumption and the PV system as an independent variable in order to further reduce energy consumption in the office building. The material used to collect real data (light energy consumption, HVAC energy consumption) is described.

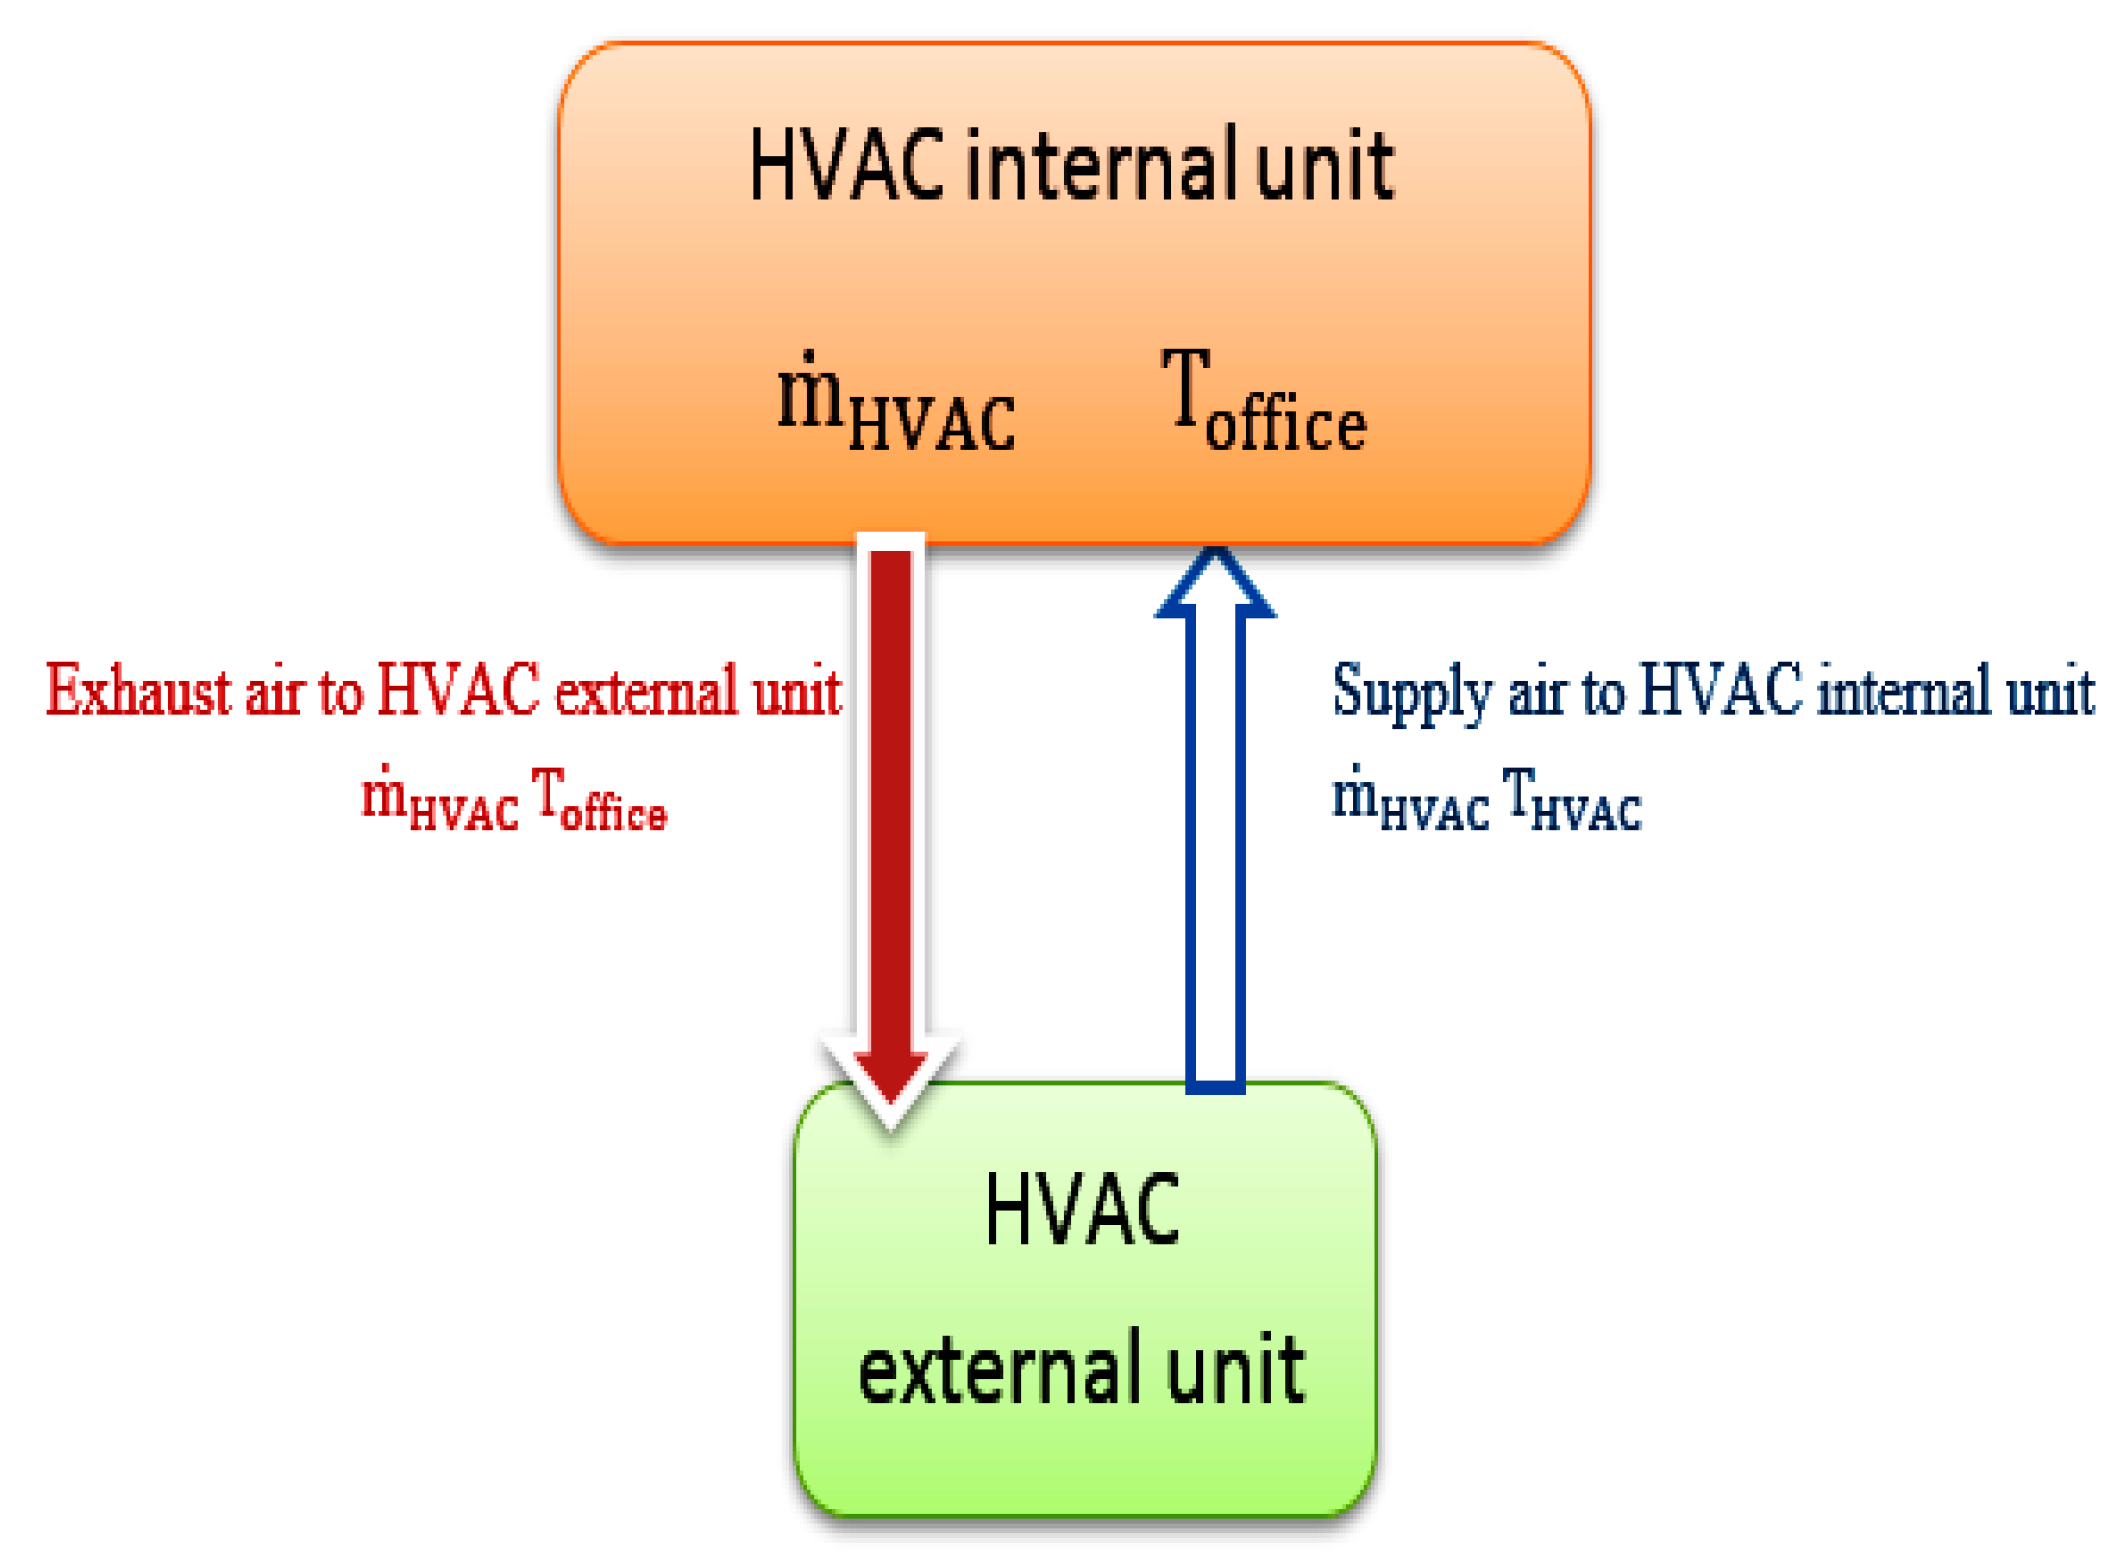
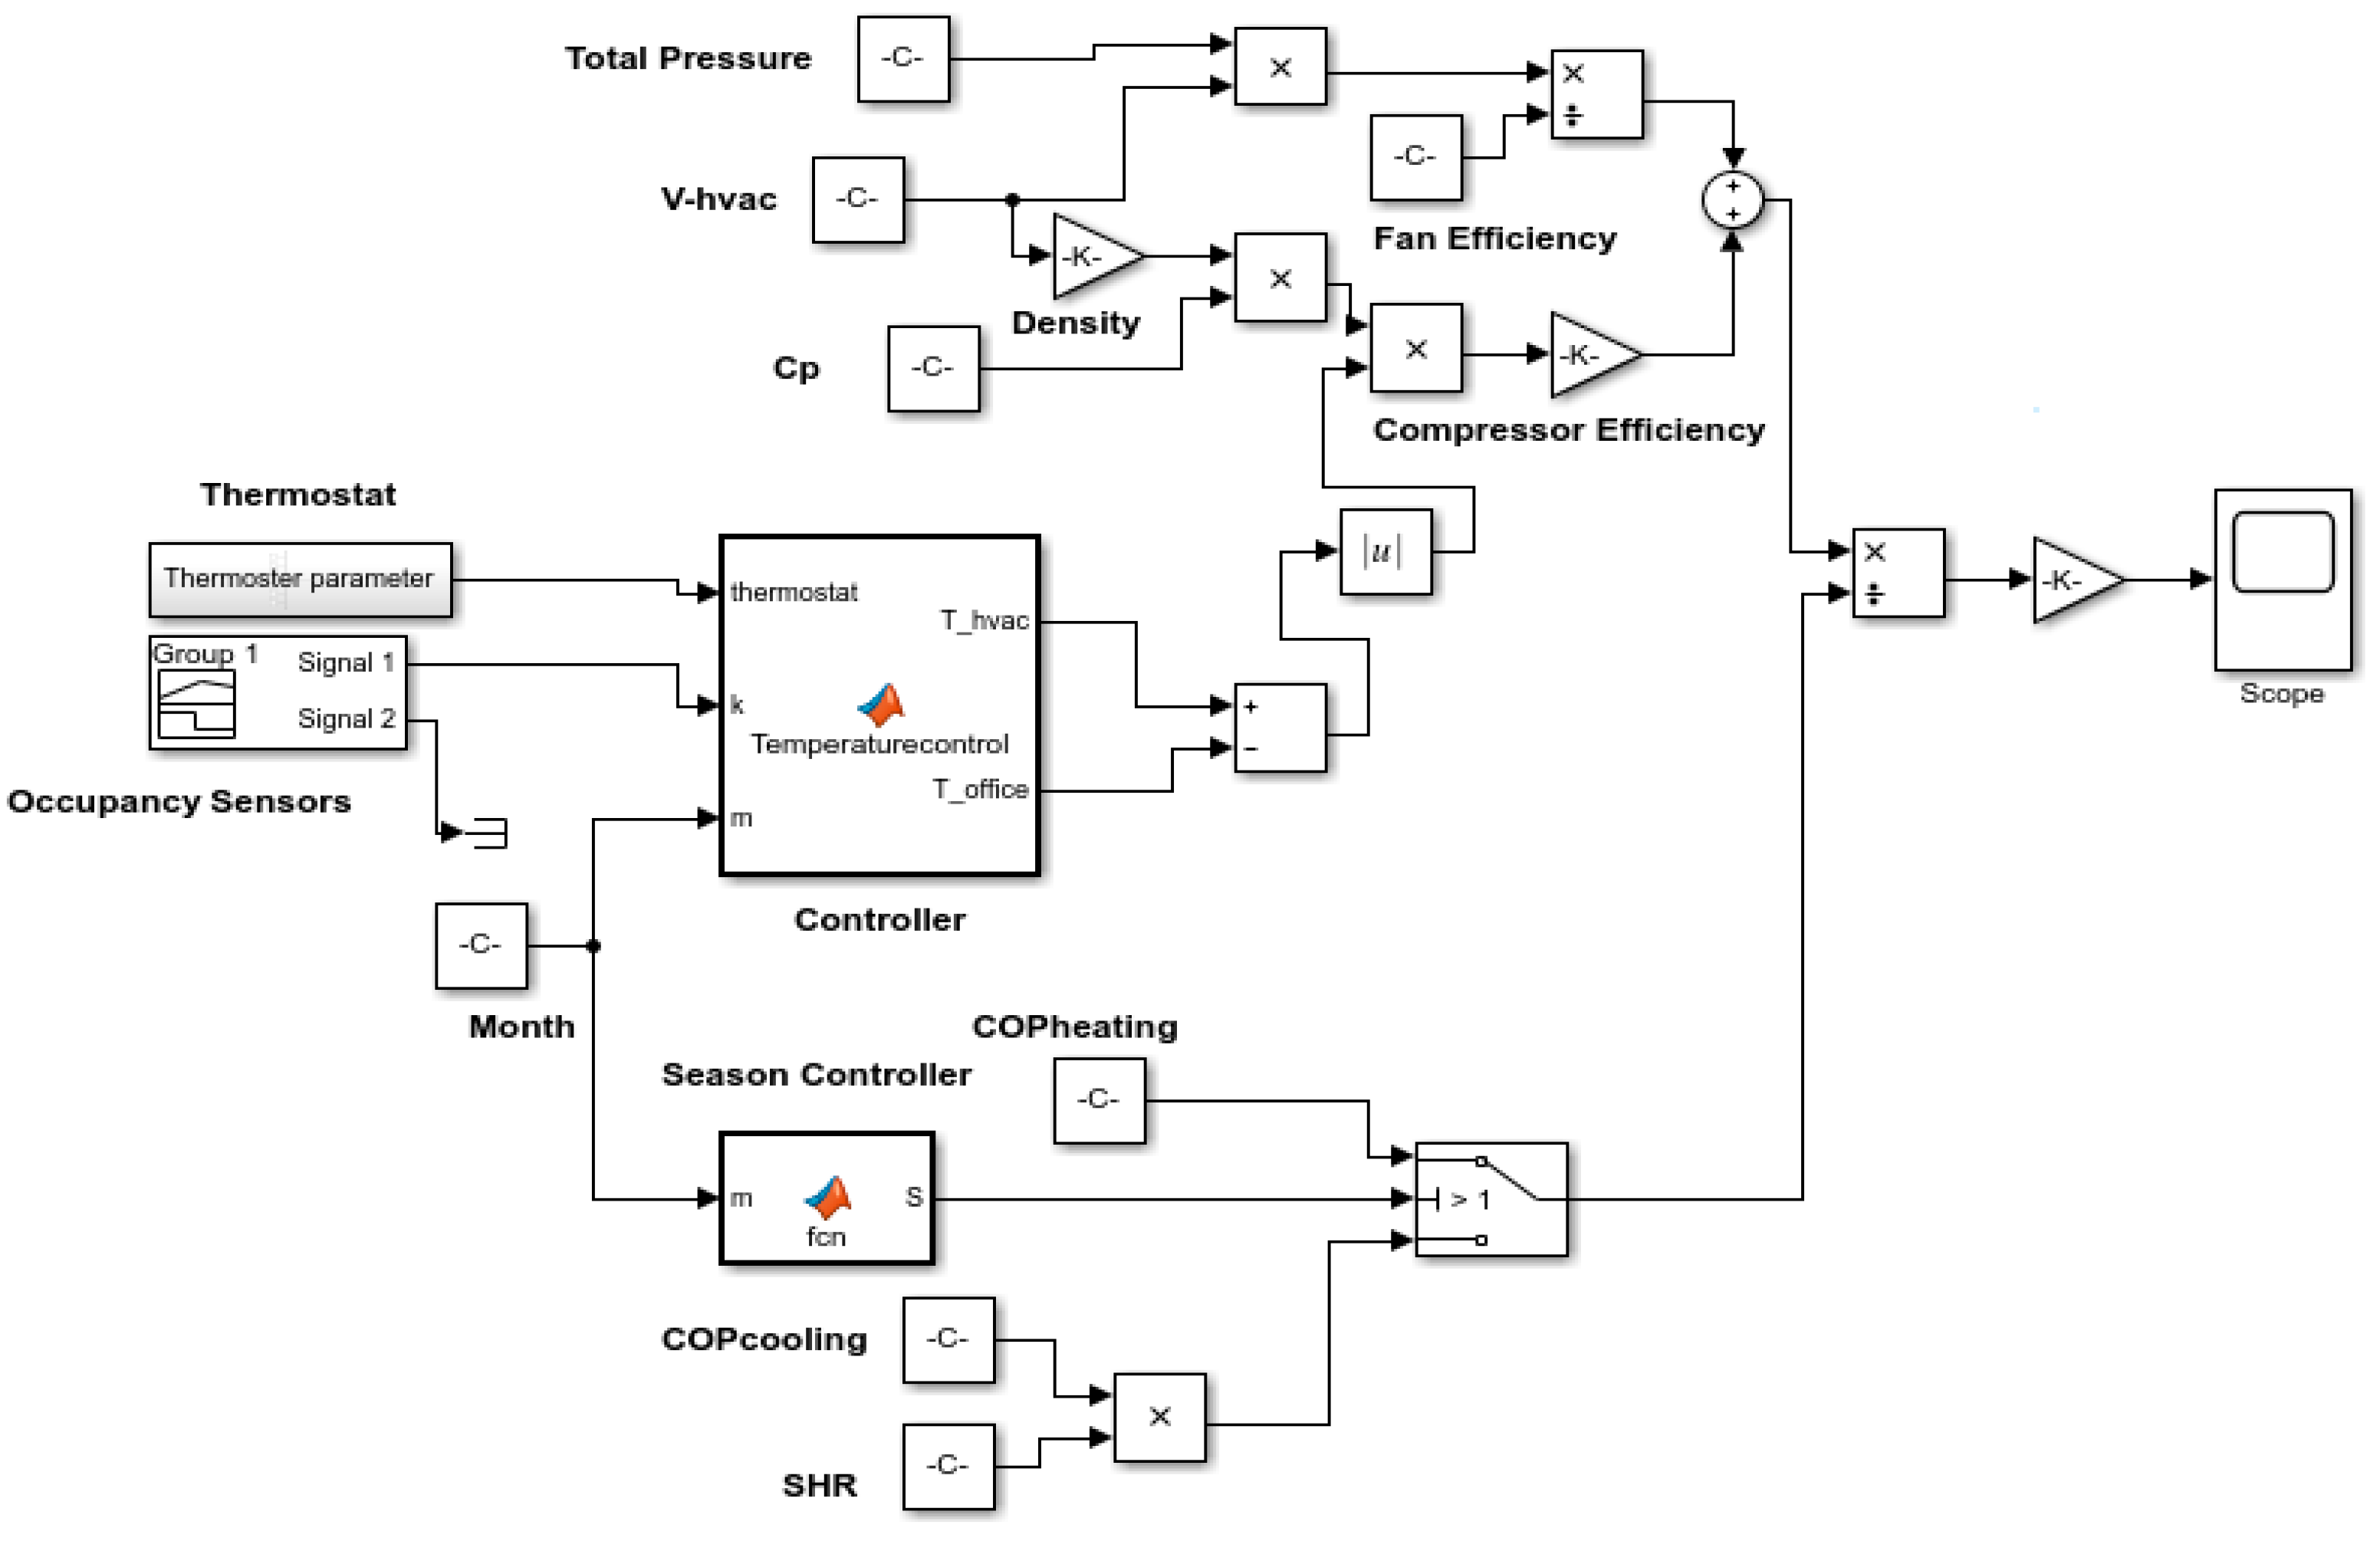
2.1. Office HVAC Energy Model Based on Temperature

Based on the fundamental principles of thermodynamics and heat transfer, a control volume analysis of the HVAC was conducted as shown in Figure 1.
The HVAC energy consumption is divided into two—the energy consumed by the fan when the compressor is off and the power consumed by the entire system when the compressor and the fan are ON. In the above schematic diagram, the electric energy consumed by the fan E f can be computed as follows [28]
E f = V ˙ H V A C P t o t η
where η is the fan efficiency and V ˙ H V A C is the air volume flow rate of the fan P t o t the total pressure of the fan.

2.2. Office HVAC Energy Consumption Model during Winter and Summer

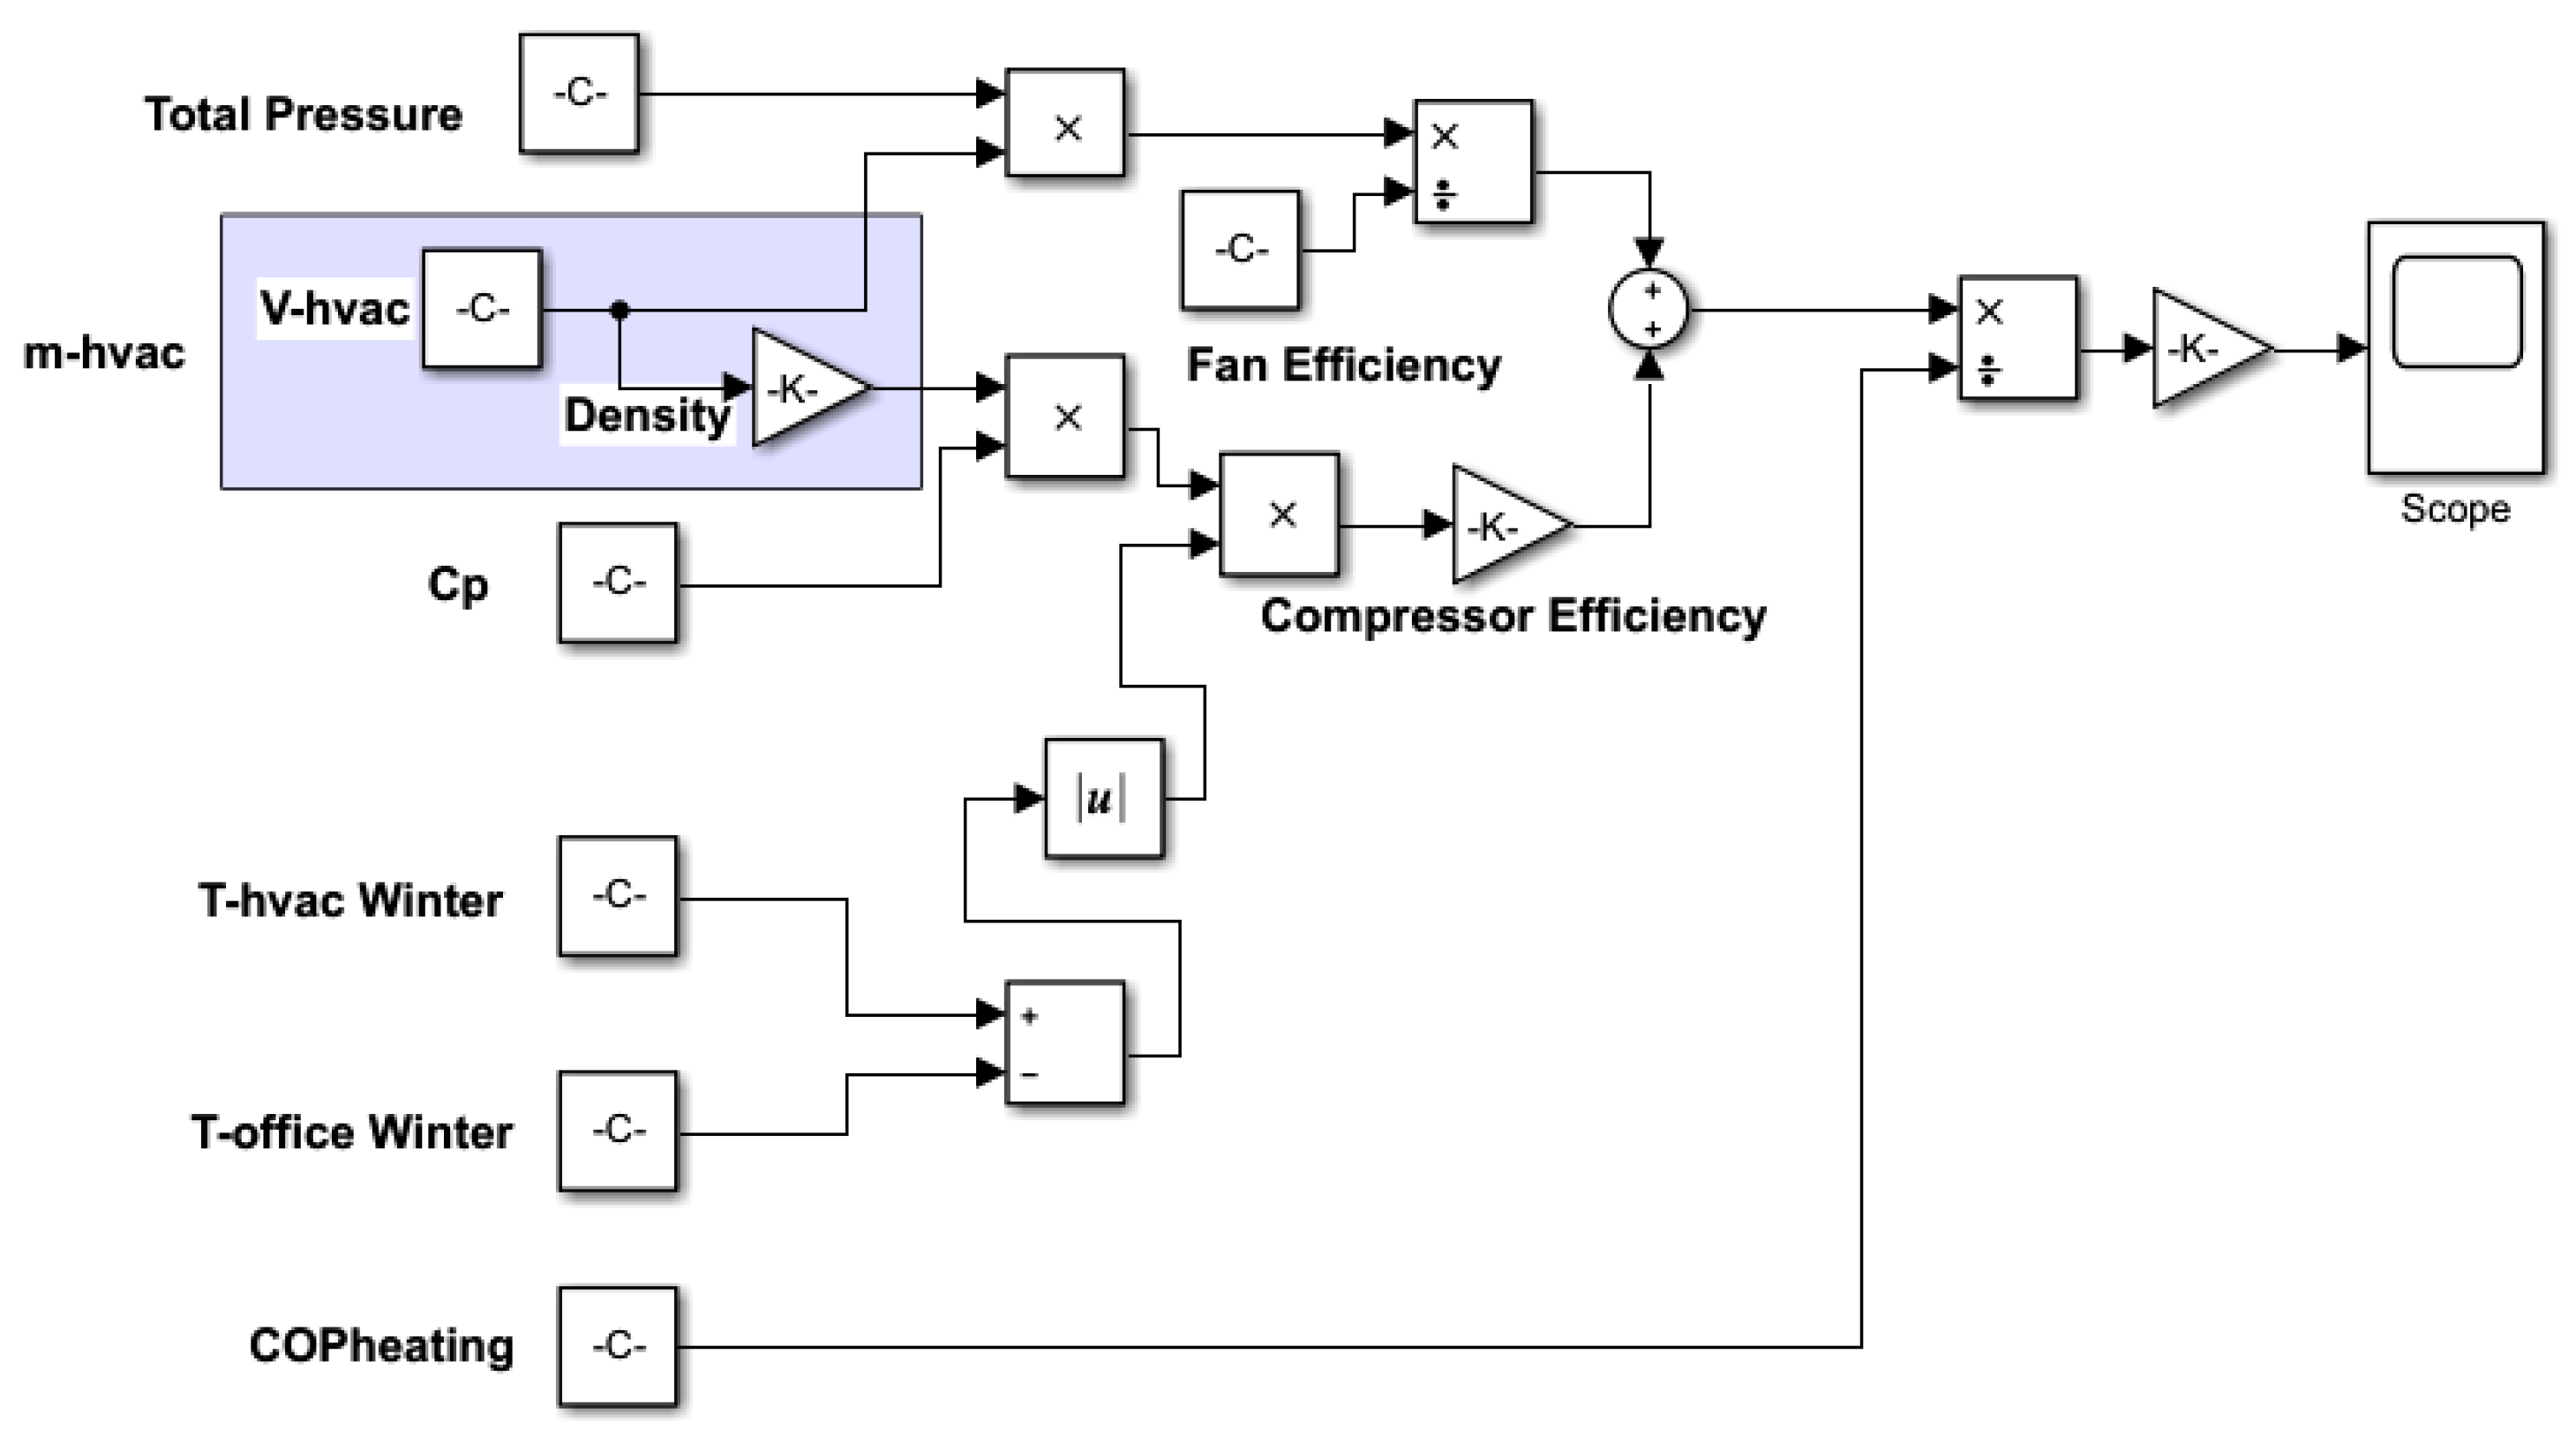
2.2.1. During Winter

Based on the heat transfer principle, the heat energy is defined as follow [29]
Q H   =   m ˙ H V A C C p ( T H V A C T o f f i c e )
In Equation ( 2 ) ,   Q H is the heat energy transfer, = m ˙ H V A C is the mass flow rate, C p     is the air heat capacity and T H V A C and T o f f i c e are the HVAC temperature and the office temperature, respectively. The energy efficiency ratio (EER) of the air conditioner in heating mode is the ratio of the heating capacity to the input power and the coefficient of performance is the ratio of the heat energy output ( Q O U T ) to the input energy ( E H )
Q O U T =   Q H + E f
C O P h e a t i n g   =   Q O U T E H
Due to Equations (2)–(4), the energy consumed by the office during winter is determined as
E H =   m ˙ H V A C C p ( T H V A C T o f f i c e ) + E f C O P h e a t i n g
C O P h e a t i n g   =   E E R * 0.29307
Figure 2 is a schematic representation of the HVAC energy consumed in winter as simulated in MATLAB Simulink® so that different variables were constructed and represented as the block in Simulink in order to simulate the HVAC energy in winter.

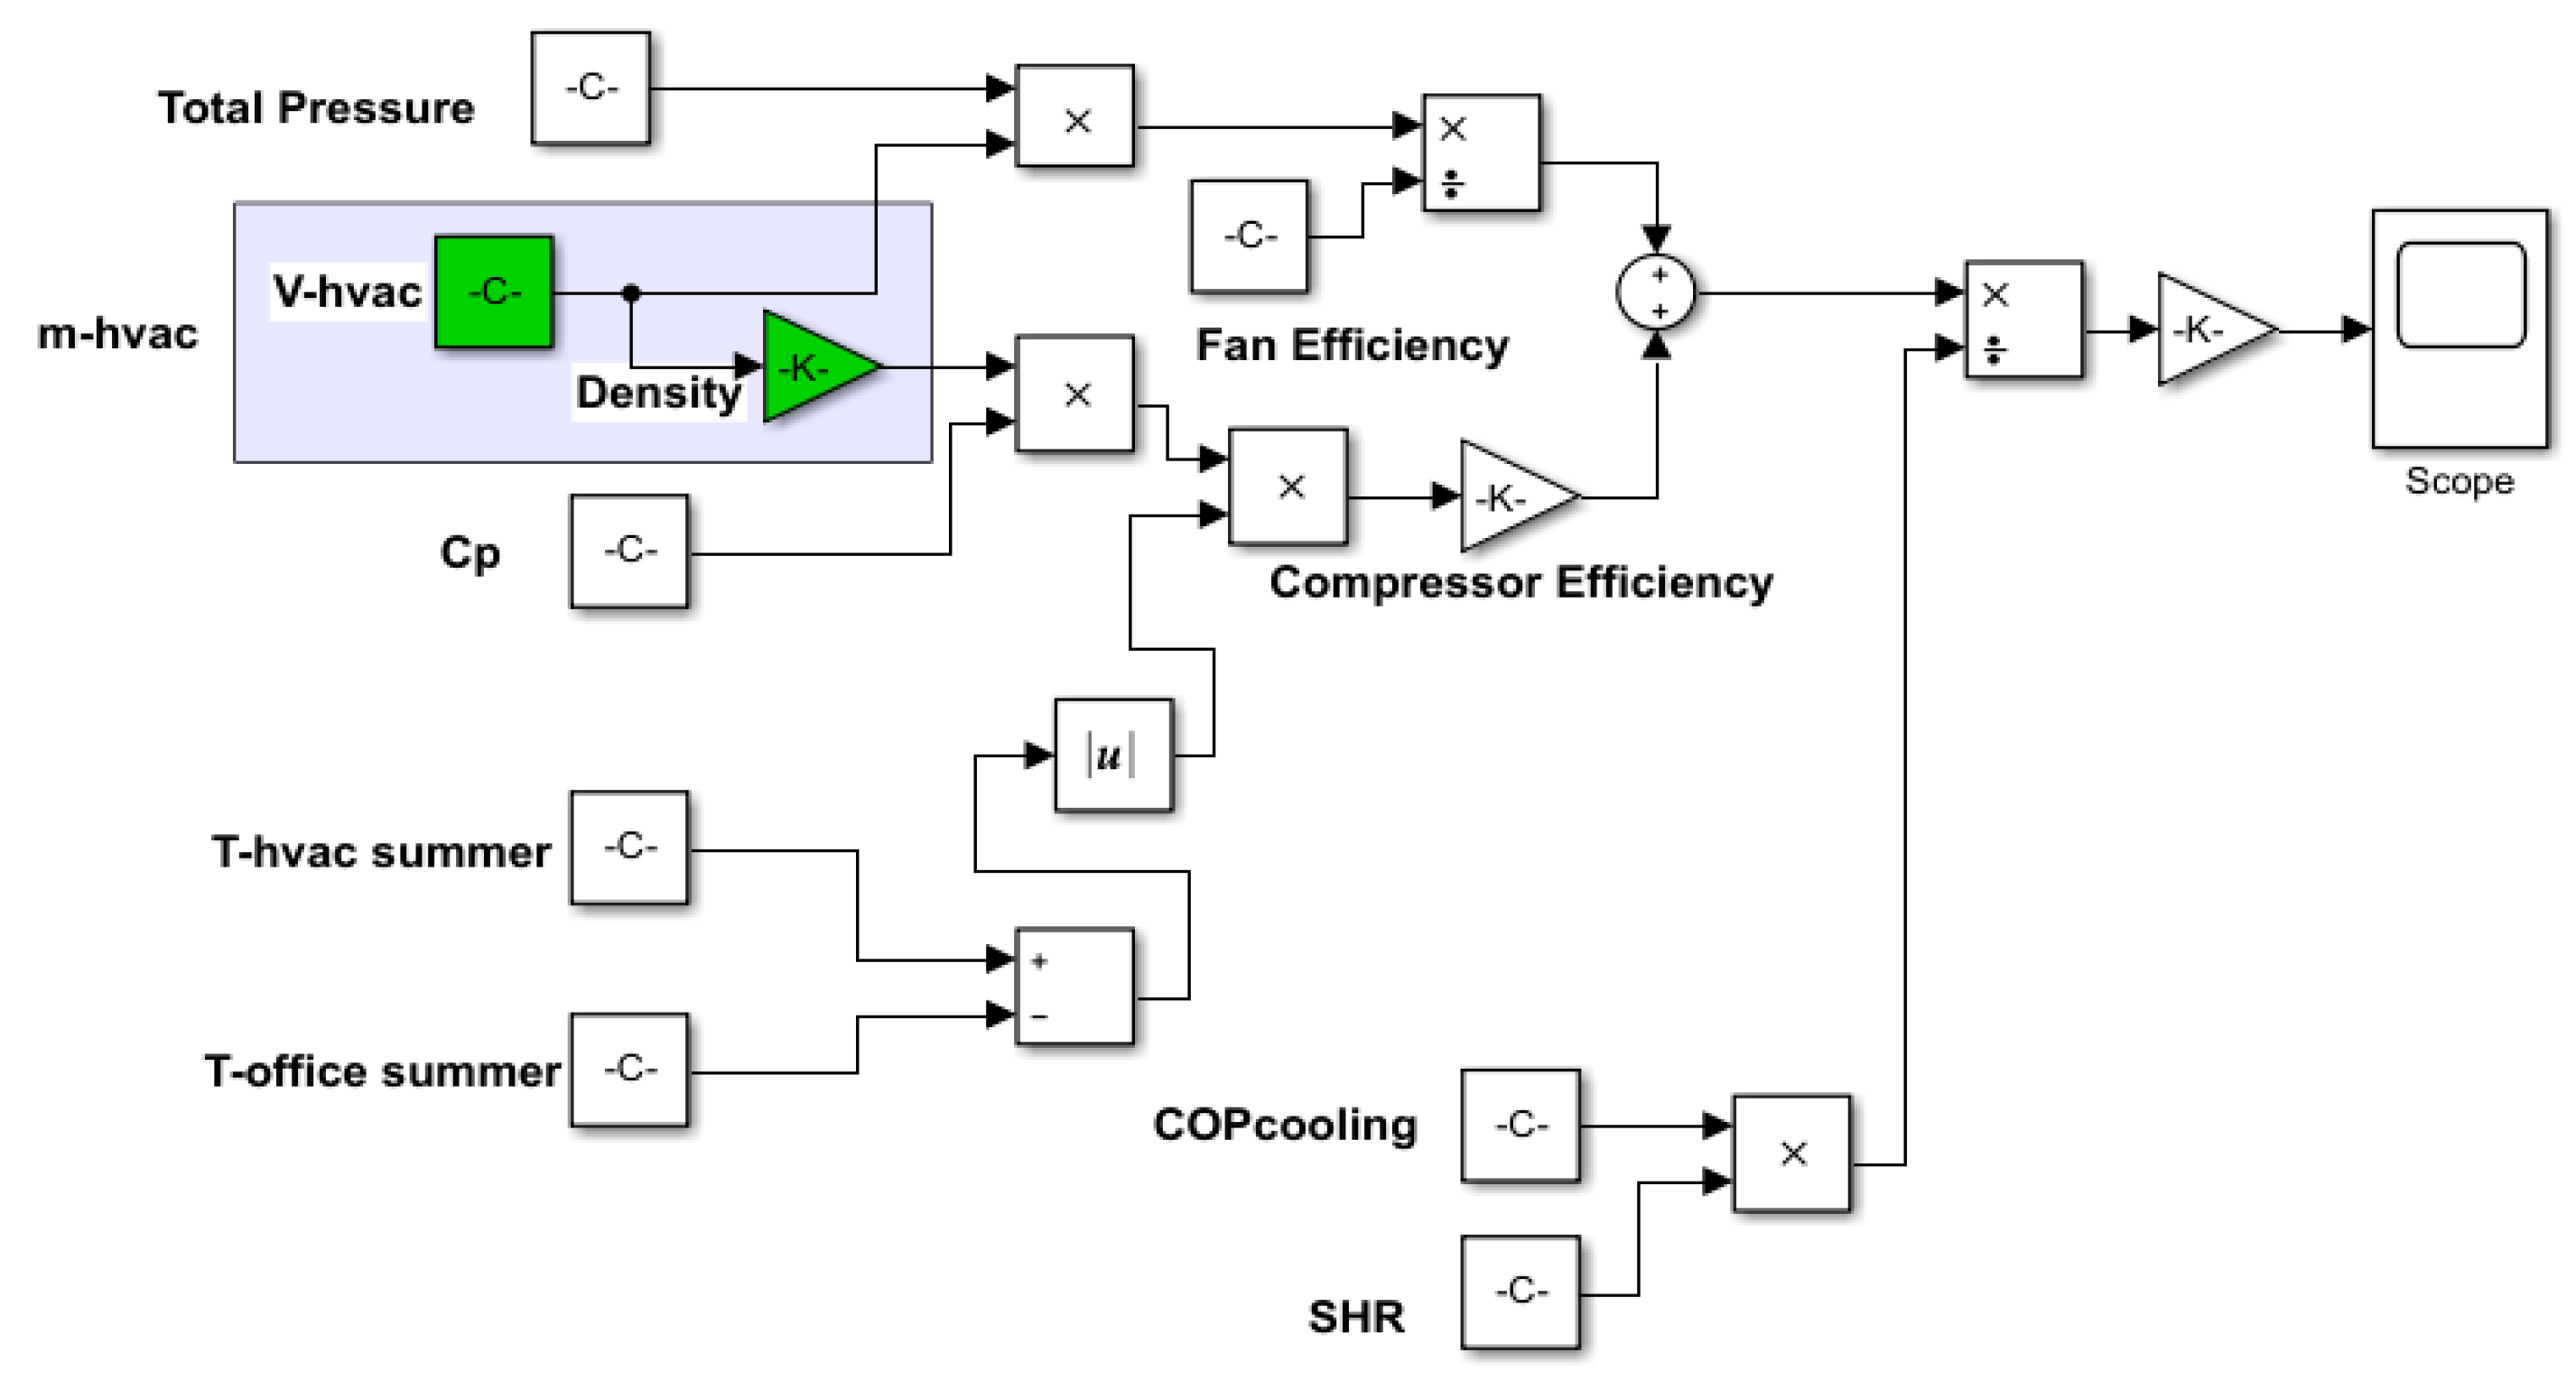
2.2.2. During Summer

Based on the split HVAC, the energy efficiency ratio (EER) of the air conditioner in cooling mode is the ratio of the cooling capacity to the input power and the coefficient of performance is the ratio of the cooling energy output ( Q O U T ) to the input energy ( E c ).
C O P c o o l i n g   =   Q O U T E c
From (2), (3) and (7) the cooling energy E c consumption (see Figure 2) during summer is modelled as:
E c   =   m ˙ HVAC C p ( T HVAC T office ) + E f   COP cooling * SHF  
COP cooling   =   EER * 0.29307
where EER is the Energy Efficient Ratio which in this case is the ratio of cooling capacity (Btu) of a required HVAC to it input power. Where SHR is the sensible heat factor which is the ratio between sensible heat load and the total heat load of the office room
The simulated model was built in Simulink (Figure 3) where independent variables were built as block and the result was shown by the scope.

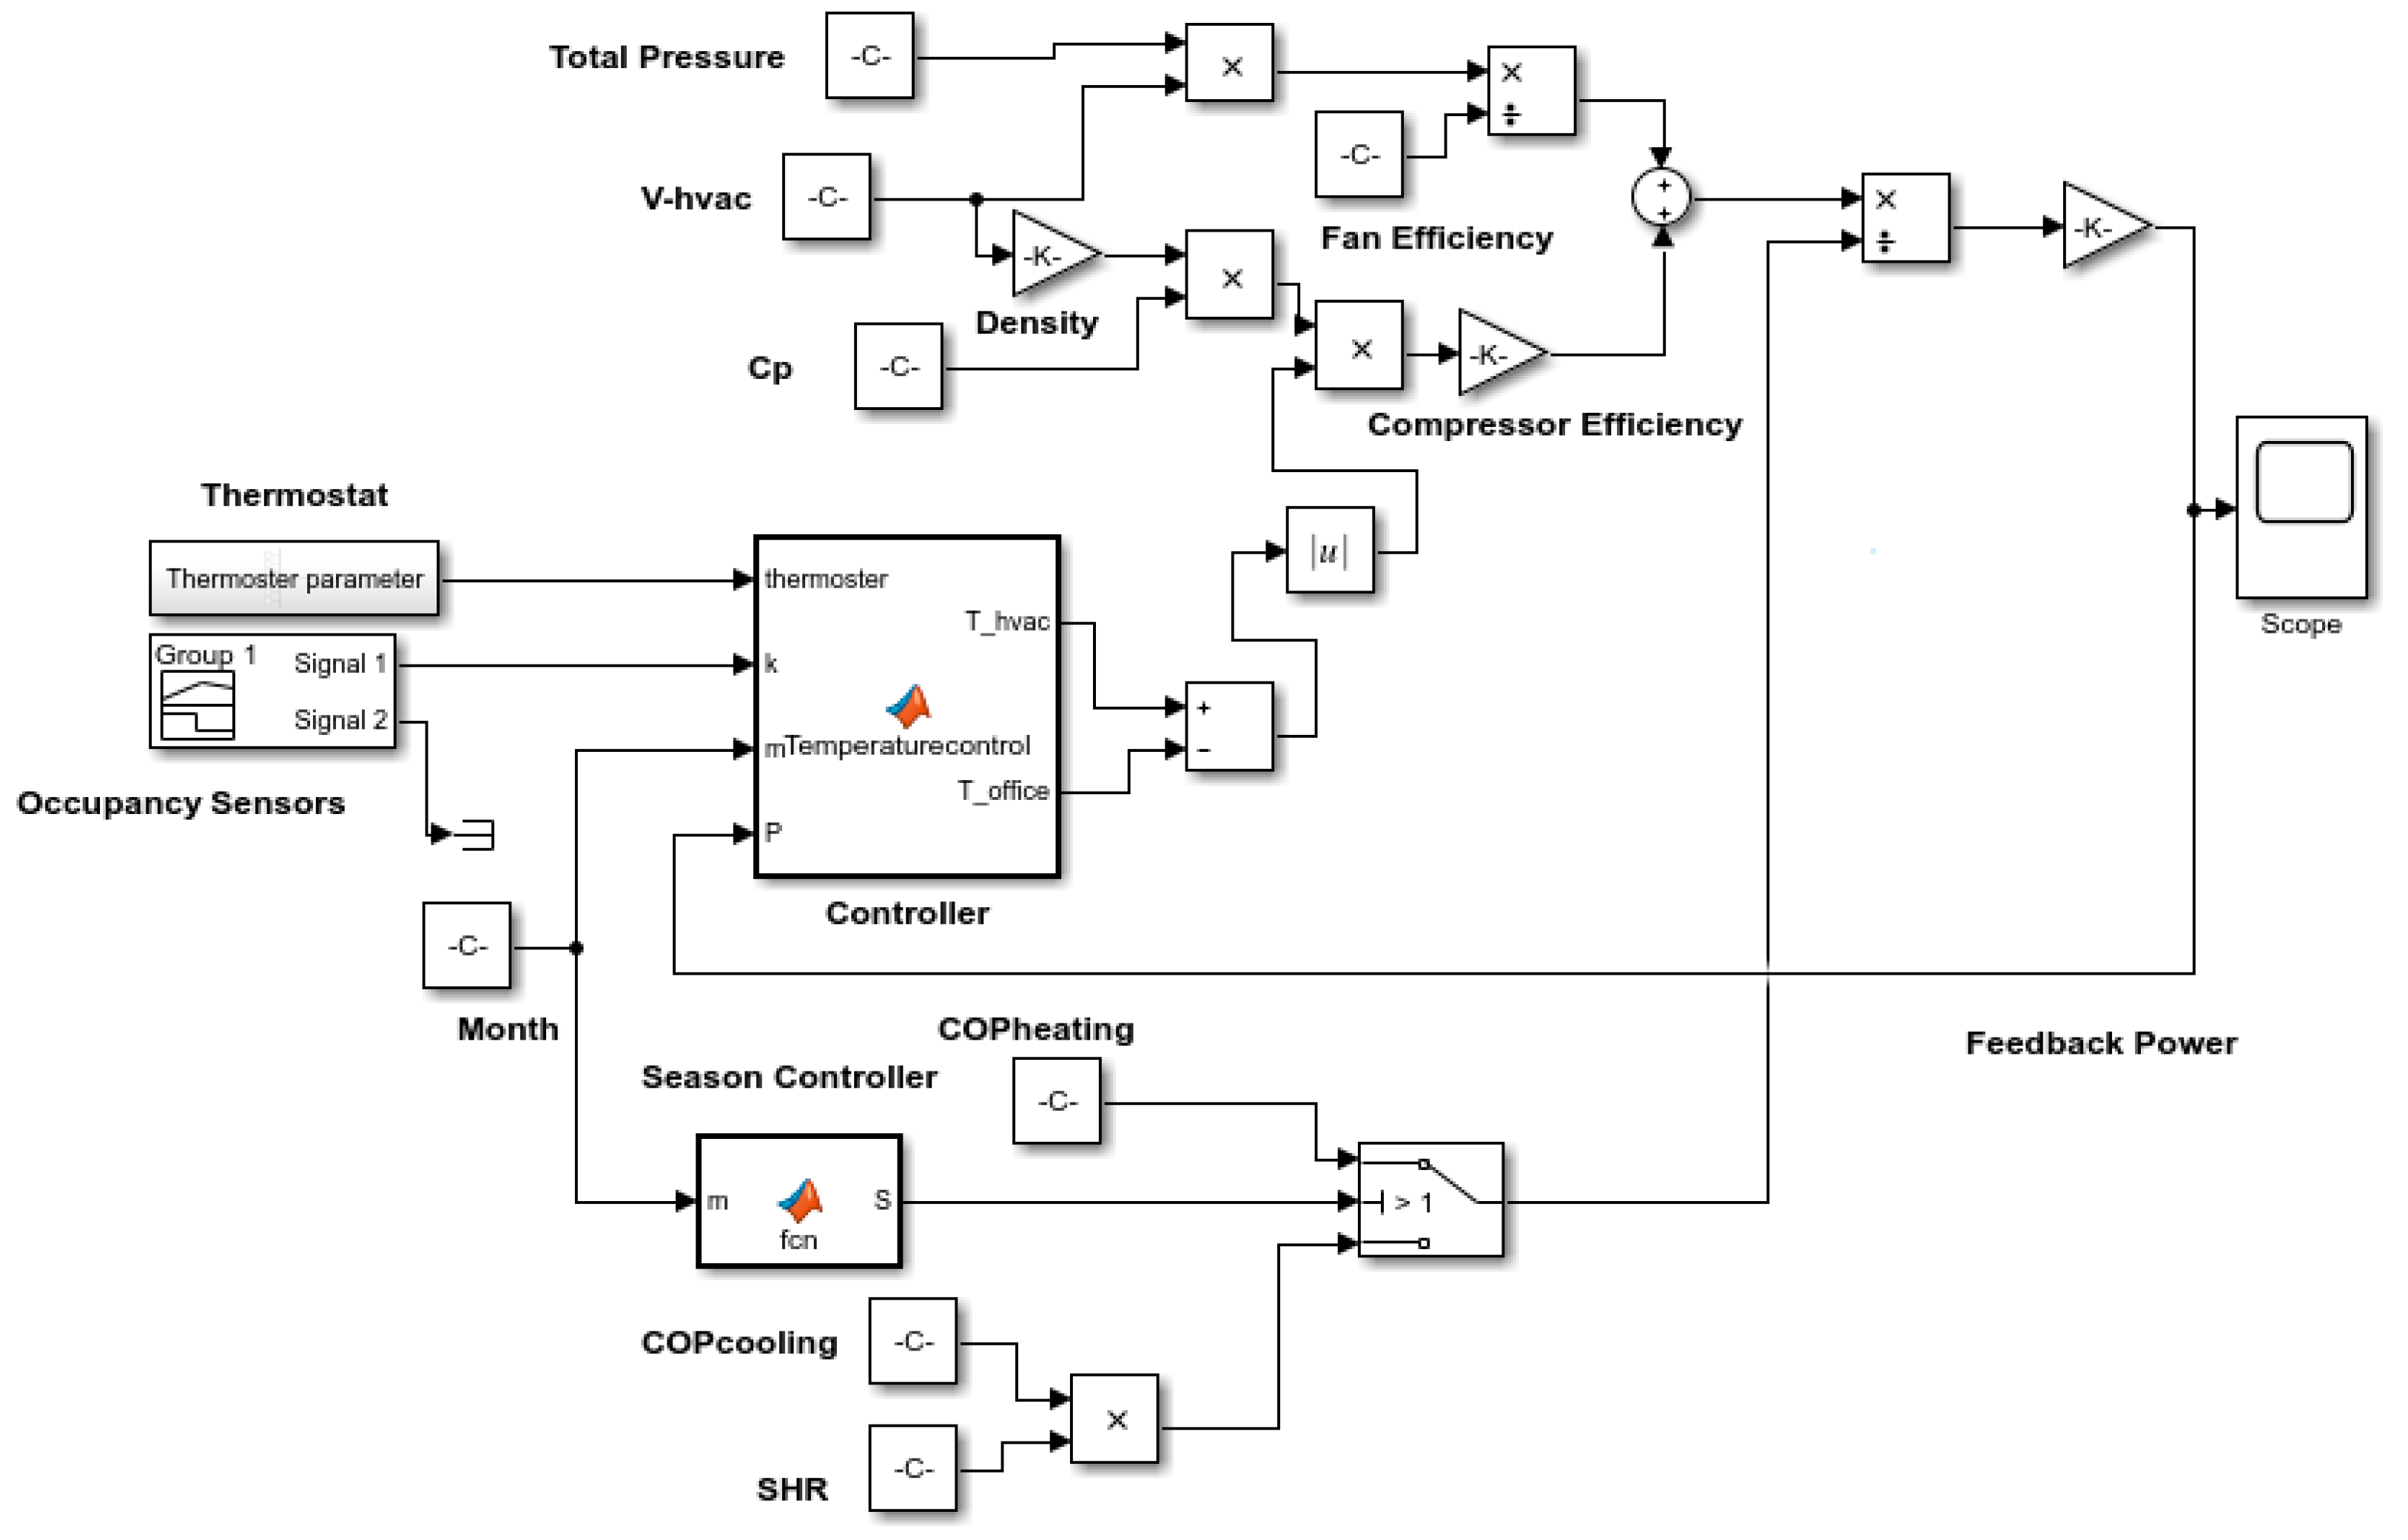
2.3. Office HVAC Energy Efficient Based on Occupancy Control, Temperature, Loads Control

Based on the above equation regarding the HVAC office energy, consumption varies due to the office temperature changing and the occupancy behaviour.

2.3.1. Occupancy Control Strategy

To save the HVAC energy consumption in the office, the occupancy sensor is installed in the office in order to alert if the room is occupied (Figure 4) or when it is unoccupied (Figure 5). Therefore, let k ∈ {0, 1} be defined as the state variable for the occupancy sensor and the HVAC by:
k t = { 1 i f   o f f i c e   =   o c c u p i e d 0 i f   o f f i c e = u n o c c u p i e d
The presence of this sensor permits a schedule based on human activity in an office and the working hours to be drawn. The thermostat control strategy must be designed based on the season or weather condition, the occupancy sensor and the loads used.

2.3.2. HVAC Temperature, Occupancy, Weather, Loads Control Strategy in Summer and the Impact on the Energy Consumption

In summer, most office environments need to be cooled in order to reduce the heat. Thus, the temperature must be set in the cooling mode. In order to reduce the energy consumption, the temperature ( T o f f i c e ∈ { T c o l d   , T m d ,   T h o t }) needs to be changed based on the occupancy sensor and working hours and loads consumed; let E c be defined as the energy consumed during summer and w the energy consumed threshold. The control strategy can be expressed by:
T o f f i c e = { T c o l d   i f   k t = 1 , E c <   w T m d i f   k t = 1 , E c   o t h e r w i s e T h o t i f   k t = 0 , E c < w
Due to the above condition, during summer the temperature rises, resulting in the environment being hot. However, the employee in the office needs to be comfortable. Based on the occupancy detector, the HVAC must be ON in the T c o l d   mode if the room is occupied— T c o l d   is the cooling temperature. When the office is not occupied, the HVAC should be in the T h o t (Figure 6) mode and this last mode is the technique to save the HVAC energy consumption during winter.
In case the HVAC electricity used is greater than the threshold value w, the HVAC must be ON in the T m d (medium temperature) mode (see Figure 7).
During summer, the HVAC energy consumed in an office when that office is occupied and when it is during, the working hour is derived as:
E c = m ˙ H V A C C p ( T H V A C T c o l d )   + E f C O P c o o l i n g * SHF , k t = 1 , E c < w
When the HVAC energy consumed in an office during summer is equal or above the threshold, the energy can be formulated as follows:
E c = m ˙ H V A C C p ( T H V A C T m d )   + E f C O P c o o l i n g * SHF , k t = 1 , E c   w
The electric energy consumed in an office during summer when the office is not occupied and when it is out the working period can be obtained from the following equation:
E c = m ˙ H V A C C p ( T H V A C T h o t ) + E f C O P c o o l i n g * SHF , k t = 0 , E c <   w
The schematic diagram above (Figure 6) was built and simulated in Simulink. It represents the HVAC energy controlled by occupancy, temperature and weather condition. The input variables were built with block and the controller block was programmed to manipulate different inputs in order to reduce the final energy consumed in summer.

2.3.3. HVAC Temperature, Occupancy, Weather, Loads Control Strategy in Winter and the Impact on the Energy Consumption

In winter, several offices’ environments need to be heated; in order to increase the heating, the temperature has to be set in the heating mode. In order to reduce the energy consumption, that temperature ( T o f f i c e ∈ { T c o l d ,   T m d ,   T h o t }) needs to changed based on the occupancy sensor and working hours load consumed; let E c be defined as the energy consumed during summer and w the energy consumed threshold. The control strategy can be expressed by:
T o f f i c e = { T h o t   i f   k t = 1 , E h <   w T m d i f   k t = 1 , E h   o t h e r w i s e T c o l d i f   k t = 0 , E h <   w
Offices need to be kept warm in winter in order to satisfy employee health requirements, so the occupancy sensor, the HVAC, must go ON in the T h o t   mode if the office is occupied, otherwise the HVAC must go ON in the T c o l d mode, which is the energy saving mode (see Figure 7). Thus, during winter when an office is occupied and when it is in the working interval time and the energy is less than the threshold, the HVAC energy consumed is derived as:
E h = m ˙ H V A C C p ( T H V A C T h o t ) + E f C O P h e a t i n g   f o r   k t = 1 , a n d E h <   w
And this can also be shown as follows:
E h = m ˙ H V A C C p ( T H V A C T h o t ) + E f C O P h e a t i n g
When the HVAC energy consumed in an office during winter is equal to or above the threshold w (Figure 6), the energy consumed can be formulated as follow:
E h = m ˙ H V A C C p ( T H V A C T m d )   + E f C O P h e a t i n g , k t = 1 , E h   w
In this situation, the output power is used as feedback to allow the controller to take a new decision, see Figure 8.
The electric energy consumed in an office during winter when the office is not occupied and when it is out the working interval can be obtained from the following equation:
E h = m ˙ H V A C C p ( T H V A C T c o l d ) + E f C O P h e a t i n g ,   for   k t = 0 , and E h <   w
The total HVAC electric energy used for cooling the office in summer for a day is
E T   =   E c   +   E h
Figure 7 represents the controlled HVAC energy consumed in winter or in summer simulated in MATLAB Simulink®. In this simulation, the weather season has been considered and the occupancy sensor, the temperatures have also been used as input and the loads consumed were also used as the feedback to the control.

2.4. HVAC Energy Saved due to Temperature and Occupancy Control and Loads Control

Based on the occupancy, loads and temperature control, the amount of electric energy saved in offices during a working day in summer can be summarized and is obtained from the following equations:
E c _ s a v e = n * m ˙ H V A C C p ( | T c o l d T h o t | ) C O P c o o l i n g * SHF ,   for E c <   w
Or
E c _ s a v e = n * m ˙ H V A C C p ( | T c o l d T m d | ) C O P c o o l i n g * SHF ,   for E c   w
n = number   of   offices
The amount of electric energy saved in offices during a working day in winter can be obtained by subtracting the energy consumed in winter when the office is not occupied from the energy consumed when the office is occupied; thus, the following equation is determined:
E h _ s a v e = n * [ E q u a t i o n   ( 15 ) E q u a t i o n   ( 18 ) ]
E h _ s a v e = n * m ˙ H V A C C p ( | T c o l d T h o t | ) C O P h e a t i n g ,   for E h <   w
Or
E h _ s a v e = n * [ E q u a t i o n   ( 15 ) E q u a t i o n   ( 17 ) ]
E h _ s a v e = n * m ˙ H V A C C p ( | T c o l d T m e d | ) C O P h e a t i n g ,   for E h   w

2.5. Data Collection

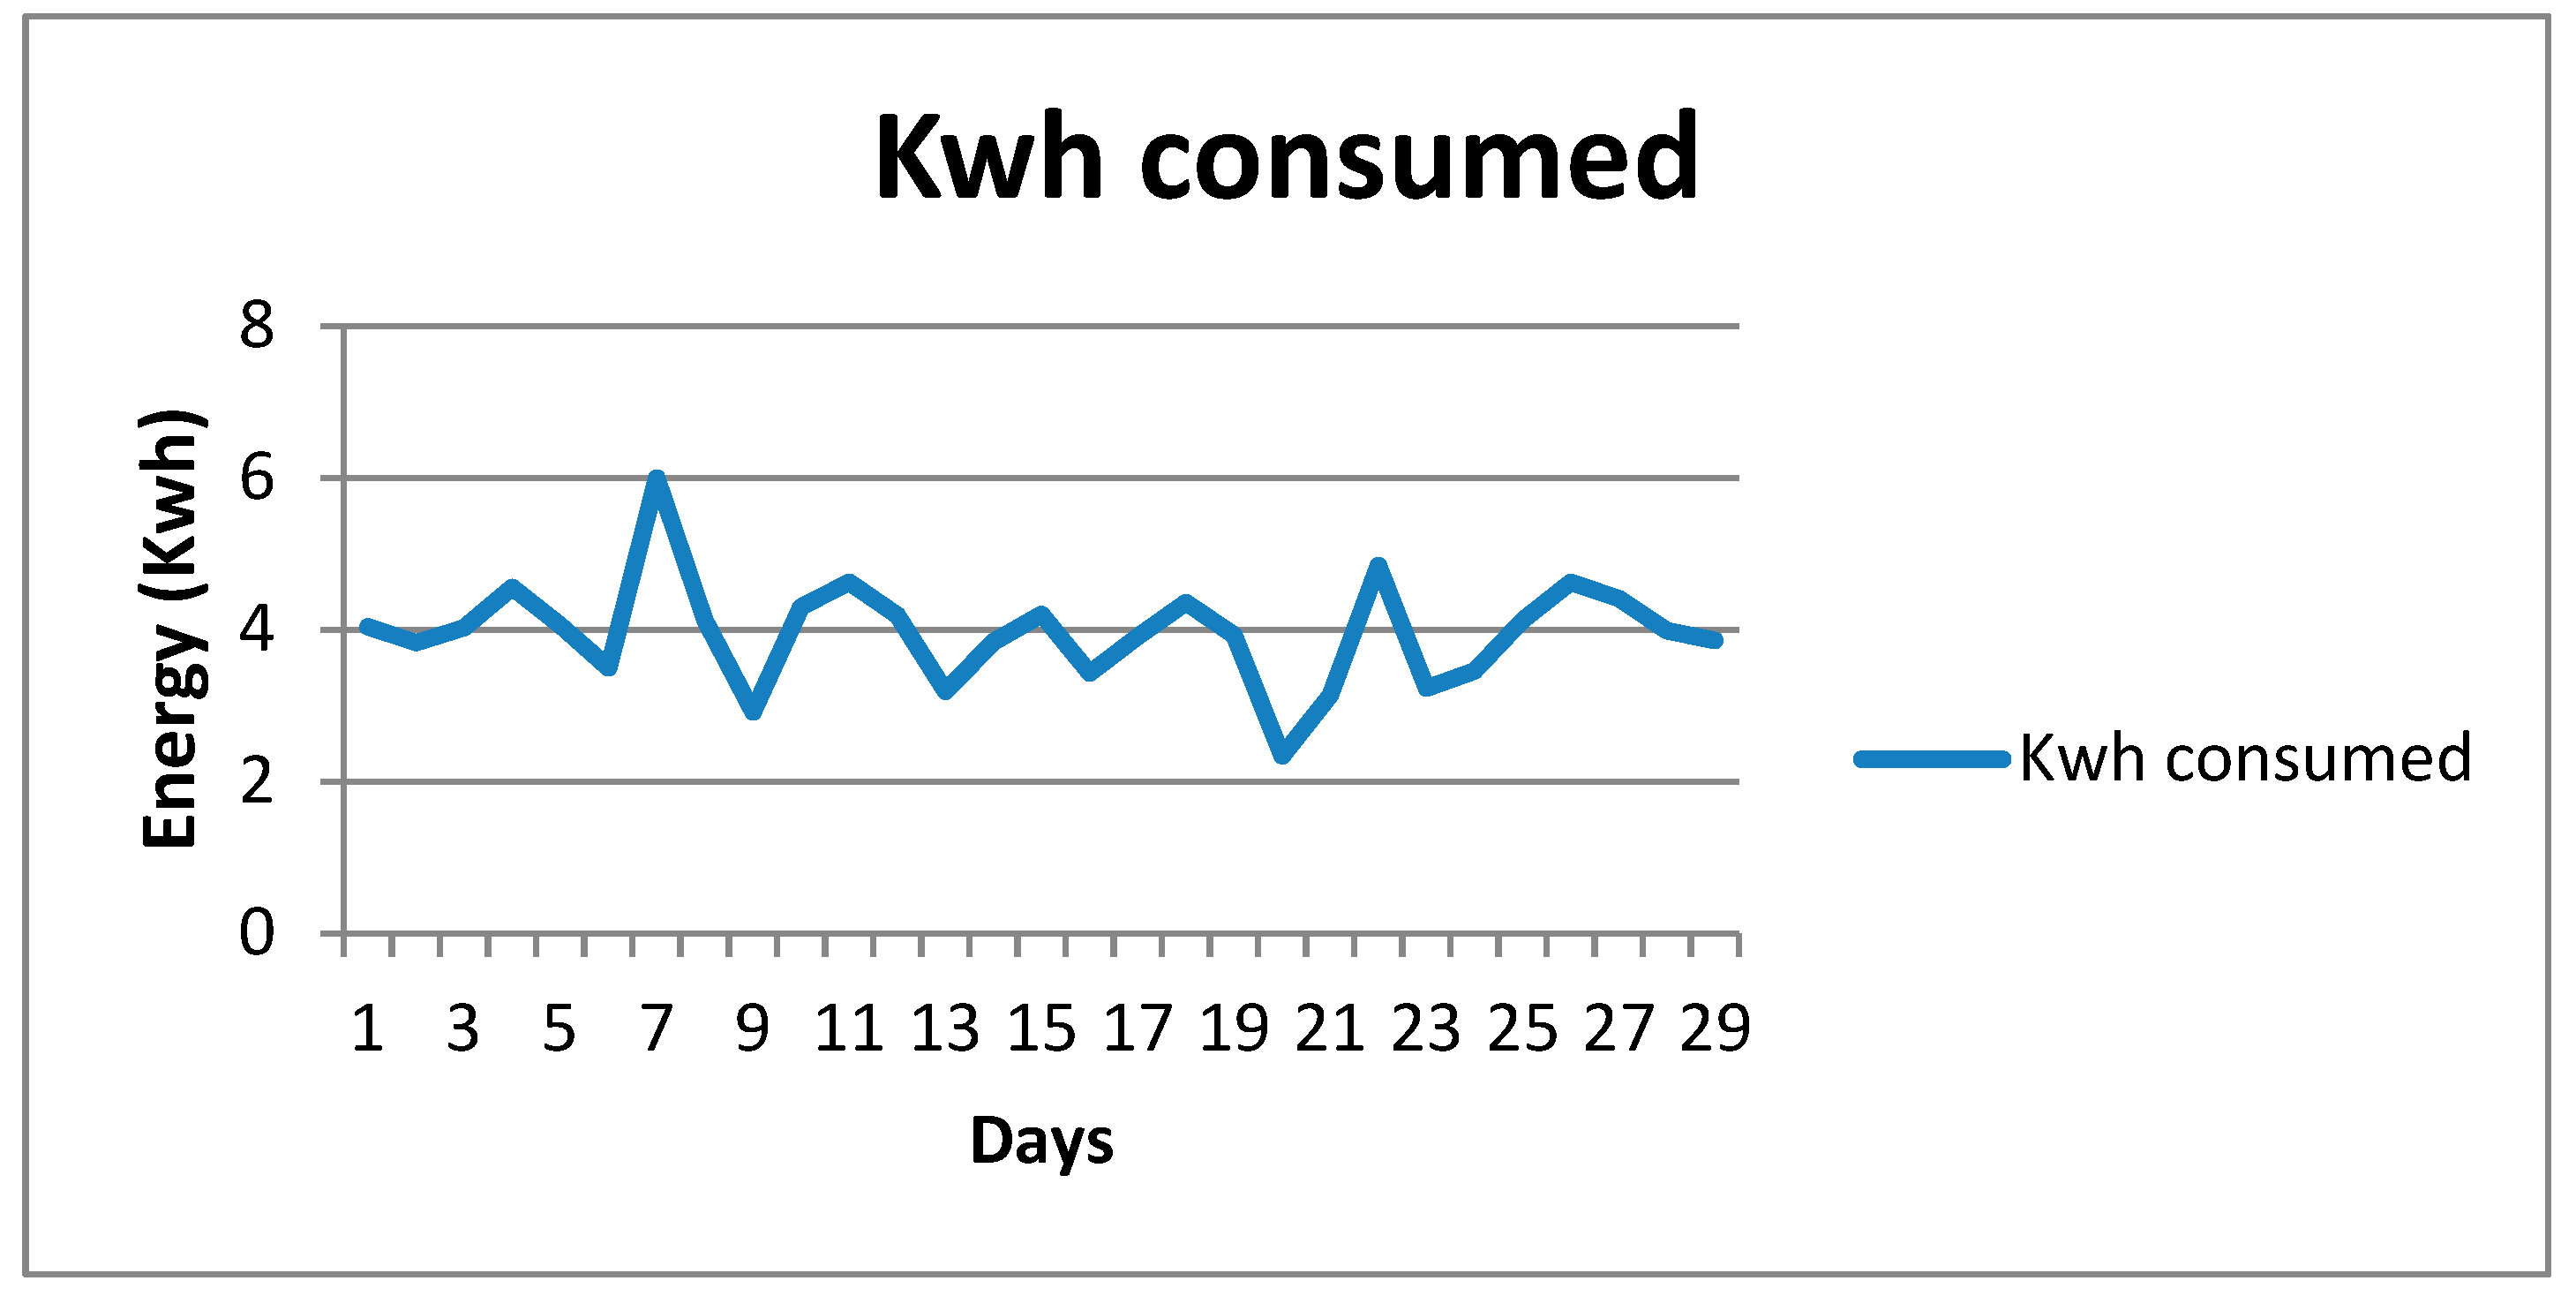
2.5.1. Light Energy Consumption Data Collection

In order to simulate the design, real data is needed, so the HEXING CIU EV-KP smart meter was used to collect daily data. The HEXING CIU EV-KP, (Figure 8) is a customer interface unit with a keypad for credit charging. It communicates with the metering unit by M-BUS (meter bus) for power energy consumption and credit balance monitoring, credit limitation and credit charging. This data was collected for one month from 5 fluorescent tubes in one of four offices in the building known as Lampropoulos Heights, in Pretoria.
As mentioned above, the graph in Figure 9 simply illustrates the lighting energy data collected.

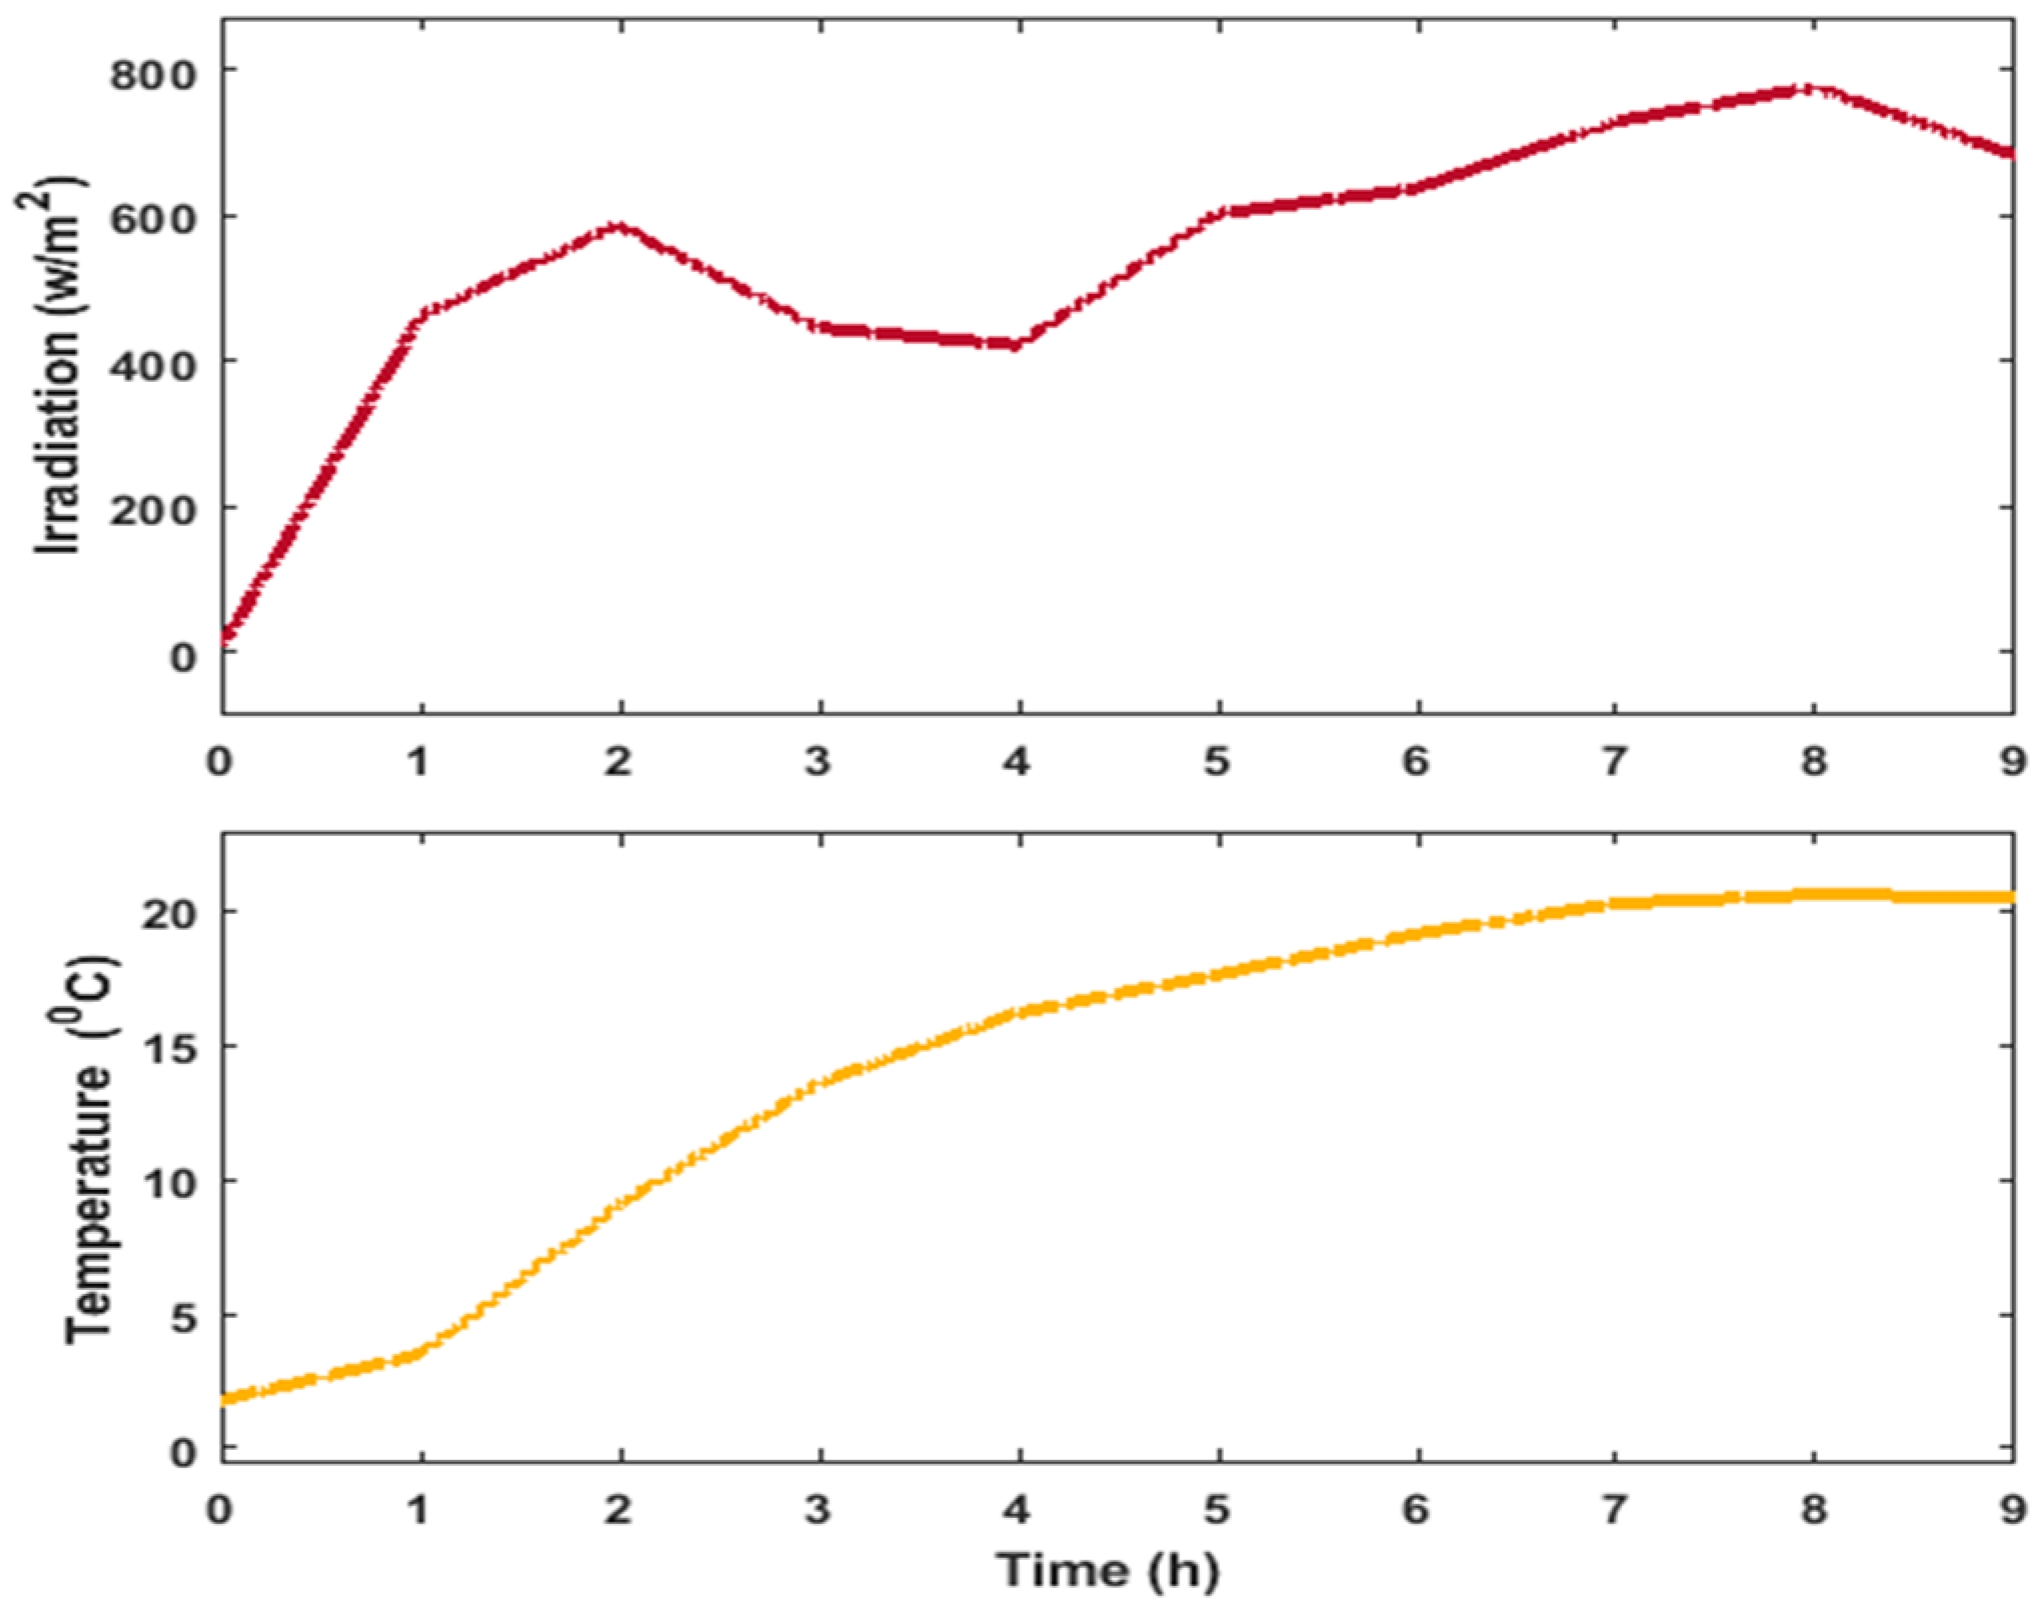
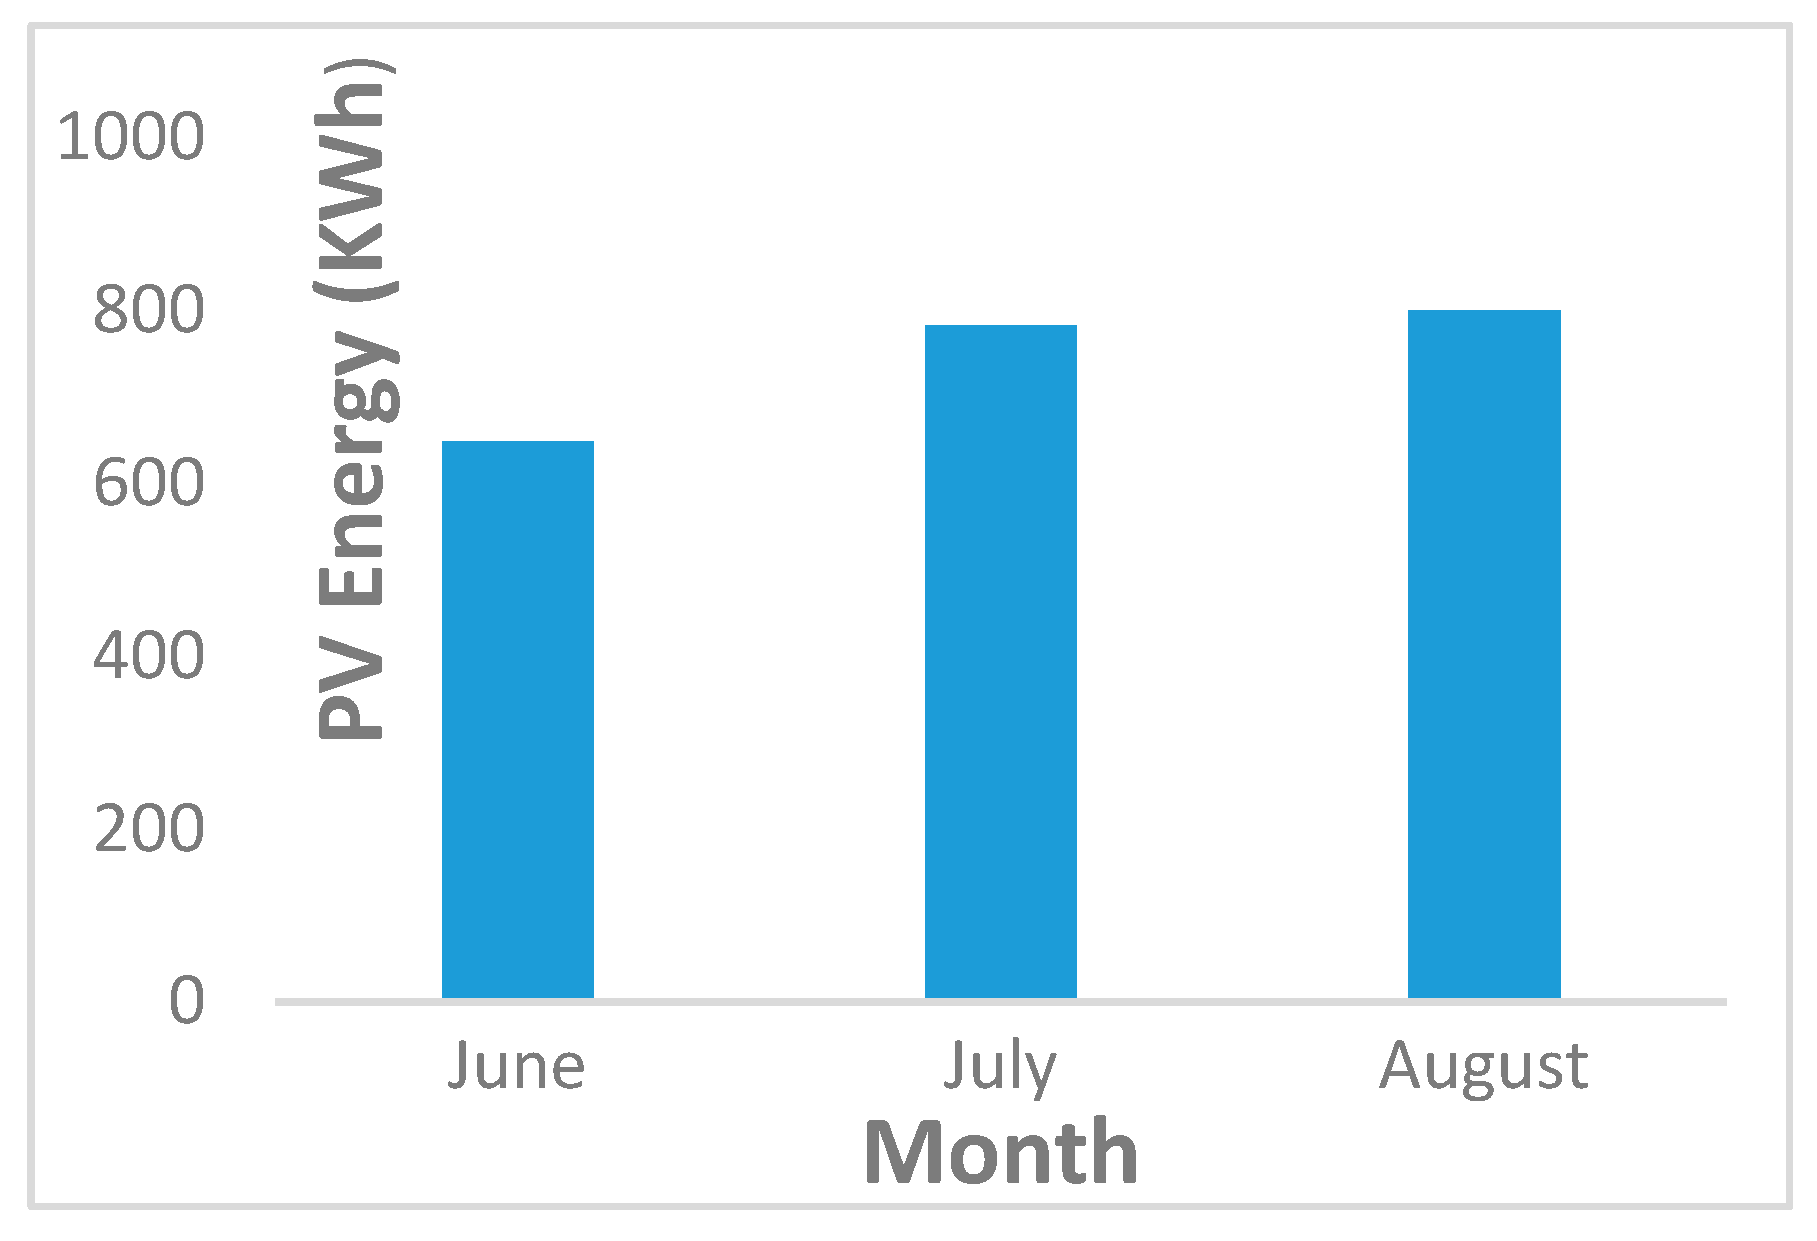
2.5.2. Solar Irradiation and Temperature Data Collection for PV Power Generated

To know what the performance of the PV is or what the maximum power that the PV can generate on a specific site or area is, we need to know the solar irradiation and the ambient temperature of the location. Twelve months of data were collected from the Eskom website in Aggeneis (Northern Cape region) Location: 29°17.721′ S 18°48.319′ E, Where the irradiation and temperature were collected each hour [30].

2.6. Lighting Energy Control Strategy

To establish a lighting energy control strategy in the office, workers movements or activities in and out the office was considered due to their lack of awareness on energy efficiency, they may not remember to switch off the lamp when they move out of the office. That lack of awareness has a distinct impact on energy usage.
Let P t be the power consumed by the lamp at time t, to alert if the room is occupied or unoccupied; let k ∈ {0, 1} be defined as the state variable for the occupancy sensor and the HVAC by:
k t = { 1 i f   o f f i c e     =       o c c u p i e d 0 i f   o f f i c e = N o n   o c c u p i e d
From the above state variable, the power consumed by the lamp can be determined as follows:
P L   = { P t i f   k t   =   1 0 i f   k t = 0
So, the office power lamp consumed is expressed as
P L =   P t * k t
The total energy consumed by the offices when the offices’ lamps are on, is expressed as
E l =   n   i = 1 t [ P i , 1 , P i , 2 , P i , 3 , P i , n ] * k i   * i
where n is the number of offices.

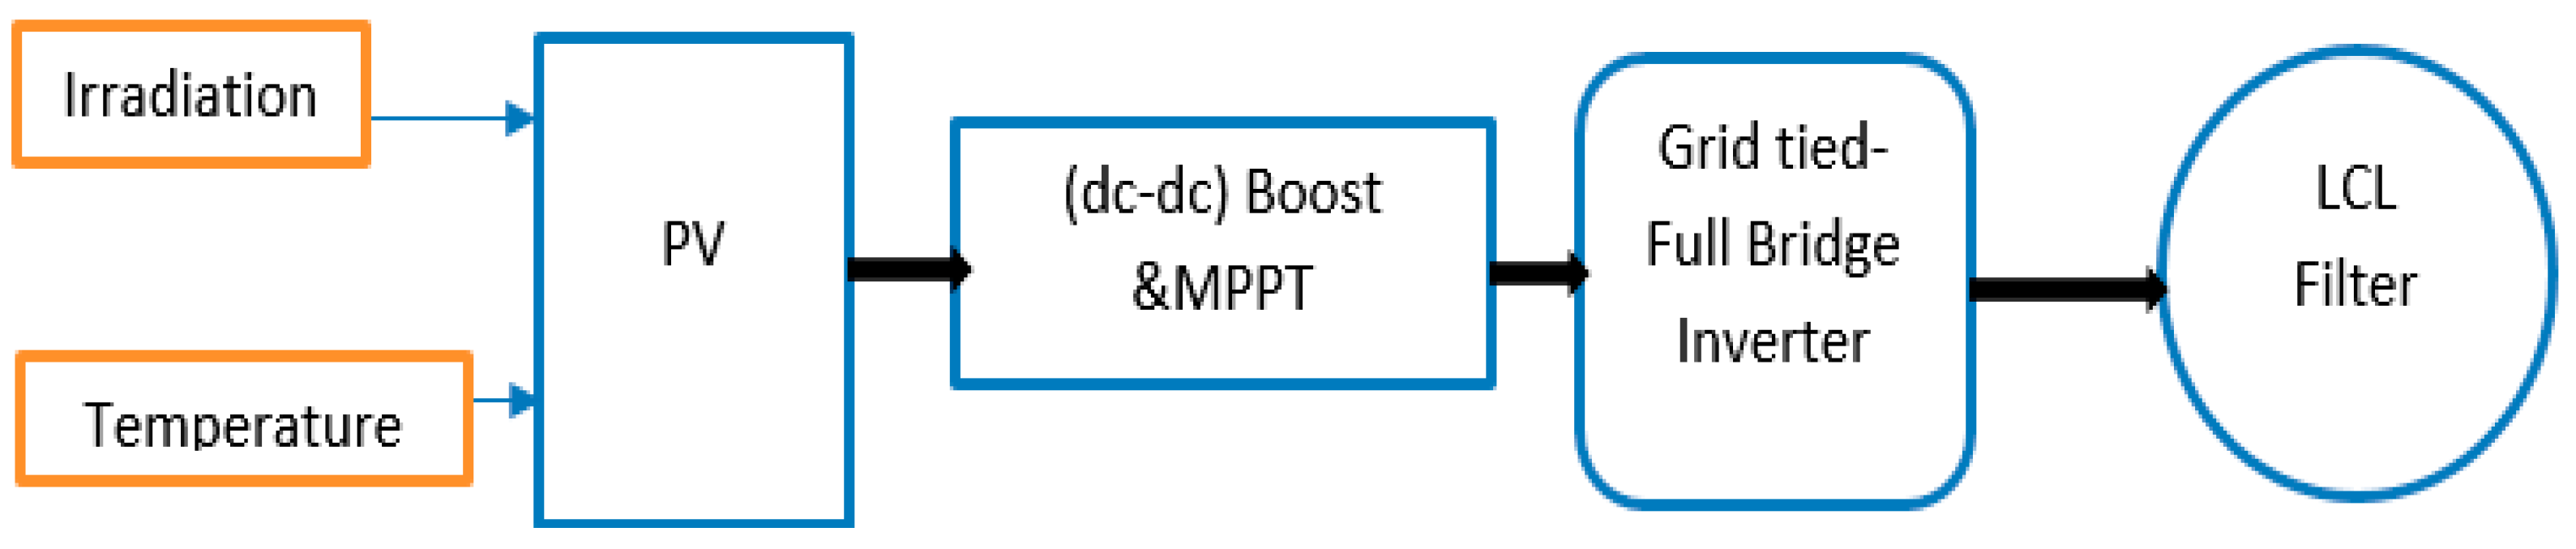
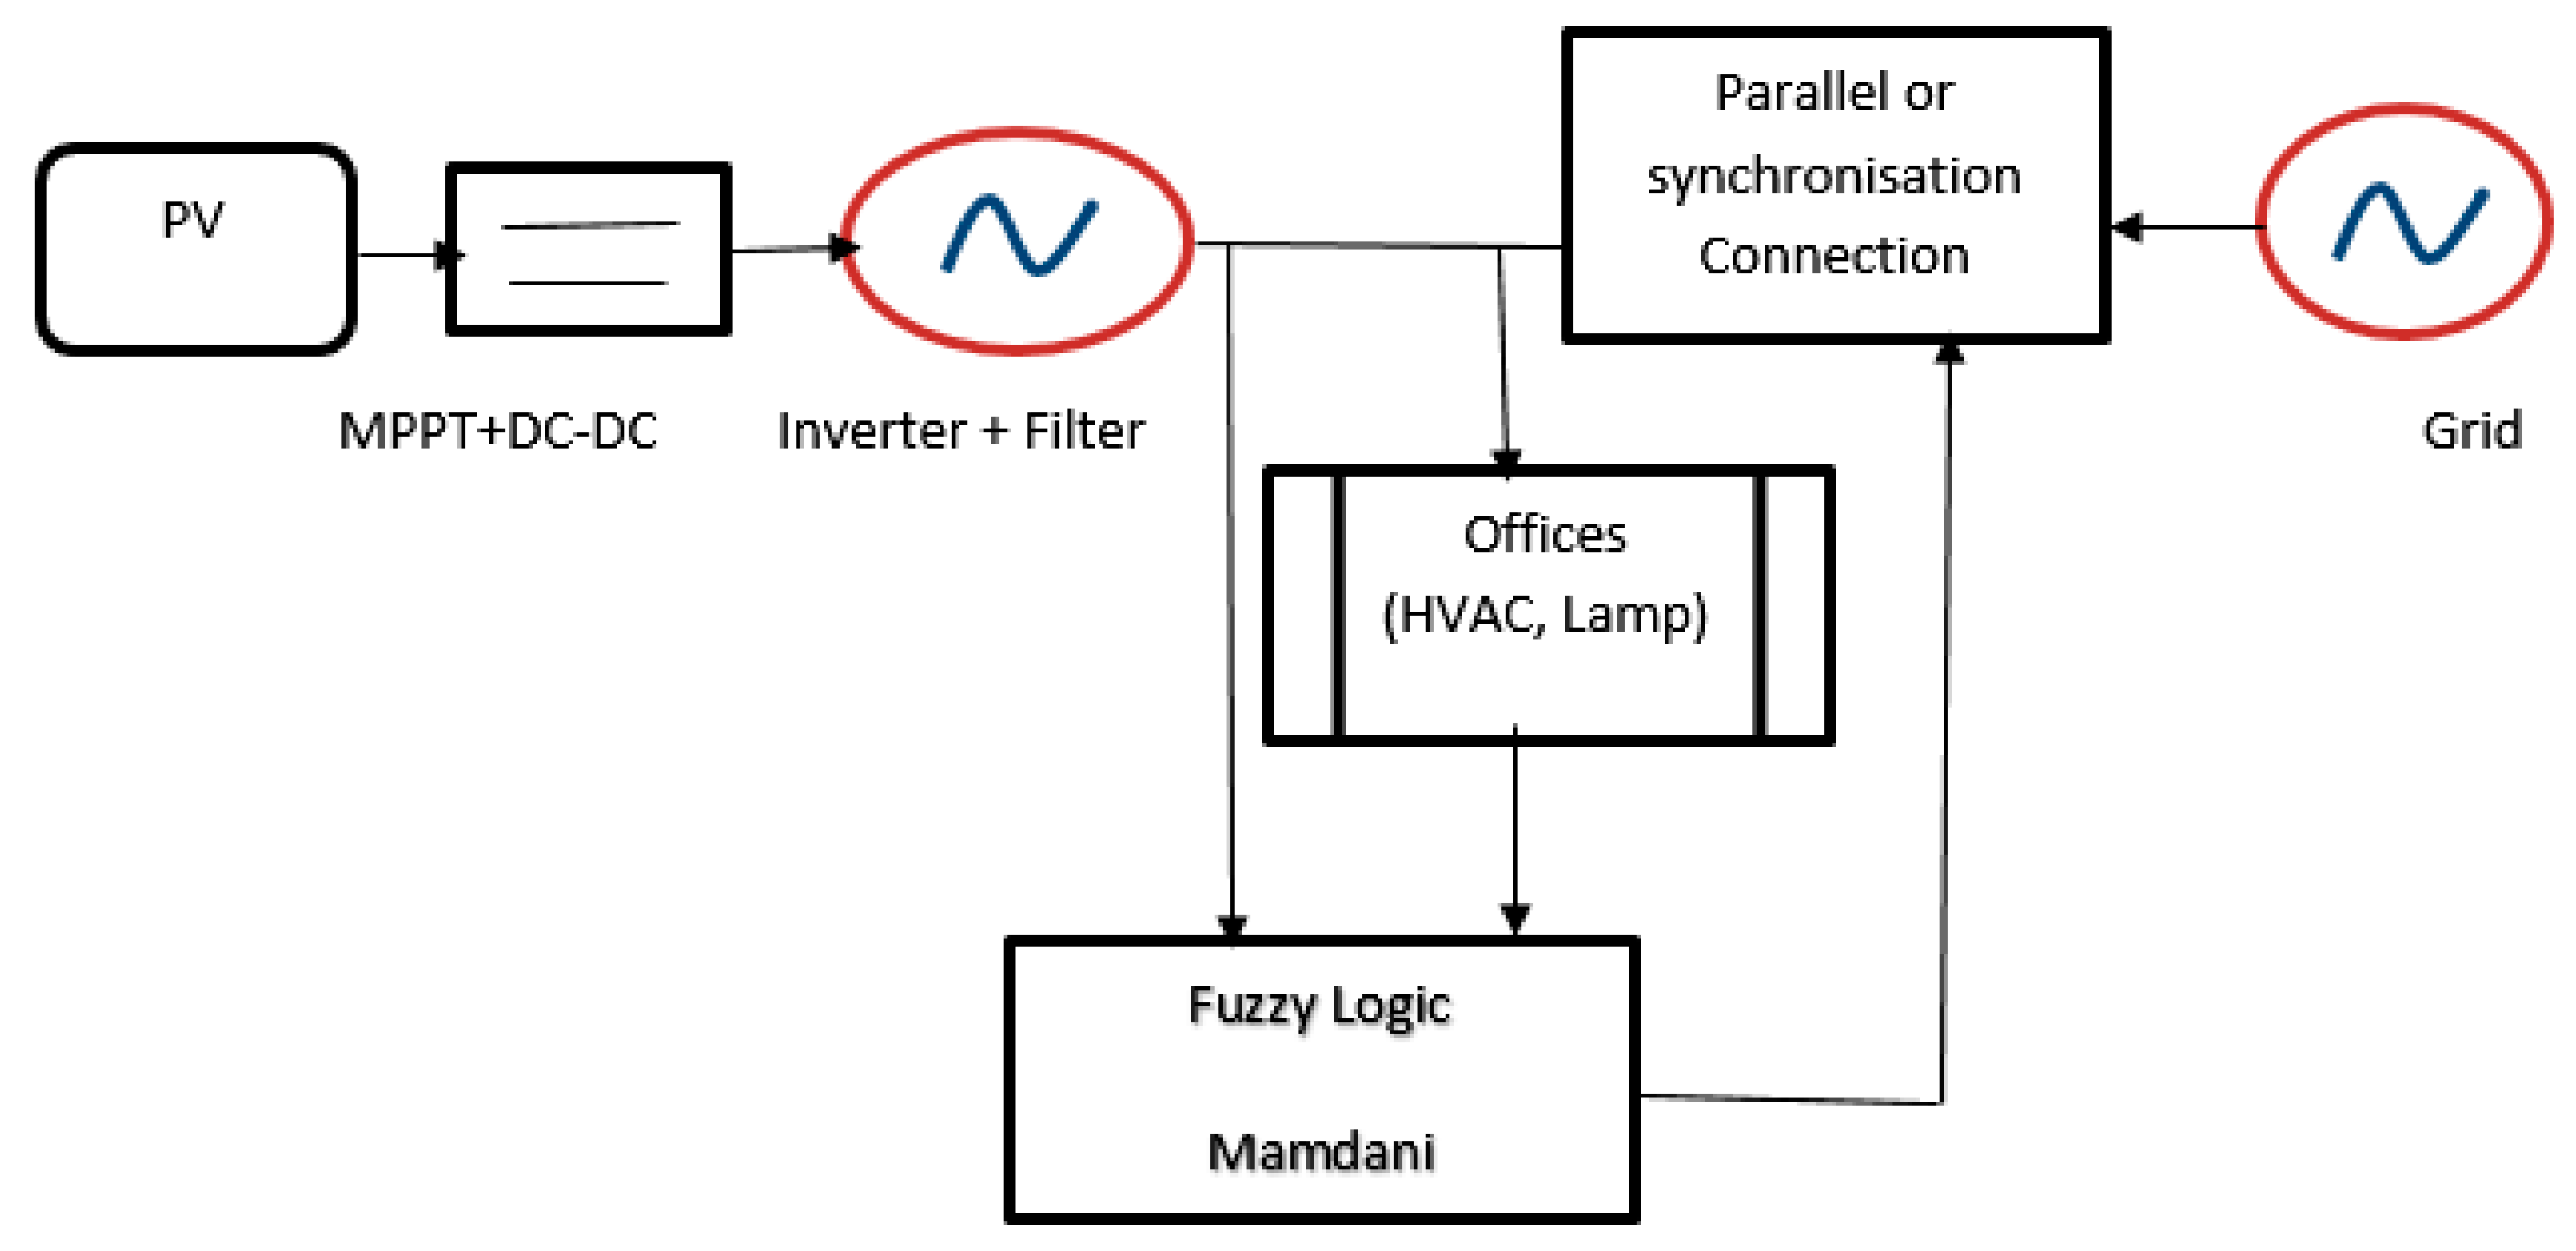
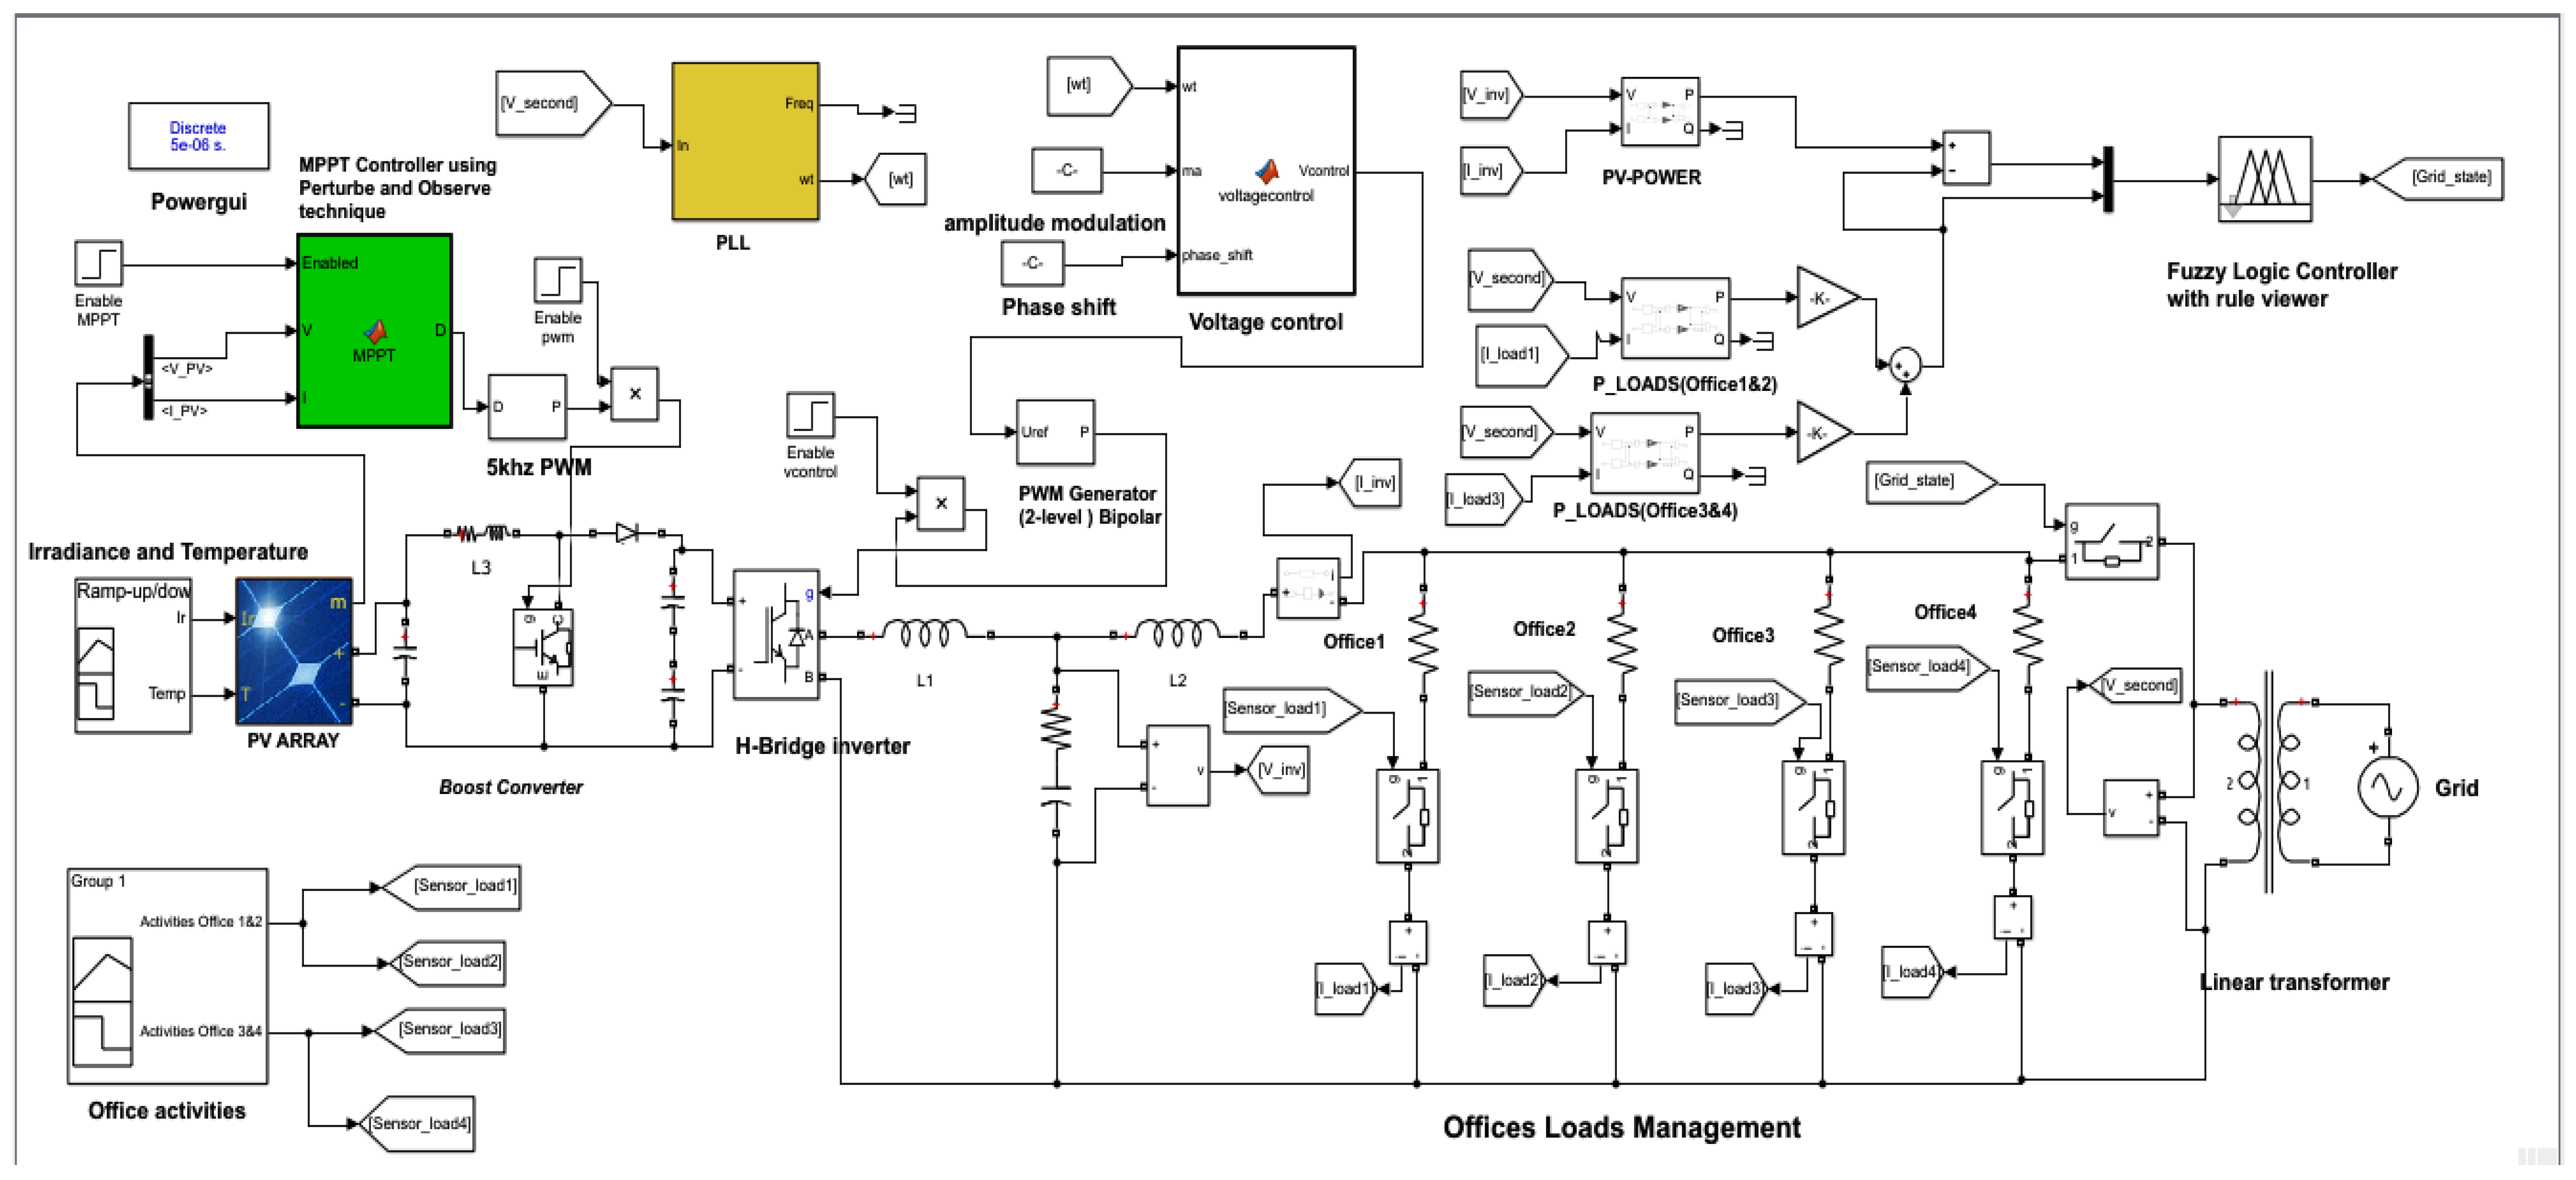
2.7. Load (HVAC, Light) Management Strategy Using PV and Grid
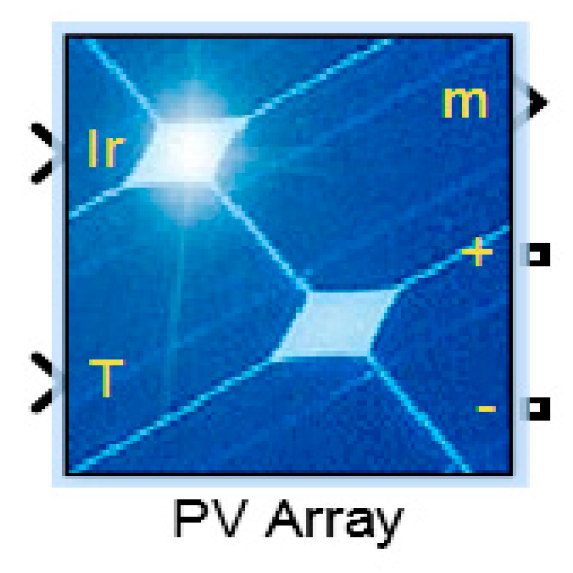
In this section, the PV system is modelled and simulated to further save electric energy around the office building and the fuzzy logic control is designed to manage the controlled loads (HVAC, light) by giving priority to the PV system to feed the electric loads (HVAC, light) coming from four different offices. In case the electric loads are less than the PV energy supplied, the grid will be offline. However, if the loads’ energy rises and become more than the PV supply, in this case the grid together with the PV plant, will feed the loads. The all system is illustrated in Appendix A (Figure A1)

2.7.1. PV System

A grid-tied system was designed. The mathematical model of the solar panel was developed in MATLAB Simulink. The PV designed here was a 4000 W array with 5 series ( n s = 5) modules per string of 198.25 W each and individual module had 72 cells, those 5 series modules was thereafter connected in 4 parallel string ( n p = 4). Each module has consisted of voltage and current at the maximum power point of 30.5 V and 6.5 A. Therefore, p = 30.5 * 6.5 * 5 * 4 = 3.97 KW which was approximately equal to 4 KW. The specification used for the mathematical model of the solar array see Appendix C (Table A2). Figure 10 is the PV array block used in MATLAB Simulink® and Figure 11 represent the block diagram of the all PV power system.

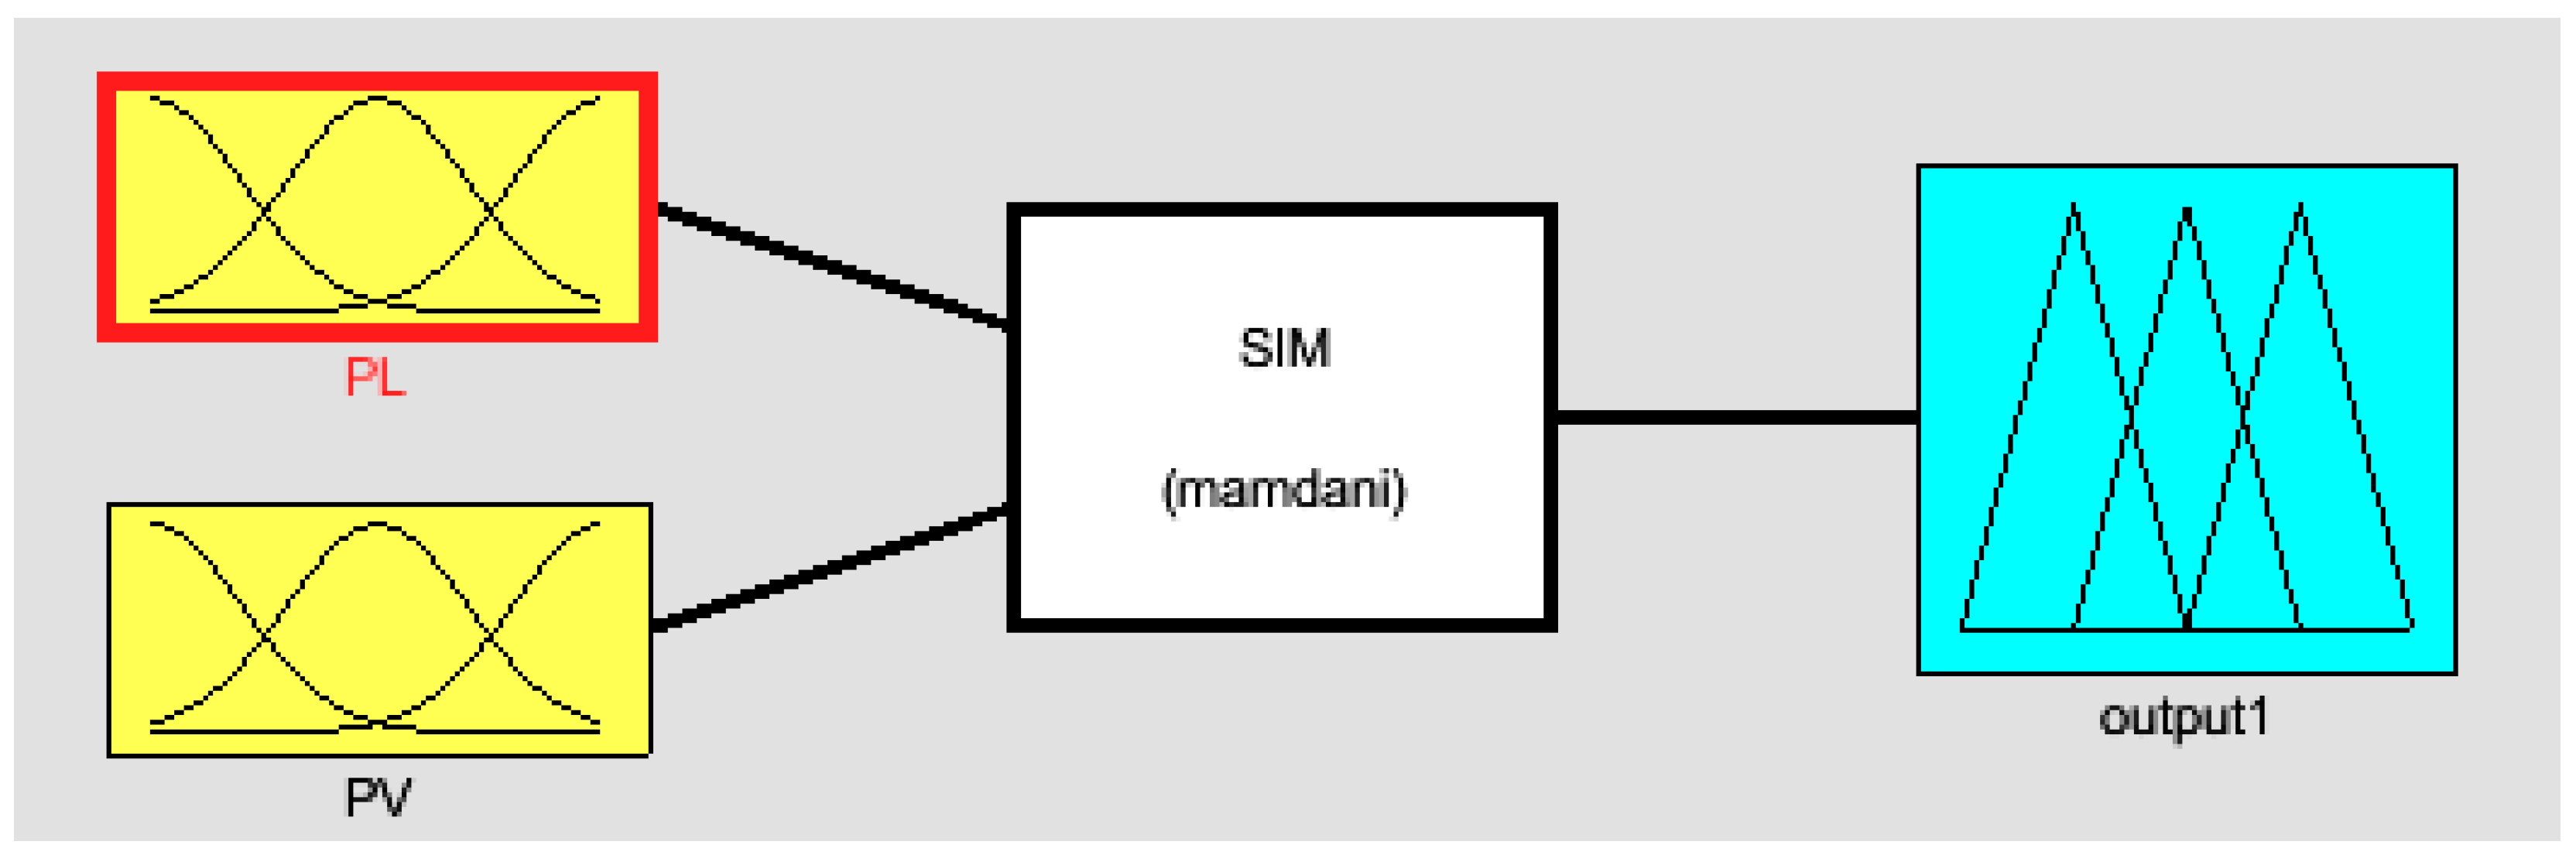
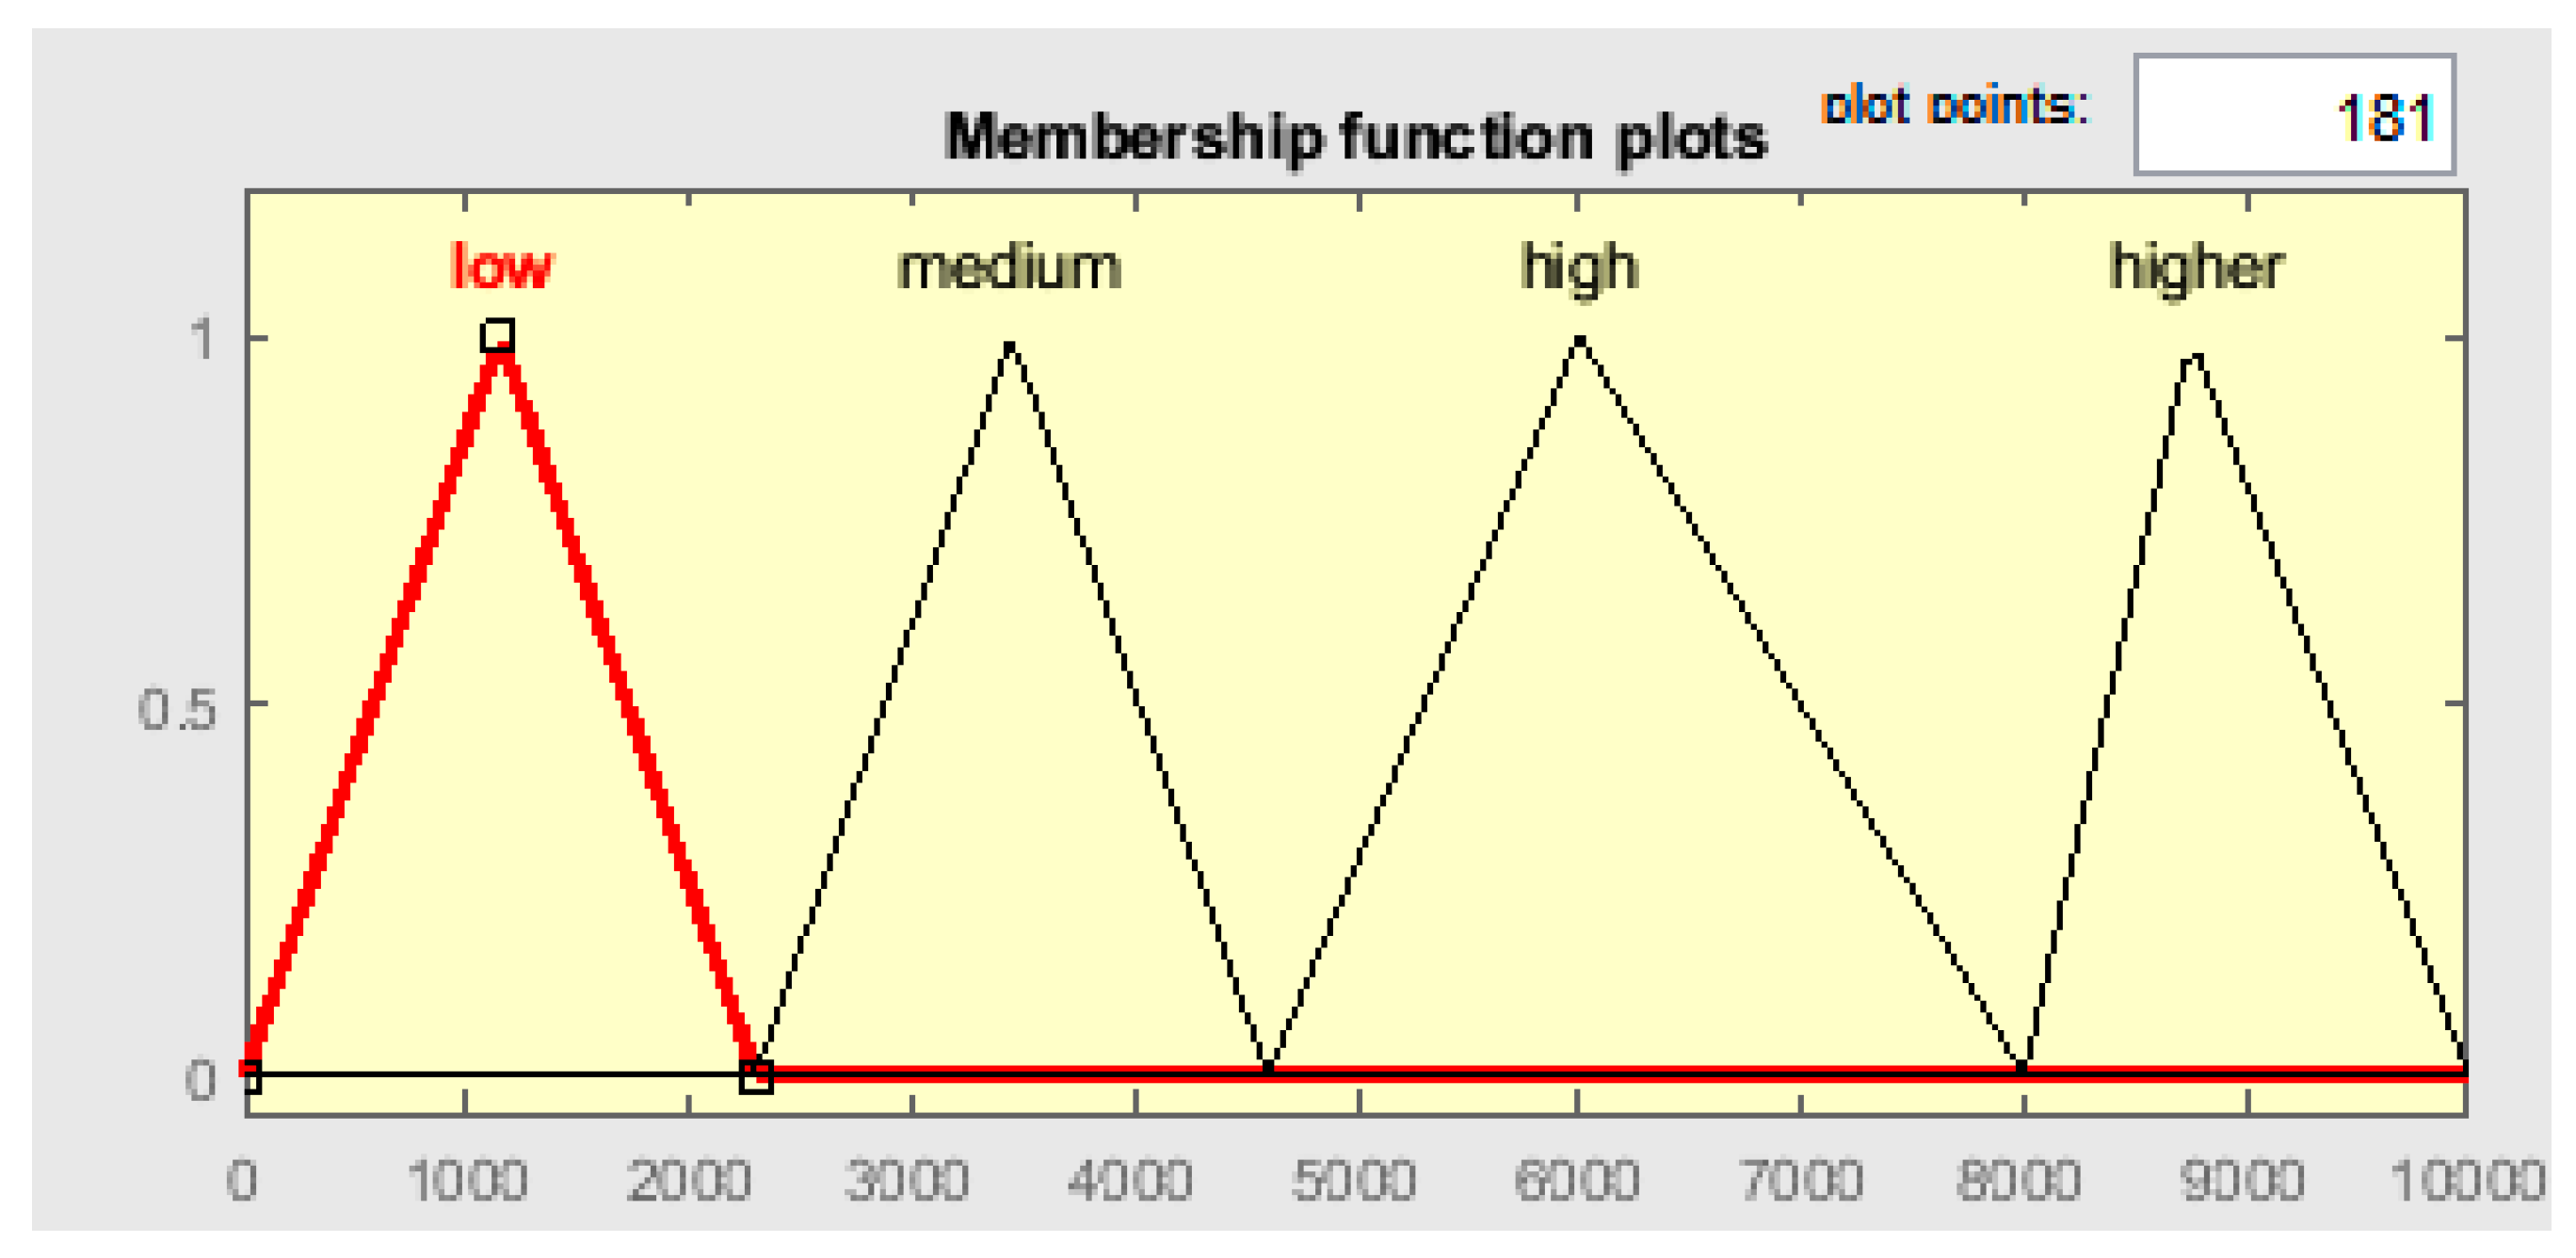
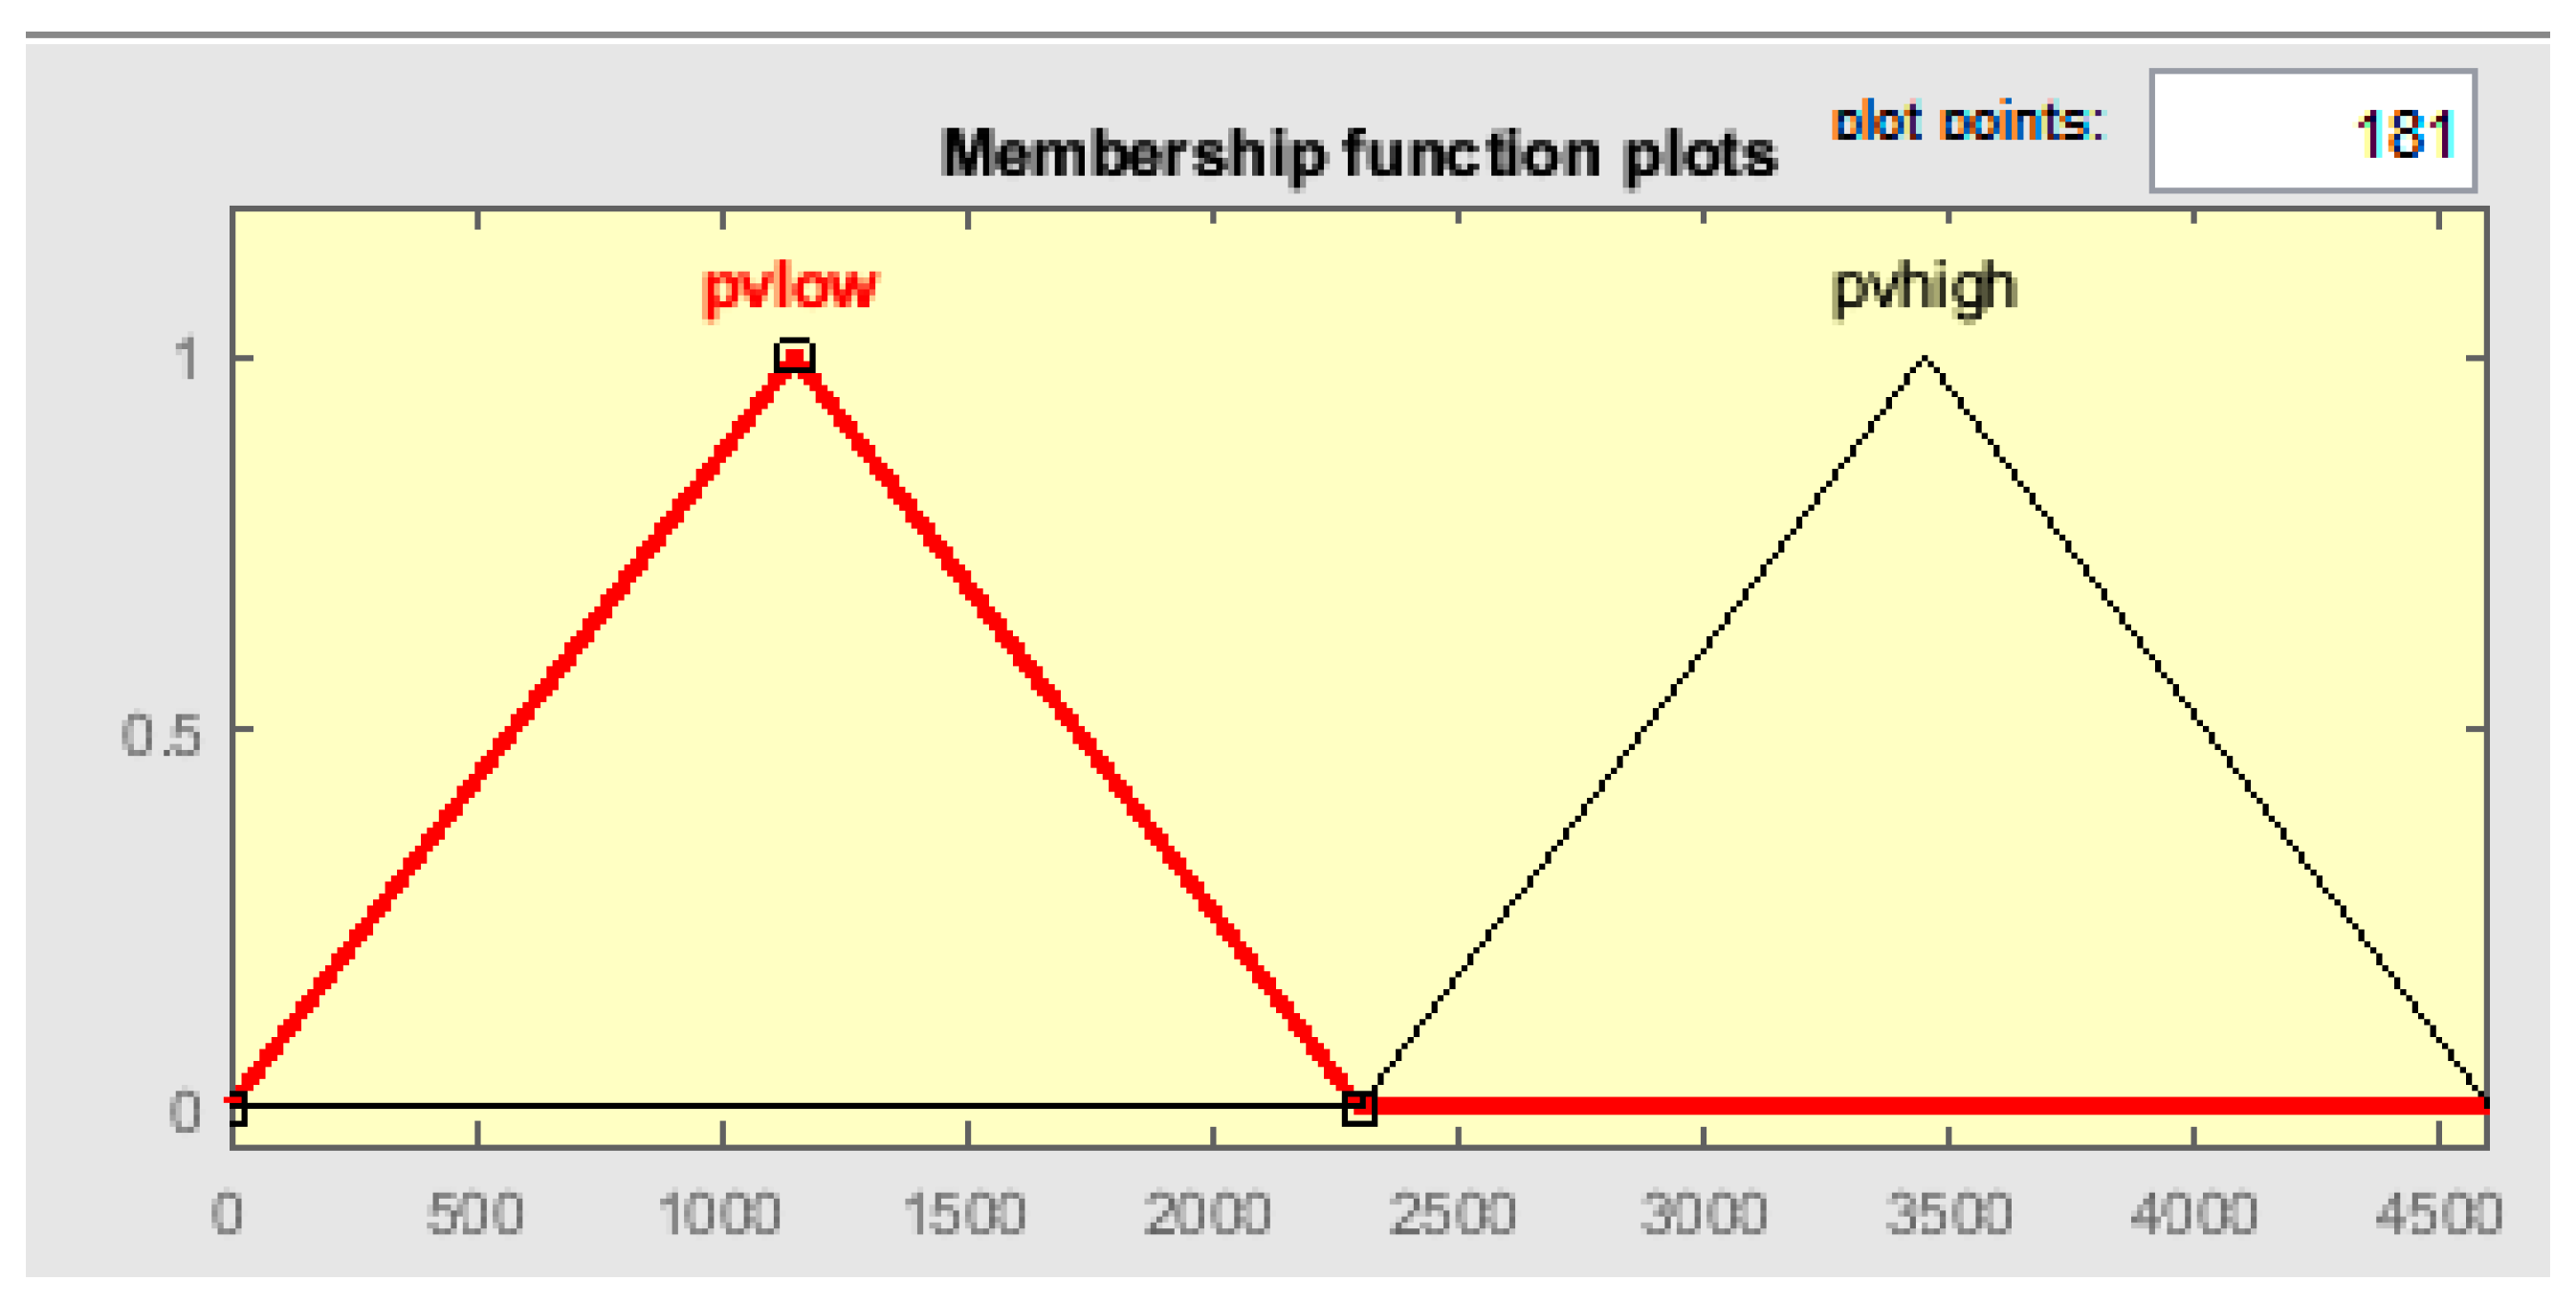
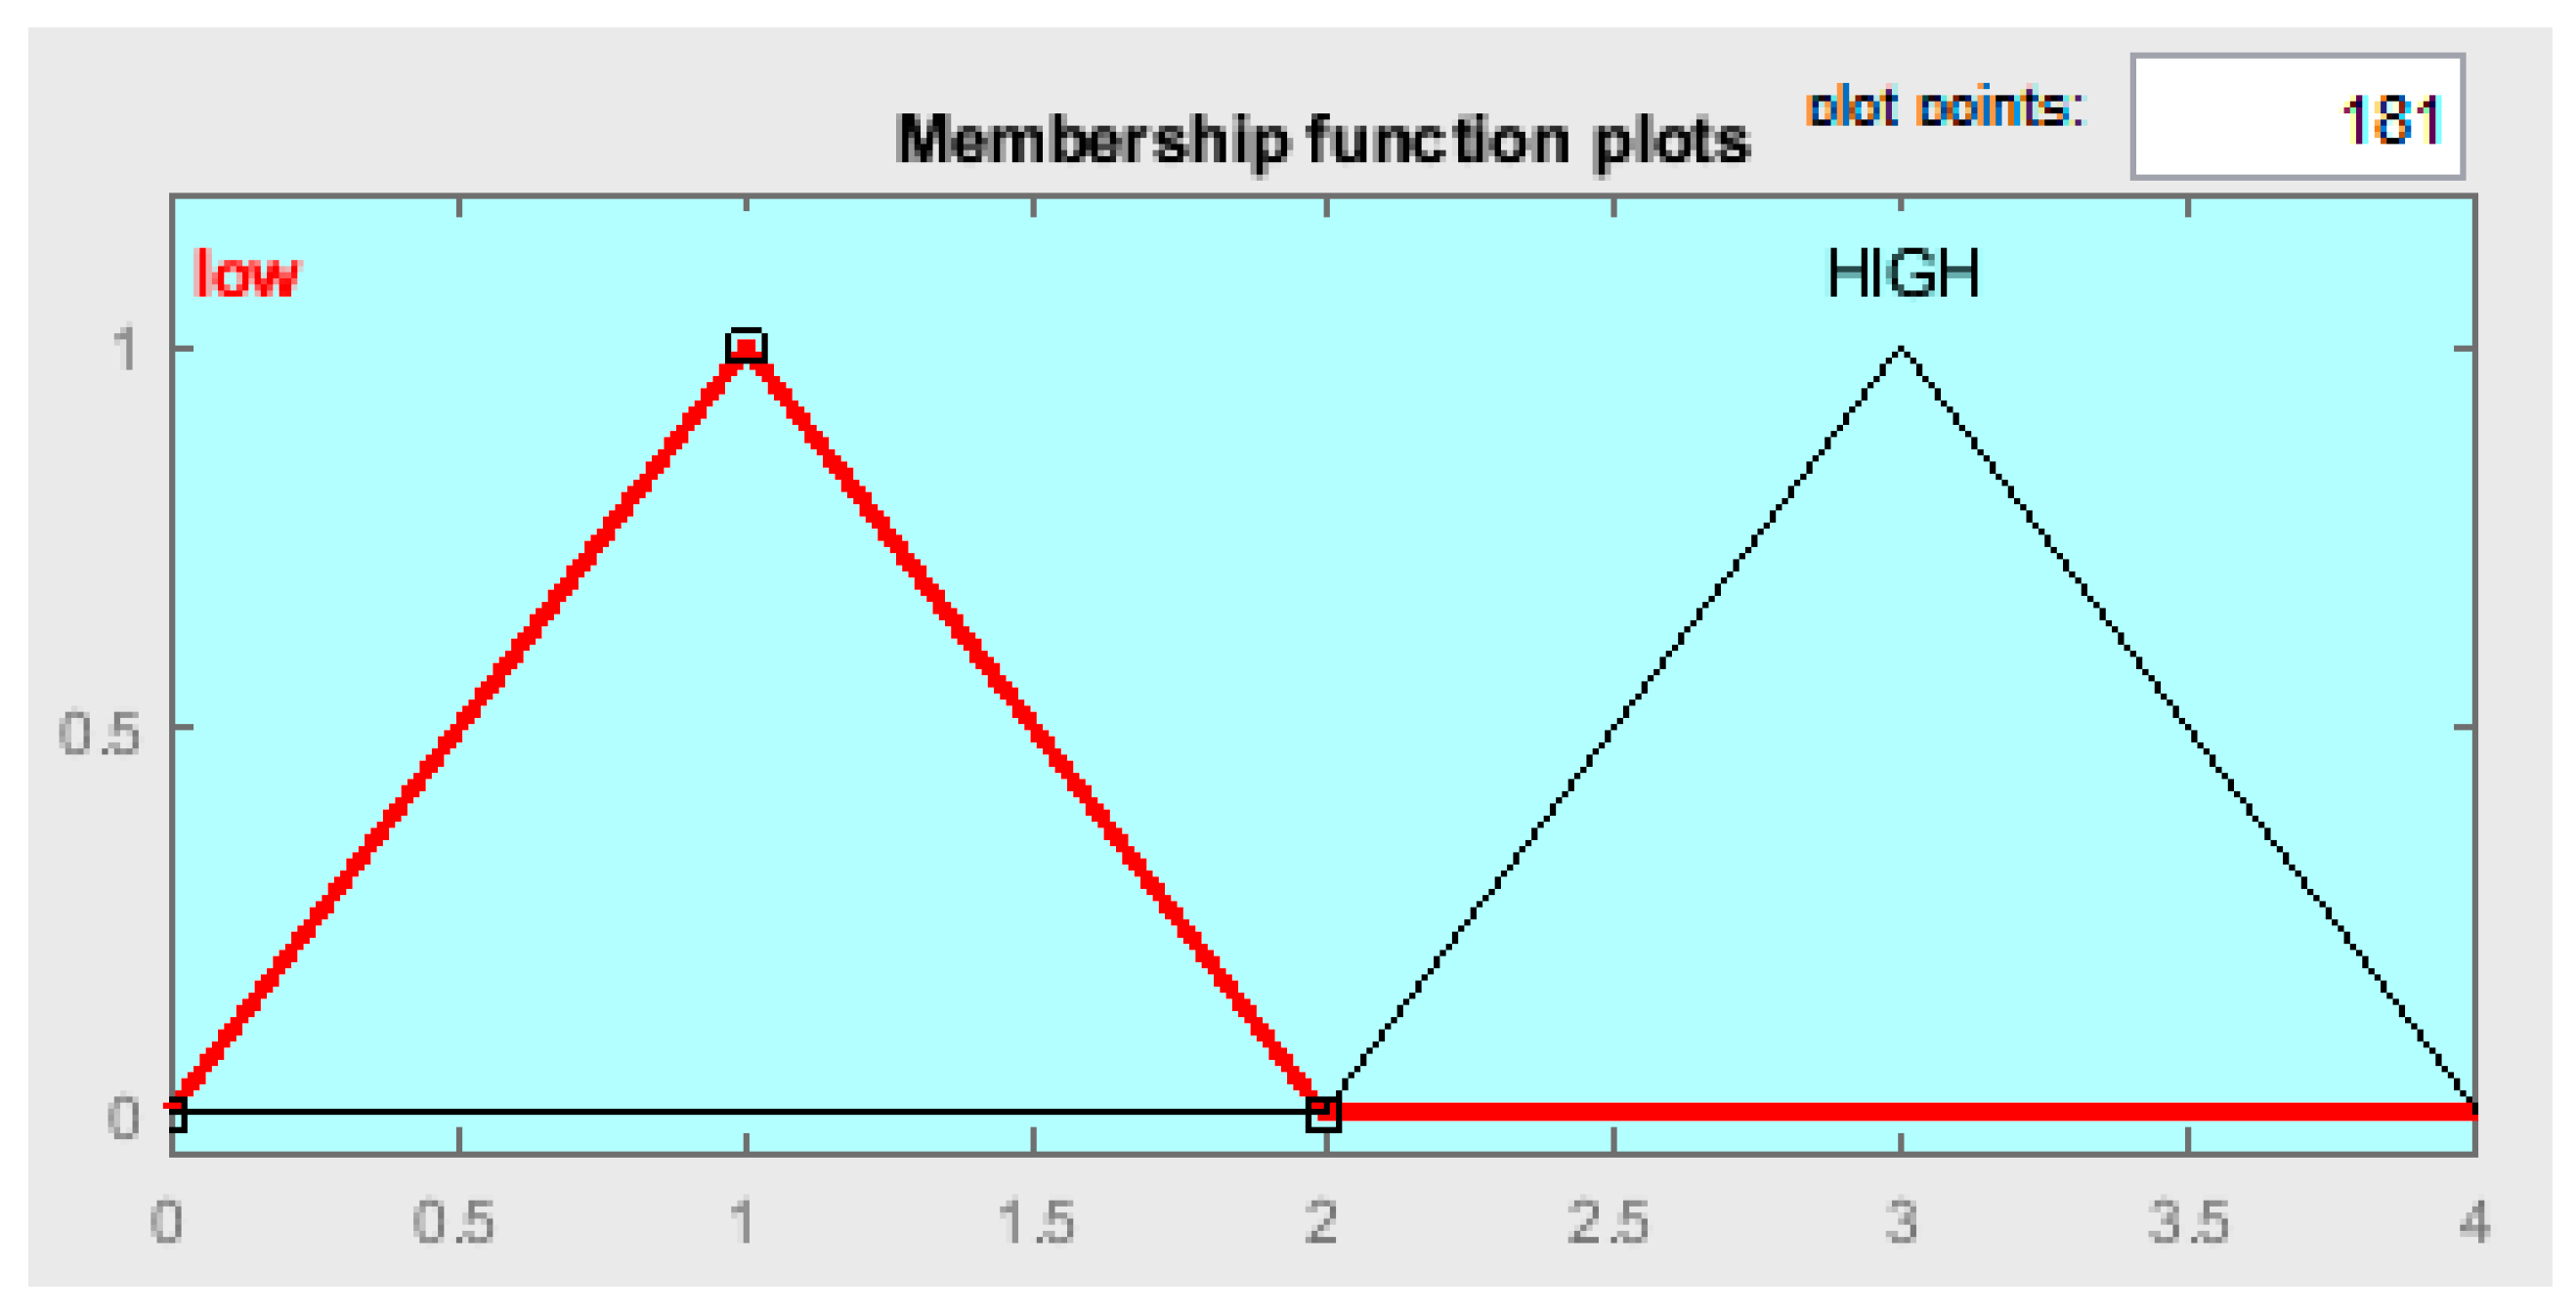
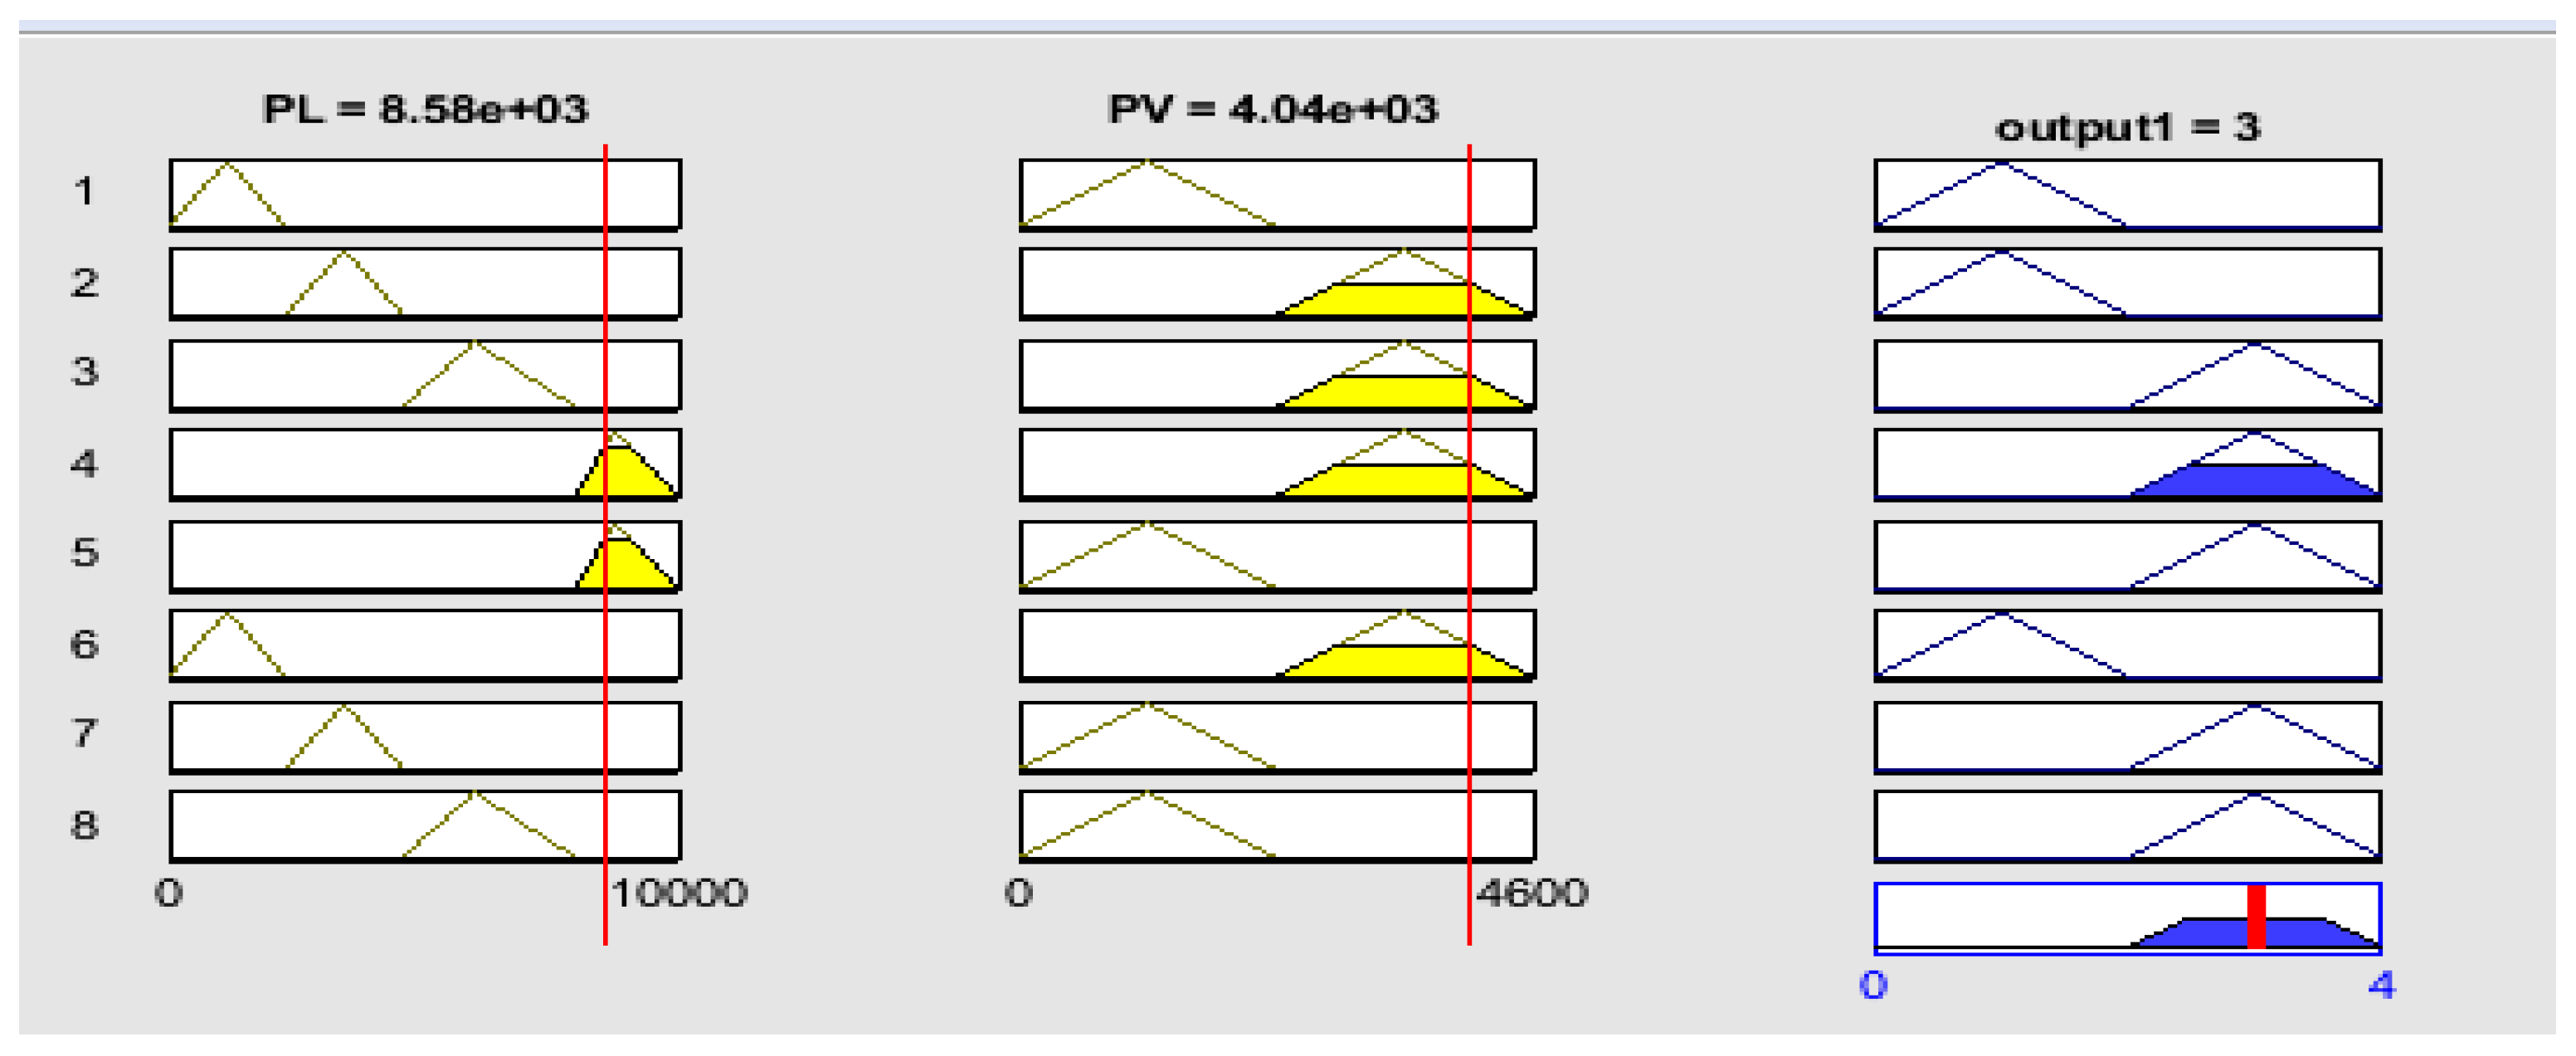
2.7.2. Fuzzy Logic Control

Fuzzy logic is the set of mathematical principles designed based on human knowledge of the system or on the degree of membership. This fuzzy logic consists of four components—fuzzification, fuzzy rules, fuzzy inference system and defuzzification.
In this part of the research we need to define the fuzzy control input and output values where this input goes through the fuzzy control system which controls the grid based on the input values of the load (HVAC and light) consumed and the PV power generated see Figure 12.
The first input is the sum of the power consumed (PL) see Figure 13 in all four offices and the order input is the power generated by the PV system (PV) see Figure 14. These inputs are used by the fuzzy logic control to provide a signal to the grid system to synchronize with the solar system in order to feed the loads when it is needed and to bring the grid off when no needed see Figure 16.
The fuzzy inference system (FIS) used in this research is a direct method called the Mamdani’ fuzzy inference method (mentioned earlier). It is used in a fuzzy rule (IF-THEN) to determine the rule outcome from the given rule input and output information. This fuzzy inference system is the most used because of its simple structure and is more suitable for the system design.
To allow our fuzzy to control the switching system of the grid, the defuzzification technique was applied in this research. The centroid defuzzifier technique was used.
The centroid defuzzifier technique was used to convert fuzzy sets or the membership of output linguistic variables into real numbers for the grid control output (Y) see Figure 15.
The block diagram in Figure 16 below illustrates the proposed fuzzy logic system articulated above.
A discussion on the impact of temperature and human activities on HVAC and light energy consumption in four close offices is presented, as well as the influence of the temperature control, human control and the loads’ control. The results of the use of fuzzy logic control for a switching system combined with a PV system to further decrease the consumption of energy in the offices, are provided.

3. Results

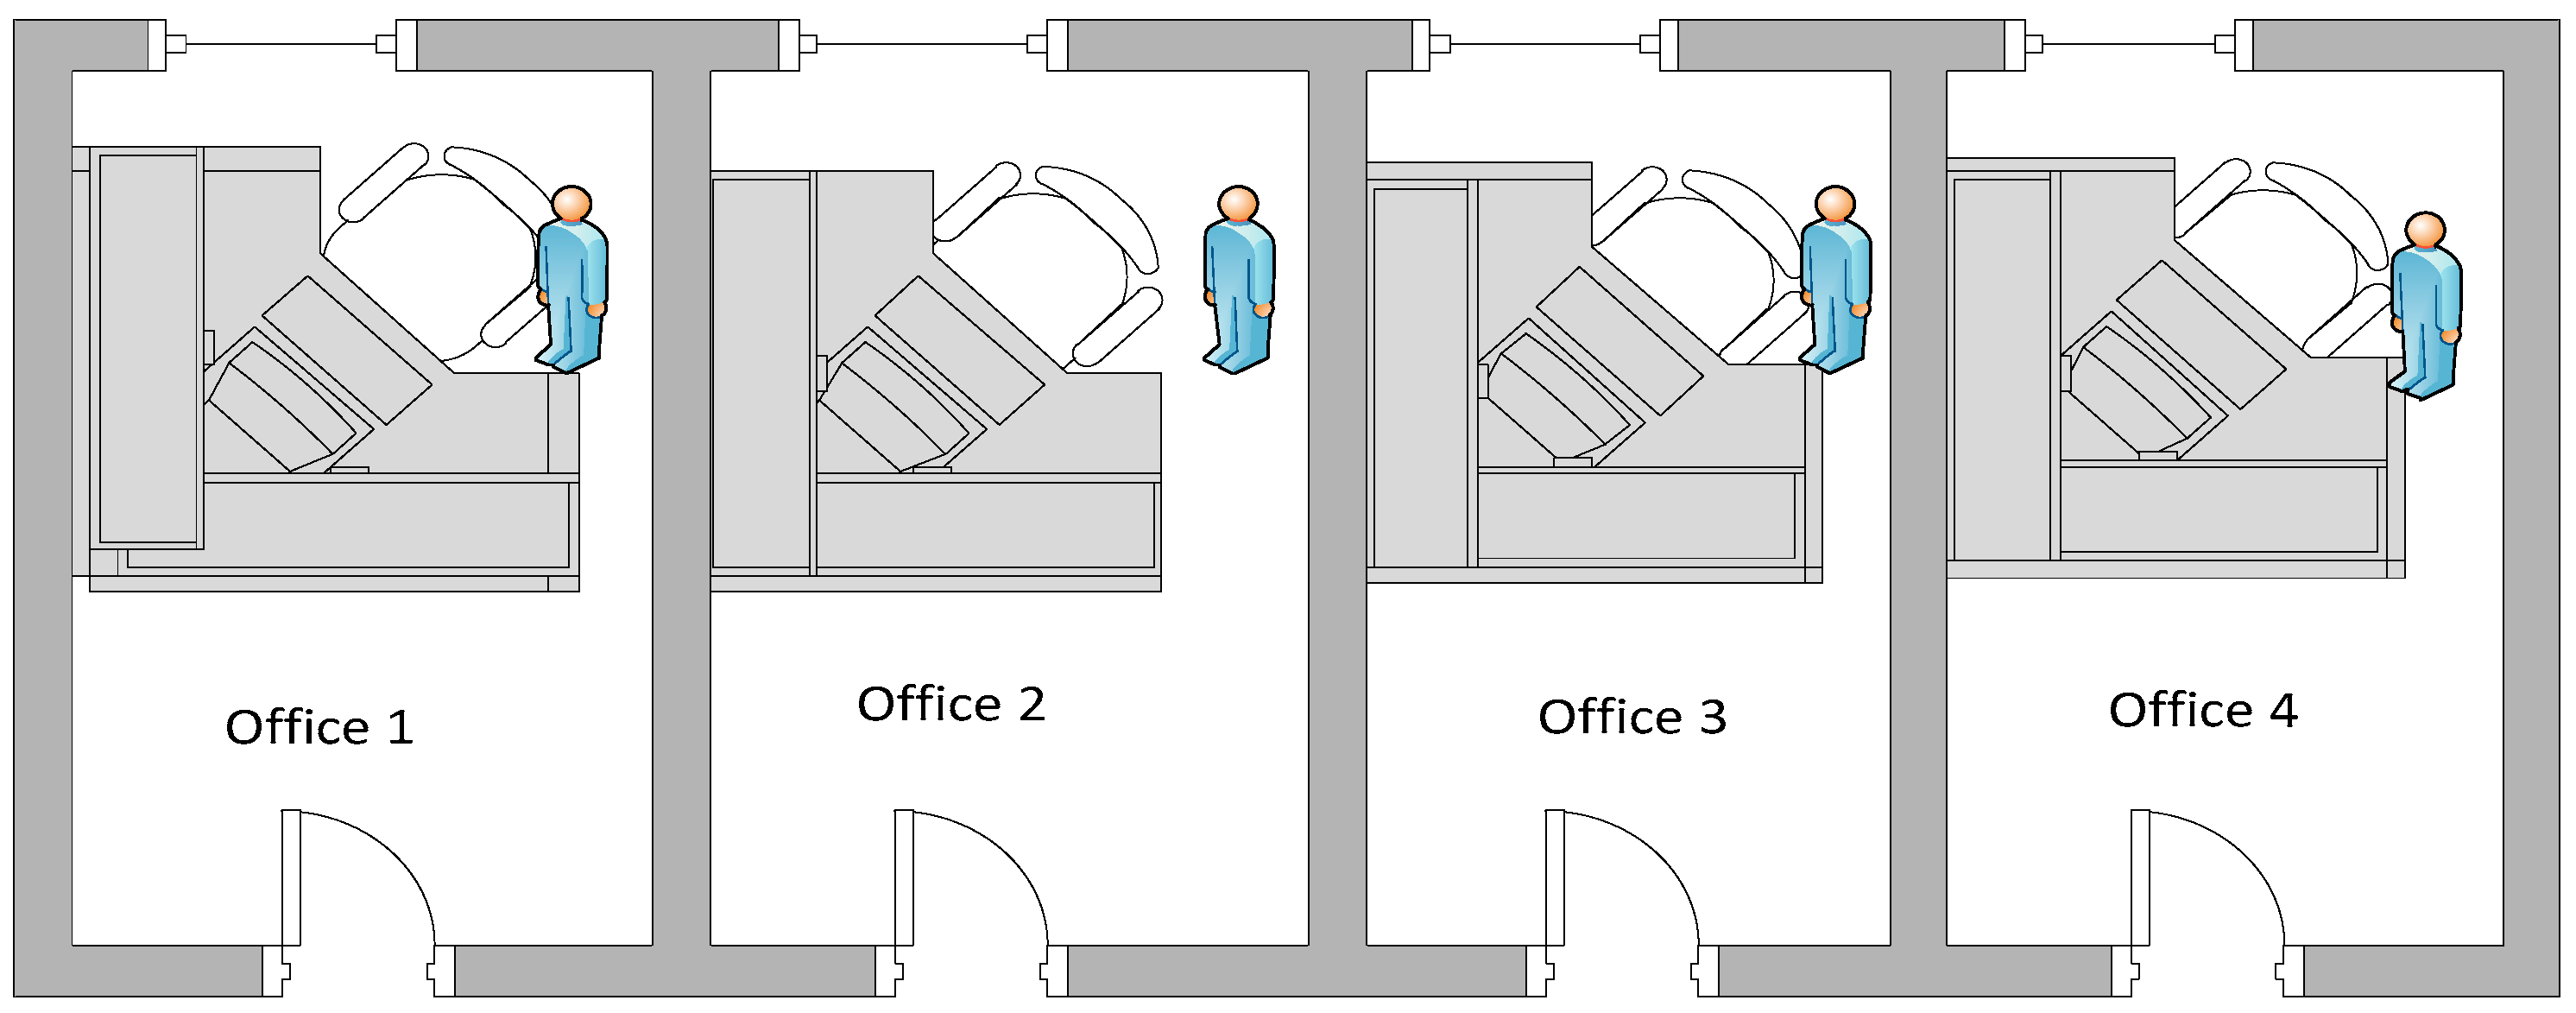
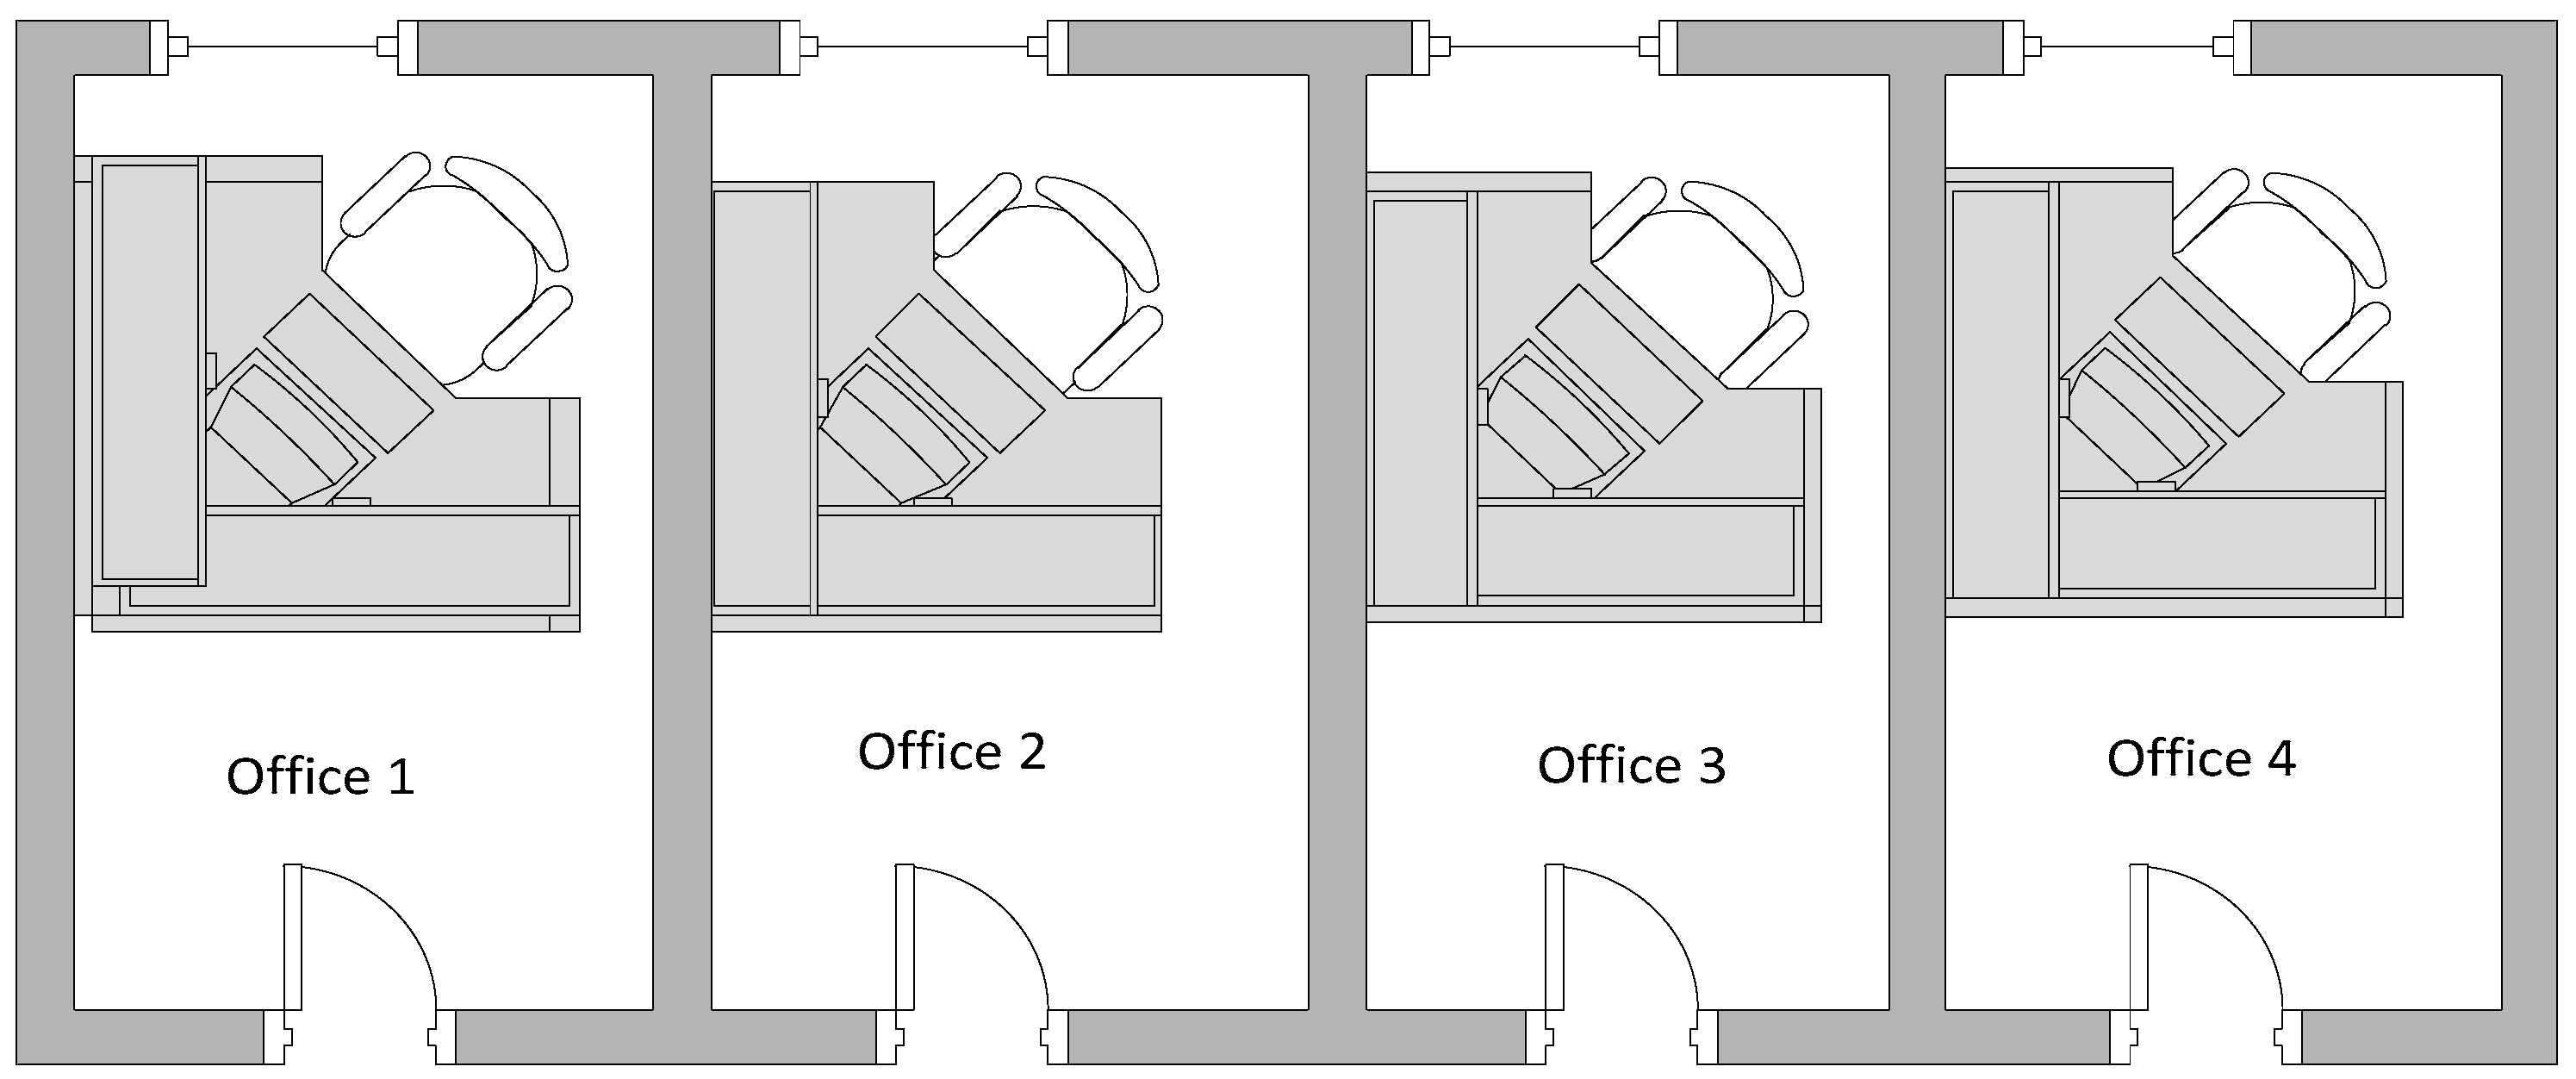
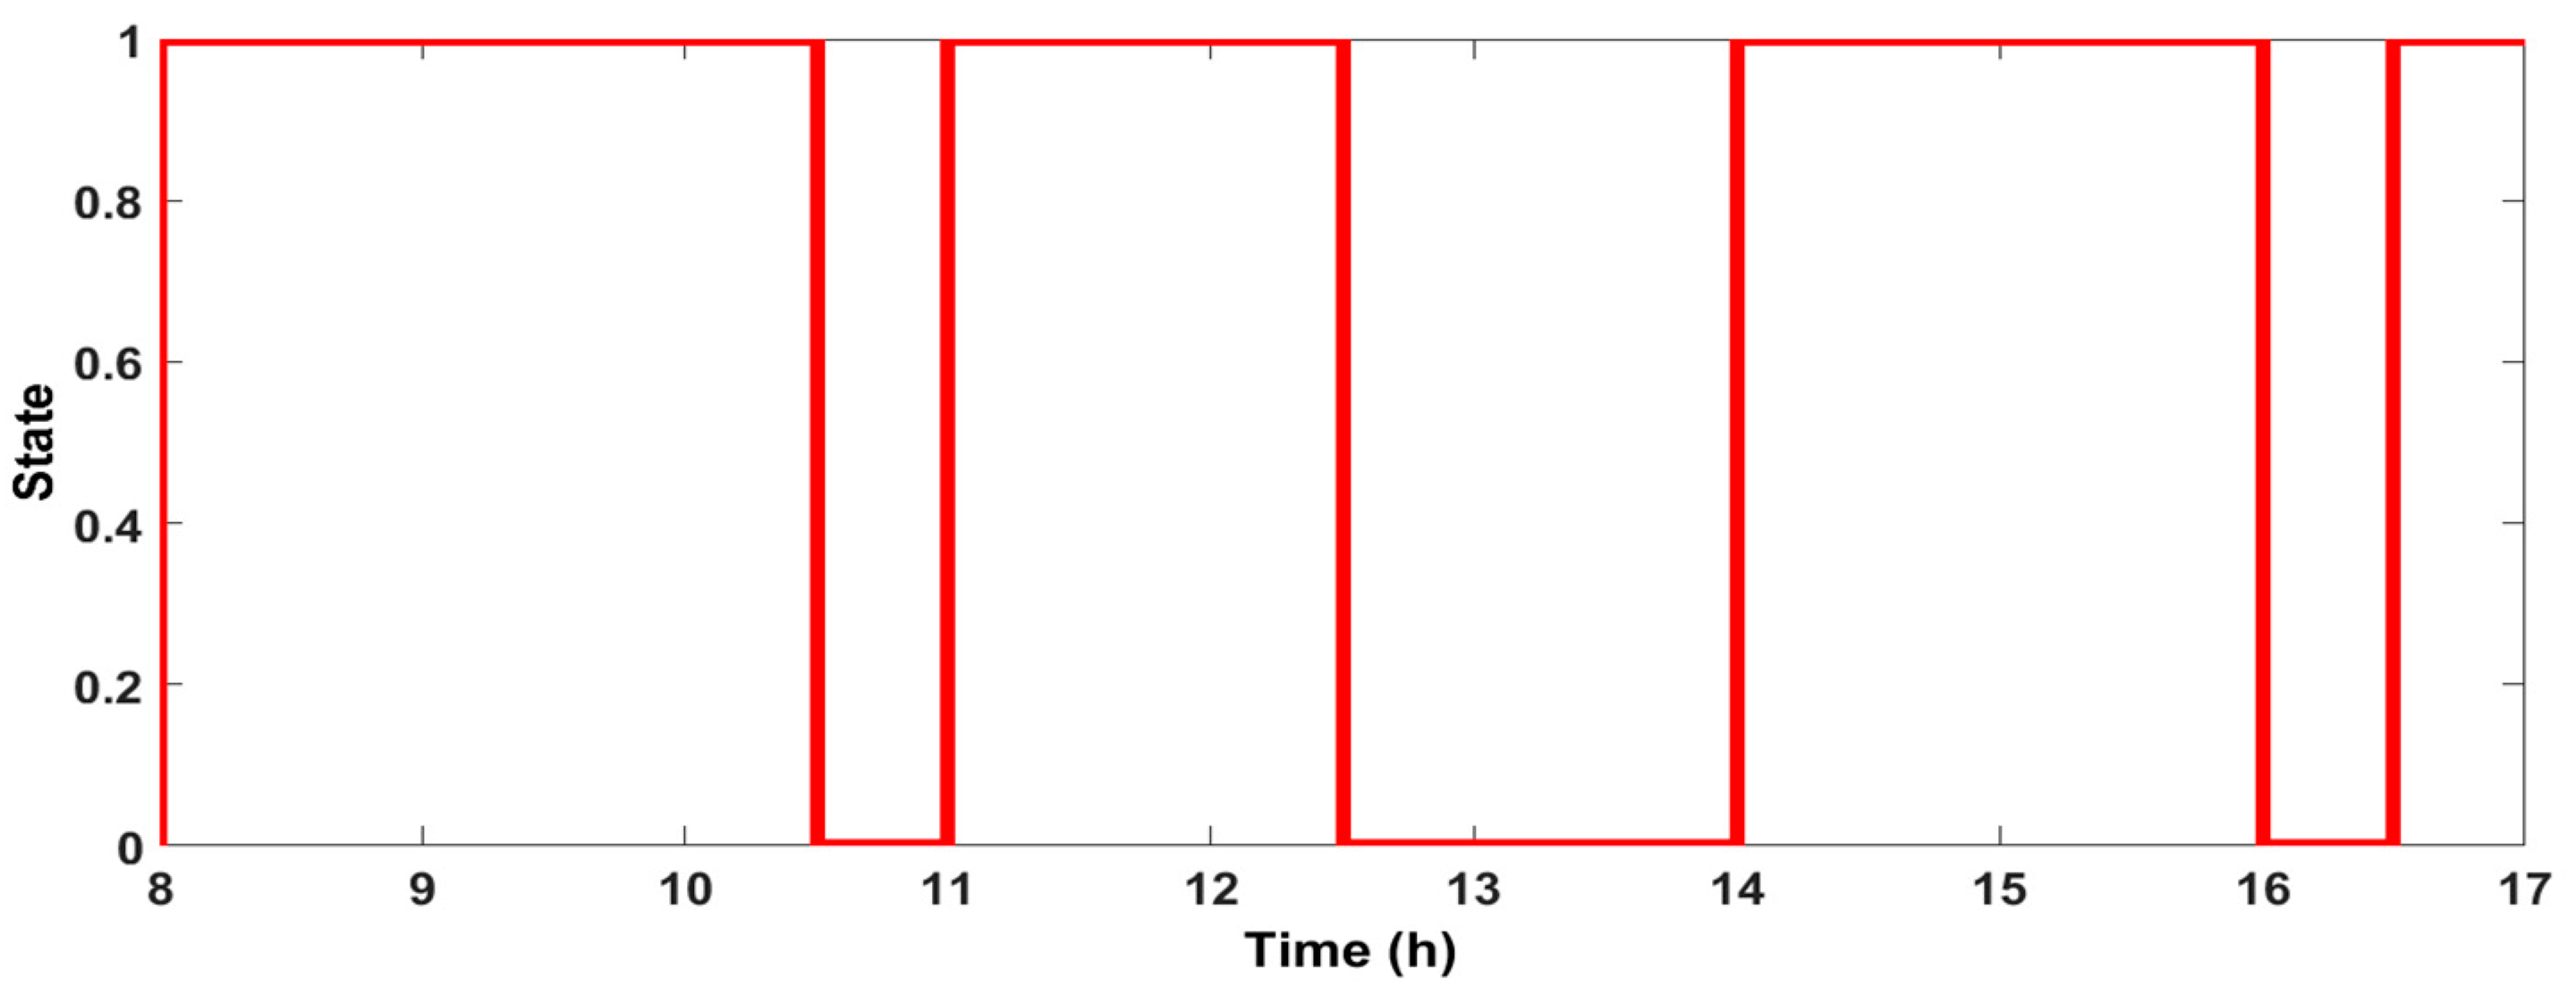
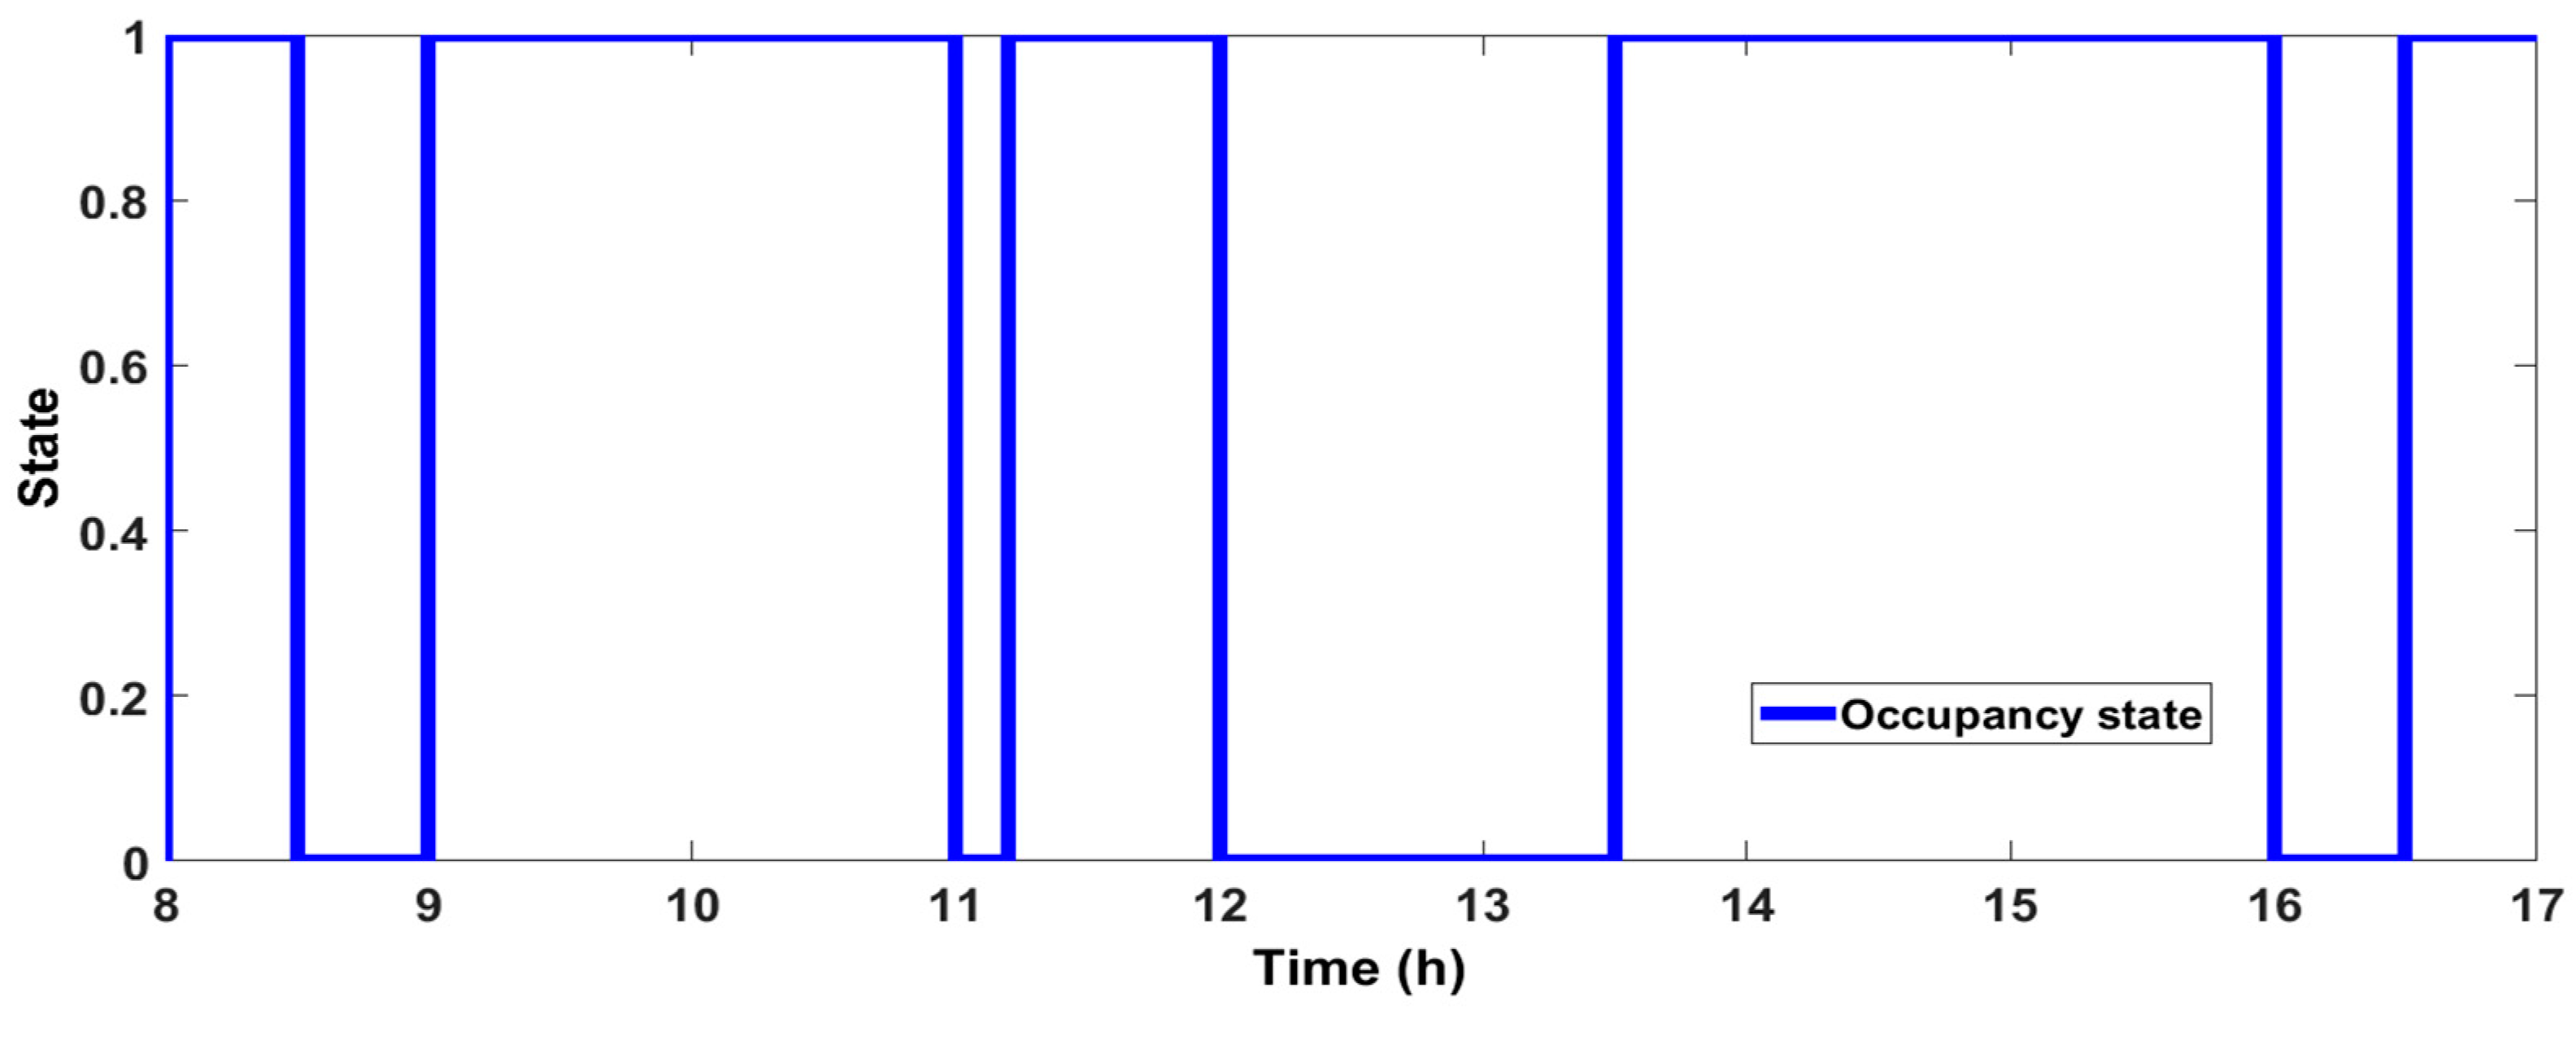
3.1. Occupancy Sensor Results from Four Offices

To simulate the occupancy activities in offices, the data used in the investigation revealed the following results and are represented in Table 1 below and the occupancy sensor output in offices 1 and 2 is graphically provided in Figure 17.
As Table 2 shows, the graph in Figure 17 was is based on the human activities in office 1 and 2 during 9 h of working, so when the office is occupied, the sensor registers 1 and when it is not occupied, the sensor registers 0. Table 2 below, indicates the schedule of working hours in offices 3 and 4.
Figure 18 depicts the different states of the employees in offices 3 and 4; as mentioned earlier the state is represented by logic 1 when the office is occupied and 0 when it is not occupied.
Both graphs (Figure 17 and Figure 18) indicated that all employees started their work at 8 h00 but had different breaks, according to their varying needs.

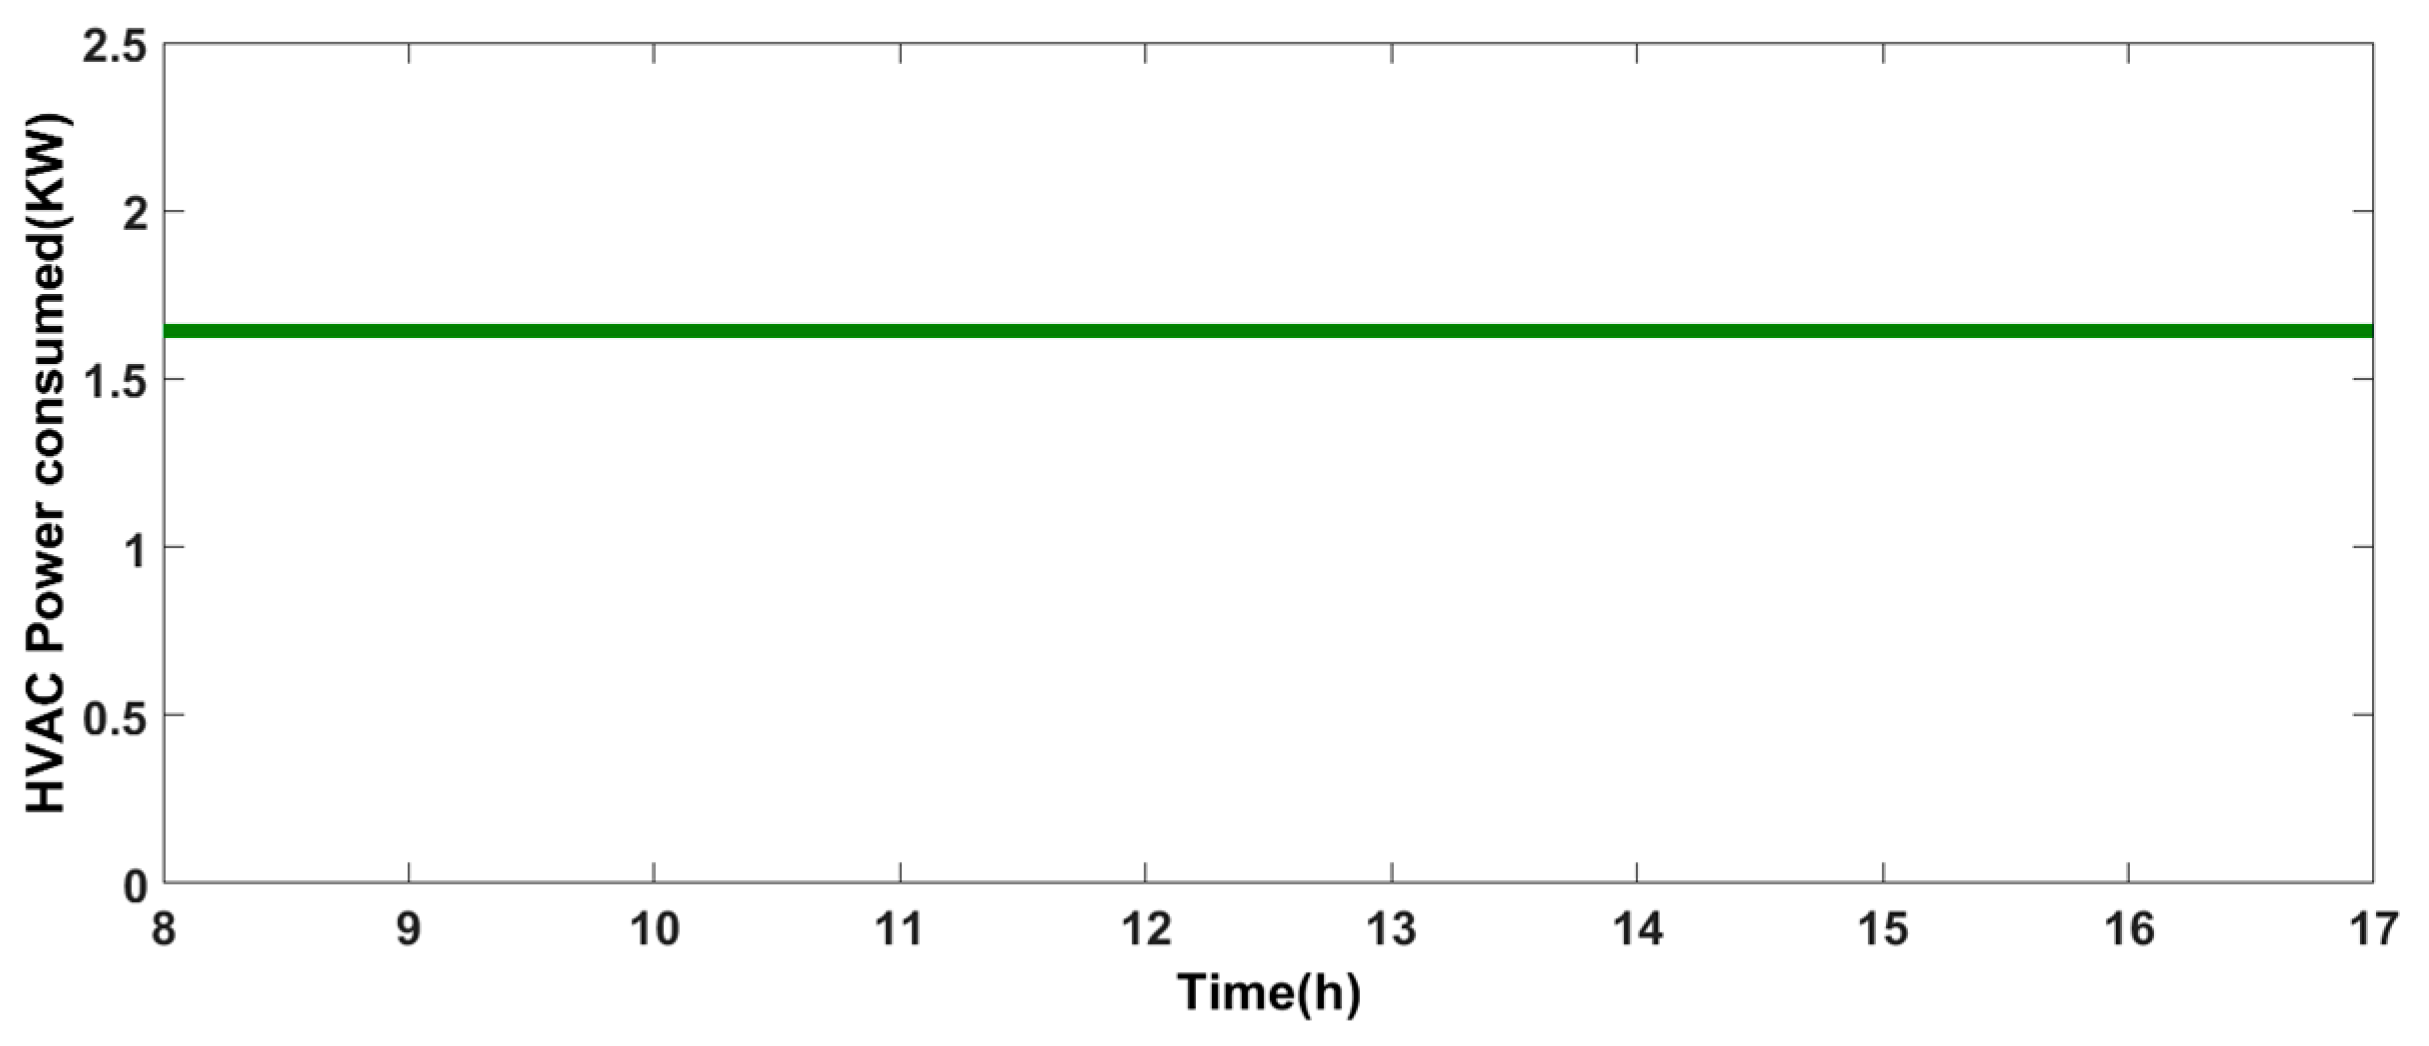
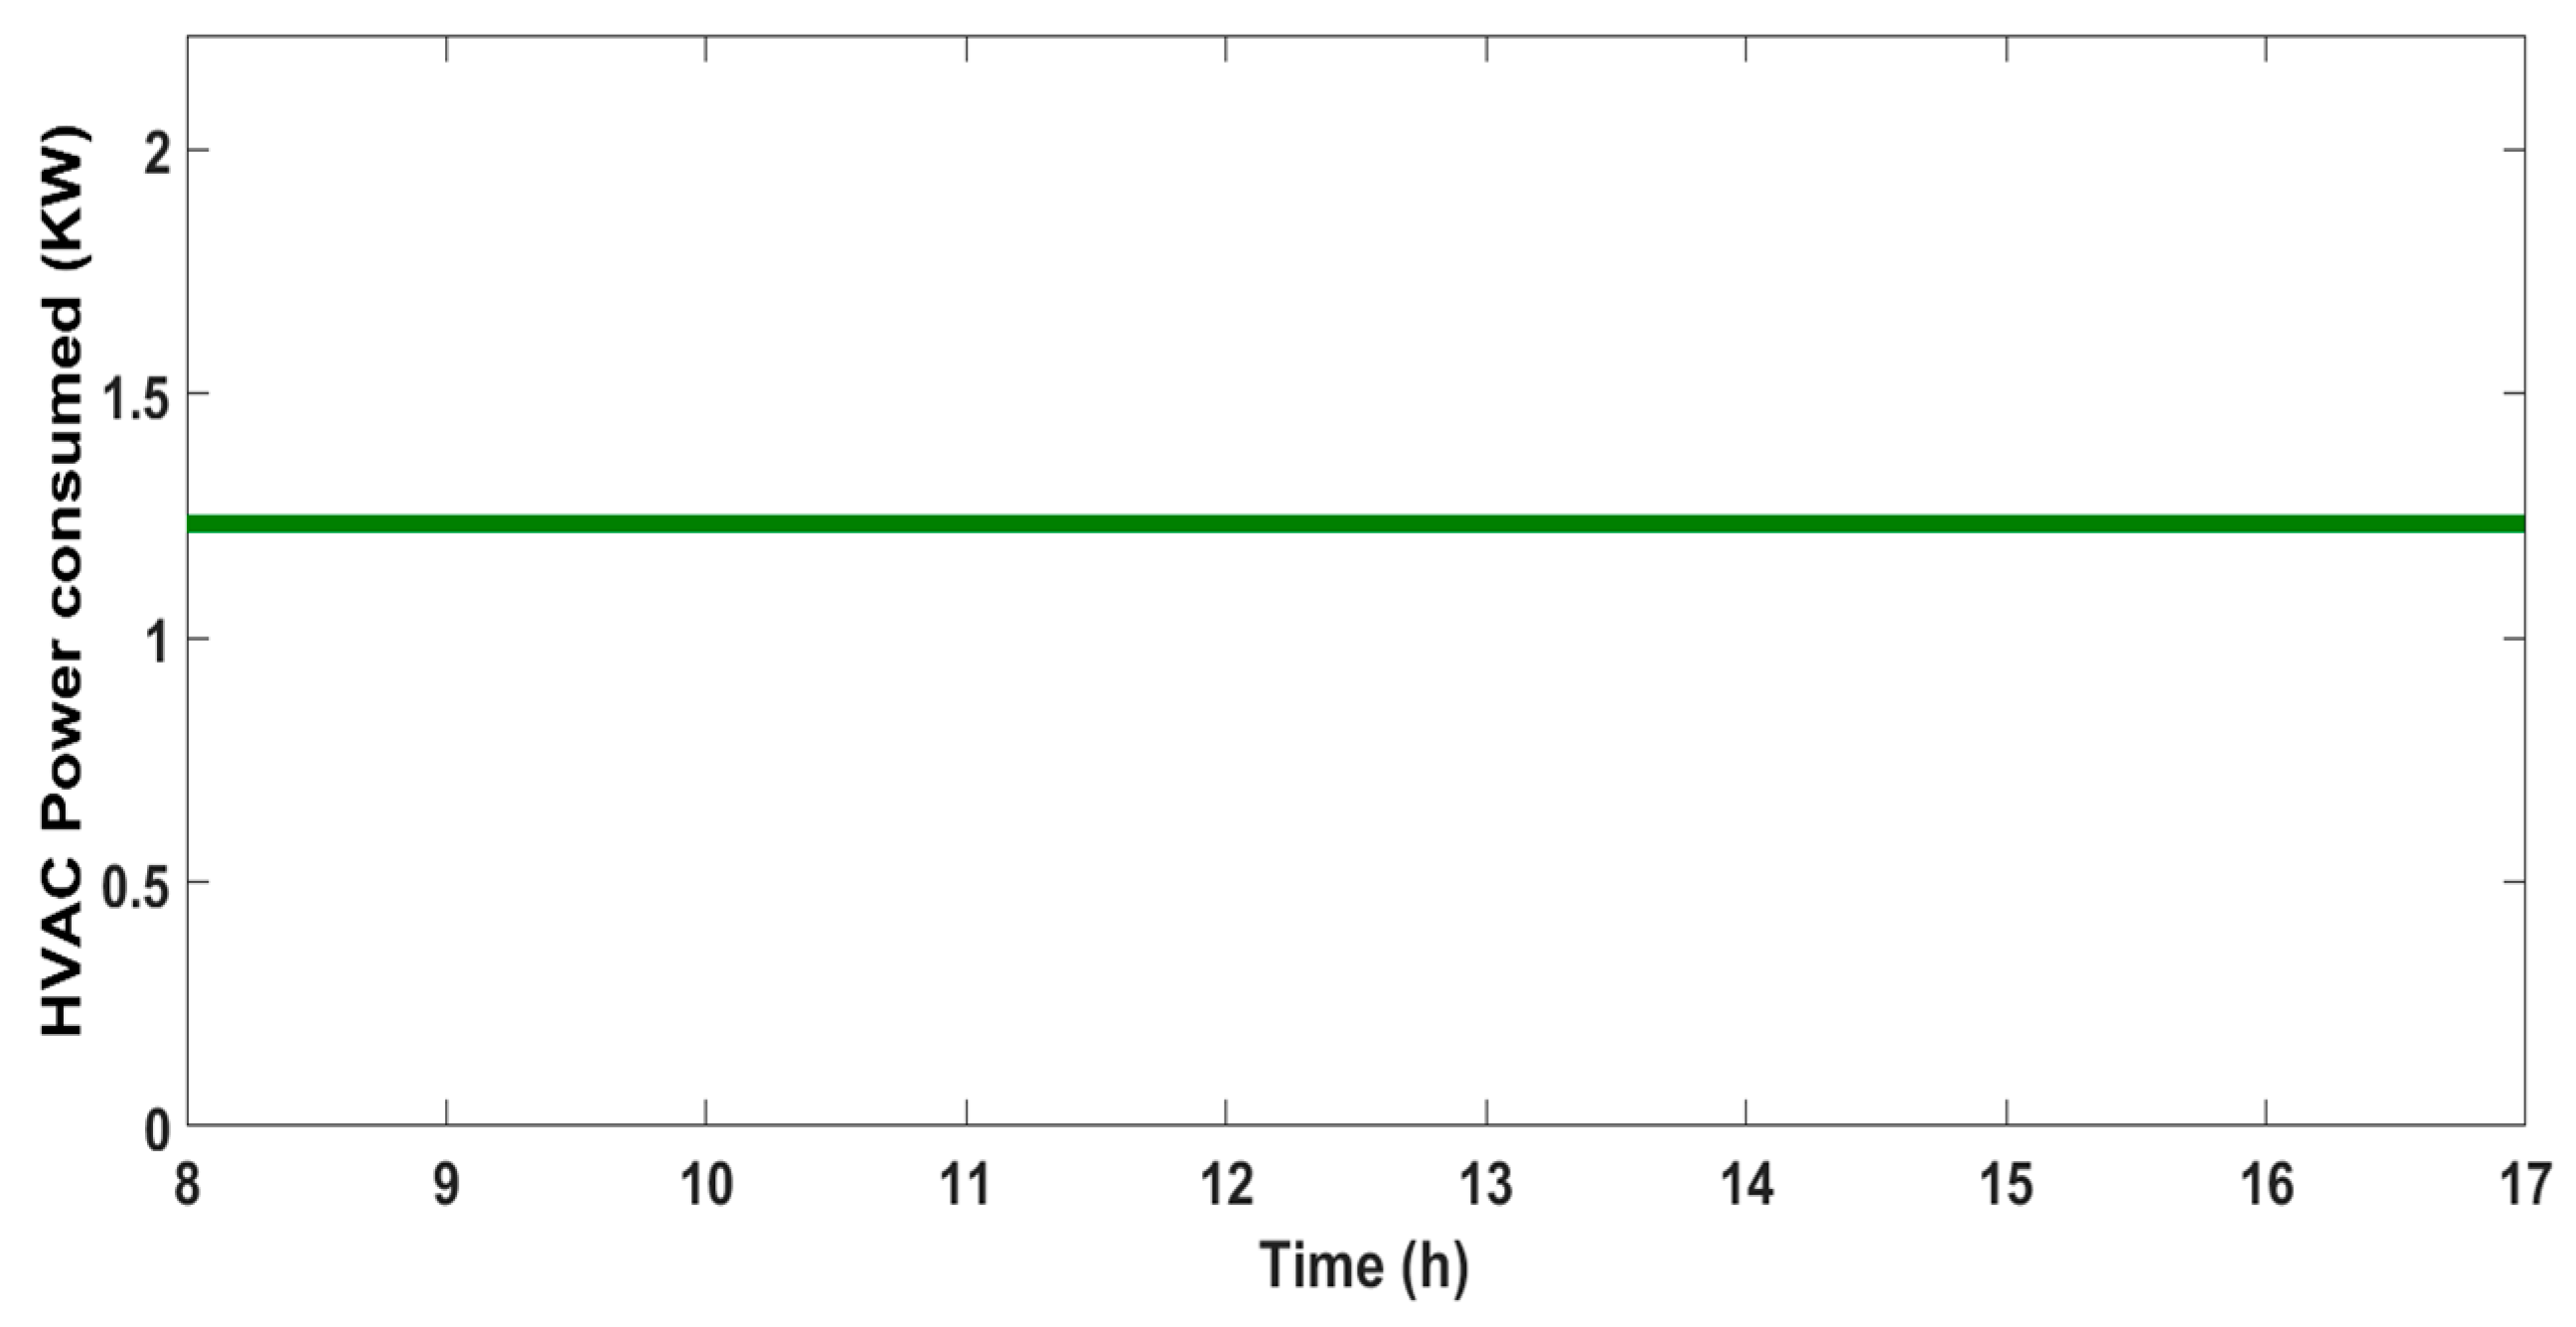
3.2. Office HVAC Energy Consumed Results for the Assumed Model in Normal Conditions Without any Control

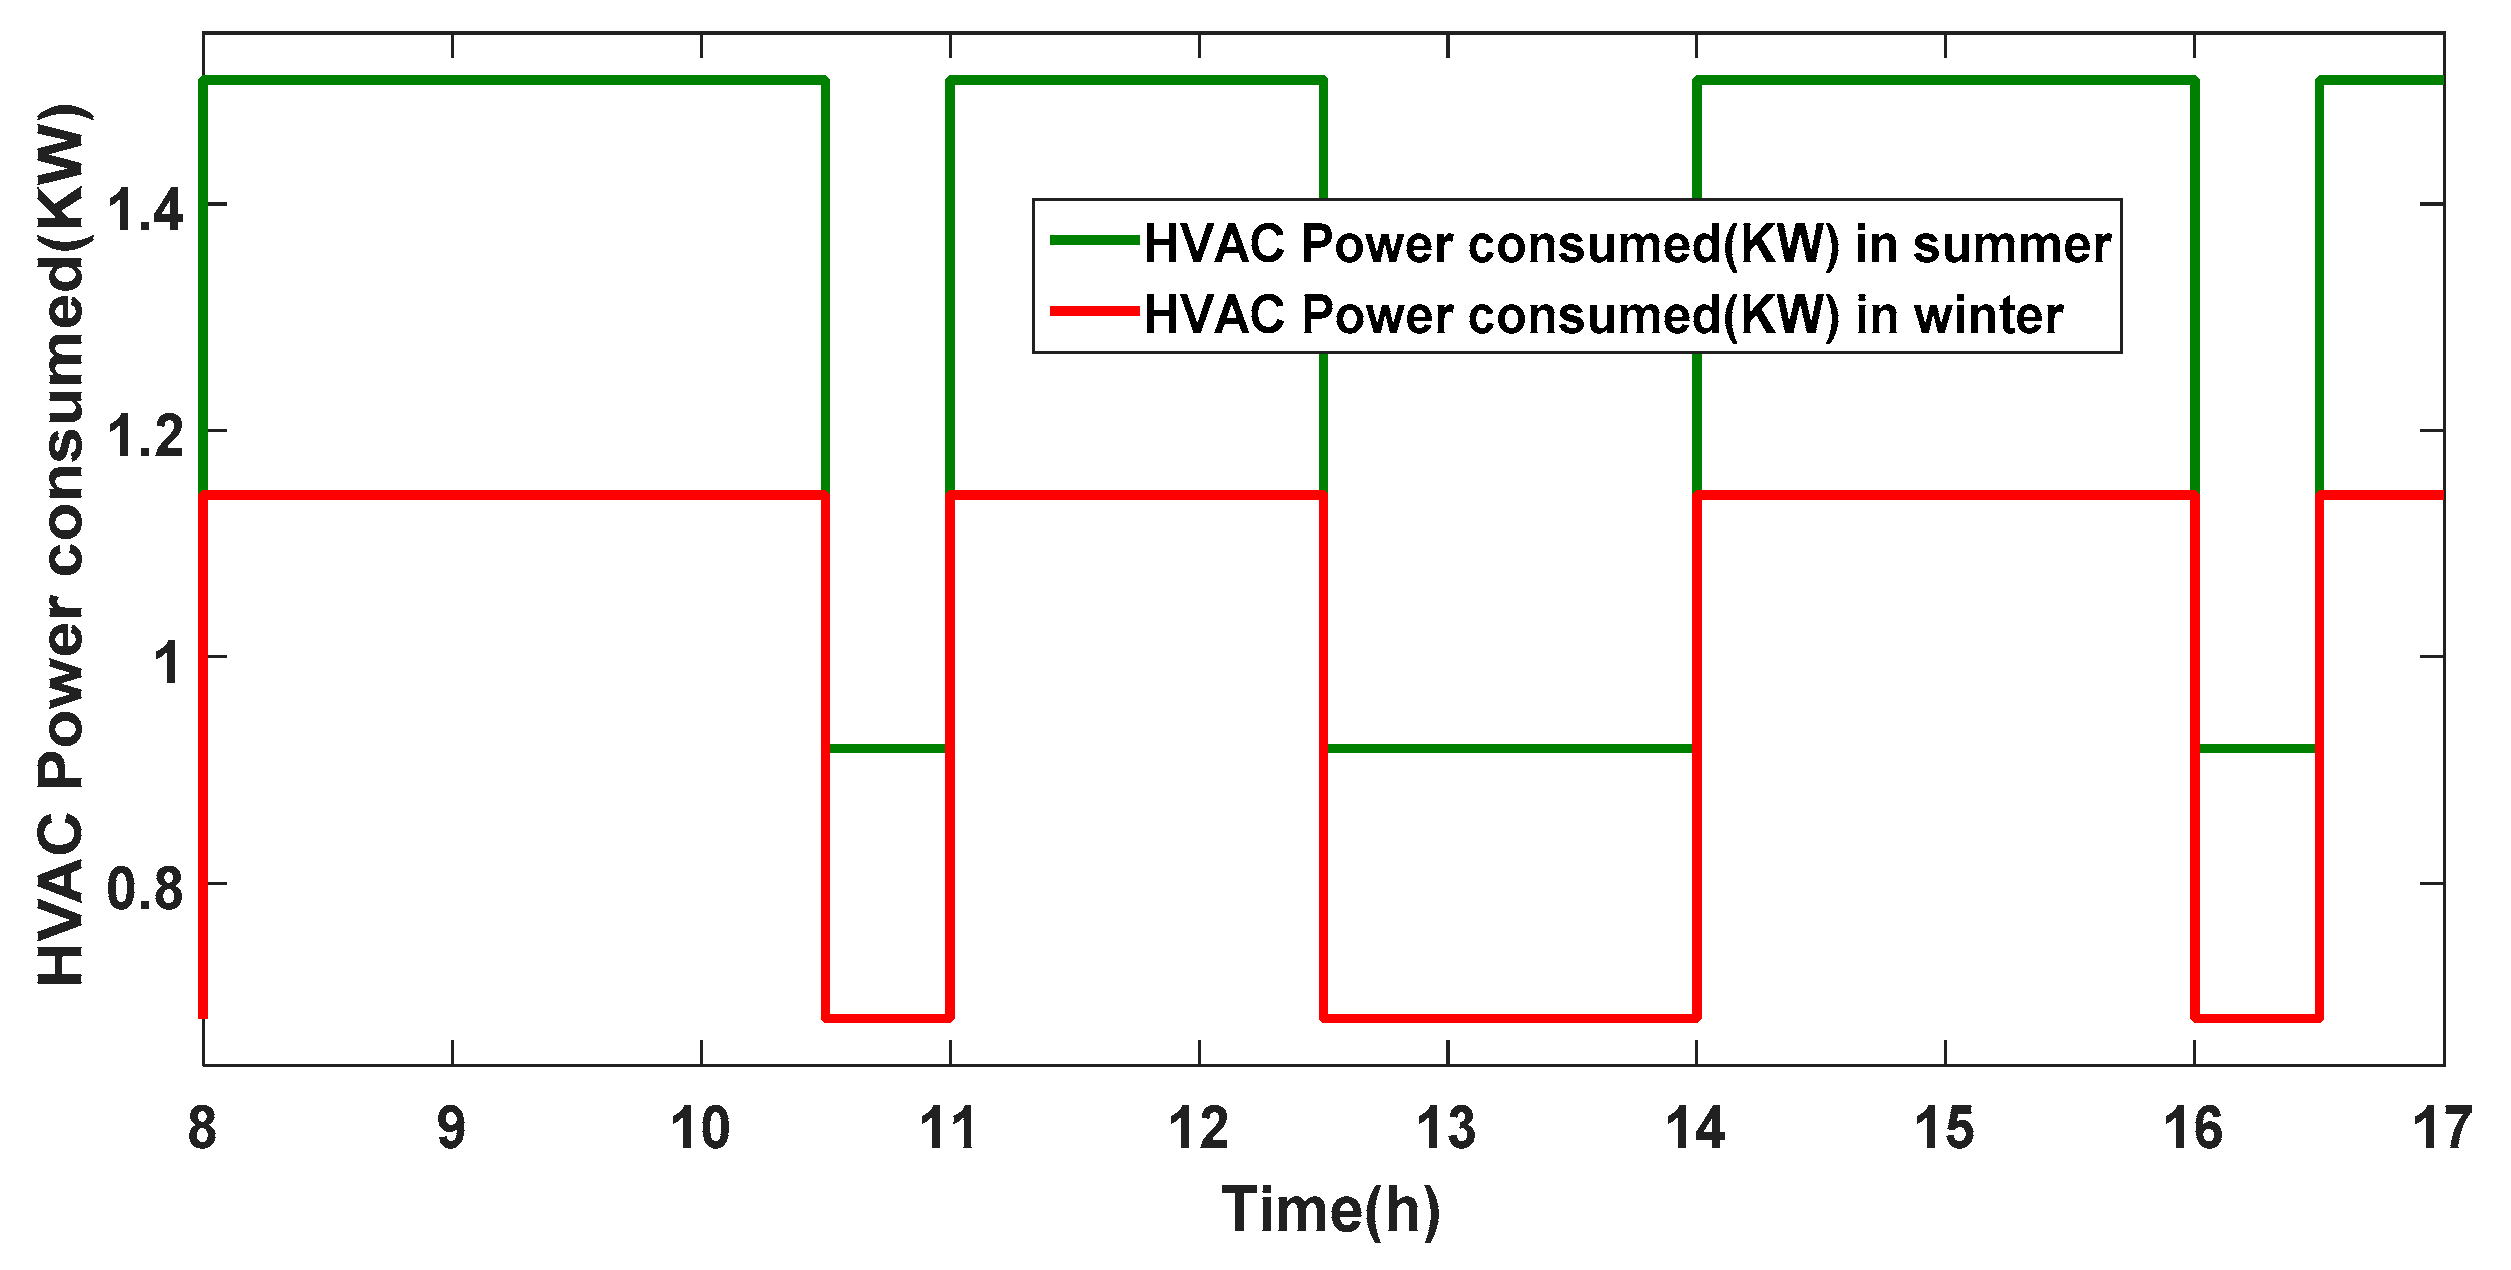
Office HVAC Energy Consumed during Summer and Winter

For the following result to be tabulated, the parameters and values were considered based on a normal 9000 Btu/ HVAC—see Appendix B (Table A1).
The graphs below, (Figure 19 and Figure 20) represent the electric power used to cool the office during summer and to heat during winter by the office HVAC and it is based on the model developed. We realized that for a specific office the desired temperature choice is 24 °C, while the power consumed is constant (1.658 KW) during summer and 1.235 KW and it is constant during the working hours.

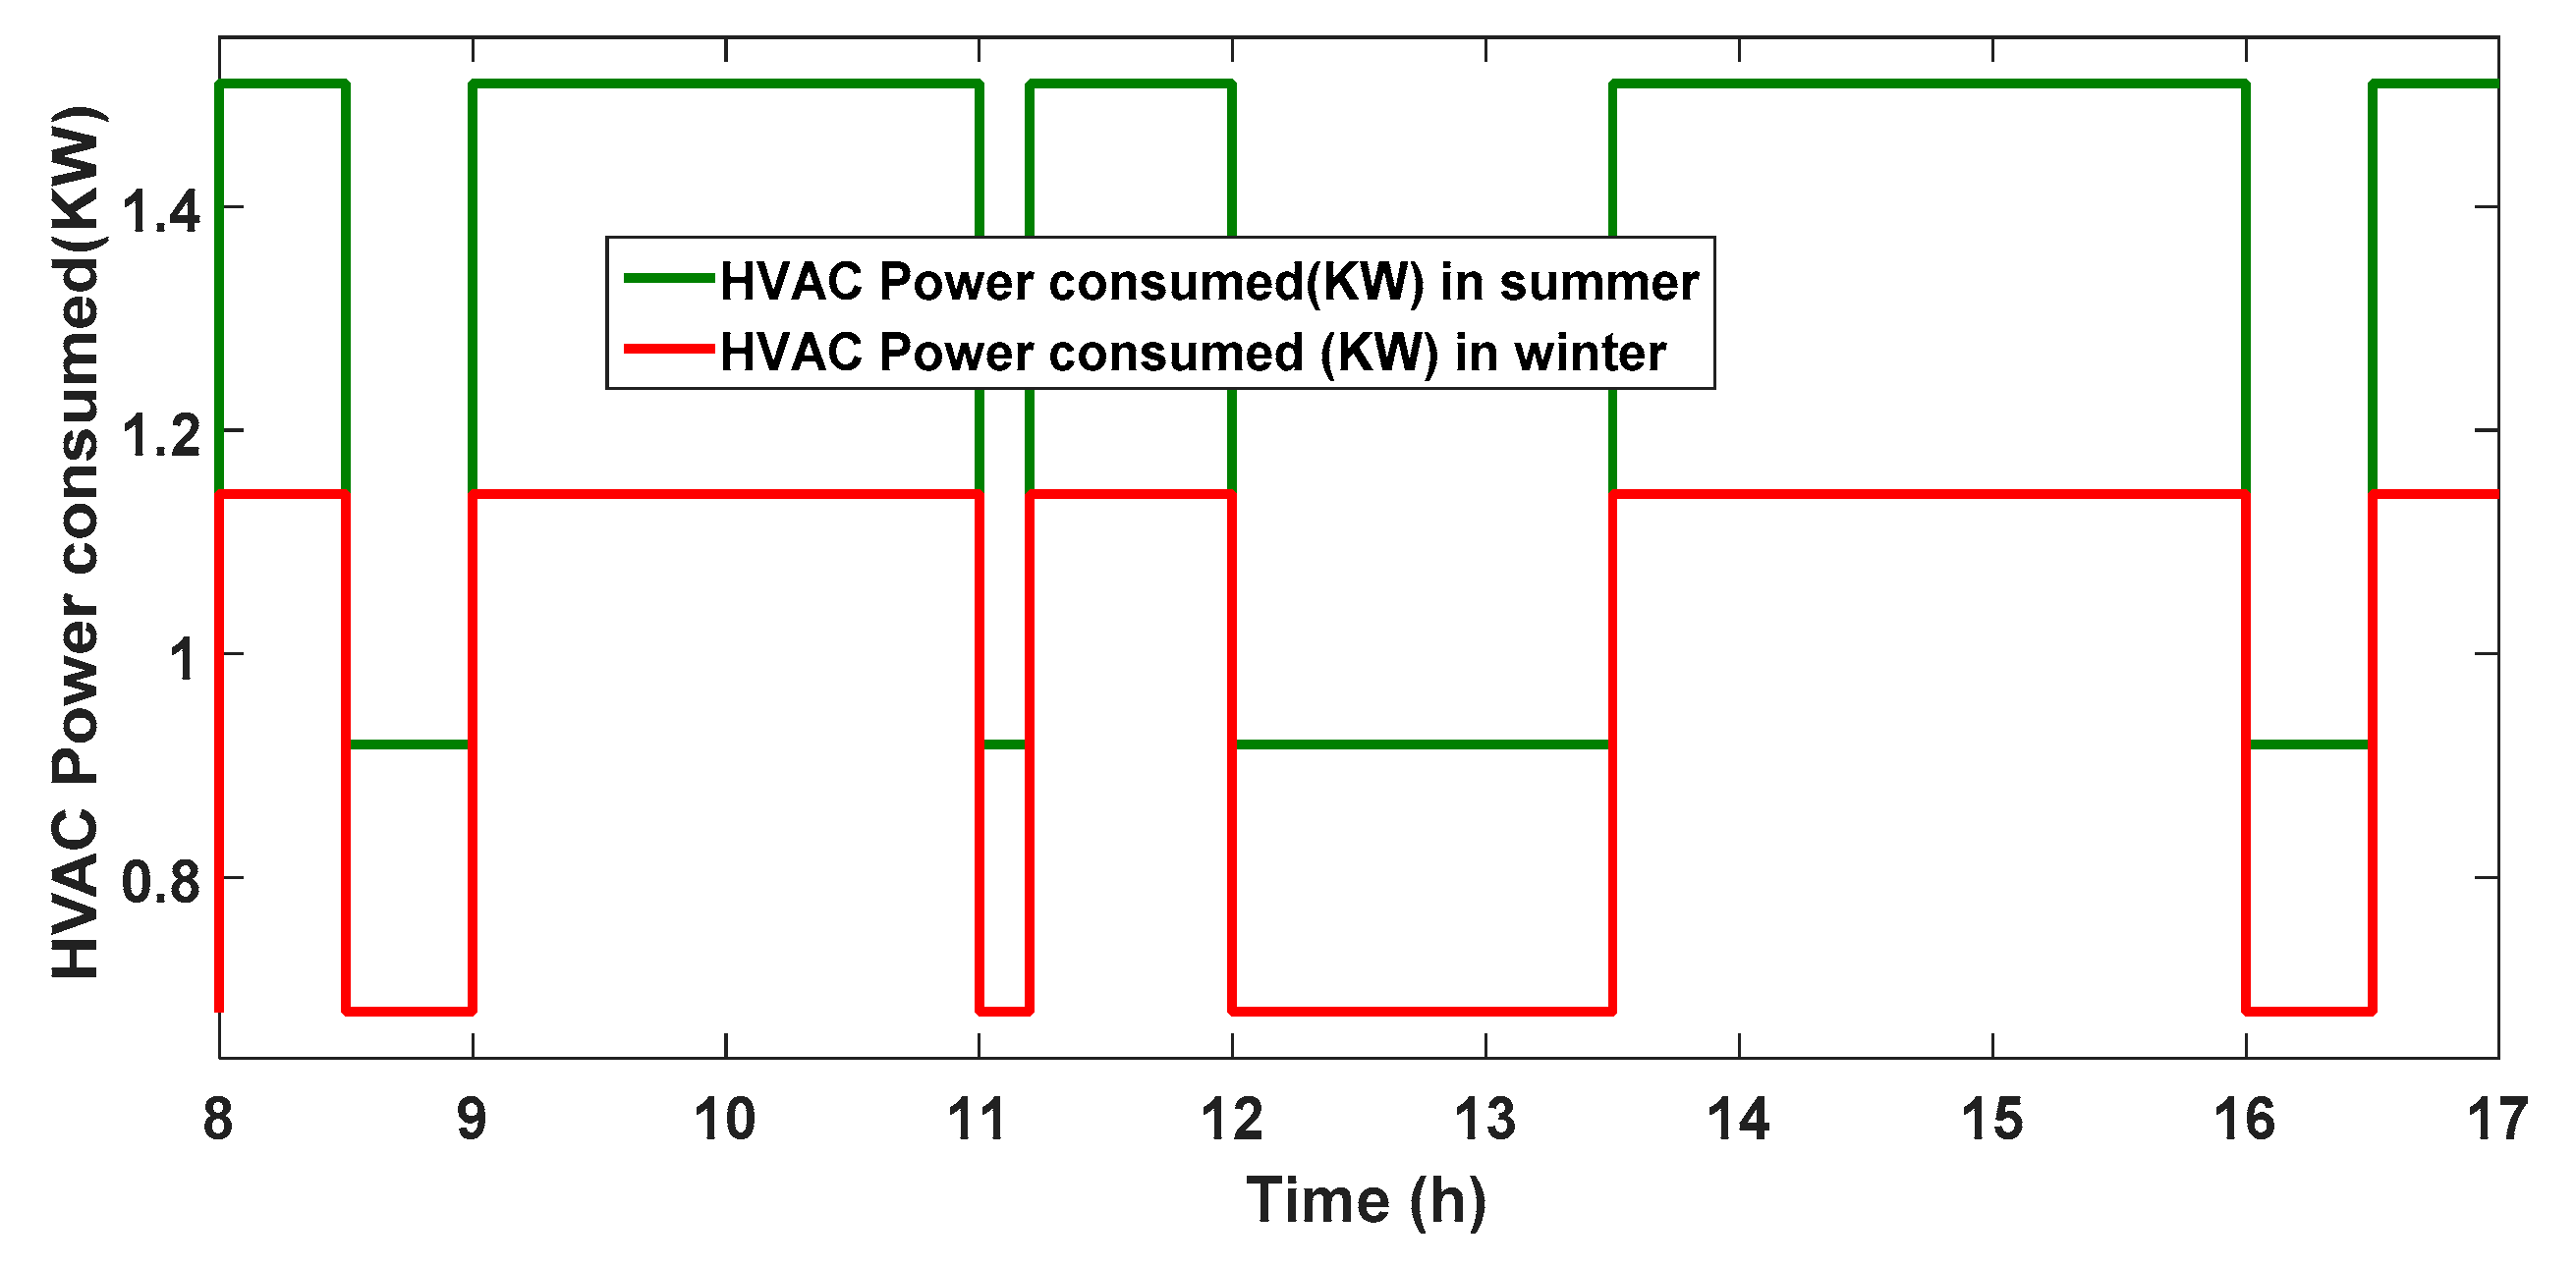
3.3. HVAC Power Consumed Based on Load, Temperature and Occupancy Control for Office

3.3.1. During Summer and Winter

The graphs in Figure 21 and Figure 22 below are simulated results of the HVAC power consumed after the loads control were combined with the temperature and occupancy control. When the threshold power is reached for offices 1 and 2 and offices 3 and 4, when they are occupied, the electricity utilized in summer is 1.51 KW and in winter 1.143 KW and when the offices are not occupied, the electricity utilized is 0.9188 KW and 0.68 KW respectively.

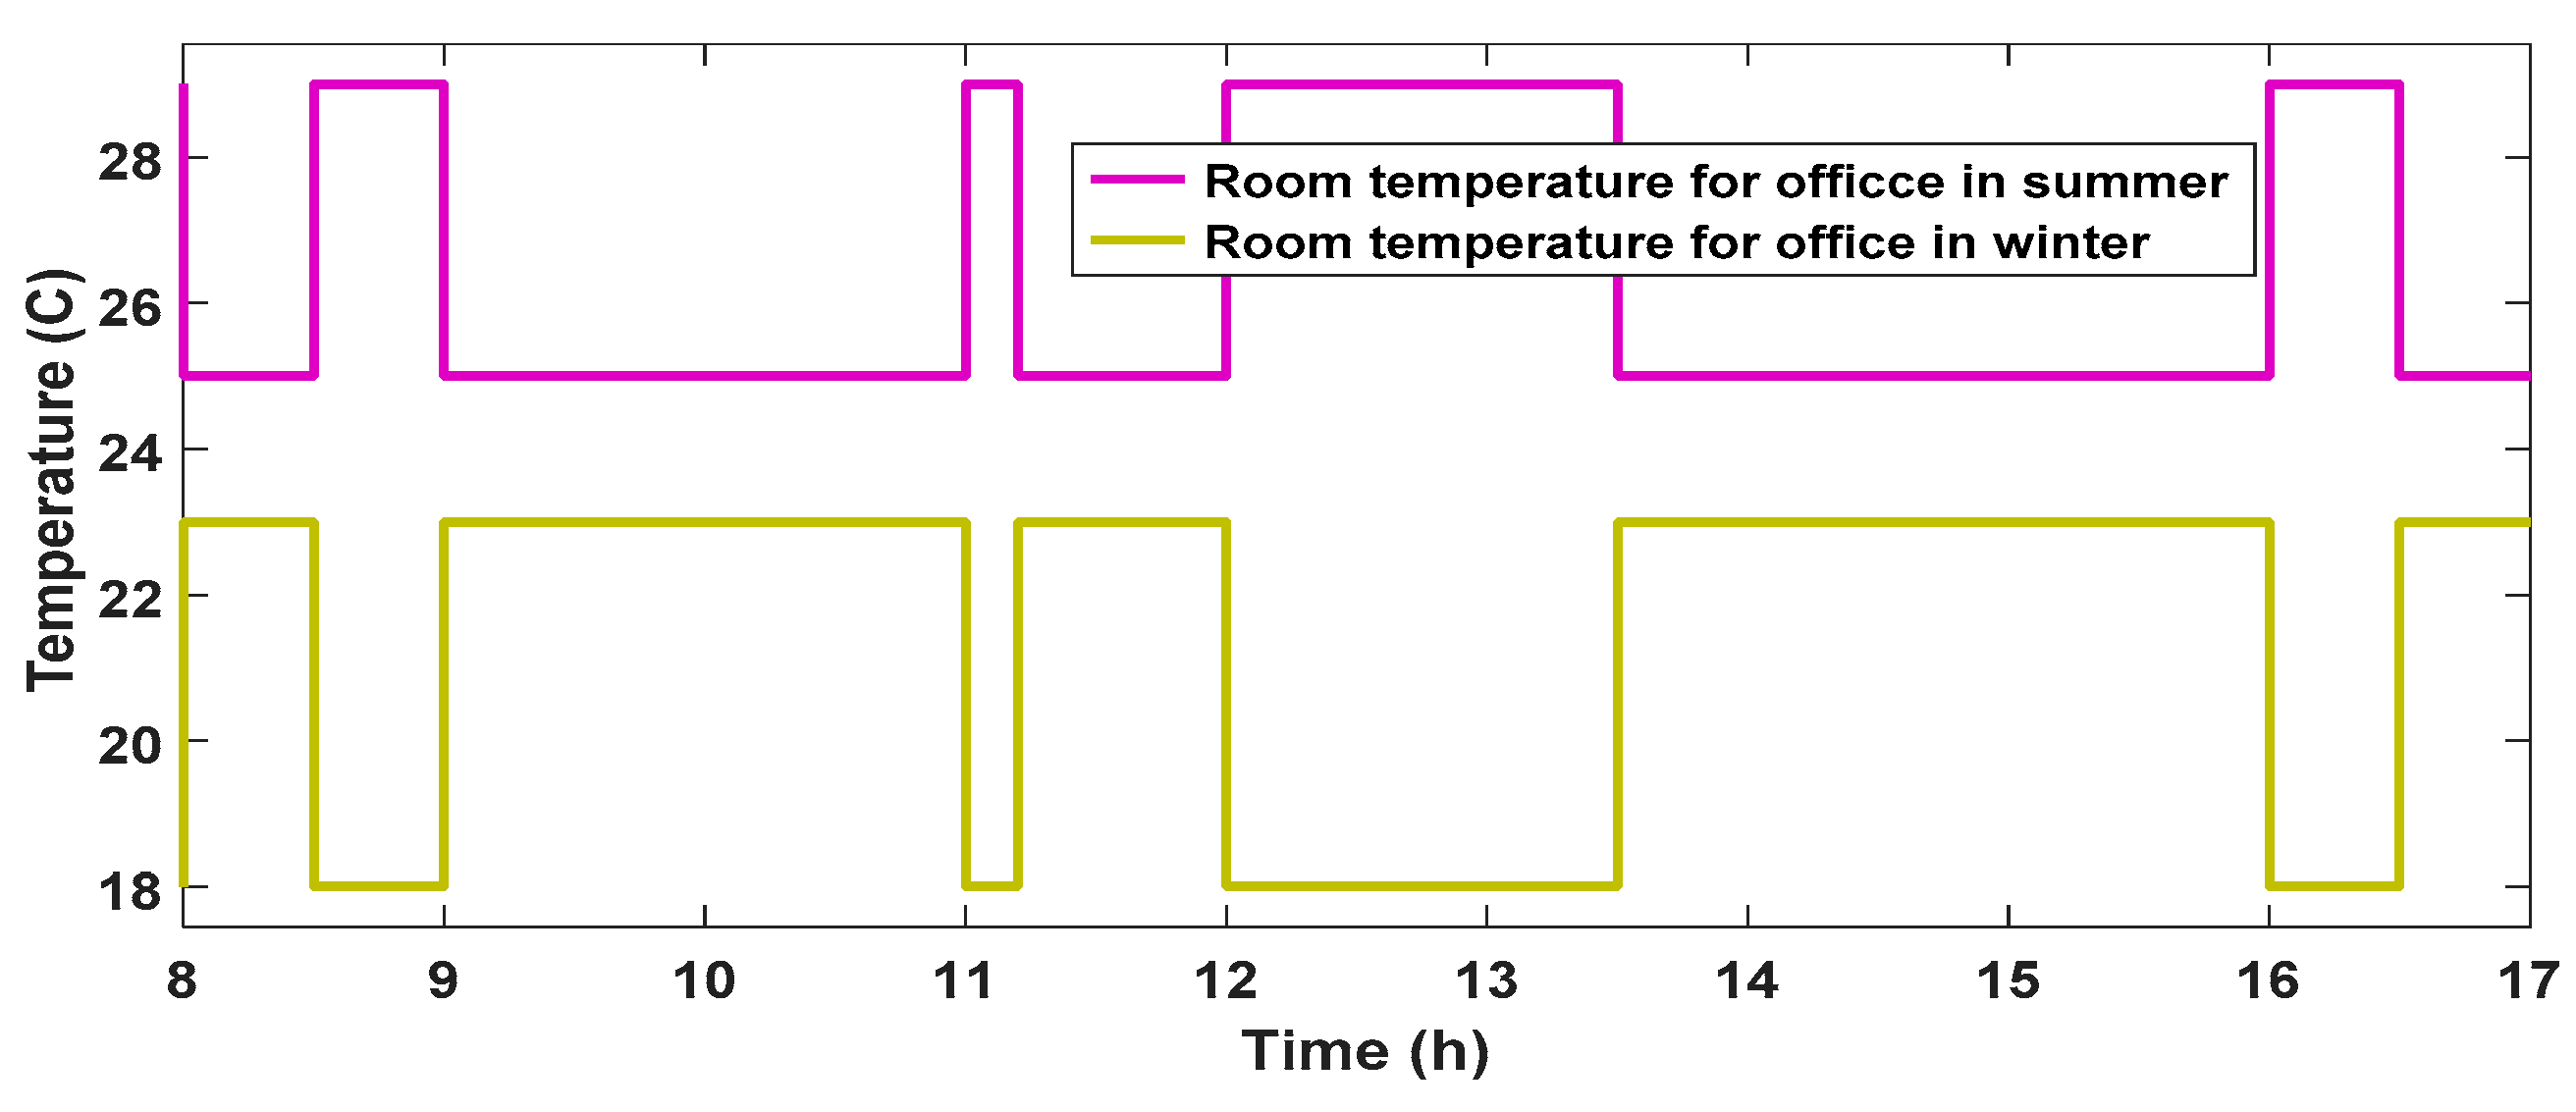
3.3.2. Room Temperature Behaviour

Due to equations (medium summer and winter) the energy power consumed by offices automatically reduces when the energy threshold set is reached in summer as in winter; the inside temperature which is the reference temperature (24 °C) in summer during the occupied period increased by one degree (25 °C) and in winter that temperature drops to 23 °C as indicated in Figure 23 This increase and drop of temperature have a positive impact on HVAC energy saved.

3.3.3. Total Energy Saved for Summer and Winter

Table 3 below lists the electric energy consumed and saved for the four offices in one year. Additionally, it shows an important saved of electric energy in summer for office 1 and 2 (18.23%) and in winter for office (26.11%). The final electric energy saved for the listed table shows that with the loads control added to the temperature and occupancy control contribute to further save energy.

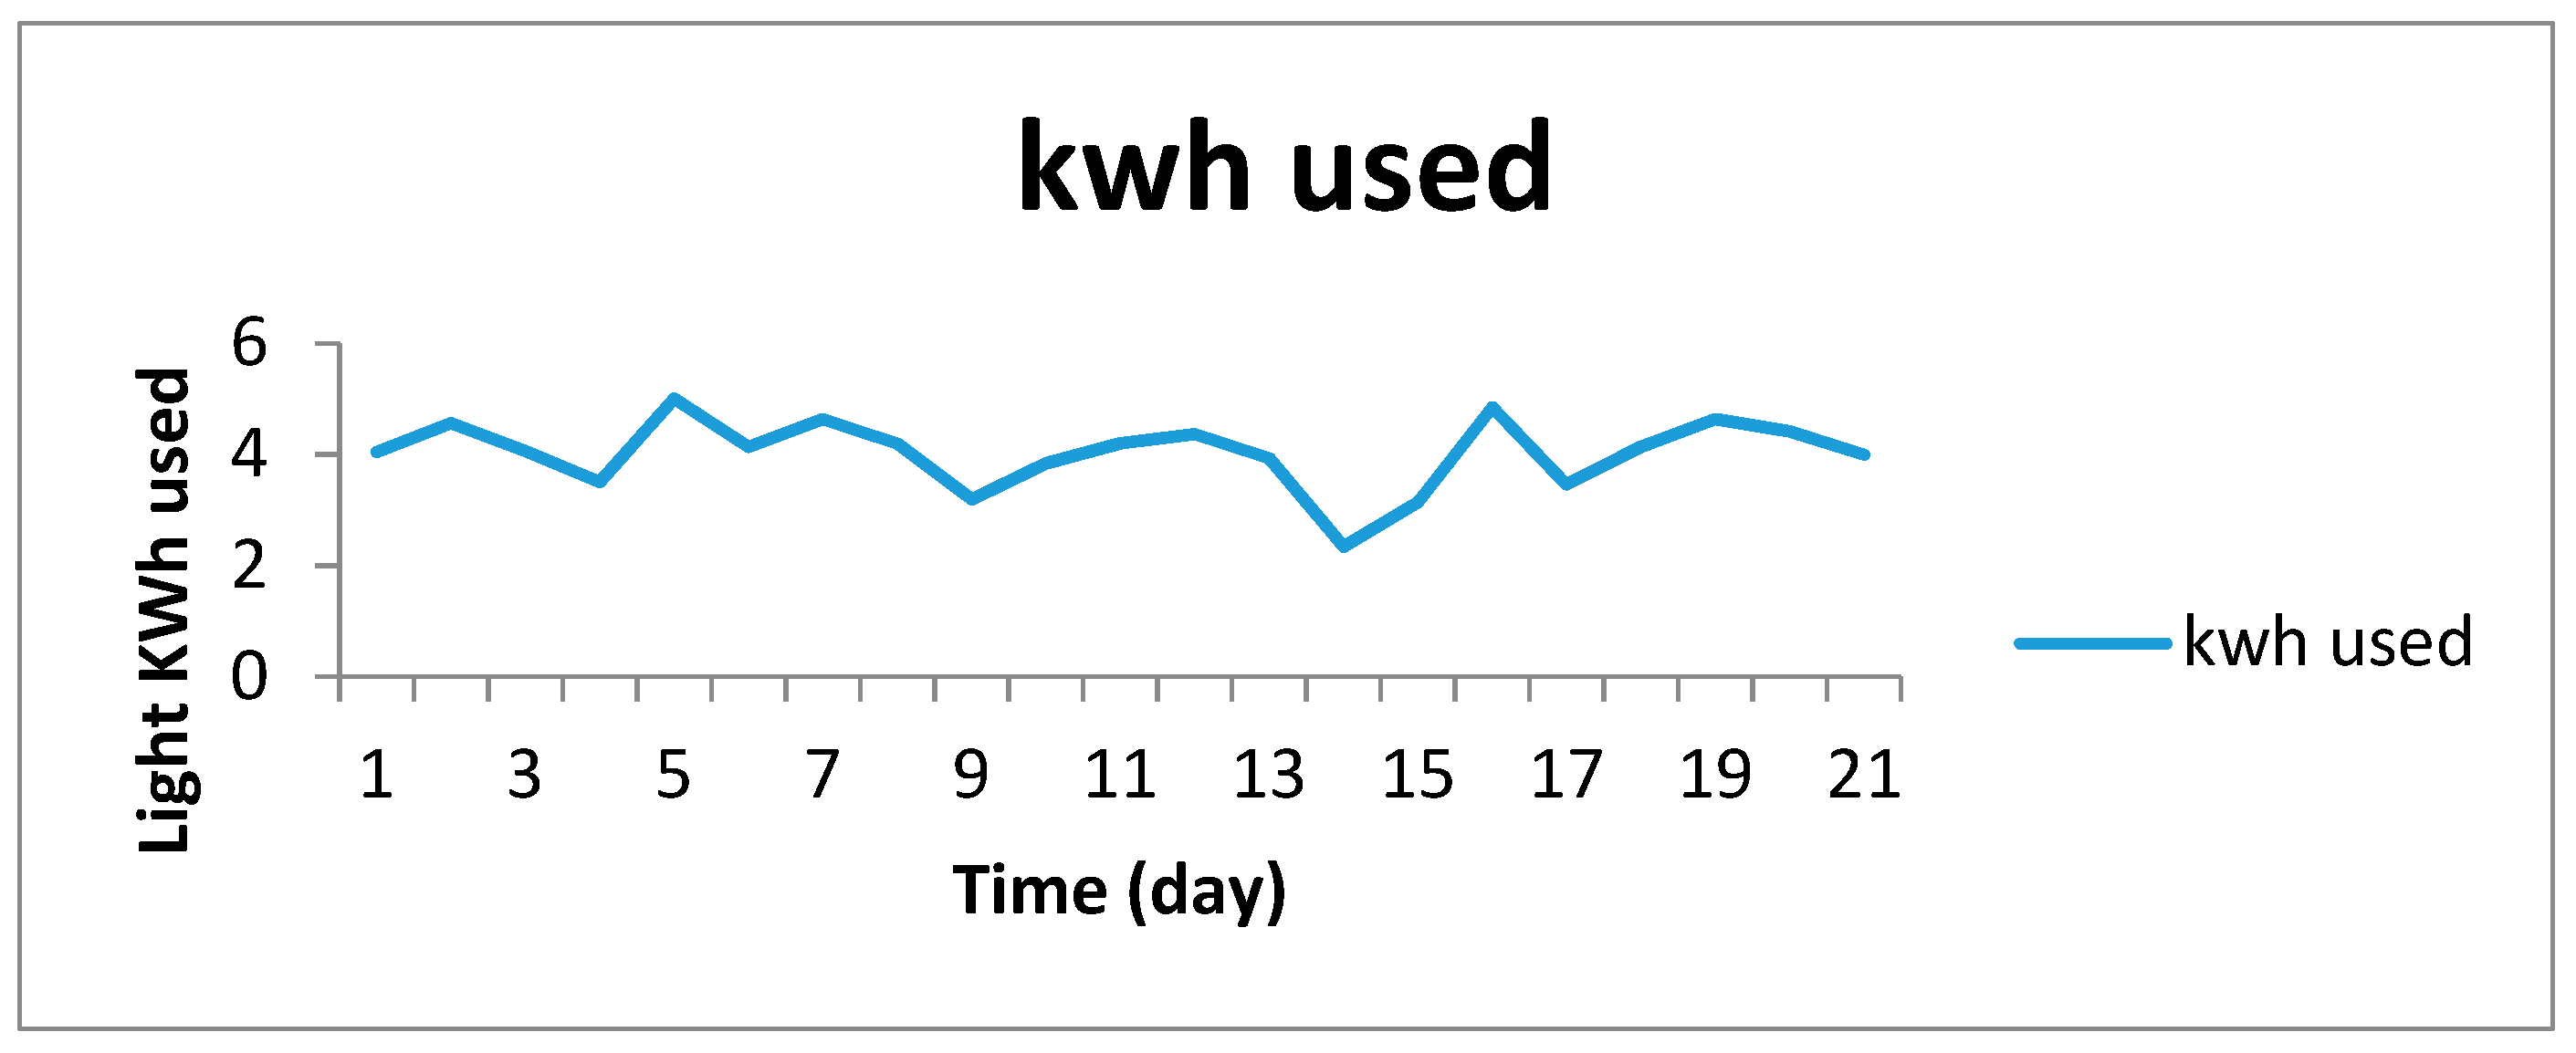
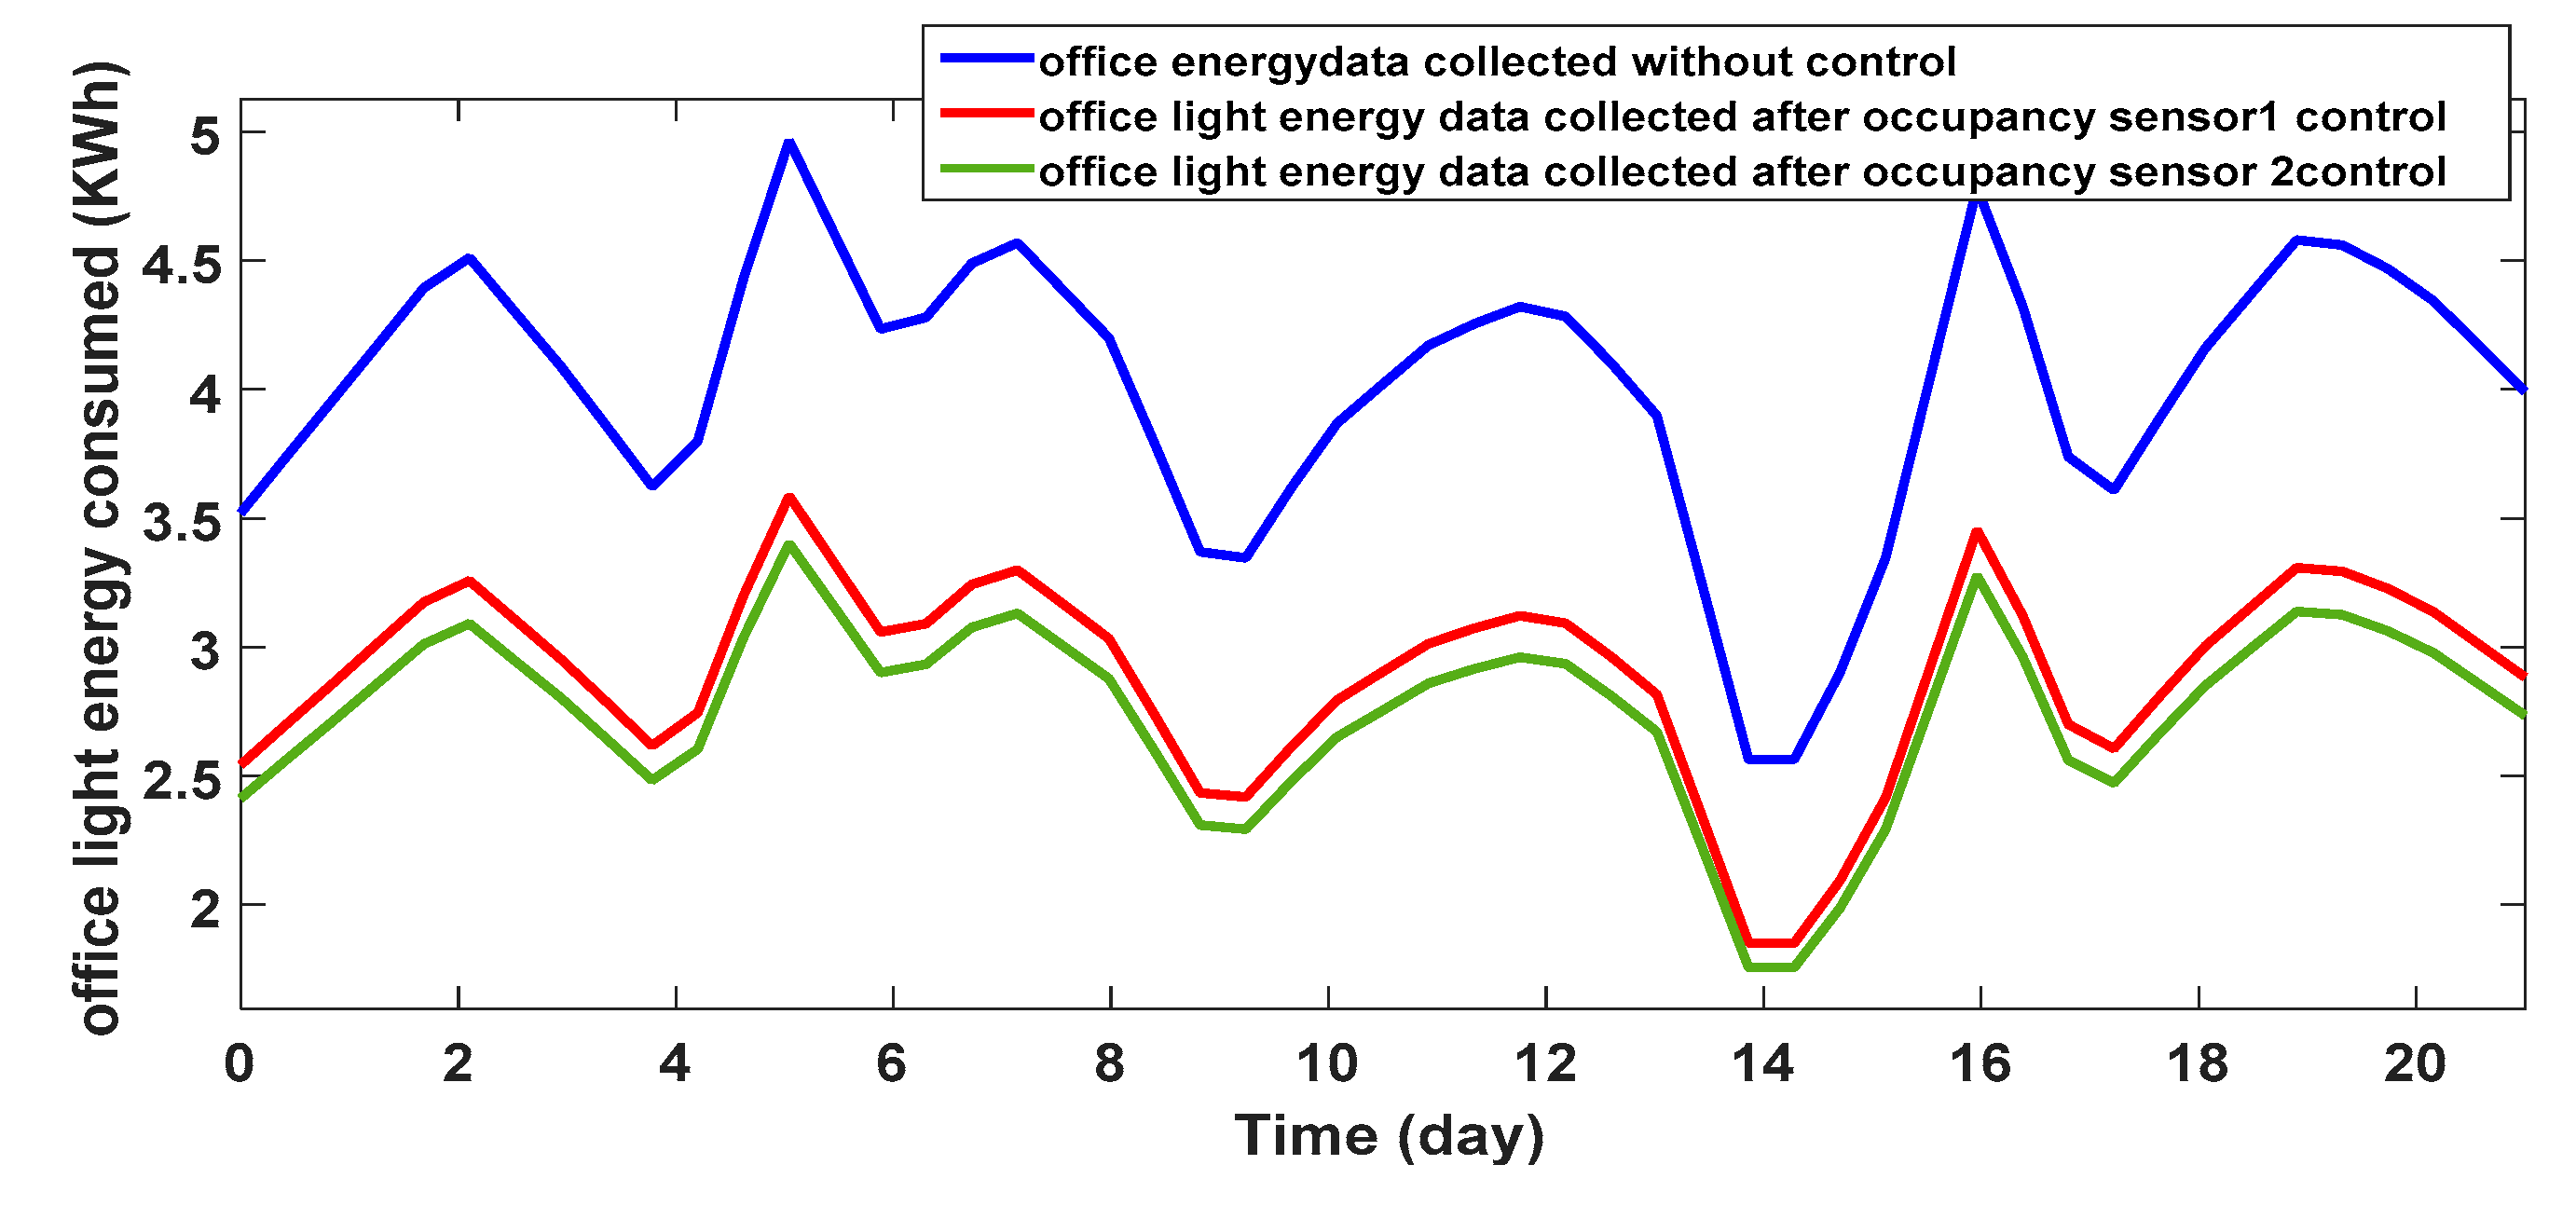
3.4. Offices’ Light Energy Consumed Results with Occupancy and During Summer after Simulation

The data for 5 fluorescent tubes was collected twice a day in September 2017, in the morning at 8:00 and in the afternoon at 17:00. This time was chosen based on the worker timetable. After a month (20) days we collected the data illustrated as a graph in Figure 24. This graph represents the energy consumed.

Offices (1–4) Light Energy Consumed Results with Occupancy Control

To be able to simulate the graph below, light energy data was collected in a specific office per day. To obtain the energy consumed per hour, the total energy consumed per day was divided by 9 since the work starts at 8 h and finish at 17 h. This hourly energy consumed is then used based on the occupancy sensor1 and sensor2 (Figure 16 and Figure 17) to obtain the light energy shown in Figure 25.
Based on those different occupancy sensors the light energy consumed was diminished for sensor 1 and further diminished for sensor 2, thus the table below, Table 4, records the comparison between those scenarios.
In Table 4 above, we see that the occupancy sensor control allows the initial light energy used without any control to drop from 27.8% from office 1 and 2 and 31% from office 3 and 4.

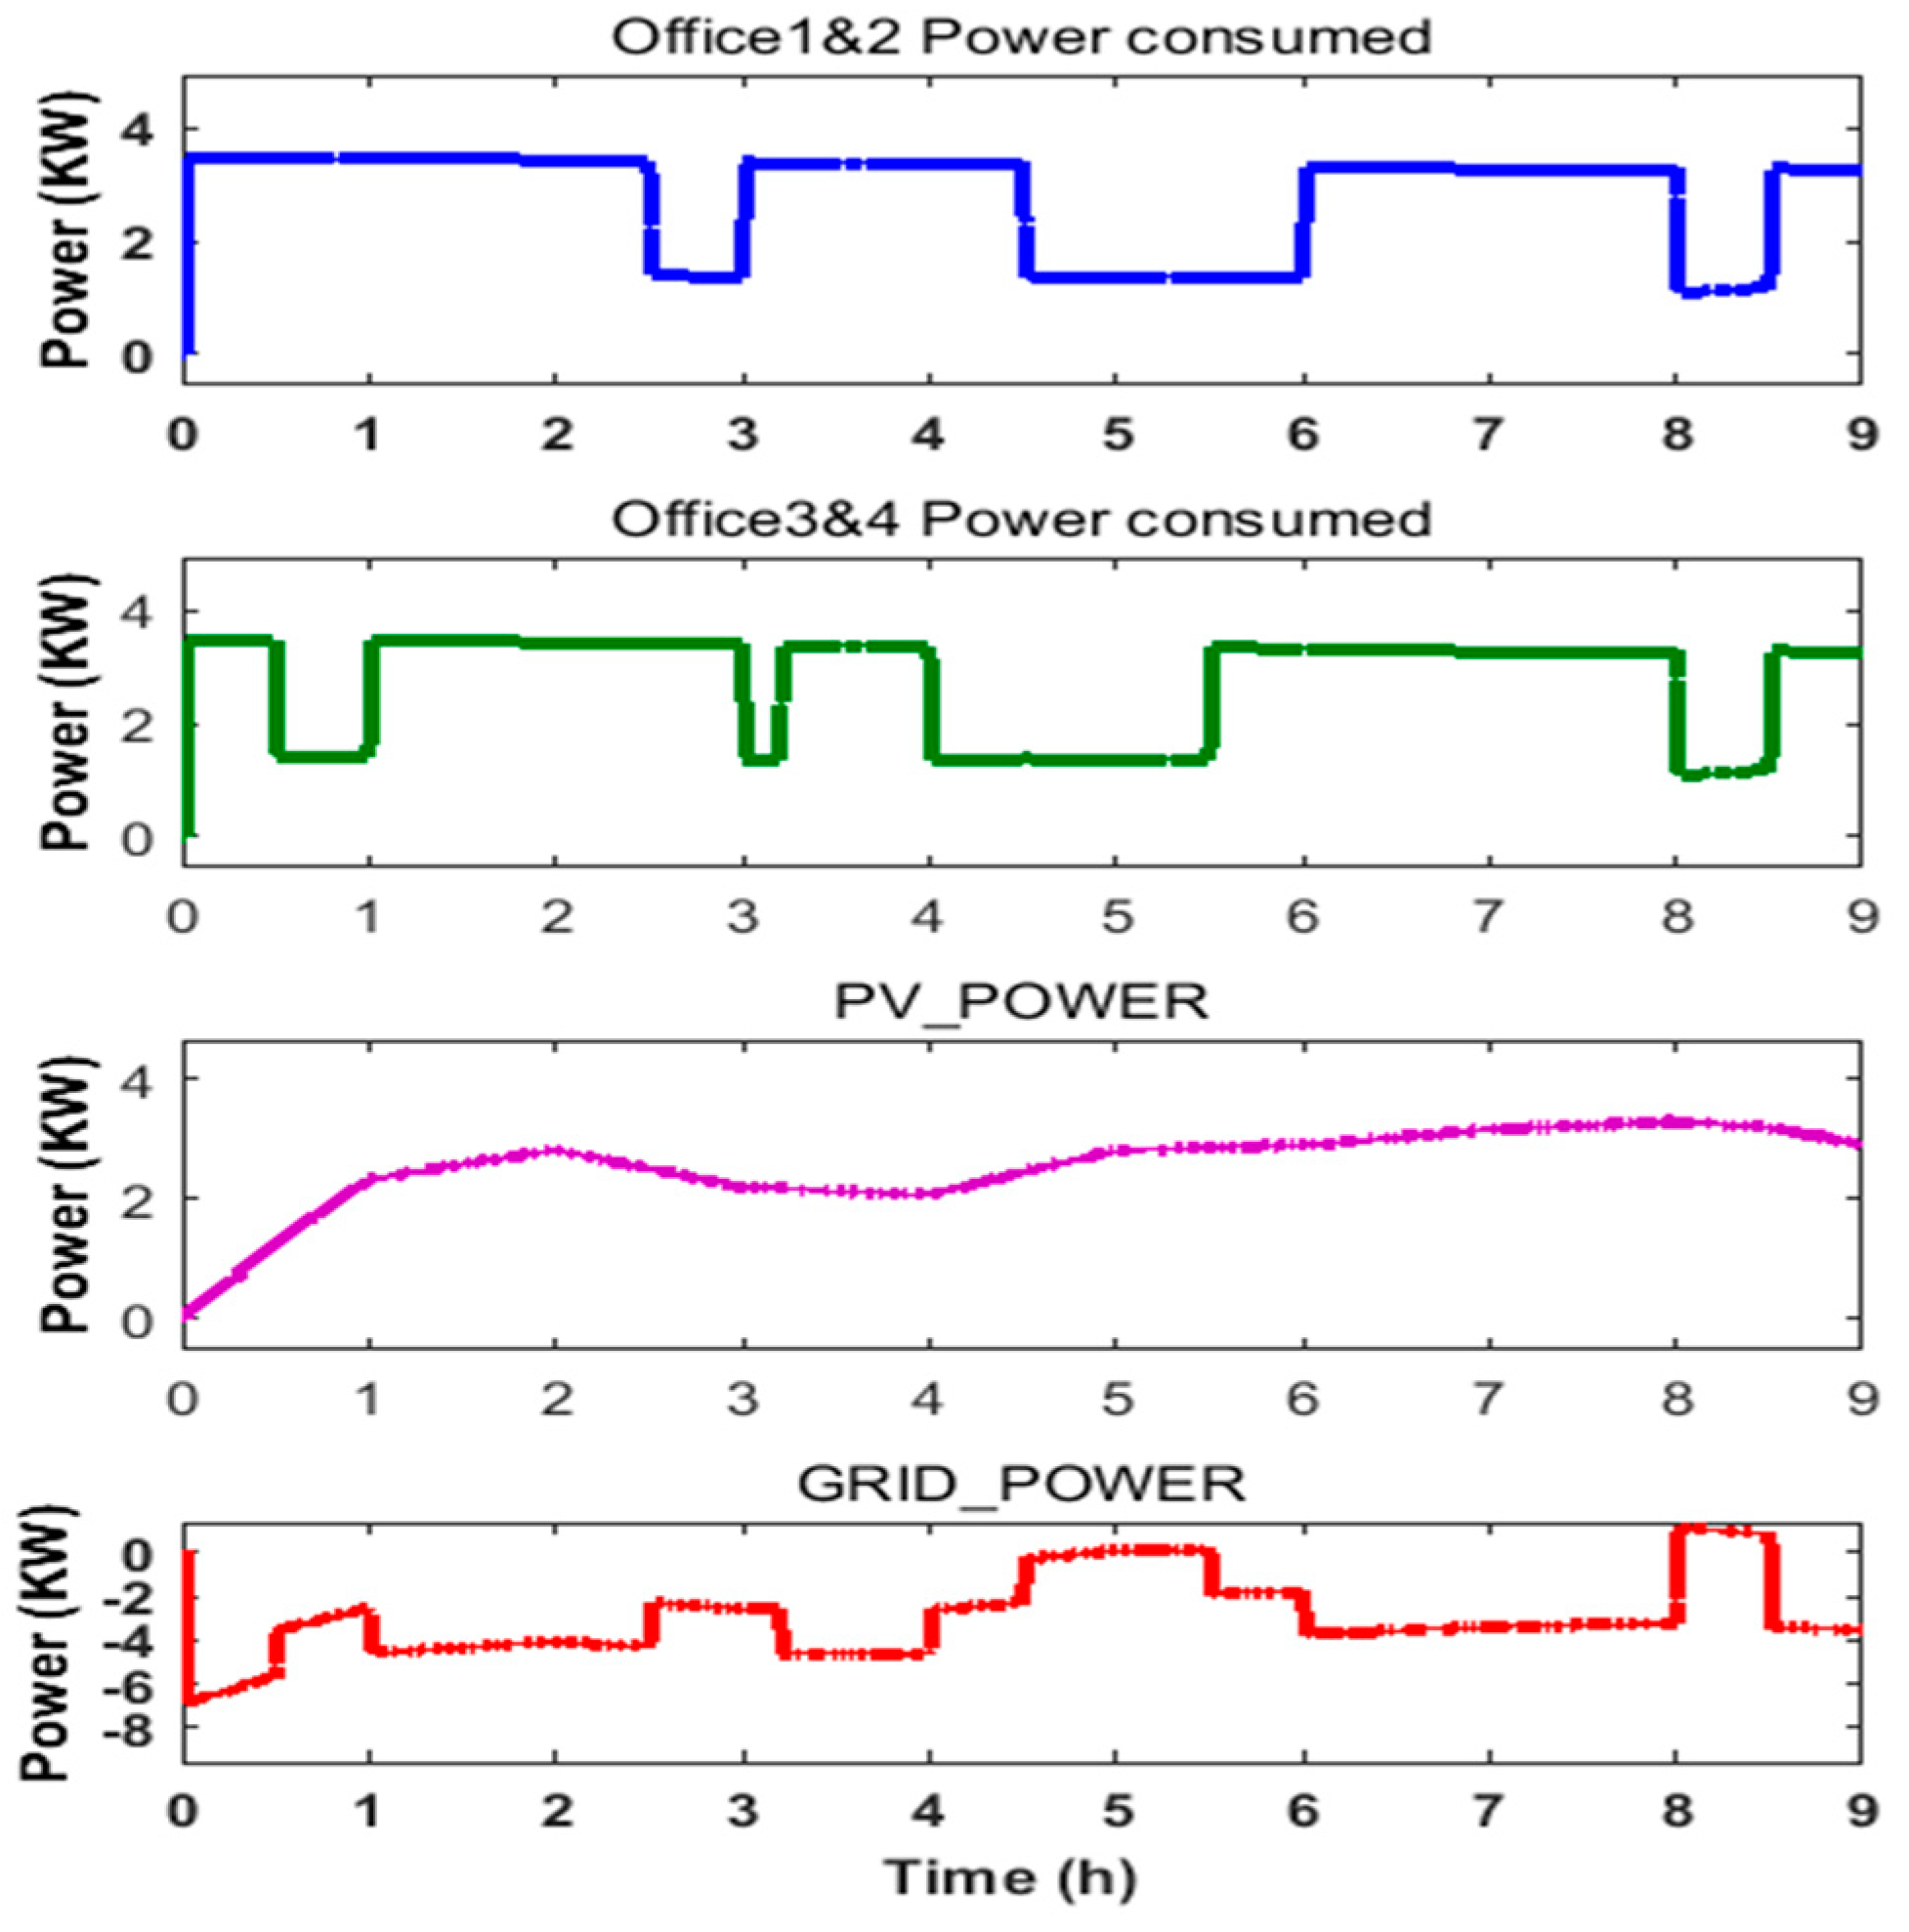
3.5. Load (HVAC, Light) Management Strategy Results Using PV and Grid

3.5.1. Fuzzy Logic Result

Due to the intelligence systems of the fuzzy logic, the grid system was not required to support the PV system to feed the load. The results shown in Figure 26 represent two samples of the fuzzy logic rule viewer where rule number 4 was chosen among eight (8) rules to show how it operates. The first column of Figure 26 shows that the membership of input PL is at a higher range, meaning that the offices’ power consumed is at 8.58 KWh. The second column also shows that the PV power generated 4.04 KWh is at a medium range as defined in the figure below. The centroid number is enumerated in the third column showing that the output is high, therefore the grid system, in this case, will be connected in series with the PV system.
Due to the fuzzy logic, all simulations obtained in March give different state results, as illustrated in the graph below (Figure 27). The graph shows when the grid was solicited to support the PV system (Grid control state is at 1) and when it was not (Grid control state is at 0).

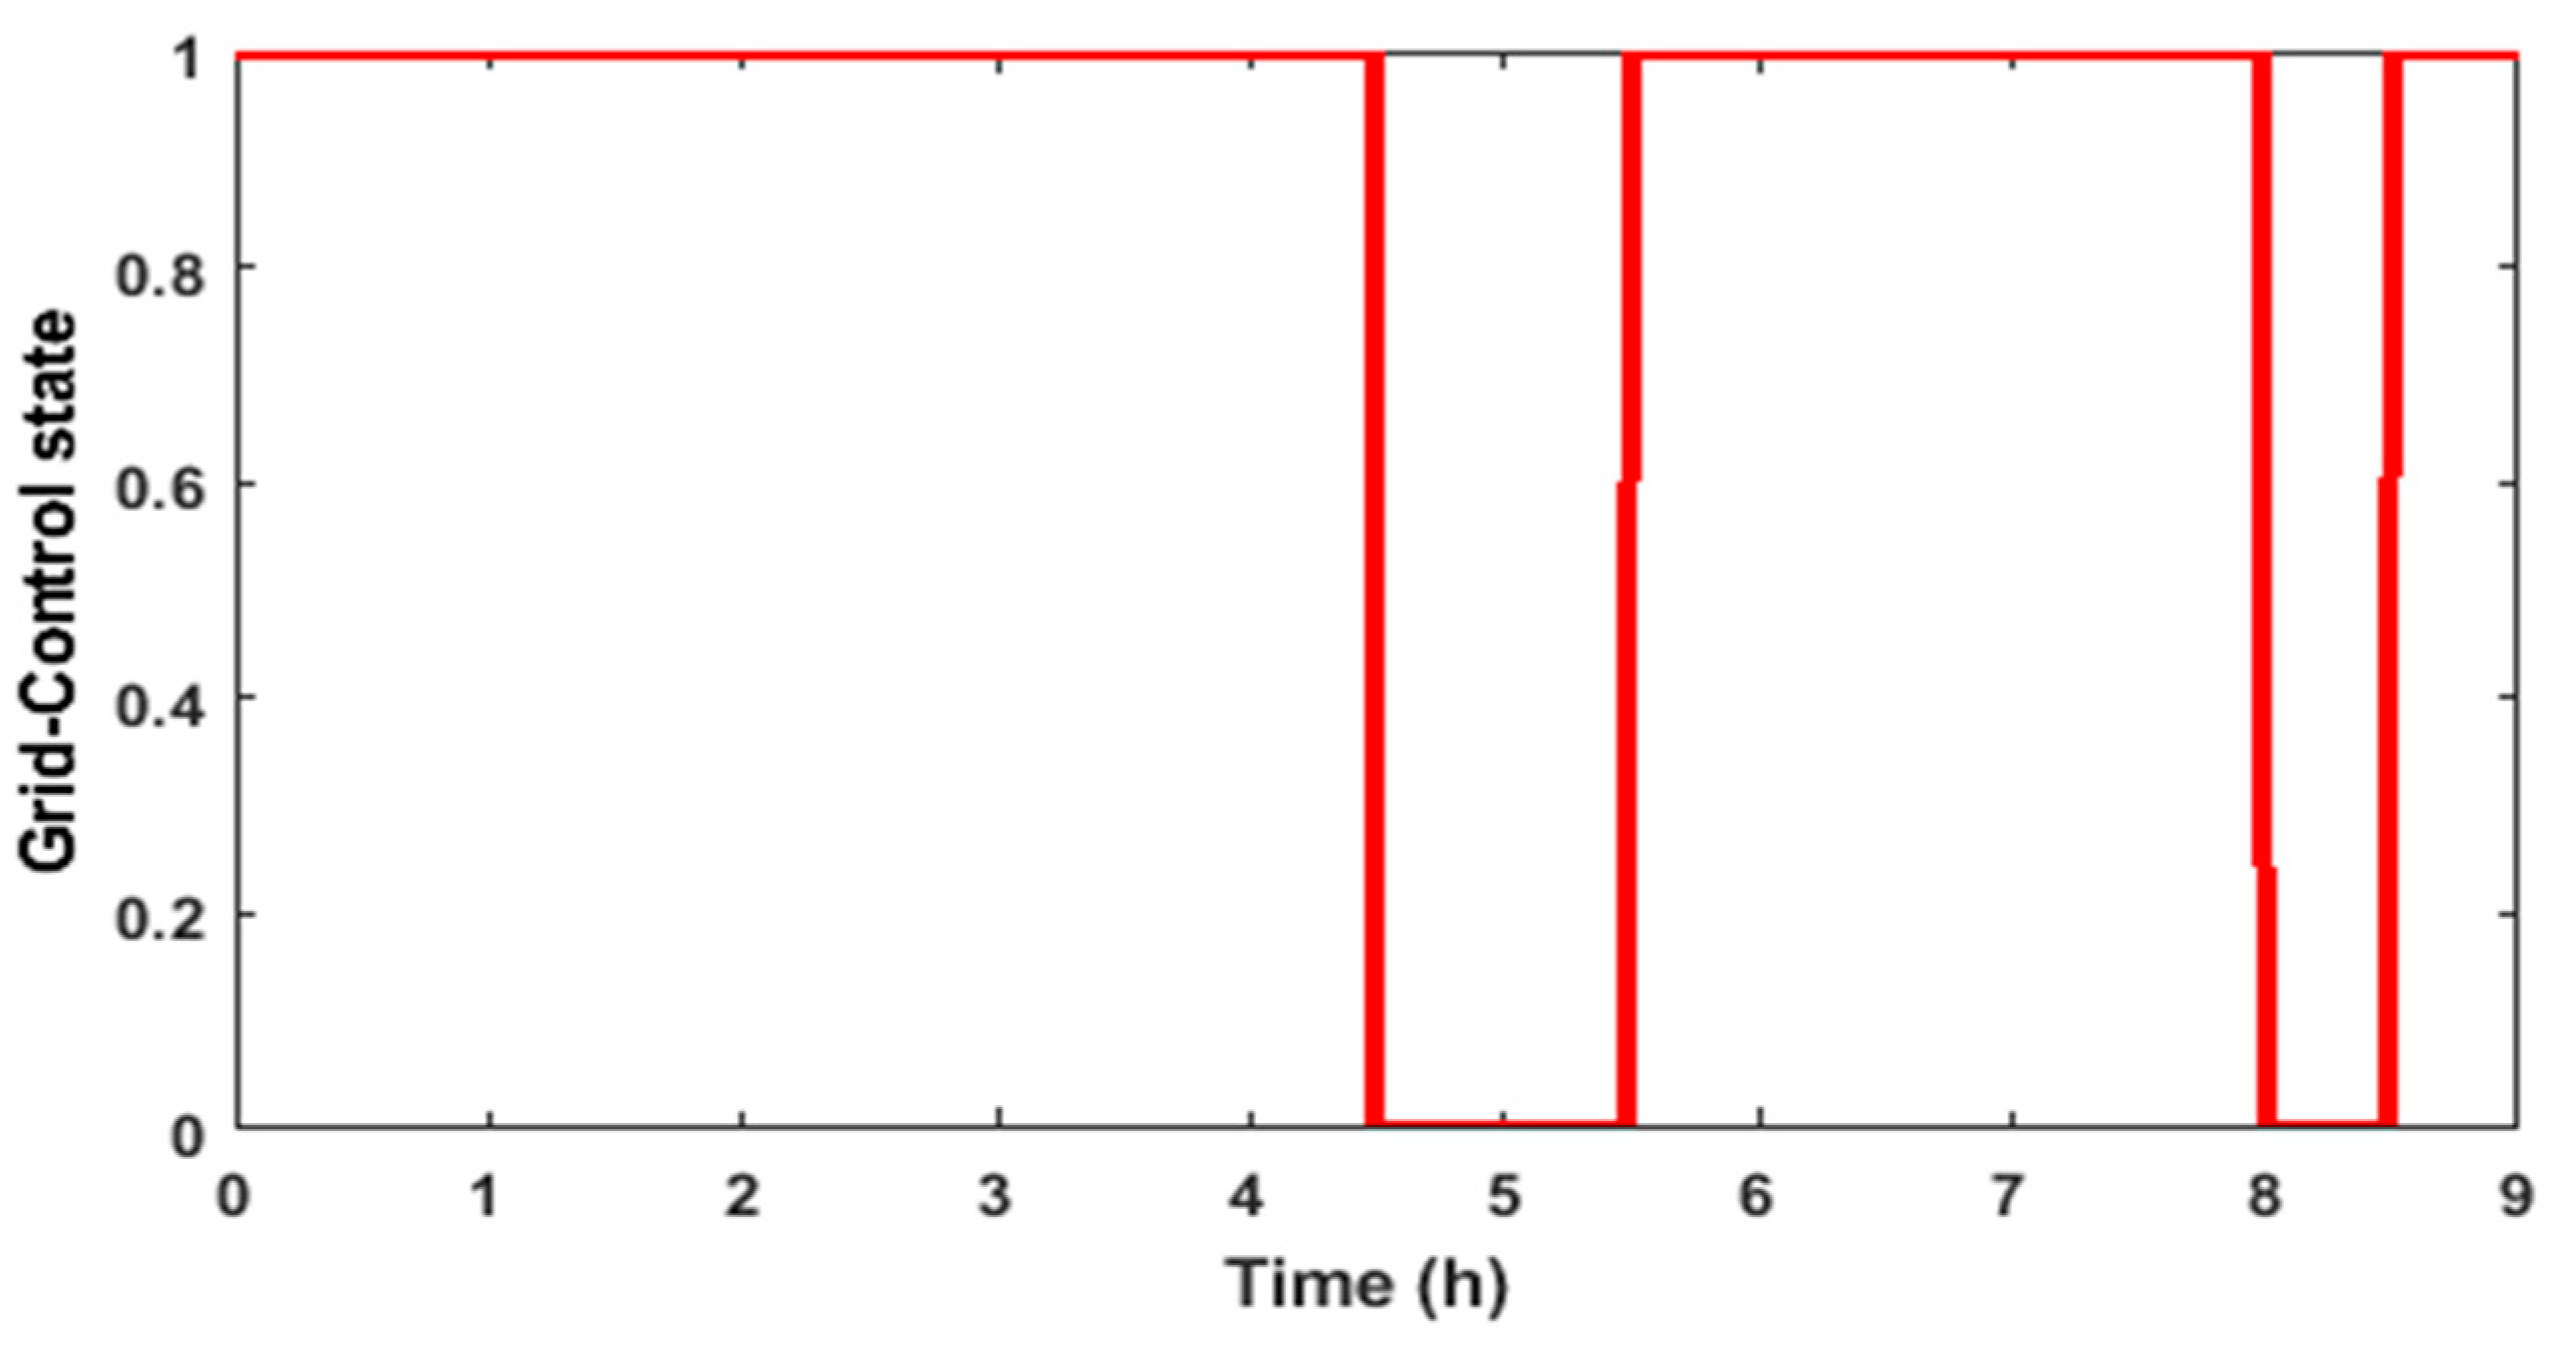
3.5.2. Office Load Management Results Due to the Intelligent Control of the PV and Grid

Simulated Results in Winter

The irradiation and temperature in Figure 28 are a one-day data collection and Figure 29 is a one-day simulation result in winter. The irradiation and temperature have an impact on the energy produced by the PV system (Figure 29 third graph). The first graph in Figure 29 shows how the offices load are fed by the PV system and the grid. Due to others results in the offices HVAC, lighting energy consumed in winter based on the occupancy control and temperature are lesser than other period of the year.
We can see in Figure 29 that during the working hours and when the offices are occupied, the PV system and the grid both supplied the room but priority is given to the PV system to further save energy or reduce the offices’ bills. So, at 8 h which is represented by 0 in these graphs which is when the workers start, at this time the irradiation and the temperature is at the lower values meaning that the PV system generates less power than the loads demand, therefore the grid system, in order to meet the demand, come into the feeding procedure. As soon as the PV become available (to be able to produce the necessary power), the grid system went off (0 W).
The table below (Table 5), resumed the PV energy generated, the total offices HVAC and light consumed, the grid energy supplied in one day due to the management strategy in the winter term.
Due to the high number of data (irradiation and temperature), MATLAB Simulink could not run a month or three months data on a one-hour basis. Hence, based on the one-day simulated result, an extrapolation technique was conducted to reach a three-month result. Therefore, the figure shown above (Figure 30), represents the PV system’s energy generated during the winter period.
The same method and technique were used to know the loads energy consumed from the PV and from the grid in others term of the year (Spring, Summer, Autumn).

3.6. Comparative Results for the Three Strategies Control Scenarios

The table below (Table 6), summarized the total energy saved in the three scenarios mentioned in Section 2.
We can see from the table below that the energy saved around the office building is more reliable for the last strategy that was initially proposed where the PV system integrated with the loads and occupancy temperature weather control has a saving percentage of 64% for HVAC and 74% for light.

4. Discussion

This research work was conducted to further minimize the energy consumption around the automated office building. Four offices were used to test the proposed energy management strategy. Different strategies were explored.
The HVAC model developed was based on the different seasons (summer and winter) and the energy consumption due to the temperature, occupancy. The load control strategy was explored, the temperature used to heat a room in winter when the office is occupied is different from when the office is non-occupied. The office loads, which were used as a control variable, also participated in the electric energy saved.
Due to the light data collected in offices, the occupancy control strategy was implemented in order to reduce the lamp energy consumed. Therefore, in this case, the employees’ working schedule was used as a sensor to track the presence of the employee in an office.
The integration strategy of the PV system with the temperature, occupancy, loads’ control was conducted to further reduce the energy consumed in office. A Grid-tied inverter technique was used. The irradiations and temperature data were collected as these two parameters were different during the year, so different terms or seasons was considered to extract the maximum solar energy. Temperature and irradiation had an impact on the energy generated by the PV system but the Perturb and MPPT technique were used to continuously track the maximum power point.
Another accomplishment in this work was the design of the fuzzy logic algorithm which was used to manage the office’s loads consumption by deciding exactly when the PV system would be supported by the grid to feed the needed office energy. This loads’ management allows the system to use the energy generated by the PV to its maximum.
In this work, an energy audit for offices was also conducted in order to determine the energy used by the office (HVAC, light) without any strategy management. The energy saved from the grid after implementing one of the intelligent strategies was also audited.
The results obtained in this research also demonstrated how intelligent strategy of load management in offices contribute to further reducing the electrical energy consumed over the period of a year and showed how the employee activities control or diminish or have an impact on the energy used. However, this research has some limitation. The HVAC mathematical modelled proposed in this paper based on fundamental principles of heat transfer and thermodynamics has limited input variable such as the characteristic of the HVAC and the physical properties of the office buildings. The HVAC energy consumed varies due to the uncontrolled outdoor temperature. The occupancy pattern drawn from this research could not include the information due to the changing dynamics of occupancy in individual offices due to the lack of a real motion detection installed. The amount of power varies with irradiation and temperature since they are not uniform through the day and varies with the season as sunlight change. The limited space allocated to pave the solar panel influenced the amount of power generated.
In conclusion, the entire results obtained in this research project confirm that to save a significant amount of energy around an automated office building, the occupancy activity, the temperature, the weather condition, the loads control should be combined with a PV system. This was the best intelligent strategy for loads management and should be implemented; in four offices 64% energy was saved for the operation of HVAC and 74% for the light.

5. Conclusions

This paper presented the research findings, discussions and analysis of the different results for the intelligent control strategy management in four offices where the office HVAC energy consumed model without control results were found. The energy consumed by the HVAC and light due to the temperature, occupancy sensor and season strategy control results were found.
The HVAC and light energy consumed’ result based on the loads control, added to others control such as temperature, occupancy and season control were also found. However, the office electric energy consumed’ results from the PV-system associated with the control variables such as temperature, occupancy, loads itself, season were found. The results showed that the energy saved for one year in four automated offices was greater when the energy consumed by the loads (HVAC and light) was controlled compared to when it was not controlled energy consumed by the loads was controlled, was greater compared to when it was not controlled (20.16% and 13.23%). This paper also shows that the lighting energy saved in offices due to the occupancy activities was 29.3% and the electric energy saved due to the PV system was 44%. Therefore, the total HVAC energy saved in four offices from the intelligent control strategy articulated above, with loads’ control and the PV assistance was 64.16% and the lighting 73.3%. Based on this proposed intelligent energy management strategy, the obtained energy saving in lightning is 48.3% higher than that found in the literature ([6,8]) (25% and 30%) and 23.34% higher than the energy saved in Reference [7]. This proposed intelligent system also allowed a considerable saved on the HVAC energy used which are 27.16% and 49.16 respectively higher than the one found in ([3,15]). However, due to the complexity of nature, improvement needs to be done.
Therefore, a recommendation for future work should consider the heat generated by employees, bulbs and computers into a control system to properly regulate the environment temperature which has an impact on the HVAC energy consumption and consequently on the office building. Develop a control system that will take into consideration the electricity price per unit to further reduce the electrical energy utilized. The HVAC using in office must be assigned to cover that specific office space, the inverter HVAC should be installed because of their abilities to save energy. Additionally, the LED lamp which is an energy efficient lighting technology must be installed in offices in order to reduce the amount of electricity used because LED wastes less heat energy compared to long tube lamp. The type of materials used and the architecture for office building need to be different from areas. The material and the architecture used must be favourable for the employee in term of energy saving and comfort.

Author Contributions

Conceptualization, S.P.C., S.I.N.T. and T.O.O.; methodology, S.I.N.T., S.P.C. and T.O.O.; software, S.I.N.T.; validation, S.I.N.T., S.P.C. and T.O.O.; formal analysis, S.I.N.T.; investigation, S.I.N.T.; resources, S.P.C and S.I.N.T.; data curation, S.I.N.T.; writing—original draft preparation, S.I.N.T.; writing—review and editing, S.I.N.T, T.O.O. and S.P.C.; visualization, S.P.C., S.I.N.T. and T.O.O.; supervision, S.P.C. and T.O.O.; project administration, S.P.C., T.O.O. and S.I.N.T.; funding acquisition, S.P.C. and T.O.O.

Funding

This research received no external funding.

Acknowledgments

Our gratitude and appreciation go to all members and colleagues of the Tshwane University of Technology (TUT) especially the Department of Electrical Engineering, for providing the facilities and material to conduct this research.

Conflicts of Interest

The authors declare no conflict of interest.

Appendix A

Figure A1. PV-Grid and Office Loads (HVAC, light) Complete Circuit.
Energies 12 04326 g0a1

Appendix B

Table A1. HVAC Components specifications.
ParameterValuesUnit
V ˙ H V A C 27 m 3   /min
C O P h e a t i n g 3.8-
C O P c o o l i n g 3.4-
P t o t 50Bar
C p 1.00KJ/Kg
T H V A C (summer)35°C
T H V A C (winter)11°C
T c o l d   24°C
Summer T m d 25°C
Winter T m d 23°C
T h o t 29°C
SHR0.7-

Appendix C

Table A2. PV system specifications.
SpecificationValue
Maximum Power4000 W
Voltage at maximum power point (Vmp)30.5 V
Current at maximum power point6.5 A
Open circuit voltage Voc48.2 V
Short circuit current Isc10 A
Series connected array ns5
Parallel strings np4

References

  1. International Energy Agency. Key World Energy Statistics; International Energy Agency: Paris, France, 2014; Available online: www.iea.org (accessed on 25 October 2019).
  2. Milford, D.R. Perspective on Energy Efficiency Building Regulations: A South African Perspective. Cidb. Available online: http://www.cidb.org.za (accessed on 25 October 2019).
  3. Jain, M.N.S. Indoor occupancy counting to enable smart energy efficient office buildings. In Proceedings of the IEEE International Conferences on Big Data and Cloud Computing (BDCloud), Social Computing and Networking (SocialCom), Sustainable Computing and Communications (SustainCom), Atlana, GA, USA, 8–10 October 2016. [Google Scholar]
  4. Marinakis, V.; Doukas, H.; Karakosta, C.; Psarras, J. An integrated system for buildings’ energy-efficient automation: Application in the tertiary sector. Appl. Energy 2013, 101, 6–14. [Google Scholar] [CrossRef]
  5. Zanoli, S.M.; Pepe, C.; Orlietti, L.; Barchiesi, D. A model predictive control strategy for energy saving and users comfort features in building automation. In Proceedings of the 19th International Conference on System Theory, Control and Computing (ICSTCC), Cheile Gradistei, Romania, 14–16 October 2015. [Google Scholar]
  6. Kaneko, Y.; Matsushita, M.; Kitagami, S.; Kiyohara, R. An energy-saving office lighting control system linked to employee’s entry/exist. In Proceedings of the IEEE 2nd Global Conference on Consumer Electronics (GCCE), Tokyo, Japan, 1–4 October 2013. [Google Scholar]
  7. Gonzalez, L.I.L.; Großekathöfer, U.; Amft, O. An intervention study on automated lighting control to save energy in open space offices. In Proceedings of the 2015 IEEE International Conference on Pervasive Computing and Communication Workshops (PerCom Workshops), St. Louis, MO, USA, 23–27 March 2015. [Google Scholar]
  8. Yun, G.Y.; Kim, H.; Kim, J.T. Effects of occupancy and lighting use patterns on lighting energy consumption. Energy Build. 2012, 46, 152–158. [Google Scholar] [CrossRef]
  9. Tiller, D.K.; Guo, X.; Henze, G.P.; Waters, C.E. Validating the application of occupancy sensor networks for lighting control. Lighting Res. Technol. 2010, 42, 399–414. [Google Scholar] [CrossRef]
  10. Yu, X.; Su, Y. Daylight availability assessment and its potential energy saving estimation—A literature review. Renew. Sustain. Energy Rev. 2015, 52, 494–503. [Google Scholar] [CrossRef]
  11. Martirano, L.; Parise, G.; Parise, L.; Manganelli, M. Simulation and sensitivity analysis of a fuzzy-based building automation control system. In Proceedings of the 2014 IEEE Industry Application Society Annual Meeting, Vancouver, BC, Canada, 5–9 October 2014. [Google Scholar]
  12. Cziker, A.; Chindris, M.; Miron, A. Fuzzy controller for a shaded daylighting system. In Proceedings of the 2008 11th International Conference on Optimization of Electrical and Electronic Equipment, Brasov, Romania, 22–24 May 2008. [Google Scholar]
  13. Cziker, A.; Chindris, M.; Miron, A. Implementation of fuzzy logic in daylighting control. In Proceedings of the 2007 11th International Conference on Intelligent Engineering Systems, Budapest, Hungary, 29 June–2 July 2007. [Google Scholar]
  14. Benezeth, Y.; Laurent, H.; Emile, B.; Rosenberger, C. Towards a sensor for detecting human presence and characterizing activity. Energy Build. 2011, 43, 305–314. [Google Scholar] [CrossRef]
  15. Qiu, L.; Wei, L.; Li, C. Applying research of the control strategy and algorithm system on intelligent building. In Proceedings of the Internationl Conference on Measuring Technology and Mechatronics Automation, Changsha, China, 13–14 March 2010. [Google Scholar]
  16. Martirano, L.; Manganelli, M.; Parise, L.; Sbordone, D.A. Design of a fuzzy-based control system for energy saving and users comfort. In Proceedings of the 14th International Conference on Environment and Electrical Engineering (EEEIC), Krakow, Poland, 10–12 May 2014. [Google Scholar]
  17. Parise, G.; Martirano, L. Impact of building automation, controls and building management on energy performance of lighting systems. In Proceedings of the Industrial & Commercial Power Systems Technical Conference—Conference Record 2009 IEEE, Calgary, AB, Canada, 3–7 May 2009. [Google Scholar]
  18. Martirano, L. A smart lighting control to save energy. In Proceedings of the Intelligent Data Acquisition and Advanced Computing Systems (IDAACS), 2011 IEEE 6th International Conference, Prague, Czech Republic, 15–17 September 2011. [Google Scholar]
  19. Martirano, L. Lighting systems to save energy in educational classrooms. In Proceedings of the 2011 10th International Conference on Environment and Electrical Engineering (EEEIC), Rome, Italy, 8–11 May 2011. [Google Scholar]
  20. Chen, X.; Yang, H.; Lu, L. A comprehensive review on passive design approaches in green building rating tools. Renew. Sustain. Energy Rev. 2015, 50, 1425–1436. [Google Scholar] [CrossRef]
  21. Jiang, Z.; Eichi, H.R. Design, modeling and simulation of a green building energy system. In Proceedings of the 2009 IEEE Power & Energy Society General Meeting, Calgary, AB, Canada, 26–30 July 2009. [Google Scholar]
  22. Calcedo, J.G.S.; Rodriguez, F.L. Analysis of the performance of a high efficiency administrative building in Spain. Int. J. Green Energy 2017, 14, 55–62. [Google Scholar] [CrossRef]
  23. Coma, J.; Perez, G.; Sole, C.; Castell, A.; Cabeza, L.F. Thermal assessment of extensive green roofs as passive tool for energy savings in buildings. Renew. Energy 2015, 85, 1106–1115. [Google Scholar] [CrossRef] [Green Version]
  24. Mpelogianni, V.; Groumpos, P.; Tsipianitis, D.; Mantas, P.; Michos, S. Fuzzy inference tool for the achievement of sustainable energy solutions. In Proceedings of the 2015 6th International Conference on Information, Intelligence, Systems and Applications (IISA), Corfu, Greece, 6–8 July 2015. [Google Scholar]
  25. Weber, L. Energy Relevan Decisions in Organizations within Office Buildings; Swiss Federation Institute of Technology: Zurich, Swiss, 2000. [Google Scholar]
  26. Mastelic, J.; Emery, L.; Previdoli, D.; Papilloud, L.; Cimmino, F.; Genoud, S. Energy management in public building: A case study co-designing the building energy management system. In Proceedings of the 2017 International Conference on Engineering, Technology and Innovation (ICE/ITMC), Funchal, Portugal, 27–29 June 2017. [Google Scholar]
  27. Darby, S. The Effectiveness of Feedback on Energy; Environmental Change Institute: Oxford, UK, 2006. [Google Scholar]
  28. The Engineering Toolbox. 25 October 2018. Available online: https://www.engineeringtoolbox.com/fans-efficiency-power-consumption-d_197.html (accessed on 13 October 2019).
  29. Lienhard, J.H. (Ed.) The general problem of heat transfert. In A Heat Transfert Texbook, 3rd ed.; 2001; pp. 7–8. Available online: http://www.mie.uth.gr/labs/ltte/grk/pubs/ahtt.pdf (accessed on 13 October 2019).
  30. Eskom Solar and Met Data, 2009–2010. Available online: http://www.eskom.co.za/AboutElectricity/RenewableEnergy/Pages/Solar_Information.aspx (accessed on 13 October 2019).
Figure 1. Schematic of the control volume.
Energies 12 04326 g001
Figure 2. Heating Ventilation and Air Conditioning (HVAC) energy consumed during winter, modelled in MATLAB Simulink®.
Energies 12 04326 g002
Figure 3. HVAC energy consumed simulated during summer, modelled in MATLAB Simulink.
Energies 12 04326 g003
Figure 4. Four occupied offices.
Energies 12 04326 g004
Figure 5. Unoccupied offices.
Energies 12 04326 g005
Figure 6. HVAC office energy control based on temperature, occupancy activities and weather, using MATLAB Simulink.
Energies 12 04326 g006
Figure 7. HVAC proposed energy control strategy using MATLAB Simulink®.
Energies 12 04326 g007
Figure 8. The HEXING CIU EV-KP. Source: Photograph by Simplice I, T Noubissie.
Energies 12 04326 g008
Figure 9. Fluorescent tubes’ energy consumed in an office.
Energies 12 04326 g009
Figure 10. Photovoltaic (PV) array from MATLAB Simulink.
Energies 12 04326 g010
Figure 11. PV system Block diagram.
Energies 12 04326 g011
Figure 12. Fuzzy Designer.
Energies 12 04326 g012
Figure 13. Input variable Power consumed by the Loads (HVAC & light power used).
Energies 12 04326 g013
Figure 14. PV Input variable.
Energies 12 04326 g014
Figure 15. Fuzzy Output variable.
Energies 12 04326 g015
Figure 16. Block diagram of proposed fuzzy logic.
Energies 12 04326 g016
Figure 17. Occupancy sensor output in offices 1 and 2.
Energies 12 04326 g017
Figure 18. Occupancy sensor output in offices 3 and 4.
Energies 12 04326 g018
Figure 19. Power consumed by HVAC office based on model assumed during summer.
Energies 12 04326 g019
Figure 20. Power consumed by HVAC office based on model assumed during winter.
Energies 12 04326 g020
Figure 21. HVAC Power consumed based on temperature, occupancy and load control for office 1 during summer and winter.
Energies 12 04326 g021
Figure 22. HVAC Power consumed based on load, temperature, occupancy and control for office 3 during summer and winter.
Energies 12 04326 g022
Figure 23. Room temperature for offices in summer and winter.
Energies 12 04326 g023
Figure 24. Five Fluorescent tubes Energy consumed in on office.
Energies 12 04326 g024
Figure 25. Office light energy consumed under occupancy sensor1 and 2.
Energies 12 04326 g025
Figure 26. Rule number 4 viewer and the crisp values.
Energies 12 04326 g026
Figure 27. Grid control state due to fuzzy logic.
Energies 12 04326 g027
Figure 28. A day (9 h) irradiation and temperature curve in winter.
Energies 12 04326 g028
Figure 29. PV system and Grid feeding the offices load (HVAC and lighting) in winter.
Energies 12 04326 g029
Figure 30. PV Energy generated during winter period.
Energies 12 04326 g030
Table 1. Office 1 and office 2 working hours’ schedule.
Time8:00–10:3010:30–11:3011:30–12:3012:30–14:0014:00–16:0016:00–16:3016:30–17:00
Occupancy state1010101
Table 2. Office 3 and office 4 working hours schedule.
Time8:00–8:308:30–9:009:00–11:0011:00–11:2011:20–12:0012:00–13:3013:30–16:0016:00–16:3016:30–17:00
Occupancy state101010101
Table 3. HVAC energy used in offices 1&2 and offices 3&4 in one year after load, temperature, occupancy control.
OfficesElectric Energy Used (KWh)Electric Energy Saved (KWh)Savings [R]
Kwh = R1.2
Percentage (%)
Office 1&2 Summer period3875.840899.201079.0418.83%
Office 1&2 Winter period1460.75317.680381.21617.86%
Office 3&4 Summer period3812.566962.241154.68820.15%
Office 3&4 Winter period1314.027464.372557.24726.11%
Total10,463.1832643.4923172.19120.16%
Table 4. Office light total energy consumed comparison.
OfficeElectric Energy Used (KWh) (Month)Electric Energy Saved (KWh) (month)Savings [R]
Kwh = R1.2
Percentage (%)
Four Offices without sensor84.58---
Office1&2 with sensor161.0823.528.6727.8%
Office3&4 with sensor257.9526.6332.48831%
Table 5. Offices load (HVAC & light), PV and Grid total electric energy comparison in one day.
OfficesElectric Energy Used (KWh)Electric Energy Generated (KWh)Savings [R]
Kwh = R1.2
Savings Percentage
Office 1&225.137---
Office 3&424.711---
PV-23.12627.75146.394%
GRID-26.721--
Total49.84849.84727.5146.394%
Table 6. Total energy saved in the enumerated three scenarios mentioned in Section 1.
Strategy and ScenariosHVAC Energy Saved %LIGHT Energy Saved%
Occupancy, temperature, weather control13.23%29.3%
Loads, Occupancy, temperature, weather control20.16%29.3%
PV system44%
PV plus, Occupancy, temperature, weather control57.23%73.3%
PV + Loads, Occupancy, temperature, weather control64.16%73.3%

