Article

Environmental Impact Evaluation of Distributed Renewable Energy System Based on Life Cycle Assessment and Fuzzy Rough Sets

1
National Research Center for Thermal Power Engineering and Technology, North China Electric Power University, Beinong Road 2, Beijing 102206, China
2
Beijing Jingneng Power Co., Ltd, Chenjialin Road 9, Beijing 100025, China
3
Beijing InBasis Technology Co., Ltd, Chenjialin Road 9, Beijing 100025, China
*
Authors to whom correspondence should be addressed.
Energies 2019, 12(21), 4214; https://doi.org/10.3390/en12214214
Submission received: 12 September 2019 / Revised: 30 October 2019 / Accepted: 31 October 2019 / Published: 5 November 2019
(This article belongs to the Special Issue Life Cycle Assessment of Renewable Energy Sources)

Abstract

:
The distributed renewable energy system, integrating various renewable energy resources, is a significant energy supply technology within energy internet. It is an effective way to meet increasingly growing demand for energy conservation and environmental damage reduction in energy generation and energy utilization. In this paper, the life cycle assessment (LCA) method and fuzzy rough sets (FRS) theory are combined to build an environmental evaluation model for a distributed renewable energy system. The ReCiPe2016 method is selected to calculate the environmental effect scores of the distributed energy system, and the FRS is utilized to identify the crucial activities and exchanges during its life cycle from cradle to grave. The generalized evaluation method is applied to a real-world case study, a typical distributed energy system located in Yanqing District, Beijing, China, which is composed of wind power, small-scale hydropower, photovoltaic, centralized solar thermal power plant and a biogas power plant. The results show that the environmental effect of per kWh power derived from the distributed renewable energy system is 2.06 × 10⁻³ species disappeared per year, 9.88 × 10⁻³ disability-adjusted life years, and 1.75 × 10⁻³ USD loss on fossil resources extraction, and further in the uncertainty analysis, it is found that the environmental load can be reduced effectively and efficiently by improving life span and annual utilization hour of power generation technologies and technology upgrade for wind turbine and photovoltaic plants. The results show that the proposed evaluation method could fast evaluate the environmental effects of a distributed energy system while the uncertainty analysis with FRS successfully and effectively identifies the key element and link among its life span.

Graphical Abstract

1. Introduction

As a dispensable resource, stable energy supply is essential for human survival and social development. With continuous growth in industrial production and economic aggregates, energy consumption has sharply increased in China, which has imposed an extra pressure on the energy supply system and resulted in a new energy revolution [1,2,3]. Moreover, in the presence of the environmental protection targets, it is impossible to meet the increasing energy demand through conventional approaches which capture and rely on fossil fuels [4,5,6]. The energy structure revolution of renewable energy sources coupled with traditional fossil fuels have been gradually turned into a new normal [7,8]. The construction of energy internet provides a significant solution to the current severe situation about energy supply and environmental protection. Energy internet is an innovative energy utilization form with the features of an in-depth combination with renewable energy generation technologies and advanced information technologies [9]. Distributed renewable energy system (DRES), which integrates various renewable energy power generation technologies, can optimize the allocation and utilization of energy, and have better environmental performance when compared to fossil energy production options, is a pretty foundation and solid support for energy internet [10].
Renewable energy is highly praised for its wide availability and environmental friendliness, as well as its decisive advantage over traditional energy is that it is not subjected to fossil fuel resources depletion and it does not lead to much increasing pollution [11]. The feasibility and potential for DRES have been performed by many researchers in terms of technical [12,13,14], economic [15,16,17], and ecological characteristics [18,19,20]. Kasperowicz et al. [21] presented the possibility of estimation of an appropriate power supply based on renewable energy sources in the context of the whole energy system in the annual balance taking into account the technical and economic optimization strategies. Considering the European Directive that 20% of the total energy should come from renewable energy sources for each European Member State, Simionescu et al. [17] have assessed the importance of GDP per capita in realizing the targets and the effects of the renewable energy sources share in electricity. Moreover, Baleta et al. [22] reviewed some of the latest developments in the main areas of sustainability in terms of themes of energy, water, environment, and their joint effects.
In the context of sustainable development, environmental impacts of the energy system, especially distributed renewable energy system, have drawn increasing attention. From the perspective of method innovation, García-Gusano et al. [23] proposed a robust framework for the soft-linking of life cycle assessment (LCA) and TIMES model, integrating life-cycle indicators into energy system optimization models. Aiming at bridging the gap between short term forecasting and long-term scenario modeling methods, a newly strategic UK Transport Carbon Model covering the range of transport-energy-environment issues from socioeconomic and policy influences on energy demand reduction have been proposed in [24]. To explore the trade-offs between climate change mitigation and other environmental impacts on electricity generation, Kouloumpis et al. [25] have developed an electricity technologies life cycle assessment model. A multi-method approach for decision-making is presented in [10], in which the life cycle assessment method and analytical hierarchy process (AHP) method are combined to assess the sustainability of three energy scenarios combing five renewable options, and AHP is used to identify the weight of the sustainability indicator. With consideration of multiple factors, a multi-objective optimization model at the urban sector scale is proposed to achieve sustainable development of energy, economic, and environmental systems, by integrating objectives of minimal energy consumption, energy cost, and environmental impact in [26].
From the view of the policy-making, Petrillo et.al [27] developed a life cycle assessment and life cycle cost analysis model for a stand-alone hybrid renewable energy system, aiming at supporting decision-makers in complex decision problems in the field of environmental sustainability. Vázquez-Rowe et al. [28] studied two cases for Peru and Spain analyzing their changing electricity grids to explore the influence of climate-centric policy-making on long-term electricity mix change. Pereira et al. [29] designed four scenarios to evaluate the co-benefits implications of alternative electricity generation scenarios in Japan in a post-Fukushima context, providing a reference for policy-maker among various candidate options including fossil fuels, nuclear energy, and renewable energy. After that, Pereira and his colleagues [30] evaluated the impacts of life cycle assessment greenhouse gas (LCA-GHG) emissions in the power supply portfolio and the effectiveness of a carbon tax scheme. In the context of booming research on the environmental footprint, the hourly life carbon footprint of electricity generation in Belgium has been investigated in [31], which offered decision support to fully exploit the advantages of a future smart grid.
Considering the specific environmental impacts of DRES, Evangelisti et al. [32] assessed the environmental impact about three different combined heat and power systems with bio-methane produced from organic waste. Strazza et al. [33] evaluates both potential environmental impacts and costs of the operation of a 230 kW solid oxide fuel cell (SOFC) system and micro gas turbine (MGT) system for distributed power generation applications. Zhang et al. [34] addressed the optimal design of micro-grids with combined heat and power (CHP) units by coupling environmental and economic sustainability in a multi-objective optimization model. It can be found that much research about the sustainability of renewable distributed energy system has been conducted, and the environmental impact has been also calculated via LCA. Environmental evaluation results can be affected by several uncertainty factors, which mainly consist of selected methodologies, initial assumptions, i.e., allocation rules, system boundaries and specific technical parameters, and the quality of available data [35]. Thus, sensitivity analysis in results interpretation is necessary for the LCA.
From the view of process analysis and formulated the procedure, Heijungs [36] have proposed the sensitivity analysis method based on the matrix-based LCA. After that, Sakai and Yokoyama [37] introduced a perturbation method to matrix-based LCA to evaluate the degree of influence of each element on the total sum of environmental loads. Moreover, Groen et al. [38] compared seven sensitivity methods applied to electricity production and seafood production, in which one contains matrix perturbation, a one-at-a-time (OAT) method of elementary effect, standardized regression coefficients, key issue analysis, random balance design, and Sobol indices. Considering sensitivity analysis in the practical application of LCA, Welz et al. [39] investigated the environmental impacts of four domestic lighting technologies which employed cumulative energy demand, global warming potential, and the eco-indicator99 to the same scenarios for checking the robustness of the results. For the power system, Zhai et al. [40] have investigated the LCA of a solar aided coal-fired power system with and without heat storage, and carried out uncertainty analysis to find the effect of main factors on the system. Lamnatou and Chemisana [41] have evaluated environmental loads of photovoltaic-green and other roofing systems utilizing ReCiPe and three different scenarios (20, 100, and 500 years) in terms of the global warming potential (GWP) time horizon are examined for sensitivity analysis.
For multiple uncertainty factors analysis, fuzzy rough sets offer well-founded theoretical solutions transferable into practice to quantify uncertainty influence. Fuzzy rough sets (FRS) allows partial membership of an object to the lower and upper approximations, and approximate equality between objects can be modeled through fuzzy indiscernibility relations [42]. An advantage of this are the FRS suits for hybrid data and default data without any information loss, thus, they can be used for feature selection, instance selection, classification, attribute reduction, and regression. Juneja et al. [43] proposed a three-phase reduction, in which a novel fuzzy rough feature selection was proposed in the third phase for learning a decision model. Cheng et al. [44] have conducted green competitiveness evaluation of provinces in China based on correlation analysis and fuzzy rough sets, in which FRS was employed to select and analyze 21 indicators and develop a regional green competitiveness index. Moreover, Cheng et al. [45] have performed the obstacle diagnosis of green competition promotion of provinces in China based on catastrophe progression and fuzzy rough set methods. Similarly, fuzzy rough sets can be applied to sensitivity analysis of LCA, in which FRS is employed to calculate the dependence degree on environmental loads for various uncertain factors by way of attribute reduction.
Based on the review mentioned above, an environmental impact evaluation model integrating LCA and FRS is proposed in this study. The FRS is utilized to identify the critical factors which contribute the most on its environmental impacts, and further, to conduct the uncertainty analysis related to those critical factors. According to the analysis results, the vital activities and exchanges throughout the life cycle of the DRES are determined, which in turn provide references for DRES construction, technology upgrading, and decision-makers. In particular, the case with five renewable energy generation technologies located in different parts of China is investigated. The paper is organized as follows: the framework of the environmental evaluation method (Section 2.1) and basic life cycle assessment method ReCiPe2016 (Section 2.2) is introduced. Then, the fuzzy rough sets embedded into life cycle assessment is elaborated in Section 2.3. Subsequently, a complex realistic case study is defined and the proposed environmental impact evaluation approach is applied to evaluate its performance (Section 3). Finally, the conclusions are drawn in Section 4.

2. Environmental Impact Evaluation Method of DRES Integrating LCA and FRS Methods

In the proposed environmental impact evaluation framework, LCA methods can continuously analyze each process of any component of the DRES, and FRS can be used to identify the vital parameters, activities, and exchanges throughout the assessment process based on the LCA results.

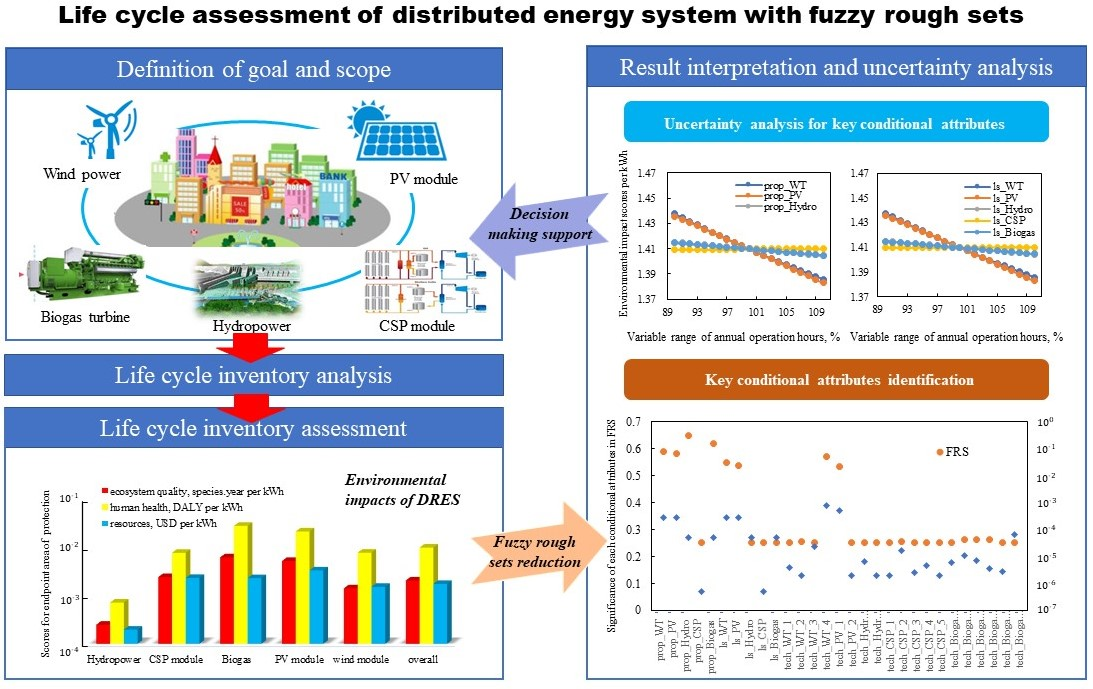
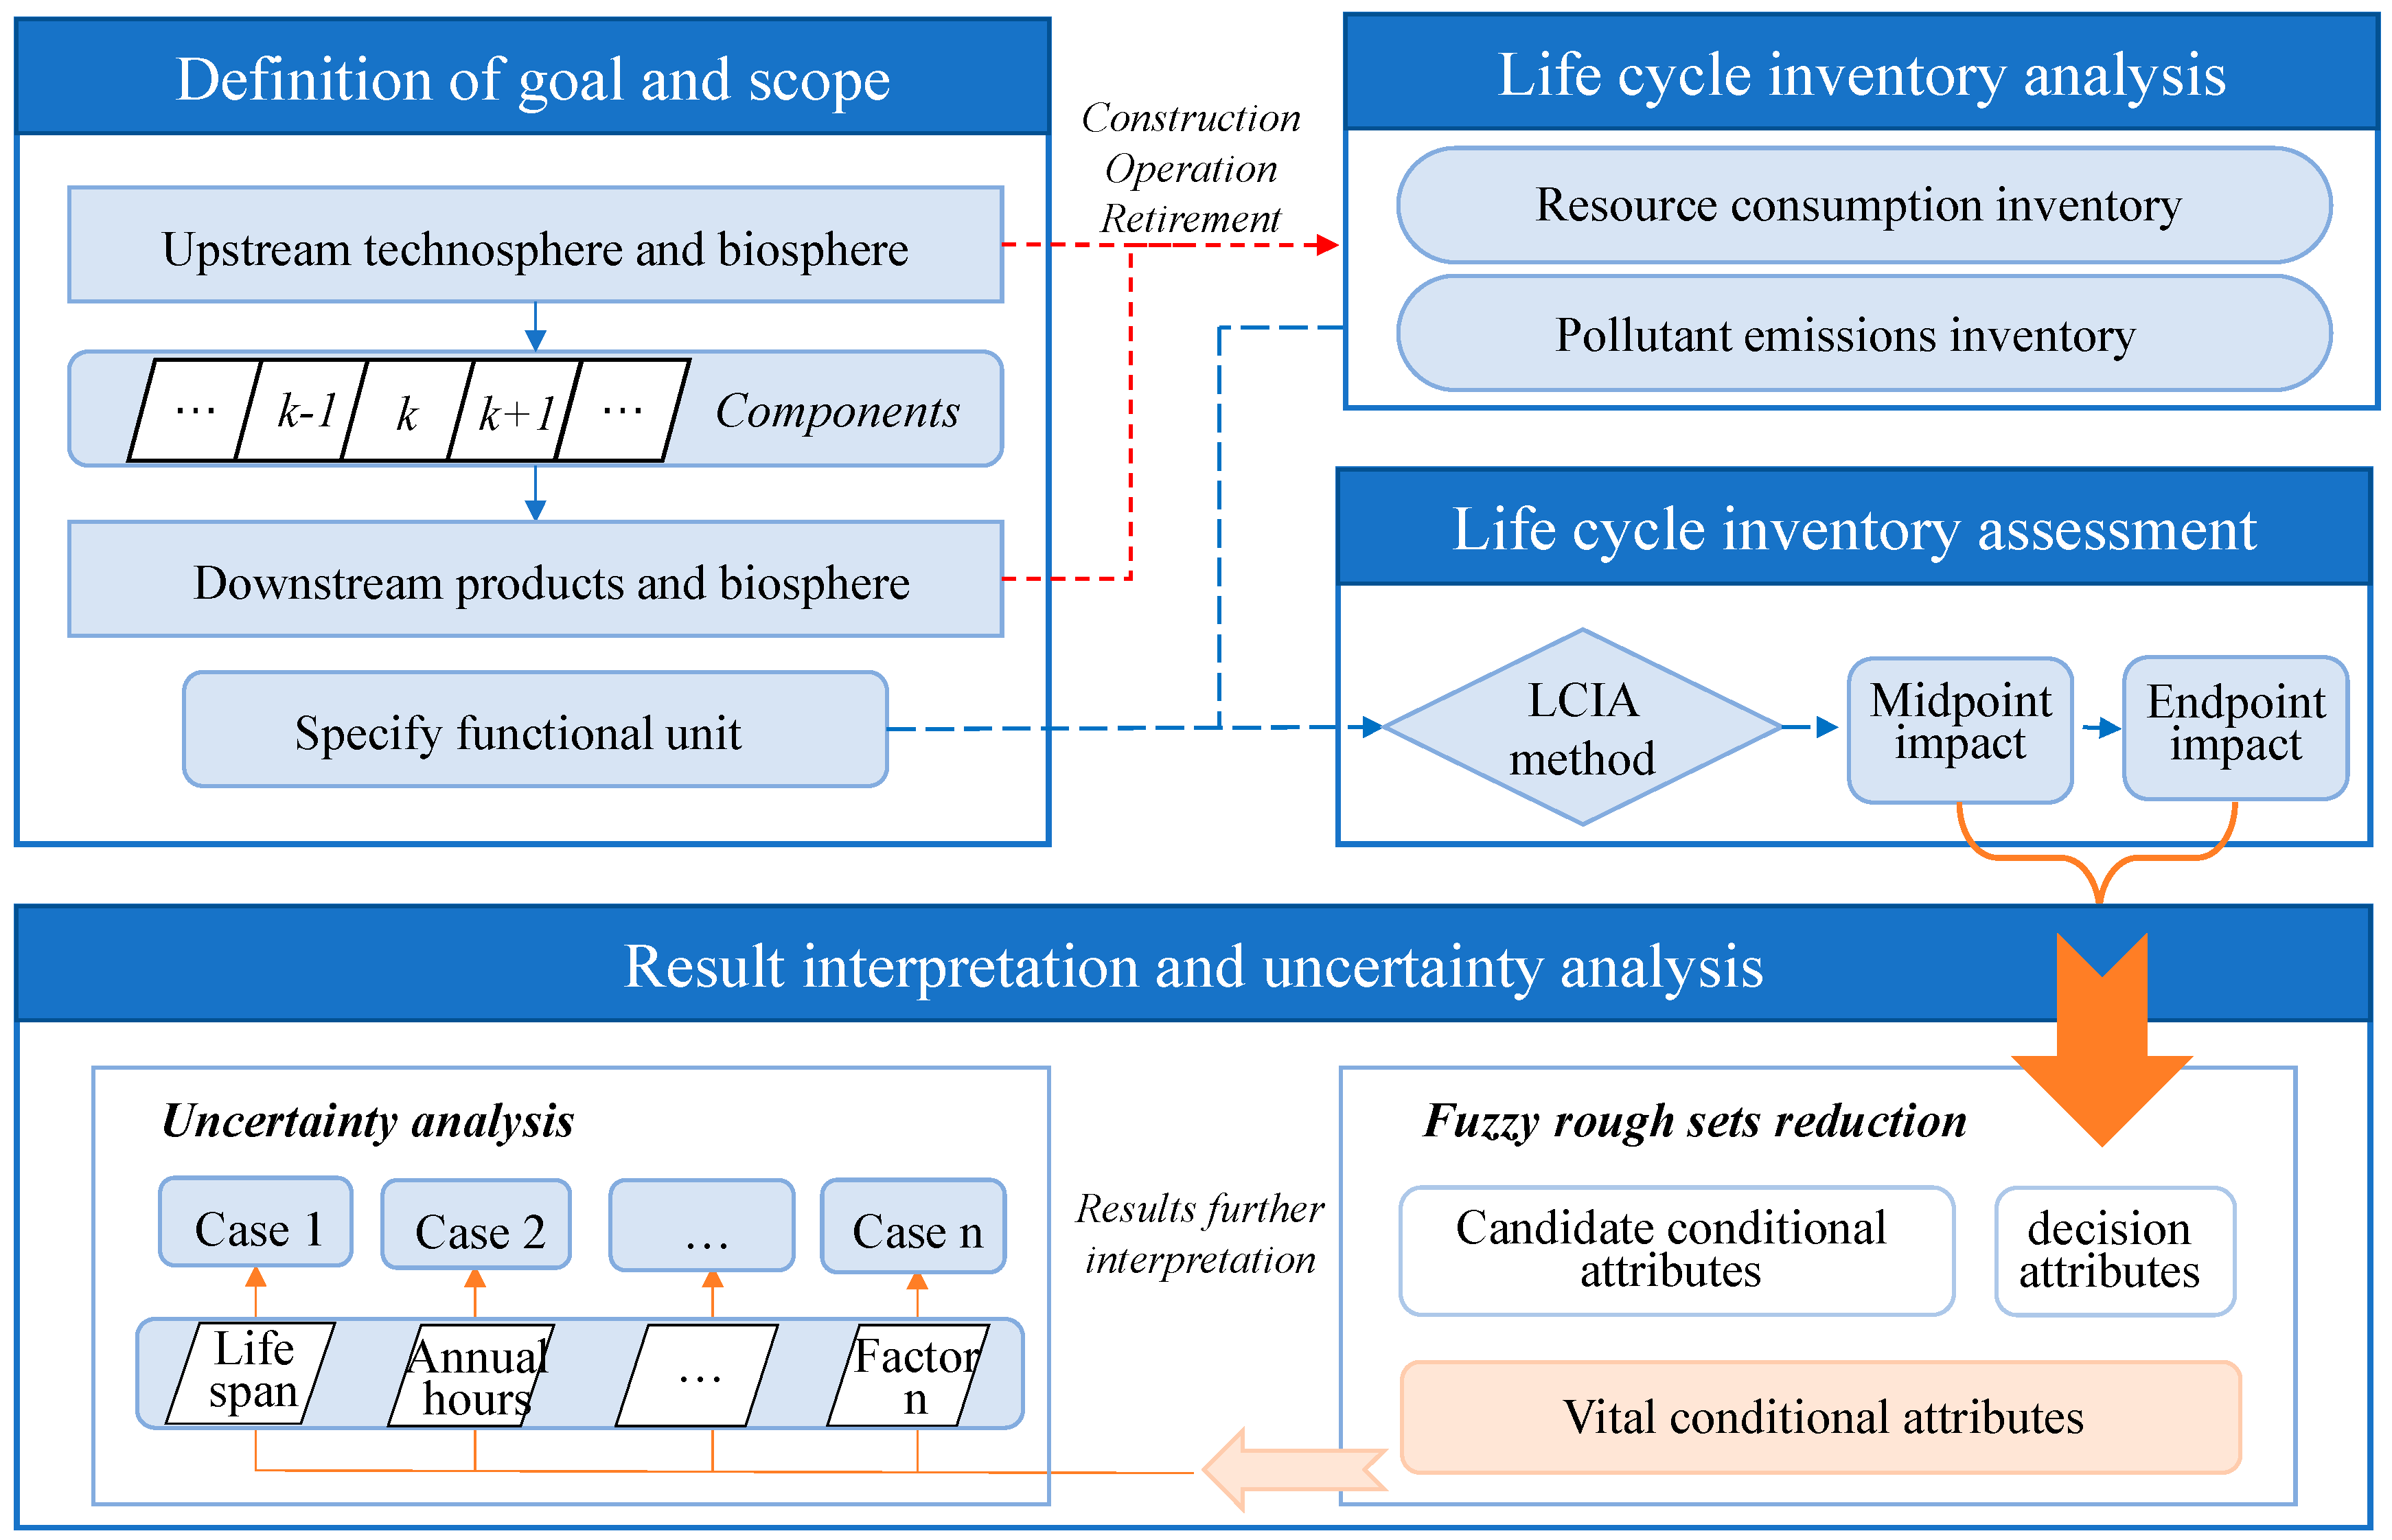
2.1. The Framework of Environmental Impact Evaluation Method

The natural environment provides various energy resources like coal, oil and renewable resources to human society, as well as other minerals. Nowadays, clean power supply for different application scenarios gradually developed towards a new formal in which distributed renewable energy system dominated, coupled with fossil fuel power generation as a backup. Therefore, rational configuration planning of the energy supply system and relative environmental evaluation, especially renewable power generation technologies, plays a critical role in the low-carbon environmental protection, community development, and economic prosperity.
An environmental evaluation method of distributed renewable energy system is proposed in this paper based on the life cycle assessment method and fuzzy rough sets, in which the basic environmental impact assessment is implemented through the LCA method and result interpretation is achieved with fuzzy rough sets. The framework of the environmental impact evaluation method is presented in Figure 1.
In general, the evaluation model can be divided into four steps. Firstly, after identifying local renewable energy resources, certain power generation approaches can be determined and research goals and study scope can be defined in respect to the corresponding Technosphere. Next, life cycle inventory analysis can be calculated and the statistical results of pollutant emissions for overall DRES can be obtained. After that, pollutant emissions can be further analyzed into midpoint environmental impact categories and the endpoint area of protection subjects through normalization and characterization. Finally, uncertainty analysis is conducted for different parameters, and FRS are employed to assist to find vital factors or activities for the overall DRES, which can be a reference for policymaker and system optimization.

2.2. Life Cycle Assessment in the Proposed Evaluation Framework

Life cycle assessment can comprehensively evaluate the entire life span of a device or a system within the total life cycle consumption of resources and their benefits [41], and translate emissions and resources extractions into a limited number of environmental impact scores using relative characterization factors [46]. Environmental effects analyses with LCA methods can recognize the stage at which results in a great role in pollutant emissions and seek opportunities to improve its environmental manifestation.
In general, LCA analysis models mainly includes a simplified model, process model, decision-making theory model, and multi-objective optimization model according to specific features. There are more than 20 environmental impact evaluation methods derived from various research institutes, and these methods can be divided into two mainstream ways from the view of investigate targets, i.e., mid-point methods and end-point methods. The former methods focus on the environmental impact mechanism and evaluated various activities’ environmental impacts such as climate change, soil acidification, water eutrophication, which are also called question-centric approaches. The latter divided different environmental subjects and modeled various damages to human, environment, and natural resources, which are called as damage-centric approaches. In this paper, the improved ReCiPe2016 methods derived from ReCiPe2008 are selected for life cycle assessment [46], which implement human health, ecosystem quality, and resource scarcity as three endpoint protection subjects. Moreover, endpoint impact subjects are associated with 17 midpoint impact categories through appropriate mid-to-endpoint factors according to predefined damage pathways.
Life cycle assessment generally consists of four processes [47]: (1) determination of research goals and scope; (2) making up life cycle inventory; (3) calculating life cycle impact assessment value; (4) achieving life cycle interpretation and corresponding improvement, and former three steps are discussed in detail coupled with distributed renewable energy system within ReCiPe2016 as following paragraphs.

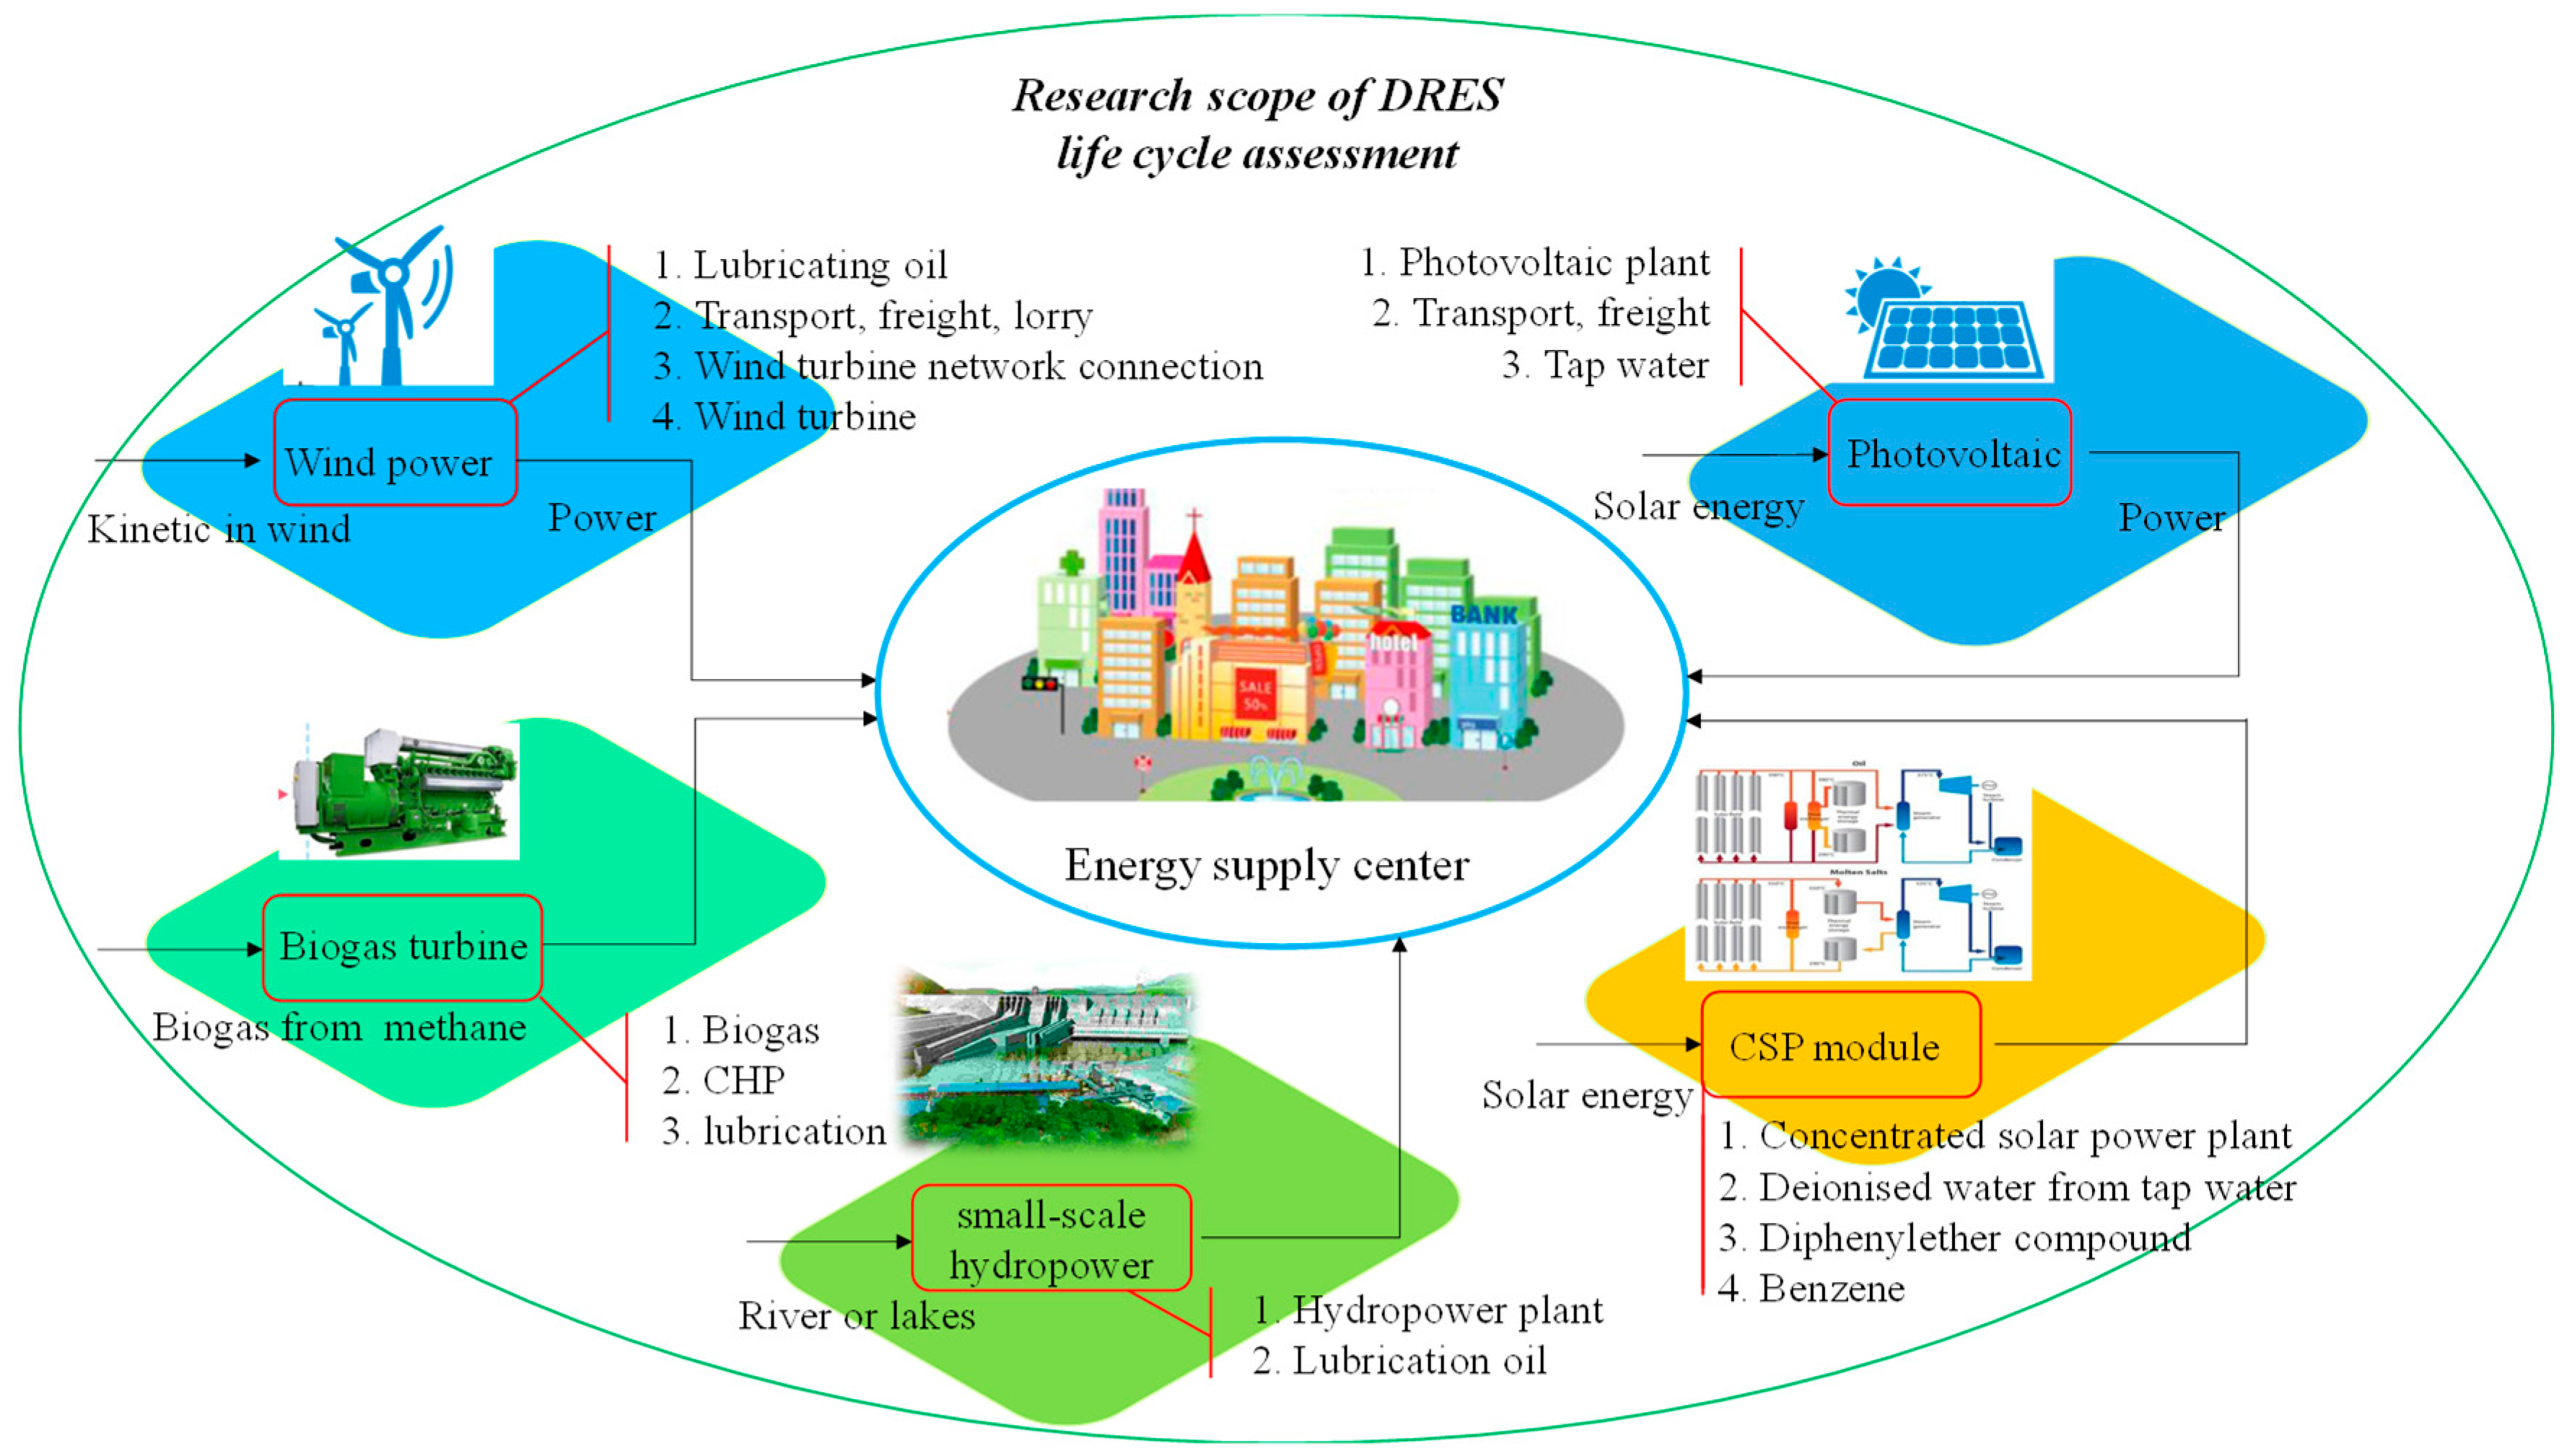
2.2.1. Determination of Research Goals and Scope

The purpose of the proposed evaluation framework is to calculate pollutants emissions of DRES which directly contribute to midpoint impact category and indirectly affect the endpoint area of protection. The impact categories covered in the ReCiPe2016 method and their relationship are illustrated in Figure 2. For complex distributed renewable energy system integrating various renewable power generation technologies, the environmental performance of different modules can be obtained and compared for further investigation.
From the view of midpoint impact categories, there are many distinctions among different power generation forms, which may be caused by their specific scope definition. The scope of the studied Technosphere is defined according to its technical features, for example, the scope of wind power covered three typical stages during its life span, construction, operation and decommission periods. “Construction” stands for building wind power stations and affiliated wind turbine networks, as well as relative transportation through freight and lorry. Wind turbine operation stage needs to take lubricating oil used for turbine lubrication and cooling into account, while all by-products are classified as recyclable in decommission stage.

2.2.2. Making Up life Cycle Inventory

Life cycle inventory analysis mainly refers to the pollutant emissions of units over their entire life span, and mission data applied in this paper are referred to the Ecoinvent Version 3.5 databases. Considering all components within the distributed energy system, the emissions mass vector E can be expressed as follows:
E = [ C O 2 , S O 2 , C O , N O x , C H 4 ,   , N 2 O ]
in which pollutant emissions of the overall system include CO2, SO2, CO, NOx, CH4, N2O, and so on are basic elements in the mass vector.

2.2.3. Calculating Life Cycle Evaluation Value through Normalization and Characterization

Typically, emissions of these pollutants results in a variety of environmental problems, under the framework of ReCiPe2016, global warming potential (GWP), ionizing radiation potential (IAP), terrestrial ecotoxicity potential (ETP terra) et al. Seventeen midpoint damage categories are considered, and further divided into eight damage pathways according to their influence mechanism. Finally, environmental effects are summarized into three endpoint area of protection: damage to human health (DHH), damage to ecosystems (DEH), and damage to resource availability (DRA).
To simplify, the calculations and easily compare impact results, various pollutant emissions should be converted into an equivalent reference benchmark pollutants through the normalization process. For example, CO2 is the most important greenhouse gas in the global warming impact, thus, other pollutant emissions are converted into equivalent quantities of CO2 in the light of their contributions to global warming impact, which is written as CO2-eq. Similarity, reference benchmark for other impact categories are presented in Table 1.
The environmental impact potential can be calculated through pollutant emissions multiply corresponding normalized factor. Taking global warming impact as an example, the global warming potential represented by CO2-eq can be calculated as follows:
GWP = f normalize ,   GWP E T
where, f normalize ,   GWP denotes global warming impact normalized factor vector, for which emissions contribute none on global warming, the value is zero in the vector.
The primary analyses results can be obtained after normalizing the emission inventory for distributed renewable energy system, in which specific environmental impact potential is expressed by a person equivalent quantity for selected reference benchmark. Furthermore, 17 midpoint impact categories are turned into three endpoint area of protection along with damage pathways through characterization factors, which can be calculated as follows:
S c o r e area ,   pro = f midpoint ,   endpoint M
where, S c o r e area ,   pro denotes endpoint area of protection subjects including DHH (DALYs, disability-adjusted life years), DEH (species year, potentially disappeared fraction of species m2 year or potentially disappeared fraction of species m3 year), and DRA (USD, extra costs for future mineral and fossil resource extraction) [46], f midpoint ,   endpoint denotes endpoint characteristics factor transversal vector derived from various midpoint impact categories, M denotes the normalization midpoint impact column vectors derived from normalization, which can be expressed as follows:
M = [ G W P , O D P ,   I R P , , F F P ]

2.3. Fuzzy Rough Sets Theory Embedded into LCA Method

One important and valuable research area in fuzzy rough sets is attribute reduction for decision system. Attribute reductions with fuzzy rough sets take account of all decision classes together and could identify key conditional attributes explicitly for special decision class [48]. In the context of life cycle assessment, uncertainty analysis is generally employed to examine any factor that affects the LCA results in the final step since some parameters are assumed in the modeling process [40]. To be specific, distributed renewable energy system uncertainty may be caused by predefined life span time, proportion of each renewable energy, upstream Technosphere related to components, selection of normalizing methods and characterization factors, etc. Conventional research conducted on uncertainty analysis observed the environmental impact load variation coupled with parameter change.
In the context of uncertainty analysis, parameters for conventional analysis can be regarded as candidate conditional attributes, and the final environmental impact, as well as damage subject scores, can be seen as decision variables. Further study is carried out based on FRS to do the conditional attribute reduction, and key conditional attributes that have a significant effect on environmental impacts are identified explicitly. The determined key conditional attributes can interpret vital parameters during its life span and guide practical energy programming and production.
The key conditional attributes can be obtained with the utilization of fuzzy decision table to do the attributes reduction. The fuzzy decision table is a special and important knowledge expression system. It is can be expressed as the following equations:
F DT = ( U , C , D )
where U is a finite theory domain, C is a fuzzy conditional attributes, and D is the decision attributes. For a given fuzzy rough table, any object x belongs to U, a group data are responding to the C and D. According to the fuzzy rough sets theory, the candidate conditional attributes can be expressed as follows:
C = [ C ls , C prop , C tech , C norm , ,   C char ]
where, C ls is the vector of life span about the various renewable power plant, C prop is the proportion of renewable energy in a specific region, C tech is upstream technosphere performance related to components, C norm denotes the normalization factors for midpoint impact categories, and   C char denotes endpoint characterization factors. A key parameter Significance is defined to express the dependency among each conditional attributes and decision attributes, and those attributes with high Significance are considered as crucial uncertainty factors to be analyzed.

3. Case study with the Proposed Environmental Impact Evaluation Method

3.1. Basic Information Description for Case Study

A real distributed renewable energy system located in Yanqing District, Beijing, China, was selected to serve for the case study below. Yanqing district has the largest scale of micro-power-grid in China and abundant renewable energy system, which has built renewable energy power generation projects with a capacity of 200.9 MW. The specific parameters of concrete energy components are represented in Table 2. According to the method introduced in Section 2, ReCiPe2016 and FRS were utilized to assess the environmental impacts for the Yanqing DRES.

3.2. Goal and Scope Definition of DRES

Before environmental evaluation, the research scope for the case study was defined as the distributed energy system with five components displayed in Table 2 for Yanqing district, in which energy flows contain origin input nature sources like solar energy, wind energy, hydropower, and biogas energy, and output power. The system boundaries cover upstream biogas supply, energy devices construction, corresponding freight and possible retired processing. The research target was to investigate the environmental impacts of the distributed renewable energy system per functional unit. Moreover, combined with the basic information displayed in Table 2, the research scope of the DRES can be determined and depicted in Figure 3.
It was found that each component corresponded to a variety of upstream Technosphere activities and exchange between them and the environment. For wind power, kinetic energy in wind from the environment is transferred into power as a product and corresponds to upstream Technosphere lubricating oil, two kinds of transportation, wind turbine network connection, and wind turbine. For the photovoltaic module, solar energy from environment is transferred into power through a photovoltaic plant, which is cooled by tap water. Concerning biogas turbine, heat and power cogeneration technology are considered. Concerning small-scale hydropower, the hydropower plant is deployed in the downstream of rivers or lakes for power generation, and lubrication oil also needs to be considered during its operation period. For centralized solar thermal power generation technologies (CSP), the upstream technology field includes concentrated solar power plant, deionized water from tap water, diphenyl ether compound, as well as benzene—which was considered in the research scope. Moreover, in the context of the defined research scope, the function unit for following research was defined as per kWh power generation, thus, the pollutant emissions were expressed as kg per kWh, and the final environmental effects were expressed as impact scores per kWh.

3.3. Life Cycle Inventory Analysis

The data from the Ecoinvent Version 3.5 Database [50] was employed for life cycle inventory analysis, and the emission data of various power generation technologies was calculated through statistical approaches. The main pollutant emissions considered for each power generation technology and overall DRES system are shown in Table 3.
It can found that carbon dioxide dominated among displayed various emissions both for five sub-systems and overall distributed renewable energy systems, and the amount of CO2 emission was 6.55 × 10⁻² kg per kWh for the overall system, which was higher than other emissions over two orders of magnitude. For five sub-system in the DRES, biogas contributed most to the CO2 emission since biomass fuel combustion release a large number of CO2. The following highest pollution emissions are CO and CH4, which were 3.54 × 10⁻⁴ and 3.28 × 10⁻⁴ kg per kWh for the overall system, were mainly attributed to global warming. The emission quantities of SO2 and NOx were 1.17 × 10⁻⁴ and 8.76 × 10⁻⁵ kg per kWh for overall DRES, respectively, which contributed to common acid rain, respiratory disease, and other air pollution problems. In contrast, the amount of nitric oxide emission was ignorable compared with other pollutants, in which photovoltaic occupied the majority compared with other renewable power generation technologies.

3.4. Environmental Impact Evaluation

With normalization and characterization, inventory results were further turned into three endpoint areas of protection, the equivalent quantities of various reference benchmark pollutants for each midpoint impact categories were obtained to express the related influence situation. According to the life cycle assessment method applied in the models referring to ReCiPe2016, characterization factors are listed in Table 4.
Normalization and characterization of various environmental-related emissions with reference to pollution emission depicted in Table 1 and conversion factors listed in Table 4, final environmental impact scores about damage to humans, damage to the ecosystem, and damage to natural resources availability for study case are shown in Figure 4.
To clarify the environmental effects of DRES, the environmental load for the other five sub-systems is also listed in Figure 4. It was found that, in the life cycle of the distributed renewable energy system, unit power generation (kWh) resulted in 2.06 × 10⁻³ species disappeared per year, 9.88 × 10⁻³ disability-adjusted life years, and a 1.75 × 10⁻³ USD loss for three endpoint categories: damage to ecosystem, damage to human, and damage to natural resources availability, respectively. Compared with single power generation technology, it was found that the environmental effects of DRES was similar to the wind module whilst higher than hydropower system over three items, because the wind power system occupied the majority of the DRES with a proportion of 74.66% while the percentage of hydropower was 1.99%. Apart from the hydropower system, damage to the ecosystem and damage to natural resources availability for per kWh power from DRES was just higher than that generated from wind power system. Considering the damage to humans, the DRES performed better than the hydropower system, wind power system, and CSP system since the photovoltaic system and biogas system emitted much more air pollutants harmful to human health when compared to other systems.

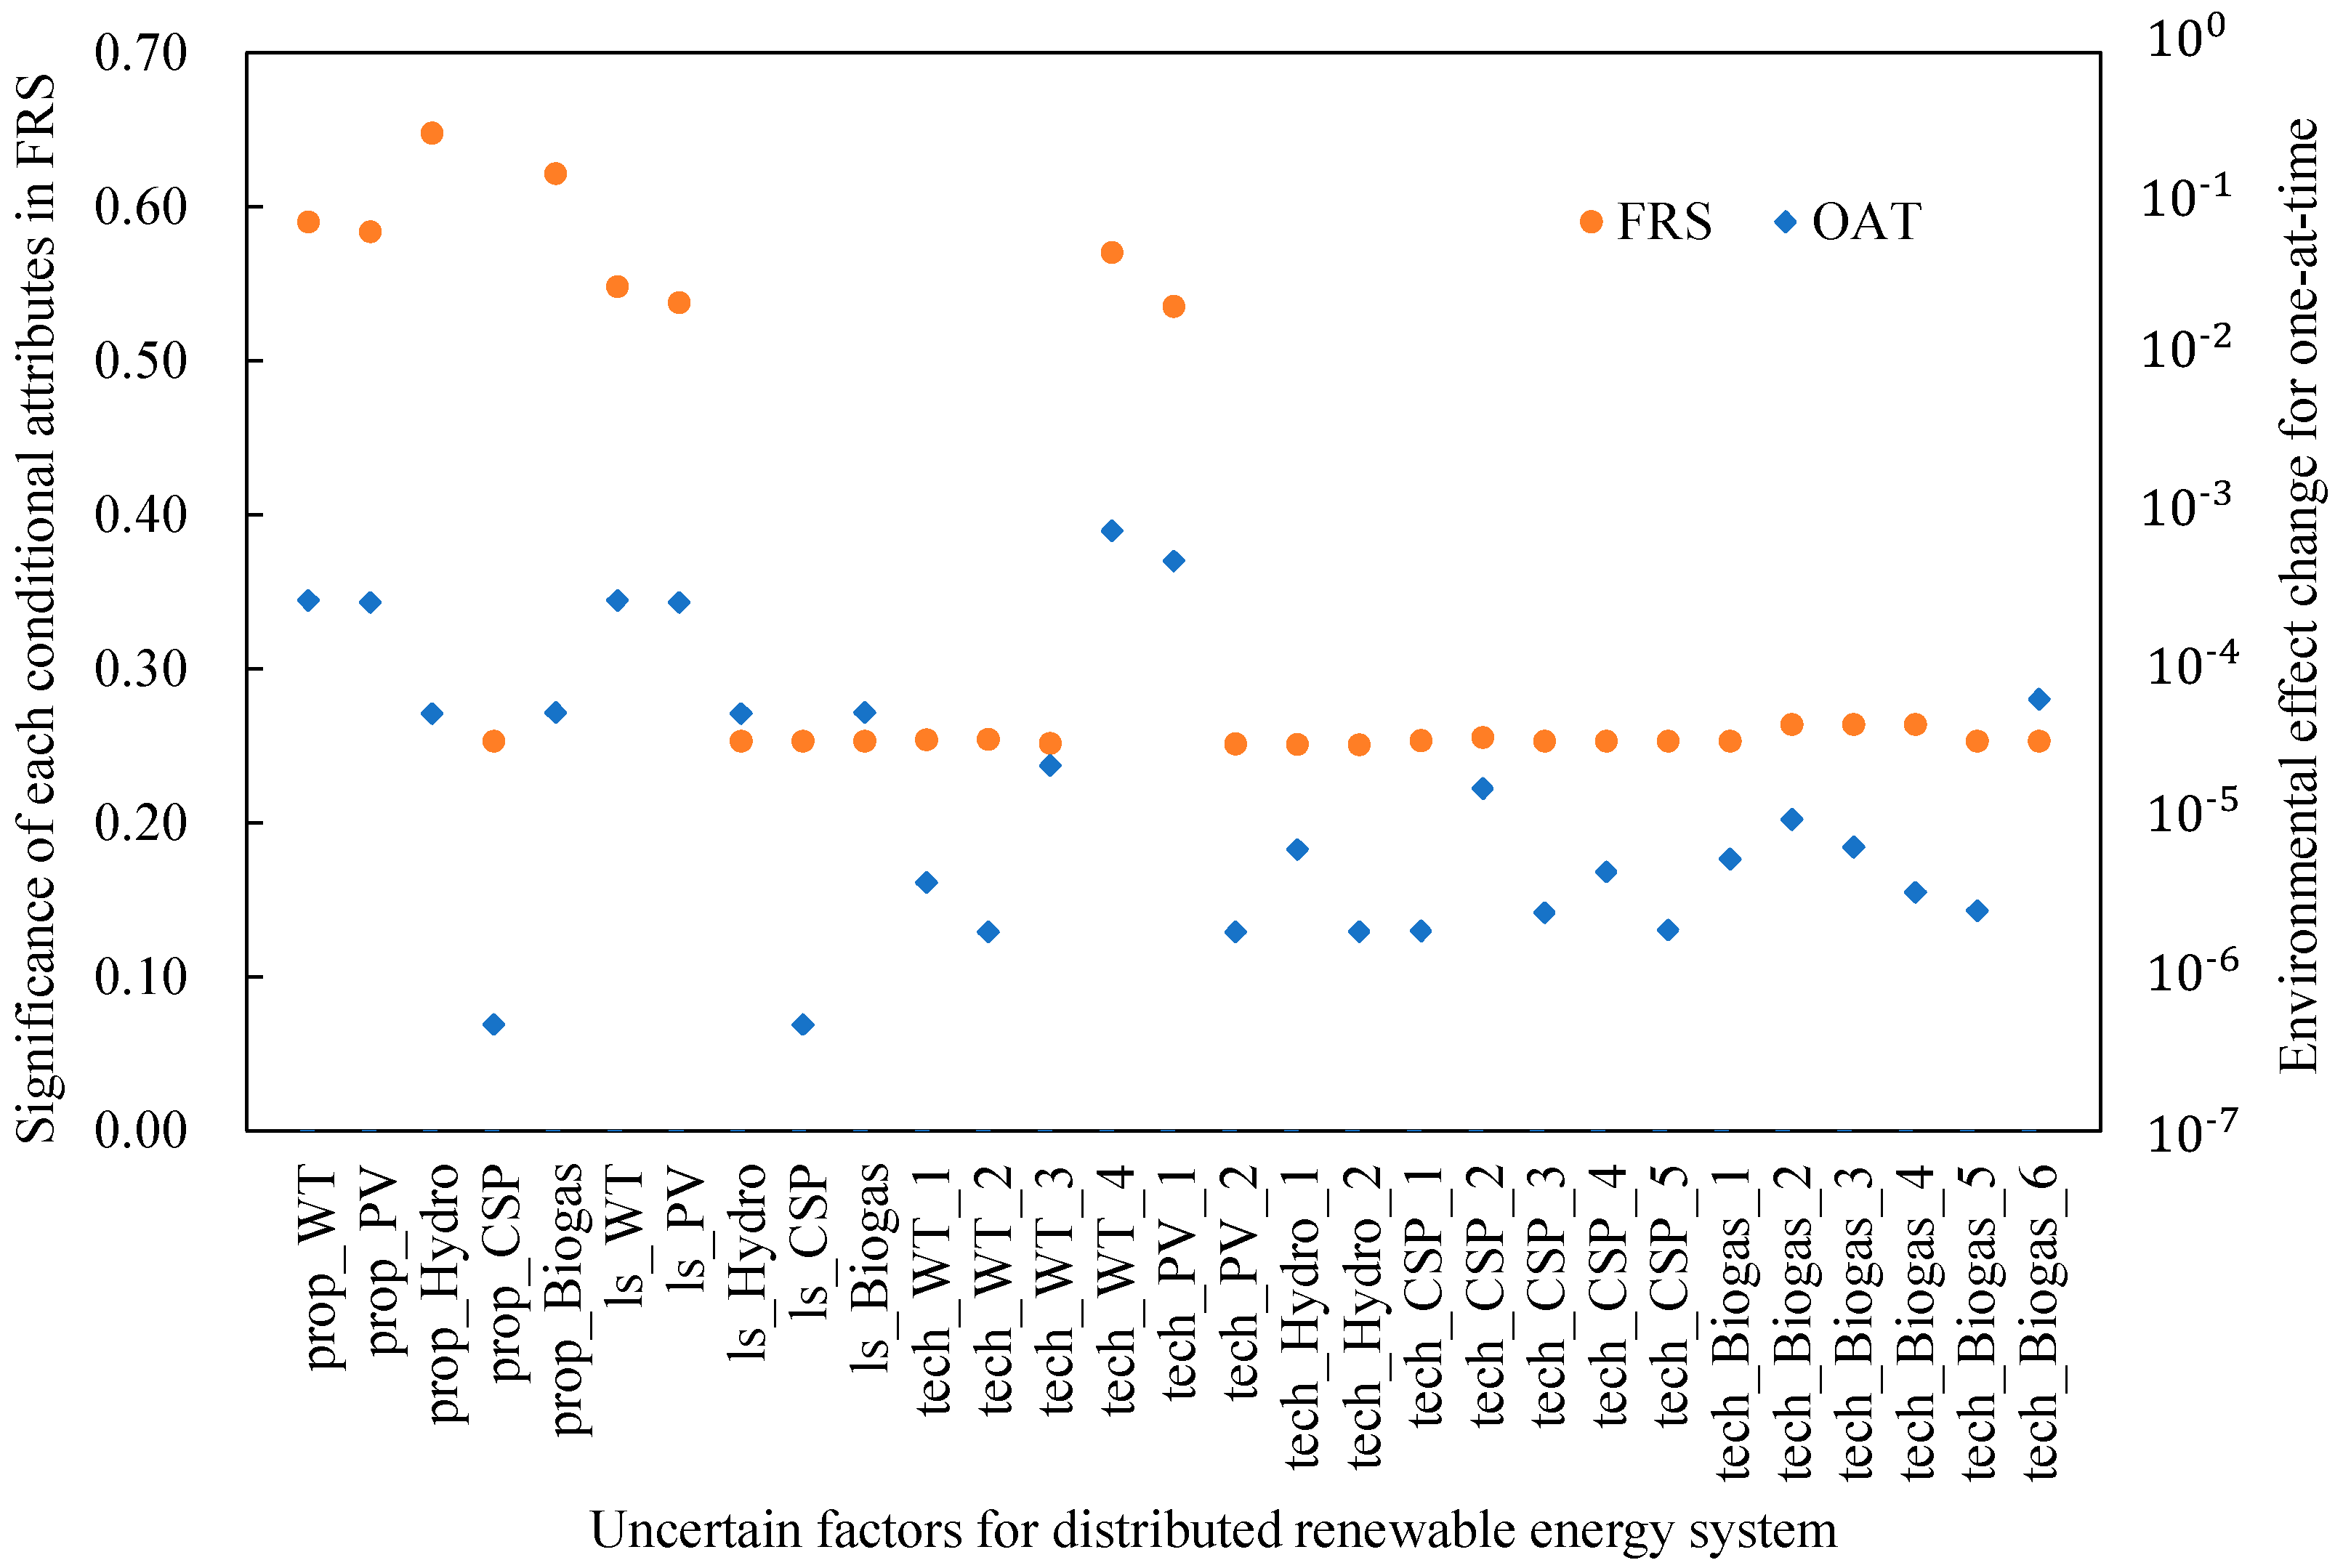
3.5. Results Interpretation and Uncertainty Analysis with FRS

In the presence of the framework of environmental impact evaluation method, power plant capacity, annual operation hours, upstream Technosphere performance were taken into account for case study in the uncertainty analysis and further resulted in interpretation with fuzzy rough sets. These parameters were assumed to change in the range of ±10% based on its origin value. All of the variables were candidate conditional attributes, and each situation with parameter change produced a set of data for attributes reduction. Meanwhile, the conventional OAT approach was also applied for sensitivity analysis, in which the sublet of the input parameters was changed one at a time to identify how much influence was induced by the change. The results for identifying crucial uncertain factors for DRES through the two methods are shown in Figure 5.
As shown in Figure 5, the significance of each conditional attribute in FRS and environmental effect changes for OAT present similar distribution regulation among 29 uncertain factors. Based on the research scope and FRS methods, prop_WT, prop_PV, prop_Hydro, prop_Biogas, ls_WT, ls_PV, tech_WT_4, and tech_PV_1 were more important than other factors with a higher significance value. Moreover, those eight factors expressed the largest changes when corresponding factors with a 10% change in input parameter values, which also demonstrated the feasibility of the proposed evaluation framework combing LCA and FRS. It should be noted that the results of FRS and OAT were not equal. For example, the most important factors calculated from the two methods were prop_hydro and tech_WT_4, respectively, due to the FRS modeled according to the fuzzy equivalence relation while OAT was dependent on the control variate method. Therefore, FRS provided another research path for sensitivity analysis in LCA.
Taking into account of two methods results, the aforementioned eight factors were selected to quantify the uncertainty influence with 10% disturbance. The uncertainty analysis results of installed power generation capacity and annual operation hours are shown in Figure 6a,b. Moreover, uncertainty analyses results of the upstream Technosphere for the wind power system and the photovoltaic power system are represented in Figure 6c,d.
For uncertainty analysis on installed capacity and annual operation hours of each component in DRES, it can be found from Figure 6a,b that both present the same tendency for the same component. This is because these two parameters coupled with each other with multiplication in the life cycle assessment. Moreover, these two parameters changing the wind module had the most influence on environmental impact due to its large installed capacity proportion, followed by the PV module, which corresponded to its high subsystem environmental impact scores as shown in Figure 4. Therefore, policy-makers should encourage the application of the product with a longer life span, and research needs to focus on extending the design lifetime for various power generation equipment.
In the upstream technical field of wind power generation system, tech_WT_4, the wind turbine played an important role in its life cycle assessment. The environmental impact score changed from 0.013 per kWh to 0.015 points per kWh when the environmental effect of wind turbine changed from 90% to 110%. Therefore, a priority technology improvement should concern the environmental friendly production of the wind turbine. For photovoltaic power generation technology, tech_PV_1, photovoltaic plant played an important role in environmental impacts. The environmental impact score of per kWh power from the overall DRES increased gradually from 1.36 × 10⁻² points to 1.46 × 10⁻² points, while the proportion to unit power generation changed from 0.9 to 1.1 of origin value. Thus, the development of the PV power system should focus on improving the photovoltaic plant construction technology.

4. Conclusions

In this paper, the environmental impact evaluation method based on life cycle assessment and fuzzy rough sets was generalized and comprehensively demonstrated by application to the real-world distributed energy system, in which three areas of protection derived from ReCiPe2016 were evaluated. The advantage of the proposed method was to accurately quantify the environmental impacts and effectively identify vital parameters, activities, and exchanges among the life span, thus helping programming configuration of energy systems and assisting in making decision. In the real-world problem, five distributed renewable energy generation technologies were introduced in the DRES. The main conclusions included:
  • For the case study, unit power generation (kWh) from the distributed renewable energy system resulted in a 2.06 × 10⁻³ species disappeared per year, 9.88 × 10⁻³ disability-adjusted life years, and 1.75 × 10⁻³ USD loss for three endpoint categories for protection: damage to the ecosystem, damage to humans, and damage to natural resources availability, respectively.
  • A simple comparison of sensitivity analysis in LCA through FRS and OAT was performed to demonstrate the feasibility of the proposed method, the results of FRS approaches kept pace with conventional OAT methods, in which eight significant uncertain factors were successfully identified.
  • The identified eight crucial factors were used to further quantify and analyze the uncertainty influence. The results showed that various power generation technology should improve their life span or annual utilization time to reduce environmental load per product, moreover, for the wind power system and the photovoltaic power system, technology upgrades for wind turbines and photovoltaic plant can contribute to environmental pollution deprivation.
  • In this paper, the candidate attributes were limited to conventional factors related to environmental load and a layer for each of the power generation systems. Moreover, the proposed model was just employed combined with ReCiPe2016. Future model development works focused on the limitation of model, such as the expansion of attribute sets including characteristics factors for emissions and conversion factors for midpoint impact categories. In addition, the model could be coupled with other LCA methods to verify its feasibility and universality.

Author Contributions

C.L. and N.W. conceived and designed the procedure for the evaluation method; H.Z. and Y.C. collected application scenario data; Q.L. and X.S. conducted data analysis; Z.Y. and Y.Y. contributed the life cycle assessment tools; C.L. and N.W. analyzed the results and wrote the paper; C.L. contributed the main jobs to the work reported.

Funding

This research was funded by the National Nature Science Foundation of China, grant number 51821004 and The APC was funded by the National Nature Science Foundation of China, grant number 51821004.

Acknowledgments

This work was supported by the National Nature Science Foundation of China (Grant No.51821004). The authors also thank the Ecoinvent Database for supporting this research with sufficient life cycle assessment data.

Conflicts of Interest

The authors declare no conflicts of interest.

Nomenclature

LCAlife cycle assessment
FRSfuzzy rough sets
DRESdistributed renewable energy system
AHPanalytic hierarchy process
SOFCsolid oxide fuel cell
MGTmicro gas turbine
CHPcombined heat and power
DHHdamage to human health
DEHdamage to ecosystem health
DRAdamage to resource availability
CSPcentralized solar thermal power generation
DALYdisability-adjusted life years
OATone-at-a-time
WTwind power system
GWPglobal warming potential
Mathematical Symbols
f normalize ,   GWP global warming impact normalized factor vector
f midpoint ,   endpoint endpoint characteristics factor transversal vector
Eemission mass vector
Mnormalization midpoint impact column vectors
Ufinite theory domain
Cfuzzy conditional attributes
Ddecision attributes
Subscripts and Superscripts
DTdecision table
lflife span
proprenewable energy system capacity proportion
techupstream Technosphere
normnormalization factors
charcharacterization factors
area,proarea of protection

References

  1. Zhang, C.; Zhou, K.; Yang, S.; Shao, Z. On electricity consumption and economic growth in China. Renew. Sustain. Energy Rev. 2017, 76, 353–368. [Google Scholar] [CrossRef]
  2. Liu, Q.; Lei, Q.; Xu, H.; Yuan, J. China’s energy revolution strategy into 2030. Resour. Conserv. Recycl. 2018, 128, 78–89. [Google Scholar] [CrossRef]
  3. Li, Y.; Li, Z. Forecasting of coal demand in China based on support vector machine optimized by the improved gravitational search algorithm. Energies 2019, 12, 2249. [Google Scholar] [CrossRef]
  4. Wu, J.; Tang, G.; Wang, R.; Sun, Y. Multi-Objective optimization for China’s power carbon emission reduction by 2035. J. Therm. Sci. 2019, 28, 184–194. [Google Scholar] [CrossRef]
  5. Gosens, J.; Kaberger, T.; Wang, Y. China’s next renewable energy revolution: Goals and mechanisms in the 13th Five Year Plan for energy. Energy Sci. Eng. 2017, 5, 141–155. [Google Scholar] [CrossRef]
  6. Li, Y.; Zeng, C. Evaluation index system and evaluation method of China’s regional potential for electrical energy substitution. Math. Probl. Eng. 2018, 2018, 1–16. [Google Scholar] [CrossRef]
  7. Yang, Y.; Li, C.; Wang, N.; Yang, Z. Progress and prospects of innovative coal-fired power plants within the energy internet. Glob. Energy Interconnect. 2019, 2, 160–179. [Google Scholar] [CrossRef]
  8. Zeng, M.; Yang, Y.; Liu, D.; Zeng, B.; Han, X. “Generation-Grid-Load-Storage” coordinative optimal operation mode of energy internet and key technologies. Power Syst. Technol. 2016, 40, 114–124. [Google Scholar]
  9. Dong, Z.; Zhao, J.; Wen, F.; Xue, Y. From smart grid to energy internet: Basic concept and research framework. Autom. Electr. Power Syst. 2014, 38, 1–11. [Google Scholar]
  10. Väisänen, S.; Mikkilä, M.; Havukainen, J.; Sokka, L.; Luoranen, M.; Horttanainen, M. Using a multi-method approach for decision-making about a sustainable local distributed energy system: A case study from Finland. J. Clean. Prod. 2016, 137, 1330–1338. [Google Scholar] [CrossRef]
  11. Kharlamova, G.; Nate, S.; Chernyak, O. Renewable energy and security for Ukraine: Challenge or smart way. J. Int. Stud. 2016, 9, 88–115. [Google Scholar] [CrossRef] [PubMed]
  12. Tvaronavičienė, M.; Prakapienė, D.; Garškaitė-Milvydienė, K.; Prakapas, R.; Nawrot, Ł. Energy efficiency in the long run in the selected European countries. Econ. Sociol. 2018, 11, 245–254. [Google Scholar] [CrossRef] [PubMed]
  13. Wang, C.S.; Yan, J.Y.; Jia, H.J.; Wu, J.Z.; Yu, J.C.; Xu, T.; Zhang, Y. Renewable and distributed energy integration with mini/microgrids. Appl. Energy 2019, 237, 920–923. [Google Scholar] [CrossRef]
  14. Li, Y.; Yang, W.; He, P.; Chen, C.; Wang, X. Design and management of a distributed hybrid energy system through smart contract and blockchain. Appl. Energy 2019, 248, 390–405. [Google Scholar] [CrossRef]
  15. Shindina, T.; Streimikis, J.; Sukhareva, Y.; Nawrot, Ł. Social and economic properties of the energy markets. Econ. Sociol. 2018, 11, 334–344. [Google Scholar] [CrossRef]
  16. Sadeghi-Mobarakeh, A.; Shahsavari, A.; Haghighat, H.; Mohsenian-Rad, H. Optimal market participation of distributed load resources under distribution network operational limits and renewable generation uncertainties. IEEE Trans. Smart Grid 2019, 10, 3549–3561. [Google Scholar] [CrossRef]
  17. Simionescu, M.; Bilan, Y.; Krajnakova, E.; Streimikiene, D.; Gedek, S. Renewable energy in the electricity sector and GDP per capita in the European Union. Energies 2019, 12, 2520. [Google Scholar] [CrossRef]
  18. Simionescu, M.; Bilan, Y.; Štreimikienė, D. The impact of biodiesel consumption by transport on economic growth in the European Union. Inžinerinė Ekonomika 2019, 30, 50–58. [Google Scholar]
  19. Young, J.; Anderson, N.; Naughton, H. Influence of policy, air quality, and local attitudes toward renewable energy on the adoption of woody biomass heating systems. Energies 2018, 11, 2873. [Google Scholar] [CrossRef]
  20. Colmenar-Santos, A.; Munoz-Gomez, A.M.; Rosales-Asensio, E.; Lopez-Rey, A. Electric vehicle charging strategy to support renewable energy sources in Europe 2050 low-carbon scenario. Energy 2019, 183, 61–74. [Google Scholar] [CrossRef]
  21. Kasperowicz, R.; Pinczyński, M.; Khabdullin, A. Modeling the power of renewable energy sources in the context of classical electricity system transformation. J. Int. Stud. 2017, 10, 264–272. [Google Scholar] [CrossRef]
  22. Baleta, J.; Mikulcic, H.; Klemes, J.; Urbaniec, K.; Duic, N. Integration of energy, water and environmental systems for a sustainable development. J. Clean. Prod. 2019, 215, 1424–1436. [Google Scholar] [CrossRef]
  23. García-Gusano, D.; Iribarren, D.; Martín-Gamboa, M.; Dufour, J.; Espegren, K.; Lind, A. Integration of life-cycle indicators into energy optimisation models: The case study of power generation in Norway. J. Clean. Prod. 2016, 112, 2693–2696. [Google Scholar] [CrossRef]
  24. Brand, C.; Tran, M.; Anable, J. The UK transport carbon model: An integrated life cycle approach to explore low carbon futures. Energy Policy 2012, 41, 107–124. [Google Scholar] [CrossRef] [Green Version]
  25. Kouloumpis, V.; Stamford, L.; Azapagic, A. Decarbonising electricity supply: Is climate change mitigation going to be carried out at the expense of other environmental impacts? Sustain. Prod. Consum. 2015, 1, 1–21. [Google Scholar] [CrossRef]
  26. Su, M.; Chen, C.; Yang, Z. Urban energy structure optimization at the sector scale: considering environmental impact based on life cycle assessment. J. Clean. Prod. 2016, 112, 1464–1474. [Google Scholar] [CrossRef]
  27. Petrillo, A.; Felice, F.D.; Jannelli, E.; Autorino, C.; Minutillo, M.; Lavadera, A.L. Life cycle assessment (LCA) and life cycle cost (LCC) analysis model for a stand-alone hybrid renewable energy system. Renew. Energy 2016, 95, 337–355. [Google Scholar] [CrossRef]
  28. Vázquez-Rowe, I.; Reyna, J.L.; García-Torres, S.; Kahhat, R. Is climate change-centrism an optimal policy making strategy to set national electricity mixes? Appl. Energy 2015, 159, 108–116. [Google Scholar] [CrossRef]
  29. Pereira, J.P.; Parady, G.T.; Dominguez, B.C. Japan’s energy conundrum: Post-Fukushima scenarios from a life cycle perspective. Energy Policy 2014, 67, 104–115. [Google Scholar] [CrossRef]
  30. Portugal-Pereira, J.; Köberle, A.C.; Soria, R.; Lucena, A.F.; Szklo, A.; Schaeffer, R. Overlooked impacts of electricity expansion optimisation modelling: The life cycle side of the story. Energy 2016, 115, 1424–1435. [Google Scholar] [CrossRef]
  31. Messagie, M.; Mertens, J.; Oliveira, L.; Rangaraju, S.; Sanfelix, J.; Coosemans, T.; Macharis, C. The hourly life cycle carbon footprint of electricity generation in Belgium, bringing a temporal resolution in life cycle assessment. Appl. Energy 2014, 134, 469–476. [Google Scholar] [CrossRef]
  32. Evangelisti, S.; Clift, R.; Tagliaferri, C.; Lettieri, P. A life cycle assessment of distributed energy production from organic waste: Two case studies in Europe. Waste Manag. 2017, 64, 371–385. [Google Scholar] [CrossRef] [PubMed] [Green Version]
  33. Strazza, C.; Borghi, A.D.; Costamagna, P.; Gallo, M.; Brignole, E.; Girdinio, P. Life Cycle Assessment and Life Cycle Costing of a SOFC system for distributed power generation. Energy Convers. Manag. 2015, 100, 64–77. [Google Scholar] [CrossRef]
  34. Zhang, D.; Evangelisti, S.; Lettieri, P.; Papageorgiou, L.G. Optimal design of CHP-based microgrids: Multiobjective optimisation and life cycle assessment. Energy 2015, 85, 181–193. [Google Scholar] [CrossRef]
  35. Cellura, M.; Longo, S.; Mistretta, M. Sensitivity analysis to quantify uncertainty in life cycle assessment: The case study of an Italian tile. Renew. Sustain. Energy Rev. 2011, 15, 4697–4705. [Google Scholar] [CrossRef]
  36. Heijungs, R. Identification of key issues for further investigation in improving the reliability of life-cycle assessments. J. Clean. Prod. 1996, 4, 159–166. [Google Scholar] [CrossRef] [Green Version]
  37. Sakai, S.; Yokoyama, K. Formulation of sensitivity analysis in life cycle assessment using a perturbation method. Clean Technol. Environ. Policy 2002, 4, 72–78. [Google Scholar] [CrossRef]
  38. Groen, E.A.; Heijungs, R.; Bokkers, E.A.M.; de Boer, I.J. Sensitivity Analysis in Life Cycle Assessment. In Proceedings of the International Conference on Life Cycle Assessment in the Agri-food Sector, San Francisco, CA, USA, 8–10 October 2014. [Google Scholar]
  39. Welz, T.; Hischier, R.; Hilty, L.M. Environmental impacts of lighting technologies—Life cycle assessment and sensitivity analysis. Environ. Impact Assess. Rev. 2011, 31, 334–343. [Google Scholar] [CrossRef]
  40. Zhai, R.; Chao, L.; Ying, Y.; Patchigolla, K.; Oakey, J.E. Life cycle assessment of solar aided coal-fired power system with and without heat storage. Energy Convers. Manag. 2016, 111, 453–465. [Google Scholar] [CrossRef]
  41. Lamnatou, C.; Chemisana, D. Evaluation of photovoltaic-green and other roofing systems by means of ReCiPe and multiple life cycle-based environmental indicators. Build. Environ. 2015, 93, 376–384. [Google Scholar] [CrossRef]
  42. Riza, L.S.; Janusz, A.; Bergmeir, C.; Cornelis, C.; Herrera, F.; Śle, D.; Benítez, J.M. Implementing algorithms of rough set theory and fuzzy rough set theory in the R package “RoughSets”. Inf. Sci. 2014, 287, 68–89. [Google Scholar] [CrossRef]
  43. Juneja, A.; Rana, B.; Agrawal, R.K. A novel fuzzy rough selection of non-linearly extracted features for schizophrenia diagnosis using fMRI. Comput. Meth. Prog. Biomed. 2018, 155, 139–152. [Google Scholar] [CrossRef] [PubMed]
  44. Cheng, X.; Long, R.; Hong, C.; Li, W. Green competitiveness evaluation of provinces in China based on correlation analysis and fuzzy rough set. Ecol. Indic. 2018, 85, 841–852. [Google Scholar] [CrossRef]
  45. Cheng, X.; Long, R.; Chen, H. Obstacle diagnosis of green competition promotion: A case study of provinces in China based on catastrophe progression and fuzzy rough set methods. Environ. Sci. Pollut. Res. 2018, 25, 4344–4360. [Google Scholar] [CrossRef] [PubMed]
  46. Huijbregts, M.A.J.; Steinmann, Z.; Elshout, P.M.F.; Stam, G.; Verones, F.; Moura Vieira, M.D.; Zijp, M.; Hollander, A.; van Zelm, R. ReCiPe 2016: A harmonised life cycle impact assessment method at midpoint and endpoint level. Int. J. Life Cycle Assess. 2016, 22, 1–10. [Google Scholar]
  47. Miller, V.B.; Landis, A.E.; Schaefer, L.A. A benchmark for life cycle air emissions and life cycle impact assessment of hydrokinetic energy extraction using life cycle assessment. Renew. Energy 2011, 36, 1040–1046. [Google Scholar] [CrossRef]
  48. Chen, D.; Zhao, S. Local reduction of decision system with fuzzy rough sets. Fuzzy Sets Syst. 2010, 161, 1871–1883. [Google Scholar]
  49. Yang, J.; Chen, B. Life cycle assessment of wind power generation system. Handb. Clean Energy Syst. 2015, 1–18. [Google Scholar]
  50. Wernet, G.; Bauer, C.; Steubing, B.; Reinhard, J.; Moreno-Ruiz, E.; Weidema, B. The ecoinvent database version 3 (part I): Overview and methodology. Int. J. Life Cycle Assess. 2016, 21, 1218–1230. [Google Scholar] [CrossRef]
Figure 1. The framework of environmental impact evaluation methods.
Energies 12 04214 g001
Figure 2. Life cycle assessment (LCA) analysis flowchart for ReCiPe2016 method expended from Reference [46]. The dotted line means there is no constant mid-to endpoint factor for fossil resources.
Energies 12 04214 g002
Figure 3. Research profile of demonstrated distributed renewable energy system for life cycle assessment.
Energies 12 04214 g003
Figure 4. Environmental impact scores per product for endpoint area of protection of each power generation technology and overall distributed energy system.
Energies 12 04214 g004
Figure 5. Identifying crucial uncertain factors for distributed renewable energy system (DRES) through fuzzy rough sets (FRS) and one-at-a-time (OAT) approaches.
Energies 12 04214 g005
Figure 6. Uncertainty analysis results during the performance degradation process.
Energies 12 04214 g006
Table 1. Benchmark pollutant emission for 17 midpoint impact categories and normalization.
No.Midpoint Impact CategoryAbbreviationReference Benchmark
1Global warmingGWPCarbon dioxide
2Stratospheric ozone depletionODPCFC-11
3Ionizing radiationIRPCo-60
4Photochemical ozone formation (human)HOFPNitrogen oxides
5Fine particulate matter of formationPMFPPM2.5
6Photochemical ozone formation (ecosystem)EOFPNitrogen oxides
7Terrestrial acidificationAPSulphur oxides
8Freshwater eutrophicationFEPPhosphorus
9Terrestrial ecotoxicityETP terra1,4-DCB
10Freshwater ecotoxicityETP fw1,4-DCB
11Marine ecotoxicityETP marine1,4-DCB
12Human carcinogenic toxicityHCF carc1,4-DCB
13Human non-carcinogenic toxicityHCF ncarc1,4-DCB
14Land occupation/transformationLCP-
15Water consumptionWCP-
16Mineral resourceMRPkg Cu-eq/kg ore
17Fossil resource scarcityFFPkg oil-eq/unit of resource
Table 2. Basic parameters of the distributed renewable energy system in Yanqing district.
ComponentCapacity/MWLife Span/YearAnnual Utilization/%Annual Electricity/GWh
Wind1502026.12250.54 *
Small-scale hydropower45038.8713.62
Biogas2.43082.1917.28
Solar thermal1.53037.104.88
Photovoltaic432514.7355.47
* Annual electricity of the wind power system calculated with the synthetical reduction coefficient as 0.73 from [49].
Table 3. Typical pollutant emissions quantity to environment directly for each power generation technology and overall system with function unit.
Pollutant EmissionsWind Power
kg/kWh
Photovoltaic
kg/kWh
Hydropower
kg/kWh
Centralized Solar Thermal Power Generation Technologies (CSP) Module
kg/kWh
Biogas
kg/kWh
Overall
kg/kWh
CO21.93 × 10−27.25 × 10−24.21 × 10−36.23 × 10−27.62 × 10−16.55 × 10⁻²
SO26.73 × 10−52.56 × 10−47.31 × 10−61.43 × 10−44.71 × 10−41.17 × 10⁻⁴
CO1.48 × 10−42.51 × 10−42.10 × 10−53.79 × 10−43.93 × 10−33.54 × 10−4
NOX5.90 × 10−51.84 × 10−41.52 × 10−51.69 × 10−42.28 × 10−48.76 × 10⁻⁵
CH45.87 × 10−52.16 × 10−46.30 × 10−61.82 × 10−44.89 × 10−33.28 × 10⁻⁴
N2O4.86 × 10−122.62 × 10−103.79 × 10−134.63 × 10−111.27 × 10−124.69 × 10⁻¹¹
Table 4. Midpoint to endpoint conversion factors referring to ReCiPe2016 [46].
Endpoint AreaMidpoint Impact CategoryUnitConversion Factor
Human healthGlobal warmingDisability-adjusted life years (DALY)/kg CO2 eq.1.25 × 10−5
Stratospheric ozone depletionDALY/kg CFC11 eq.1.34 × 10−3
ionizing radiationDALY/kBq Co-60 emitted to air eq.1.40 × 10−8
Fine particulate matter formationDALY/kg PM2.5 eq.6.29 × 10−4
Photochemical ozone formationDALY/kg NOx eq.9.10 × 10−7
Toxicity (cancer)DALY/kg 1,4-DCB emitted to urban air eq.3.32 × 10−6
Toxicity (non-cancer)DALY/kg 1,4-DCB emitted to urban air eq.2.28 × 10−7
Water consumptionDALY/m3 consumed2.22 × 10−6
Terrestrial ecosystemsGlobal WarmingSpecies. year/kg CO2 eq.2.50 × 10−8
Photochemical ozone formationSpecies. year/kg NOx eq.1.29 × 10−7
AcidificationSpecies. year/kg SO2 eq.2.12 × 10−7
ToxicitySpecies. year/kg 1,4-DBC emitted to industrial soil eq.1.14 × 10−11
Water consumptionspecies. year/m3 consumed1.35 × 10−8
Land useSpecies/(m2∙annual crop eq)8.88 × 10⁻⁹
Freshwater ecosystemsGlobal WarmingSpecies. year/kg CO2 eq.6.82 × 10−13
EutrophicationSpecies. year/kg P to freshwater eq.6.71 × 10−7
ToxicitySpecies. year/kg 1,4-DBC emitted to freshwater eq.6.95 × 10−10
Water consumptionspecies. year/m3 consumed6.04 × 10−13
Marine ecosystemsToxicitySpecies. year/kg 1,4-DBC emitted to sea water eq.1.05 × 10−10
EutrophicationSpecies. year/kg N to marine water eq.1.70 × 10−9
ResourcesMineral resource scarcityUSD/kg Cu0.23
Fossil Resource scarcityCrude oilUSD/kg0.46
Hard coalUSD/kg0.03
Natural gasUSD/Nm30.30
Brown coalUSD/kg0.03
PeatUSD/kg0.03

