Article

An Investigation into Sub-Critical Choke Flow Performance in High Rate Gas Condensate Wells

1
School of Engineering, Faculty of Science and Technology, University of Central Lancashire, Preston PR1 2HE, UK
2
School of Engineering, Azad University, Tehran Jonoob Branch, Tehran 1584743311, Iran
3
Department of water sciences & engineering, college of agriculture; Jahrom University, Jahrom 74148-46199, Iran
*
Author to whom correspondence should be addressed.
Energies 2019, 12(20), 3992; https://doi.org/10.3390/en12203992
Submission received: 30 June 2019 / Revised: 15 October 2019 / Accepted: 16 October 2019 / Published: 20 October 2019

Abstract

:
There have been some correlations in the literature to predict the gas and liquid flow rate through wellhead chokes under subcritical flow conditions. The majority of these empirical correlations have been developed based on limited production data sets that were collected from a small number of fields. Therefore, these correlations are valid within the parameter variation ranges of those fields. If such correlations are used elsewhere for the prediction of the subcritical choke flow performance of the other fields, significant errors will occur. Additionally, there are only a few empirical correlations for sub-critical choke flow performance in high rate gas condensate wells. These led the authors to develop a new empirical correlation based on a wider production data set from different gas condensate fields in the world; 234 production data points were collected from a large number of production wells in twenty different gas condensate fields with diverse reservoir conditions and different production histories. A non-linear regression analysis method was applied to their production. The new correlation was validated with a new set of data points from some other production wells to confirm the accuracy of the established correlation. The results show that the new correlation had minimal errors and predicted the gas flow rate more accurately than the other three existing models over a wider range of parameter variation ranges.

1. Introduction

Wellhead choke is a primary piece of equipment used in the multiphase production of oil and gas wells. Wellhead chokes are mainly used in the oil and gas industry for the following reasons [1,2,3,4]:
  • To regulate oil and gas production and consequently keep the wellhead pressure to an acceptable level to avoid any damage to the formation.
  • To secure surface facilities from slugging.
  • To avoid any possible water or gas coning due to excessive pressure drawdown.
  • To produce a well at a stable production rate at the most efficient level.
Since the production of oil and gas is extremely sensitive to choke size, it is significantly important to model choke performance and select optimal choke size as accurately as possible. Two different types of wellhead chokes are placed in surface facilities, i.e., fixed choke and adjustable chokes. If adjustable chokes are used, fluid flow and wellhead pressure can be adjusted by changing the opening of the adjustable choke, i.e., choke size. However, in fixed chokes, the size of the opening is fixed, and it is not possible to change the fluid flow rate and wellhead pressure. Once a well is designed to produce for a long production period at a constant production rate, it is recommended to use the fixed choke due to such a choke’s resistance to erosion [2,5,6,7].
Depending on the flow regime, the flow across the wellhead choke can be typified as either sonic (critical) flow or subsonic (subcritical) flow. Critical or sonic flow through wellhead chokes occurs when the Mach number exceeds unity, in such a case, the fluid velocity through the choke surpasses the sonic velocity, and consequently, any downstream pressure perturbation cannot disseminate through the upstream choke. Therefore, the mass flow rate across the choke depends only on the upstream parameters, and it is not a function of the downstream parameters. Resultantly, during the critical flow condition, the fluid flow is not a function of the pressure change through the choke, and any change in the downstream condition of the choke has no impact on the upstream. Contrariwise, when the fluid velocity across the choke is less than the sonic velocity, the Mach number does not exceed unity and any pressure disturbance in downstream could spread through the choke upstream. For that reason, the mass flow rate across the choke depends on both the upstream parameters and the downstream parameters, and the fluid flow is dependent on the pressure change across the choke. Since it is too difficult to measure the sound and fluid velocities across the choke in oil and gas fields, it is recommended to consider the value of 0.5 for the ratio of downstream pressure to wellhead pressure as the borderline of the critical and sub-critical flow. In other words, when the value of the ratio of downstream pressure to upstream pressure is below 0.5, the flow is considered as critical, and when the ratio is larger than 0.5, the flow is considered as sub-critical [2].
Analytical and empirical approaches are considered the main two approaches to predict the multiphase fluid flow through wellhead chokes [8,9,10,11,12,13]. There are numerous analytical and empirical correlations for the prediction of choke performance relationships [14,15,16,17,18].
Tangren et al. (1949) were the first investigators to analytically model the two-phase flow through chokes. They assumed that liquid is a continuous phase and gas is the discontinuous phase, and the correlation is therefore invalid when the liquid phase is intermittent through the chokes [19]. Ros (1960) extended the analytical investigation that was conducted by Tangren et al. (1949) to change their model into a new correlation in which the gas phase is the continuous phase and liquid is discontinuous. Ashford and Pierce (1975) used the model that was developed by Ros (1960) to establish a relationship to predict the flow rates under a critical flow condition. Sachdeva et al., (1986) were the first researchers to develop a relationship to predict the pressure ratio for the critical flow condition. Additionally, they developed another correlation to determine the boundary between the critical (sonic) and subcritical (subsonic) flow. Brill (1991) developed a theoretical (mechanistic) model by combining the Bernoulli and continuity equations to predict flow rates under a subcritical flow condition. Their correlation is extensively utilized in the oil and gas industry with an acceptable error. There have been several other research works on the development of theoretical models [20,21,22,23,24,25].
Gilbert (1954) was the first researcher to suggest the an empirical correlation by using 268 production data sets taken from an oil field in California, for choke sizes ranging from 6/64 to 18/64. He assumed that the fluid flow through the choke is under a critical condition and upstream pressure is at least seventy percent larger than that of the downstream. In Gilbert’s correlation, which is recognized as the best empirical correlation for the prediction of flow rates under critical conditions, the flow rate is linearly proportional to the pressure at upstream of the choke. Gilbert’s empirical correlation is shown in Equation (1).
P w h = c · Q · R a S b
where:
  • Pwh: Upstream (wellhead) pressure, psi.
  • Q: Gross liquid rate, bbl/day.
  • R: Gas–liquid ratio, MScf/Stb.
  • S: Choke size, 1/64 inch.
  • a, b, and c: Empirical constants.
Many researchers have developed Gilbert-type empirical correlations for the prediction of choke performance under critical conditions [25,26,27,28,29,30,31,32,33]. All empirical correlations have been developed using production data sets taken from some specific fields [34,35,36,37,38]; therefore, these empirical correlations are usually accurate within production parameter variation ranges from which they have been developed. If such correlations are introduced to new production data from other fields to predict production rates or if they are used to extrapolate to other conditions, inaccurate results can occur. Therefore, many investigators have developed different Gilbert-type relationships with different empirical constants for production data sets from different fields [39,40,41,42,43,44,45].
Osman and Dokla (1990) investigated a set of different subcritical production data points from different wells in a field and noted that if the pressure drop replaces the upstream pressure in the Gilbert formula through the choke (the difference between upstream pressure and downstream pressure), it could significantly improve the accuracy of the flow rate prediction. Following the results of Osman and Dokla (1990), some researchers developed new empirical correlations for the subcritical flow condition [20,22,31,39,46].
Guo et al. (2002) considered a set of production data from a gas condensate field in the USA. They showed that a subcritical flow condition commonly takes place in wellhead chokes with large choke sizes.
Al-Attar (2008) considered ninety-seven different production data sets with chokes ranging from 24/64 to 128/64 inch to develop a new correlation for a subcritical flow condition. He tuned the empirical constant of the modified Gilbert formula with pressure drop replacing upstream pressure, using a non-linear regression analysis approach. He also divided the production data sets into eight different subdivisions, where each subdivision was representative of a choke size, i.e., 24/64, 32/64, 44/64, 48/64, 64/64, 96/64, 112/64 and 128/64. He developed eight different new Gilbert formulas, each representing a choke size, for each subdivision. He noticed that the accuracy of the established correlations was significantly improved once the analysis was applied to subdivisions with individual choke sizes. Following the results of the two research works which were conducted by Guo et al. (2002) and Al-Attar (2008), Nasriani and Kalantari Asl (2011) were the first researchers to develop an empirical Gilbert-type correlation under a subcritical flow condition for high rate gas wells across large choke sizes ranging from 40/64 to 192/64. They conducted a non-linear regression analysis on sixty-one different production datasets taken from gas condensate fields in the Middle East to tune the empirical constants of the modified Gilbert-type formula.
It is worth mentioning that the flow rate of the choke is not always linearly proportional to the pressure drop across the choke, and the relation between the flow rate and the pressure drop across the choke could therefore be concave compared to the straight line in the Gilbert formula. Resultantly, some researchers considered a concave relationship between the flow rate and the pressure drop by introducing a new exponent to the pressure drop in the Gilbert formula to improve the accuracy of the flow rate prediction [30,47,48].
The modified Gilbert formula is shown in Equation (2).
Q g = a ( L G R ) b S c Δ P d
where:
  • Δ P : Pressure drop across the choke
  • Qg: Gas flow rate, MMscf/day
  • LGR: Liquid–gas, Stb/MMScf
  • S: Choke size, 1/64 inch
  • a, b, c and d: Empirical constants.
Seidi and Sayahi (2015) extended the work that was initially conducted on high flow rate chokes by Nasriani and Kalantari Asl (2011) and developed the second empirical correlation for high flow rate gas through large chokes under a subcritical condition using a non-linear regression analysis and a genetic algorithm.
It was mentioned previously that all empirical correlations are developed using limited production data points which are taken from some specific fields; therefore, all empirical correlations are usually accurate within the production parameter variation ranges in which they have been developed. If such correlations are introduced to new production data from other fields to predict production rates or if they are used to extrapolate to other conditions, inaccurate results can occur. In this study, several sets of production data points are used to develop a more realistic subcritical Gilbert-type correlation that could represent the choke performance of high rate wells in gas condensate reservoirs as accurately as possible over much wider-ranging production parameters.
The newly established correlation is validated against an additional set of production data points (32 new production data points). The second objective of this study is to extend the works that were conducted on the development of a set of correlations on individual choke categories [19,21]. An integrated error analysis study is conducted on the results of the new model using different error parameters.

2. Methodology

In a nonlinear regression analysis, the observed (real) data are demonstrated by a function in which the model parameters are nonlinearly combined, and this nonlinear combination is a function of one or more independent variables. The output data are fitted by the succeeding approximations technique. A nonlinear regression analysis is commonly used when a specific form for the function of dependent data and variables is available according to the understanding of the physics of the phenomena. This technique uses the linear estimation of a Taylor series expansion to convert a nonlinear combination of variables of a function into a linear combination. An iterative process is employed to estimate parameters by the minimization of the summation of square errors. The iteration process stops when the error of the estimation becomes satisfactorily small.
In this work, five different sets of production data points were employed to establish a more accurate subcritical Gilbert-type relationship that could describe the choke performance of high-rate wells in gas condensate reservoirs as precisely as possible over much wider-ranging production parameters than those that have been previously established; 293 different data points from 4 different sets of data points from twenty different gas condensate fields were used to develop a more accurate correlation which could be applicable to broader than usual practical field data. It should be noted that all of the production data sets are collected from onshore wells; 293 different data points from 4 different sets of data points that were gathered from 20 different gas condensate fields are as follows:
  • Sixty-one production data points from the research work conducted by Nasriani and Kalantari Asl (2011) [19].
  • Two sets of production data points with 67 and 39 data points from the research work conducted by Seidi and Sayahi (2015) [30].
  • A set of 126 new production data points from high rate gas condensate wells were considered. The new production data points were collected from moderate-to-rich gas condensate fields with relatively high LGR values, i.e., up to 178.8 bbl/MMscf; therefore the new model can be applicable to a wider (than previously established) range of gas condensate fields with low-to-relatively high condensate gas ratios compared to the other 2 models that were developed for gas condensate reservoirs, i.e., [19,30].
The range of different production parameters are shown in Table 1. The authors believe that they could increase the applicability of their new model by considering different production data points from previously published works [19,30] in addition to 126 new production data points from high rate gas condensate wells. The new model could assist field engineers in the optimization of flow rate and the selection of the optimal choke size. As mentioned previously, in the second stage, the newly established correlation was validated against an additional set of production data points (32 new production data points). In the third stage, a regression analysis was introduced to individual choke categories to observe if the estimation could be further improved [19,21].
During all these three stages, in addition to the newly developed model, the flow rate was predicted using three additional models to evaluate the applicability of the new model compared to the previously published models. The three additional models are as follows:
  • Model 1 [30]:
    Q g = 0.015 S 1.27 Δ P 0.56 ( L G R ) 0.4
  • Model 2 [19]:
    Q g = S 1.9 Δ P 9350 ( L G R ) 0.65
  • Model 3 [2]:
    Q g = S 1.8587 Δ P 302 ( L G R ) 0.4038
A comprehensive error analysis study was implemented on the results of the new model and the other three available models using seven error expressions:
  • Per cent deviation (PD):
    P D i = Q g , r e a l Q g ,   p r e d i c t e d Q g , r e a l
  • Average per cent deviation (APD):
    A P D = i = 1 n P D i n
  • Absolute average percent deviation (AAPD):
    A A P D = i = 1 n | P D i | n
  • Standard deviation (SD):
    S D = i = 1 n ( P D i A P D ) 2 n 1
  • Mean square error (MSE):
    M S E = i = 1 n ( Q g ,   p r e d i c t e d Q g , r e a l ) 2 n
  • Root mean square error (RMSE):
    R M S E = i = 1 n ( Q g ,   p r e d i c t e d Q g , r e a l ) 2 n
  • R-squared (R2):
    R 2 = 1 i = 1 n ( Q g ,   p r e d i c t e d Q g , r e a l ) 2 i = 1 n ( Q g , r e a l i = 1 n Q g , r e a l   i n ) 2

3. Results and Discussion

In order to find the optimal values for the empirical constant and exponents of the Gilbert-type formula, the following steps were taken:
  • All 293 production data points were used in the non-linear regression analysis, i.e., gas flow rate (Qg), the liquid gas ratio (LGR), choke size (S) and the pressure drop across the choke (ΔP).
  • The Gilbert-type formula was introduced to the model as the input function.
  • The objective parameter for the optimization was selected, i.e., either the mean square error (MSE) to be minimized or the R-squared (R2) value to be as close as possible to unity.
  • Decision variables, i.e., the empirical constant and exponents of the Gilbert-type formula: a, b, c and d.
In this work, the objective parameter of the nonlinear regression analysis was the mean square error (MSE) of the predicted gas flow rates and the real gas flow rates, as shown in Equation (10). Four different decision variables, i.e., the empirical constant and exponents of the Gilbert-type formula: a, b, c and d were considered to predict the flow rate and, consequently, the objective parameter (MSE). The solver tuned the decision variables to obtain the minimum possible value for the mean square error, i.e., the objective parameter. In this work, the generalized reduced gradient (GRG) method, a consistent and robust iteration protocol, was employed for the nonlinear optimization of the correlation.
This technique used the linear approximation of a Taylor series expansion to convert a nonlinear combination of variables of the function into a linear combination. An iterative process was employed to estimate the parameters by the minimization of the summation of square errors. The iteration process stopped when the error of the estimation became satisfactorily minimal. A full explanation of the implementation of the nonlinear regression analysis using excel solver can be found elsewhere [49,50,51,52]. The results of the implementation of the non-linear regression analysis on the tuning the Gilbert-type formula is shown in Equation (13):
Q g = 0.0437 S 1.1136 Δ P 0.4836 ( L G R ) 0.3129
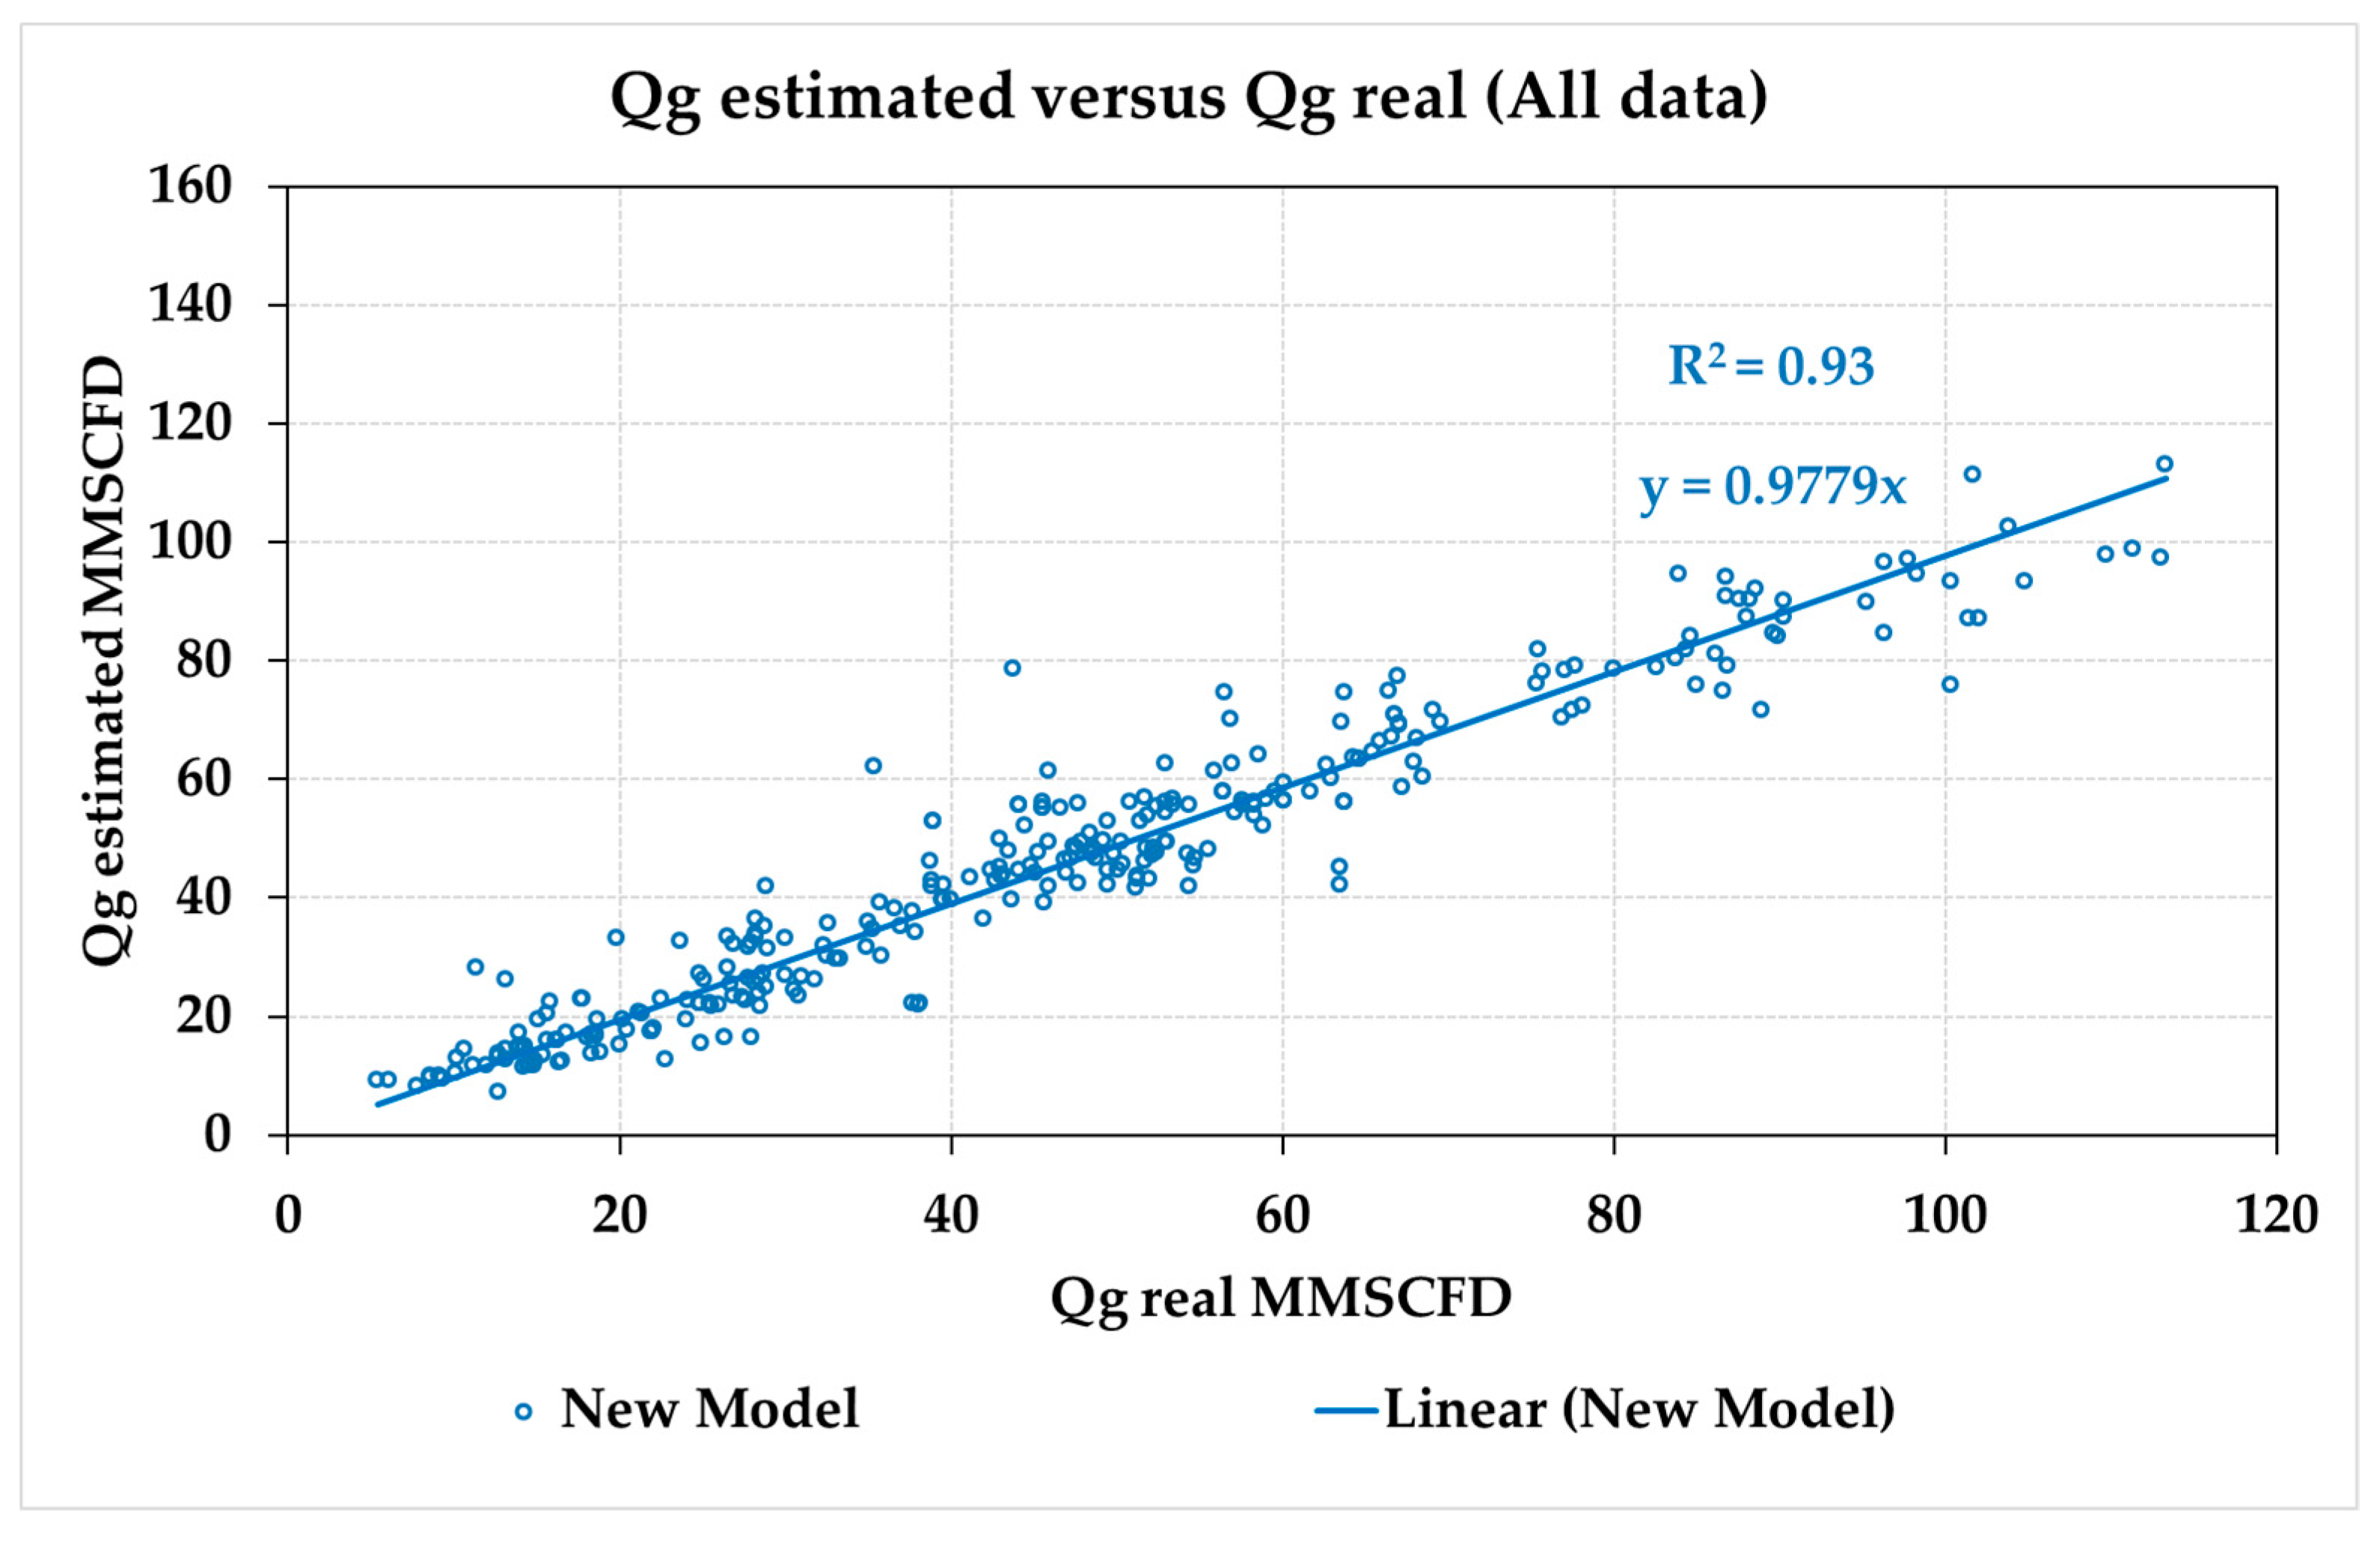
The estimated gas flow rate using the tuned Gilbert-type formula, Equation (13) versus real gas flow rate, is shown in Figure 1. It can be noted in Figure 1 that the new model predicted the gas flow rate through wellhead choke was in an excellent agreement with the real gas flow rate, i.e., R2 = 0.93. As is shown in Figure 1, the unit for gas flowrate was MMSCFD. MMSCFD stands for million standard cubic feet per day. Million standard cubic feet per day is a unit of measurement for natural gases in the world. It is frequently abbreviated MMSCFD.
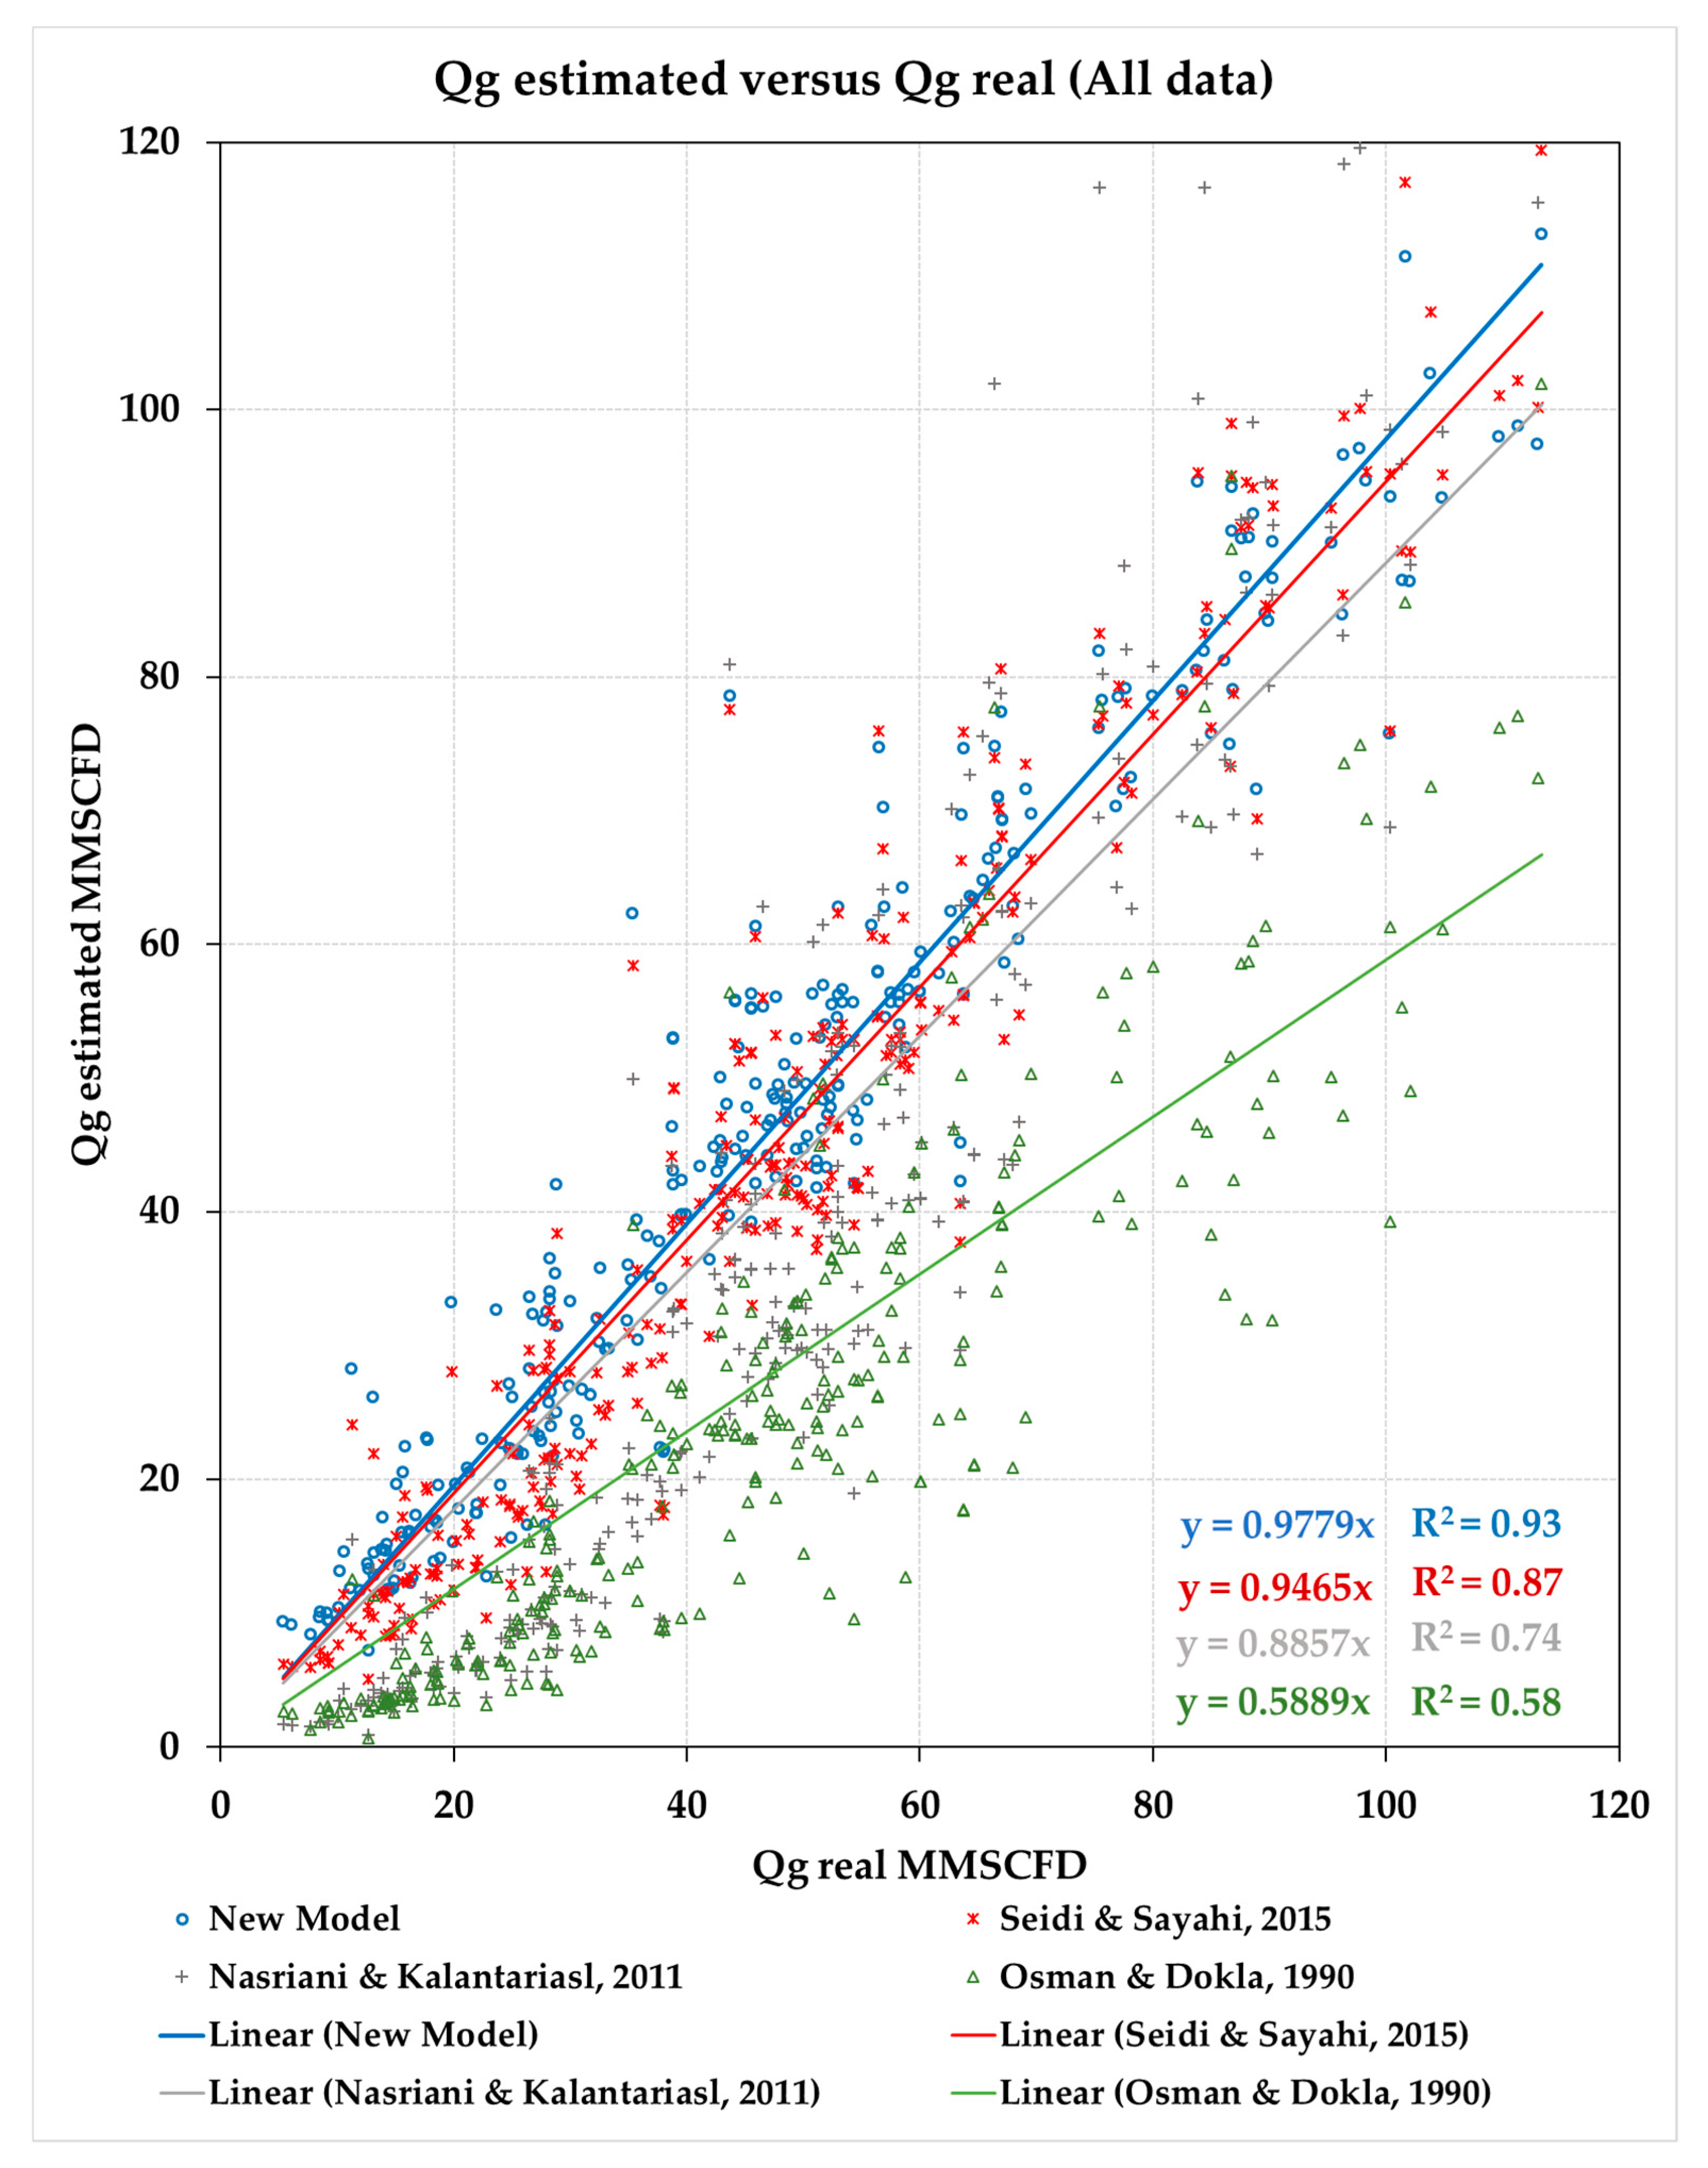
In addition to the newly developed model, the other three aforementioned correlations were employed to predict the gas flow rate for the 293 production data points, i.e., Model 1 [30], Model 2 [19], and Model 3 [2].
Figure 2 demonstrates a comparison between four different models in the prediction of gas flow rate using the production parameters. Table 2 compares the accuracy of these four different models using seven different error analysis parameters, i.e., PD, APD, AAPD, SD, MSE, RMSE and R2. A comparison of four different models in the prediction of gas flow rate in Figure 2, and, correspondingly, the comparison of the seven statistical measures of accuracy in Table 2 show that the newly developed correlation was the most accurate model amongst four models, followed by Models 1–3, respectively.
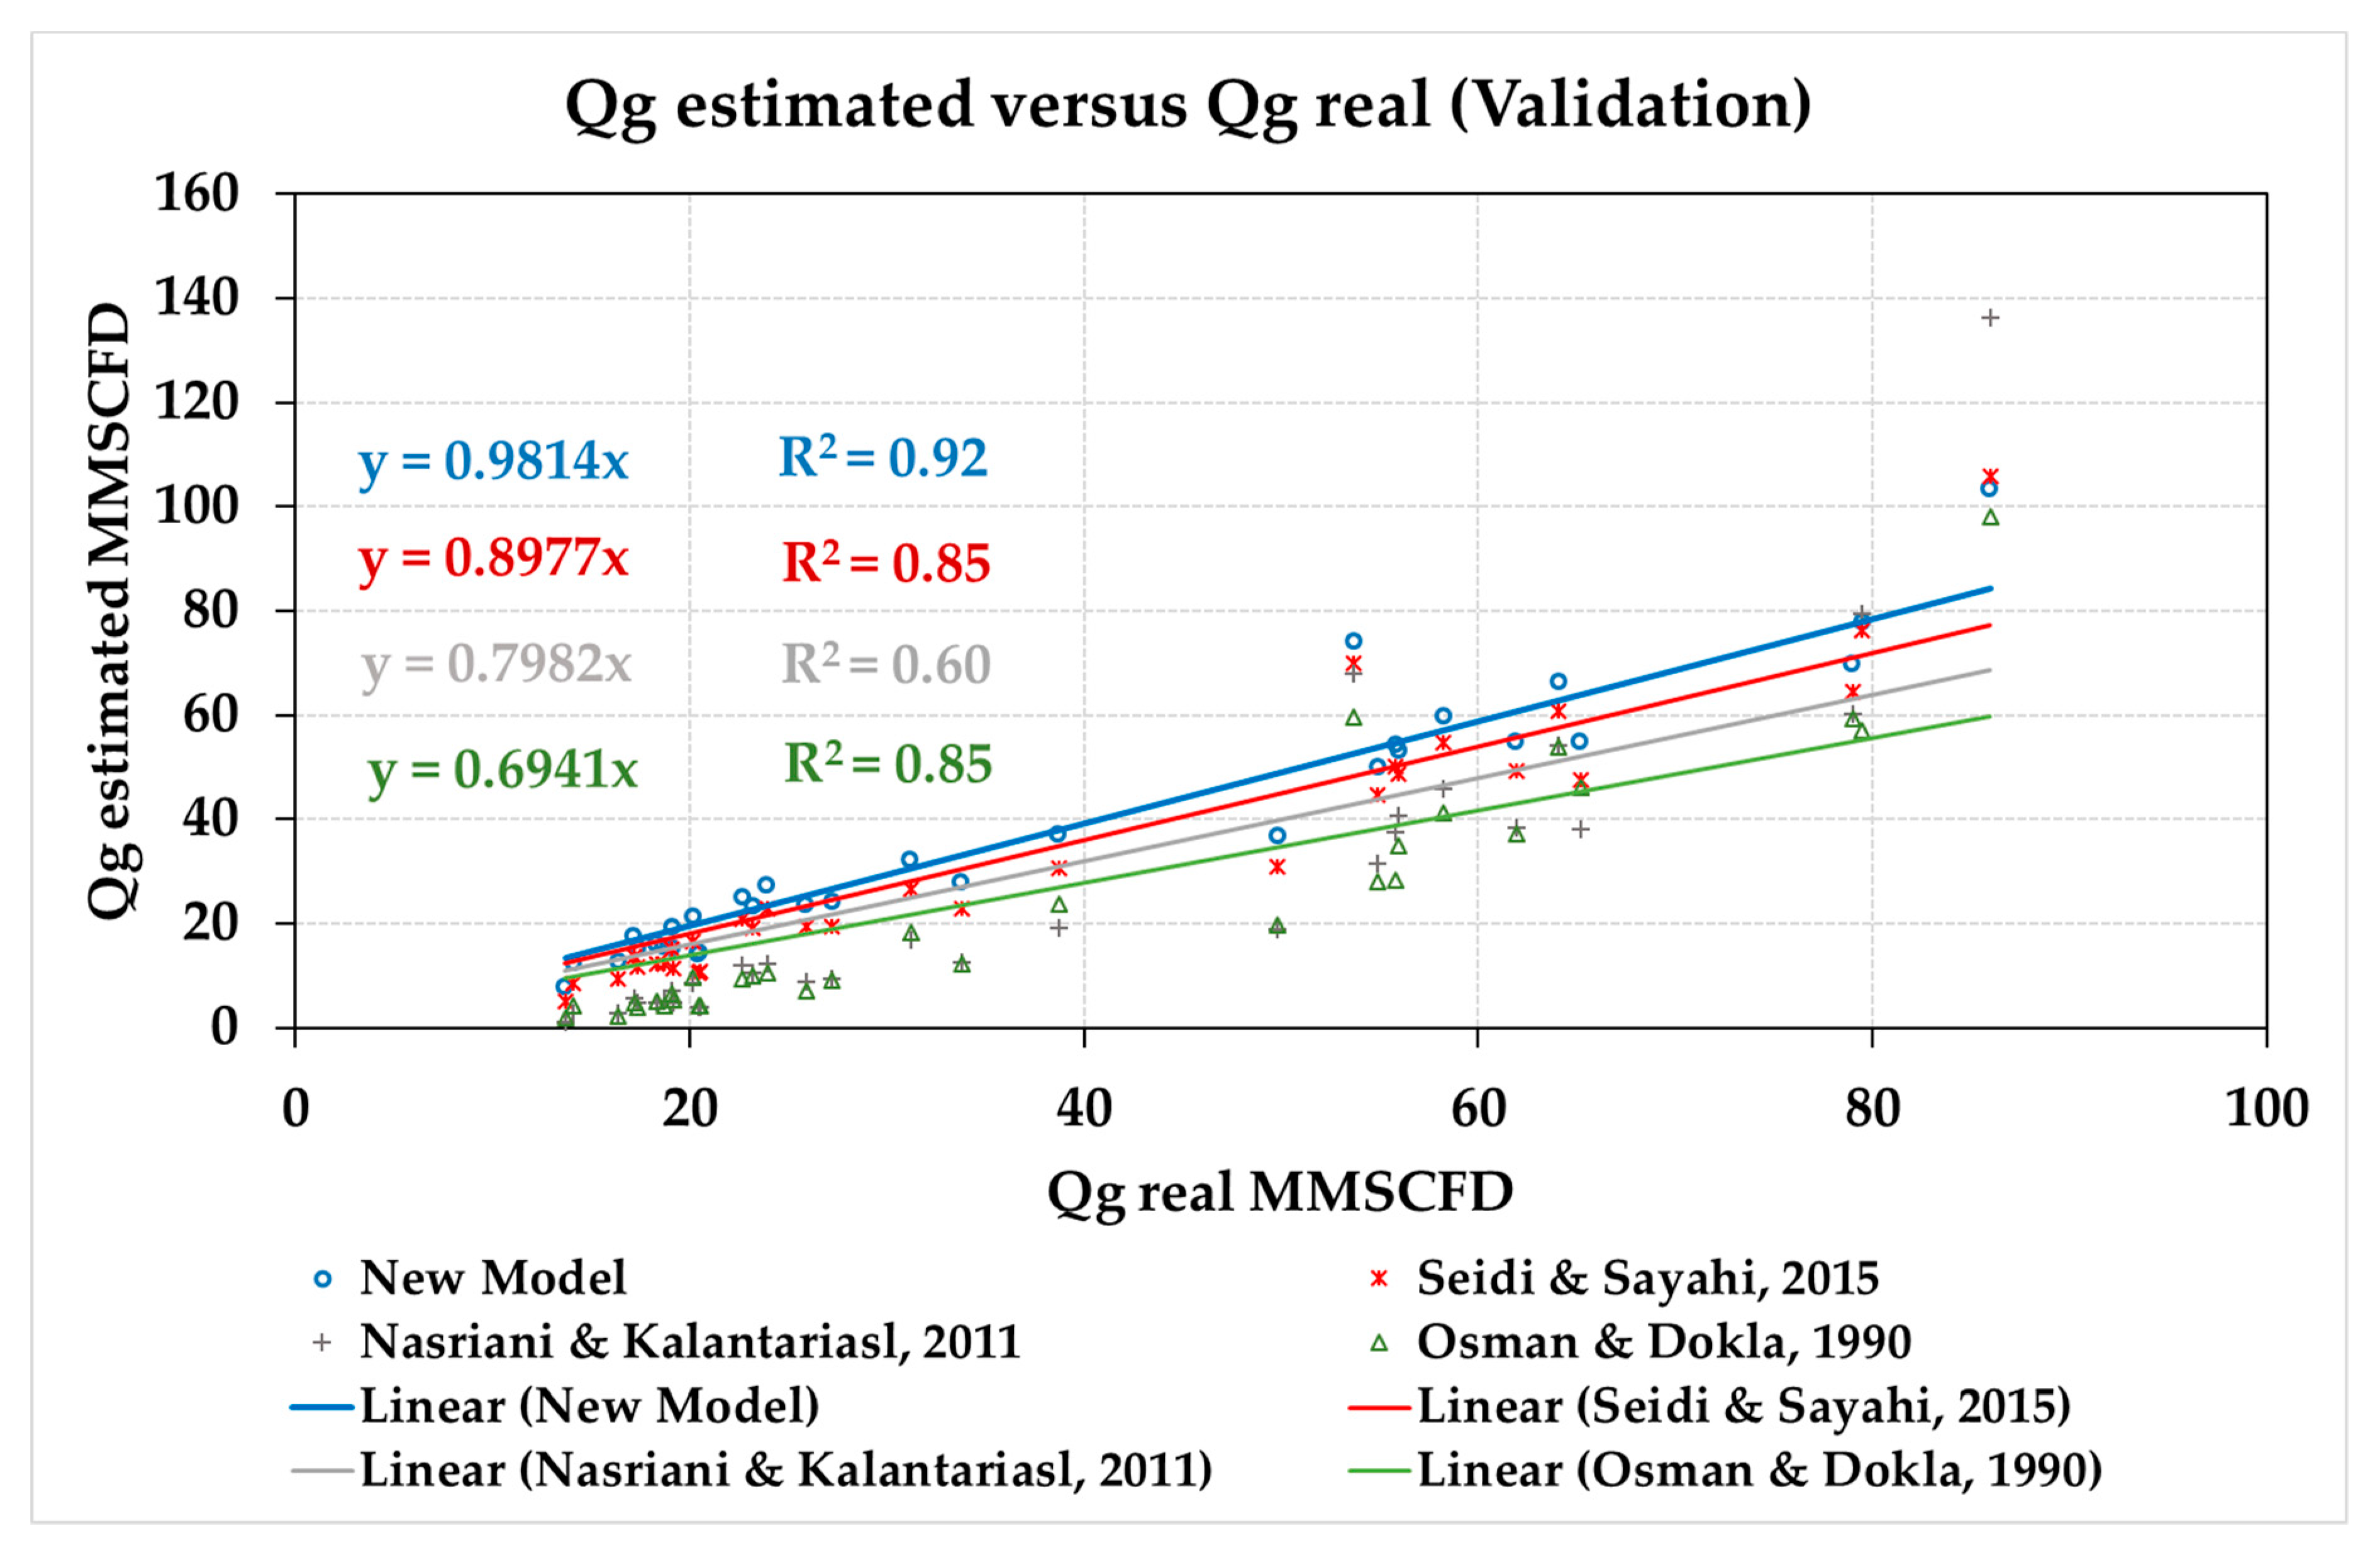
The newly developed model was evaluated using the fifth set of the production data points from some other gas condensate fields to assure that the new model was capable of the accurate prediction of choke performance in comparison with the other three available models. The new model and the other three available models were then employed to predict gas flow rate through chokes using the additional set of the production data points (32 new production data points). As is shown in Figure 3 and Table 3, the new model more accurately predicted the gas flow rate through the wellhead chokes of some other fields (with R2 of 0.92) than the three current models. 
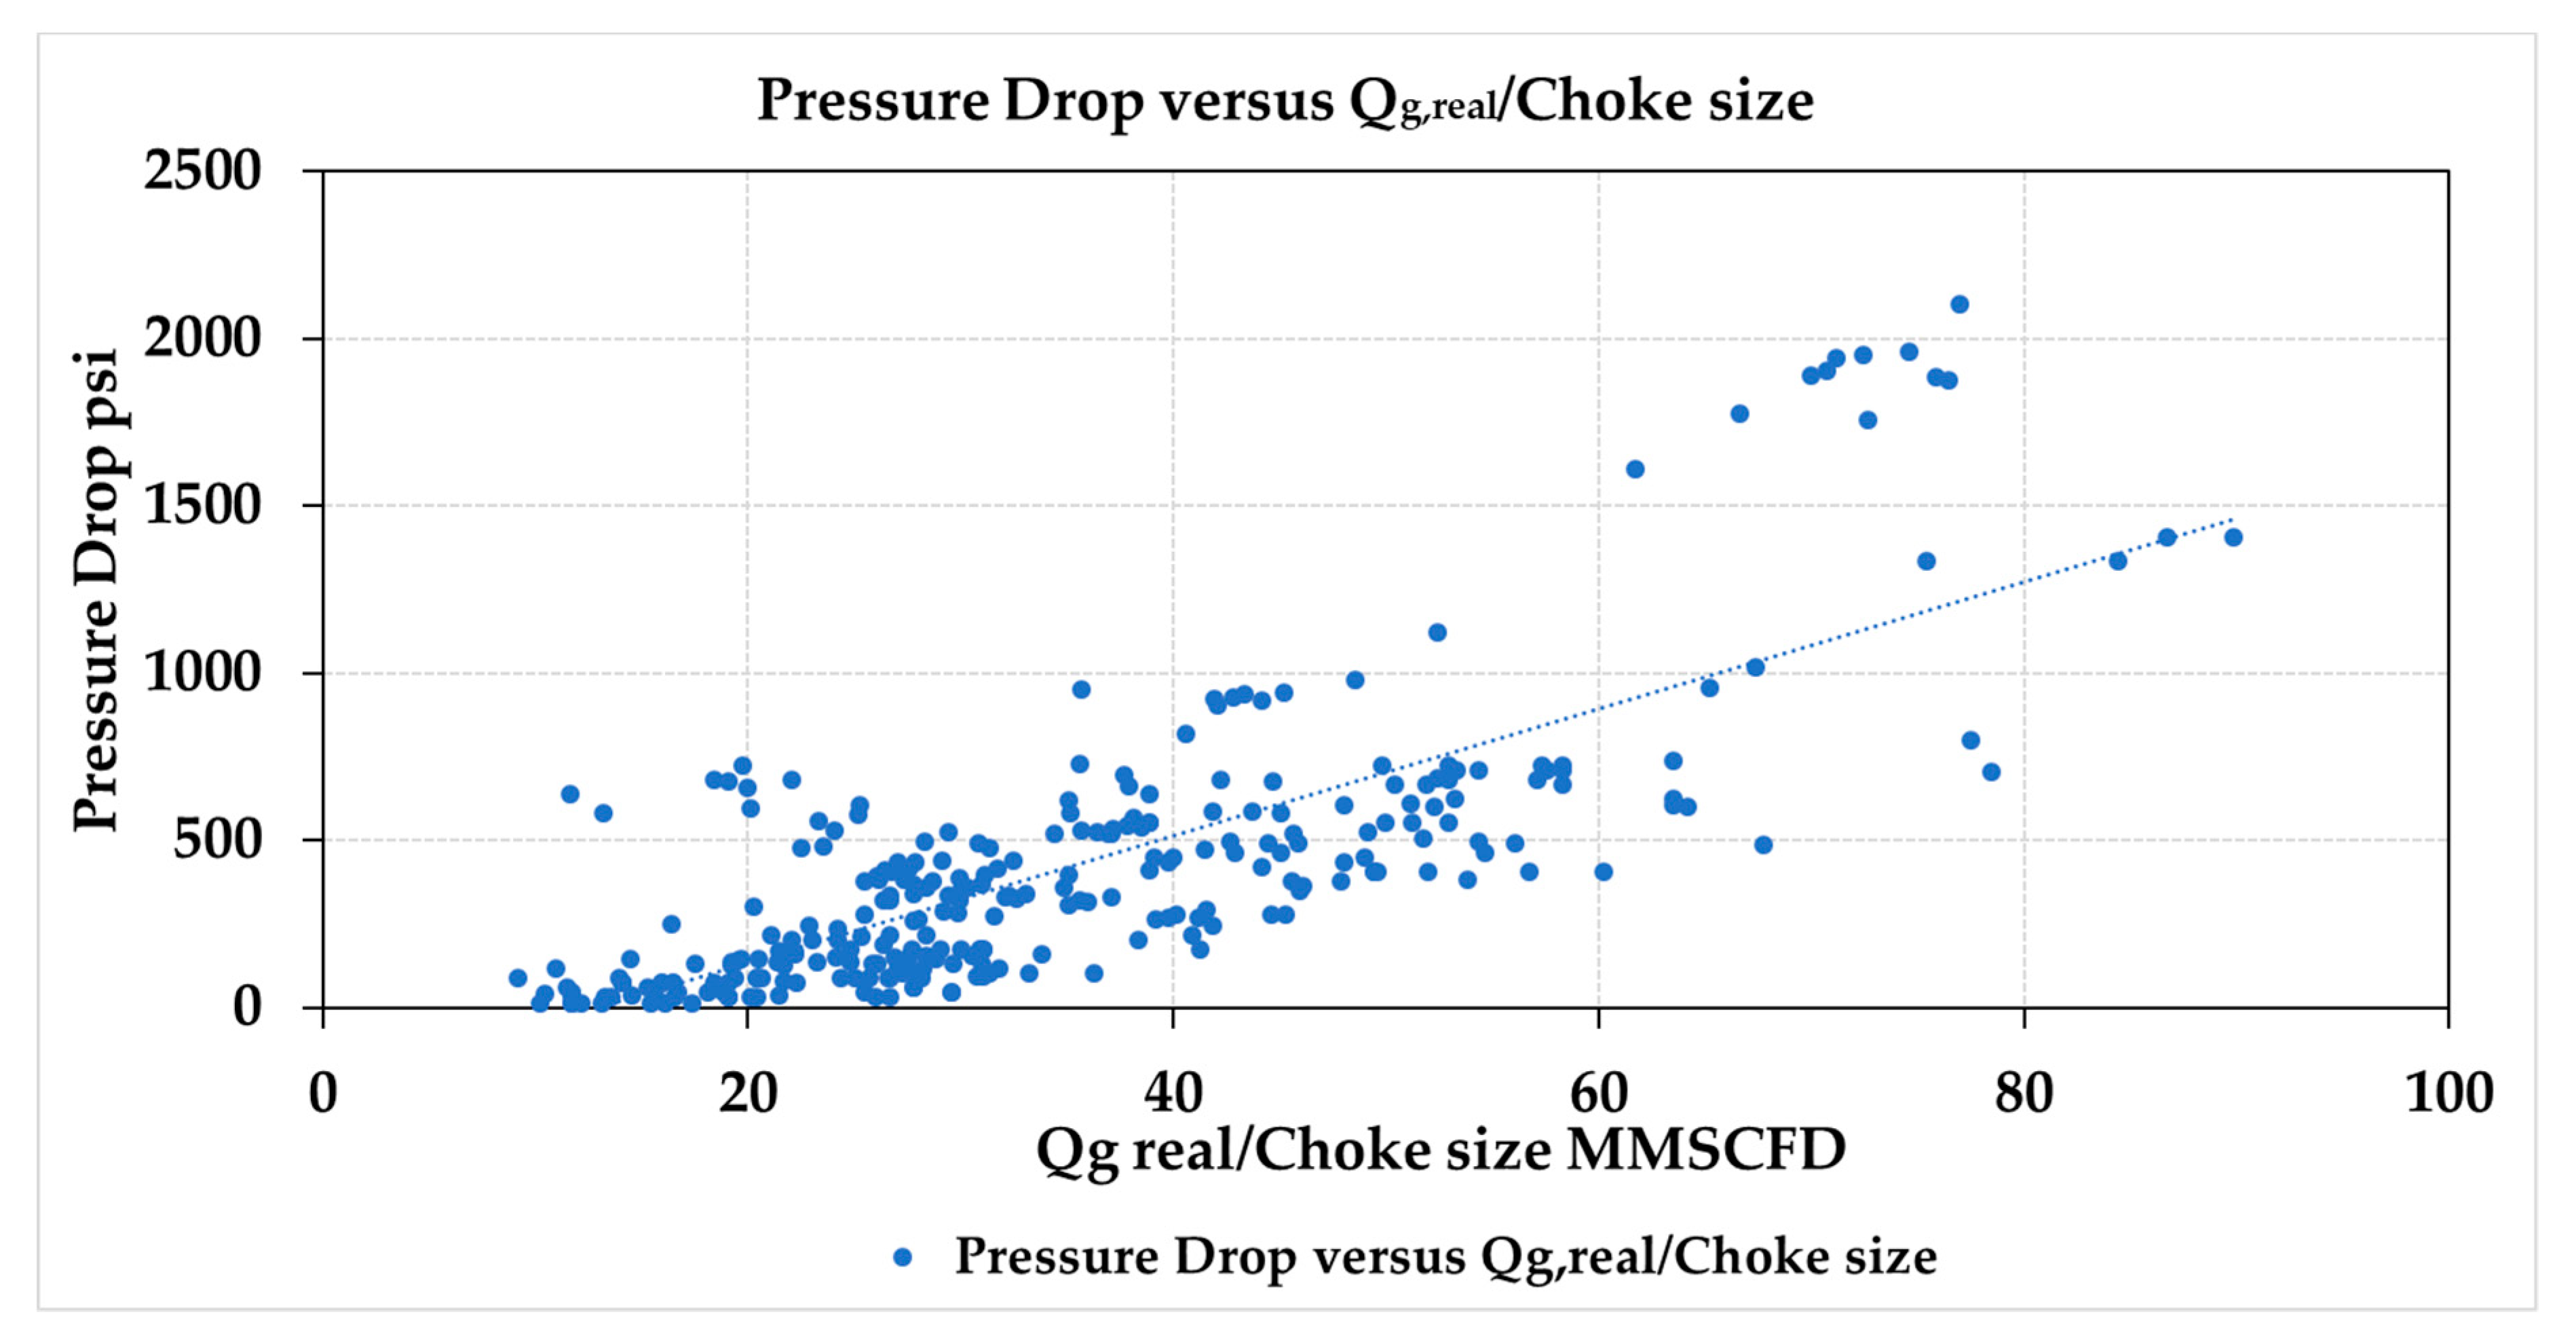
Figure 4 demonstrates the pressure drop across the choke vs flow rate per choke size for the relevance and general shape of the data and their functions. Al-Attar (2008) suggested that if the choke performance of wellhead chokes under a subcritical condition is predicted based on individual choke sizes, it could increase the accuracy of the estimation of flow rates. Nasriani and Kalantari Asl (2011) extended the line of Al-Attar’s (2008) study to large choke sizes and developed a set of different choke correlations for individual choke sizes; however, their investigation was on a limited set of the production data points (61 production data points). In this work, Nasriani and Kalantari Asl’s (2011) investigation was extended to be applicable for wider-ranging production data points (293 production data points) from different studies, i.e., 61 production data points from the research work that was conducted by Nasriani and Kalantari Asl (2011), two sets of production data points with 67 and 39 data points from the research work that was conducted by Seidi and Sayahi (2015), and a set of 126 new production data points from high rate gas condensate wells. Since in this section, the choke performance of wellhead chokes under the subcritical condition was predicted based on individual choke sizes, the choke size was constant when nonlinear regression was conducted on the subdivisions of production data points with individual choke sizes; therefore, Equation (14) could be written as follows:
Q g = a ( L G R ) b S c Δ P d = a S c ( L G R ) b Δ P d = a ( L G R ) b Δ P d
It should be highlighted that in Equation (14), a’ is a function of the choke size, i.e., a’ = aSc.
The set of production data points (293 production data points) was divided into seven different groups of main individual choke sizes of 24/64, 40/64, 64/64, 128/64, 144/64, 160/64, and 192/64 inches. The choke sizes and the number of data points corresponding to each choke size are shown in Table 4. The empirical constants and exponents for individual choke sizes resulting from the non-linear regression analysis using the specific form of the Gilbert formula (Equation (14)) are listed in Table 5.
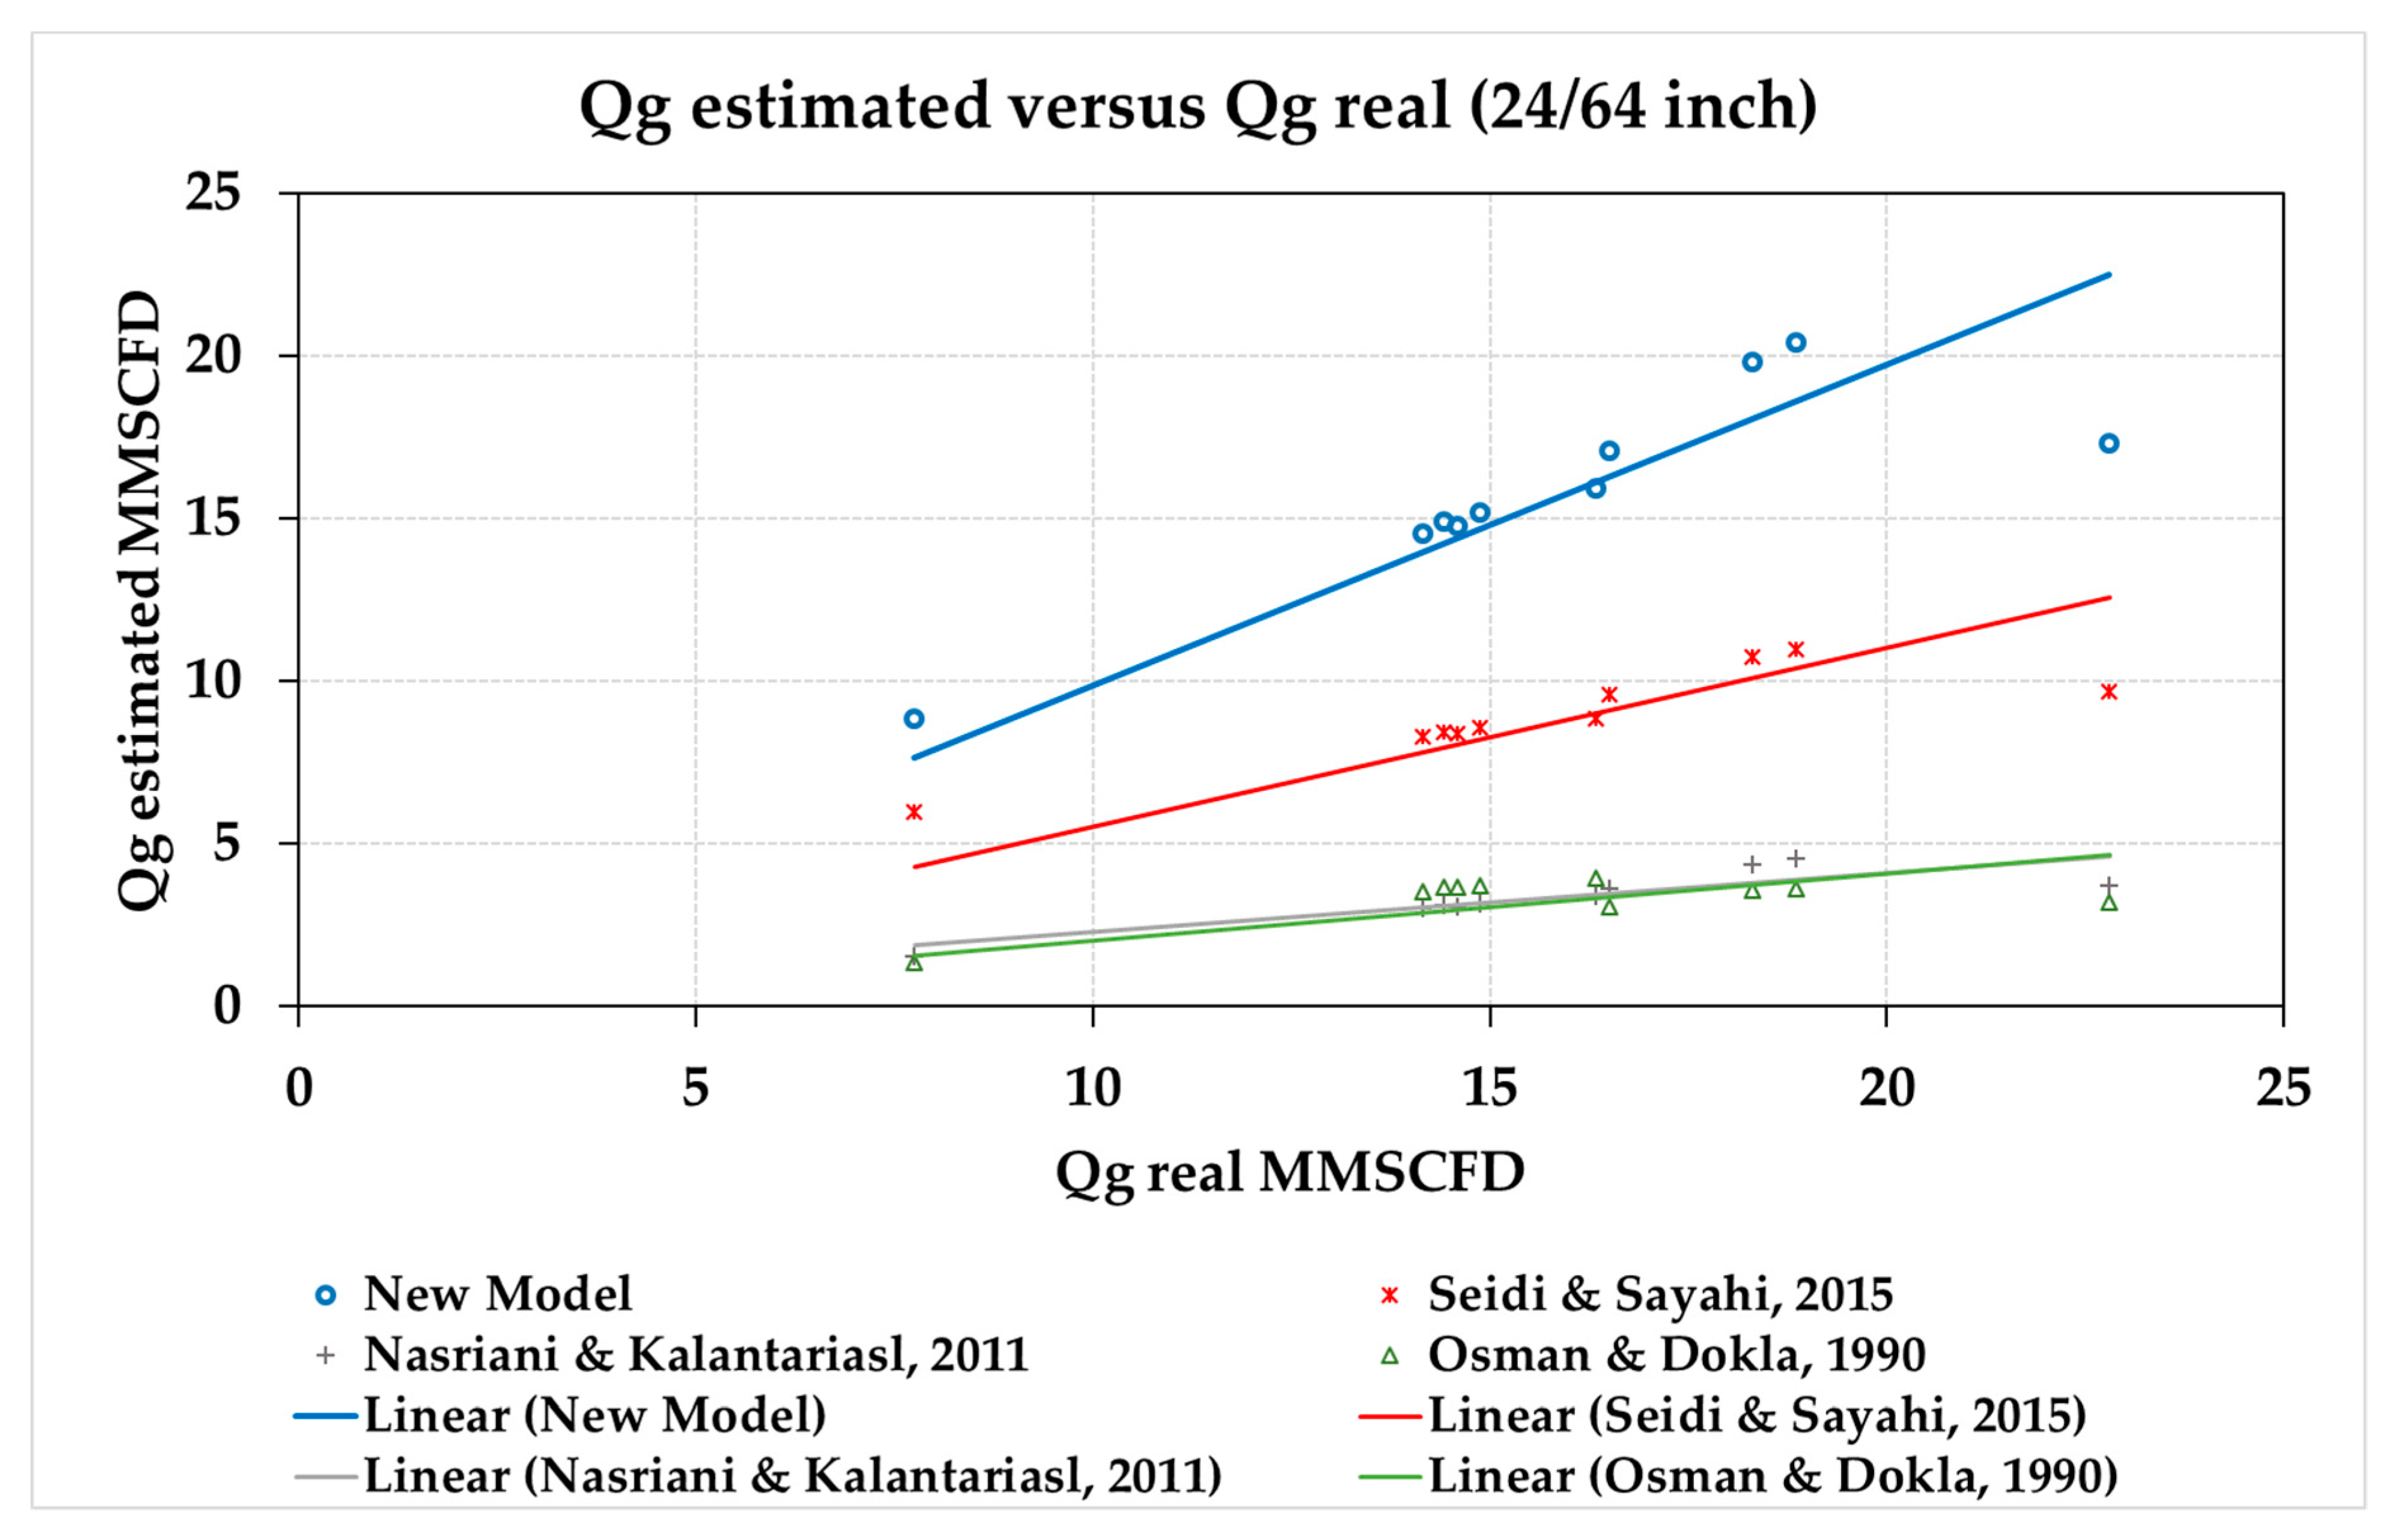
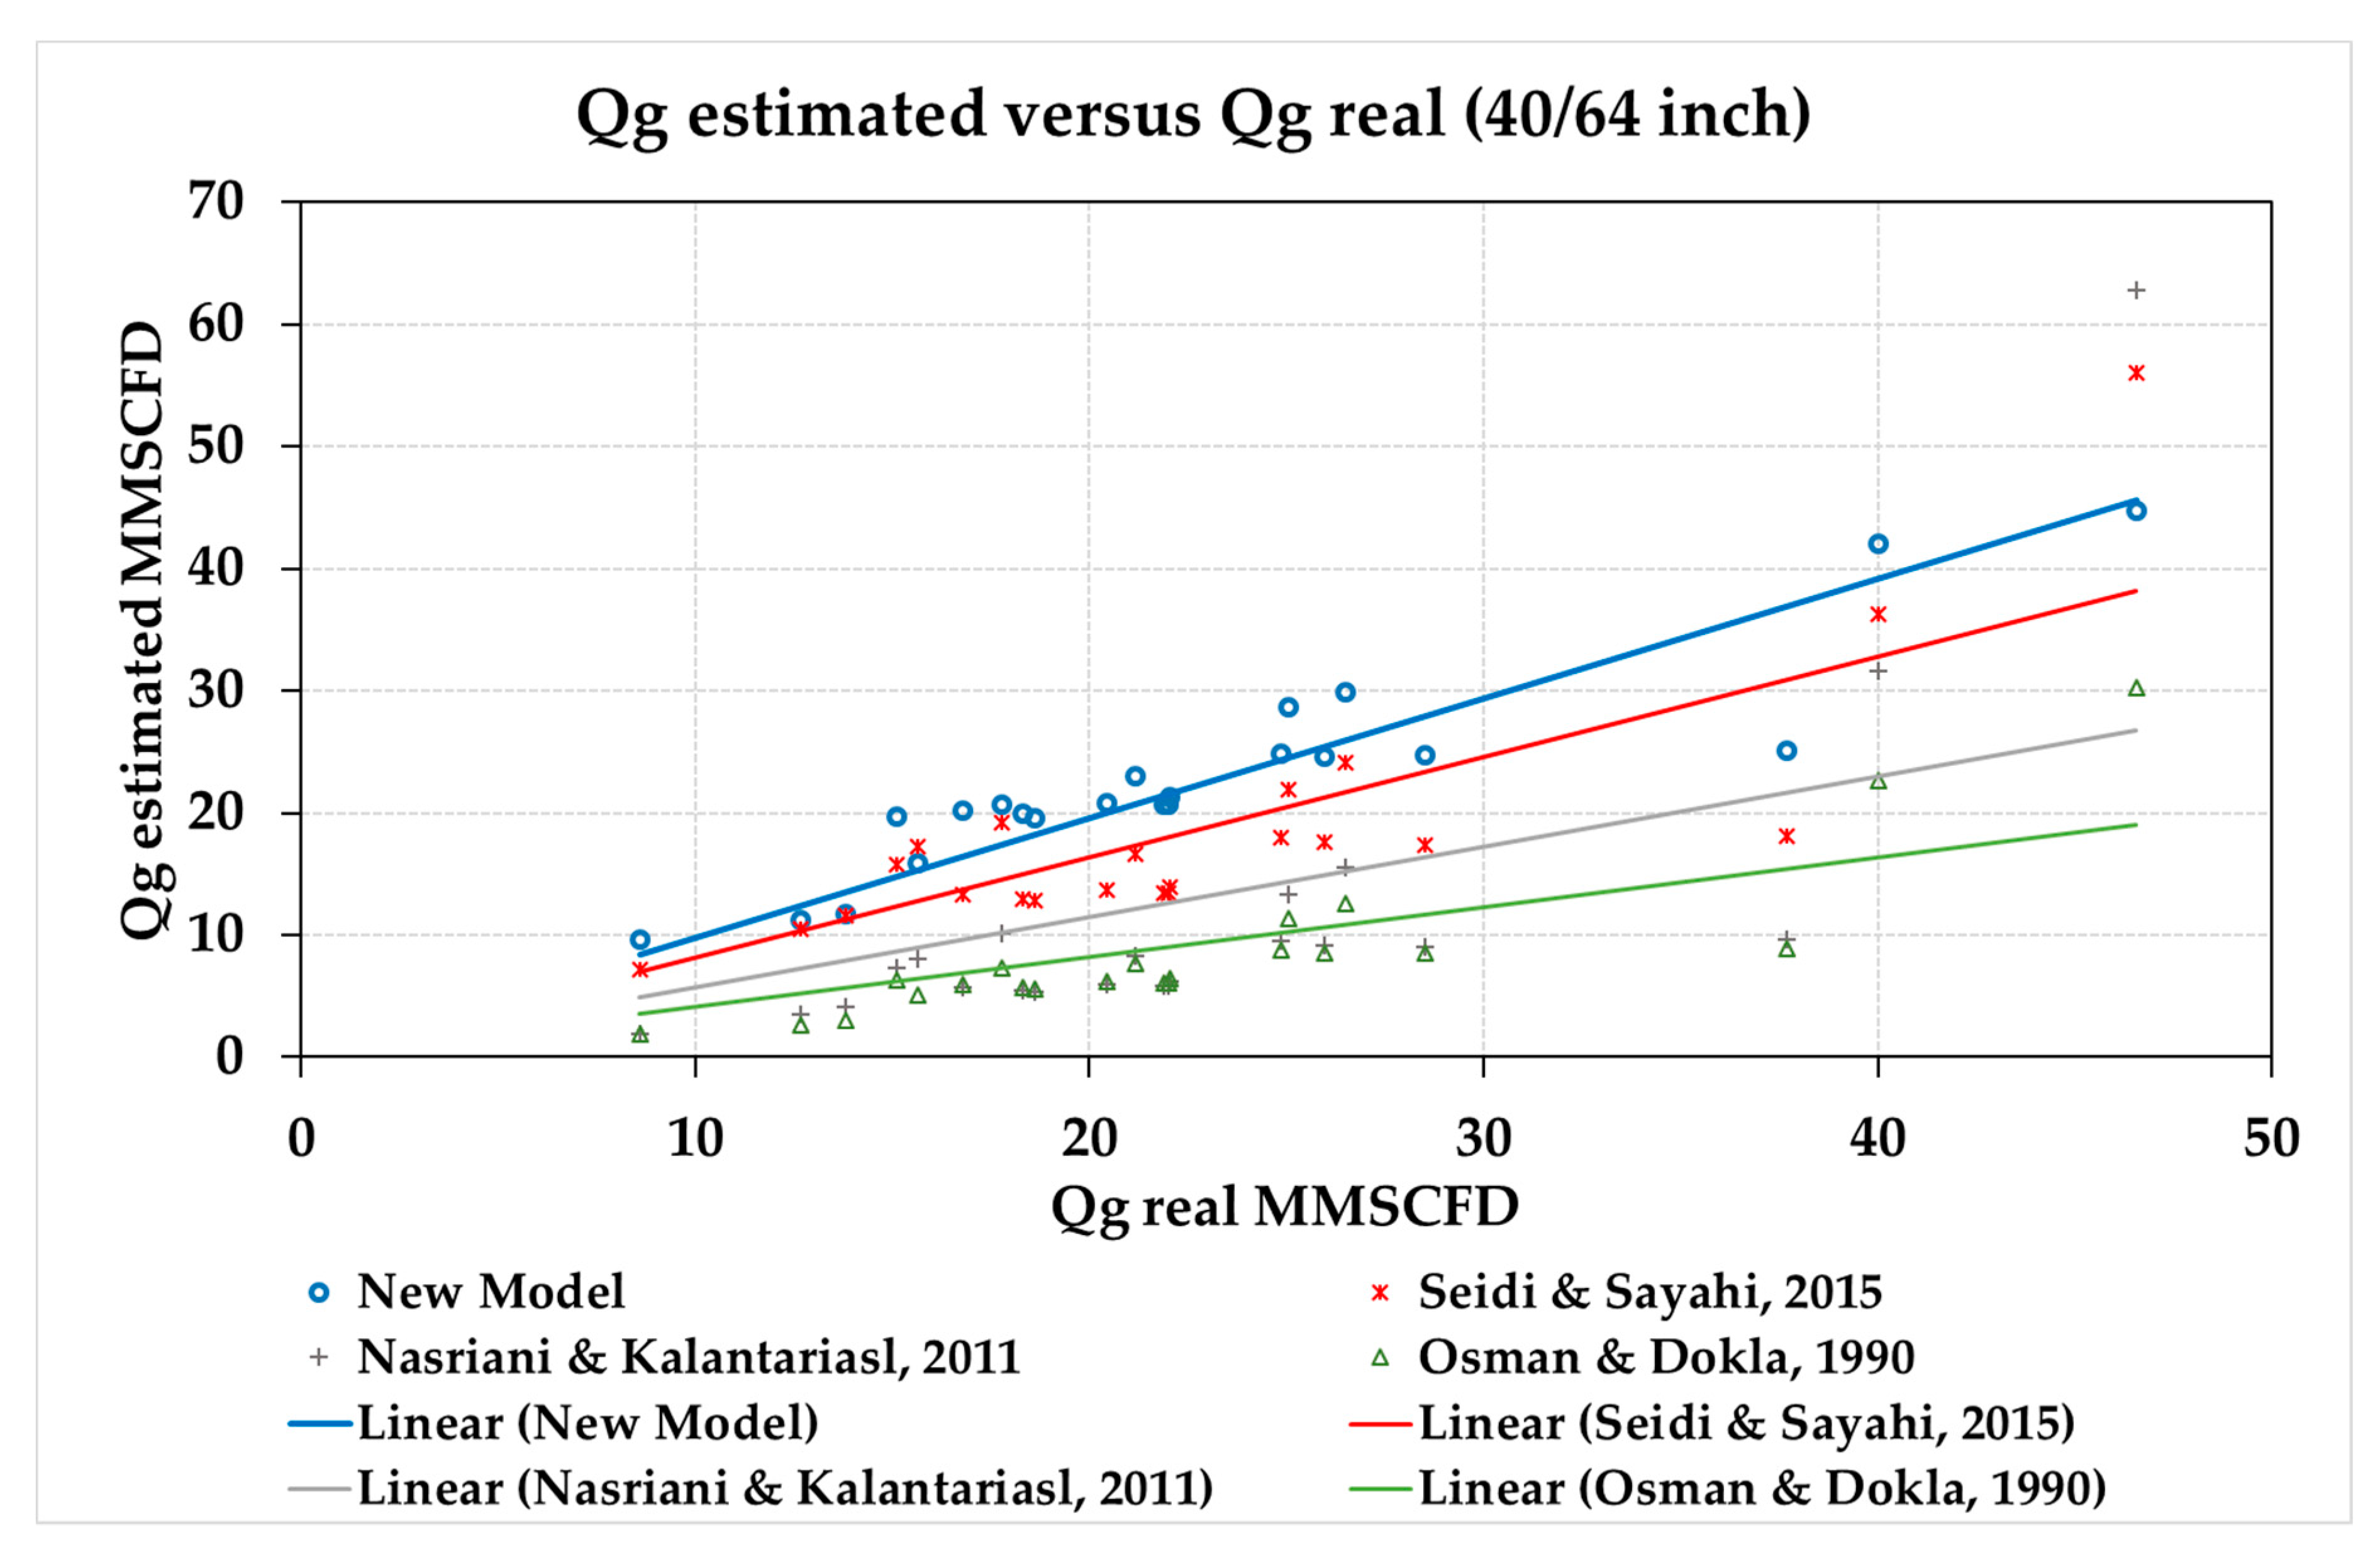
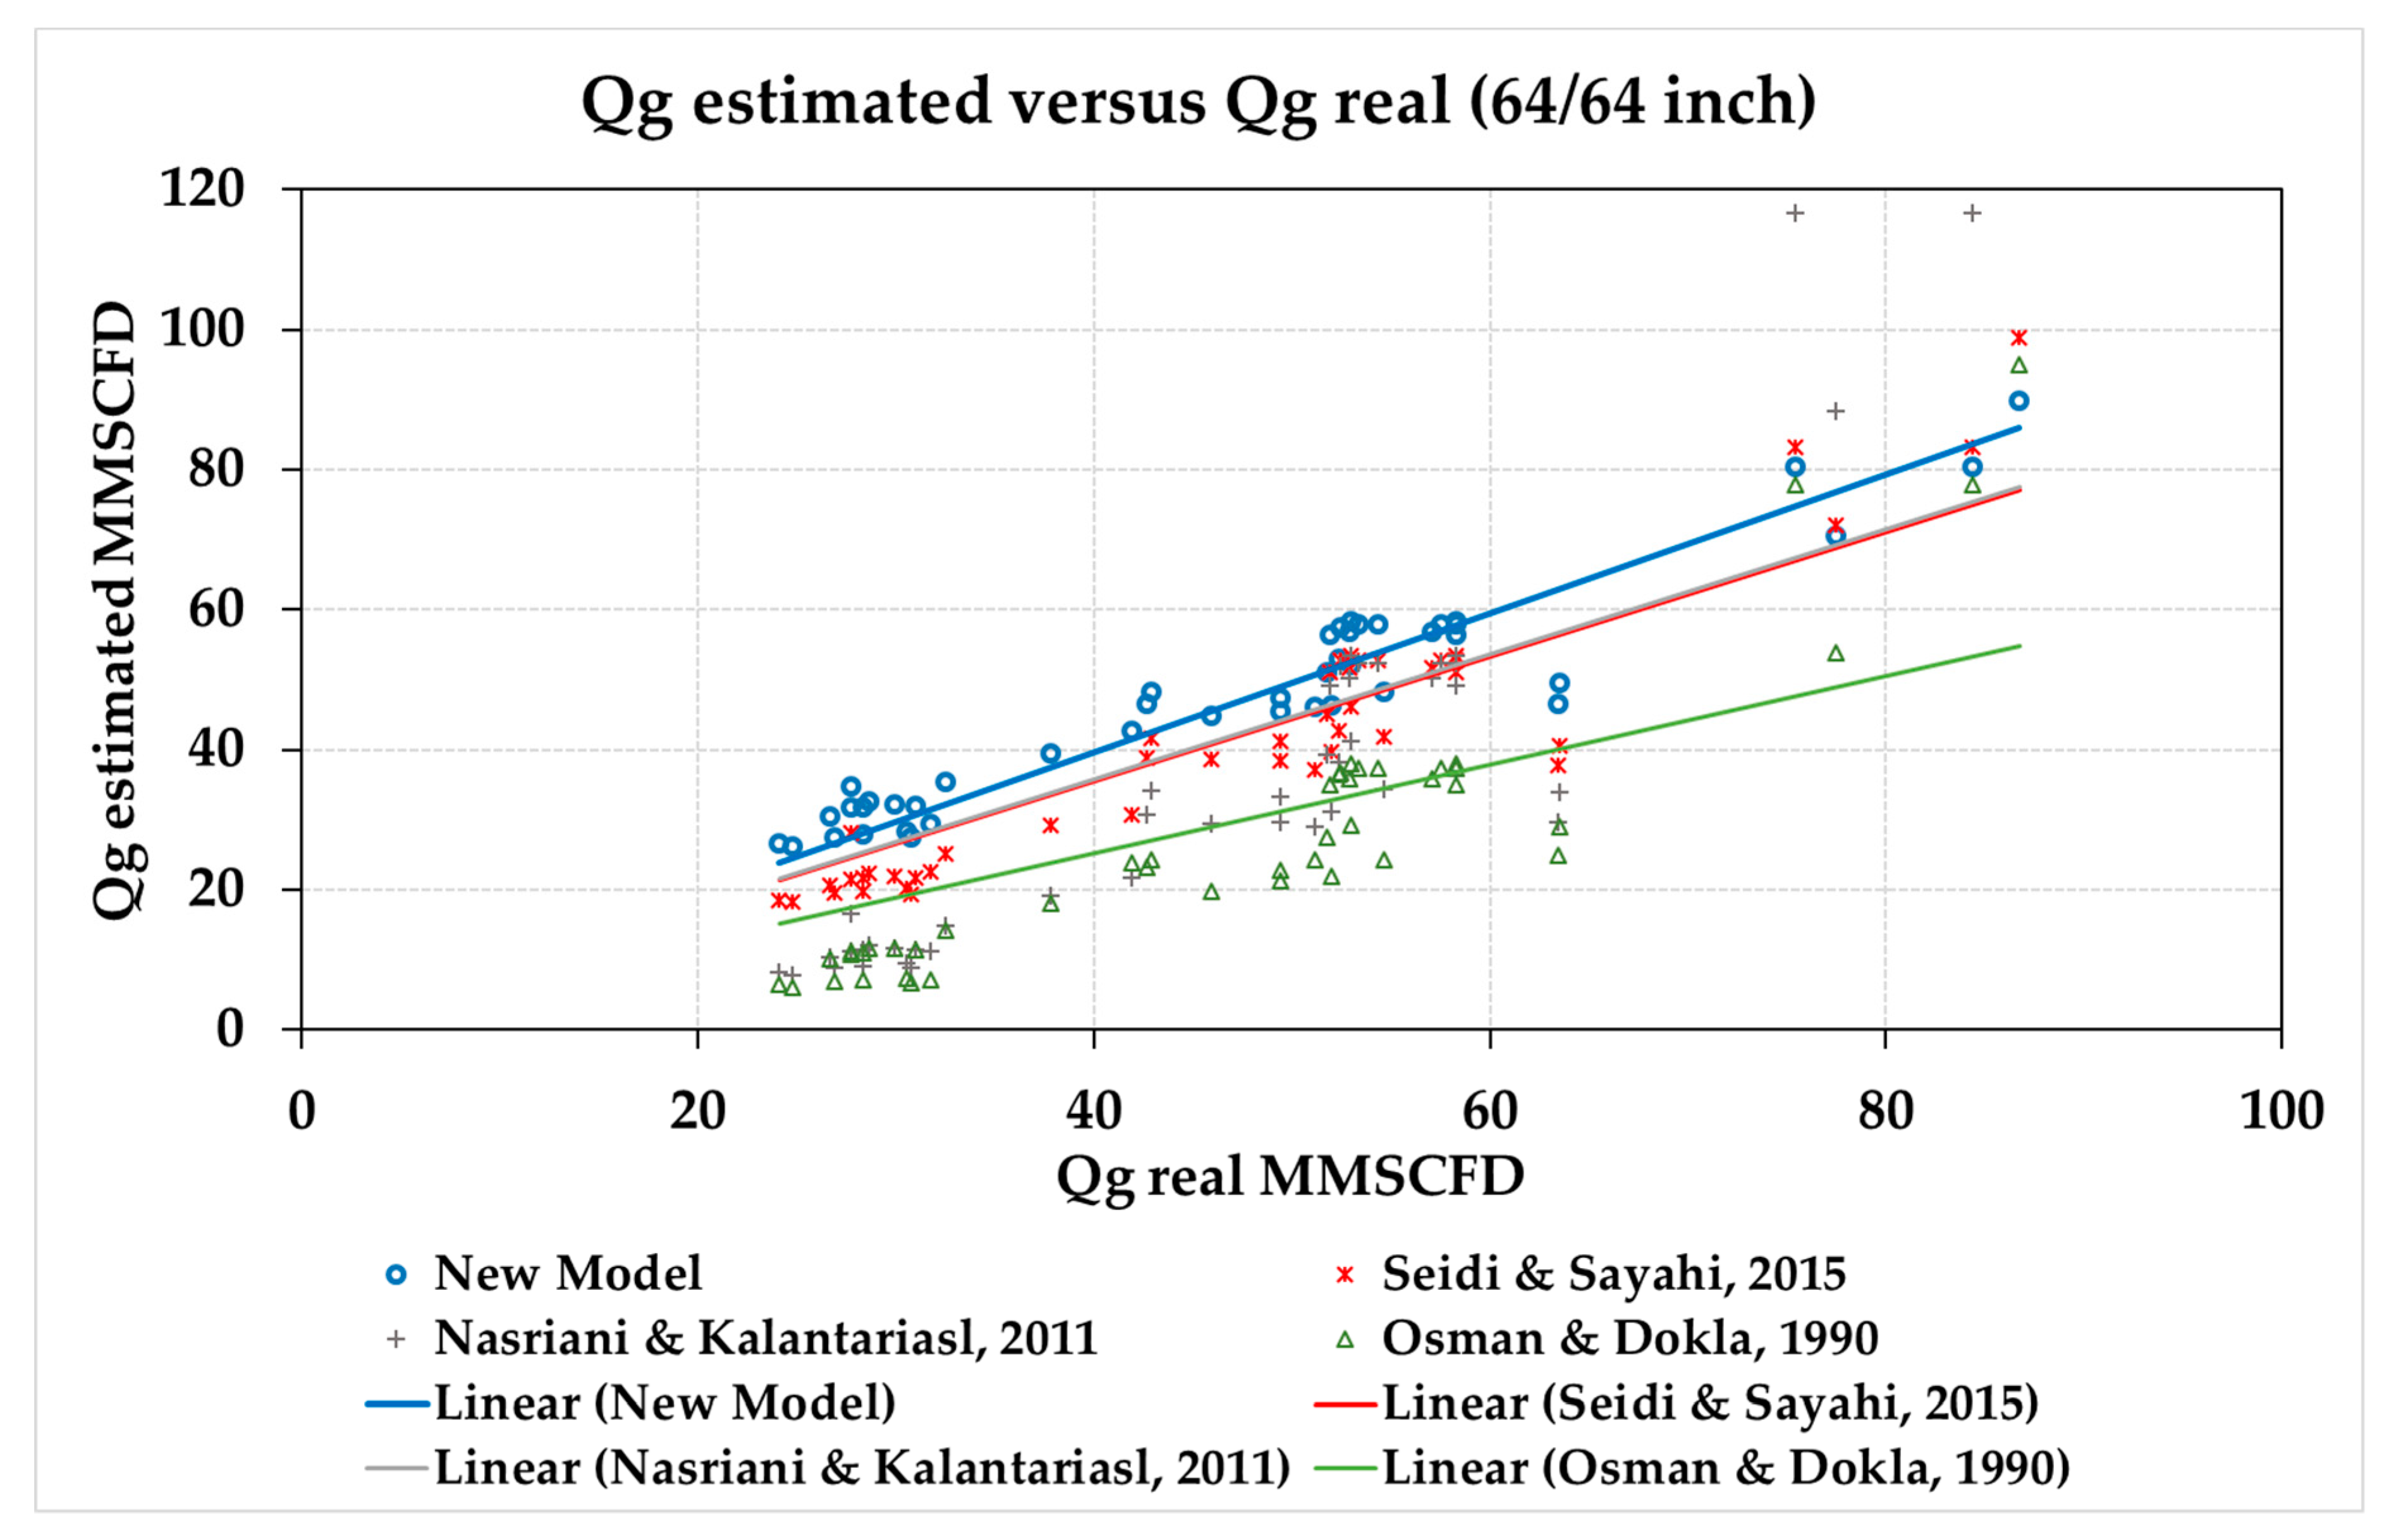
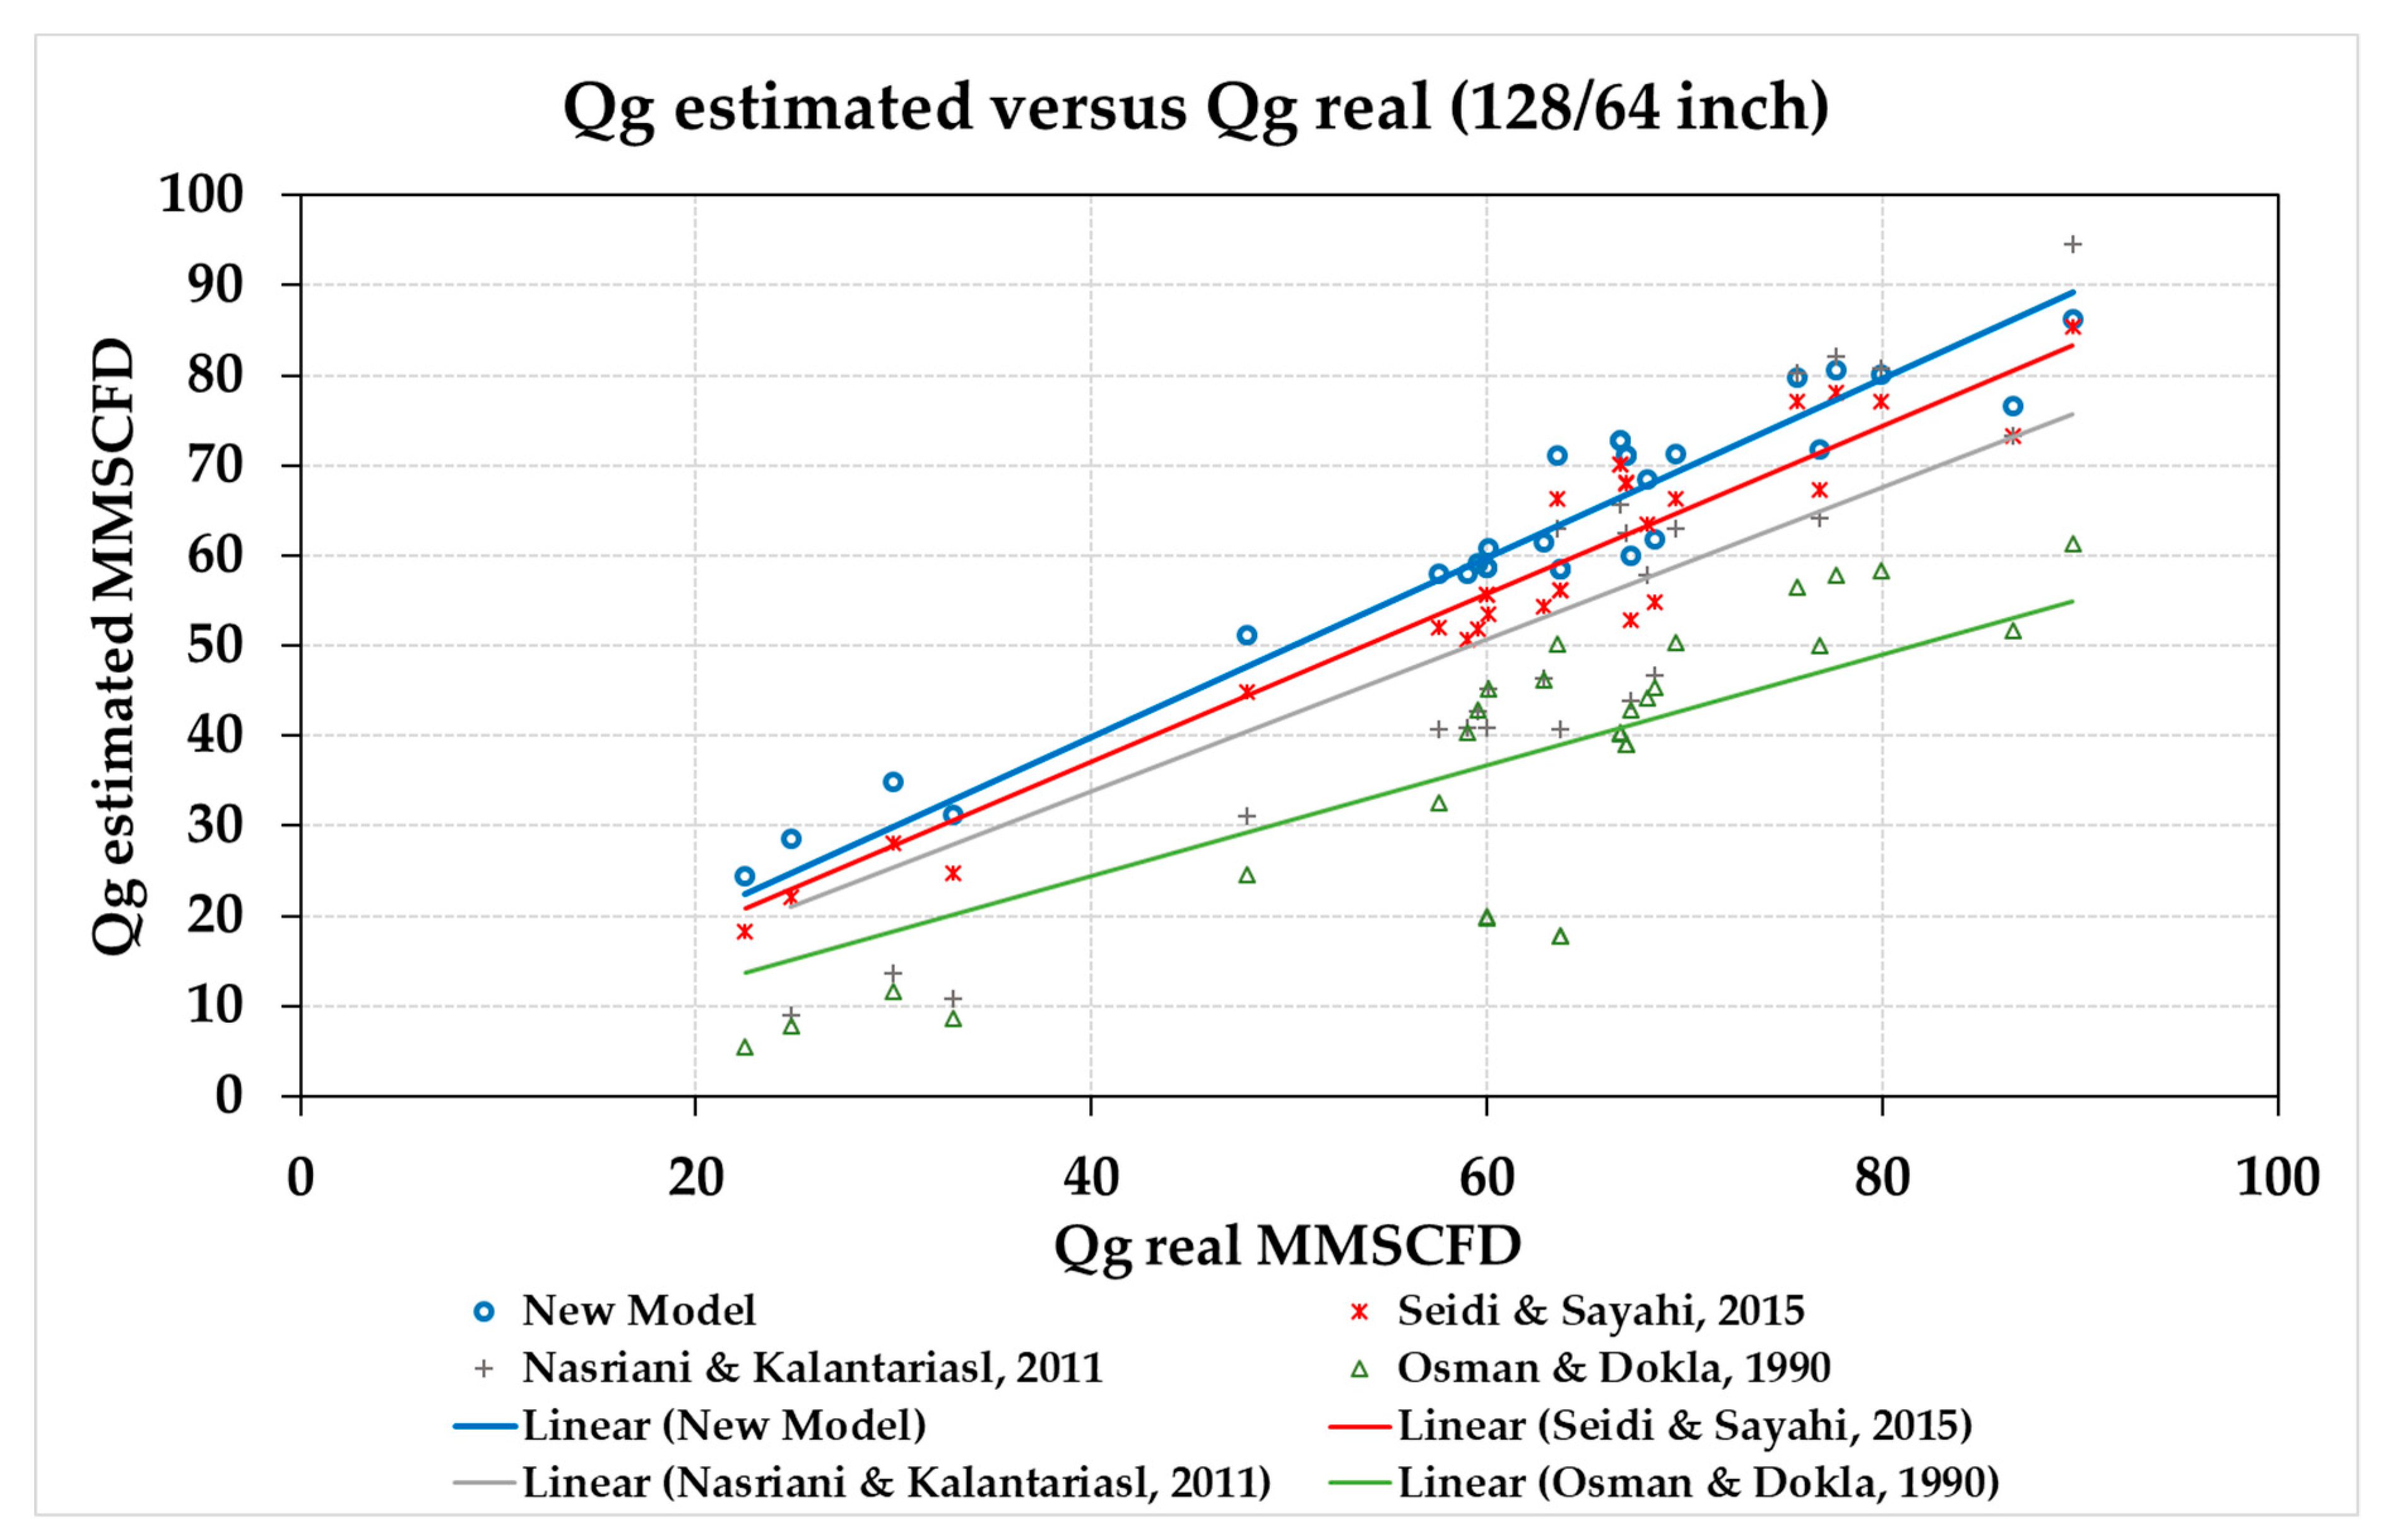
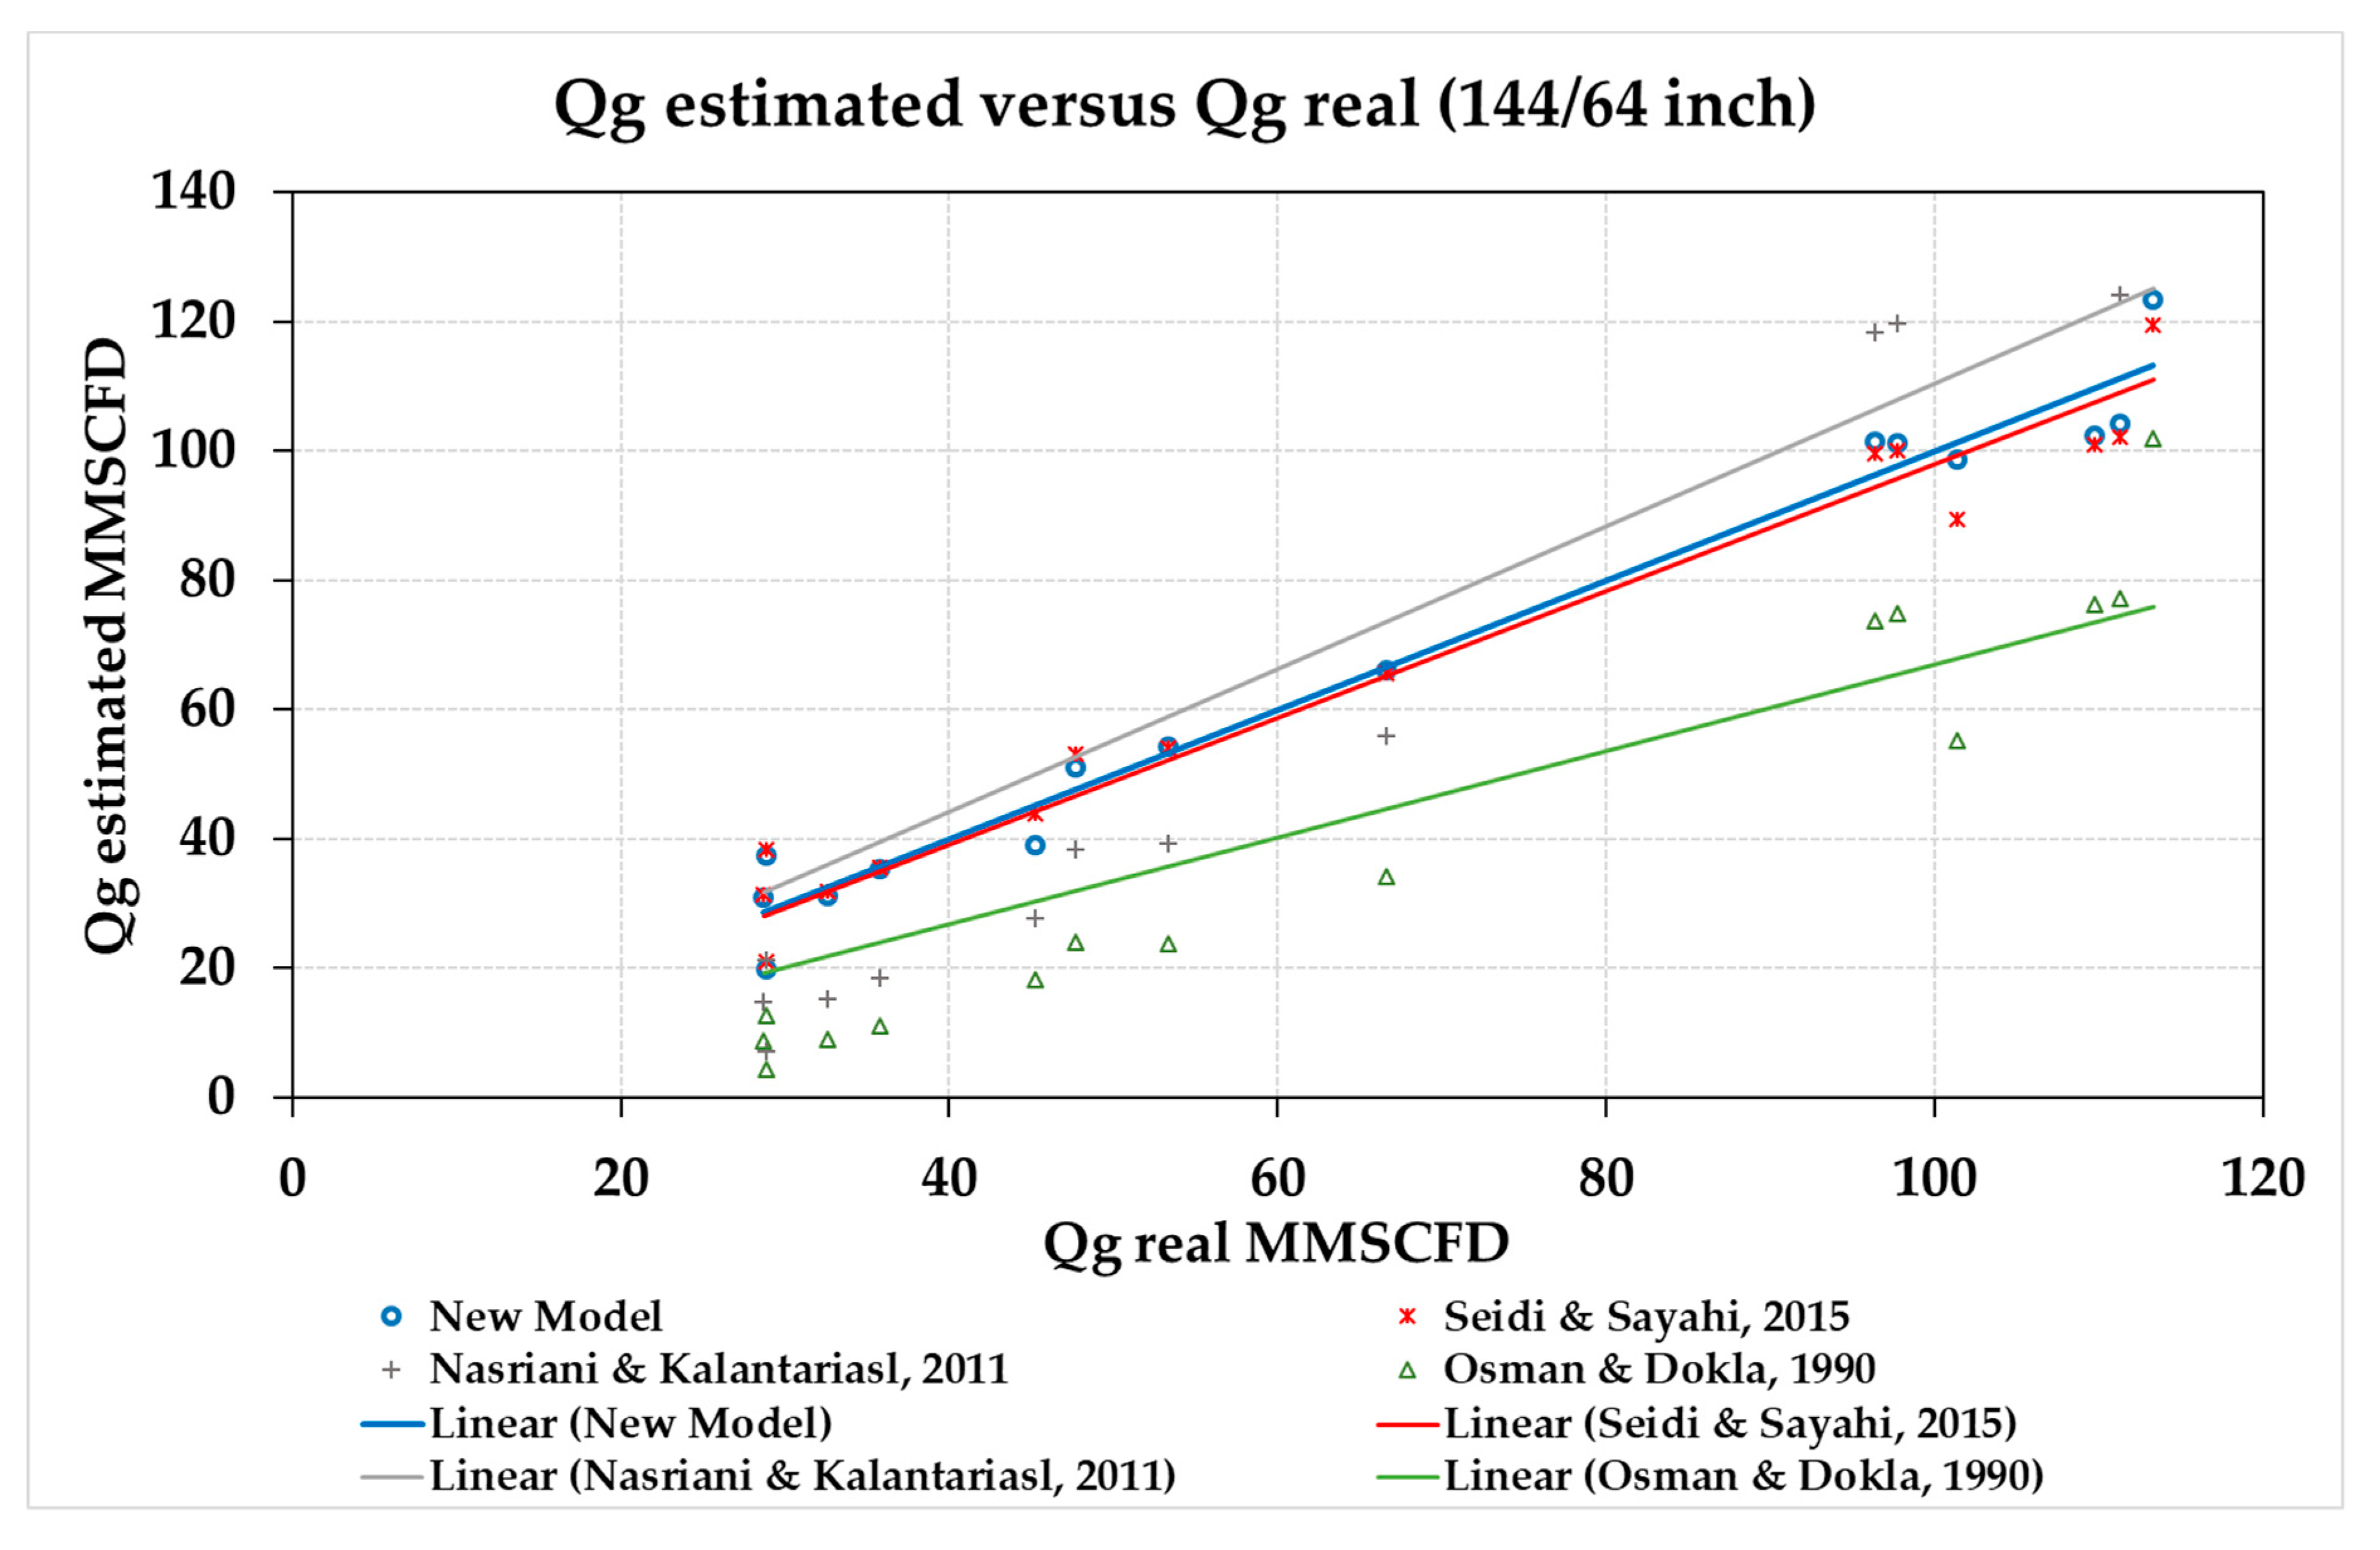
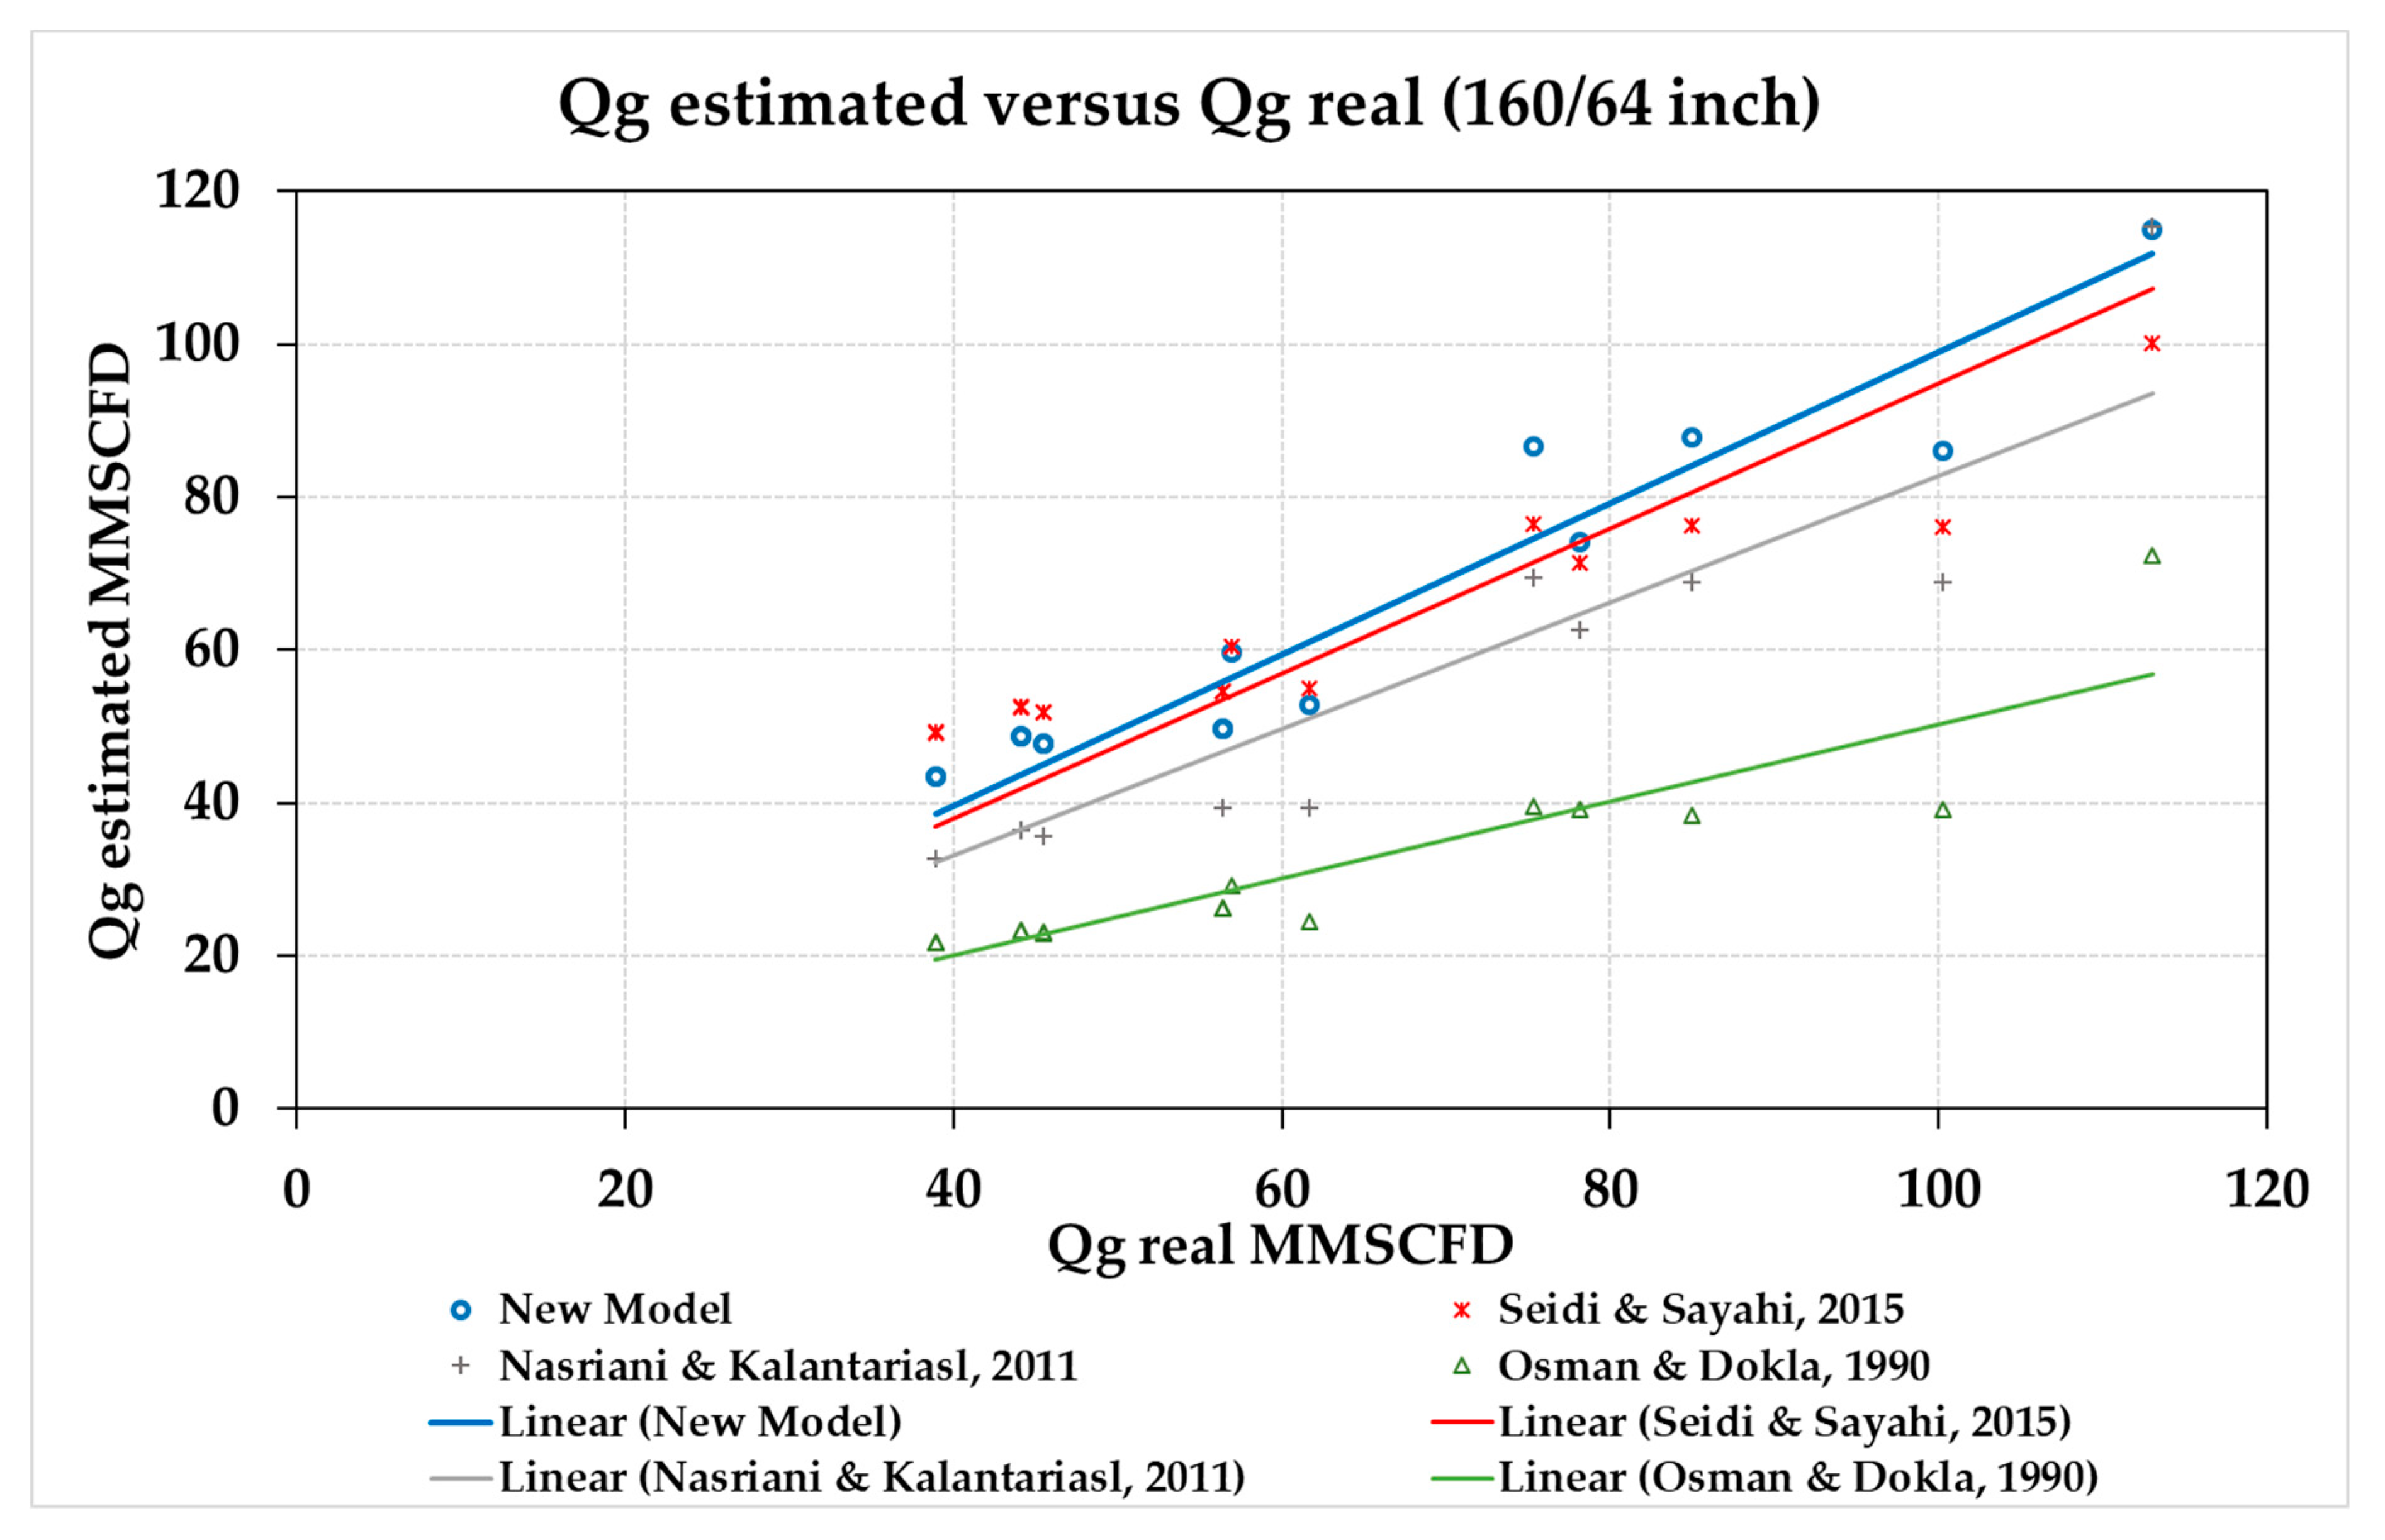
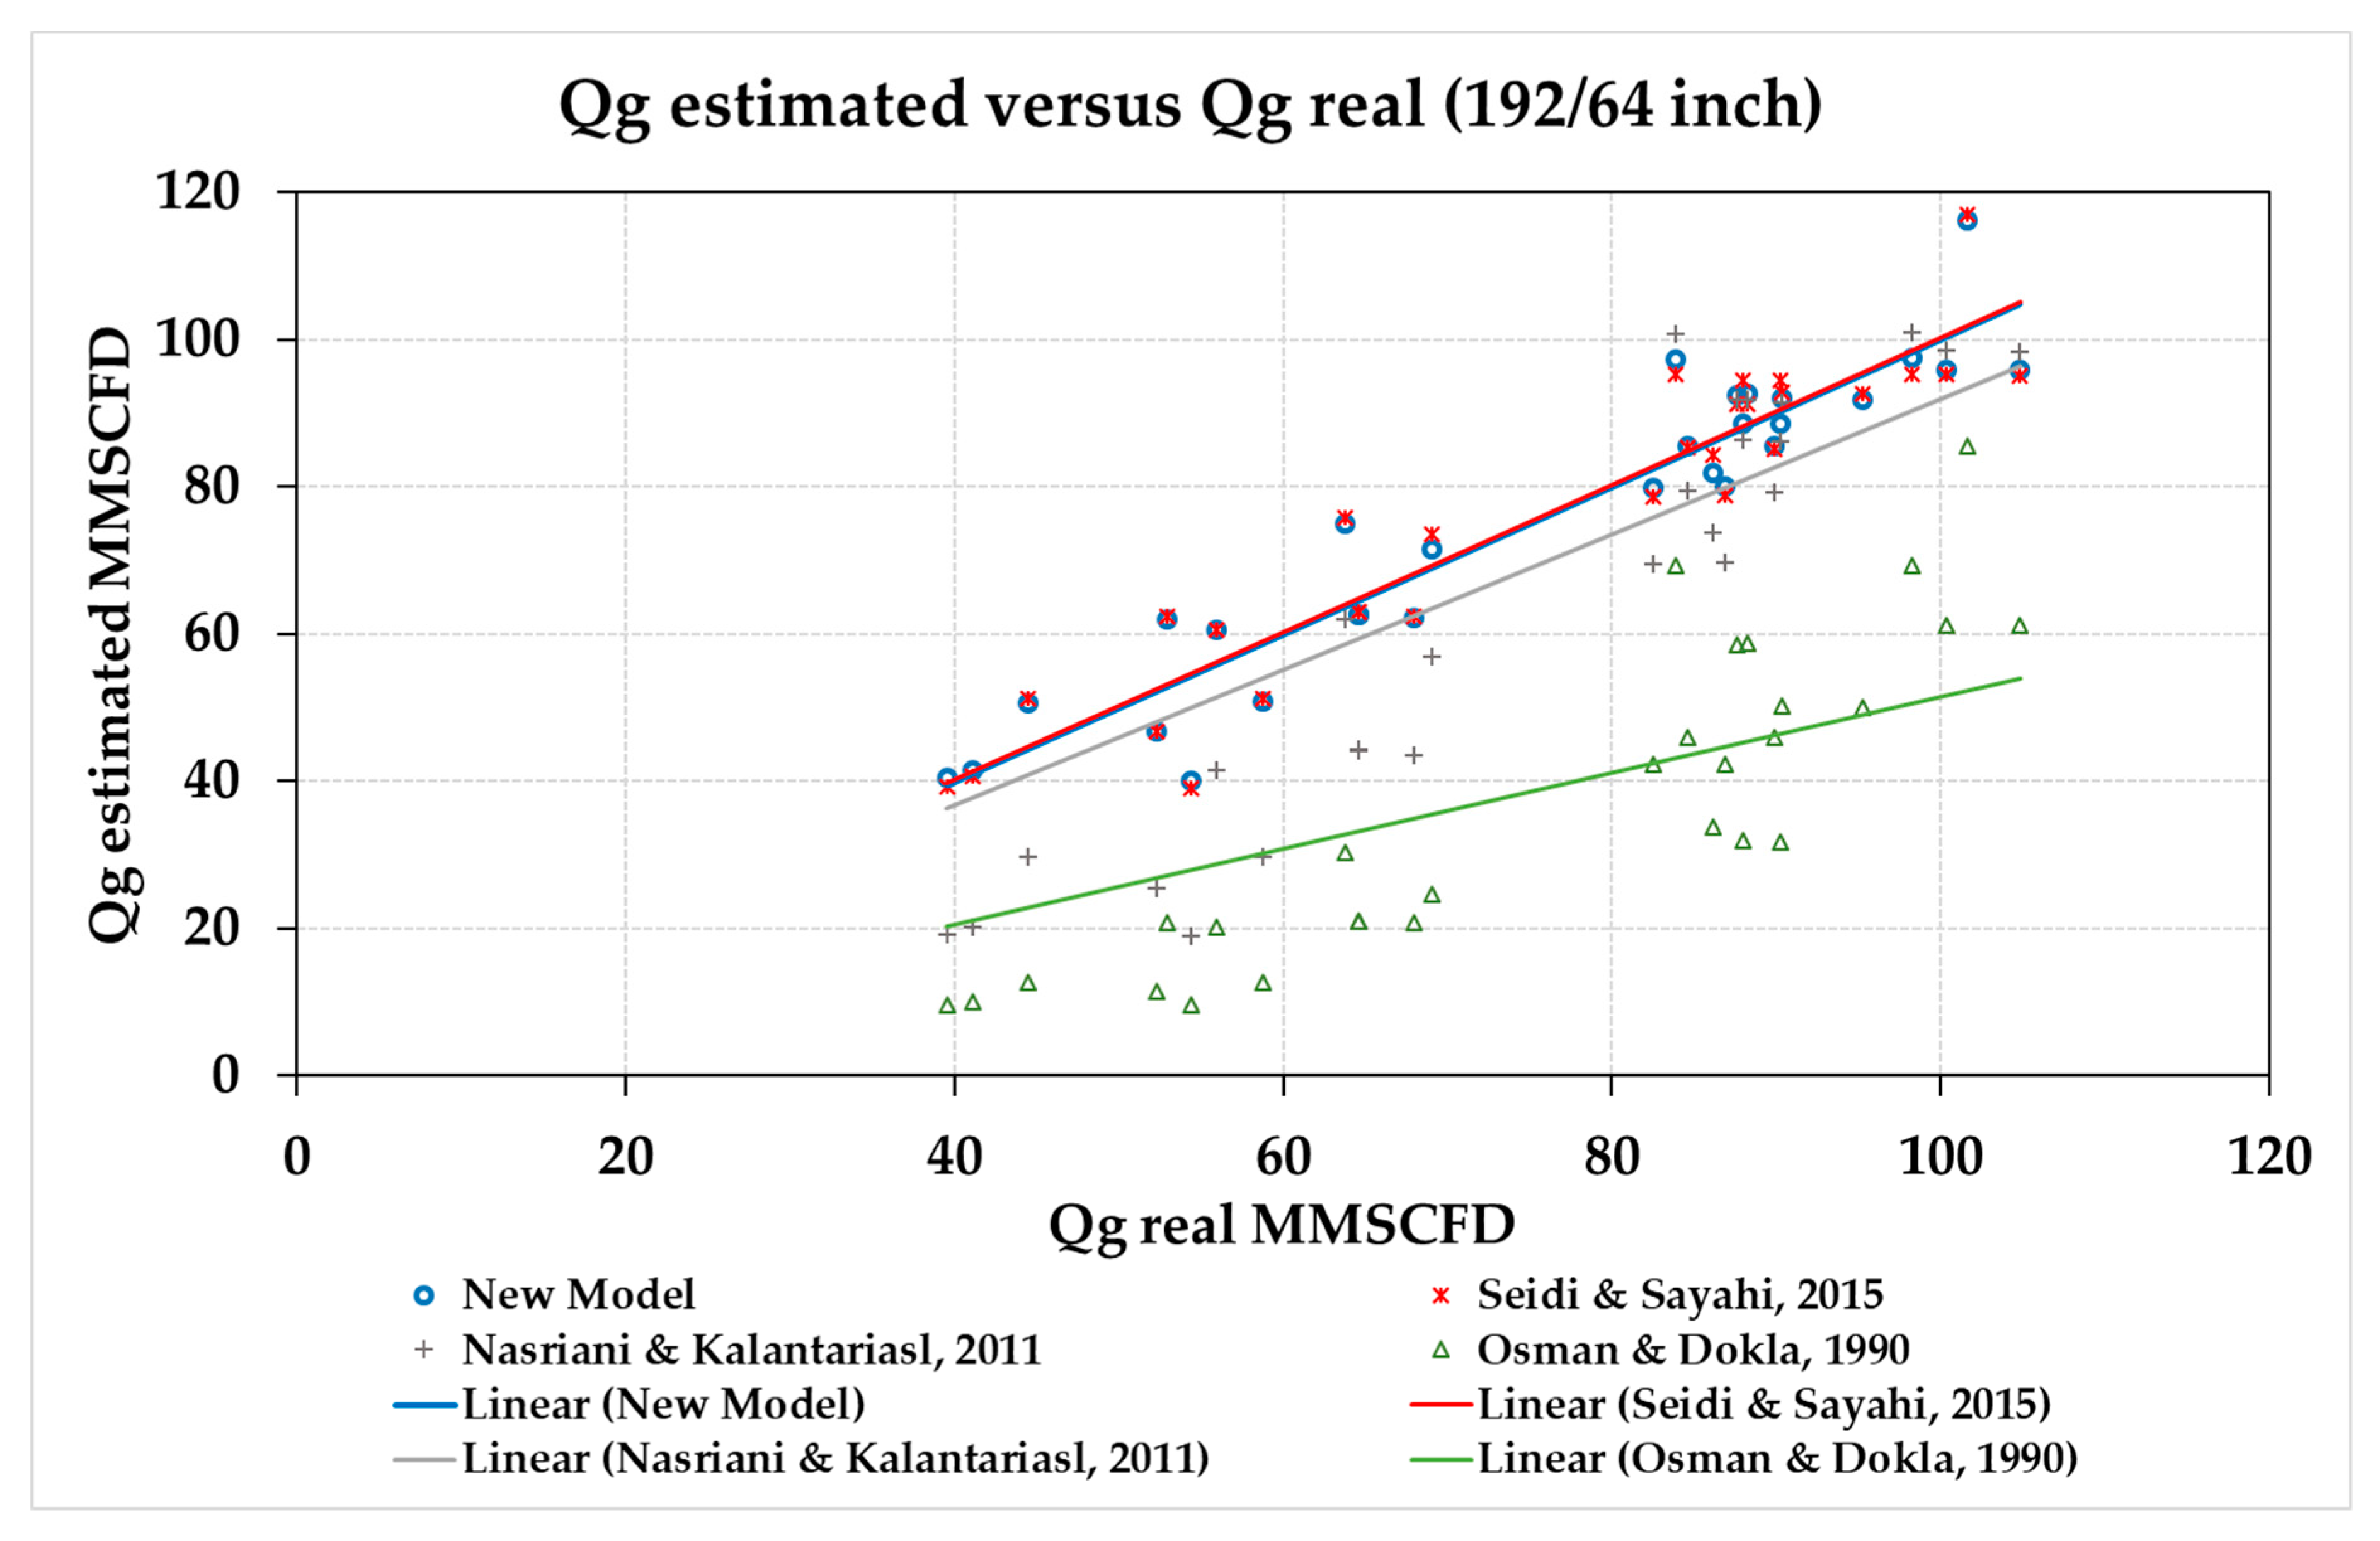
The comparisons of six different measures of accuracy corresponding to different models using the production data set of the choke sizes from 24/64 to 192/64 are shown in Table 6, Table 7, Table 8, Table 9, Table 10, Table 11 and Table 12. The estimated gas flow rate using the tuned Gilbert-type formulas for individual choke sizes (Equation (14)) as well as the estimated gas flow rate using the other three correlations as mentioned above versus real gas flow rate are shown in Figure 5, Figure 6, Figure 7, Figure 8, Figure 9, Figure 10 and Figure 11. It can be noted from these figures that the new model which predicted the gas flow rate through the wellhead choke was in perfect agreement with the real gas flow rate—the calculated value of R2 for the new model was closer to unity compared to that of the other models. Similarly, for all the other error parameters, the newly established correlation had the smallest possible values of errors.
By comparing the seven statistical measures of accuracy for the new models developed for individual choke sizes with those of the other three available models, it can be highlighted that if a nonlinear regression analysis was conducted on different groups with individual choke sizes, it could significantly improve the accuracy of the prediction of choke performance compared to the generally developed formula for all production data points and the three other current models. Resultantly, the capability of the newly developed formula to estimate the wellhead choke performance under the subcritical flow condition could be significantly improved once it is applied to specific choke sizes.

4. A summary of Conclusions and Recommendations

Almost all empirical correlations for gas condensate fields are developed using limited production data points from a few gas fields; therefore, they are generally accurate within the ranges in which they have been established. If such correlations are employed to predict the gas flow rate of other fields or if they are used to extrapolate to other conditions, inaccurate results are gained. The aim of this study was to develop a more comprehensive empirical correlation for the prediction of the gas flow rate under the subcritical condition. Several sets of production data points from previous works and some new production data points from high rate gas condensate wells (293 production data points) were used in a non-linear regression analysis. The developed model was then validated using an additional set of 32 data points.
A summary of the main conclusions and recommendations are as follows:
  • A comprehensive empirical correlation for the prediction of the gas flow rate under the subcritical flow condition was developed using wide-ranging sets of production data points taken from literature and some new data points collected from high rate gas condensate fields.
  • The newly developed model was compared with three existing models using different error analysis parameters, i.e., PD, APD, AAPD, SD, MSE, RMSE and R2; it was shown that the new model was the most accurate correlation in the modelling of the wellhead choke performance under the subcritical flow condition.
  • It is recommended to use the new model within the range of production parameters that have been covered in this study, i.e., an LGR of 0.7–178.8 bbl/MMscf, a choke size ranging from 24/64 to 192/64, and a gas flow rate of 5.4–113.3 MMscfD.
  • In addition to the newly developed correlation, a set of new correlations was developed for the individual choke sizes. The accuracy of the new model was further improved once they were developed using the production data sets with the individual choke sizes.
  • It is recommended to investigate the impact of temperature change across the choke on the prediction of gas flow rate under the subcritical flow condition by introducing the ΔTe term to Equation (2).
    Q g = a ( L G R ) b S c Δ P d Δ T e

Author Contributions

Conceptualization, H.R.N., K.K., S.N.; methodology, H.R.N.; software, H.R.N.; validation, H.R.N., T.G. and K.K.; formal analysis, H.R.N., K.K., J.M., S.N.; investigation, H.R.N., T.G., M.N.; resources, M.N., M.R.R.; data curation, S.N., M.N., M.R.R.; writing—original draft preparation, H.R.N., T.G.; writing—review and editing, H.R.N., K.K., T.G.; visualization, K.K., S.N., J.M.; supervision, H.R.N.; project administration, H.R.N.

Funding

This research received no external funding.

Conflicts of Interest

The authors declare no conflict of interest.

Nomenclature

a The empirical constant, Equation (2)
a′The empirical constant, Equation (14)
b Liquid–gas ratio exponent, Equations (2) and (14)
cThe empirical exponent of choke size, Equation (2)
d The empirical exponent of pressure drop through the choke, Equations (2) and (14)
LGRLiquid gas ratio, Equations (2) and (14)
Pwh or PuUpstream (wellhead) pressure, Equation (1)
PdDownstream pressure
ΔP The pressure drop across the choke, Equations (2) and (14)
QgGas flow rate, Equations (2) and (14)
Qg, real.Real (Measured) Gas flow rate
Qg, est.Estimated (predicted) Gas flow rate
S.Choke size, 1/64 in

References

  1. Grinestaff, G.H. Waterflood Pattern Allocations: Quantifying the Injector to Producer Relationship with Streamline Simulation. In Proceedings of the SPE Western Regional Meeting, Anchorage, Alaska, 26–27 May 1999; Society of Petroleum Engineers: Bethel, CT, USA, 1999. [Google Scholar]
  2. Osman, M.E.; Dokla, M.E. Gas condensate flow through chokes. In Proceedings of the European Petroleum Conference, The Hague, The Netherlands, 21–24 October 1990. [Google Scholar]
  3. Al-Attar, H. Performance of wellhead chokes during sub-critical flow of gas condensates. J. Pet. Sci. Eng. 2008, 60, 205–212. [Google Scholar] [CrossRef]
  4. Ghareeb, M.; Elgaghah, S. A New Correlation for Calculating Wellhead Production Considering Influences of Temperature, GOR, and Water-Cut for Artificially Lifted Wells. In Proceedings of the International Petroleum Technology Conference, Dubai, UAE, 4–6 December 2007. [Google Scholar]
  5. Vo, H.X.; Horne, R.N. Experimental Study of Composition Variation During Flow of Gas-Condensate. In Proceedings of the SPE Annual Technical Conference and Exhibition, Houston, TX, USA, 28–30 September 2015. [Google Scholar]
  6. Elhaj, M.A.; Anifowose, F.; Abdulraheem, A. Single Gas Flow Prediction through Chokes using Artificial Intelligence Techniques. In Proceedings of the SPE Saudi Arabia Section Annual Technical Symposium and Exhibition, Al-Khobar, Saudi Arabia, 21–23 April 2015; Society of Petroleum Engineers: Bethel, CT, USA, 2015. [Google Scholar]
  7. Fasesan, S.O.; Olukini, O.O.; Adewumi, O.O. Characteristics of Gas Condensate. Pet. Sci. Technol. 2003, 21, 81–90. [Google Scholar] [CrossRef]
  8. Gholgheysari Gorjaei, R.; Songolzadeh, R.; Torkaman, M.; Safari, M.; Zargar, G. A novel PSO-LSSVM model for predicting liquid rate of two phase flow through wellhead chokes. J. Nat. Gas Sci. Eng. 2015, 24, 228–237. [Google Scholar] [CrossRef]
  9. Hosein, R.; Dawe, R. Characterization of Trinidad Gas Condensates. Pet. Sci. Technol. 2011, 29, 817–823. [Google Scholar] [CrossRef]
  10. Lak, A.; Azin, R.; Osfouri, S.; Gerami, S.; Chahshoori, R. Choke modeling and flow splitting in a gas-condensate offshore platform. J. Nat. Gas Sci. Eng. 2014, 21, 1163–1170. [Google Scholar] [CrossRef]
  11. Azin, R.; Chahshoori, R.; Osfouri, S.; Lak, A.; Sureshjani, M.H.H.; Gerami, S. Integrated analysis of choke performance and flow behaviour in high-rate, deviated gas-condensate wells. Gas Process. J. 2014, 1, 8–18. [Google Scholar]
  12. Latif, F.; Griston-Castrup, S.; Al Kalbani, A. Field Evaluation of MOV Adjustable Steam Chokes. In Proceedings of the SPE Western Regional Meeting, Bakersfield, CA, USA, 1 January 2012; Society of Petroleum Engineers: Bethel, CT, USA, 2012; p. 10. [Google Scholar]
  13. Ling, K. Modifications to equations of Gas flow through choke. In Proceedings of the SPE Latin America and Caribbean Petroleum Engineering Conference, Mexico City, Mexico, 16–18 April 2012. [Google Scholar]
  14. Morris, S.D. Choke pressure in pipeline restrictions. J. Hazard. Mater. 1996, 50, 65–69. [Google Scholar] [CrossRef]
  15. Bairamzadeh, S.; Ghanaatpisheh, E. A new choke correlation to predict liquid flow rate. Sci. Int. 2015, 27, 271–274. [Google Scholar]
  16. Alimonti, C.; Falcone, G.; Bello, O. Two-phase flow characteristics in multiple orifice valves. Exp. Therm. Fluid Sci. 2010, 34, 1324–1333. [Google Scholar] [CrossRef]
  17. AlAjmi, M.D.; Alarifi, S.A.; Mahsoon, A.H. Improving Multiphase Choke Performance Prediction and Well Production Test Validation Using Artificial Intelligence: A New Milestone. In Proceedings of the SPE Digital Energy Conference and Exhibition, The Woodlands, TX, USA, 3–5 March; Society of Petroleum Engineers: Bethel, CT, USA, 2015; p. 8. [Google Scholar]
  18. Abdul-Majeed, G.H. Correlations Developed to Predict Two Phase Flow Through Wellhead Chokes. In Proceedings of the Annual Technical Meeting, Calgary, AB, Canada, 20–23 April 1988; Petroleum Society of Canada: Calgary, AB, Canada, 1988; p. 15. [Google Scholar]
  19. Tangren, R.F.; Dodge, C.H.; Seifert, H.S. Compressibility Effects in Two-Phase Flow. J. Appl. Phys. 1949, 20, 637–645. [Google Scholar] [CrossRef]
  20. Nasriani, H.R.; Kalantari Asl, A. Two-phase flow choke performance in high rate gas condensate wells. In Proceedings of the Society of Petroleum Engineers—SPE Asia Pacific Oil and Gas Conference and Exhibition, Jakarta, Indonesia, 20–22 September 2011. [Google Scholar]
  21. Nasriani, H.R.; Kalantari Asl, A. Choke Performance in High-rate Gas Condensate Wells Under Subcritical Flow Condition. Energy Sourcespart A Recover. Util. Environ. Eff. 2014, 37, 192–199. [Google Scholar] [CrossRef]
  22. Al-Attar, H.H. New correlations for critical and subcritical two-phase flow through surface chokes in high-rate oil wells. In Proceedings of the Society of Petroleum Engineers, Latin American and Caribbean Petroleum Engineering Conference, Cartagena de Indias, Colombia, 31 May–3 June 2009. [Google Scholar]
  23. Nasriani, H.R.; MoradiDowlatAbad, M.; Kalantari Asl, A. A new correlation for prediction of critical two-phase flow through wellhead chokes. In Proceedings of the 78th EAGE Conference and Exhibition 2016: Efficient Use of Technology—Unlocking Potential, Vienna, Austria, 30 May–2 June 2016. [Google Scholar]
  24. Gilbert, W.E. Flowing and Gas-Lift Well Performance; American Petroleum Institute: Washington, DC, USA, 1954. [Google Scholar]
  25. Pope, D.; Britt, L.K.; Constien, V.; Anderson, A.; Leung, L. Field Study of Guar Removal from Hydraulic Fractures. In Proceedings of the SPE Formation Damage Control Symposium, Lafayette, LA, USA, 14–15 February 1996. [Google Scholar]
  26. Ros, N.C.J. An analysis of critical simultaneous gas/liquid flow through a restriction and its application to flowmetering. Appl. Sci. Res. 1960, 9, 374–388. [Google Scholar] [CrossRef]
  27. Guo, B.; Al-Bemani, A.S.; Ghalambor, A. Applicability of Sachdeva’s choke flow model in Southwest Louisiana gas condensate wells. In Proceedings of the SPE Gas Technology Symposium, Calgary, AB, Canada, 30 April–2 May 2002. [Google Scholar]
  28. Sachdeva, R.; Schmidt, Z.; Brill, J.P.; Blais, R.M. Two-phase flow through chokes. In Proceedings of the SPE Annual Technical Conference and Exhibition. Society of Petroleum Engineers, New Orleans, LA, USA, 5–8 October 1986. [Google Scholar]
  29. Safar Beiranvand, M.; Babaei Khorzoughi, M. Introducing a New Correlation for Multiphase Flow Through Surface Chokes with Newly Incorporated Parameters. SPE Prod. Oper. 2012, 27, 422–428. [Google Scholar] [CrossRef]
  30. Surbey, D.W.; Kelkar, B.G.; Brill, J.P. Study of Multiphase Critical Flow Through Wellhead Chokes. SPE Prod. Eng. 1989, 4, 142–146. [Google Scholar] [CrossRef]
  31. Seidi, S.; Sayahi, T. A new correlation for prediction of sub-critical two-phase flow pressure drop through large-sized wellhead chokes. J. Nat. Gas Sci. Eng. 2015, 26, 264–278. [Google Scholar] [CrossRef]
  32. Bagherian, B.; Ghalambor, A.; Sarmadivaleh, M.; Rasouli, V.; Nabipour, A.; Eshkaftaki, M.M. Optimization of Multiple-Fractured Horizontal Tight Gas Well; Society of Petroleum Engineers: Bethel, CT, USA, 2010. [Google Scholar]
  33. Beggs, D.H.; Brill, J.P. A study of two-phase flow in inclined pipes. J. Pet. Technol. 1973, 25, 607–617. [Google Scholar] [CrossRef]
  34. Ashford, F.E.; Pierce, P.E. Determining Multiphase Pressure Drops and Flow Capacities in Down-Hole Safety Valves. J. Pet. Technol. 1975, 27, 1145–1152. [Google Scholar] [CrossRef]
  35. Pilehvari, A.A. Experimental Study of Critical Two-Phase Flow through Wellhead Chokes; University of Tulsa: Tulsa, OK, USA, 1981. [Google Scholar]
  36. Perkins, T.K.; Kern, L.R. Widths of Hydraulic Fractures. J. Pet. Technol. 1961, 13, 937–949. [Google Scholar] [CrossRef]
  37. Lannom, D.A.; Hatzignatiou, D.G. Multiphase-flow choke correlation limits analyzed. Oil Gas J. 1996, 94, 37–41. [Google Scholar]
  38. Baxendell, P.B. Producing Wells on Casing Flow-An Analysis of Flowing Pressure Gradients. Soc. Pet. Eng. 1958, 213, 202–206. [Google Scholar]
  39. Nejatian, I.; Kanani, M.; Arabloo, M.; Bahadori, A.; Zendehboudi, S. Prediction of natural gas flow through chokes using support vector machine algorithm. J. Nat. Gas Sci. Eng. 2014, 18, 155–163. [Google Scholar] [CrossRef]
  40. Perkins, T.K. Critical and Subcritical Flow of Multiphase Mixtures Through Chokes. SPE Drill. Complet. 1993, 8, 271–276. [Google Scholar] [CrossRef]
  41. Fortunati, F. Two-phase flow through wellhead chokes. In Proceedings of the SPE European Spring Meeting, Amsterdam, The Netherlands, 16–18 May 1972. [Google Scholar]
  42. Poettmann, F.H.; Beck, R.L. New charts developed to predict gas-liquid flow through chokes. World Oil 1963, 184, 95–100. [Google Scholar]
  43. Ajienka, J.A.; Enaibe, O.E.; Owolabi, O.O. Multiphase flow metering: An evaluation of discharge coefficients. J. Can. Pet. Technol. 1994, 33. [Google Scholar] [CrossRef]
  44. Mesallati Biznati, A.; Mansouri, M. Multiphase-Flow Choke Correlations for Offshore Bouri Oil Field. In Proceedings of the International Gas Union 21st World Gas Conference, Nice, France, 6–9 June 2000. [Google Scholar]
  45. Safar Beiranvand, M.; Mohammadmoradi, P.; Aminshahidy, B.; Fazelabdolabadi, B.; Aghahoseini, S. New multiphase choke correlations for a high flow rate Iranian oil field. Mech. Sci. 2012, 3, 43–47. [Google Scholar] [CrossRef] [Green Version]
  46. Nasriani, H.R.; Kalantari Asl, A. Choke performance in high-rate gas condensate wells under subcritical flow condition. Energy Sourcespart A Recover. Util. Environ. Eff. 2015, 37, 192–199. [Google Scholar] [CrossRef]
  47. Al-Towailib, A.L.; Al-Marhoun, M.A. A new correlation for two-phase flow through chokes. J. Can. Pet. Technol. 1994, 33, 40–43. [Google Scholar] [CrossRef]
  48. Alrumah, M.K.; Bizanti, M.S.; Studies, T. New Multiphase Choke Correlations for Kuwait Fields. In Proceedings of the SPE Middle East Oil and Gas Show and Conference, Manama, Bahrain, 11–14 March 2007. [Google Scholar]
  49. Pinder, J.P. An excel solver exercise to introduce nonlinear regression. Decis. Sci. J. Innov. Educ. 2013, 11, 263–278. [Google Scholar] [CrossRef]
  50. Ghorbani, H.; Wood, D.A.; Moghadasi, J.; Choubineh, A.; Abdizadeh, P.; Mohamadian, N. Predicting liquid flow-rate performance through wellhead chokes with genetic and solver optimizers: An oil field case study. J. Pet. Explor. Prod. Technol. 2019, 9, 1355–1373. [Google Scholar] [CrossRef]
  51. Rashid, S.; Ghamartale, A.; Abbasi, J.; Darvish, H.; Tatar, A. Prediction of multiphase critical choke flow behavior by using a rigorous artificial neural network method. Flow Meas. Instrum. 2019, 69, 101579. [Google Scholar] [CrossRef]
  52. Kargarpour, M.A. Oil and gas well rate estimation by choke formula: Semi-analytical approach. J. Pet. Explor. Prod. Technol. 2019, 1, 1–12. [Google Scholar] [CrossRef]
Figure 1. Estimated gas flow rate versus real gas flow rate (all data).
Energies 12 03992 g001
Figure 2. Estimated gas flow rate versus real gas flow rate (all data) for all four models.
Energies 12 03992 g002
Figure 3. Estimated gas flow rate versus real gas flow rate (validation).
Energies 12 03992 g003
Figure 4. Pressure drop across the choke vs flow rate per choke size.
Energies 12 03992 g004
Figure 5. Estimated gas flow rate versus real gas flow rate (24/64 inch).
Energies 12 03992 g005
Figure 6. Estimated gas flow rate versus real gas flow rate (40/64 inch).
Energies 12 03992 g006
Figure 7. Estimated gas flow rate versus real gas flow rate (64/64 inch).
Energies 12 03992 g007
Figure 8. Estimated gas flow rate versus real gas flow rate (128/64 inch).
Energies 12 03992 g008
Figure 9. Estimated gas flow rate versus real gas flow rate (144/64 inch).
Energies 12 03992 g009
Figure 10. Estimated gas flow rate versus real gas flow rate (160/64 inch).
Energies 12 03992 g010
Figure 11. Estimated gas flow rate versus real gas flow rate (192/64 inch).
Energies 12 03992 g011
Table 1. The range of different production parameters.
ParametersChoke Size (1/64)LGR (bbl/MMscf)Qg (MMscf/day)Upstream Pressure (Psi)Downstream Pressure (Psi)ΔP (psi)Tf (K)
Minimum Value320.695.429716014.5362
Maximum Value192178.8113.345383045.82104513
Table 2. A comparison of six different measures of accuracy corresponding to different models using all production data points (239 data points).
ErrorNew ModelModel 1, Seidi Model 2, HRNModel 3, Osman
APD−0.00690.10050.33260.5126
AAPD0.13000.17390.39450.5179
SD0.04160.04230.10820.0451
MSE45.9563.53272.02580.95
RMSE6.787.9716.4924.10
R^20.930.870.740.58
Table 3. A comparison of six different measures of accuracy corresponding to different models for the validation of the new model using an additional production data set (32 data points).
ErrorNew ModelModel 1, Seidi Model 2, HRNModel 3, Osman
APD0.07140.22010.48860.5259
AAPD0.13400.25350.54180.5416
SD0.02470.03600.08380.0638
MSE44.2188.48242.27295.81
RMSE6.659.4116.1017.20
R^20.920.850.600.44
Table 4. Individual choke sizes and number of corresponding data points.
Choke size24/6440/6464/64128/64144/64160/64192/64
Number of data points10224529151529
Dataset percent61327189918
Table 5. Empirical constant and exponents for each individual choke size.
Choke sizea′bd
24/640.585−0.5150.776
40/640.77−0.1810.632
64/645.82−0.2360.426
128/6410.75−0.3070.467
144/6411.728−0.7020.6
160/647.731−0.6930.726
192/6413.264−0.33750.526
Table 6. A comparison of six different measures of accuracy corresponding to different models using the production data set of the 24/64 inch choke size.
New ModelModel 1, Seidi Model 2, HRNModel 3, Osman
APD−0.01700.41830.78810.7867
AAPD0.07010.41830.78810.7867
SD0.00930.00620.00040.0015
MSE3.6954.51165.79168.00
RMSE1.927.3812.8812.96
R^20.900.450.400.38
Table 7. A comparison of six different measures of accuracy corresponding to different models using the production data set of the 40/64 inch choke size.
New ModelModel 1, Seidi Model 2, HRNModel 3, Osman
APD−0.01380.18410.47870.5357
AAPD0.07880.21260.50210.5357
SD0.01360.03400.06040.0261
MSE8.9152.58175.48195.94
RMSE2.997.2513.2514.00
R^20.900.610.400.38
Table 8. A comparison of six different measures of accuracy corresponding to different models using the production data set of the 64/64 inch choke size.
New ModelModel 1, Seidi Model 2, HRNModel 3, Osman
APD−0.00520.16130.30400.4807
AAPD0.07660.17350.38720.4864
SD0.00940.01660.11260.0398
MSE37.36121.17616.16684.58
RMSE6.1111.0124.8226.16
R^20.910.770.570.48
Table 9. A comparison of six different measures of accuracy corresponding to different models using production data set of the 128/64 inch choke size.
New ModelModel 1, Seidi Model 2, HRNModel 3, Osman
APD−0.01000.08130.23830.4351
AAPD0.06080.09510.25080.4351
SD0.00550.00630.04590.0304
MSE18.8244.46219.29684.58
RMSE4.346.6714.8126.16
R^20.930.850.560.45
Table 10. A comparison of six different measures of accuracy corresponding to different models using production data set of the 144/64 inch choke size.
New ModelModel 1, Seidi Model 2, HRNModel 3, Osman
APD0.0012−0.00340.16400.4862
AAPD0.08710.08510.31380.4862
SD0.01590.01570.10670.0425
MSE31.0136.24393.74749.28
RMSE5.576.0219.8427.37
R^20.970.960.850.55
Table 11. A comparison of six different measures of accuracy corresponding to different models using the production data set of the 160/64 inch choke size.
New ModelModel 1, Seidi Model 2, HRNModel 3, Osman
APD−0.0143−0.00920.20080.5261
AAPD0.09070.13520.20380.5261
SD0.00990.02490.00870.0112
MSE41.8083.98208.051105.46
RMSE6.479.1614.4233.25
R^20.920.720.610.48
Table 12. A comparison of six different measures of accuracy corresponding to different models using the production data set of the 192/64 inch choke size.
New ModelModel 1, Seidi Model 2, HRNModel 3, Osman
APD−0.0091−0.00380.16500.5471
AAPD0.07480.07810.21510.5471
SD0.00900.01020.05340.0388
MSE38.9747.57294.591374.93
RMSE6.246.9017.1637.08
R^20.900.880.700.45

