Review

Energy Savings from Feedback Systems: A Meta-Studies’ Review

Joint Research Centre (JRC), European Commission, 21027 Ispra (VA), Italy
*
Author to whom correspondence should be addressed.
Energies 2019, 12(19), 3788; https://doi.org/10.3390/en12193788
Submission received: 25 July 2019 / Revised: 23 September 2019 / Accepted: 28 September 2019 / Published: 6 October 2019
(This article belongs to the Special Issue Electricity Demand Side Management)

Abstract

:
In order to achieve the goal of the Paris Agreement and reduce energy consumption there is the need for a behavior change in energy end-users. Many studies have demonstrated that by delivering to energy users customized feedback on their energy consumption it can encourage a change in their behavior and support investments in energy efficiency and sustainable energy use. However, the resulting impact on energy consumption can vary largely depending on how, when, and to whom the feedback is delivered. This paper aims to provide an updated overview of the energy savings for the main energy consumptions in residential buildings associated with different types of feedback and against some key determinants, i.e., geographical area, time period, type of medium. This analysis is based on a comprehensive literature review of over 70 studies. Based on the review the paper draws conclusions relevant for policymakers and stakeholders interested in developing feedback strategies and tools for their wide applications. The paper focuses also on the ongoing process implementing the EU Energy Efficiency Directive articles related to billing and metering, which will enable more proactive consumer feedback.

1. Introduction

It is clear that to reach carbon neutrality as recommended by the IPCC Special Report on Global Warming of 1.5 °C [1], there is the need to reduce the energy demand of the existing building stock, which is responsible, with the buildings and construction sectors, for approximately 36% of the global final energy consumption and nearly 40% of the total direct and indirect CO2 emissions in the world [2].
Energy feedback has been on the spotlight as one of the actions to increase energy efficiency and energy savings, thanks to the development of studies and the greater understanding of the importance of consumer behavior, from the social and individual points of view [3]. Labanca [4] highlighted that the main ingredients of current policies for energy efficiency can be considered as a mix of behaviorally or technologically driven energy efficiency improvements, and they should be complemented with a new generation of policies based on the insights provided by social practice theories.
Energy feedback is seen as a way to turn a resource that until recently, was considered invisible into a more visible one, thus transforming energy consumers into active agents in the energy system. Darby (2006) through the Oxford English Dictionary [5] has defined feedback as the information about the result of a process or action that can be used in modification or control of a process or system, especially by noting the difference between a desired and an actual result. As a result of feedback, final energy consumers can use the information about their energy consumption and adapt their behavior and gather a better understanding of the effect of a change in their behavior by interpreting the received feedback. Change in energy consumption, achieved through feedback can be persistent, when individuals develop new habits and/or when feedback has urged to invest in new appliances, for example [5]. Continuous feedback over a long time-period allows people to monitor the impact of changes in their housing and appliances, which is important for them to learn how to use energy more effectively. Therefore, persistent feedback can be important for achieving persistent changes in energy consumption.
The traditional methodology for energy feedback works by providing, to energy consumers, the display of numeric information, regarding their use of electricity and gas resources in order to give them the information needed to reduce their overall energy consumption and shift it from periods of peak demand to periods of “over supply” [6]. The traditional energy feedback research has been focusing on the improvement of its effectiveness into delivering greater energy savings via the change of behaviors as discussed by Buchanan (2015) [7]. Early feedback studies focused mainly on giving out mere notes on the energy consumption, then evolving to more informative bills, to up to today’s digital in-home displays. According with Hargreaves (2018) [6], ultimately, the “role for energy users in future energy transitions may be narrowed down to responding to the information they are given, by undertaking a relatively short list of actions designed to reduce their energy use”. The same author also suggests that the list of potential changes can be divided into just five core types of action: turn it off, use it less, use it more carefully, improve its performance, and replace it/use an alternative. These can be seen as “small changes” that individuals can undertake easily in the course of their life.
The lack of interest from household occupants, confusing feedback and difficulty to relate to, an overemphasis on financial motivations for energy savings, and the risks of “fall-back effects” where energy use returns to previous levels after a short time or rebound effects has been pointed out by Buchanan et al. (2015) [7] as the main reasons for the failing of traditional feedback. The majority of this type of criticism outlines why feedback fails to achieve the expected energy savings, and how this may be overcome through improved design. Three further points are highlighted by Hargreaves [6] as unintended consequences of conventional approaches to energy feedback. First, the fact that some energy users feel unable to realize significant savings as this would mean compromising their levels of comfort. Secondly, once individuals have made the range of ‘small changes’ they feel they can realize, the users start asking not how they can improve, but how the authorities or big companies should be doing. And thirdly, there is a critique that energy feedback, and other forms of quantified feedback, for appealing to and thereby strengthening ‘numeric imagination’, where someone ponders how much we can consume and, in the best of all cases, what can be unplugged—but it never challenges us to think of how a different set of numbers might be generated. Users are then locked in their existing patterns instead of considering new ones.
As pointed out by Aydin (2018) [8], technology alone will not be enough to achieve the desired energy savings. First, due to the rebound effect where consumers tend to increase their energy consumption when using more efficient technologies, and secondly, the diffusion of new energy efficiency technology is rather slow due to a lack of consumer awareness. Behavioral factors are important, as consumers need to adopt and adapt to achieve residential energy savings. As compared to technological changes, behavioral changes can lead to immediate energy savings without additional costs.
With a long-standing tradition in the implementation of energy efficiency policies, the European Union (EU) has introduced policies, which have a direct impact on the development and uptake of energy feedback systems. Since 2006 the EU has established a legislative framework to improve energy performance of buildings and reduce energy consumption in this sector. The framework includes the Energy Services Directive (2006/32/EC) [9], the Directive 2010/31/EU on the Energy Performance of Buildings (EPBD) [10], and the Directive 2012/27/EU on Energy Efficiency (EED) [11]. Both these directives were amended in 2018 [12,13] and together, they promote policies to achieve by 2030 a reduction of energy consumption of 32.5% compared to business as usual and by 2050 a highly energy efficient and decarbonized building stock [14]. Residential buildings in the EU are responsible for 25.7% of the EU’s final energy demand, representing the second largest consuming sector after transport [15].
In particular, Articles 9 and 10 of EED outline the guidance for Member States to supply accurate and systematic energy consumption information for final energy users through metering and billing. The EED requires Member States to make sure that billing information is based on the actual energy consumption and provided in a regular basis as established in Annex VII of the EED. The roll-out of smart meters plays a big role in enabling smart feedback. The EED also establishes minimum functionalities and obligations for smart meters so that consumers are billed based on actual consumption. These metering systems are of the most importance for a regular and up to date communication between the energy suppliers and the final energy consumers.
Four main stages of the roll-out of smart meters were identified through the analysis of the 2017 National Energy Efficiency Action Plans [16,17] and the National Energy and Climate Plans [18]. They are represented in Figure 1 below, as:
(1)
Member states that have already rolled out, or hope to achieve, the 80% coverage of smart meters throughout their territory before 2020 (Austria, Denmark, Estonia, Finland, France, Luxembourg, Malta, Netherlands, Romania, Slovenia, Sweden, United Kingdom);
(2)
Member states that have decided to proceed with the smart meters roll-out, but no earlier than 2020 (Ireland, Italy, Latvia, Lithuania, Portugal, and Slovenia);
(3)
Member states that have been implementing smart meter pilot projects and that will act upon the results of such projects (Cyprus, Greece, Germany, Hungary, Spain, and Slovakia);
(4)
Member states that haven’t got a defined smart meter roll-out strategy, mainly due to a negative outcome in the cost-benefit analyses performed, and are adopting a wait-and-see posture regarding the development of smart meter technology (Belgium, Bulgaria, Croatia, Czech Republic, and Poland).
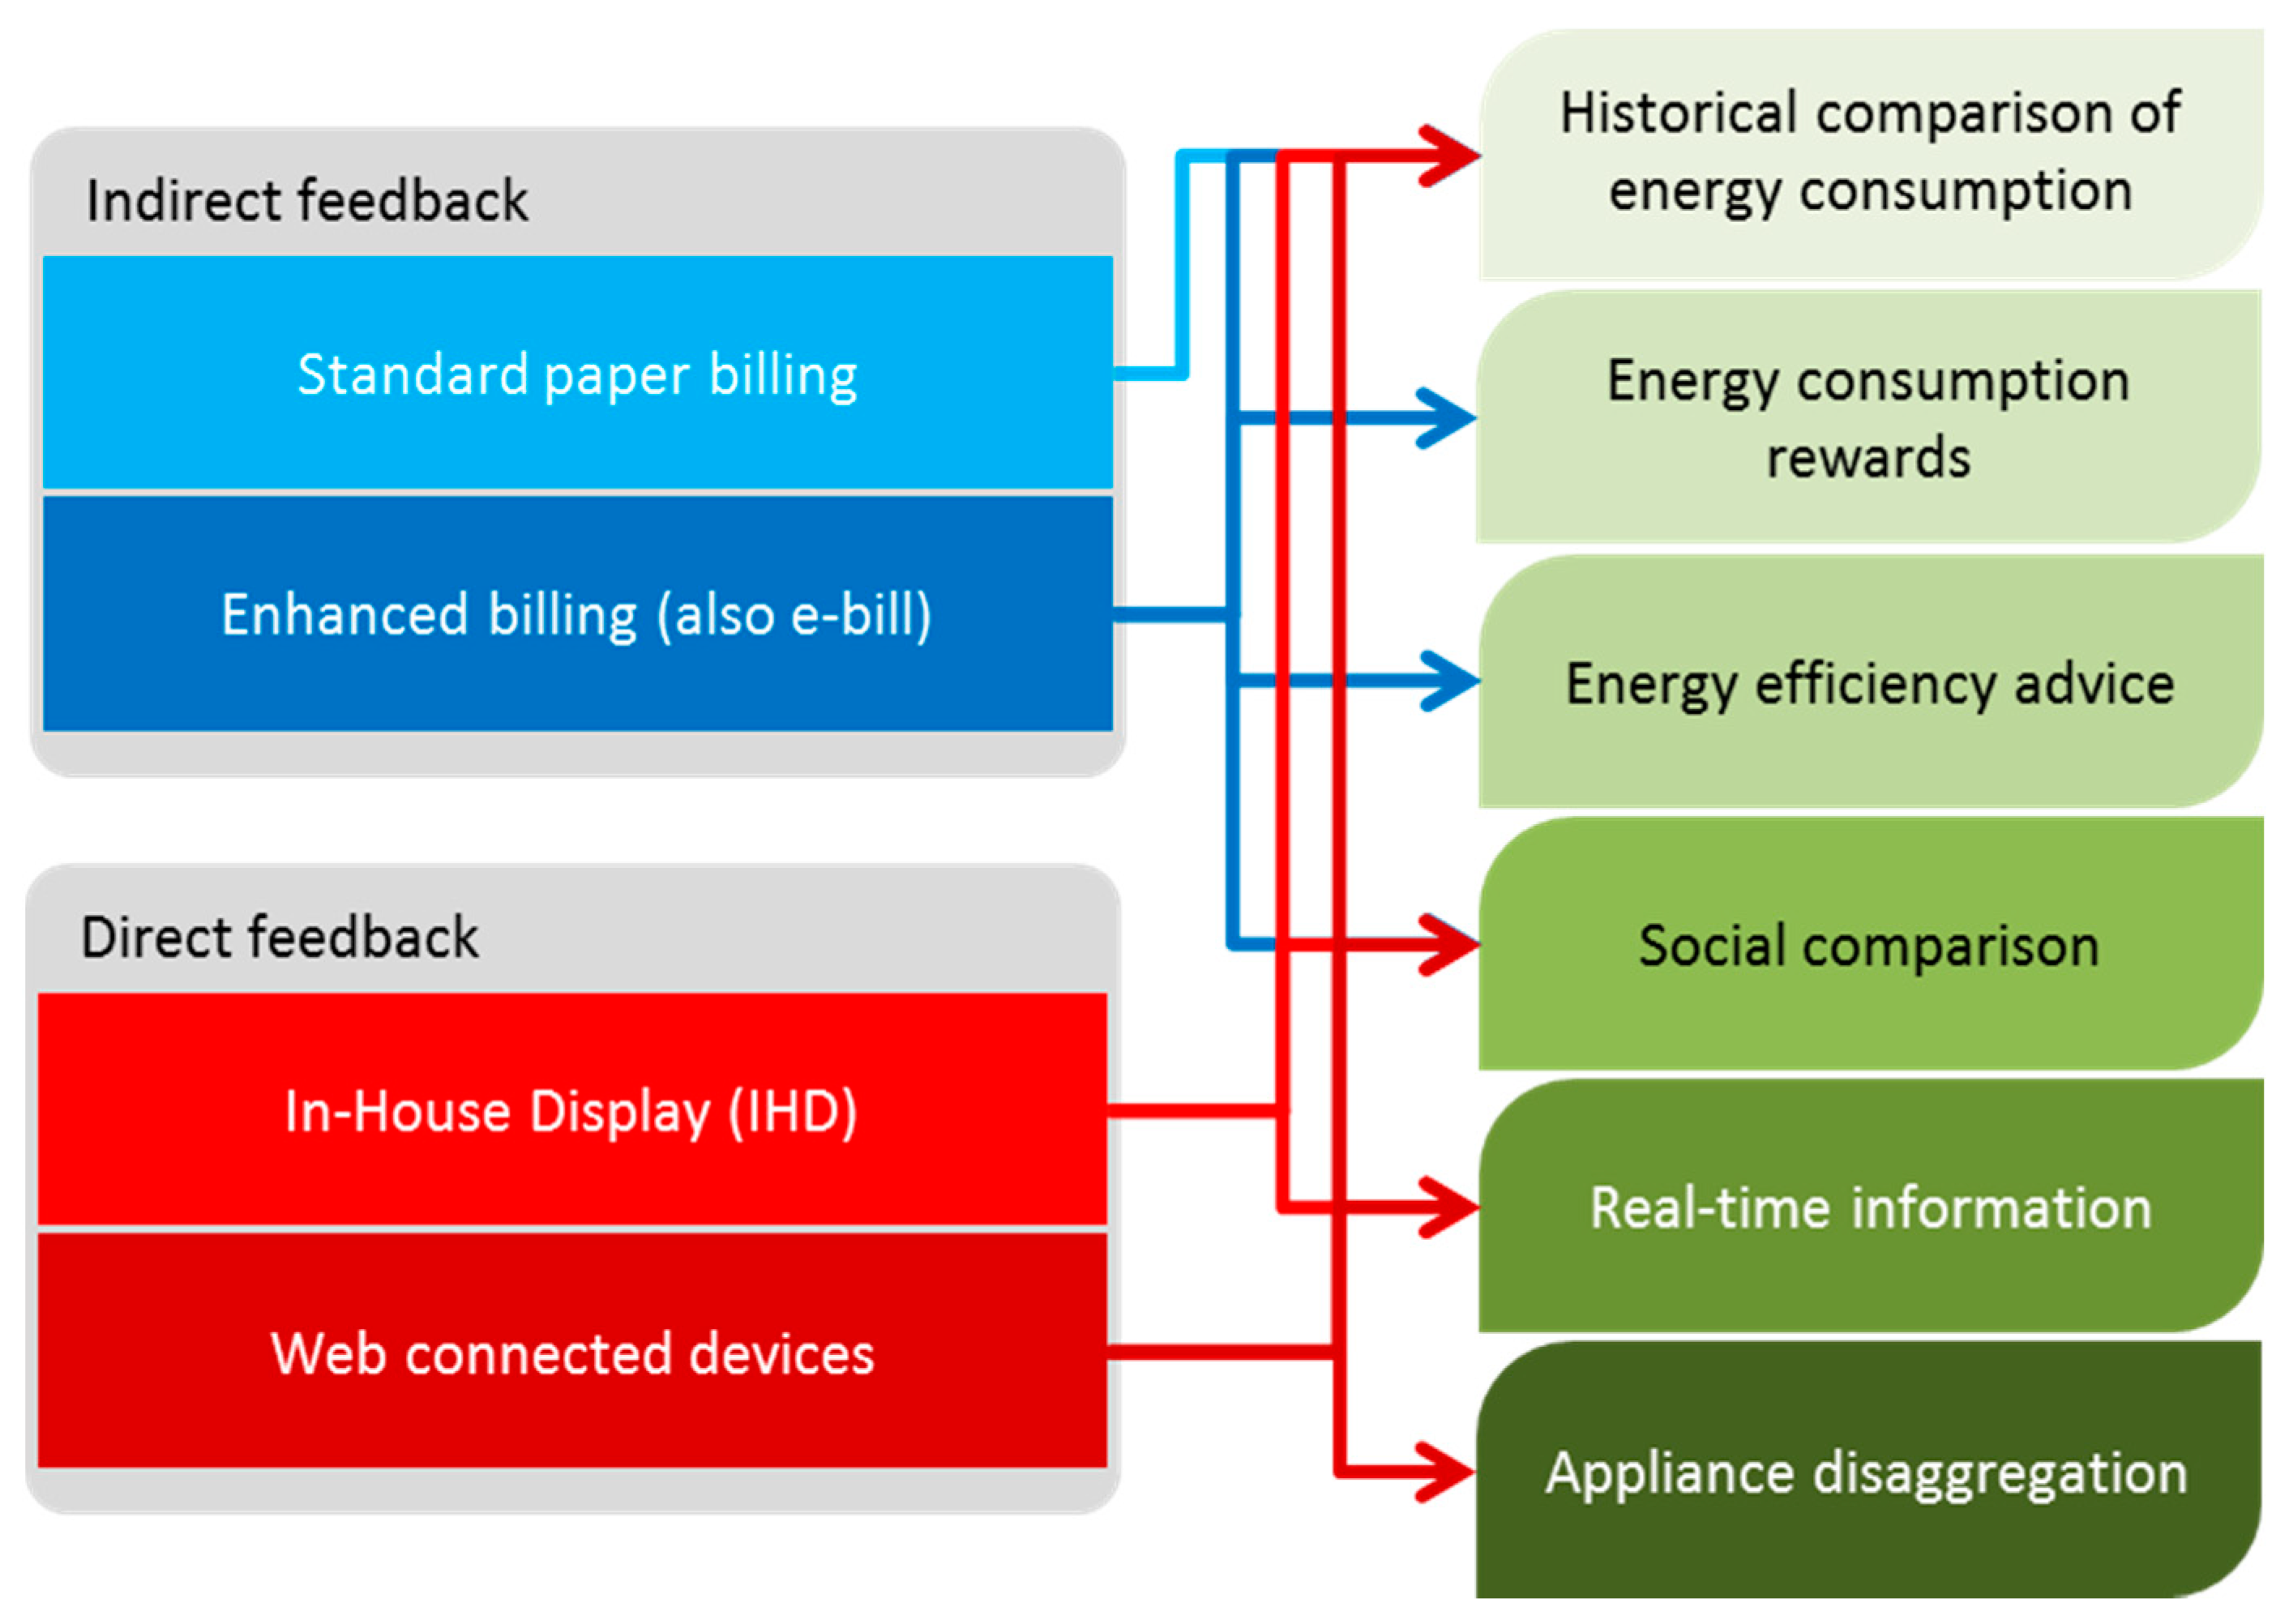
Besides the roll-out of smart meters, which allow for a direct and immediate feedback, the subject of billing is also of importance for the object of this study. The EED outlines in its Article 9 that Member States must ensure that the meters have to provide an accurate reflection of the actual energy consumption of the end user, whereas Article 10 encompasses the provisions for access of information of energy consumption for final customers via the energy bill. The billing information needs to be accurate and represent the actual use and consumers need to have access to the historical consumption, at least for the last three years. The bill should also be able to be received in an electronic format and be easily understandable and comparable.
Whereas with smart meter roll-out, Europe is transitioning at different speeds, through the analysis of Member States’ National Energy Efficiency Action Plans (NEEAPs), it is possible to assess the transposition of the EED articles on billing and minimum information provided to final energy consumers. The large majority of the EU-28 Member States have already transposed the EED provisions and by now energy bills are clearer and more oriented for a full comprehension from the final energy consumers.
This paper updates the review already done by the same authors in 2015 [19,20] and it improves the methodology already applied. The rest of this paper is structured as follows: Section 2 introduces the main feedback systems. Section 3 presents and discusses the meta-studies’ review about the energy savings related to feedback. Finally, the most relevant conclusions are outlined in Section 4.

2. Energy Feedback

According to McCalley [21], feedback can be defined as “the mechanism that directs attention to a specific goal” and two main families of feedback may be adopted: indirect and direct. It is possible to classify other sub-categories, under these two broader categories, that allow different ways of interaction and reaction from the energy providers and final energy consumers. Figure 2 proposes a classification of feedback systems in relation to the type of information that they can provide.

2.1. Indirect Feedback

Indirect energy feedback systems are the most common strategies used to give feedback to final energy consumers, which consist in providing the feedback after the energy consumption. This includes the standard and enhanced billing.
Standard billing is traditionally provided by the energy retailer or distributer and it basically describes the quantity of energy used during a certain period of time through a paper bill, or in an electronic way, delivering some additional information. The frequency of this means of feedback and also whether the bill is based on estimated consumption (based on historical records) or real consumption (actual meter reading) are significant matters in relation to the commitment of the consumer. For instance, if a consumer is paying a flat rate throughout the year, independently from the real consumption, this may discourage energy savings.
Nominally, the effectiveness of standard billing can be judged as quite low, since it doesn’t encourage final users to change their energy behavior or make energy efficiency investments in their building units [22,23,24]. The kind of information being given in a traditional bill does not go much beyond the sustained costs, type of contracted price, and eventually an analysis versus a comparable timeframe. Since it is only informational and non-engaging, this feedback does not ask for a call for action in any kind of way other than advising the customer to pay the bill. It occurs often that the lack of clearness of the bill is evident, which leads to misperception and a consequent loss of interest.
Enhanced billing is a step further from standard billing and although still conveying information from the utility, it relies on third-party agents to provide additional information such as comparing energy consumption in the previous year or even month, due to the use of measured utility data. This feedback subtype is often delivered by autonomous companies that evaluate the information gathered by the utility and therefore provide comparisons and historical or social backgrounds.
Enhanced billing can be linked to the traditional energy bill, or delivered independently [22,25]. This feedback is usually provided through traditional mailing or via a web platform. The kind of information provided in this way is more complex than the one coming from traditional bills, with the companies providing this service using different data sources other than utility data, such as home inspections, energy performance certifications, cadastral maps, census, or climatic data. Very often statistics are used to run models to analyze existing data along with user’s input to deliver a customized experience for the energy consumer. The advice to the household, web-based energy checks and the billing analysis that is offered increase the completeness and the quality of the information provided.
In these types of feedback, social science principles are also used to deliver a more engaging experience to the energy consumers, with gamification principles like goal setting and social norms which stimulate the personal competition and call-to-action processes. In recent years enhanced billing strategies have been implemented with significant success. For instance, some operators working with utilities base their analysis on data processing techniques and social science theories. This, joint with a user-centric design, allows for utilities to connect more effectively with their clients for customer loyalty actions or as part of initiatives on energy efficiency.
Such approach to communicate with the customers presents energy performance to the energy consumers in an easy and intuitive way to understand. The use of descriptive and peremptory norms reinforces a positive behavior change when the user can see where he stands in comparison with their peers or neighbors, and receive immediate gratification, sometimes simply through a traffic light or an emoticon. The same can be said for target setting where the user is pursuing a specific goal and is more likely to act accordingly.
Other than the traditional moments to provide information to the customers, these operators use continuously other key occasions of commitment with energy consumers. While some of these opportunities may rely on the availability of smart meters, others can utilize the traditional meter technologies. For instance, advice can be sent to the clients to prepare them for the arrival of new climatic conditions, suggesting new technologies that may be implemented or behavioral changes that can be adopted by the household. Other interaction occasions may be when a higher than normal energy expenditure is expected to arrive on a peak day.

2.2. Direct Feedback

As reported by Serrenho [26], direct feedback can be delivered by user interfaces, smart hardware, or software platforms. Devices or platforms that are traditionally used to provide feedback to energy consumers are:
-
In-home displays (IHD), which are relatively simple interfaces providing immediate energy use feedback for the consumer with the capacity to send pricing signals. The type of information is very simple and direct.
-
Load monitors give simple information on the energy consumption of a device and are placed between the power outlet and the appliance. The type of information provided by load monitors is limited to the energy consumption and eventually a calculation of associated costs, if these parameters are imputed by the user.
-
Smart hubs are devices that aggregate several smart connected devices within the smart home environment with the main objective to integrate the functionalities of all the devices and communicate with all in a concerted way within a home network.
-
Energy portals, which have as their main functionality the collection of energy data and its transmission for the final consumer. It receives energy consumption information from smart meters or smart appliances within the household and allows for a detailed and near real-time energy consumption, allowing for the household occupants to control the appliances remotely by acting upon the information received.
When one of these devices is installed in the household environment, the final energy consumer is able to access real-time information on how energy is being used. This allows for the energy consumer to manage the home devices, turn them on or off, or receive appliance-specific feedback. The customization of information that can be provided to the consumer is limitless. From the information regarding the costs or the incorporation of the energy management into the home web environment, these devices allow for the user to configure alarms or define goals and track them. The fact that connected devices allow for an increased interaction, which can be accessed by a personal computer, smartphone, or tablet, and access real-time data on the energy consumption, energy consuming appliances, historical consumption, or emergency messages, make these devices the most complete and engaging types of feedback, just before a fully automated system.
Ideally, to have an effective feedback strategy, the appliances and other devices should be linked to a central application or device, which can be controlled in a remote way, being able to monitor and act upon prompts defined by the user, and also have the ability to receive price signals and utilities’ load control. These systems are usually composed of different types of components that allow for even traditional appliances to be “smartized”, such as smart lighting and appliances, smart plugs, and thermostats.

3. Meta-Data Studies on Feedback

Over the past 50 years a huge quantity of studies derived indications about the possible influence on energy consumption with the introduction of feedback strategies. For this review, we have taken into account previous review studies [27,28,29] based on quite various literature [30,31,32,33,34,35,36,37,38,39,40,41,42,43,44,45,46,47,48,49,50,51,52,53,54,55,56,57,58,59,60,61,62,63,64,65,66,67,68,69,70,71,72,73,74,75,76,77,78,79,80,81,82,83,84,85], as well as more recent studies [86,87,88,89,90,91,92,93]. In accordance with the previous review, we analyzed the empirical studies on consumption feedback through qualitative methods, applying some inclusion criteria to guarantee a minimum quality standard. In particular, the studies which were not considered a control group, as well as those with clear confounding variables, were excluded from the analysis.
By taking into account a total of 64 studies [30,31,32,33,34,35,36,37,38,39,40,41,42,43,44,45,46,47,48,49,50,51,52,53,54,55,56,57,58,59,60,61,62,63,64,65,66,67,68,69,70,71,72,73,74,75,76,77,78,79,80,81,82,83,84,85,86,87,88,89,90,91,92,93], a final database including 127 implementations of a certain type of feedback was collected, and for 114 of these, the percentage of energy savings was clearly reported. Overall, they cover:
-
2 types of feedback (direct and indirect);
-
3 types of energy end-uses (electricity only, electricity and heating, heating only);
-
6 types of media (bill, card, in-house-display, mail, PC or web, mixed mode);
-
20 countries (mainly in Europe and North America);
-
3 categories of duration periods (from 2 weeks up to 3 years);
-
3 categories of range of sample sizes (from 10 up to 100,000 households).

3.1. Studies Overview

In order to interpret better the results presented in the following sections, it is useful to explain how the final sample is composed. For this reason, Figure 3 provides a breakdown of the complete set of 127 feedback applications, from which the following information is derived:
-
A large number of experiments (59%) were carried out in Europe (mostly in UK and Scandinavia) and more than one third (37%) in North America (the USA and Canada); only few studies were developed in Asia (China and Japan) and Australia; the other parts of the world are not covered at all.
-
The majority of applications (62%) were done on electricity consumption, while the efficacy of feedback on heating consumptions and on both end-uses together has been less recognized (respectively 21% and 17%).
-
The sample covers well both direct (43%) and indirect (57%) feedback. The indirect means include feedbacks which were processed in some way before the user receives them.
-
The number of studies has increased during the last 15 years, probably due to the rollout of information campaigns, smart meters, and online services by energy utilities. In fact, 45% of research studies were carried out after 2010 and 34% between 1990 and 2010.
-
Almost the 50% of applications were focused on samples between 100 and 1000 households, 30% on less than 100, and 21% on more than 1000.
-
83% of experiments lasted for more than 3 months, and 50% for more than one year.
-
The applications taken into account cover a large range of feedback frequencies; the most represented classes are those of monthly (indirect) and continuous (direct) feedback (both at 33%).
-
Almost all direct feedbacks were provided adopting an IHD, while mostly bill (35%) and mail (25%), were used to deliver indirect feedbacks.

3.2. Energy Savings through Feedback

As discussed in the introduction, both theory and previous empirical research suggest that feedback can have a significant part in making energy consumers aware of the impacts of their behaviors, which in turn stimulates virtuous behaviors that can save energy. However, looking for quantification of the expected energy savings, it is necessary to remember that the past studies were differently designed, with a focus on different types of energy consumption and implementing methodologies not harmonized.
A very simple and general conclusion can be derived, by looking at the overall picture (based on 114 experiments for which the percentage of saving was reported): it is unlikely that a feedback method (whatever it is) is associated with an energy saving greater than 20%, as well as an increase of energy consumption. This is the case for only one record of our database, registered by the AECOM (Architecture, Engineering, Consulting, Operations, and Maintenance) analysis [75] for “fuel poor” consumers to which accurate and informative bills were delivered. This case is not statistically relevant, but it highlights the importance of the type of consumer for whom the feedback is targeted.
When the issue is analyzed deeply, it is evident that the effectiveness of a feedback approach mainly varies in function of how it is provided. For this reason, to obtain complete indications by comparing the observed impacts on energy consumptions is not obvious. However, some shreds of evidence may be gained, by classifying the results against the main procedural and contextual features. In order to obtain consistent indications, we judged as appropriated to combine two of these determinants per time, according to the combinations shown in Table 1. When an experiment did not fall univocally in one of the established categories (or not statistically relevant categories) for a certain determinant, it was not taken into account with a reduction of the total number of applications used for the specific analysis. For each category resulting from every combination of determinants the following statistics were calculated:
-
number of feedback applications;
-
average, minimum, and maximum energy saving;
-
25th, 50th, and 75th percentiles of energy saving.
In the studies analyzed it was possible to encounter negative energy savings, which are also displayed in the figures below. These negative energy savings occurrences were found to be negligible and outliers in the overall sample.
The results achieved are presented in a graphical way and discussed in the following sections.

3.2.1. Energy Savings per Type of Energy End-Use and Geographical Zone

Comparing the data per type of energy end-use and by the main geographical area (Figure 4), initially, it is important to note how maximum energy savings (around 20%) were observed in different parts of the world for electrical consumptions (whether treated alone or with heating). The differences between Europe and North America are more pronounced when the feedback is provided also on the heating consumptions; while in Europe (i.e., in Norway) it was only 10%, in the USA a maximum of 19% was obtained.
Looking at the average energy savings, they fall in the interval 4%–11% and they are slightly higher in North America. The standard deviations are always greater than 2% and reach the value of 6.5% for feedback on electricity only in Europe and on electricity and heating in North America.

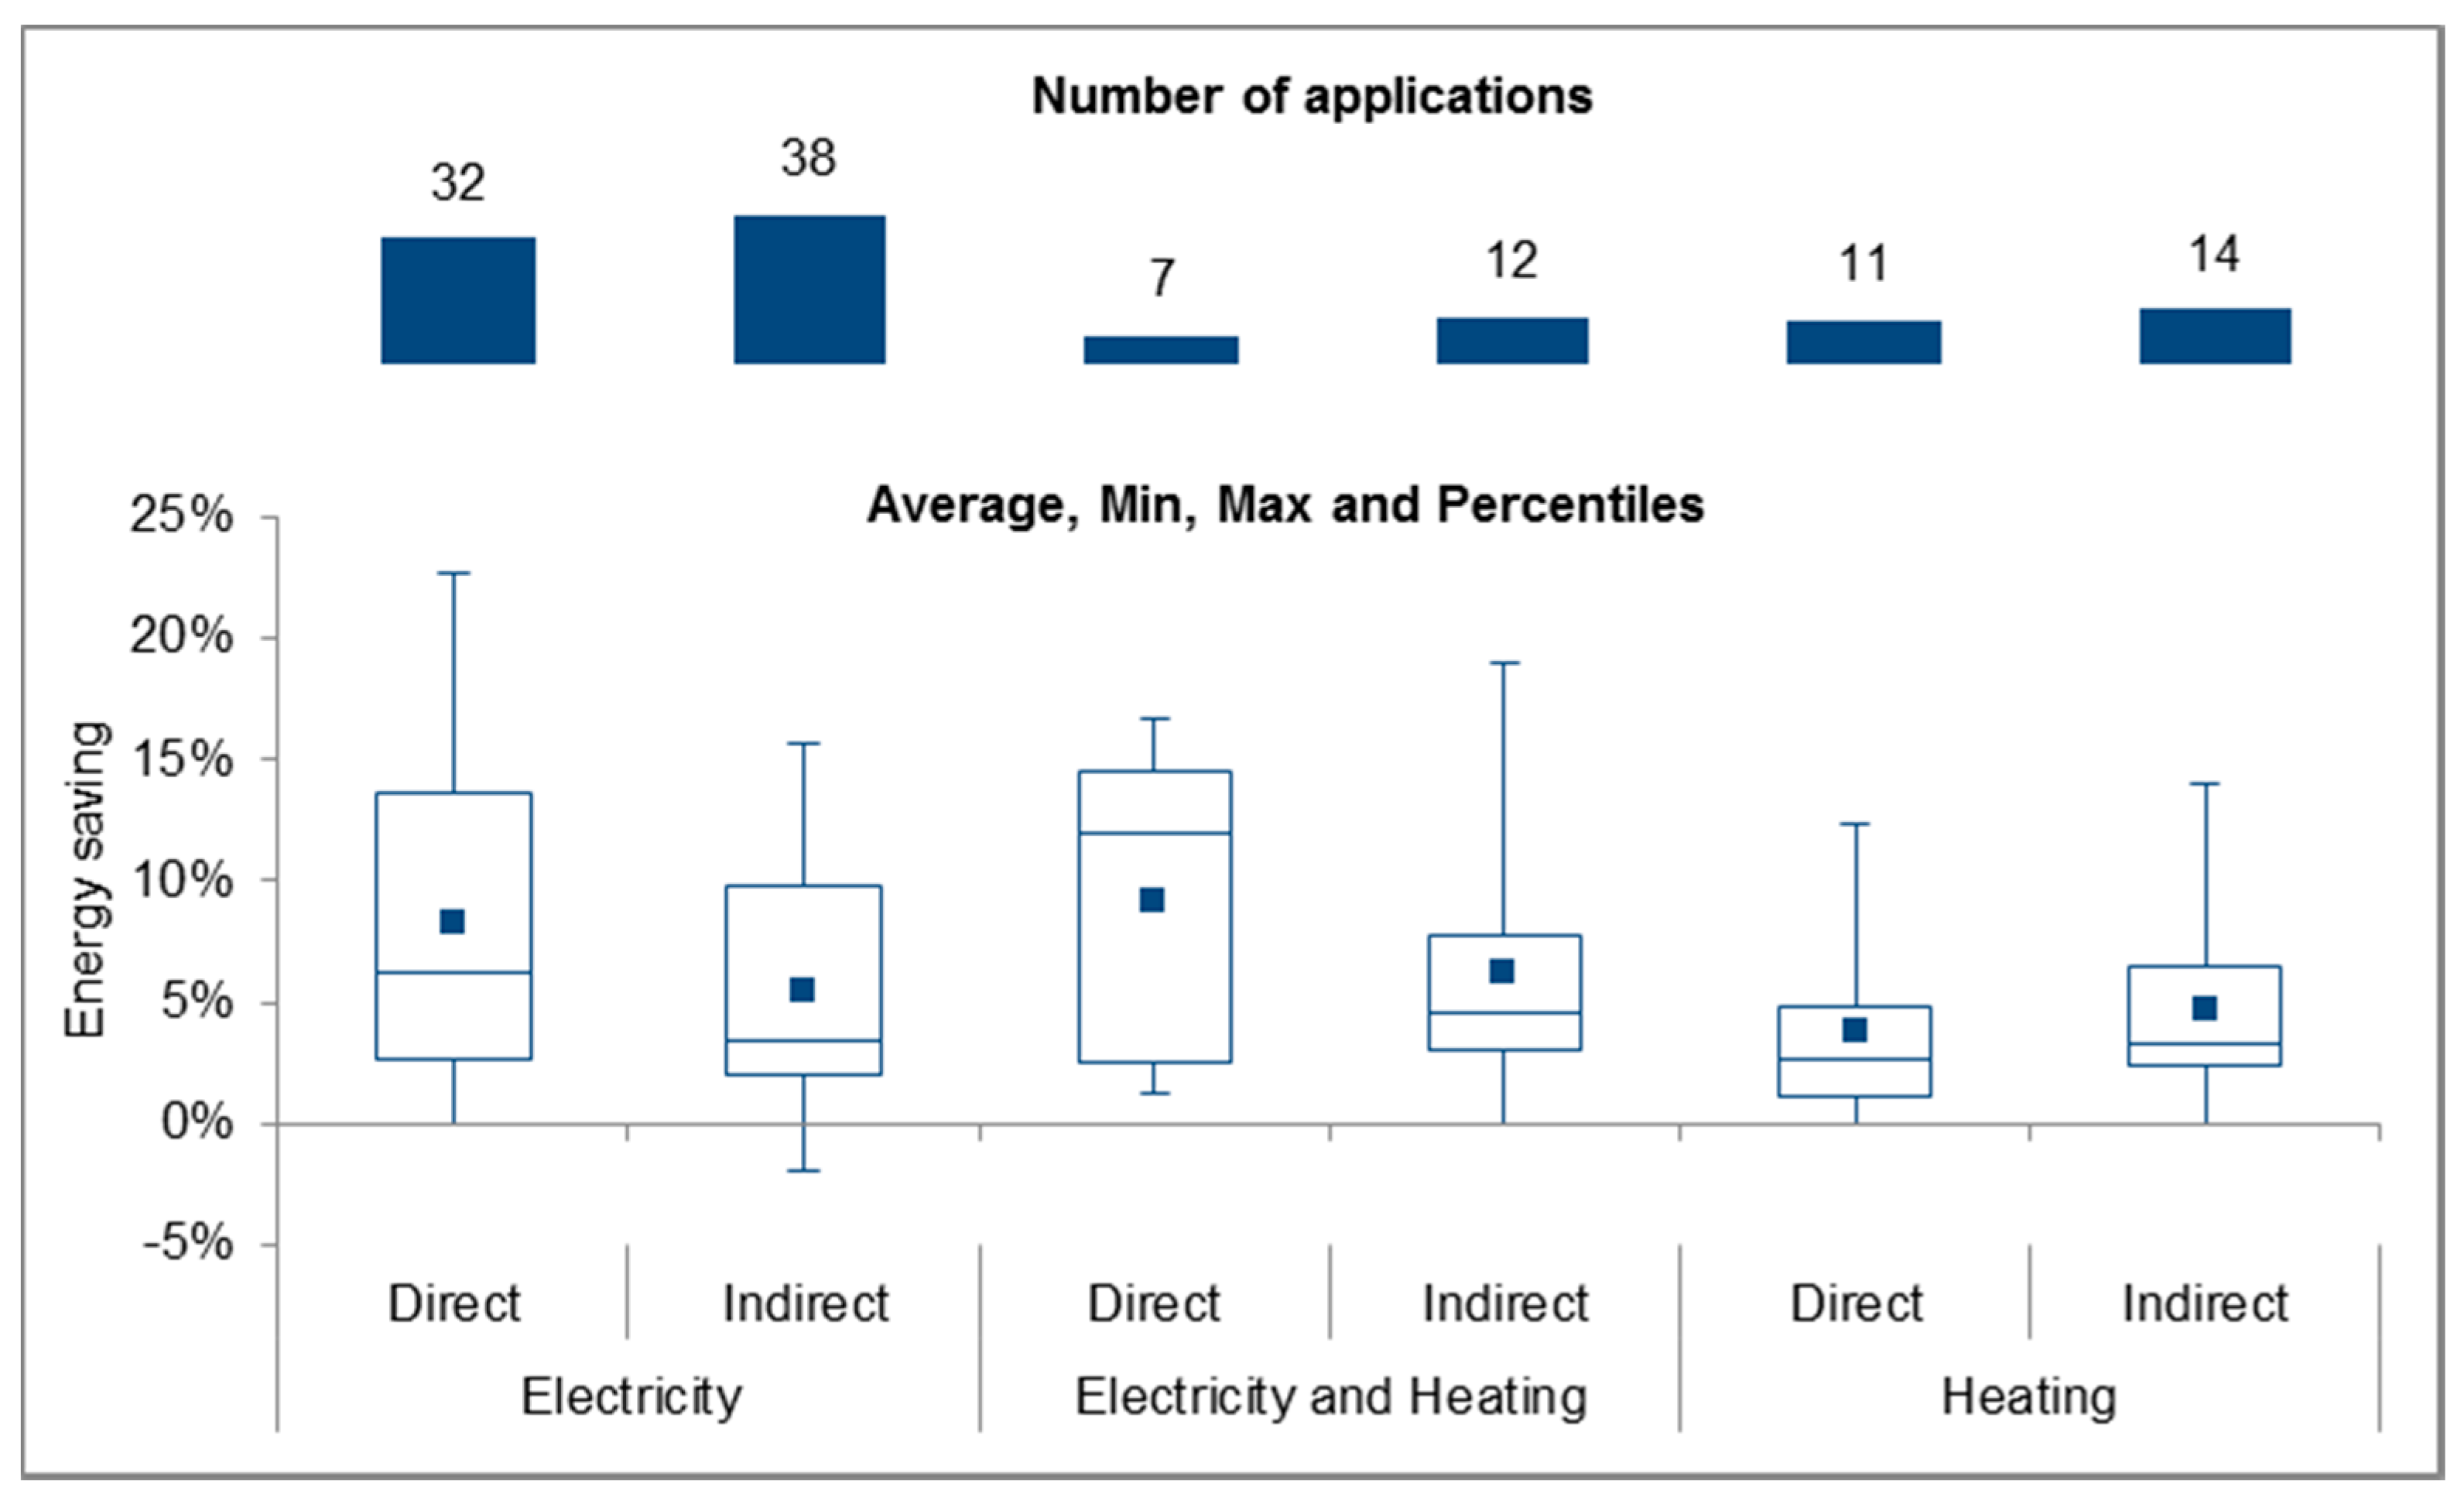
3.2.2. Energy Savings per Type of End-Use and Feedback

In general, it is confirmed that a higher average savings is related to a direct feedback with respect to an indirect one, when the recorded outputs are grouped per type of end-use and feedback (Figure 5). However, these results are true when the feedback is provided only on electricity consumption (8.3% against 5.4%) and on both the end-uses (9.1% against 6.2%), but not for only heating consumptions. In this case both the average (4.6% against 4.0%) and the maximum (14.0% against 12.3%) savings are associated to indirect strategies.
High values of standard deviation are observed mostly for direct feedback on electrical consumptions, both with (6.3%) and without heating (6.7%).

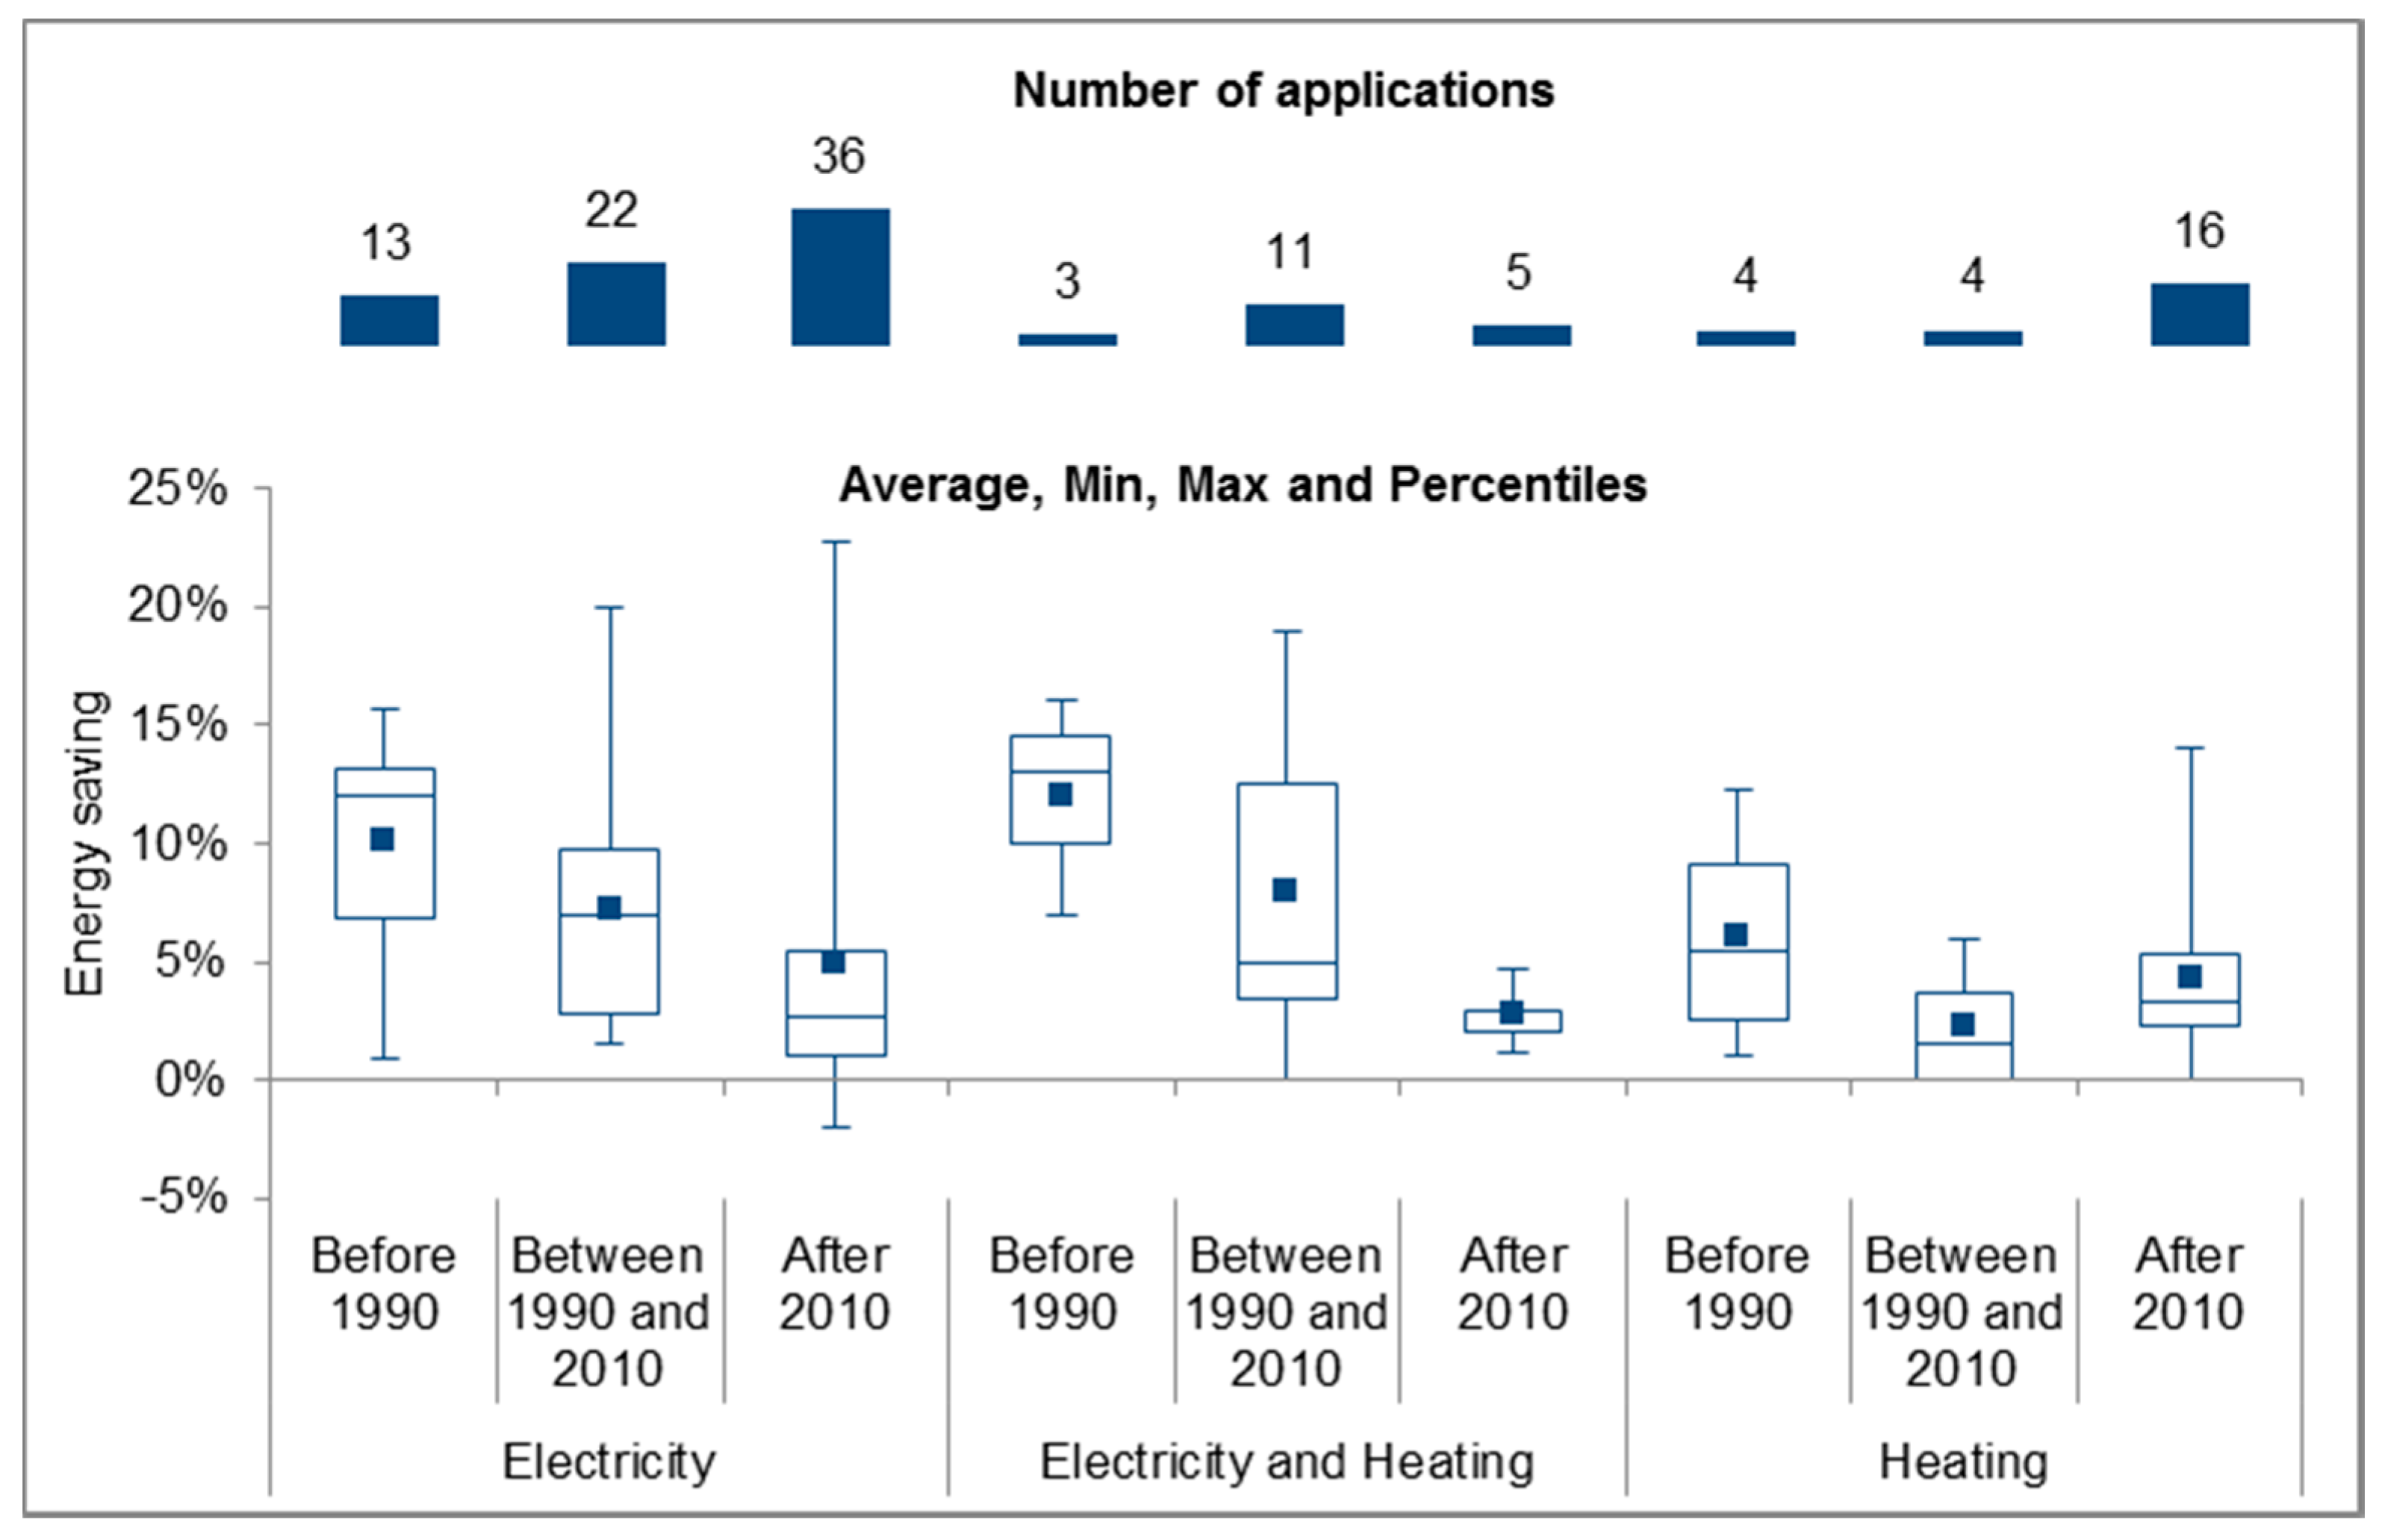
3.2.3. Energy Savings per Type of End-Use and Period of the Study

As shown in Figure 6, the average savings associated with feedback systems depends on when the experiment was carried out. As the common sense would suggest, the effectiveness of feedback can be inversely related to the grade of awareness of energy consumers: i.e., the feedback would be less effective when the starting behavior of the building occupants is high aware. Supposing that the general awareness is growing over the time because of many factors (i.e., development of information campaigns, increase of energy prices, effects of climate changes, etc.), this may clarify why the average savings observed before 1990 (9.4% in average) is greater than that recorded after 2010 (4.0% in average) for all end-use types. Another reason for this is the past increase of energy efficiency of domestic appliances and heating systems.

3.2.4. Energy Savings per Type of Feedback and Medium

Regarding the type of media (Figure 7), this cross-analysis discloses that greater savings can be reached with a real-time feedback provided by an in-home display or a web tool (7.8% on average) and that the indirect feedbacks communicated with a card (i.e., door hanger or other card/sign delivered by the researchers to the energy consumers) are more effective (9.4% on average) than those delivered by other mediums (not considering mixed modes). The indirect systems based on bills are definitely more replicable and can be extended to higher samples (due to their lower specific costs), but their impact appears smaller (3% on average and 10% maximum). Some studies have been categorized as “mixed” because more than one medium was used.

3.2.5. Energy Savings per Type of Feedback and Interaction Frequency

As theory suggests [27,94], a more frequent feedback should be more effective than the occasional one because it helps to connect a behavioral change to its effect on energy consumptions. This is verified looking at the Figure 8. Especially for indirect feedback, the mean savings is clearly proportional to the frequency, passing from 8.6% with 1–4 feedback per week to 2.7% with the most infrequent communications (every 2–6 months). The absolute maximum saving was obtained with continuous direct feedback. In line with previous experiences, the immediate feedback (the consumer is able to refer to the feedback directly after taking action) is particularly effective during the learning phase, when the user’s attention is focused on the specific action target.

3.2.6. Energy Savings per Type of Feedback and Duration

Another factor influencing the energy saving obtainable with a feedback strategy is its duration over time. In fact, the attention of consumers may drop as they pass from the starting learning task to the satisfaction of a specific objective. In fact, the duration of a feedback may impact on how the consumer will interpret its message and where he will subsequently focus the attention.
The statistical analysis presented in Figure 9 suggests that when the duration increases, the average savings decreases, both for direct (from 10.5% to 5.8% on average) and indirect feedback (from 11.0% to 4.4% on average).

4. Conclusions

As summarized in Table 2, the studies evaluated in the present article show that feedback can contribute in a realistic perspective to a household’s final energy consumption reduction in the range from 5% to 10%. From Table 2 it emerges that direct feedbacks can be considered as slightly more effective than the indirect ones, especially for electricity end-uses. On the contrary, regarding the comparison between Europe and North America, it is difficult to obtain conclusive evidence of different results clearly reflecting cultural or behavioral differences among end-users in the two different regions.
Even if this analysis is based only on robust studies that used a control group and also considered contextual factors (e.g., household demographics, socio economic context, consumption ranges, weather, etc.), it is important to observe that a certain margin of variation may be attributable to differences of household groups (e.g., educated or wealthy household, or young vs. elderly households) typically ranging from self-selected volunteers to random population samples and other dissimilarities in experiment design. In addition, the final impact on energy consumptions can strongly depend on how the feedback is tailored to the household and presented in a clear, engaging way. Moreover, it is necessary to remind the reader that the energy savings associated to every application refers to the period under analysis (less than 12 months for the 60%) and could be changed over the long term.
Besides the persistence in time of the effects of feedback and the eventual need of adjusting the strategy to maintain the engagement of householders, by analyzing the energy feedback studies, relevant uncertainties were also found on the impact of feedback on energy users in different demographic and social groups and the cost-benefit of feedback. The discrepancies between different cost-benefit assessments for feedback based on advanced metering technologies have to be further studied, as well as the conditions under which the benefits of feedback compensate the costs. Moreover, it was also found that the technicalities associated with enabling the sharing of information on energy consumptions between similar consumers are rarely analyzed and discussed. These aspects are of great relevance and should be addressed in further research.
Also, the frequency of feedback interventions is a key aspect, which can influence the permanent engagement of energy users, where a correct balance between too many and too few feedbacks should be found, to avoid losing the interest of the final energy consumers. The analysis of the studies shows that a greater frequency of feedback is leading to much more energy savings with 8% for feedback provided several times per week, instead of less than 3% for feedback provided every 2–6 month. This finding could call for a revision of the EED provisions with energy consumption readings at least once a year and billing occasions twice a year should be increased for boosting energy savings.
There is ample evidence that the general awareness of energy efficiency has been growing throughout the years. Nevertheless, an important energy saving potential can still be attributed to proactive actions able to increase the awareness of one’s own energy footprint and measures related to reduce energy consumption through behavior change. In addition, end-user engagement has to be maintained in order to reduce the long-term loss of effectiveness of a feedback mean. To do this, a two-way interaction approach between the energy suppliers and final user is recommended [95,96], as well as the use of gamification strategies, such as the challenge with similar profile consumers, and the application of methods that gratify the consumer when its energy consumption is reduced. Also, the effects of these aspects have to be better investigated in the coming years.

Author Contributions

Conceptualization, P.Z., T.S. and P.B.; Methodology, P.Z., T.S. and P.B.; Writing—Original Draft Preparation, P.Z., T.S.; Writing—Review & Editing, P.Z., T.S. and P.B.

Funding

This research received no external funding.

Conflicts of Interest

The authors declare no conflict of interest.

References and Notes

  1. Masson-Delmotte, V.; Zhai, P.; Pörtner, H.O.; Roberts, D.; Skea, J.; Shukla, P.R.; Pirani, A.; Moufouma-Okia, W.; Péan, C.; Pidcock, R.; et al. IPCC, 2018: Global Warming of 1.5 °C. Available online: https://www.ipcc.ch/sr15/ (accessed on 10 September 2019).
  2. Global Alliance for Buildings and Construction. Towards a Zero-Emission, Efficient and Resilient Buildings and Construction Sector; United Nations Environment Programme: Nairobi, Kenya, 2018; ISBN 978-92-807-3729-5. [Google Scholar]
  3. Bertoldi, P. Overview of the European Union policies to promote more sustainable behaviours in energy end-users. In Energy and Behaviour, 1st ed.; Elsevier: London, UK, 2019; ISBN 9780128185674. [Google Scholar]
  4. Labanca, N.; Bertoldi, P. Beyond energy efficiency and individual behaviours: Policy insights from social practice theories. In Energy Policy; Elsevier: London, UK, 2018; Volume 115, pp. 494–502. [Google Scholar]
  5. Darby, S. The effectiveness of feedback on energy consumption. In A Review for DEFRA of the Literature on Metering, Billing and Direct Displays; Oxford University: Oxford, UK, 2006. [Google Scholar]
  6. Hargreaves, T. Beyond energy feedback. Build Res. Inf. 2018, 46, 332–342. [Google Scholar]
  7. Buchanan, K.; Russo, R.; Anderson, B. The question of energy reduction: The problem(s) with feedback. Energy Policy 2015, 77, 89–96. [Google Scholar] [CrossRef] [Green Version]
  8. Aydin, E.; Brounen, D.; Kok, N. Information provision and energy consumption: Evidence from a field experiment. Energy Econ. 2018, 71, 403–410. [Google Scholar] [CrossRef]
  9. European Union. Directive 2006/32/EC of the European Parliament and of the Council of 5 April 2012 on energy end-use efficiency and energy services and repealing Council Directive 93/76/EEC. Available online: https://eur-lex.europa.eu/legal-content/EN/TXT/HTML/?uri=CELEX:32006L0032&from=EN (accessed on 27 April 2006).
  10. European Union. Directive 2010/31/EU of the European Parliament and of the Council of 19 May 2010 on the Energy Performance of Buildings. Brussels, 18 June 2010. Available online: https://eur-lex.europa.eu/legal-content/EN/TXT/HTML/?uri=CELEX:32010L0031&from=it (accessed on 15 May 2019).
  11. European Union. Directive 2012/27/EU of the European Parliament and of the Council of 25 October 2012 on Energy Efficiency, Amending Directives 2009/125/EC and 2010/30/EU and Repealing Directives 2004/8/EC and 2006/32/EC. Brussels, 14 November 2012. Available online: https://eur-lex.europa.eu/legal-content/EN/TXT/?uri=celex%3A32012L0027 (accessed on 15 May 2019).
  12. European Union. Directive 2018/844 of the European Parliament and of the Council of 30 May 2018, Amending Directive 2010/31/EU on the Energy Performance of Buildings and Directive 2012/27/EU on Energy Efficiency. Available online: https://eur-lex.europa.eu/legal-content/IT/TXT/?uri=CELEX%3A32018L0844 (accessed on 19 June 2018).
  13. European Union. Directive 2018/2002 of the European Parliament and of the council of 11 December 2018 amending Directive 2012/27/EU on Energy Efficiency. Brussels, 21 December 2018. Available online: https://eur-lex.europa.eu/legal-content/EN/TXT/PDF/?uri=CELEX:32018L2002&from=EN (accessed on 15 May 2019).
  14. European Union. Clean Energy for all Europeans. Publications Office of the European Union: Luxembourg, 2019. Available online: https://publications.europa.eu/en/publication-detail/-/publication/b4e46873-7528-11e9-9f05-01aa75ed71a1/language-en?WT.mc_id=Searchresult&WT.ria_c=null&WT.ria_f=3608&WT.ria_ev=search (accessed on 15 May 2019). [CrossRef]
  15. Tzeiranaki, S.T.; Bertoldi, P.; Diluiso, F.; Castellazzi, L.; Economidou, M.; Labanca, N.; Serrenho, T.R.; Zangheri, P. Analysis of the EU Residential Energy Consumption: Trends and Determinants. Energies 2019, 12, 1065. [Google Scholar] [CrossRef]
  16. Economidou, M.; Labanca, N.; Ribeiro Serrenho, T.; Castellazzi, L.; Panev, S.; Zancanella, P.; Broc, J.; Bertoldi, P. Assessment of the Second National Energy Efficiency Action Plans under the Energy Efficiency Directive; European Union: Luxembourg, 2018; ISBN 978-92-79-87946-3. [Google Scholar]
  17. Bertoldi, P.; Economidou, M. EU Member States Energy Efficiency Policies for the Industrial Sector Based on the NEEAPs Analysis, Eceee Industrial Summer Study Proceedings. Available online: https://www2.scopus.com/inward/record.uri?eid=2-s2.0-85049886641&partnerID=40&md5=b62c3eb3bce2a45f905c60b053023a5e (accessed on 20 November 2018).
  18. EU-28 National Energy and Climate Action Plans (NECPs). Available online: https://ec.europa.eu/energy/en/topics/energy-strategy-and-energy-union/governance-energy-union/national-energy-climate-plans (accessed on 13 July 2018).
  19. Serrenho, T.; Zangheri, P.; Bertoldi, B. Energy Feedback Systems: Evaluation of Meta-Studies on Energy Savings through Feedback. EUR 27992 EN. Available online: http://publications.jrc.ec.europa.eu/repository/bitstream/JRC99716/ldna27992enn.pdf (accessed on 15 January 2016).
  20. Bertoldi, P.; Tiago, S.; Paolo, Z. Consumer Feedback Systems: How Much Energy Saving Will They Deliver and for How Long? 2016 ACEEE Summer Study on Energy Efficiency in Buildings. Available online: https://aceee.org/files/proceedings/2016/data/papers/12_769.pdf (accessed on 30 November 2016).
  21. McCalley, L.T. From motivation and cognition theories to everyday applications and back again: The case of product-integrated information and feedback. Energy Policy 2006, 34, 129–137. [Google Scholar] [CrossRef]
  22. Summit Blue Consulting. Impact Evaluation of OPOWER SMUD Pilot Study. Available online: http://www.oracle.com/us/industries/utilities/impact-eval-opower-smud-3631991.pdf (accessed on 15 May 2019).
  23. Allcott, H. Social norms and energy conservation. J. Public Econ. 2011, 95, 1082–1095. [Google Scholar] [CrossRef] [Green Version]
  24. Ayres, I.; Raseman, S.; Shih, A. Evidence from two large field experiments that peer comparison feedback can reduce residential energy usage. J. Law Econ. Organ. 2013, 29, 992–1022. [Google Scholar] [CrossRef]
  25. Wilhite, H.; Ling, R. Measured energy savings from a more informative energy bill. Energy Build. 1995, 22, 145–155. [Google Scholar] [CrossRef]
  26. Serrenho, T.; Bertoldi, P. Smart Home and Appliances: State of the Art - Energy, Communications, Protocols, Standards, EUR 29750 EN. Available online: http://publications.jrc.ec.europa.eu/repository/bitstream/JRC113988/kjna29750enn_1.pdf (accessed on 15 May 2019).
  27. Fischer, C. Feedback on household electricity consumption: A tool for saving energy? Energy Effic. 2008, 1, 79–104. [Google Scholar] [CrossRef]
  28. Zvingilaite, E.; Togeby, M. Impact of Feedback about Energy Consumption; Ea Energy Analyses: Copenhagen, Denmark, 2015. [Google Scholar]
  29. Karlin, B.; Zinger, J.F.; Ford, R. The Effects of Feedback on Energy Conservation: A Meta-Analysis. APA PsycNET 2015, 141, 1205–1227. [Google Scholar] [CrossRef]
  30. Pallak, M.S.; Cummings, N. Commitment and voluntary energy conservation. Pers. Soc. Psychol. Bull. 1976, 2, 27–30. [Google Scholar] [CrossRef]
  31. Seaver, W.B.; Patterson, A.H. Decreasing fuel-oil consumption through feedback and social commendation. J. Appl. Behav. Anal. 1976, 9, 147–152. [Google Scholar] [CrossRef] [PubMed]
  32. Becker, L.J. Joint effect of feedback and goal setting on performance: A field study of residential energy conservation. J. Appl. Psychol. 1978, 63, 428–433. [Google Scholar] [CrossRef]
  33. Becker, L.J.; Seligman, C. Reducing air conditioning waste by signaling it is cool outside. Personal. Soc. Psychol. Bull. 1978, 4, 412–415. [Google Scholar] [CrossRef]
  34. Seligman, C.; Darley, J.M.; Becker, L.J. Behavioral approaches to residential energy conservation. Energy Build. 1978, 1, 325–337. [Google Scholar] [CrossRef]
  35. Battalio, R.C.; Kagel, J.H.; Winkler, R.C.; Winett, R.A. Residential electricity demand: An experimental study. Rev. Econ. Stat. 1979, 61, 180–189. [Google Scholar] [CrossRef]
  36. Bittle, R.G.; Valesano, R.; Thaler, G. The effects of daily feedback on residential electricity usage as a function of usage level and type of feedback information. J. Environ. Syst. 1979, 9, 275–287. [Google Scholar] [CrossRef]
  37. Winett, R.A.; Neale, M.S.; Grier, H.C. Effects of Self-Monitoring and Feedback on Residential Electricity Consumption. J. Appl. Behav. Anal. 1979, 12, 173–184. [Google Scholar] [CrossRef] [PubMed]
  38. Bittle, R.G.; Valesano, R.; Thaler, G. The effects of daily cost feedback on residential electricity consumption. Behav. Modifi. 1979, 3, 187–202. [Google Scholar] [CrossRef]
  39. McClelland, L.; Cook, S.W. Energy conservation effects of continuous in-home feedback in all-electric homes. J. Environ. Syst. 1979, 9, 169–173. [Google Scholar] [CrossRef]
  40. Pallak, M.; Cook, D.; Sullivan, J. Commitment and energy conservation. Appl. Soc. Psychol. Annu. 1980, 1, 235–253. [Google Scholar]
  41. Hayes, S.C.; Cone, J.D. Reduction of residential consumption of electricity through simple monthly feedback. J. Appl. Behav. Anal. 1981, 14, 81–88. [Google Scholar] [CrossRef] [PubMed] [Green Version]
  42. Kasulis, J.J.; Huettner, D.A.; Dikeman, N.J. The feasibility of changing electricity consumption patterns. J. Consum. Res. 1981, 8, 279–290. [Google Scholar] [CrossRef]
  43. Katzev, R.; Cooper, L.; Fisher, P. The effect of feedback and social reinforcement on residential electricity consumption. J. Environ. Syst. 1980, 10, 215–227. [Google Scholar] [CrossRef]
  44. Winett, R.A.; Hatcher, J.W.; Fort, T.R.; Leckliter, I.N.; Love, S.Q.; Riley, A.W.; Fishback, J.F. The effects of videotape modelling and daily feedback on residential electricity conservation, home temperature and humidity, perceived comfort, and clothing worn: Winter and summer. J. Appl. Behav. Anal. 1982, 15, 381–402. [Google Scholar] [CrossRef]
  45. Midden, C.J.H.; Meter, J.F.; Weenig, M.H.; Zieverink, H.J.A. Using feedback, reinforcement and information to reduce energy consumption in households: A field-experiment. J. Econom. Psychol. 1983, 3, 65–86. [Google Scholar] [CrossRef]
  46. Hutton, R.B.; Mauser, G.A.; Filiatrault, P.; Ahtola, O.T. Effects of cost-related feedback on consumer knowledge and consumption behavior: A field experimental approach. J. Consum. Res. 1986, 13, 327–336. [Google Scholar] [CrossRef]
  47. Sexton, R.J.; Sexton, T.A. Theoretical and methodological perspectives on consumer response to electricity information. J. Consum. Affairs 1987, 21, 238–257. [Google Scholar] [CrossRef]
  48. Sexton, R.J.; Johnson, N.B.; Konakayama, A. Consumer response to continuous-display electricity-use monitors in a time-of-use pricing experiment. J. Consum. Res. 1987, 14, 55–62. [Google Scholar] [CrossRef]
  49. Van Houwelingen, J.H.; van Raaij, W.F. The effect of goal-setting and daily electronic feedback on in-home energy use. J. Consum. Res. 1989, 16, 98–105. [Google Scholar] [CrossRef]
  50. Sexton, R.J.; Sexton, T.A.; Wann, J.J.; Kling, C.L. The conservation and welfare effects of information in a time-of-day pricing experiment. Land Econom. 1989, 65, 272–279. [Google Scholar] [CrossRef]
  51. Dobson, J.K.; Griffin, J.D.A. Conservation Effect of Immediate Electricity Cost Feedback on Residential Consumption Behavior. Available online: https://aceee.org/files/proceedings/1992/data/papers/SS92_Panel10_Paper06.pdf (accessed on 15 May 2019).
  52. Nielsen, L.; Jørgensen, K.; Jordal-Jørgensen, J. Elbesparelser i boligsekto-ren – afsluttende rapport. Amternes og kommunernes forskningsinstitut. 1992.
  53. Wilhite, H.; Ling, R.; Untela, A.; Anttila, U.; Arvola, A. A Nordic Test of the Energy Saving Potential of New Residential Saving Techniques; Nordic Council of Ministers: Copenhagen K, Denmark, 1993. [Google Scholar]
  54. Arvola, A.; Uutela, A.; Anttila, U. Billing feedback as means to encourage household electricity conservation: A field experiment in Helsinki. Available online: https://www.eceee.org/library/conference_proceedings/eceee_Summer_Studies/1993/Panel_3/p3_2/ (accessed on 15 May 2019).
  55. Harrigan, S.M.; Gregory, J.M. Do Savings from Energy Education Persist? Alliance to Save Energy: Washington, DC, USA, 1994. Available online: https://aceee.org/files/proceedings/1994/data/papers/SS94_Panel1_Paper09.pdf (accessed on 15 May 2019).
  56. Garay, J.; Lindholm, P. Statistics on the energy bill: Better control for the customer. In Proceedings of the International Energy Program Evaluation Conference, Chicago, IL, USA, 22–25 August 1995. [Google Scholar]
  57. Haakana, M.; Sillanpaeae, L.; Talsi, M. The effect of feedback and focused advice on household energy consumption. In Proceedings of the ECEEE ’97: European Council for an Energy Efficient Economy Summer Study on Energy Efficiency in Buildings, Prague, Czech Republic, 9–13 June 1997. [Google Scholar]
  58. Brandon, G.; Lewis, A. Reducing household energy consumption: A qualitative and quantitative field study. J. Environ. Psychol. 1999, 19, 75–85. [Google Scholar] [CrossRef]
  59. Mansouri, I.; Newborough, M. Dynamics of energy use in UK households: End-use monitoring of electric cookers. In Proceedings of the ECEEE ’99: European Council for an Energy Efficient Economy Summer Study on Energy Efficiency in Buildings, Mandelieu, France, 1–4 June 1999. [Google Scholar]
  60. Wilhite, H.; Høivik, A.; Olsen, J.G. Advances in the use of consumption feedback information in energy billing: The experiences of a Norwegian energy utility. In Proceedings of the ECEEE ’99: European Council for an Energy Efficient Economy Summer Study on Energy Efficiency in Buildings, Mandelieu, France, 1–4 June 1999. [Google Scholar]
  61. Henryson, J.; Hakansson, T.; Pyrko, J. Energy efficiency in buildings through information – Swedish perspective. Energy Policy 2000, 28, 169–180. [Google Scholar] [CrossRef]
  62. Mack, B.; Hallmann, S. Strom sparen in Lummerlund—eine Interventionsstudie in einer Passiv- und Niedrigenergiehaussiedlung. [Conserving electricity in Lummerlund. An intervention study in a passive and low energy house residential area]. Umweltpsychologie 2004, 8, 12–29. [Google Scholar]
  63. Matsukawa, I. The effects of information on residential demand for electricity. Energy J. 2004, 25, 1–17. [Google Scholar] [CrossRef]
  64. Mosler, H.-J.; Gutscher, H. Die Förderung von Energiesparverhalten durch Kombination von instruierter Selbstverbreitung mit Interventionsinstrumenten. [Promoting Energy Conserving Behaviour by Combining Instructed Self-Diffusion with Intervention Instruments]. Umweltpsychologie 2004, 8, 50–65. [Google Scholar]
  65. Kurz, T.; Donaghue, N.; Walker, I. Utilizing a social-ecological framework to promote water and energy conservation: A field experiment. J. Appl. Soc. Psychol. 2005, 35, 1281–1300. [Google Scholar] [CrossRef]
  66. Ueno, T.; Inada, R.; Saeki, O.; Tsuji, K. Effectiveness of Displaying Energy Consumption Data in Residential Houses. Analysis on How the Residents Respond. Proceedings from ECEEE ’05: European Council for an Energy Efficient Economy Summer Study on Energy Efficiency in Buildings. 2005. Available online: https://www.eceee.org/library/conference_proceedings/eceee_Summer_Studies/2005c/Panel_6/6100ueno/ (accessed on 15 May 2019).
  67. Hydro One. The Impact of Real-Time Feedback on Residential Energy Consumption: The Hydro One pilot. Summary. Conducted by Dean Mountain, University Ontario, Canada. 2006. Available online: https://www.reducemyenergy.com/PDF/Summary%20Results%20Hydro%20One%20Pilot%20-%20Real-Time%20Feedback.pdf (accessed on 15 May 2019).
  68. Nexus Energy Software. California Bill Analysis Pilot Final Report. Calmac: San Francisco, CA, USA. Available online: http://www.calmac.org/publications/ca_bill_analysis_pilot_final_04-06es.pdf (accessed on 15 May 2019).
  69. Mountain, D.C. Real-time feedback and residential electricity consumption: British Columbia and Newfoundland and Labrador Pilots. Mountain Economic Consulting: Ontatio, Canada. Available online: http://www.calmac.org/publications/ca_bill_analysis_pilot_final_04-06es.pdf (accessed on 15 May 2019).
  70. Robinson, J. The effect of Electricity-Use Feedback on Residential Consumption: A Case Study of Customers with Smart Meters in Milton, Ontario. Master’s Thesis, University of Waterloo, Waterloo, ON, Canada, 2007. [Google Scholar]
  71. Parker, D.S.; Hoak, D.; Cummings, J. Pilot Evaluation of Energy Savings from Residential Energy Demand Feedback Devices. Florida Solar Energy Center: Cocoa, FL, USA. Available online: http://www.fsec.ucf.edu/en/publications/pdf/FSEC-CR-1742-08.pdf (accessed on 15 May 2019).
  72. van Elburg, H. ESMA-deliverable 6—Report on Effective Customer Feedback Mechanisms. 2008.
  73. Sipe, B.; Castor, S. The net impact of home energy feedback devices. In Proceedings of the IEPEC ’09: International Energy Program Evaluation Conference, Portland, OR, USA, 12–14 August 2009. [Google Scholar]
  74. Gleerup, M.A.; Larsen, S.; Leth-Petersen, M.T. The effect of feedback by SMS-text messages and email on household electricity consumption: Experimental evidence. Energy J. 2010, 31, 113–132. [Google Scholar] [CrossRef]
  75. AECOM. Energy Demand Research Project: Final Analysis. Available online: www.ofgem.gov.uk/ofgem-publications/59105/energy-demand-research-project-final-analysis.pdf (accessed on 15 May 2019).
  76. ISTA. Nyhedsartikel vedrørende feedback undersøgelse i Aachen. 2011.
  77. Schleich, J.M.; Klobasa, M.; Brunner, S.; Gölz, K.; Götz, G. Sunderer. Smart metering in Germany and Austria – results of providing feedback information in a field trial, Fraunhofer. Available online: www.isi.fraunhofer.de/isi-wAssets/docs/e-x/working-pa-pers-sustainability-and-innovation/WP6-2011_smart-metering-in-Germany.pdf (accessed on 15 May 2019).
  78. Rinn, K.; Cook, R.; Stewart, J.; Colby, J.; Mulholland, C.; Khawaja, M.S. Home Energy Report. Pilot Year 3 Evaluation. Available online: http://ilsagfiles.org/SAG_files/Evaluation_Documents/Ameren/AIU%20Evaluation%20Reports%20EPY3/AIU%20Home%20Energy%20Report%20Program%20Evaluation%20PY3.pdf (accessed on 15 May 2019).
  79. Carroll, J.; Lyons, S.; Denny, E. Reducing Electricity Demand through Smart Metering: The Role of Improved Household Knowledge. Available online: www.tcd.ie/Economics/TEP/2013/TEP0313.pdf (accessed on 15 May 2019).
  80. Kofod, C. Fastlæggelse af danske standardværdier for Feedback. 2013.
  81. D’Oca, S.; Corgnati, S.P.; Buso, T. Smart meters and energy savings in Italy: Determining the effectiveness of persuasive communication in dwellings. Energy Res. Soc. Sci. 2014, 3, 131–142. [Google Scholar] [CrossRef]
  82. DENA. Undersøgelse af opvarmningsperioden 2013/2014. 2014.
  83. Nilsson, A.; Bergstad, C.J.; Thuvander, L.; Andersson, D.; Andersson, K.; Meiling, P. Effects of continuous feedback on households’ electricity con-sumption: Potentials and barriers. Appl. Energy 2014, 122, 17–23. [Google Scholar] [CrossRef]
  84. SEAS/NVE (2014): Vind Med nye Elvaner. Slutrapport På Elpristesten. Available online: https://www.sciencedirect.com/science/article/pii/S0306261914000890 (accessed on 15 May 2019).
  85. DECC. Smart Metering Early Learning Project: Domestic Energy Consumption Analysis. Available online: https://assets.publishing.service.gov.uk/government/uploads/system/uploads/attachment_data/file/407542/2_ELP_Domestic_Energy_Consumption_Analysis_Report.pdf (accessed on 15 May 2019).
  86. Lynham, J.; Nitta, K.; Saijo, T.; Tarui, N. Why does real-time information reduce energy consumption? Energy Econom. 2016, 54, 173–181. [Google Scholar] [CrossRef] [Green Version]
  87. Shen, M.; Young, R.; Cui, Q. The normative feedback approach for energy conservation behavior in the military community. Energy Policy 2016, 98, 19–32. [Google Scholar] [CrossRef]
  88. Podgornik, A.; Sucic, B.; Blazic, B. Effects of customized consumption feedback on energy efficient behaviour in low-income households. J. Clean. Prod. 2016, 130, 25–34. [Google Scholar] [CrossRef]
  89. Kendel, A.; Lazaric, N.; Maréchal, K. What do people ‘learn by looking’ at direct feedback on their energy consumption? Results of a field study in Southern France. Energy Policy 2017, 108, 593–605. [Google Scholar] [CrossRef]
  90. Nilsson, A.; Lazarevic, D.; Brandt, N.; Kordas, O. Household responsiveness to residential demand response strategies: Results and policy implications from a Swedish field study. Energy Policy 2018, 122, 273–286. [Google Scholar] [CrossRef]
  91. Gabrielle, W.-P.; Krishnamurti, T.; Gluck, J.; Agarwal, Y. Encouraging energy conservation at work: A field study testing social norm feedback and awareness of monitoring. Energy Policy 2019, 130, 197–205. [Google Scholar]
  92. Mi, L.; Ding, C.; Yang, J.; Yu, X.; Cong, J.; Zhu, H.; Liu, Q. Using goal and contrast feedback to motivate Chinese urban families to save electricity actively—A randomized controlled field trial. J. Clean. Prod. 2019, 226, 443–453. [Google Scholar] [CrossRef]
  93. Marisa, H.L.; Ferraro, P.J.; Kontoleon, A. The behavioural effect of electronic home energy reports: Evidence from a randomised field trial in the United States. Energy Policy 2019, 132, 1256–1261. [Google Scholar]
  94. Kluger, A.N.; DeNisi, A. The effects of feedback interventions on performance: A historical review, a meta-analysis, and a preliminary feedback intervention theory. Psychol. Bull. 1996, 119, 254–284. [Google Scholar] [CrossRef]
  95. Bertoldi, P.; Rezessy, S.; Oikonomou, V. Rewarding energy savings rather than energy efficiency: Exploring the concept of a feed-in tariff for energy savings. Energy Policy 2013, 56, 526–535. [Google Scholar] [CrossRef]
  96. Prasanna, A.; Mahmoodi, J.; Brosch, T.; Patel, M.K. Recent experiences with tariffs for saving electricity in households. Energy Policy 2018, 115, 514–522. [Google Scholar] [CrossRef]
Figure 1. Status of smart meter roll-out in the EU-28 (JRC, 2019).
Energies 12 03788 g001
Figure 2. Types of feedback and information provided.
Energies 12 03788 g002
Figure 3. Breakdown of 127 feedback applications by main determinant factors.
Energies 12 03788 g003aEnergies 12 03788 g003b
Figure 4. Number of studies and statistical analysis of energy savings, per type of energy end-use, and geographical zone (based on 107 out of 114 feedback applications).
Energies 12 03788 g004
Figure 5. Number of studies and statistical analysis of energy savings, per type of end-use, and feedback (based on 114 out of 114 feedback applications).
Energies 12 03788 g005
Figure 6. Number of studies and statistical analysis of energy savings, per type of end-use, and period of the study (based on 114 out of 114 feedback applications).
Energies 12 03788 g006
Figure 7. Number of studies and statistical analysis of energy savings, per type of feedback, and medium (based on 113 out of 114 feedback applications).
Energies 12 03788 g007
Figure 8. Number of studies and statistical analysis of energy savings, per type of feedback, and interaction frequency (based on 107 out of 114 feedback applications). The “Other” category includes daily and mixed frequencies.
Energies 12 03788 g008
Figure 9. Number of studies and statistical analysis of energy savings associated to feedback, per type of feedback, and duration (based on 113 out of 114 feedback applications).
Energies 12 03788 g009
Table 1. Combinations of determinants used to provide statistics on energy savings associated to feedback strategies.
Determinant 1Determinant 2Number of Applications
End-use (i.e., electricity, heating, and both)Geographical zone (i.e., Europe and North America)107 out of 114
End-use (i.e., electricity, heating, and both)Feedback type (i.e., direct and indirect)114 out of 114
End-use (i.e., electricity, heating, and both)Period of the study (i.e., before 1990, between 1990–2010, after 2010)114 out of 114
Feedback type (i.e., direct and indirect)Medium type (i.e., IHD, bill, mail, PC or web, cards, and mixed modes)113 out of 114
Feedback type (i.e., direct and indirect)Interaction frequency (continuous, 1–4 times per week, monthly, 2–6 months, and other)107 out of 114
Feedback type (i.e., direct and indirect)Duration (i.e., less than 3 months, between 3 and 12 months, more than 12 months)113 out of 114
Table 2. Summary of average, minimum, and maximum energy savings related to feedback strategies. Statistics are not provided for categories represented by less than 3 applications.
Geo ZoneEnergy End-UseFeedback TypeNumber of ApplicationsAverage Energy SavingMin Energy SavingMax Energy Saving
EuropeElectricityDirect189%0%23%
Indirect244%–2%14%
Electricity and HeatingDirect<3n.a.n.a.n.a.
Indirect75%3%10%
HeatingDirect94%0%12%
Indirect135%0%14%
North AmericaElectricityDirect129%3%18%
Indirect146%1%16%
Electricity and HeatingDirect412%1%17%
Indirect410%1%19%
HeatingDirect<3n.a.n.a.n.a.
Indirect<3n.a.n.a.n.a.

