1. Introduction
Europe’s offshore wind resources cannot be fully exploited without the development of the necessary electrical infrastructure to connect offshore wind farms (OWFs) and onshore networks. Until now, only a few OWFs export their production through HVDC, while the majority are connected via traditional HVAC [
1]. However, the amount of HVDC-connected OWFs is widely expected to increase, as the size and distance from shore of new OWFs increase, and the associated costs decrease [
2,
3].
HVDC transmission technology using voltage source (forced-/self-commutated) converters (VSCs), based on insulated-gate bipolar transistors, has undergone remarkable development since its introduction in 1997 [
4]. Such technology still faces costs and losses higher than those associated with the more common, mature one employing (phase-controlled) line-commutated converters, based on thyristors (in a current source converter topology), which are largely employed for bulk power transmission [
3,
5]. Nevertheless, VSC-based HVDC transmission (VSC-HVDC) offers advantages such as fast reversibility of active power flow, independent control of active and reactive power, smaller footprints, and the (grid-forming) capability to form AC networks, i.e. to control their AC-side voltage magnitude and frequency (which allows them to operate without the need of a strong AC grid) [
4]. Because of such advantages, the use of VSC-based offshore HVDC terminals has made it possible to develop HVDC-connected OWFs with the prevailing grid-following approach to controlling wind turbines (WTs), in which WTs rely on other (grid-forming) units (e.g. VSC-based offshore HVDC terminals) forming their AC network [
1].
Recently put forward, (uncontrolled, line-commutated) diode rectifiers (DRs) have elicited increasing interest from both industry and academia as a feasible alternative for connecting OWFs to HVDC networks [
6,
7,
8,
9,
10,
11]. DR-based offshore HVDC terminals offer advantages such as lower costs, higher efficiency, smaller footprints and higher reliability [
8,
10]. However, since diodes are passive devices, such offshore HVDC terminals are inherently devoid of the grid-forming capability of VSCs. WTs have therefore been suggested as feasible candidates to take over such duty. This entails fundamentally different WT and WF controls, changing their control approach from that of grid-following units to that of grid-forming units [
6,
9].
HVDC-connected OWFs and the corresponding HVDC power transmission networks can be required to contribute to the secure operation of the onshore AC networks connected to them by means of e.g., fault ride-through, black start and restoration, reactive power/alternating voltage control, active power/frequency control and rotor angle stability-related control. Rotor angle stability-related control can include avoiding loss of synchronism and damping electromechanical oscillations, also known as
power oscillation damping (POD) [
3,
12]. The capabilities of VSC-HVDC-connected OWFs and the corresponding HVDC power transmission networks to provide such services are well established. However, more studies are needed to assess the actual capabilities of DR-connected OWFs to contribute in the provision of such services before such technology is deployed [
12,
13].
The impact of AC-connected WFs on power oscillations has been reviewed in [
14], where focus has been given to the contribution or damping of the oscillations, and to the resulting oscillations inside the WTs. By considering the full layout of the collector grid and individual representation of the WTs in such a WF, the impact of the controls in each WT on oscillatory modes has been assessed in [
15], and it has been shown that park level control is possible and that the level of WF model aggregation has a limited impact on the resulting damping. Recommendations have been given in [
16] for selecting the best input–output signal pair for the provision of POD by such WFs, based on a comparison of different analysis techniques that considers both controllability, observability and input-output interactions. In [
17], the implementation of POD controls on VSC-HVDC-connected OWFs has been studied, design guidelines have been derived for the corresponding controllers, the effect of voltage regulators has been analysed, and other practical implementation aspects have been discussed. In [
18], it has been shown for such OWFs that supplementary controls in the VSC-based onshore terminal alone can result in undesirable voltage variations in the onshore ac network and that modulation of the OWF active power output alone can be inadequate due to the limited overloading capability of the WTs, and a decentralised coordinated controller has been proposed to overcome such limitations.
The present study assessed the actual capability of an OWF to provide POD to an onshore AC network by means of active power modulation, when connected through an HVDC link having a DR-based offshore terminal and a VSC-based onshore terminal. The study also examined the compatibility of corresponding higher-level controls previously devised for VSC-HVDC-connected OWFs [
17]. Through such controls, the OWF modifies its active power output according to the onshore frequency signals directly communicated to it. Any contribution of the onshore HVDC terminal in the provision of POD is outside the scope of the study, as are also the impact and benefits of such service on the onshore synchronous area stability.
Previous work [
19] consisted of closed-loop tests using models and grid-forming WT front-end converter (FEC) controls based on those in [
6,
7,
8], and a single-turbine aggregated representation of the OWF. Such controls rely on communication for a centralised control of the offshore AC network voltage and do not deal with the synchronisation of the WT FECs, whereas the single-turbine aggregated OWF model does not provide enough insight into the dynamics within the OWF.
This work extended the analysis to both open- and closed-loop tests using more detailed models based on those in [
20] and a semi-aggregated representation of the OWF. Such OWF representation provides insight into the dynamics of the WTs within a string by representing them in detail, while keeping reasonable simulation times. The contemplated distributions of aerodynamic power from the wind available to each WT frame the study in more realistic operating conditions. The open-loop tests facilitate the evaluation of the WF’s compliance with the corresponding connection requirements for the provision of POD. Moreover, the considered grid-forming WT FEC controls are based on those in [
11], which rely solely on local measurements and enable the synchronisation of the WT FECs by means of a distributed phase-locked-loop-based (PLL-based) frequency control algorithm.
Results of the performed dynamic simulations for the different operating conditions corroborate that such an OWF can provide POD by means of OWF active power controls similar to those developed for OWFs connected to HVDC via VSCs, while its grid-forming WTs share the reactive power consumption/production and keep the offshore frequency and voltages within their normal operating ranges. The results of the closed-loop tests show that the damping of onshore power oscillations can be increased by having DR-connected OWFs employ such strategies to modulate their active power output in response to the onshore signals directly communicated to them. The results of the open-loop tests show that such capability can, however, be restricted at operating points corresponding to the lowest and highest values of active power output.
The rest of the paper is organised as follows. In
Section 2, the investigated system is described and the main control algorithm is detailed. In
Section 3, some of the considered cases are described, and corresponding simulation results are presented and discussed. Finally, concluding remarks are made in
Section 4.
2. Modelling and Control
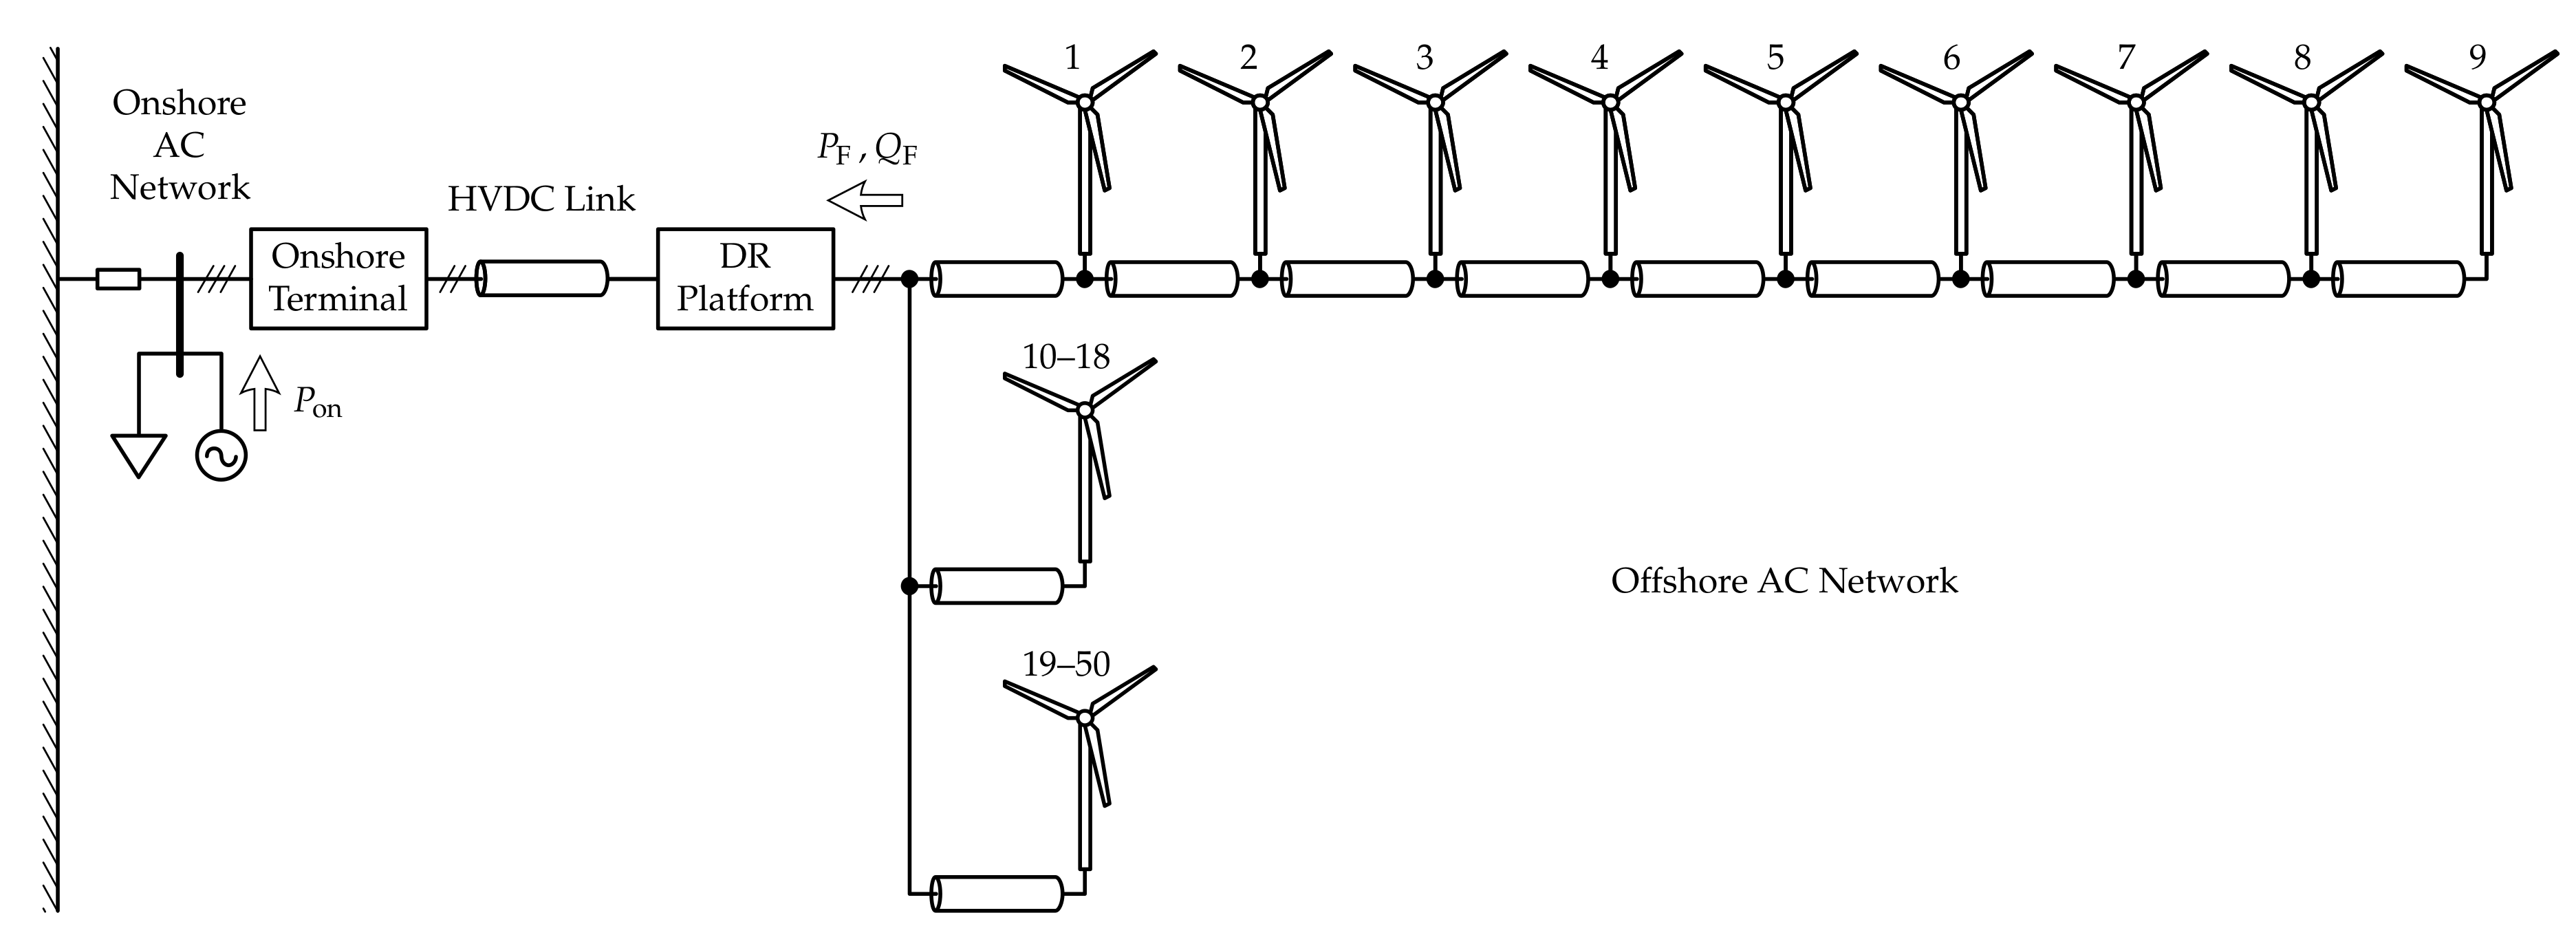
Figure 1 shows an overview of the studied system. The system is based on that described in [
13,
20] and consists of a 400 MW WF connected to an onshore AC network by means of a monopolar HVDC link. Balanced/symmetric operation is assumed. The onshore AC network is represented by a lumped three-phase 1200 MW synchronous machine (SM) with its governor, turbine, exciter and automatic voltage regulator (AVR), and a lumped three-phase 80 MW resistive load, connected to an infinite bus through a transmission line. The corresponding SM and transmission line parameters have been set in a reasonable way, so as to achieve oscillations with frequencies around 1
. The share of wind power generation at the connection point is 25%, i.e., the WF is rated at 400 MW, for a total installed capacity at the connection point of 1600 MW. The VSC-based onshore HVDC terminal controls the voltage on its DC terminals and the reactive power injected into the onshore AC network. The offshore HVDC terminal, labelled in
Figure 1 as
DR Platform, consists of two (uncontrolled, line-commutated) diode-based 12-pulse rectifiers (DRs) connected in series, with corresponding reactive power compensation and filter bank on their AC side.
The WF has 50 type-4 (full-converter) 8 MW WTs, laid out in six strings. The first string is comprised of WTs 1–9, which are represented in detail. The second string, consisting of WTs 10–18, is aggregated into an equivalent 72 MW WT and corresponding cable equivalent
circuit using the method proposed in [
21]. Likewise, the other four strings, comprising WTs 19–50, are aggregated into an equivalent 256 MW WT and corresponding cable equivalent
circuit.
For computational efficiency, dynamics in the WT DC link and behind it are not considered, and its voltage is thus assumed constant (ideally regulated by the back-end/machine-side converter). Pulse width modulation (PWM) is assumed to be done in the linear range, switching effects and any delay due to implementation of the PWM are neglected, and average value models are used to represent all VSCs. Focus is given to dynamics not faster than the VSC (inner/lower) current control loops, the fastest of which are designed to have a bandwidth of 200 Hz.
2.1. Wind Turbine Front-End Converter Controls
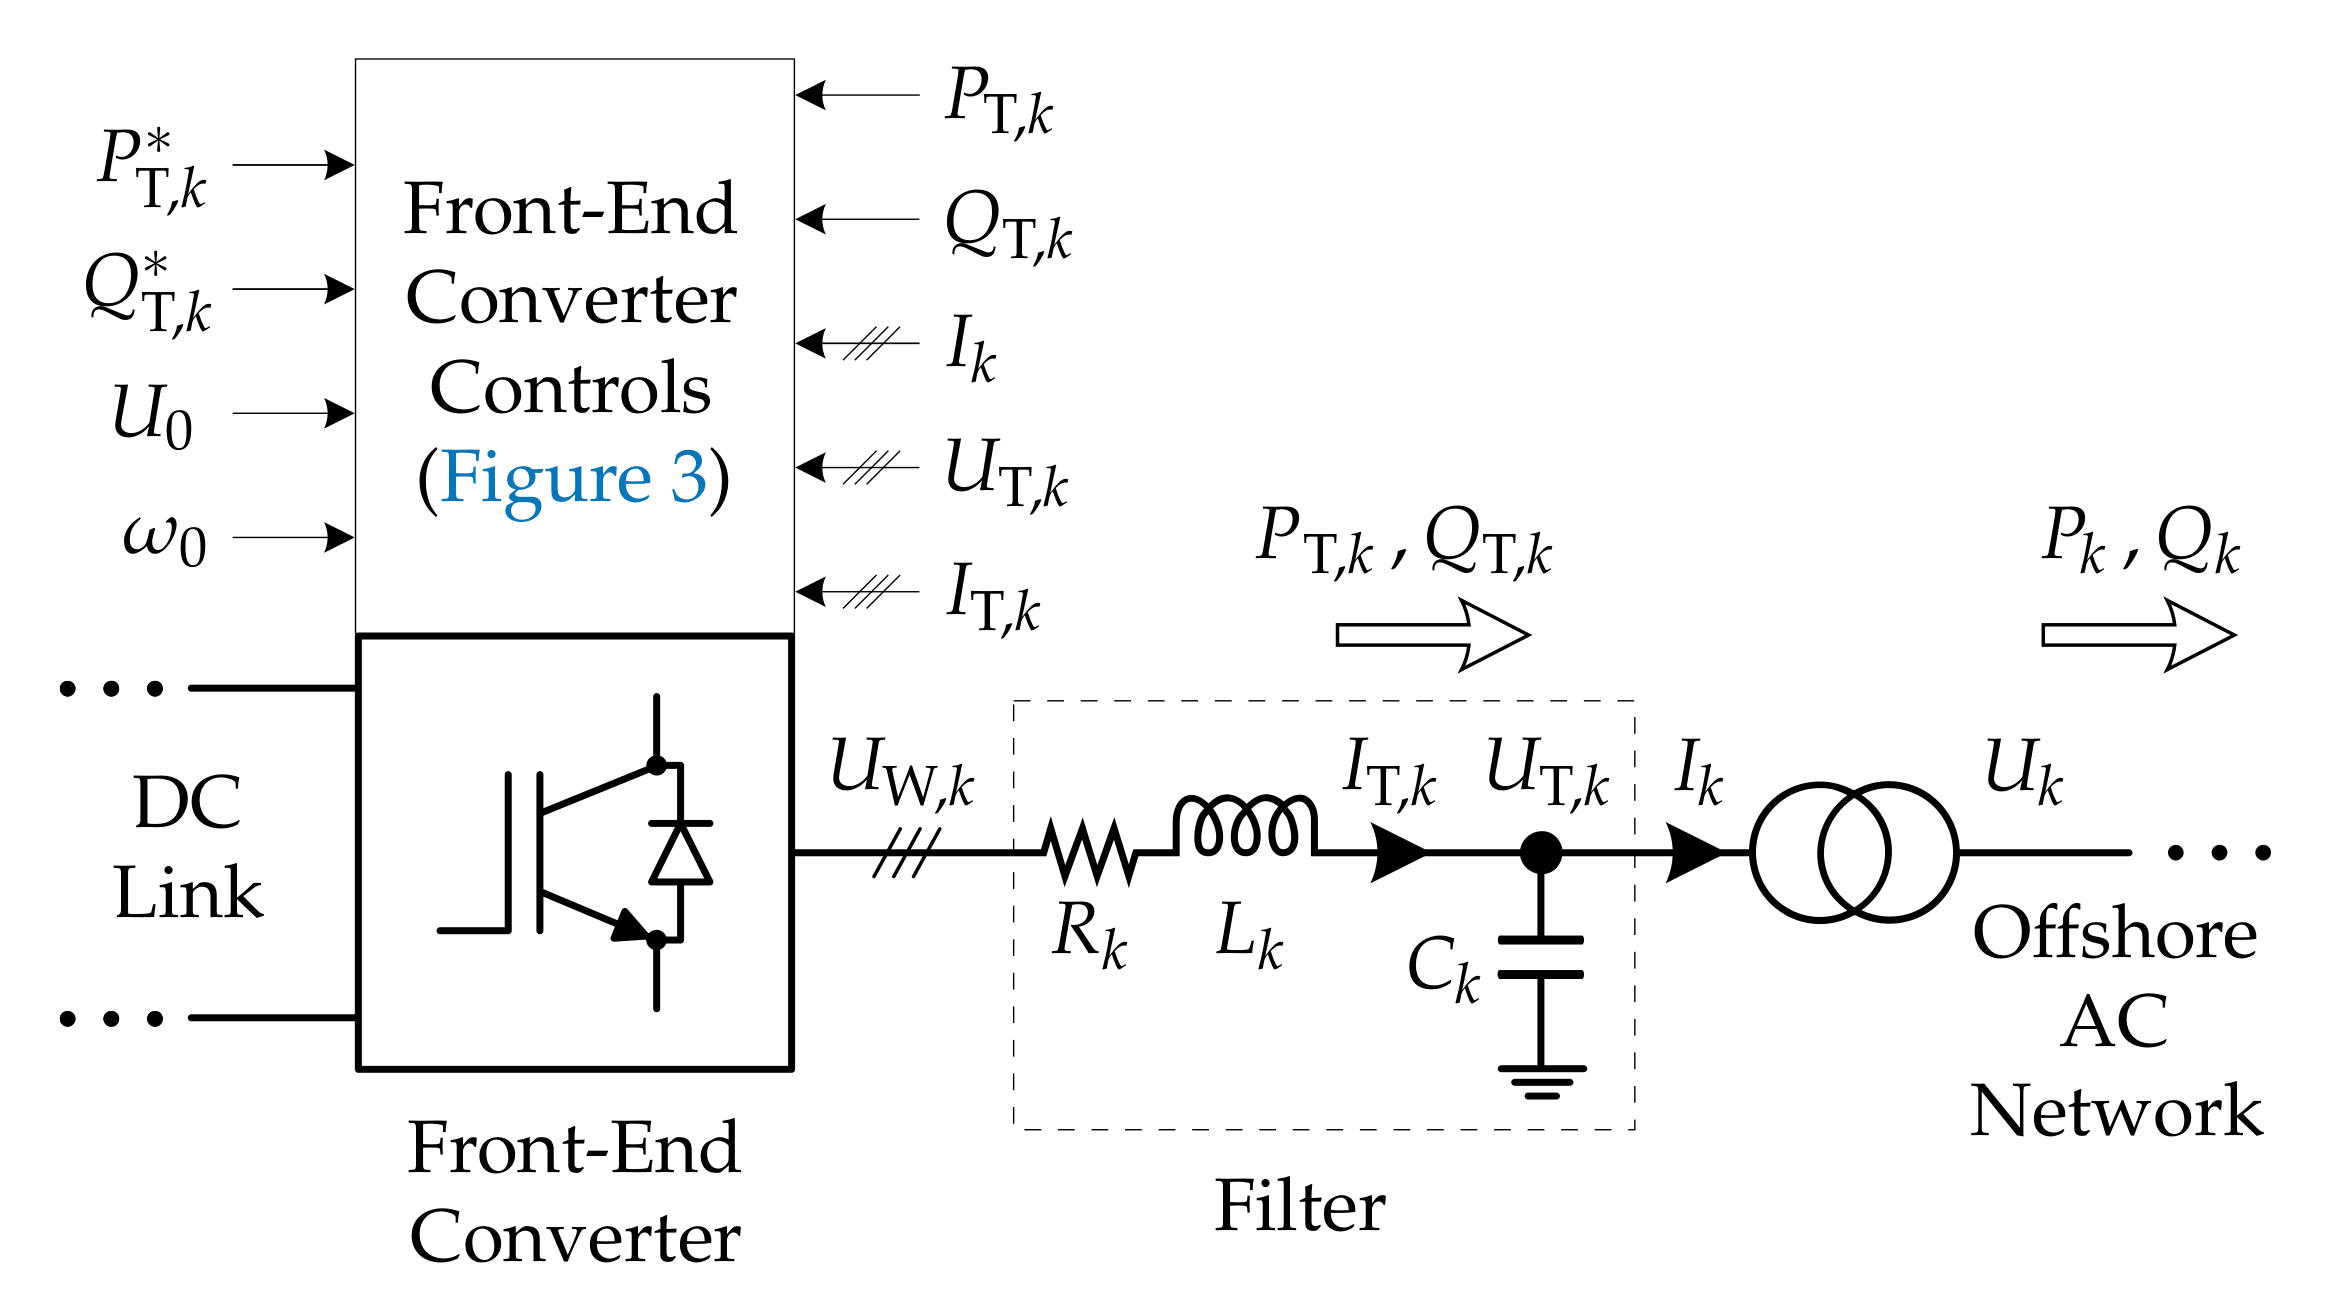
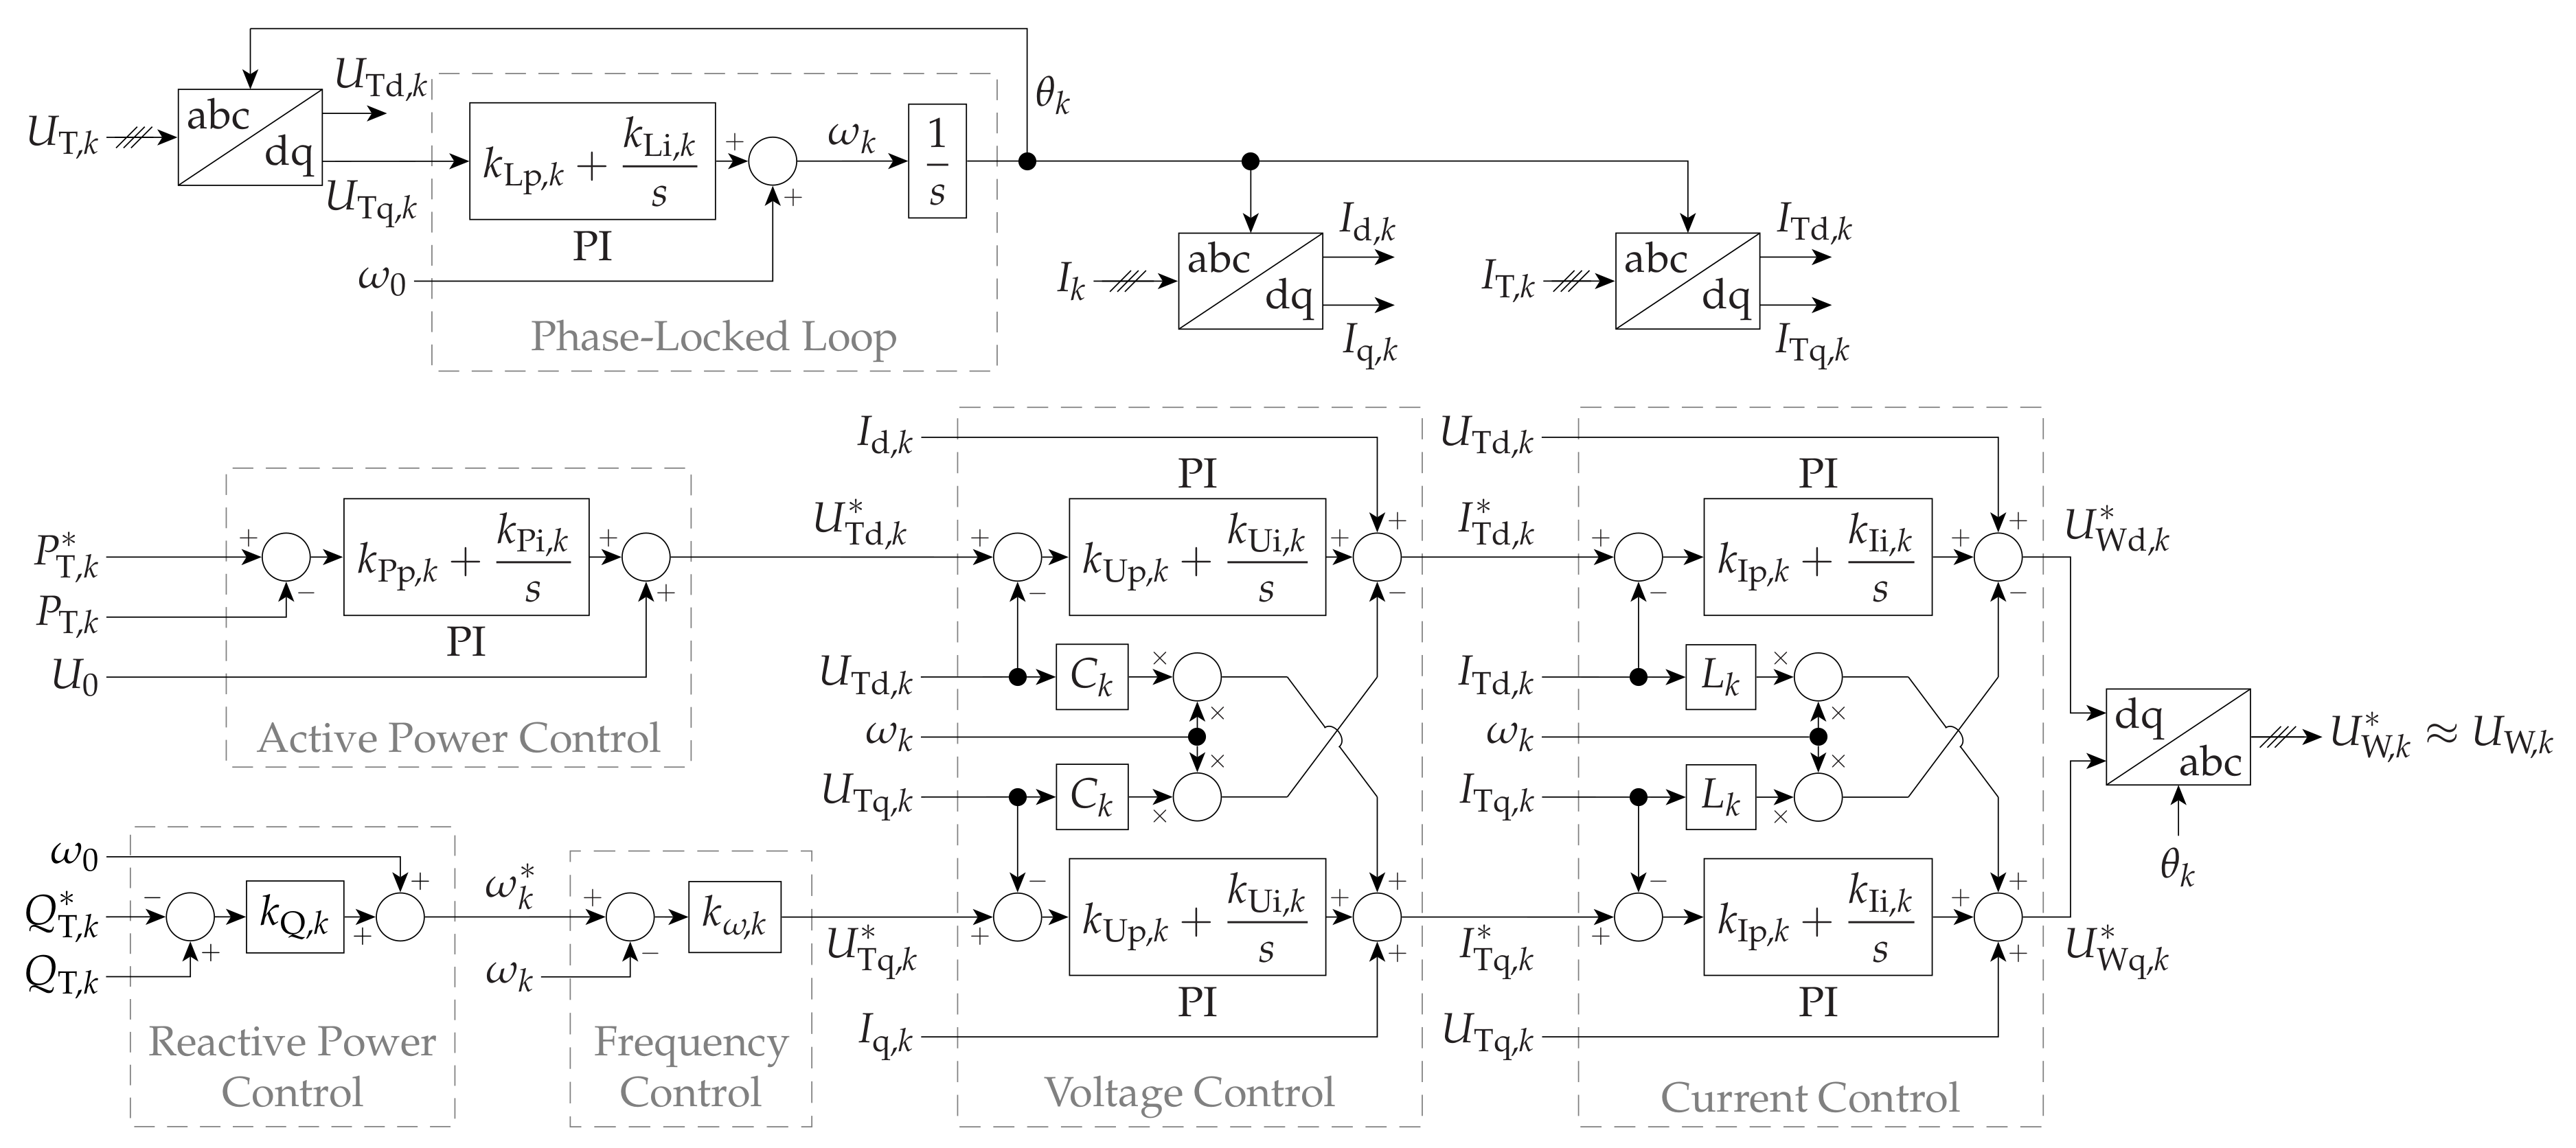
The front-end (line-side) network in the
kth wind turbine(s), WT
, is shown in
Figure 2, while
Figure 3 depicts the corresponding FEC controls. Such controls are based on those proposed in [
11] and are implemented on a rotating reference frame (RRF) oriented on the voltage at the filter capacitor,
.
In each WT front-end network, the filter capacitor voltage direct (d) and quadrature (q) axis components, and , respectively, are regulated by the FEC lower/inner cascaded current and voltage control loops to follow the corresponding references, , respectively, while keeping the FEC output current, , within its limits. consists of two components: the offshore AC network voltage set point, , common to all WTs, and a component individual to each WT, which is altered to control the FEC active power output, . In an additional control loop based on the FEC PLL, a proportional (P) controller manipulates to regulate the FEC (angular) frequency, . The reference to such additional loop, , also consists of two components: the offshore AC network (angular) frequency set point, , common to all WTs, and a component individual to each WT, which is altered to control the FEC reactive power output, . When the WF is exporting power, the FEC upper/outer control loops in each WT regulate and as follows. A proportional-integral (PI) controller regulates to follow the corresponding reference, , whereas is controlled by a P regulator (reactive-power-frequency droop) with a given reference, , so that the reactive power is shared among WT FECs (avoiding overcurrents and reactive current circulation).
2.2. Wind Farm Active Power Control
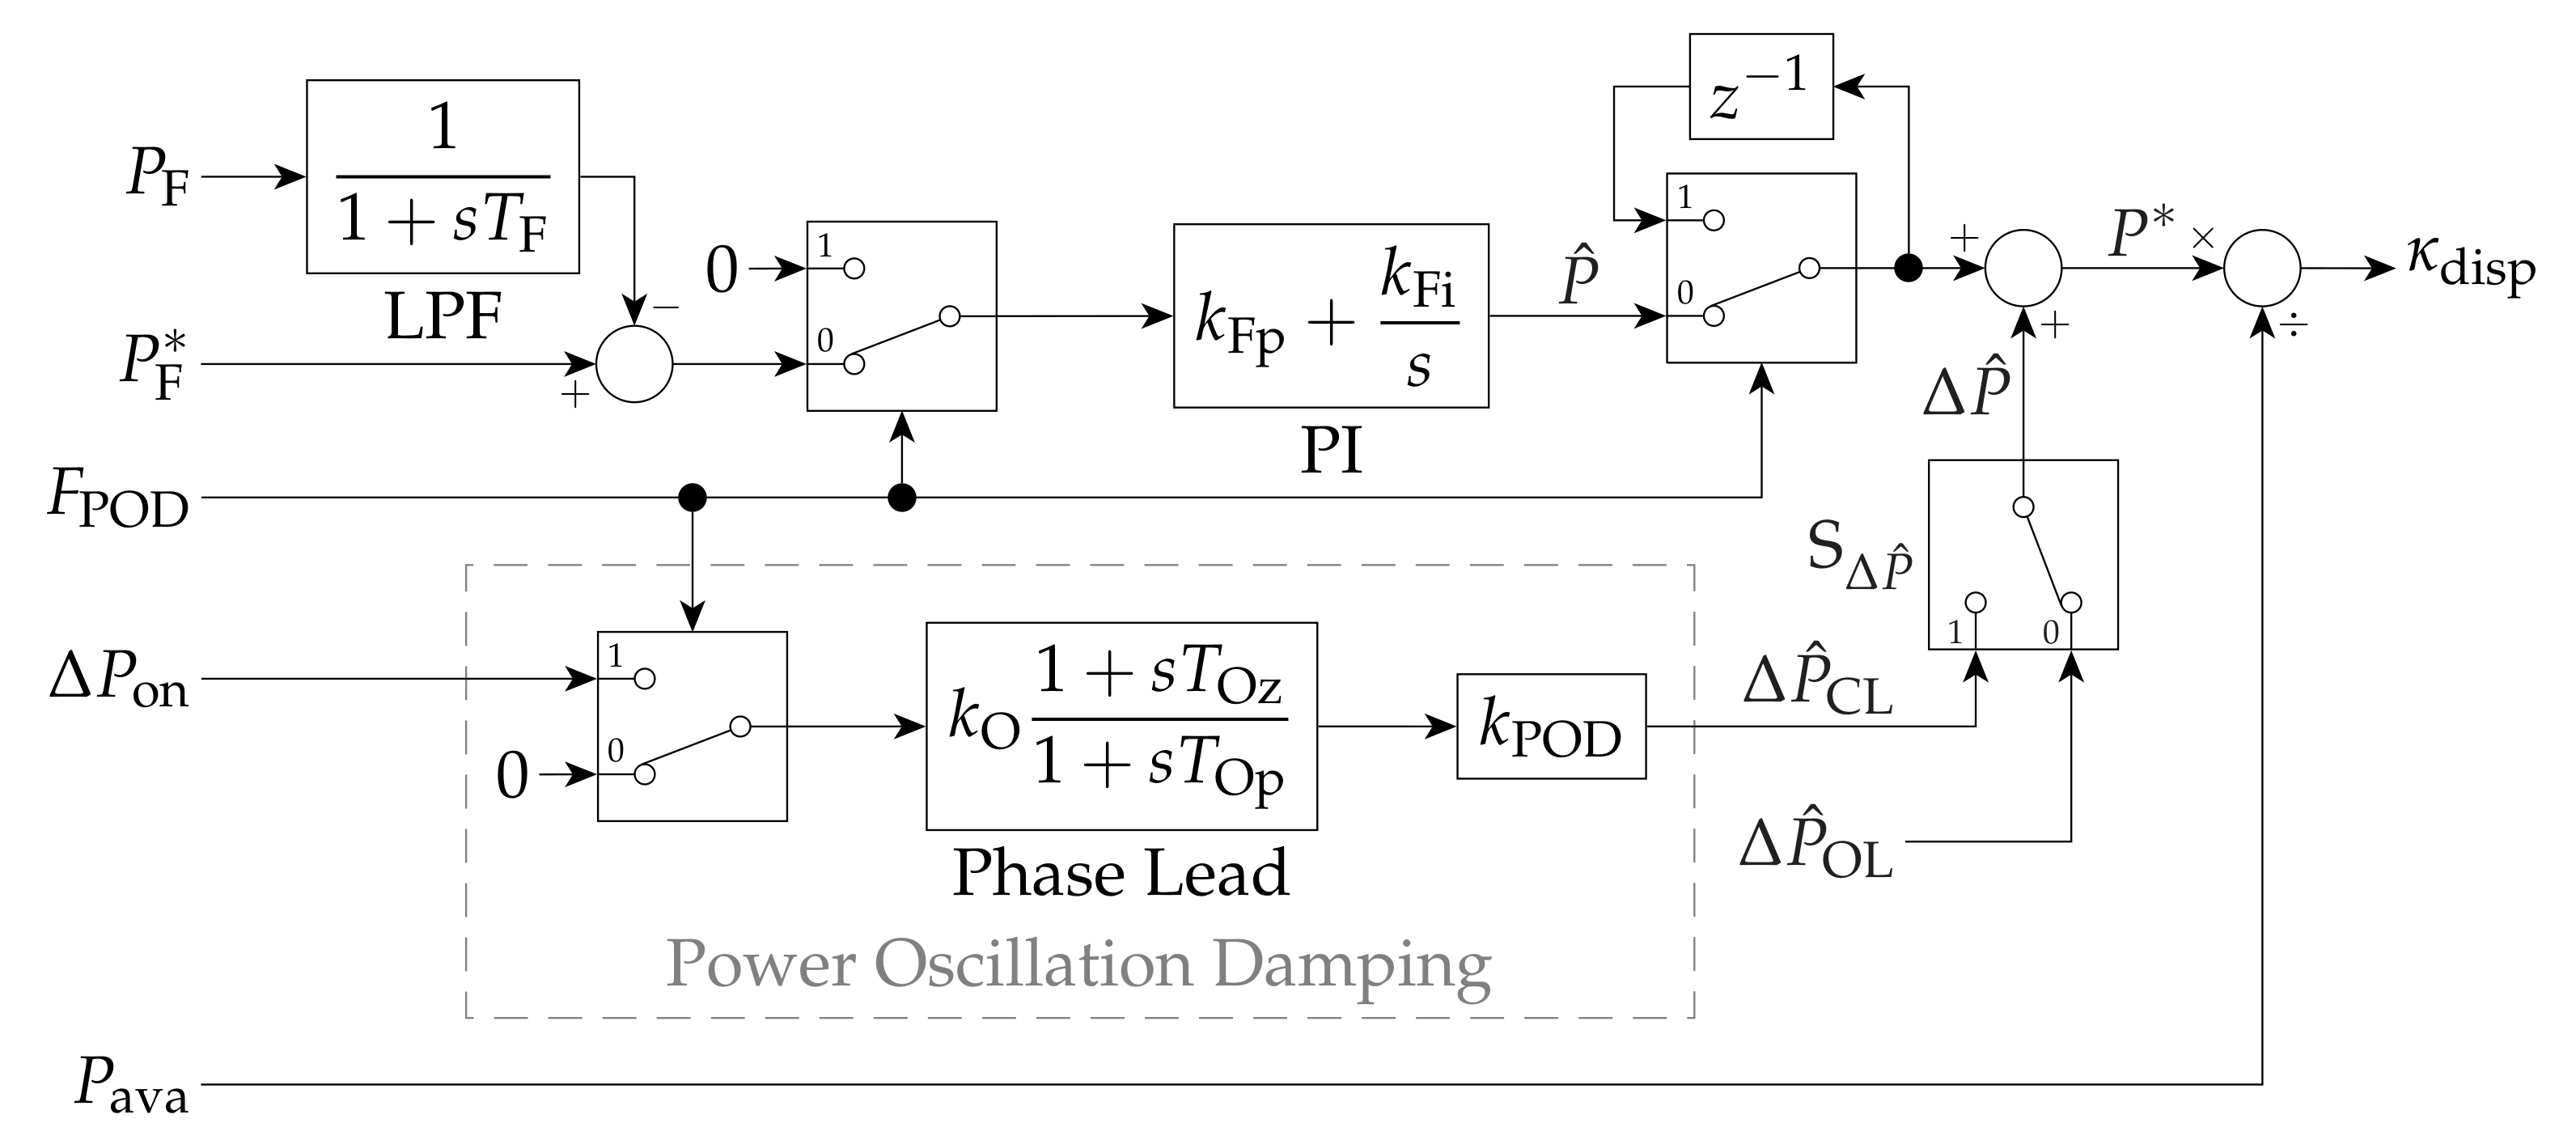
To study the capability of such a WF to provide POD to an onshore AC network, the model is extended to include the supervisory active power control (APC) at plant level shown in
Figure 4, based on that proposed in [
17] for OWFs connected to HVDC via VSCs. In normal operation, the PI regulator alters the WF active power dispatch,
, so as to have the WF active power output,
, follow its reference,
. A first-order low-pass filter (LPF) is applied to the corresponding measurement signal. Hardware and control limits are modelled by means of corresponding restrictions on the regulator output value,
, and its rate of change,
. Proportional WF generation dispatch is used. In doing so,
is divided by the overall aerodynamic power available from the wind,
, to generate the WF active power dispatch coefficient,
. The active power set point of each WT is then set as the product of the corresponding aerodynamic power available from the wind,
, and the active power dispatch coefficient, i.e.,
.
The coordinator of the WF and offshore transmission system (WF-OTS coordinator) and/or the system operator are assumed to calculate and monitor the active power flowing from the SM into the corresponding onshore bus, , from the alternating voltage and current measured at the SM terminals. The WF-OTS coordinator and/or the system operator are also assumed to detect onshore power oscillations, generate a corresponding signal (in per unit, on the WF base), , and send it to the WF with a delay of 100 ms, together with the activation of a flag, .
Upon the activation of
, the controller switches to POD control mode. In such mode,
is frozen, and an additional oscillatory/modulating (active) power signal,
, is superimposed,
. Since
does not entail an additional net energy delivery to the onshore AC network, no preventively curtailed operation has been considered in the corresponding studies. The WTs are thus briefly overloaded during the positive semi-period of
and recover their speed during its negative semi-period. In POD control mode, the restrictions imposed on the rate of change of
are considered to be less stringent than those usually imposed by the WTs. This is necessary for POD to be provided with a certain minimum performance [
17,
19].
When evaluating the WF’s compliance with grid code requirements for the provision of POD, input port 0 is selected in switch
, so that
is determined by an external sinusoidal signal generated in accordance with the requirements,
, where
is the frequency of such external modulating signal [
13,
22]. When providing POD to the onshore AC network, input port 1 in switch
is selected, so that
is based on
,
. In this way, the WF modulates its active power output so as to produce damping torque: an electrical torque component in phase with the SM speed deviation,
, increasing the decay rate of the oscillations as a result. The corresponding phase lead compensator provides the necessary phase shift (around 90) to align
with
(and thus with the damping torque). The gain
regulates the magnitude of the control action. Values for the wind farm active power control parameters and limits are given in
Table A1.
3. Simulation Results
Results of the performed dynamic simulations are presented in
Figure 5,
Figure 6,
Figure 7,
Figure 8,
Figure 9,
Figure 10,
Figure 11,
Figure 12 and
Figure 13. The results illustrated in
Figure 5,
Figure 6,
Figure 7,
Figure 8,
Figure 9 and
Figure 10 correspond to the open-loop tests, discussed in
Section 3.1, whereas those depicted in
Figure 11,
Figure 12 and
Figure 13 correspond to the closed-loop tests, discussed in
Section 3.2.
Table 1 details the wind speed scenarios considered in the simulations. The results corresponding to the medium wind speed scenario are similar to those corresponding to the medium-low wind speed scenario and are thus omitted. Wind speed (and the aerodynamic power available from it) was considered constant in each simulation. The considered individual WT operating points in
Table 1 take into account the wind speed deficit due to the aerodynamic interaction between WTs. In principle,
decreases along the string in the wind speed direction [
23].
All (equivalent) WT front-end networks and corresponding converter controls have the same parameter per-unit (
) values. Moreover,
,
and
for all of them. The wind farm active power control parameters and limits used in the simulations are given in
Table A1. No minimum limit above zero production (as given in [
13]) was imposed on the WF, so as to study the WF response also at operating points near zero production. The onshore HVDC terminal kept the HVDC link voltage close to the corresponding set point throughout all simulations.
3.1. Open-Loop Tests
Results of the open-loop tests are shown in
Figure 5,
Figure 6,
Figure 7,
Figure 8,
Figure 9 and
Figure 10. In such tests,
was active and input port 0 was selected in switch
in the WF APC (
Figure 4), so that the APC was in POD control mode and the WF modulated its active power output according to
.
at the beginning of each simulation but changes shortly afterwards to
.
is given by the wind speed scenario (
Table 1), whereas the two extreme values given in [
13,
22] for
were considered.
Figure 5,
Figure 6 and
Figure 7 correspond to
, whereas
Figure 8,
Figure 9 and
Figure 10 correspond to
.
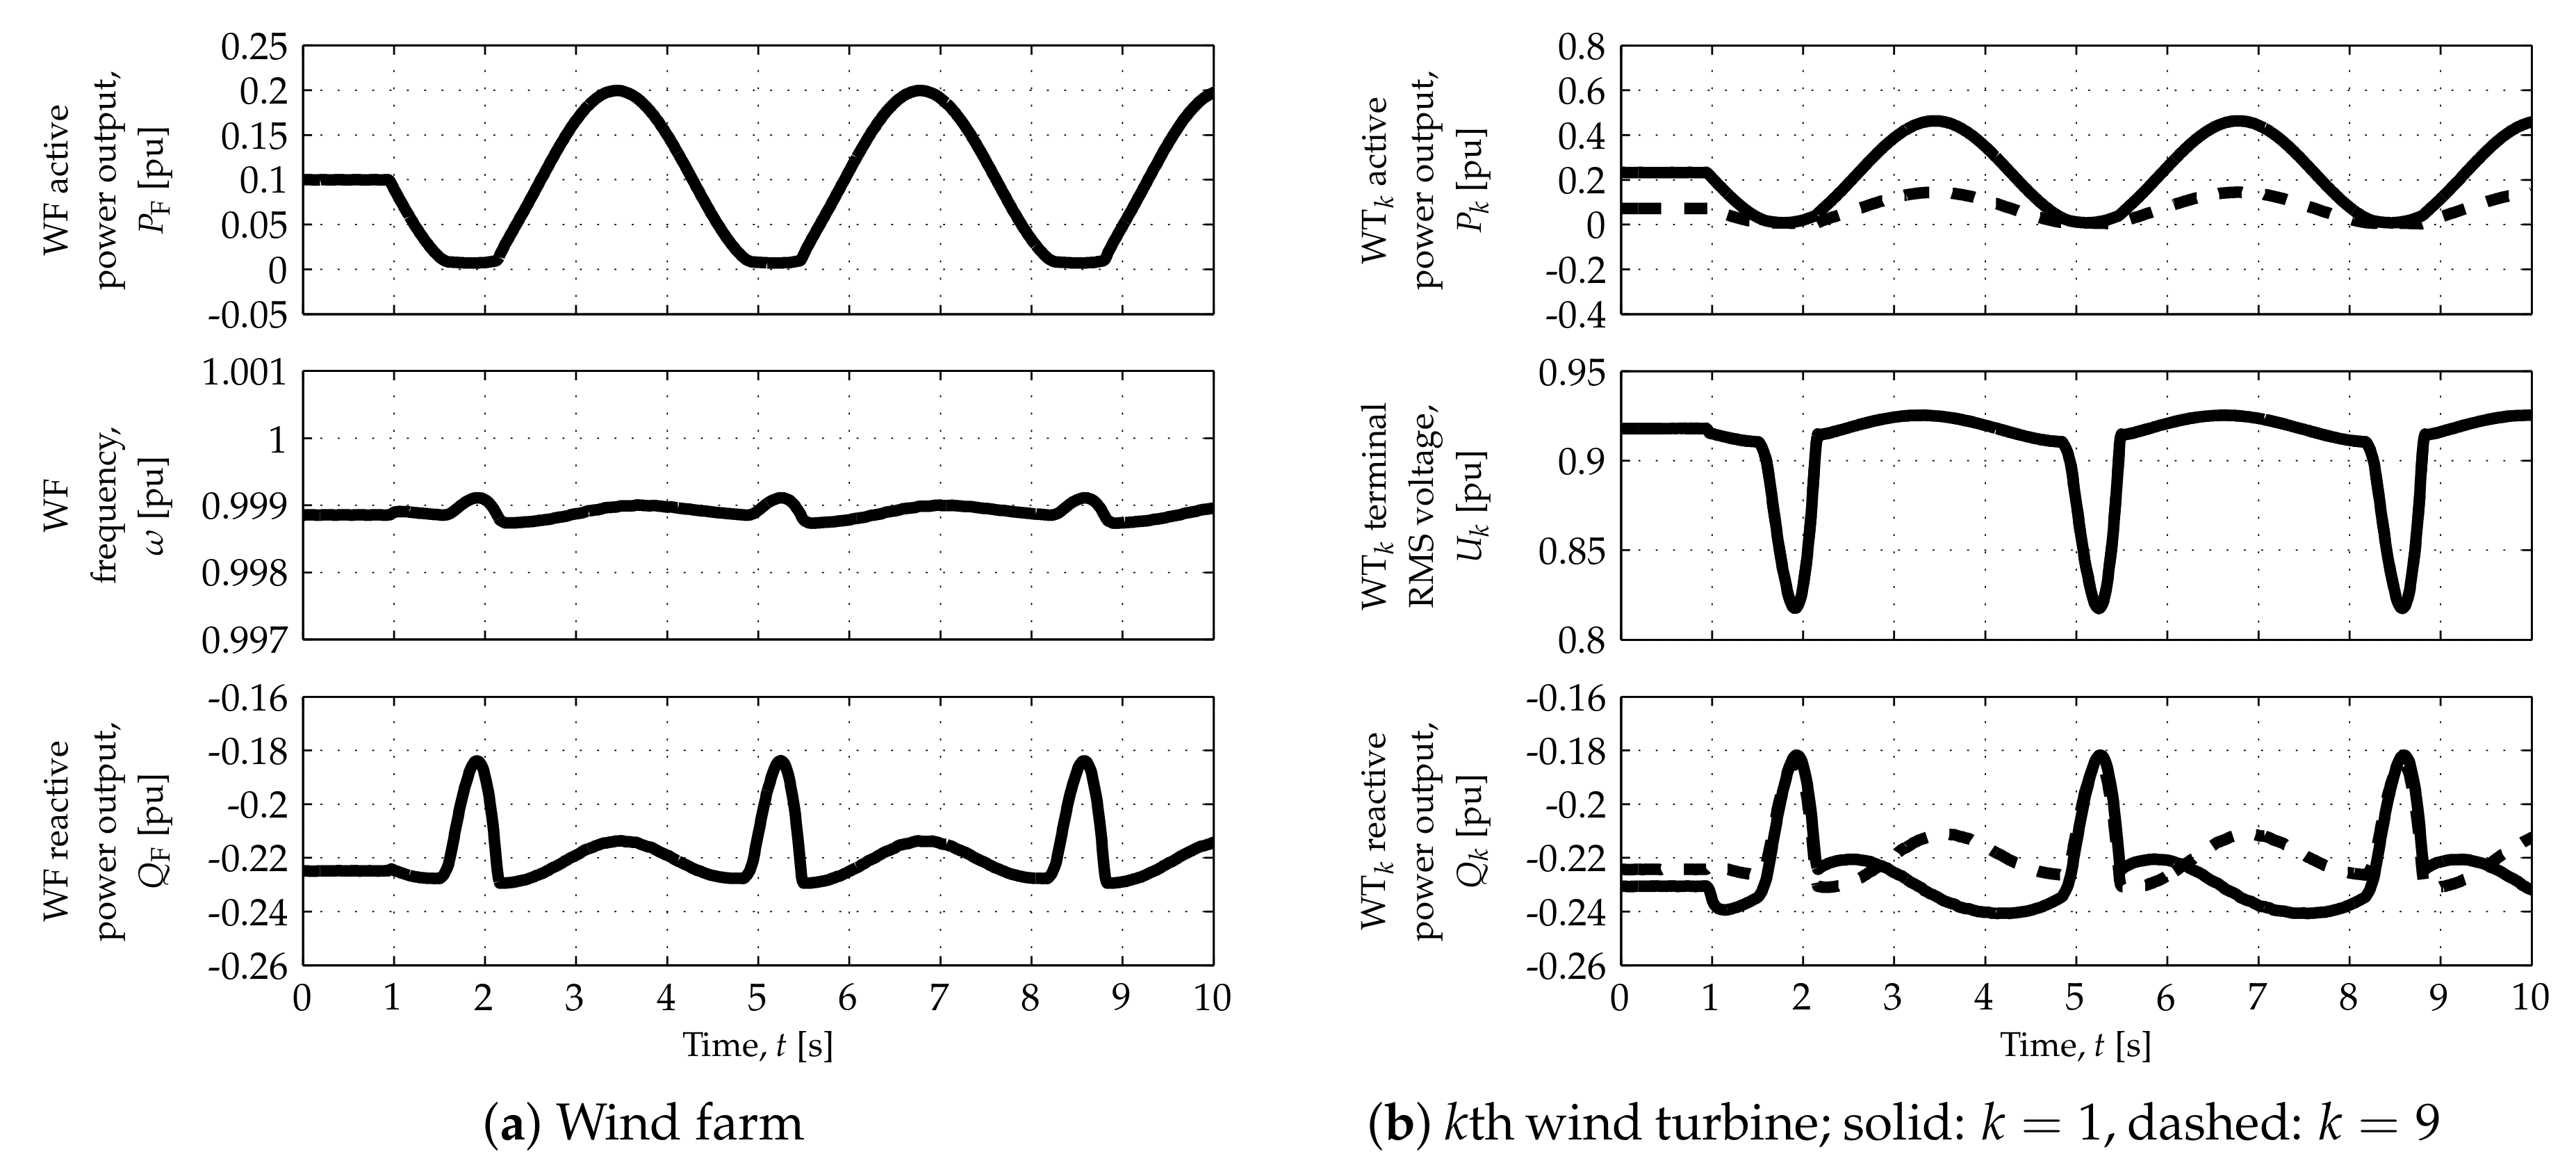
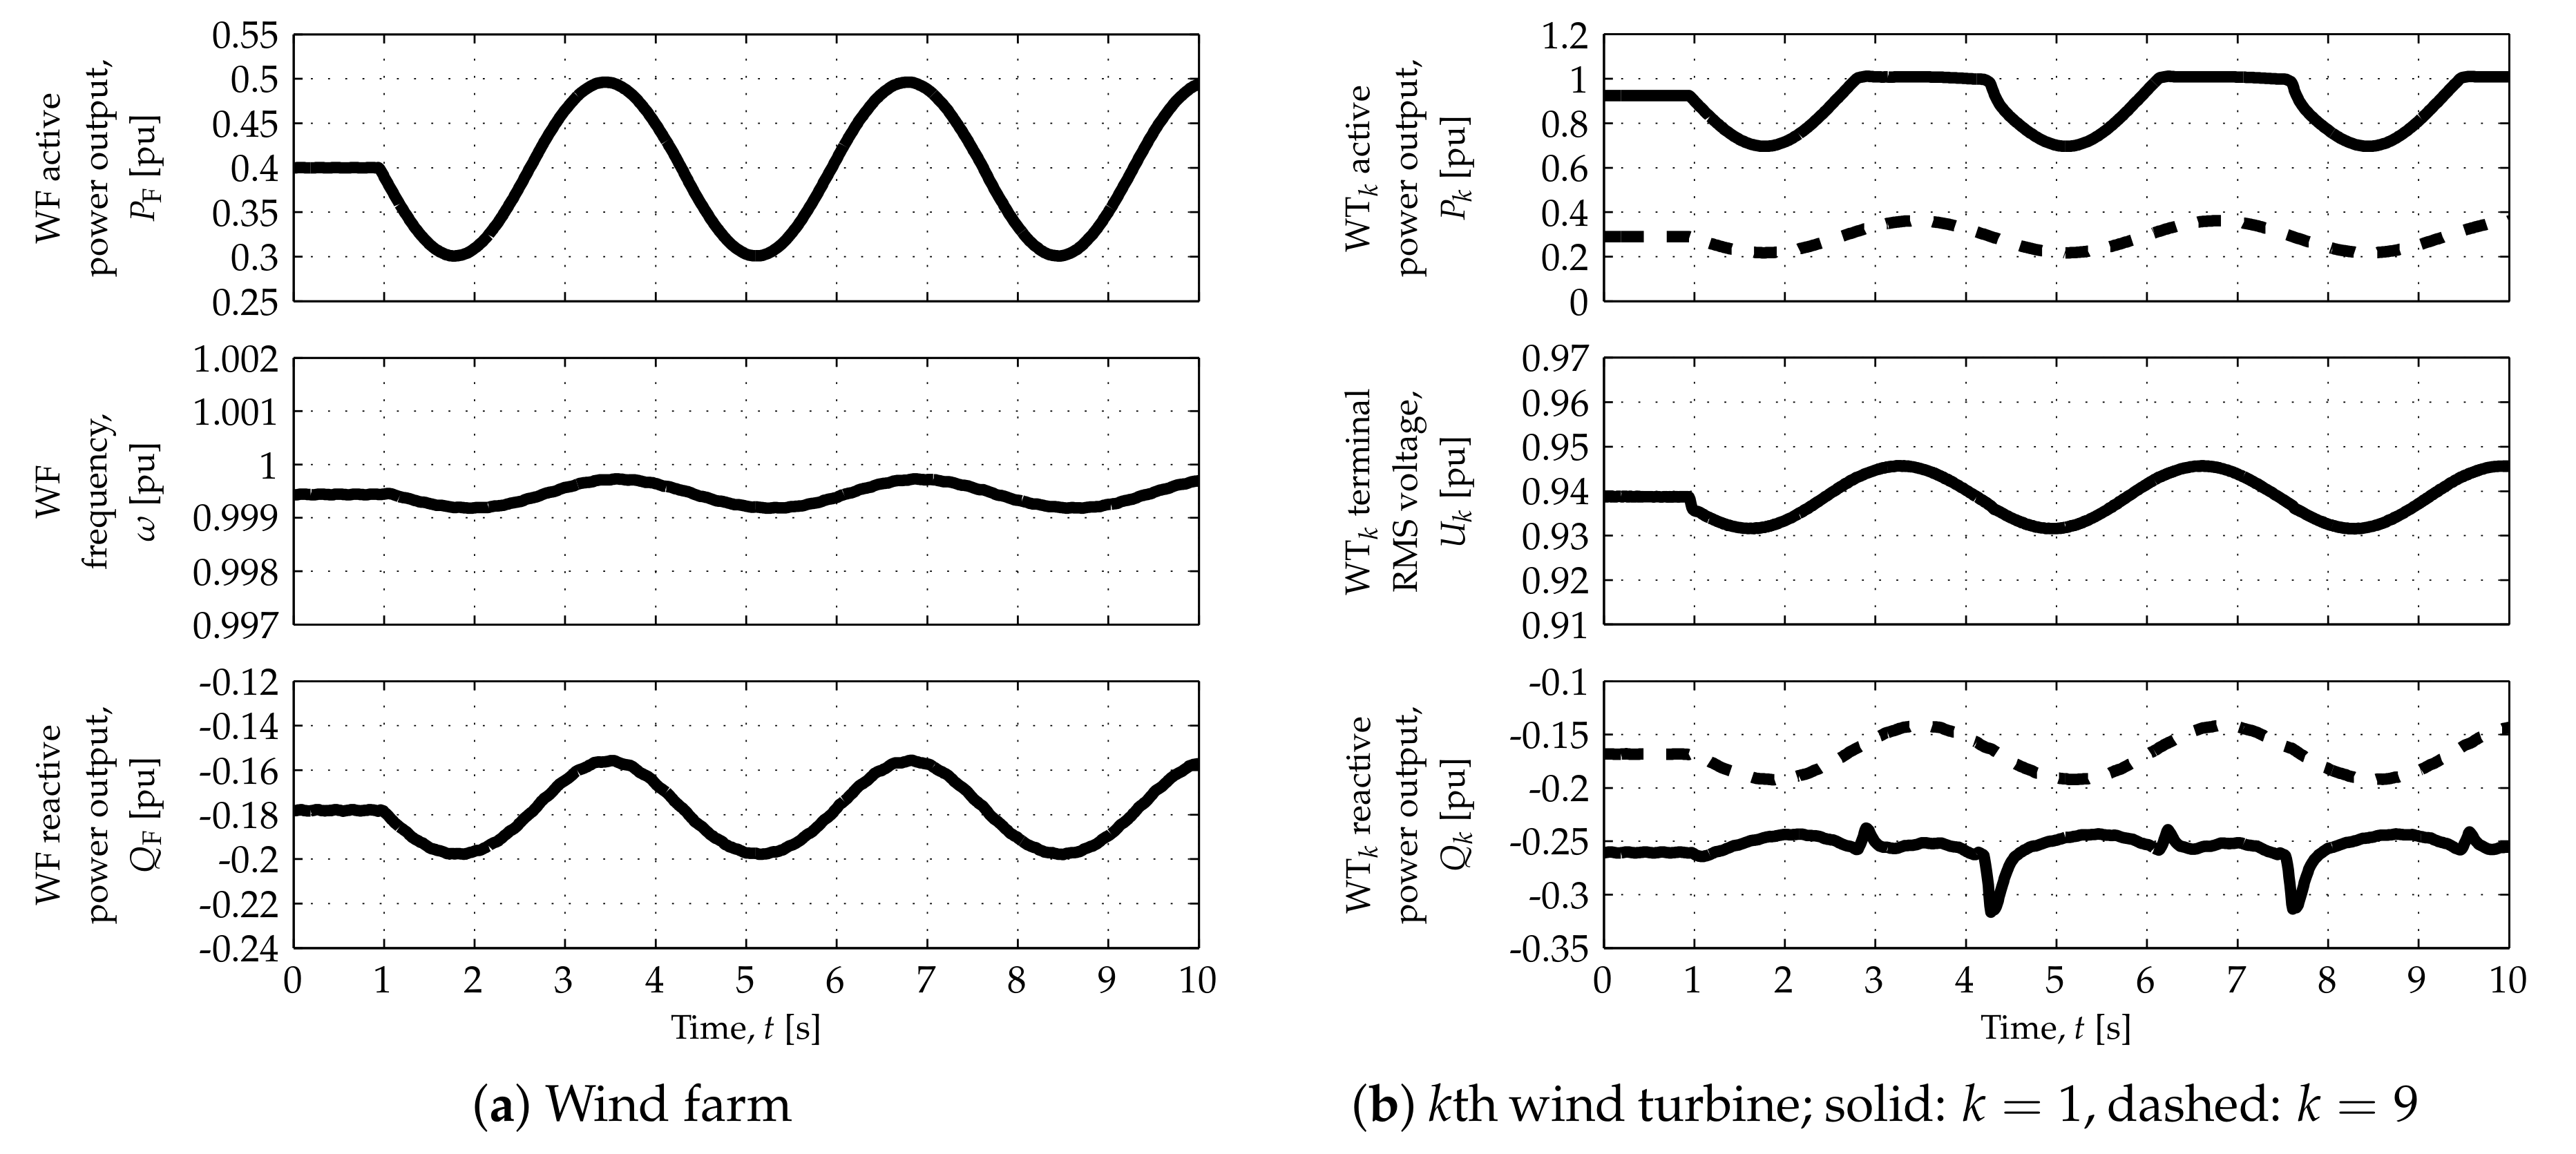
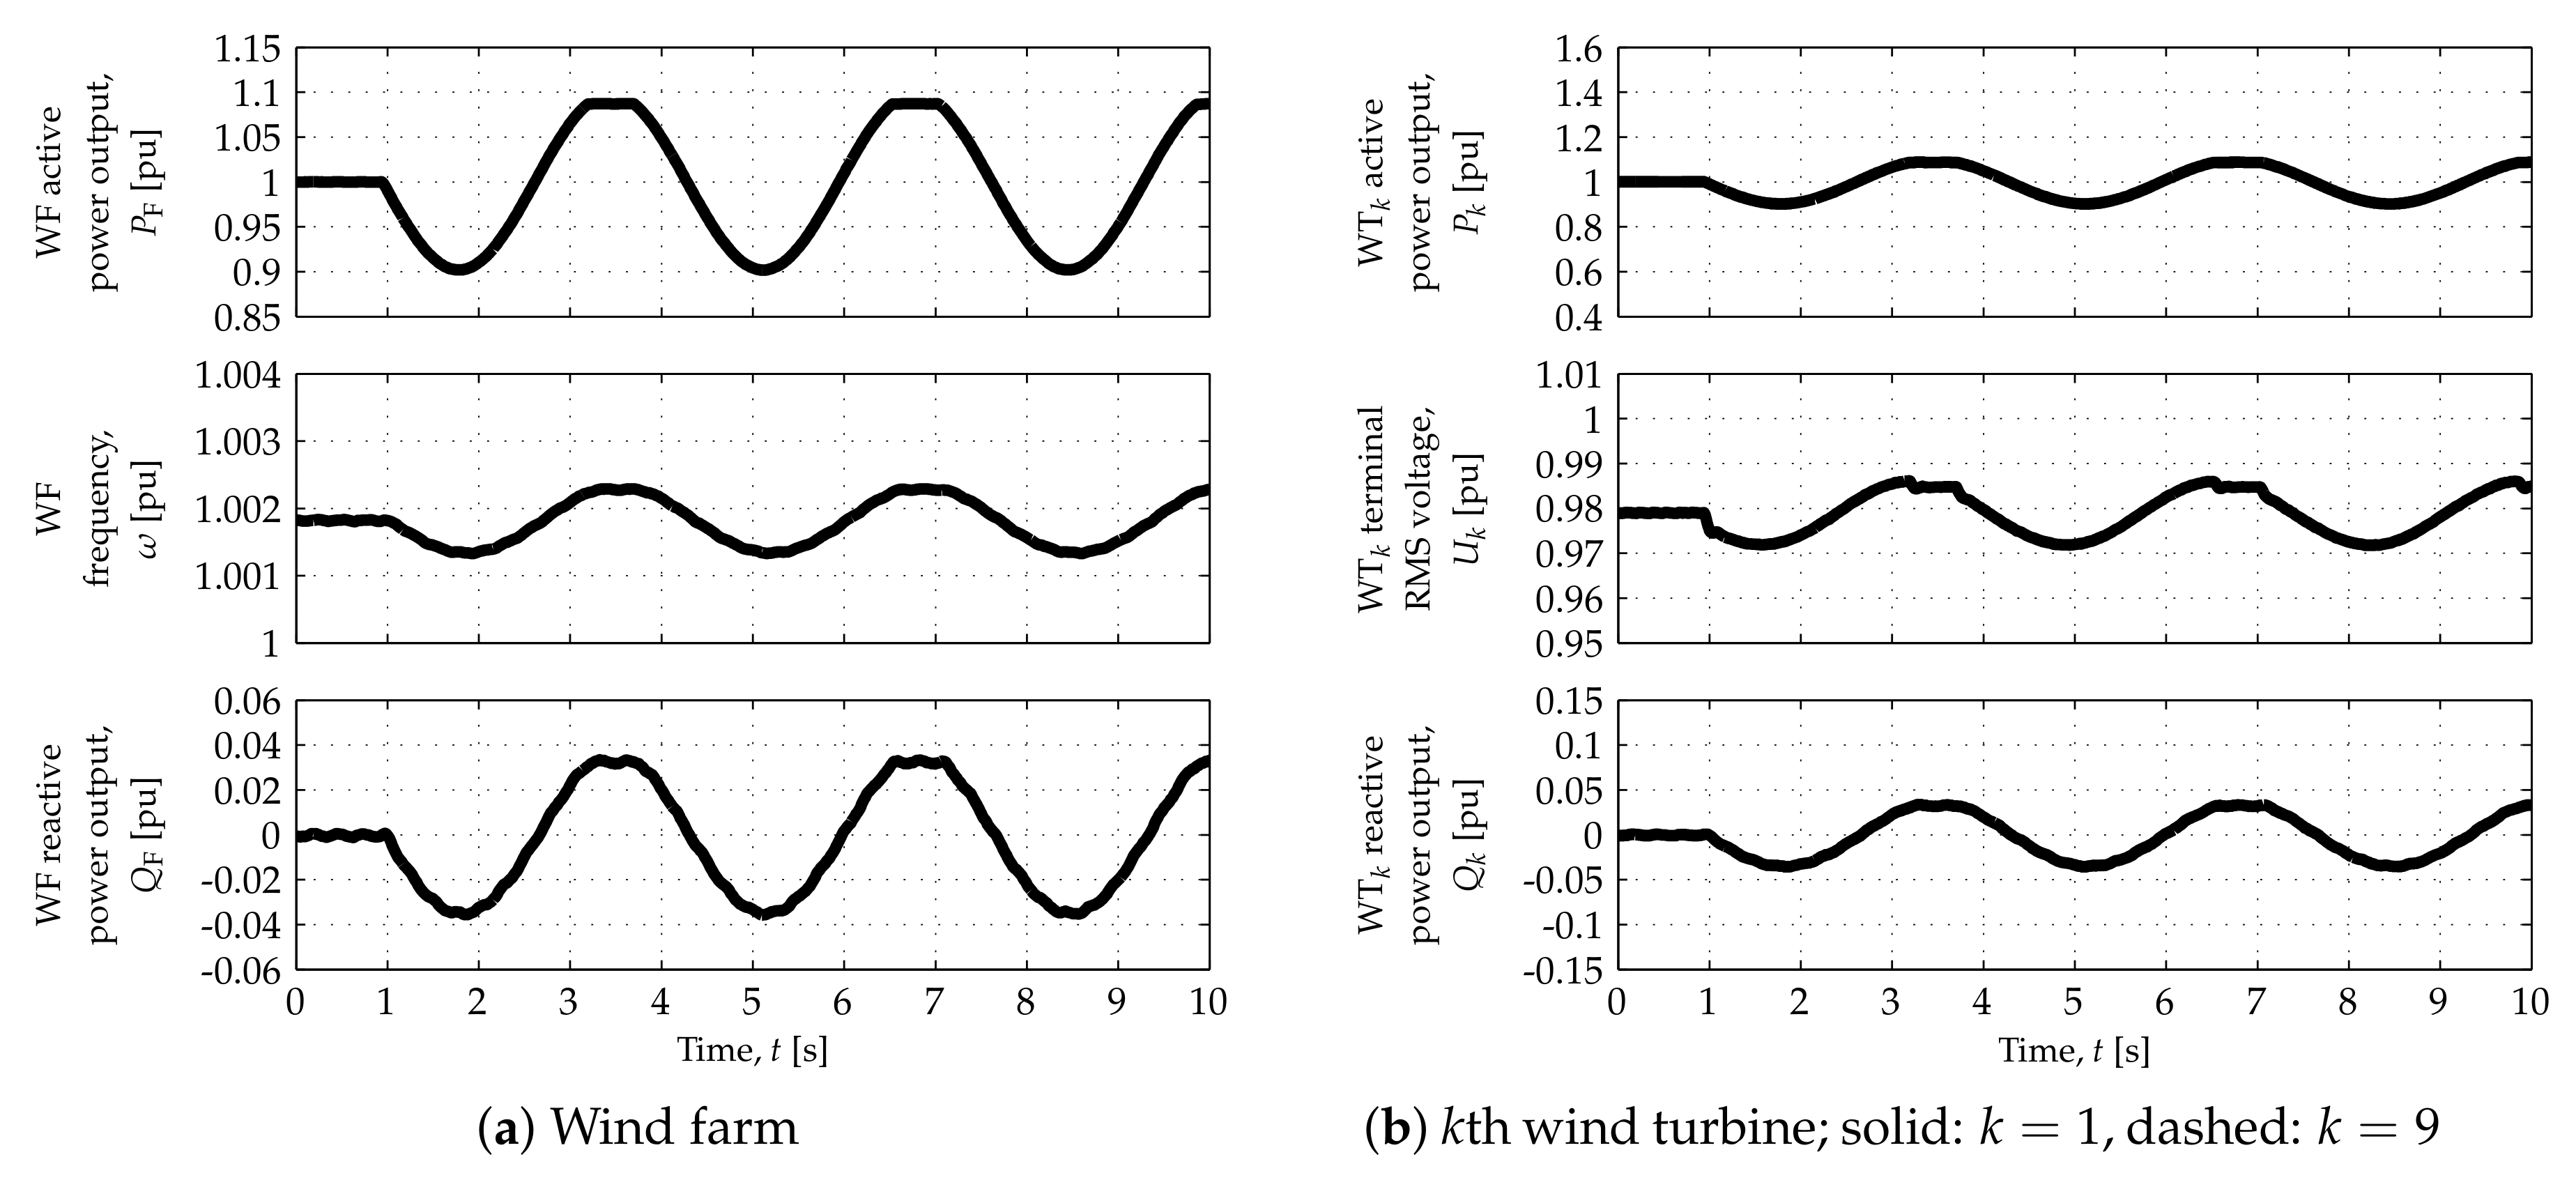
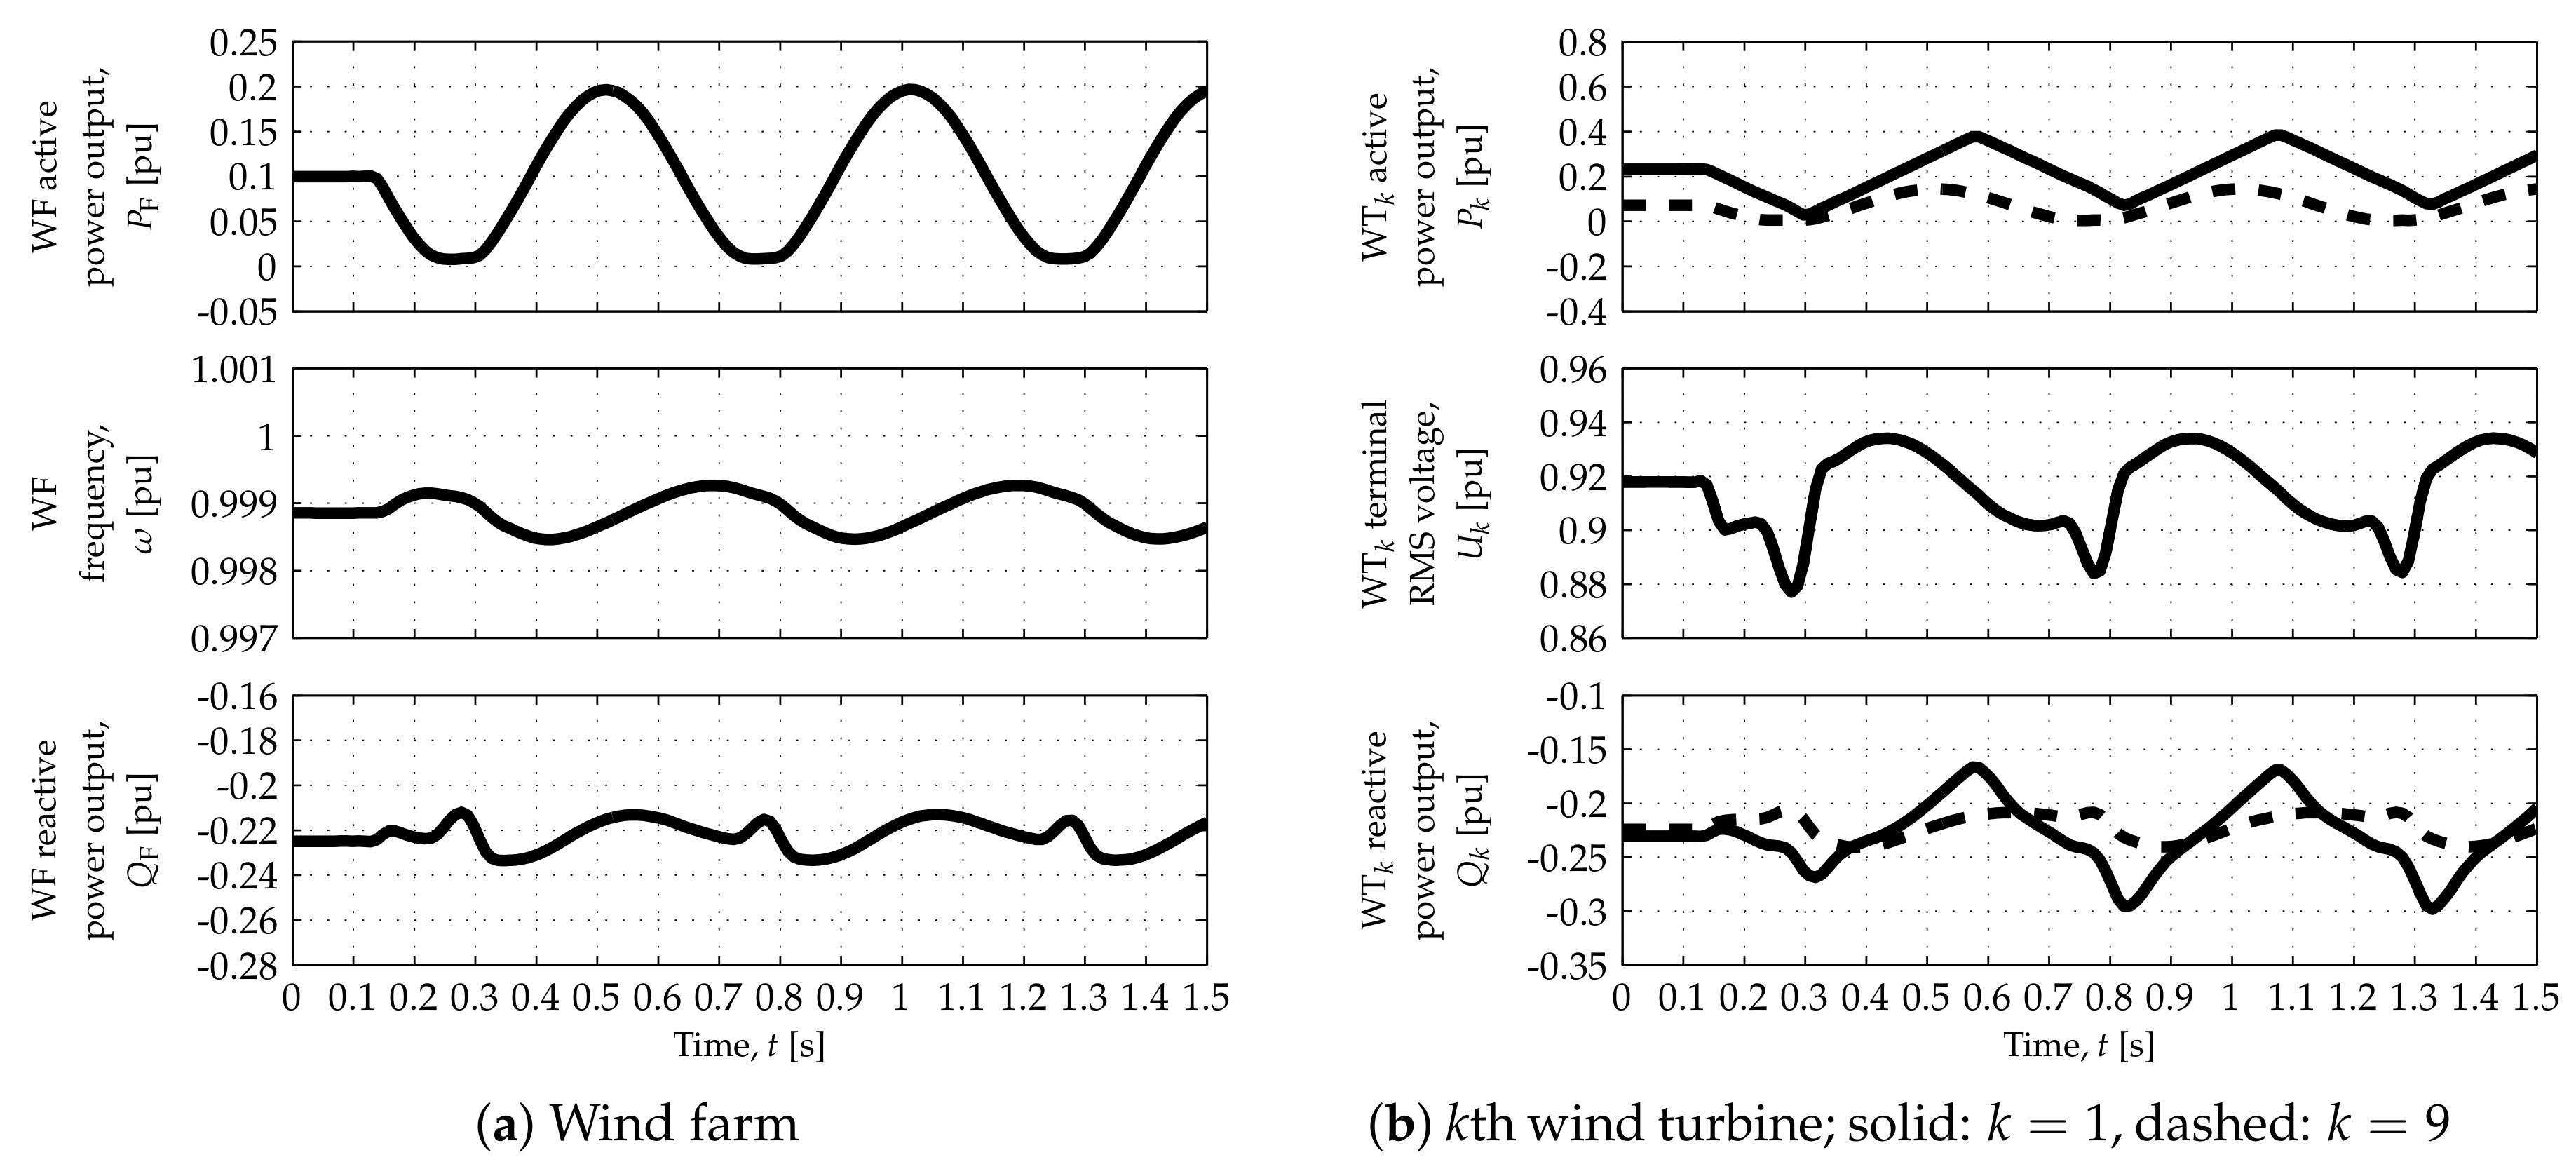
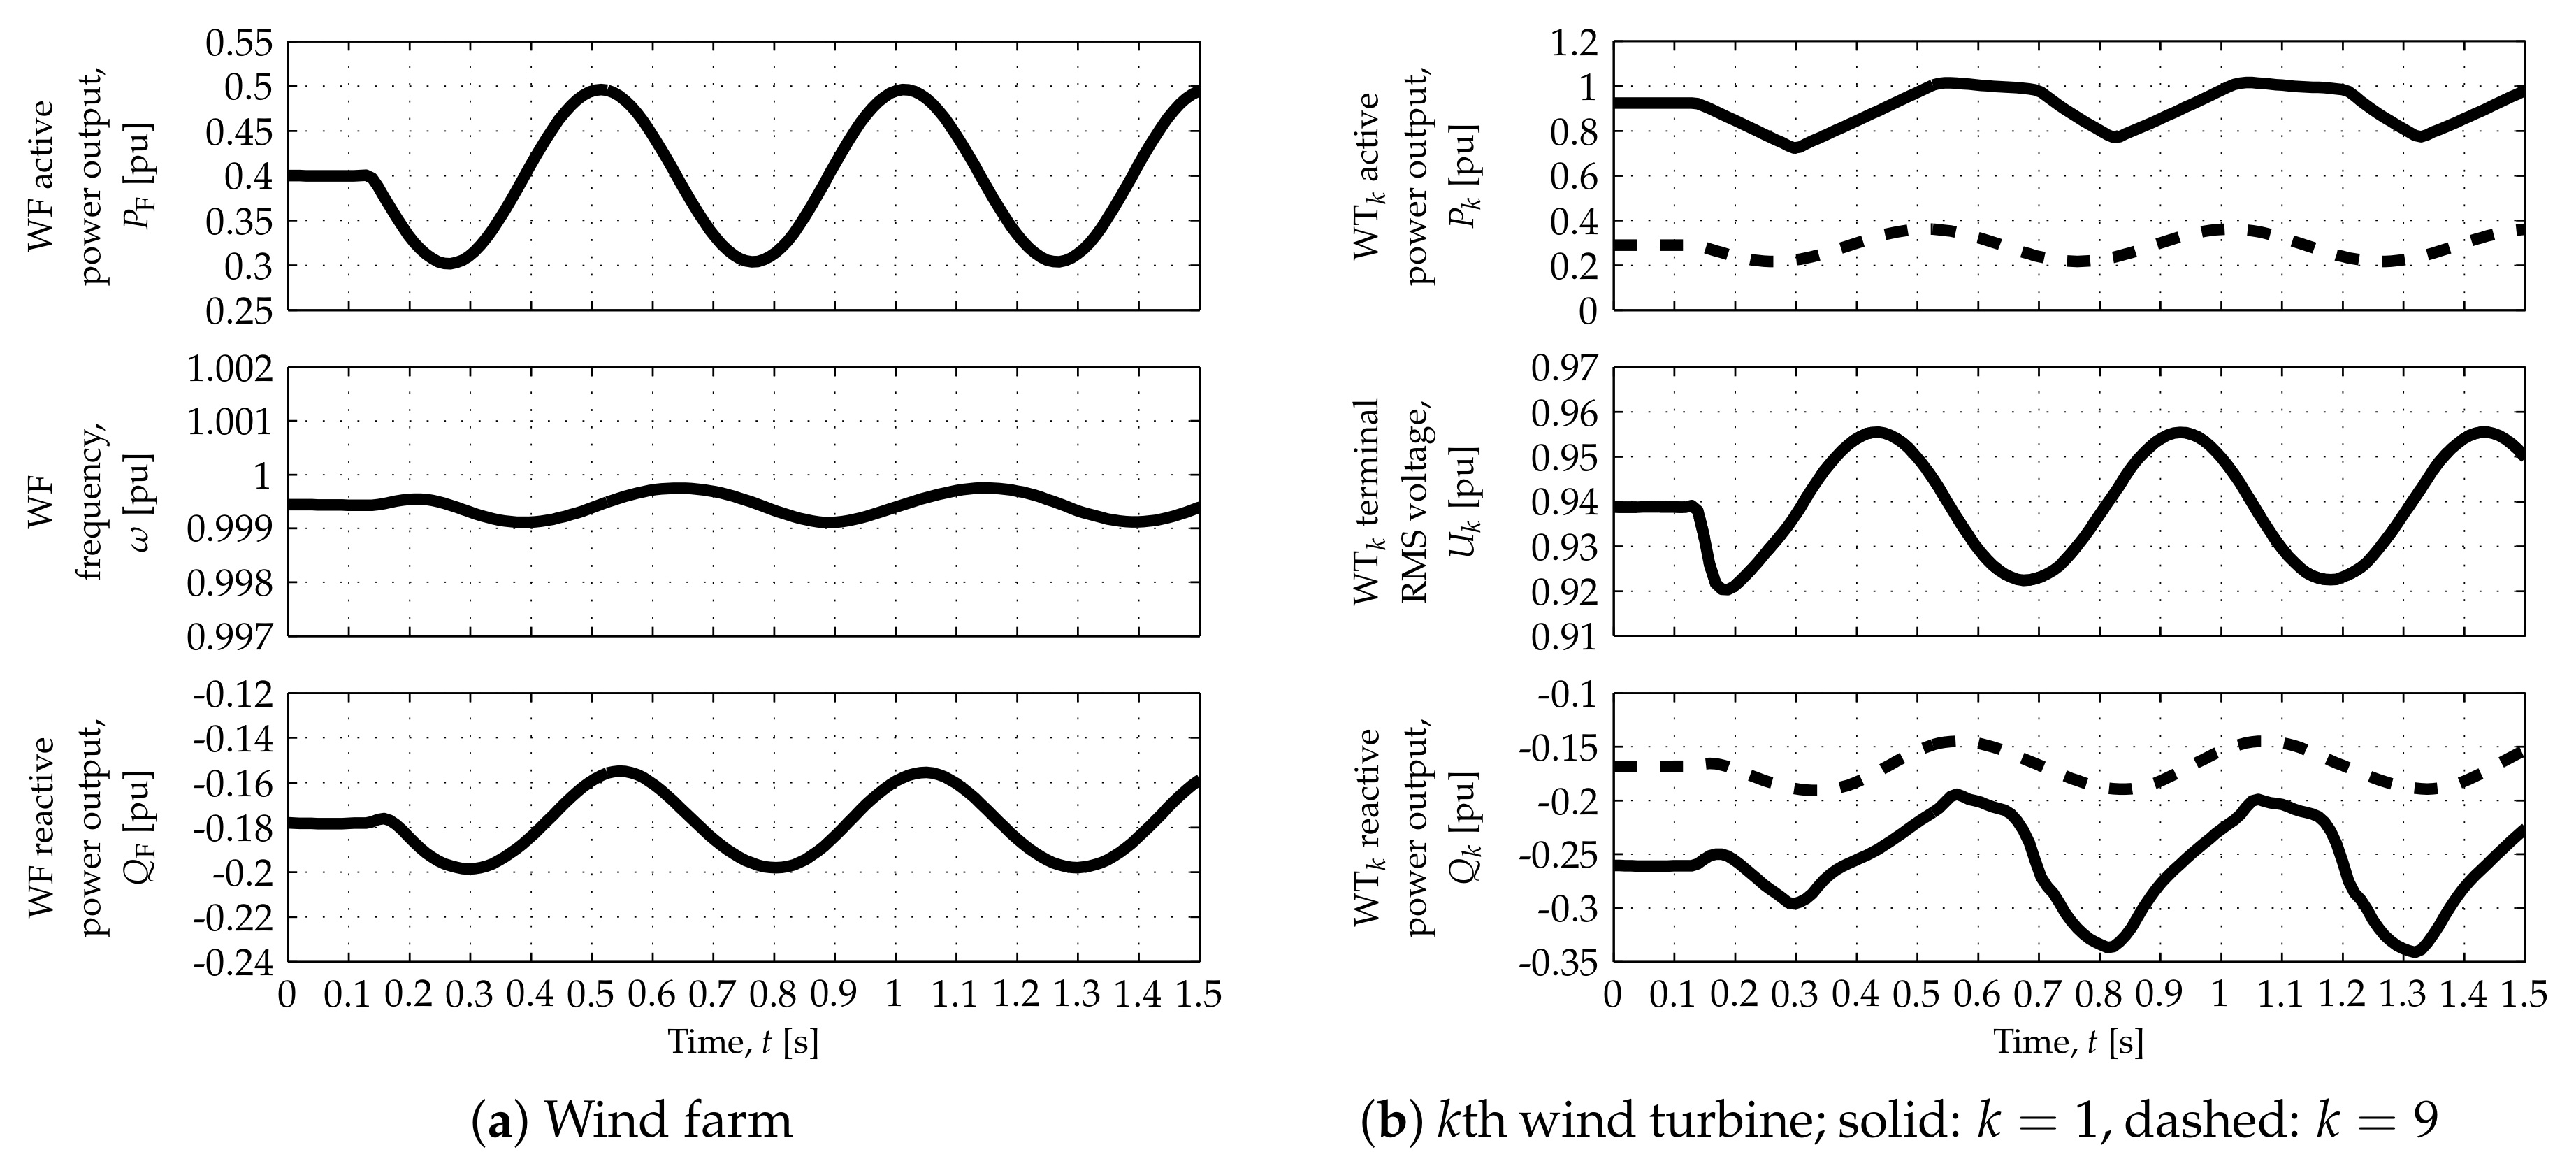
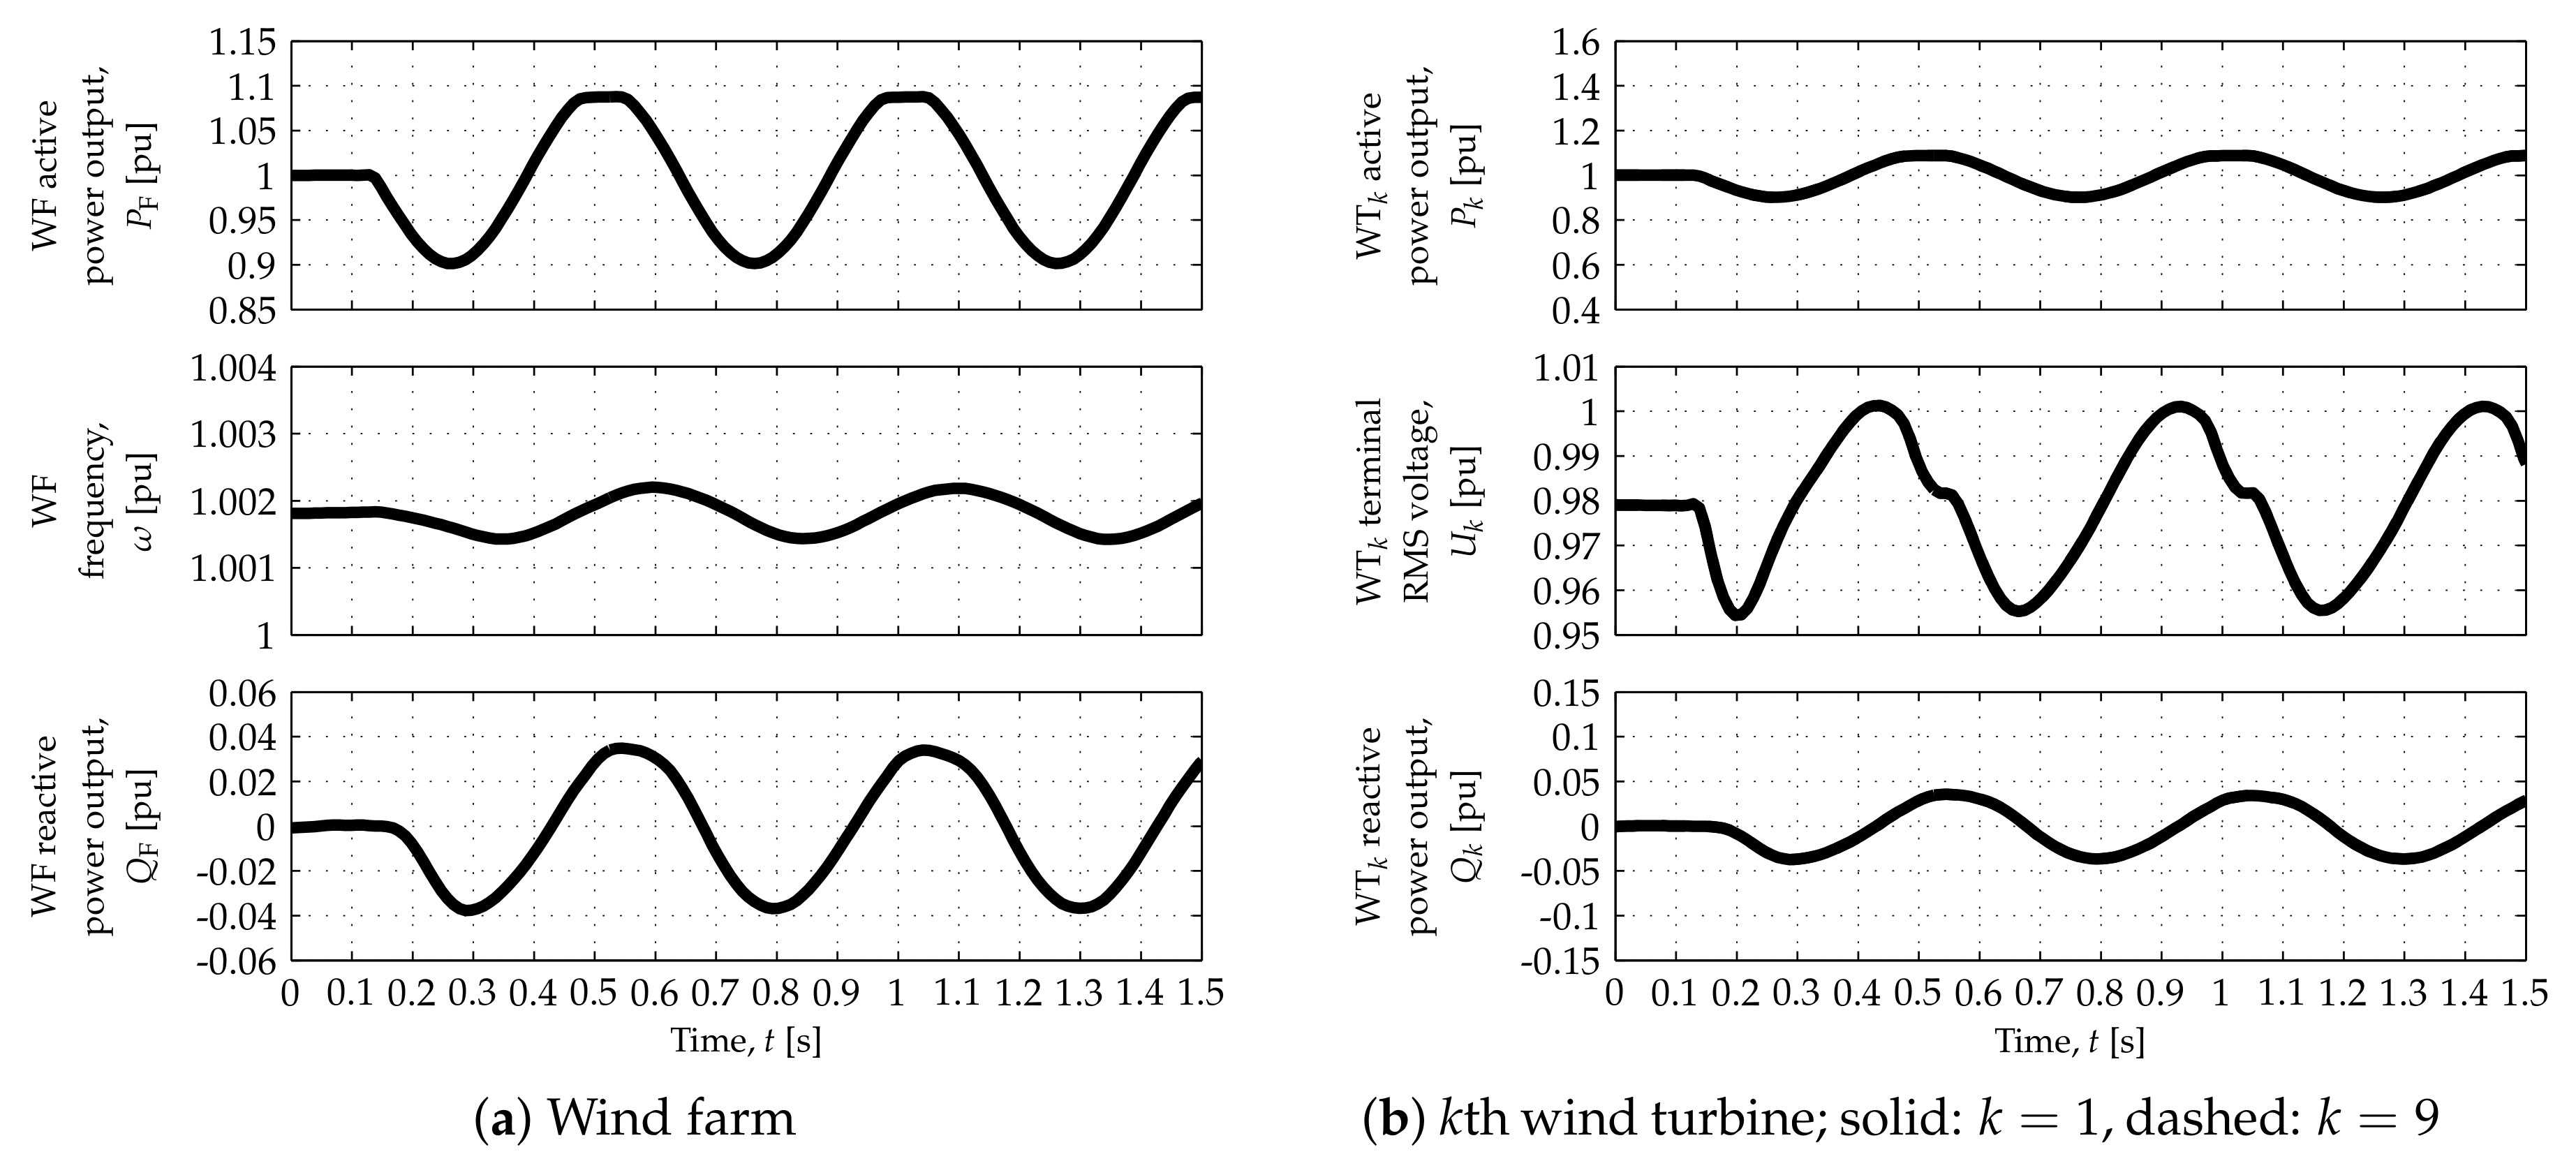
The WF response is illustrated by the plots on the left side of each figure, whereas WT responses are depicted by the plots on the right side. Solid and dashed traces in the WT responses—superimposed in the case of the WT
terminal root mean square (RMS) voltages,
—represent the responses of WTs 1 and 9, respectively, located at both ends of the string represented in detail (
Figure 1).
As depicted by the top-left plots in each figure, the WF can modulate its active power output,
, according to the connection requirements for most of its operating range. Such capability can, however, be restricted at operating points corresponding to the lowest and highest values of
, as shown in the top plots in
Figure 5a,
Figure 7a,
Figure 8a and
Figure 10a. The nonlinear characteristics of the DR-based offshore HVDC terminal can prevent the WF from achieving
. This can be observed in
Figure 5 and
Figure 8, which correspond to the low wind speed scenario: when the DRs stop conducting,
saturates at a value above 0 and
drops sharply. Moreover, the consumption/production of reactive power, necessary to control the offshore AC network (angular) frequency,
, can reduce the active power headroom of the corresponding grid-forming WTs. Such reduced active power headroom can prevent the WF from achieving
. This is illustrated by
Figure 7 and
Figure 10, which correspond to the high wind speed scenario: when the WT FEC output currents,
, reach their
limit,
and
saturate at a value below
.
The nonlinear characteristics of the responses correspond to grid-forming WTs and their FECs reaching the limits imposed on their output current,
, and on the rate of change of their active power output,
. Regardless of the HVDC connection technology and as a natural consequence of proportional dispatch,
with the values of
and
given in
Table 1. Equation (
1) implies that, even though
and
, the value and rate of change of
are greater than such limits in the low, medium-low and medium wind speed scenarios. In other words, greater and faster changes in the active power output are demanded from the most upstream WT when the power available to such WT is greater than the average. As depicted in
Figure 6b,
Figure 8b and
Figure 9b, such changes may not be fully achieved because of WT hardware constraints (represented by the aforementioned limits).
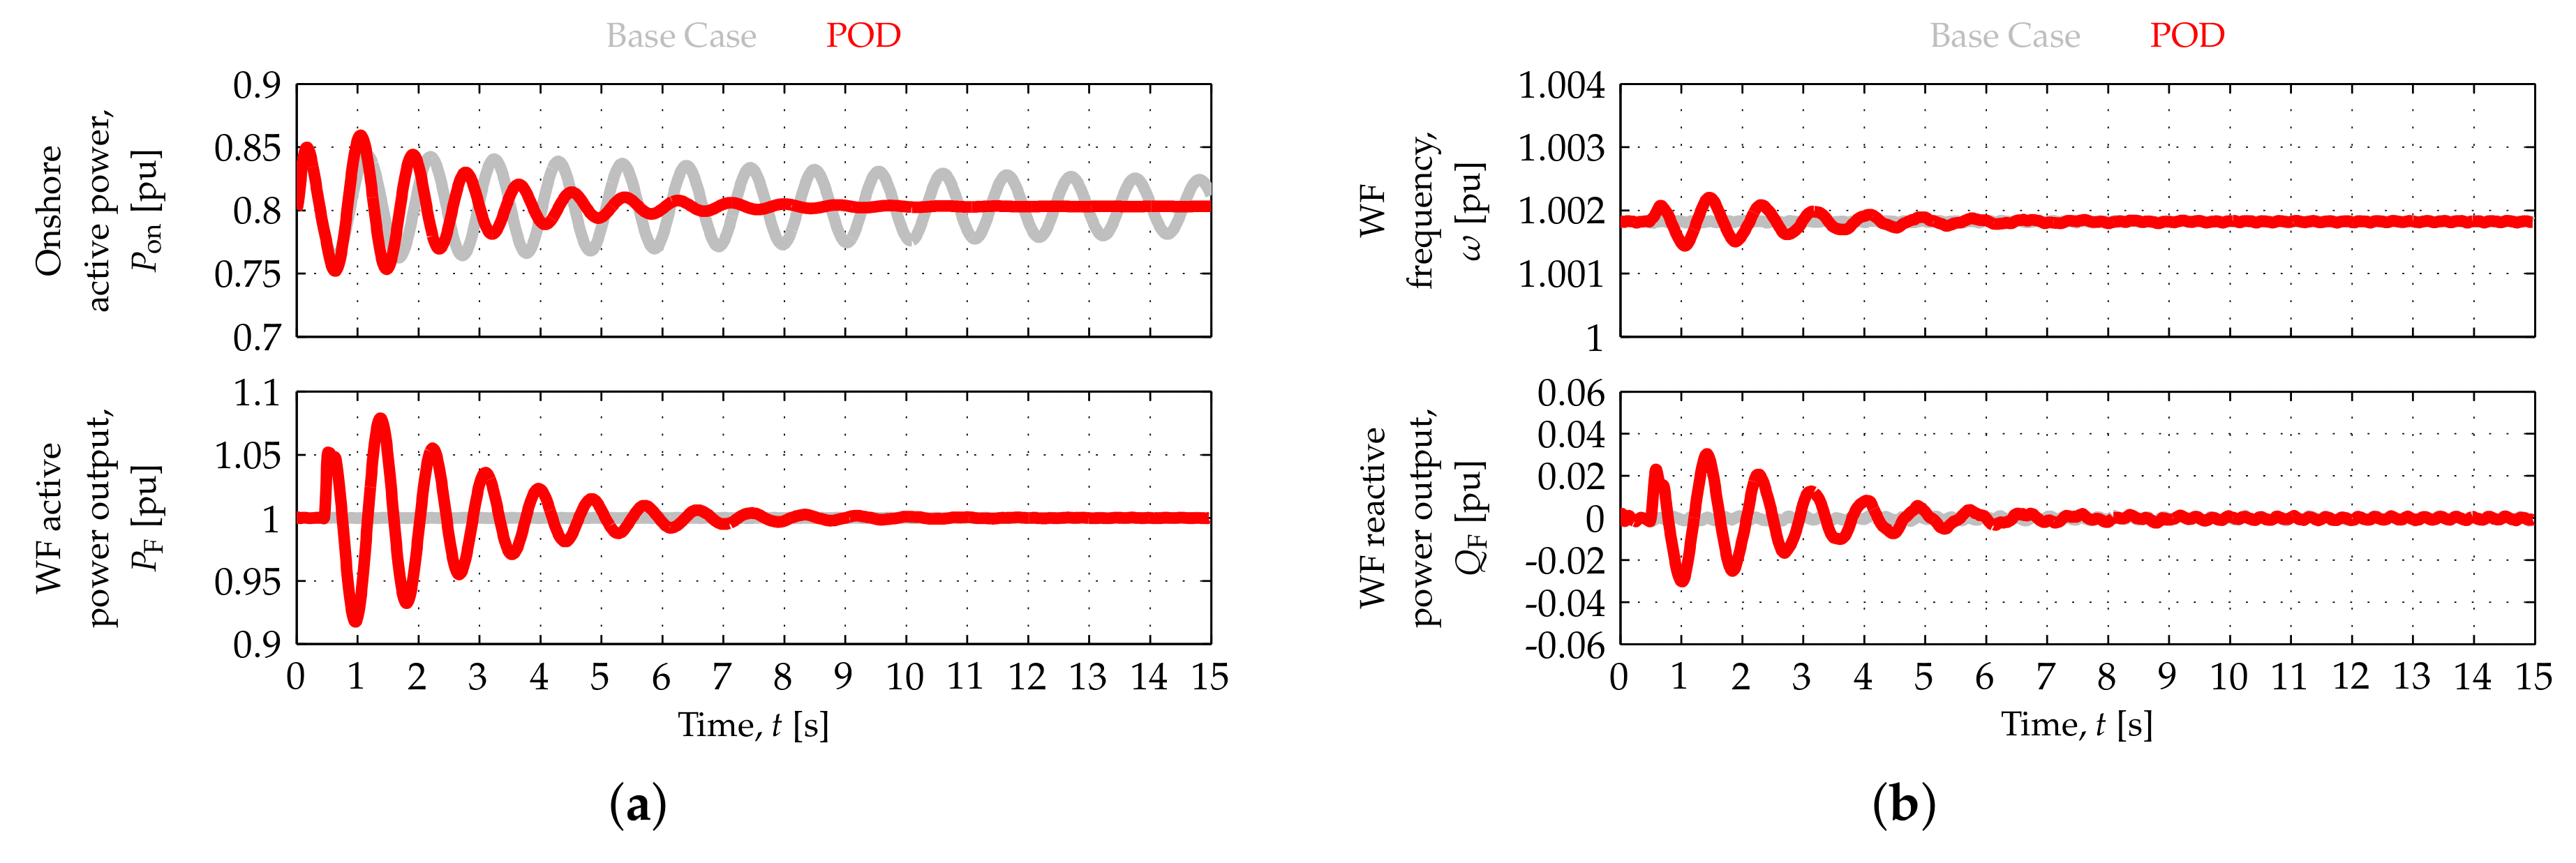
3.2. Closed-Loop Tests
Results of the closed-loop tests are depicted in
Figure 11,
Figure 12 and
Figure 13. In such tests, input port 1 was selected in switch
in the WF APC (
Figure 4), so that the WF modulated its active power output according to
. Onshore power oscillations were triggered by means of 80 MW load step changes at
.
Each figure includes base case responses, corresponding to no POD from the OWF. The (light) grey signals in each figure represent the base case,
, while the (dark) red traces illustrate the cases in which the WF contributes to damp the oscillations in
,
. To improve the response, the POD control mode was activated at the next zero-crossing of
after the activation of
at
. The results depicted in
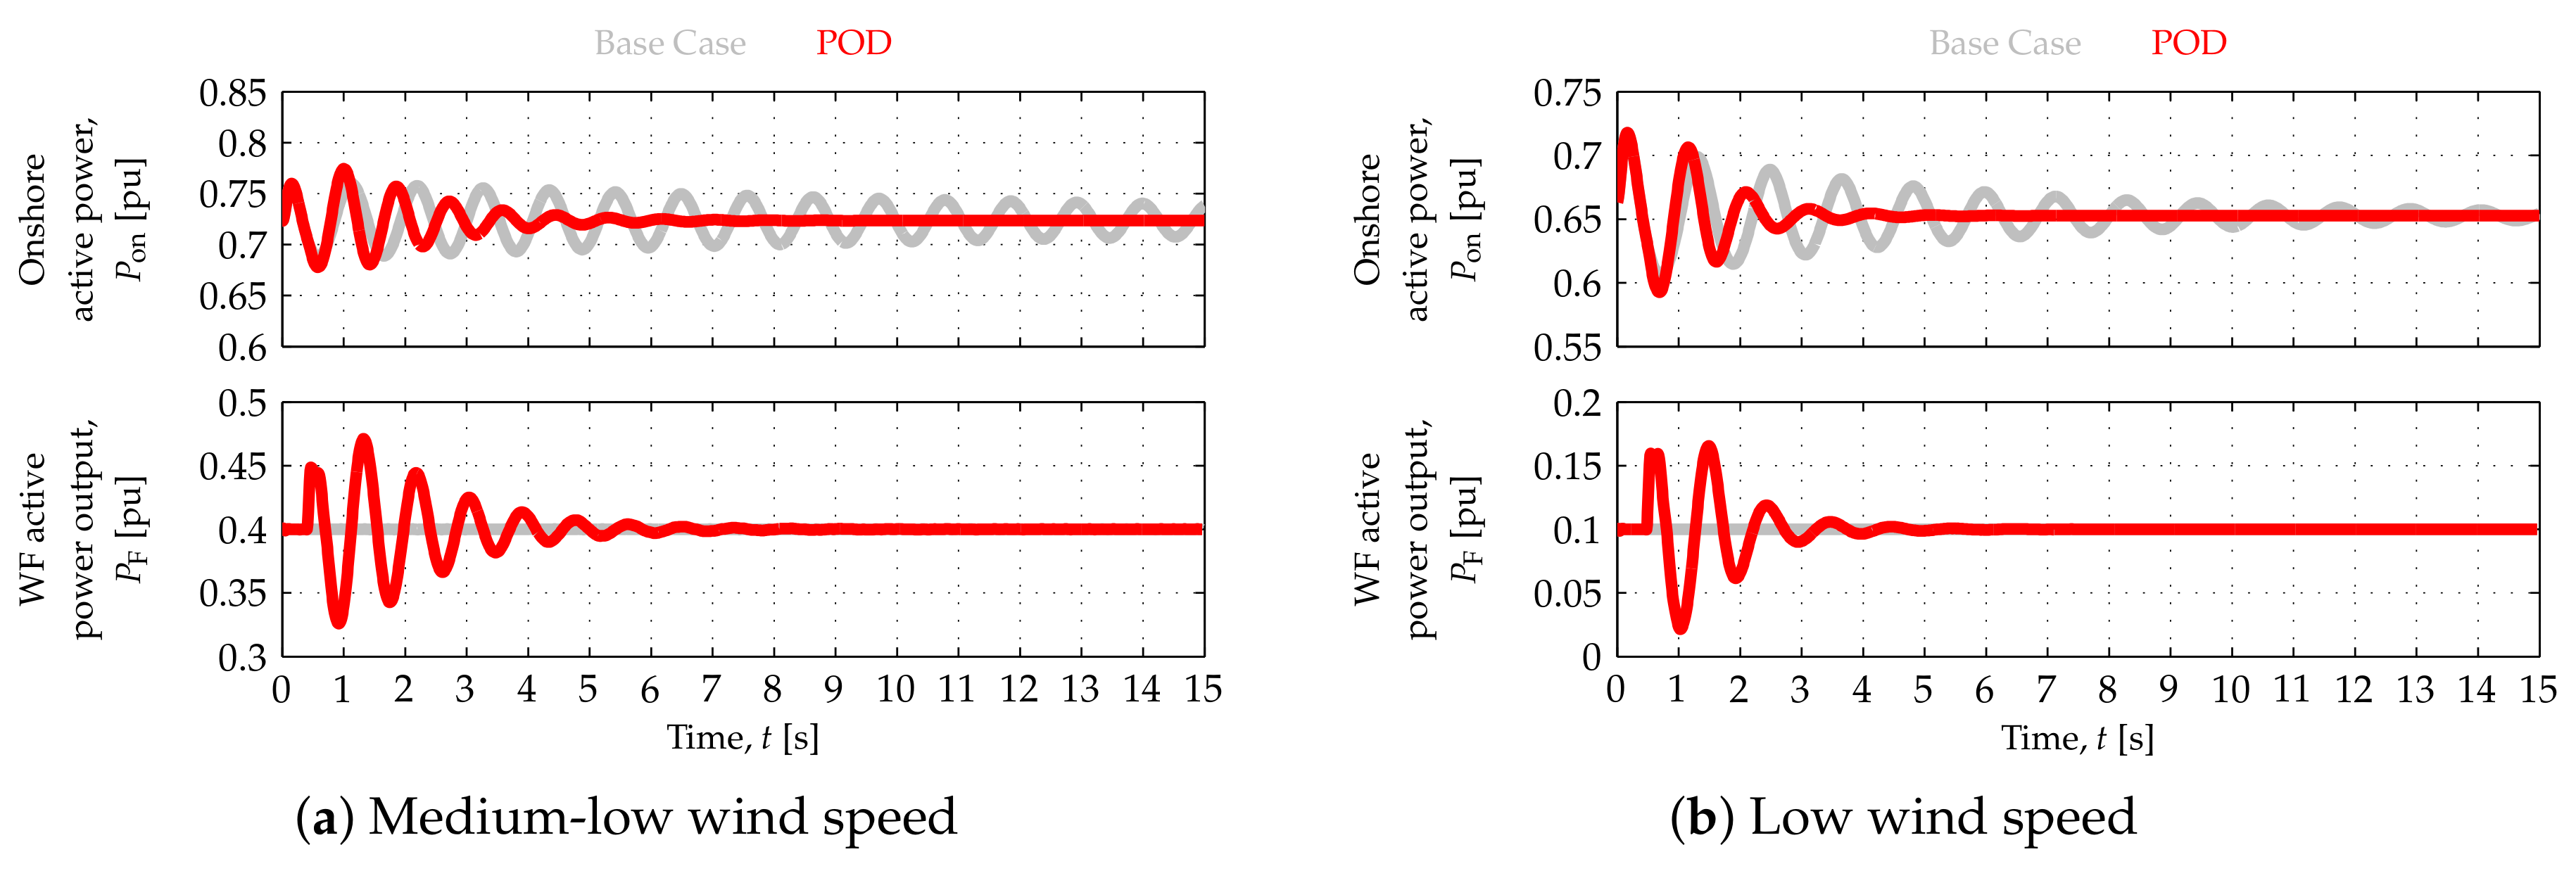
Figure 11 correspond to the high wind speed scenario, whereas those in
Figure 12a and
Figure 13a correspond to the medium-low wind speed scenario, and those in
Figure 12b and
Figure 13b correspond to the low wind speed scenario.
WF responses to onshore (active) power oscillations at high, medium-low and low wind speeds are depicted in
Figure 11,
Figure 12a and
Figure 12b, respectively. The offshore AC network (angular) frequency,
, and WF reactive power output,
, are only presented in
Figure 11b corresponding to the high wind speed scenario. However, similar results have been obtained in the three other wind speed scenarios. As can be seen in
Figure 11a and
Figure 12, the damping of the onshore (active) power oscillations can be increased by having the OWF modulate its active power output,
, in response to the onshore signals directly communicated to it.
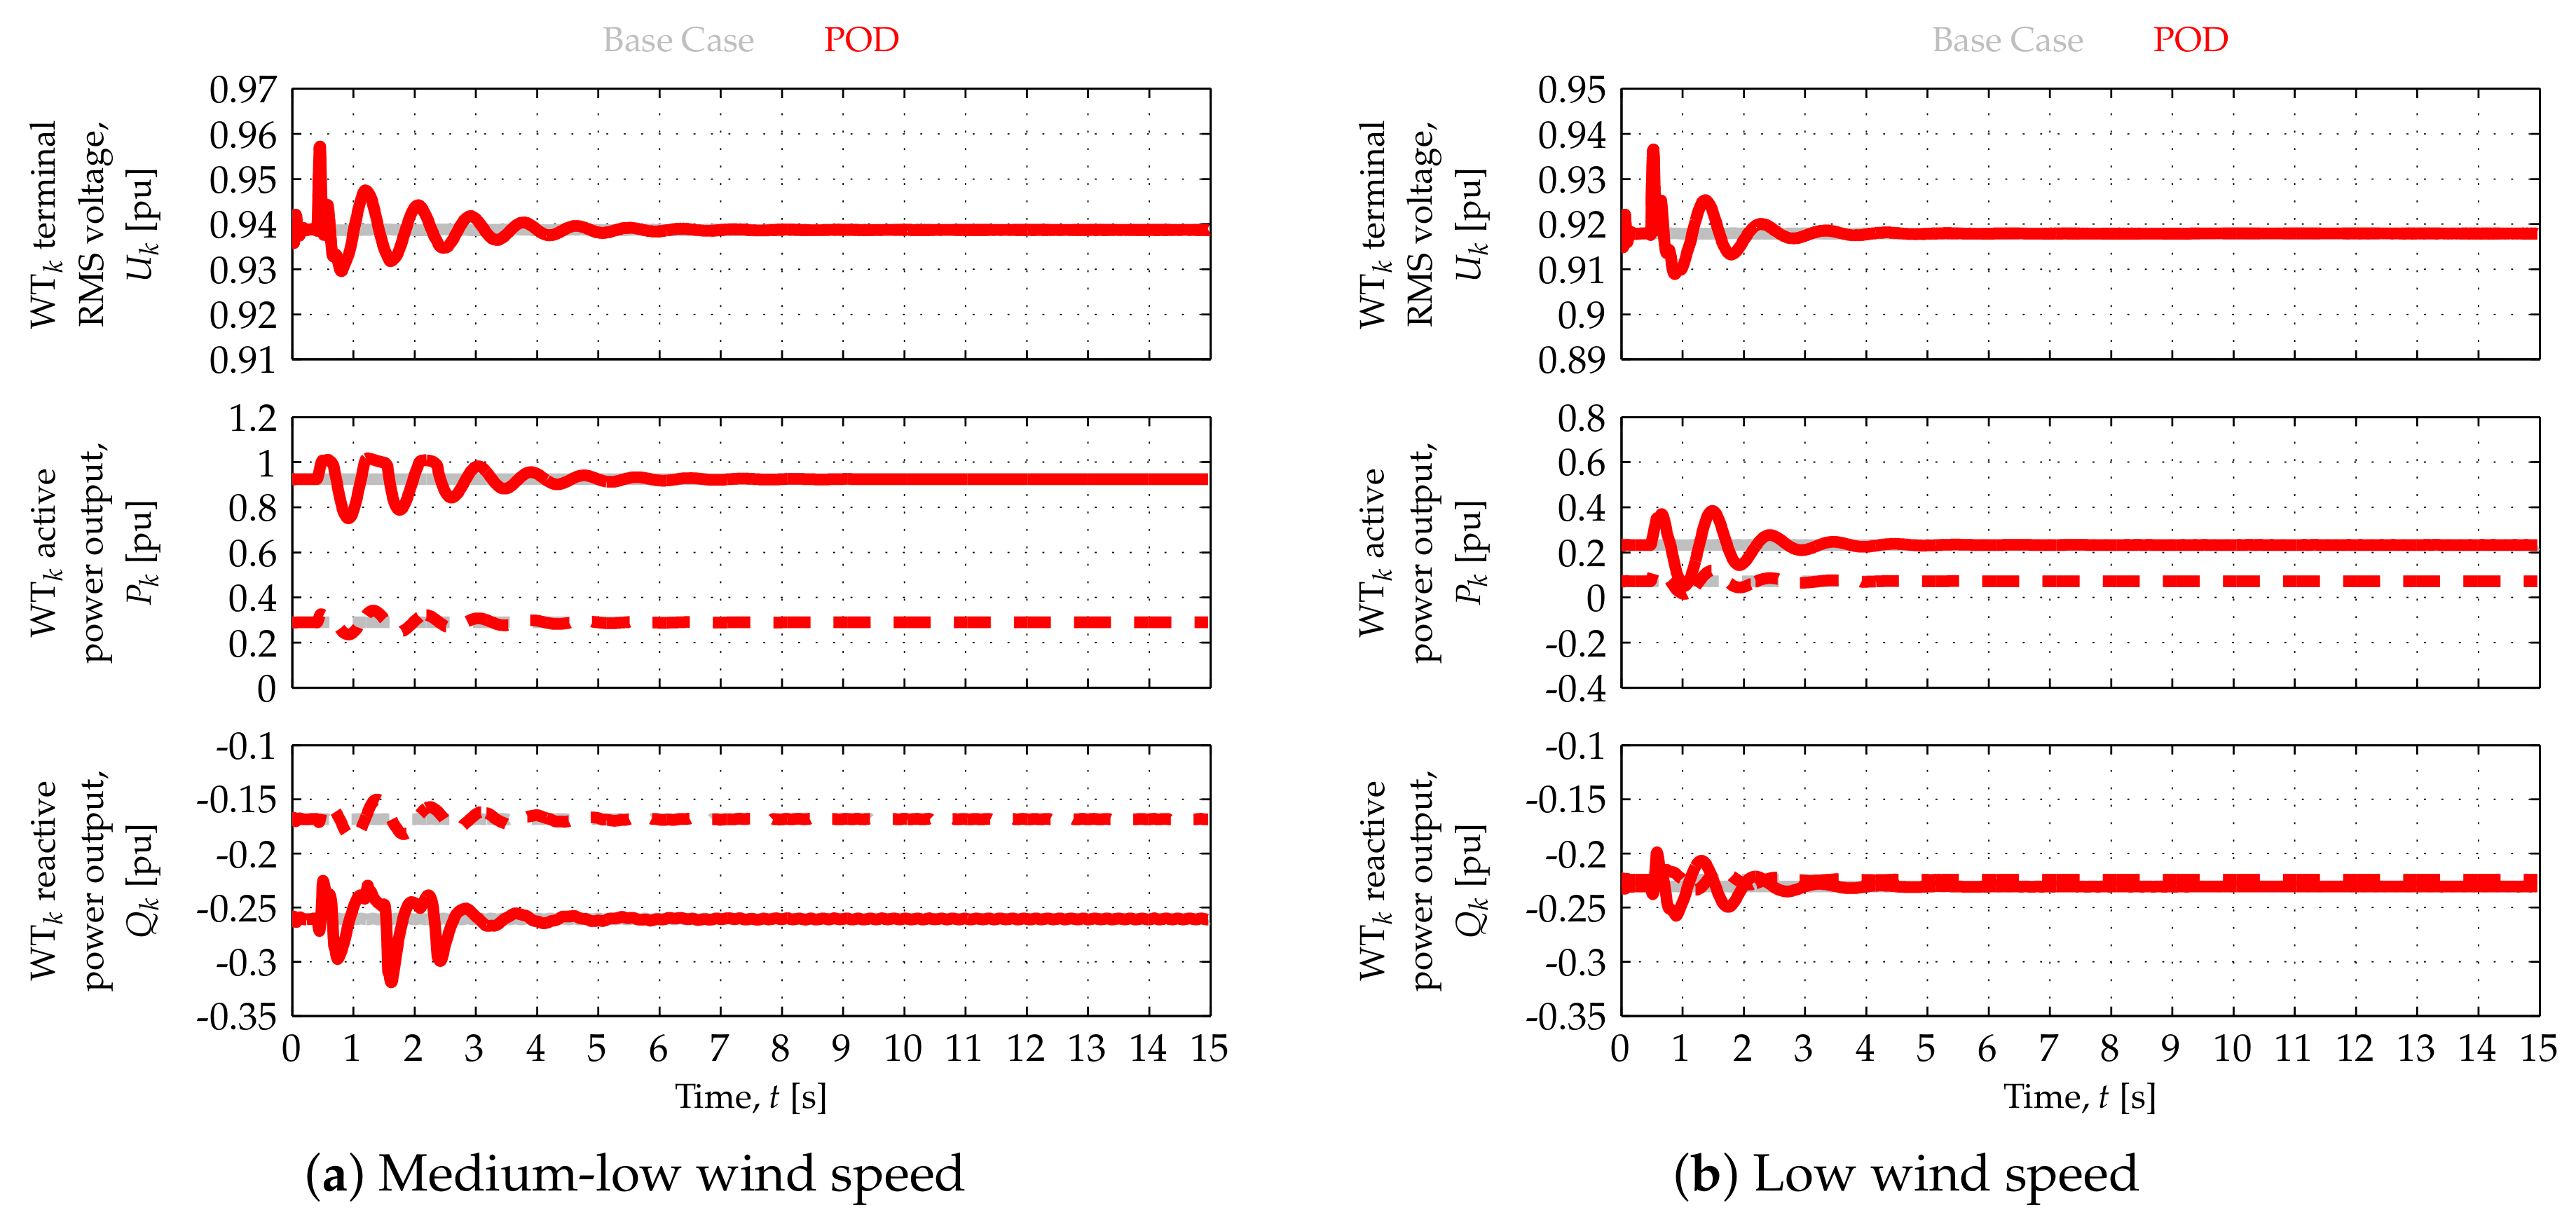
WT responses to onshore (active) power oscillations at medium and low wind speeds are illustrated by
Figure 13a,b, respectively. Once again, solid and dashed traces—superimposed in the case of
—represent the responses of WTs 1 and 9, respectively, located at both ends of the string represented in detail (
Figure 1). Similar results were obtained in the other two wind speed scenarios.
3.3. Further Comments
The WT active power outputs,
, reflect the assumed distributions of
(
Table 1) and the changes in
when the WF modulates its active power output. Such modulation, illustrated in the top-left plots in
Figure 5,
Figure 6,
Figure 7,
Figure 8,
Figure 9 and
Figure 10 and the bottom plots in
Figure 12, is achieved through changes in
, which are one or two orders of magnitude smaller, keeping them within their normal operating range, as depicted in the middle-right plots in
Figure 5,
Figure 6,
Figure 7,
Figure 8,
Figure 9 and
Figure 10 and the top plots in
Figure 13. As can be observed in the bottom-right plots in
Figure 5,
Figure 6,
Figure 7,
Figure 8,
Figure 9 and
Figure 10 and the bottom plots in
Figure 13, the WTs share the reactive power consumption or production (negative or positive values, respectively, of the WT
reactive power output,
) according to
.
The changes in
result in proportional changes in the DR reactive power consumption. This is reflected in the changes in the WF reactive power output,
, and offshore AC network (angular) frequency,
, as depicted in the middle- and bottom-left plots in
Figure 5,
Figure 6,
Figure 7,
Figure 8,
Figure 9 and
Figure 10 and in
Figure 11b. However, such changes are one and three orders of magnitude smaller than those in
, respectively, while
is kept close to
. That is the result of every grid-forming WT FEC contributing autonomously to regulating
by means of its corresponding PLL-based (proportional) controller, while sharing the reactive power with the other grid-forming WT FECs by means of its reactive-power-frequency droop.
4. Conclusions
This study assessed the actual capability of an OWF to provide POD to an onshore AC network by means of active power modulation, when connected through an HVDC link having a DR-based offshore terminal and a VSC-based onshore terminal. The study also examined the compatibility of corresponding higher-level controls previously devised for VSC-HVDC-connected OWFs. The analysis performed in previous work was extended to both open- and closed-loop tests using more detailed models, a semi-aggregated representation of the OWF and improved grid-forming WT FEC controls. Such OWF representation provides insight into the dynamics of the WTs within a string by representing them in detail, while keeping reasonable simulation times. The contemplated distributions of aerodynamic power from the wind available to each WT frame the study in more realistic operating conditions. The open-loop tests facilitate the evaluation of the WF’s compliance with the corresponding connection requirements for the provision of POD.
The simulation results indicate that the new connection concept (and corresponding changes in WT control) does not impact the capability of OWFs to provide POD—in most of their operating range—by means of OWF active power control strategies similar to those developed for VSC-HVDC-connected OWFs. Closed-loop tests showed that the damping of onshore power oscillations can be increased by having DR-connected OWFs employ such strategies to modulate their active power output in response to the onshore signals directly communicated to them.
While modulating their active power output, the grid-forming WTs share the reactive power consumption/production and keep the offshore voltage frequency and magnitude within their normal operating ranges. The semi-aggregated OWF representation makes it possible to corroborate that for each grid-forming WT within the string represented in detail, while achieving reasonable simulation times. The considered distributions of aerodynamic power from the wind available to each WT frame the study in more realistic operating conditions.
Open-loop tests showed that such OWFs can modulate their active power output according to the connection requirements for most of their operating range, and that such capability can, however, be restricted at operating points corresponding to the lowest and highest values of active power output. The nonlinear characteristics of DRs can restrict the provision of POD at low wind speeds by preventing the OWFs from achieving zero active power output. Moreover, the consumption/production of reactive power, necessary to control the offshore AC network frequency, can reduce the active power headroom of the corresponding grid-forming WTs. This can restrict the provision of POD at high wind speeds by preventing the OWFs from achieving the maximum active power output.

 ,
, 


