Article

Electric Vehicle Battery Simulation System for Mobile Field Test of Off-Board Charger

Key Laboratory of Distributed Energy Storage and Micro-Grid of Hebei Province, North China Electric Power University, Baoding 071003, China
*
Authors to whom correspondence should be addressed.
Energies 2019, 12(15), 3025; https://doi.org/10.3390/en12153025
Submission received: 1 July 2019 / Revised: 30 July 2019 / Accepted: 30 July 2019 / Published: 6 August 2019

Abstract

:
An electric vehicle power battery simulation system simulating different power battery packs for the field test of the off-board charger is designed, which can be used to test the performance of an off-board charger. Specifically, the improved power battery model is combined with the improved lightweight charging load and the online estimation of the state of charge as well as the electromotive force of the battery model are used to adjust charging load parameters in real time to simulate the charging response. An acceleration coefficient is introduced into the traditional battery model to improve test efficiency, and the type, specification, temperature and voltage parameters of the battery can be set online according to the test requirements. An improved charging load scheme is proposed, in which a DC converter cascaded power battery pack of the mobile test vehicle is used to form a lightweight charging load with the mode of constant voltage, constant current, constant power and constant resistance and the ability to be adjusted continuously within the rated range. As a result, the size and weight of the charging load are reduced and the autonomous test of the off-board charger is realized. The performances of the proposed battery simulation system are validated through the various experimental results.

1. Introduction

With the increasingly serious global energy crisis and environmental pollution, the huge advantages of electric vehicles compared with traditional vehicles in energy conservation and pollution emission reduction have been valued by governments and automobile enterprises [1,2]. In order to encourage the utilization of electric vehicles, the US Department of Energy launched the EV Project building home charging points for free [3]. In China, electric vehicles have been established as one of the seven strategic emerging industries [4].
The rapid development of the electric vehicle industry has accelerated the construction of the electric vehicle charging infrastructure. Various countries have implemented a series of incentives and invested a large amount of funds to support the construction of electric vehicle charging stations and charging points to meet the charging needs of electric vehicles [5,6,7,8,9,10]. In China, with the publication of a series of national standards related to the electric vehicle charging infrastructure [11], power grid companies and energy supply companies have also invested in the electric vehicle charging infrastructure such as charging stations and charging points [12]. The operation state of the electric vehicle charging infrastructure not only affects its own reliability [13,14], but also affects the service life of the power battery [15]. Therefore, it is important to test the electrical performance of electric vehicle charging equipment [16].
Currently, loads for the performance test of electric vehicle charging equipment can be divided into power battery packs and electronic loads. Many researchers built automatic test platforms to test the safety function, communication compatibility, electrical and insulation performance of electric vehicle charging facilities [17,18,19,20,21,22]. The electronic load used in the above test platforms can only simulate the fixed charging characteristic curve of the power battery and is unable to build a systematic and dynamic power battery model, which is far from the characteristics of the actual power battery [23]. In addition, the electronic load requiring a large radiator consumes power through an internal field effect transistor or giant transistor, which causes the electronic load to be bulky and heavy [24]. The practical application of the electronic load in the field test of the off-board charger is limited by the external factors such as vehicle loading space and underground-garage height.
Reference [25,26] used the lithium battery pack or lead-acid batteries as a charging load to build the test platforms to verify the performance of the charger. The parameters of the power battery pack are fixed and single, which cannot be used as a universal test method. Due to the poor adaptability of the power battery pack, it is difficult to meet the needs of the field test of the off-board charger of different specifications and models. In the normal charging process, the extreme parameters of the power battery pack such as the over temperature and overvoltage of the battery will not appear. It is difficult to test the emergency response and protection capability of the off-board charger [27]. In addition, the state of charge and voltage of power battery pack are determined by the actual energy storage of the battery. The state of charge and voltage cannot be adjusted autonomously during the test. Therefore, the whole test process is passive and inefficient. The test range and project is limited, and the independent test of the off-board charger cannot be realized.
Thus, the traditional charging loads for the mobile test of electric vehicle charging equipment have disadvantages. On the one hand, the application of the bulky electronic load is limited by the external factors such as vehicle loading space and underground-garage height. On the other hand, the battery pack parameter is single and the state of charge cannot be set flexibly, which causes a passive charging process and long charging time. Therefore, it is necessary to combine the advantages of the electronic load and battery pack while overcoming their respective shortcomings.
Reference [28] proposed dynamic battery modeling for the LiFePO4 battery simulator to express the dynamic characteristic and the transient state of the battery. Reference [29,30,31] proposed the equivalent circuit model and electrochemical model for Li-ion batteries to research the operating behavior, optimal design and effective managements of the battery and improve the simulation and computational efficiency in electric vehicles. Reference [32] presented a battery and kinematic model to be used in microscopic traffic simulation to help study the performance of thousands of electric vehicles. Reference [33] proposed a battery pack modeling method for automotive applications, which improved the fidelity of fast dynamic simulation of battery packs. The above literature proposed many battery pack modeling methods to study the performance of the battery or electric vehicles, which provides a reference for us to combine the battery model with the lightweight charging load to form a battery simulation system. However, none of the above references propose a battery pack temperature model and they did not build a lightweight battery simulator with high test efficiency and adjustable state and parameters for meeting the needs of the mobile field test of electric vehicle charging equipment.
In view of the shortcomings of the above charging load for the mobile field test of the off-board charger, this paper proposes an electric vehicle battery simulation system combining the improved battery model and lightweight charging load to reduce the volume and weight of the charging load and improve the adaptability and flexibility of the mobile test of the off-board charger. The proposed system is small in size and light in weight; it can simulate different types of power battery packs to meet the test requirements of the off-board charger; it can greatly shorten the test time and improve the test efficiency; it can simulate the charging abnormal state of the battery to test the response of the charger to the charging abnormality. Among them, a power battery pack of the mobile test vehicle cascaded DC converter is used to form the improved charging load, which reduces the volume and weight of the charging load. By designing the control strategy of the DC converter, the charging load is equipped with the mode of constant voltage, constant current, constant power, and constant resistance and the ability to be adjusted continuously within the rated range. As a result, the size and weight of the charging load are decreased and the autonomous test of the off-board charger is realized.

2. Methodology

An electric vehicle battery simulation system combining the improved battery model and lightweight charging load is designed. Specifically, the online estimation of the state of charge as well as the electromotive force of the battery model are used to adjust the lightweight charging load parameters in real time to simulate the charging response.

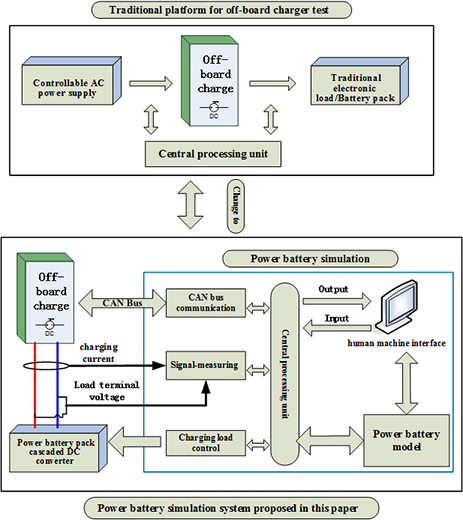
2.1. Battery Simulation System Technical Scheme

The structure of the battery simulation system is shown in Figure 1. The central processing unit calculates the current, voltage, temperature and SOC of the power battery model according to both the battery parameter set through the human machine interface and the output current or voltage of the off-board charger measured through the signal-measuring unit. The power battery model can also simulate abnormality of the battery when it is necessary to test the ability of emergency protection of the off-board charger. The charging load control unit is used to set the parameters of the power battery pack cascaded DC converter according to the calculation result of the battery model to simulate charging response. The human machine interface can also display the state information of the battery model. The CAN bus communication unit is used to communicate with the off-board charger through the CAN bus to realize the communication between the battery management system and off-board charger.

2.2. Single Power Cell Model

The structure of the single power cell model can be divided into two major parts: The open circuit voltage characteristics and the internal resistance characteristics of a cell [34,35,36]. The relationship between the open circuit voltage and the state of charge (SOC) of a cell can be expressed by Gregory L. Plett’s “composite model” [37].
U OC = K 0 K 1 S O C K 2 S O C + K 3 ln ( S O C ) + K 4 ln ( 1 S O C ) ,
where K 0   to   K 4 are the fitting coefficients, and the fitting coefficients of different battery types can be obtained by the model parameter identification method. In addition, the internal resistance of a cell includes polarization internal resistance caused by concentration polarization as well as electrochemical polarization and ohmic internal resistance caused by resistance polarization. The internal resistance characteristics of a cell can be simulated by two R C parallel circuits. The dynamic circuit model of a cell is shown in Figure 2.
In Figure 2, the parallel circuits consisting of C 1 R 1 and C 2 R 2 are used to describe the concentration polarization and electrochemical polarization of a cell, respectively. The R O  represents the internal ohmic resistance of a cell, and I C , and U T represent the charging current and terminal voltage of a cell, respectively.

2.3. Charging Response Simulation

The charging response simulation of a cell is that the charging response information of the cell such as voltage, current, SOC, and temperature are obtained through a simulation calculation based on the measured charging output.
In order to shorten the test time and improve the test efficiency to realize the controllability of the test process for meeting the needs of the mobile field test. An acceleration coefficient K T is added to the previous battery model based on the traditional ampere-hour method when estimating the SOC of the battery. The expression of the SOC of the cell in the discrete time domain is:
S O C k = S O C k 1 + 1 C K T K S O C k K T k η 0 I C ( k 1 ) Δ t ,
where, C is the capacity of the single cell, η 0 is the reference coulombic efficiency, K S O C k is the SOC influence coefficient, and K T k is the temperature influence coefficient, and the acceleration factor K T is the ratio of the charging time simulated by one calculation cycle of the system to the duration of one calculation cycle. It can be seen from Figure 2 that the terminal voltage of the cell in the constant current mode is implemented using the following expressions:
U T k = f U o c ( S O C k ) + U P 1 k + U P 2 k + I C k R O k ,
U P 1 k = I C ( k 1 ) R 1 ( k 1 ) + ( U P 1 ( k 1 ) I C ( k 1 ) R 1 ( k 1 ) e K T Δ t τ 1 ( k 1 ) ,
U P 2 k = I C ( k 1 ) R 2 ( k 1 ) + ( U P 2 ( k 1 ) I C ( k 1 ) R 2 ( k 1 ) ) e K T Δ t τ 2 ( k 1 ) ,
where, U P 1 k is the concentration polarization voltage of the single cell at discrete-time index( k ), U P 2 k is the electrochemical polarization voltage of the cell at discrete-time index( k ), U P 1 ( k 1 ) is the concentration polarization voltage of the cell at discrete-time index( k 1 ), U P 2 ( k 1 ) is the electrochemical polarization voltage of the cell at discrete-time index( k 1 ), f U o c ( S O C k ) is the open circuit voltage of the cell at discrete-time index( k ), and I Ck is the charging current. The internal polarization resistance R 1 and R 2 , internal ohmic resistance R O and the polarization time constants τ 1 and τ 2 based on the different SOC can be obtained by linear interpolation according to the parameter identification template data. In the constant voltage mode, the charging current is calculated as:
I C k = U C k ( U o c k + U P 1 k + U P 2 k ) R O k ,
Here, U Ck is the charging voltage.
In order to test the information recognition and emergency response capability of the charger when the battery is over temperature, the battery temperature is regarded as an important information of the battery charging response in this paper.
The cell temperature is calculated as follows:
T k + 1 = T k + K T ( Q k Φ k ) Δ t C ,
Q k = 9.361 × 10 6 Q 1 I C k + U P 1 k 2 R 1 k + U P 2 k 2 R 2 k + I C k 2 R O k ( J / s ) ,
Φ k = T k T m R K ,
where, Q k is the heat generation of a cell, Q 1 is the electrochemical reaction heat per unit, Φ k is the heat dissipation of the cell. T k is the cell temperature, T m is the ambient temperature, and R K is the thermal resistance. The calculation of the charging response simulation in the constant current mode is shown in Figure 3:
The ability of the charger to identify and respond to battery abnormalities is an important aspect of the performance of the charger. It is equally important to test the ability during the mobile field test of the off-board charger. In response to this practical need, a battery abnormal state simulation function is added to the battery simulation system in this paper. It can simulate the abnormal phenomena such as overvoltage and over temperature that may occur in the battery during charging to adjust the SOC or internal resistance of battery online.

2.4. Lightweight Adjustable DC Charging Load

2.4.1. Main Circuit Topology

In order to reduce the size and weight of the electronic load, the lightweight adjustable DC charging load proposed in this paper is composed of the power battery pack of the mobile test vehicle and DC converter. The structure of the lightweight adjustable DC charging load is shown in Figure 4. The structure of the DC converter consisting of a boost converter and a buck converter is a three-phase interleaved parallel structure, which can effectively reduce the current stress of the switch tube and output current ripple of the converter to improve the capacity of the converter and power quality. When the off-board charger charges the load, the three-phase switch tubes of the boost converter and the buck converter are alternately turned on in turn in one switching period, and the turn-on time is T s / 3 , to ensure the current-sharing of the three-phase interleaved parallel DC converter to avoid the occurrence of circulating current. In this way, the charging load is equipped with the mode of constant voltage, constant current, constant power and constant resistance and the ability to be adjusted continuously within the rated range.

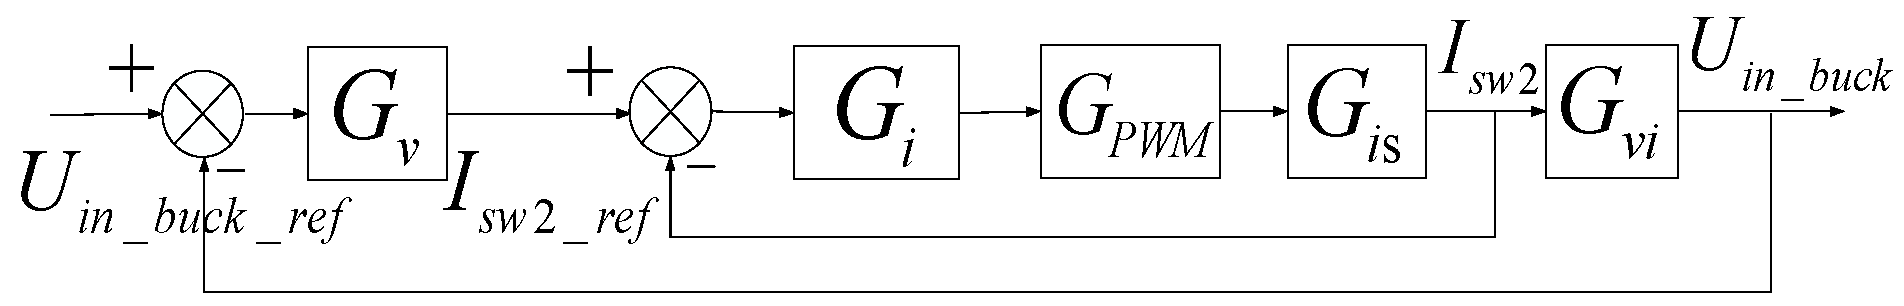
2.4.2. Control Method

The topology of the charging load designed in this paper is a three-phase interleaved parallel structure, and the control strategies of the three-phase switch tube are basically the same. The only difference of the control strategies of the three-phase switch tube is that the initial phase angles of the three-phase high-frequency triangular carrier are 120° out of one another. The control diagram of the charging load is shown in Figure 5. The control strategy of the Boost converter is a double closed-loop control. The outer loop is the regulator of voltage, current, power and the resistance of load, which corresponds to different working modes such as constant voltage, constant current, constant power, and constant resistance. The inner loop is a current regulator of the switch tube. The control strategy of the Buck converter is a double closed-loop control. The outer loop is a voltage regulator, and the inner loop is a current regulator of the switch tube.
The X in Figure 5 represents the controlled object, corresponding to the input voltage U i n , input current I i n , input power P i n and resistance of the load R l . G x and G i are the transfer functions of the outer loop regulator and the inner loop regulator respectively, and G i s and G x i are the transfer functions of the control signal to the inductor current and the controlled object to the inductor current, respectively.
In Figure 6, G v and G i are the transfer functions of the outer loop regulator and the inner loop regulator, respectively, and G i s and G v i are the transfer functions of the control signal to the inductor current and the output voltage to the inductor current, respectively. Taking the charging load working in the mode of the constant voltage as an example, the control strategy is described in detail. The structure diagram of the control system is shown in Figure 7.
The input voltage signal U i n is taken as the voltage feedback in the outer loop of the Boost circuit, and the difference between the U i n and the reference value of voltage U i n _ r e f is the error signal V w 1 which is the input signal of the proportional-integral voltage regulator. Then, the proportional-integral voltage regulator outputs the reference current I s w 1 _ r e f of the switch tube S 1 . The current signal I s w 1 of the switch tube is taken as the current feedback in the inner loop of the Boost circuit, and the difference between the I s w 1 and the I s w 1 _ r e f is the error signal I w 1 which is the input signal of the proportional-integral current regulator. Then, the proportional-integral current regulator outputs the signal V b o o s t . After the pulse width modulation, the control signal of the switch tube S 1 is the output.
The capacitor voltage U i n _ b u c k is taken as the voltage feedback in the outer loop of the Buck circuit, and the difference between the U i n _ b u c k and the reference value of the voltage U i n _ b u c k _ r e f is the error signal V w 2 which is the input signal of the proportional-integral voltage regulator. Then, the proportional-integral voltage regulator outputs the reference current I s w 2 _ r e f of the switch tube S 2 . The current signal I s w 2 of the switch tube is taken as the current feedback in the inner loop of the Boost circuit, and the difference between the I s w 2 and the I s w 2 _ r e f is the error signal I w 2 which is the input signal of the proportional-integral current regulator. Then, the proportional-integral current regulator outputs the signal V b u c k . After the pulse width modulation, the control signal of the switch tube S 2 is the output.

3. Results

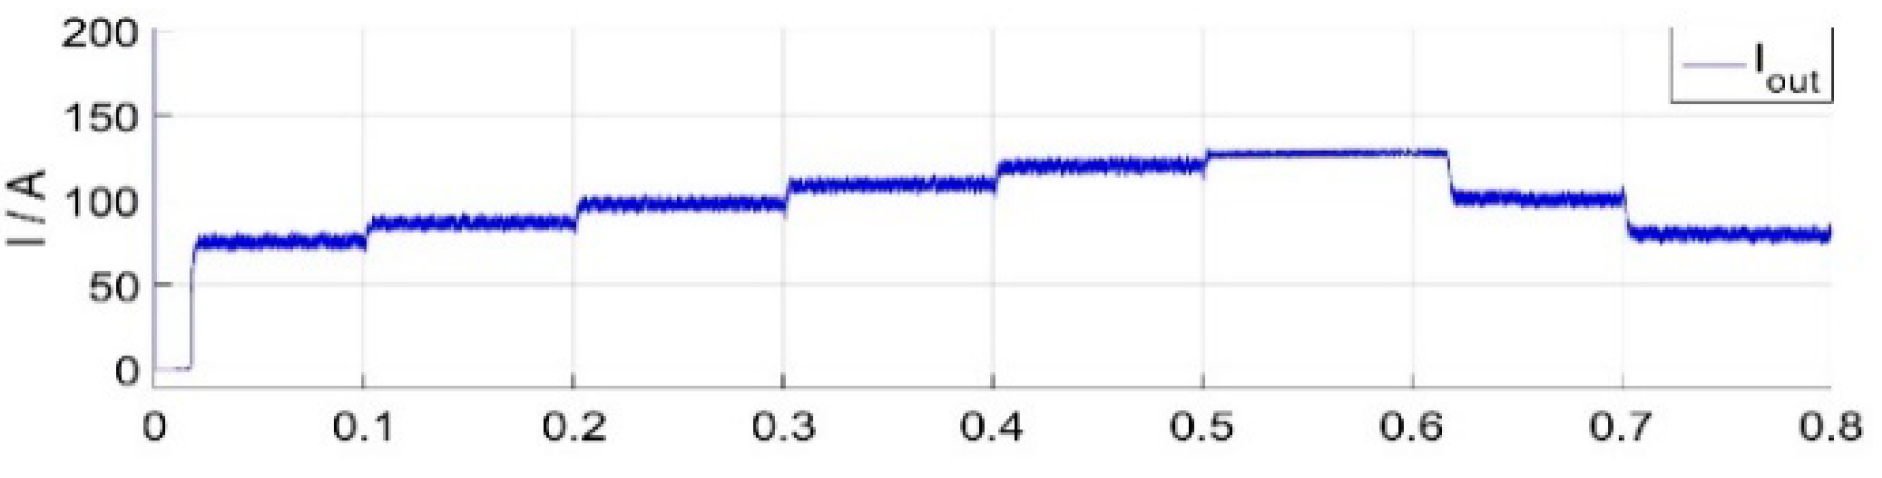
3.1. Results of Lightweight Adjustable DC Charging Load Simulation

By designing the control strategy of the DC converter, the charging load is equipped with the mode of constant voltage, constant current, constant power, and constant resistance and the ability to be adjusted continuously within the rated range.
The simulation model of the adjustable charging load working in the constant voltage mode is built in MATLAB. The parameters of the simulation model are shown in Table 1:
The simulation results are shown in Figure 8, Figure 9, Figure 10:
The parameters of the simulation model in the constant current mode are shown in Table 2:
The simulation results are shown in Figure 11, Figure 12, Figure 13:
The parameters of the simulation model in the constant power mode are shown in Table 3:
The simulation results are shown in Figure 14, Figure 15, Figure 16:
The parameters of the simulation model in the constant resistance mode are shown in Table 4:
The simulation results are shown in Figure 17, Figure 18, Figure 19:
As shown in Figure 8, Figure 11, Figure 14 and Figure 17, the input voltage, current, power and resistance can track the change of the input resistance reference value and become stable within 0.05 s when the input reference value changes, and the steady-state error is within 0.5%. The response speed and accuracy both meet the requirements. As shown in Figure 9, Figure 12, Figure 15 and Figure 18, the voltage of the cascading-side can become stable within 0.1 s, and the steady-state error is within 0.5%. The response speed and accuracy both meet the requirements, and the input voltage can be stabilized at 800 V. As shown in Figure 10, Figure 13, Figure 16 and Figure 19, when the input reference value changes, the output current changes smoothly and no large inrush current occurs, which will not shorten the battery pack life.
Since the field test project is limited and the test time is not long, it is completely feasible to store the charged electric energy in the process of testing into the battery pack of the mobile test vehicle, and the stored electric energy can be supplied to the air conditioner of the mobile test vehicle, which is economical and efficient.

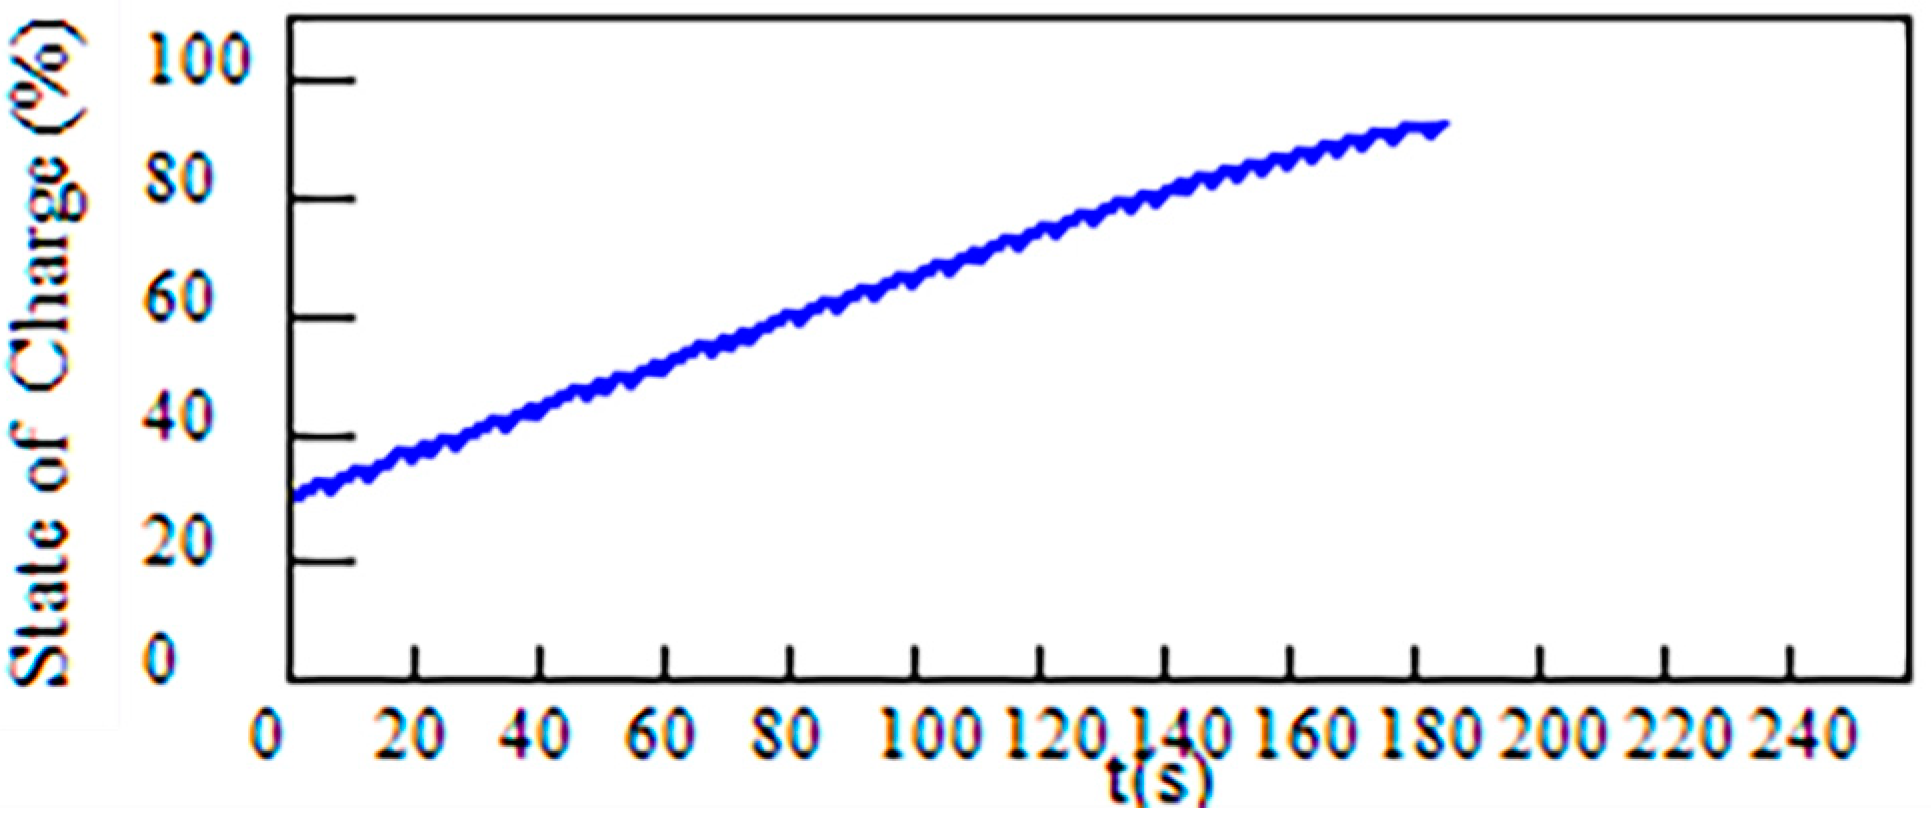
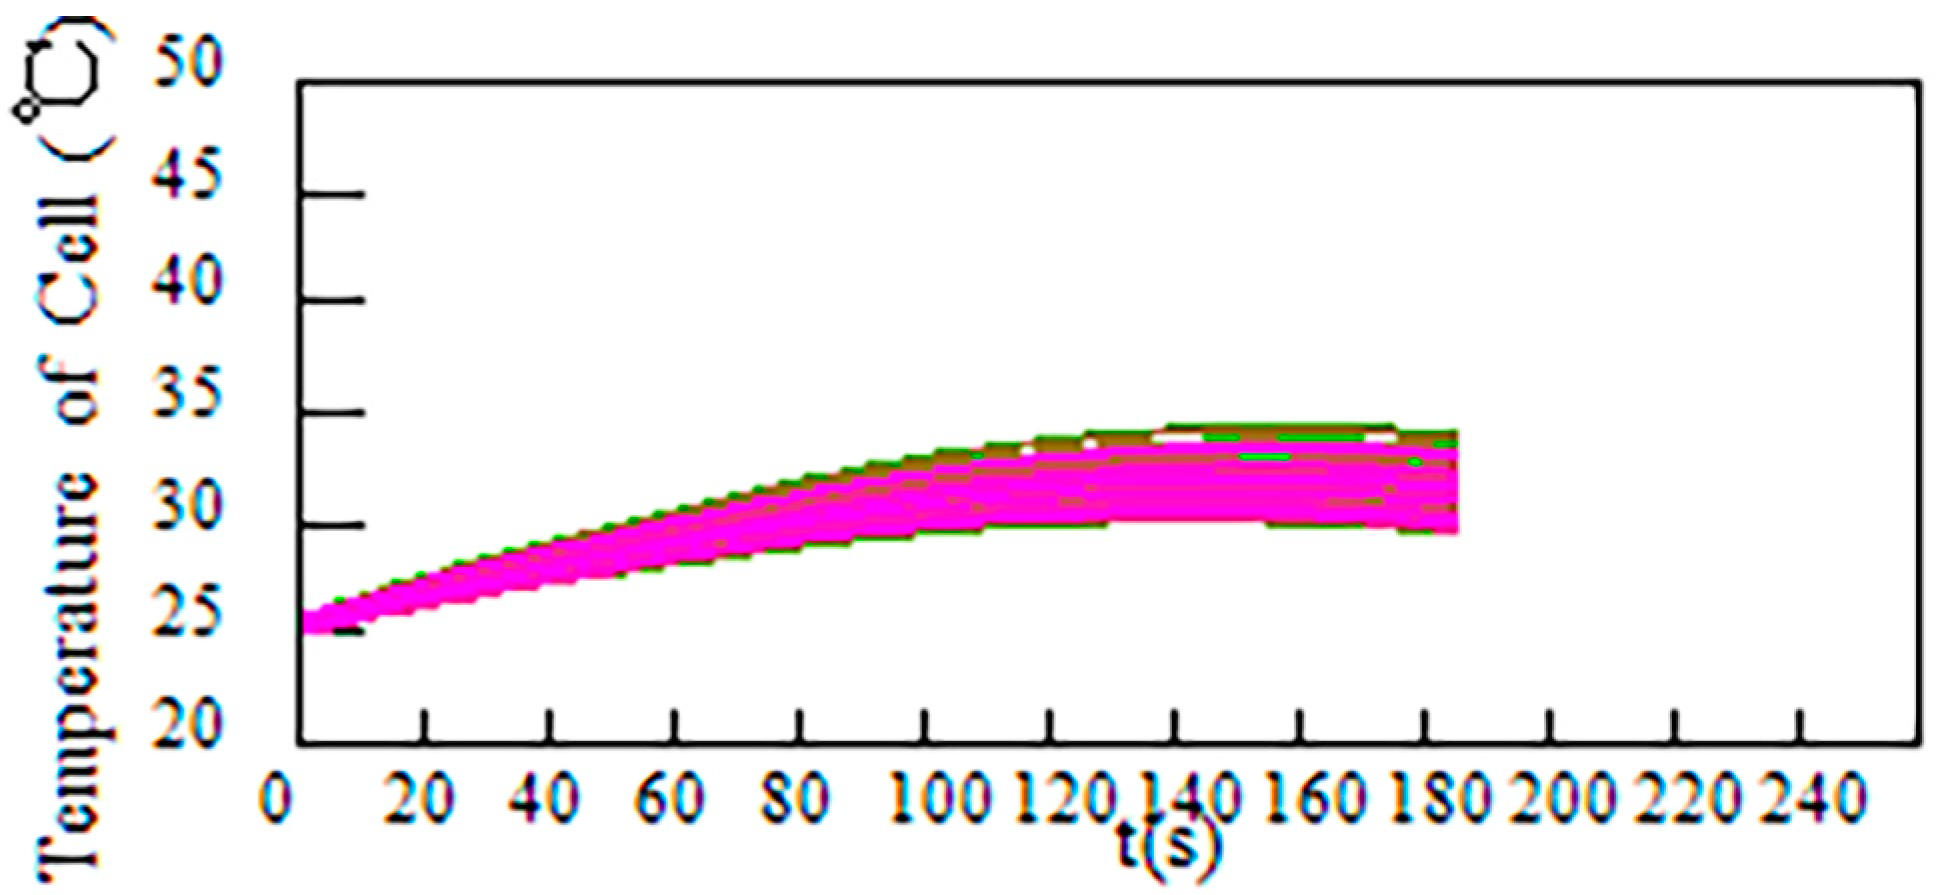
3.2. Results of Battery Simulation

Taking the LiFePO4 battery as an example, the LiFePO4 battery pack is formed by five battery modules in parallel and each battery module is formed by 20 single cells in the series. The charging mode of battery is constant current and constant voltage, and the charging current is 100 A. The rated voltage is 320 V, the rated capacity is 200 Ah. The maximum allowable voltage of the single cell is 3.7 V, the maximum allowable total charging voltage is 370 V, and the maximum allowable charging current is 150 A. The initial temperature is 25 °C, the maximum allowable temperature is 50 °C, and the initial SOC is 30%. A real-time state interface of a single cell including the voltage, current, temperature, and SOC of the battery is shown in Figure 20. The abnormality of the battery that may occur during the charging process such as the over temperature and overvoltage can be simulated by adjusting the internal resistance or the SOC of the battery. The current, voltage, and SOC of the battery pack in the constant current and constant voltage charging mode are shown in Figure 21, Figure 22 and Figure 23. The voltage and temperature of a cell in the “constant current and constant voltage” charging mode are shown in Figure 24 and Figure 25. Since an acceleration coefficient is added to the battery simulation system in this paper, the actual charging process for several hours can be simulated in a few minutes, which can greatly improve the efficiency of field test of charger.
The abnormality of the over temperature of the single-cell is simulated by increasing the internal resistance of cell No.1. The voltage of the normal cell and cell No.1 in the constant current charging mode are shown in Figure 26. The temperature of the normal cell and cell No.1 in the constant current charging mode are shown in Figure 27.

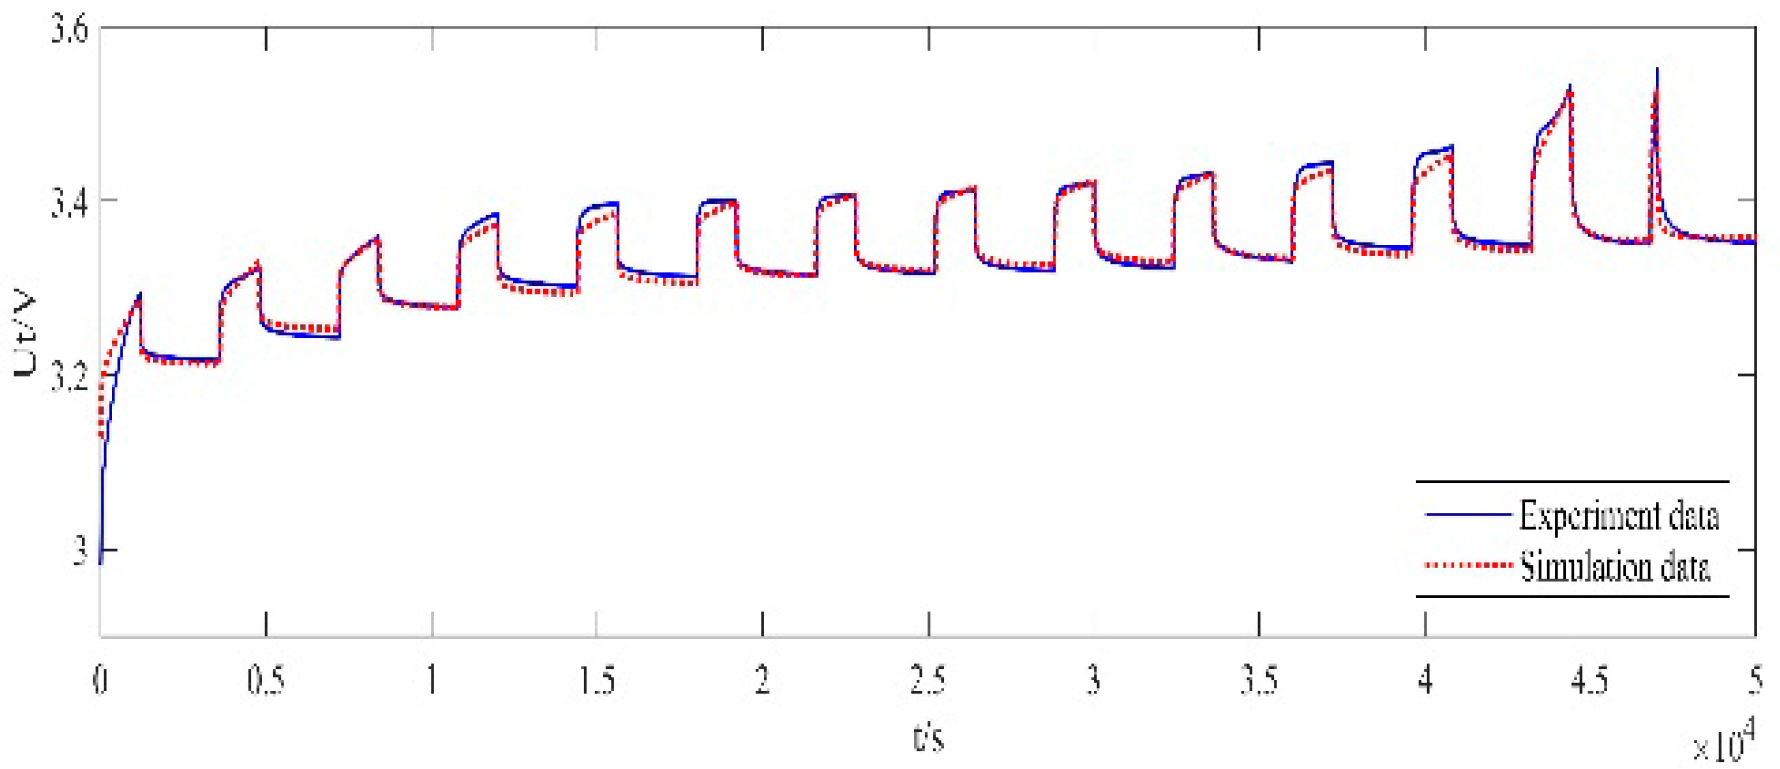
3.3. Battery Simulation System Verification and Validation

To validate the proposed battery simulation system, the experiment results are compared with the simulation results to analyze the accuracy of the battery simulation system. At the laboratory temperature 20 °C–25 °C, the actual LiFePO4 battery pack was charged in the mode of intermittent current which is 5 A, 6 A, 10 A, and 20 A, respectively and the mode of “constant current 5 A-constant voltage 350 V”. The charging response calculation of the power battery simulation system charged in the intermittent current mode and the constant current mode within the “constant current-constant voltage” mode is based on the charging current data recorded in the charging experiment. The charging response calculation of the power battery simulation system charged in the constant voltage mode within the “constant current-constant voltage” mode is based on the charging voltage data recorded in the charging experiment. The experiment data is compared with the simulation data of the power battery simulation system, and the comparison results is shown in Figure 28, Figure 29, Figure 30, Figure 31, Figure 32. The maximum voltage error is bounded within 0.05 V and the maximum current error is bounded within 0.5 A. It can be seen from the comparison results that the power battery simulation system can simulate the charging response of the actual battery very well and can meet the needs of the field test of the electric vehicle off-board charger.

4. Discussion

In view of the shortcomings of the traditional charging load for the field test of the electric vehicle off-board charger, an electric vehicle power battery simulation system combining an improved power battery model with the DC converter cascaded power battery pack of the mobile test vehicle for the mobile test of the off-board charger is proposed in this paper. The proposed battery simulation system can simulate different power battery packs to test the interoperability and communication consistency of the charging connector and the performance of the charging equipment. The experiment data is compared with the simulation data of the power battery simulation system, and the comparison results indicate that the maximum voltage error is bounded within 0.05 V and the maximum current error is bounded within 0.5 A. It can be seen from the comparison results that the power battery simulation system can simulate the charging response of the actual battery very well and can meet the needs of the field test of the electric vehicle off-board charger. The proposed battery simulation system is small in size and light in weight, which make the mobile test free from the limitation of the external factors such as vehicle loading space and underground-garage height; it can simulate different types of power battery packs to meet the test requirements of the off-board charger; it can greatly shorten the test time and improve the test efficiency; it can simulate the charging abnormal state of battery to test the response of charger to the charging abnormality. Among them, the DC converter cascaded power battery pack of the mobile test vehicle is used as the charging load. The simulation results showed that the charging load is equipped with the mode of constant voltage, constant current, constant power, and constant resistance and the ability to be adjusted continuously within the rated range. The electric energy during the test is stored in the mobile test vehicle battery, which is economical and efficient and reduces the weight and size of the charging load. The proposed battery simulation system can satisfy the requirement of the independent test of the off-board charger and make the application of the mobile test for the off-board charger more flexible. The experiment results can validate the accuracy and practicability of the proposed battery simulation system. However, the designed battery simulation system still needs the vehicle battery pack to store the electric energy, which leads to the limitation of the energy storage capacity. Future work could substitute the DC converter cascaded power battery pack for the inverter connected to the AC grid. The electric energy during the test could be directly fed back to the AC grid, which can avoid the limitation of the energy storage capacity.

Author Contributions

Conceptualization, X.Y.; Methodology, X.Y.; Software, L.W.; Validation, Z.C., S.Z. and Z.L.; Data curation, X.S.; Writing, L.W.

Funding

This research was supported by the National Natural Science Fundings of Hebei (E2018502134) and Beijing Electric Vehicle Charging and Recycling Engineering Technology Research Center Laboratory Open Fund: Electric Vehicle Charging Fault Monitoring and Early Warning Technology Research Project.

Conflicts of Interest

The authors declare no conflict of interest.

References

  1. Hu, Z.; Song, Y.; Xu, Z.; Luo, Z.; Zhan, W.; Jia, L. The influence and utilization of electric vehicles connected to the power grid. Proc. CSEE 2012, 32, 1–10. [Google Scholar]
  2. Wang, X.; Shao, C.; Wang, C.; Du, C. A review of charging load and dispatch control strategies for electric vehicles. Proc. CSEE 2013, 33, 1–10. [Google Scholar]
  3. Boulanger, A.G.; Chu, A.C.; Maxx, S.; Waltz, D.L. Vehicle electrification: Status and issues. Proc. IEEE 2011, 99, 1116–1138. [Google Scholar] [CrossRef]
  4. Guo, C.; Zhai, Z.; Wu, L.; Xiao, X. Analysis of the development prospects and key factors of electric vehicles. Automot. Eng. 2012, 34, 852–858. [Google Scholar]
  5. Wu, Q. Progress of China’s Ten Cities and Thousand Vehicles plan. Automob. Accessories 2009, 1, 15–19. [Google Scholar]
  6. Ma, L.; Yang, J.; Fu, C.; Liu, P.; Sun, Y. A review of research on effects of charge and discharge of electric vehicles on power grid. Power Syst. Prot. Control 2013, 41, 140–148. [Google Scholar]
  7. Xiao, X.; Wen, J.; Tao, S.; Li, Q. Research and suggestions on some key issues in electric vehicle charging infrastructure planning. J. Electrotech. 2014, 29, 1–10. [Google Scholar]
  8. Chen, L.; Zhang, H.; Ni, F.; Zhu, J. Discussion on the status quo and development of electric vehicle energy supply facilities. Power Syst. Autom. 2011, 35, 11–17. [Google Scholar]
  9. Lu, M.; Zhou, X.; Zhang, W. Research on the development status of electric vehicle charging facilities at home and abroad. Huazhong Electr. Power 2010, 5, 39–43. [Google Scholar]
  10. Xu, H.; Cai, J. An Optimal Design of Electric Vehicle Charging Piles Based on Time-space Sequence. Earth Environ. Sci. 2018, 170, 042027. [Google Scholar] [CrossRef]
  11. Gao, C.; Zhang, L. Overview of the impact of electric vehicle charging on power grid. Power Grid Technol. 2011, 35, 127–131. [Google Scholar]
  12. Liu, W.; Zhang, L.; Liu, Z.; He, J. Demonstration method of urban pure electric vehicle development model. Autom. Electr. Power Syst. 2014, 38, 34–40. [Google Scholar]
  13. Li, J.; Jiang, J. Research on the stability of pure electric vehicle charger system. Electr. Power Autom. Equip. 2012, 32, 13–17. [Google Scholar]
  14. Liu, H.; Huang, K.; Yang, Y.; Wei, H.; Ma, S. Real-time vehicle-to-grid control for frequency regulation with high frequency regulating signal. Prot. Control Mod. Power Syst. 2018, 3, 141–148. [Google Scholar] [CrossRef]
  15. Cui, X.; Shen, W.; Zheng, J. New on-line approach for lithium iron phosphate battery pack balancing based on state of charge. In Proceedings of the International Conference on Electrical Machinesand Systems IEEE, Pattaya, Thailand, 25–28 October 2016; pp. 762–767. [Google Scholar]
  16. Yang, Y.; Che, Y.; Yang, L. Comprehensive evaluation of multiple indicators of electric vehicle charger operation status. Electr. Power Autom. Equip. 2018, 38, 72–79. [Google Scholar]
  17. Ding, X.Z.; Bi, Z.Z.; Cao, M.; Wang, E.; Zhai, S.L. Technical analysis and experimental research of electric vehicle off-board charger. Electr. Meas. Instrum. 2012, 49, 14–17. [Google Scholar]
  18. Gu, Y. Research on Electric Vehicle Charger and Its Electrical Performance Test. Master’s Thesis, Department of Electronic and Engineering, Beijing Jiaotong University, Beijing, China, 2012. [Google Scholar]
  19. Liu, Y.L.; Li, G.D.; Hu, B.; Zhao, X.; Che, Y.B.; Teng, W. The establishment and practice of the detection platform for electric vehicle non-vehicle charger. J. Power Syst. Autom. 2015, 27, 98–102. [Google Scholar]
  20. Zhu, B.; Hou, X.Z.; Sun, H.L.; Liu, Y.X.; Wang, H.C. Electric vehicle charging facility automatic detection platform design. Electr. Meas. Instrum. 2017, 54, 75–80. [Google Scholar]
  21. Zhu, B.; Ma, G.L.; Wang, J.G.; Sun, H.L.; Liu, Y.X.; Wu, Y.; Li, Z.; Long, W.; Xu, T.T.; Wang, H.C. Electric vehicle DC charger automatic detection platform design. Power Grid Clean Energy 2017, 33, 120–127. [Google Scholar]
  22. Yan, Q.W.; He, J.Q. Design of automatic detection system for DC charging point of electric vehicle. Comput. Meas. Control 2018, 26, 35–38. [Google Scholar]
  23. He, Z.; Yang, G.; Lu, L.; Wu, H.; Yan, H. Design of power electronic load system for simulating motor port characteristics. J. Electrotech. 2016, 31, 194–203. [Google Scholar]
  24. Yan, X.; Wang, L.; Li, Y.; Gu, J.; Zhang, B.; Yin, F.; Zhang, H. Test system for electric vehicle charging equipment based on virtual battery technology. Electr. Power Autom. Equip. 2014, 34, 27–33. [Google Scholar]
  25. Bai, H.; Zhang, Y.; Semanson, C.; Luo, C.; Mi, C.C. Modelling, design and optimisation of a battery charger for plug-in hybrid electric vehicles. IET Electr. Syst. Transp. 2011, 1, 3–10. [Google Scholar] [CrossRef] [Green Version]
  26. Lu, Y.; Cheng, K.W.E.; Zhao, S.W. Power battery charger for electric vehicles. IET Power Electron. 2011, 4, 580–586. [Google Scholar] [CrossRef]
  27. Yan, X.; Li, W.; Xiao, X.; Zhang, C. Virtual battery management system. Power Electron. Technol. 2011, 45, 42–44. [Google Scholar]
  28. Bae, K.C.; Choi, S.C.; Kim, J.H.; Won, C.Y.; Jung, Y.C. LiFePO4 dynamic battery modeling for battery simulator. In Proceedings of the IEEE International Conference on Industrial Technology, Busan, South Korea, 26 February–1 March 2014. [Google Scholar]
  29. Roiu, D.; Primon, A.; Rossella, M.; Ornato, M. 2V battery modeling: Model development, simulation and validation. In Proceedings of the International Conference of Electrical and Electronic Technologies for Automotive, Torino, Italy, 15–16 June 2017. [Google Scholar]
  30. Lee, J.; Ahn, J.H.; Lee, B.K. A novel li-ion battery pack modeling considerging single cell information and capacity variation. In Proceedings of the IEEE Energy Conversion Congress and Exposition (ECCE), Cincinnati, OH, USA, 1–5 October 2017; pp. 5242–5247. [Google Scholar]
  31. Cheng, L.; Tang, A.H. Simplification and Efficient Simulation of Electrochemical Model for Li-ion Battery in EV. Energy Procedia 2016, 104, 68–73. [Google Scholar]
  32. Schellenberg, S.; Berndt, R.; Eckhoff, D.; German, R. Computationally inexpensive battery model for the microscopic simulation of electric vehicles. In Proceedings of the IEEE 80th Vehicular Technology Conference (VTC2014-Fall), Vancouver, BC, Canada, 14–17 September 2014. [Google Scholar]
  33. Li, J.W.; Mazzola, M.S. Accurate battery pack modeling for automotive applications. J. Power Sources 2013, 237, 215–228. [Google Scholar] [CrossRef]
  34. Huang, Q.; Sun, M.; Zou, X.; Xiong, W. A Dynamic modeling of power battery. Autom. Electr. Power Syst. 2014, 38, 71–77. [Google Scholar]
  35. Li, J.; Gao, F.; Yan, G.; Zhang, T.; Li, J. Modeling and SOC estimation of lithium iron phosphate battery considering capacity loss. Prot. Control Mod. Power Syst. 2018, 3, 61–69. [Google Scholar] [CrossRef]
  36. Cheng, K.W.E.; Divakar, B.P.; Wu, H.; Ding, K. Ho Fai Ho Battery-Management System (BMS) and SOC Development for Electrical Vehicles. IEEE Trans. Veh. Technol. 2011, 60, 76–88. [Google Scholar] [CrossRef]
  37. Gregory, L.P. Extended Kalman filtering for battery Mana-gementsystems of LiPB-based HEV battery packs: Part 2.modeling and identification. J. Power Sources 2014, 134, 262–276. [Google Scholar]
Figure 1. Function chart of the battery simulation system.
Energies 12 03025 g001
Figure 2. Dynamic circuit model of power cell.
Energies 12 03025 g002
Figure 3. Calculation flow chart of simulation battery system.
Energies 12 03025 g003
Figure 4. Topology of the lightweight adjustable charging load.
Energies 12 03025 g004
Figure 5. Control diagram of Boost converter.
Energies 12 03025 g005
Figure 6. Control diagram of Buck converter.
Energies 12 03025 g006
Figure 7. Structure diagram of control system with single-phase adjustable charging load working in constant voltage mode.
Energies 12 03025 g007
Figure 8. Waveform of input voltage in the constant voltage mode.
Energies 12 03025 g008
Figure 9. Waveform of cascading-side voltage in the constant voltage mode.
Energies 12 03025 g009
Figure 10. Waveform of output current in the constant voltage mode.
Energies 12 03025 g010
Figure 11. Waveform of input current in the constant current mode.
Energies 12 03025 g011
Figure 12. Waveform of cascading-side voltage in the constant current mode.
Energies 12 03025 g012
Figure 13. Waveform of output current in the constant current mode.
Energies 12 03025 g013
Figure 14. Waveform of input power in the constant power mode.
Energies 12 03025 g014
Figure 15. Waveform of cascading-side voltage in the constant power mode.
Energies 12 03025 g015
Figure 16. Waveform of output current in the constant power mode.
Energies 12 03025 g016
Figure 17. Waveform of load resistance in the constant resistance mode.
Energies 12 03025 g017
Figure 18. Waveform of cascading-side voltage in the constant resistance mode.
Energies 12 03025 g018
Figure 19. Waveform of output current in the constant resistance mode.
Energies 12 03025 g019
Figure 20. Real-time state interface of single cell.
Energies 12 03025 g020
Figure 21. Current waveform of battery pack in the constant current and constant voltage charging mode.
Energies 12 03025 g021
Figure 22. Voltage waveform of battery pack in the constant current and constant voltage charging mode.
Energies 12 03025 g022
Figure 23. SOC waveform of battery pack in the constant current and constant voltage charging mode.
Energies 12 03025 g023
Figure 24. Voltage waveform of cells in the constant current and constant voltage charging mode.
Energies 12 03025 g024
Figure 25. Temperature waveform of cells in the constant current and constant voltage charging mode.
Energies 12 03025 g025
Figure 26. Voltage waveform of normal cell and cell No.1 in the constant current charging mode.
Energies 12 03025 g026
Figure 27. Temperature waveform of normal cell and cell No.1 in the constant current charging mode.
Energies 12 03025 g027
Figure 28. Comparison of experiment results and simulation results of charging in 5 A intermittent current.
Energies 12 03025 g028
Figure 29. Comparison of experiment results and simulation results of charging in 6 A intermittent current.
Energies 12 03025 g029
Figure 30. Comparison of experiment results and simulation results of charging in 10 A intermittent current.
Energies 12 03025 g030
Figure 31. Comparison of experiment results and simulation results of charging in 20 A intermittent current.
Energies 12 03025 g031
Figure 32. Comparison of experiment results and simulation results of charging in “constant current 5 A- constant voltage 350 V”.
Energies 12 03025 g032
Table 1. Model parameters in the constant voltage mode.
ParametersNumerical Value
Input current (A)30
Output voltage (V)350
Cascading-side voltage (V)800
Reference value of input voltage (V)300–600
Inductance (mH)0.5
Input-side capacitance (μF)2200
Cascading-side capacitance (μF)2200
Output-side capacitance (μF)2200
Switch frequency of IGBT (kHz)20
Table 2. Model parameters in the constant current mode.
ParametersNumerical Value
Input voltage (A)400
Output voltage (V)350
Cascading-side voltage (V)800
Reference value of input current (A)80–130
Inductance (mH)0.5
Input-side capacitance (μF)2200
Cascading-side capacitance (μF)2200
Output-side capacitance (μF)2200
Switch frequency of IGBT (kHz)20
Table 3. Model parameters in the constant power mode.
ParametersNumerical Value
Input voltage (A)400
Output voltage (V)350
Cascading-side voltage (V)900
Reference value of input power (kW)40–65
Inductance (mH)0.5
Input-side capacitance (μF)2200
Cascading-side capacitance (μF)2200
Output-side capacitance (μF)2200
Switch frequency of IGBT (kHz)20
Table 4. Model parameters in the constant resistance mode.
ParametersNumerical Value
Input current (A)30
Output voltage (V)350
Cascading-side voltage (V)800
Reference value of load resistance (Ω)8–18
Inductance (mH)0.5
Input-side capacitance (μF)2200
Cascading-side capacitance (μF)2200
Output-side capacitance (μF)2200
Switch frequency of IGBT (kHz)20

