Next Article in Journal
Design and Implementation of a Low-Power Low-Cost Digital Current-Sink Electronic Load
Previous Article in Journal
Gasification of Waste Cooking Oil to Syngas by Thermal Arc Plasma
 
 
Erratum published on 29 October 2021, see Energies 2021, 14(21), 7077.
Article

Numerical Investigation of Flow and Heat Transfer in a Rotor-Stator Cavity with Centripetal Carbon Dioxide Through-Flow

1
Department of Energy and Power Engineering, Tsinghua University, Beijing 100084, China
2
Department of Mechanical Engineering, University of Duisburg-Essen, 47057 Duisburg, Germany
3
Key Laboratory of Fluid and Power Machinery, Xihua University, Ministry of Education, Chengdu 610039, China
*
Authors to whom correspondence should be addressed.
Energies 2019, 12(13), 2613; https://doi.org/10.3390/en12132613
Submission received: 31 May 2019 / Revised: 4 July 2019 / Accepted: 5 July 2019 / Published: 7 July 2019

Abstract

:
A centrifugal carbon dioxide compressor is a kind of general machine with extensive applications. The geometry of the side chambers of the compressors can be determined by studying the rotor-stator cavity with centripetal through-flow. In this paper, numerical simulations were conducted to predict the characteristics of flow and heat transfer. Three different speeds of rotation and two axial gap widths were considered. The correlations of the core swirl ratios were determined by fitting the results for two axial gap widths. The amounts of the moment coefficients of the disk were predicted. In order to better analyze the temperature field, the radial distributions of the local heat transfer coefficient were numerically investigated. According to the simulation results, the average Nusselt number was found to be dominated by the turbulent flow parameter. It also seemed to be proportional to the moment coefficient at a fixed circumferential Reynolds number.

Graphical Abstract

1. Background

The main application fields of centrifugal carbon dioxide compressors are at oil exploitation sites as the supplies of injection gas or at carbon capture and storage power plants for carbon dioxide compression [1]. To transport more fluid and to lower the energy consumption, the rotational speed of the impeller in a large centrifugal carbon dioxide compressor increases rapidly, whose circumferential Reynolds number R e , defined in Equation (1), is up to 2.09 × 10 7 . There are two main methods used to improve the compressor efficiencies. The first method, which is extensively studied, is to optimize the geometry of the impeller. The other method is to conduct the geometry optimization of the side chambers (both the front chamber and the back chamber in Figure 1), which is not sufficiently researched. The unreasonable geometry of the side chamber may result in excessive axial thrust, severe mechanical vibration, large disk frictional loss, low service life, etc. Compared with air, carbon dioxide is a kind of fluid with low kinematic viscosity. The design of the side chambers in such a centrifugal compressor is therefore becoming one of the focuses of study. In Figure 1a, a meridional sketch of a centrifugal carbon dioxide compressor stage is depicted. The side chambers include the front chamber (marked blue) and the back chamber (marked green). The simplified model of either side chamber is the rotor-stator cavity with centripetal through-flow, shown in Figure 1b. In order to design the geometry rationally, it is of great significance to investigate the characteristics of the flow and the heat transfer within the cavity.
R e = Ω · b 2 v
where Ω is the angular velocity of the disk, b is the outer radius of the disk, and ν is the kinematic viscosity.

1.1. Turbulent Flow Type

In a rotor-stator cavity, the dynamic behaviors and the energy losses differ depending on the turbulent flow types. In a side chamber, the turbulent flow is classified into two types [2,3], namely the Batchelor type and the Couette type. The difference is that the Batchelor-type flow has a viscous core region (the gradient of the tangential velocity V t is close to zero) between the disk boundary layer and the wall boundary layer, while the Couette-type flow has merged boundary layers. Owen et al. [4,5,6] distinguished the Batchelor type flow based on the turbulent flow parameter λ t , defined in Equation (2). The parameter λ t weighs the relative strength of the viscous and the inertial force of the through-flow. Ewa et al. [7,8] found that the Couette-type flow may change to the Batchelor-type flow with the increase of the non-dimensional axial gap G   (defined in Equation (2)) or with the increase of R e . Hu et al. [9] investigated the effects of G and through-flow on the flow types when the flow changes from the Batchelor type to the Couette type based on numerical simulations. With a third axis of the through-flow coefficient C w , they extended part of the 2D Daily and Nece diagram into 3D. The boundaries distinguishing the Batchelor-type flow and the Couette -type flow are valid for the parameter ranges | C w | 5050 and R e 3.17 × 10 6 .
λ t = C w R e 0.8 ;     C w = m ˙ μ · b ;     G = s b  
where λ t is the turbulent flow parameter, C w is the through-flow coefficient, m ˙ is the mass flow rate, and μ is the dynamic viscosity.

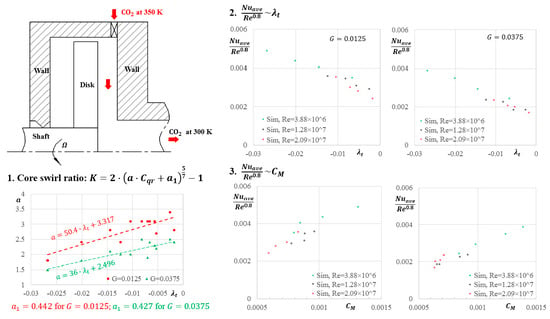
1.2. Core Swirl Ratio

The core swirl ratio K is defined in Equation (3). It is the ratio of the angular velocity of the fluid Ω f at a position half of the axial gap width to that of the disk, namely Ω . The radial distributions of K can be used to estimate the pressure distributions along the rotor. After that, the axial thrust can be predicted. Poncet et al. [2,3], Hu et al. [9] and Debuchy et al. [10] investigated the velocity profiles for both the Batchelor-type and the Couette-type flow. Hu et al. [11] investigated the effects of G and centrifugal through-flow on K. Nguyen et al. [12] studied the velocity profiles in a rotor-stator system by PIV (Particle Image Velocimetry) measurements. Lock et al. [13] investigated the distributions of K in a rotor-stator cavity with pre-swirl nozzles, which deliver the cooling air to the turbine blade. Kurokawa et al. [14,15], Coren et al. [16] and Will et al. [17,18] conducted either numerical or the experimental investigations on K.
K = Ω f Ω   at   ζ = 0.5 ;   ζ = z s
where Ω f is the angular velocity of the fluid, and ζ is the non-dimensional axial coordinate.

1.3. Disk Frictional Loss

Reducing the disk frictional losses is always the hotspot of the research into rotor-stator cavities. With the models of enclosed rotor-stator cavities, Daily and Nece [19] found that the moment coefficient C M , defined in Equation (4), on a single surface can be predicted according to the flow regimes. Kurokawa et al. [20] illustrated the impacts of C w on C M . Dibelius et al. [21] carried out the torque measurements in a shrouded rotor-stator system. Gartner [22,23] used an analytical approach to predict the frictional torque in a rotor-stator system with both radial outflow and cylindrical shroud. Coren et al. [16] determined a correlation giving the amounts of C M in terms of R e and C w . Dorfman [24] theoretically studied the effects of disk roughness on C M . By pasting sand papers, Daily and Nece [25], Kurokawa et al. [20] and Hu et al. [26] experimentally investigated the roughness effects on CM.
C M = 2 · | M | ρ · Ω 2 · b 5
where M is the frictional torque on a single surface, ρ is the density of the fluid.

1.4. Heat Transfer

The design of a side chamber requires insight into the characteristics of the heat transfer. Metzger et al. [27] calculated the average convective heat transfer coefficient h a v e , computed with Equation (5), on the rotor with the help of remote infrared sensors.
h a v e = r c b 2 h r d r b 2 r c 2
where h is transfer coefficient and r c is the inner radius where the measurements of h start.
Owen’s research group [4,5,6], Metzger’s research group [28,29,30] and Luo et al. [31] used the transient TLC technique to measure the radial distribution of the local convective heat transfer coefficient h , computed as
h = q ( T a w T w ) ;   T a w = T + r r e c · u 2 2 · l ;   r r e c P r 0.5 ;   P r = μ · l k
where q is the heat flux, T a w is the adiabatic wall temperature, T w is the surface temperature, T is the temperature of the mainstream at ζ = 0.5, r r e c is the recovery factor, u is the velocity of the mainstream at ζ = 0.5 , l is the specific heat at constant pressure, P r is the Prandtl number and, k is the thermal conductivity.
Luo et al. [31] found that the heat transfer behaviors of the rotor are quite different in the viscous, the co-determined and the inertial sections, which are identified by the amounts of the flow pattern parameters. Poncet et al. [32] performed a numerical investigation on the flow and the heat transfer inside a rotor-stator cavity. Tuliszka-Sznitko et al. [33] and Majchrowski et al. [34] performed the large-eddy simulation for the distributions of the local Nusselt numbers N u , written in Equation (7). Tuliszka-Sznitko et al. [35] conducted the numerical investigations on the flow and the heat transfer in a rotating cavity. In the literature, however, most of the investigations concerning the characteristics of the heat transfer are conducted using the rotor-stator cavity model with centrifugal through-flow instead of centripetal through-flow.
N u = h · r k ;   N u a v e = r c b 2 h r 2 d r k ( b 2 r c 2 )
The parameter k is mainly affected by the temperature. By fitting the results in [36], the heat conductivity k of carbon dioxide is estimated with Equation (8). The variation of k versus T is plotted in Figure 2.
k = 8 × 10 5 · T 0.0069
Currently, most of the investigations concerning rotor-stator cavities are performed for R e 3.17 × 10 6 . The experimental medium is primarily water or air. The available results of the velocity and the moment coefficient, however, are not fully applicable to the design of the side chambers in centrifugal carbon dioxide compressors with the numbers of R e up to 2.09 × 10 7 . In order to extend the service life, the characteristic of the heat transfer should also be studied. Hence, this paper aimed to conduct the numerical simulations of the flow and the heat transfer in a rotor-stator cavity with centripetal carbon dioxide through-flow. To verify the correctness of the simulation set-ups, some measurements of the tangential velocity, the temperature and the disk frictional torque were performed by the rotor-stator cavity group at the chair of turbomachinery, University of Duisburg-Essen. The results were used to verify the correctness of the set-ups of numerical simulations. According to the results from numerical simulations, the distributions of K , C M , h and the average Nusselt number N u a v e were predicted for two cavity models: G = 0.0125 and G = 0.0375 . The results in this paper can help the designers to better design high-speed centrifugal carbon dioxide compressors.

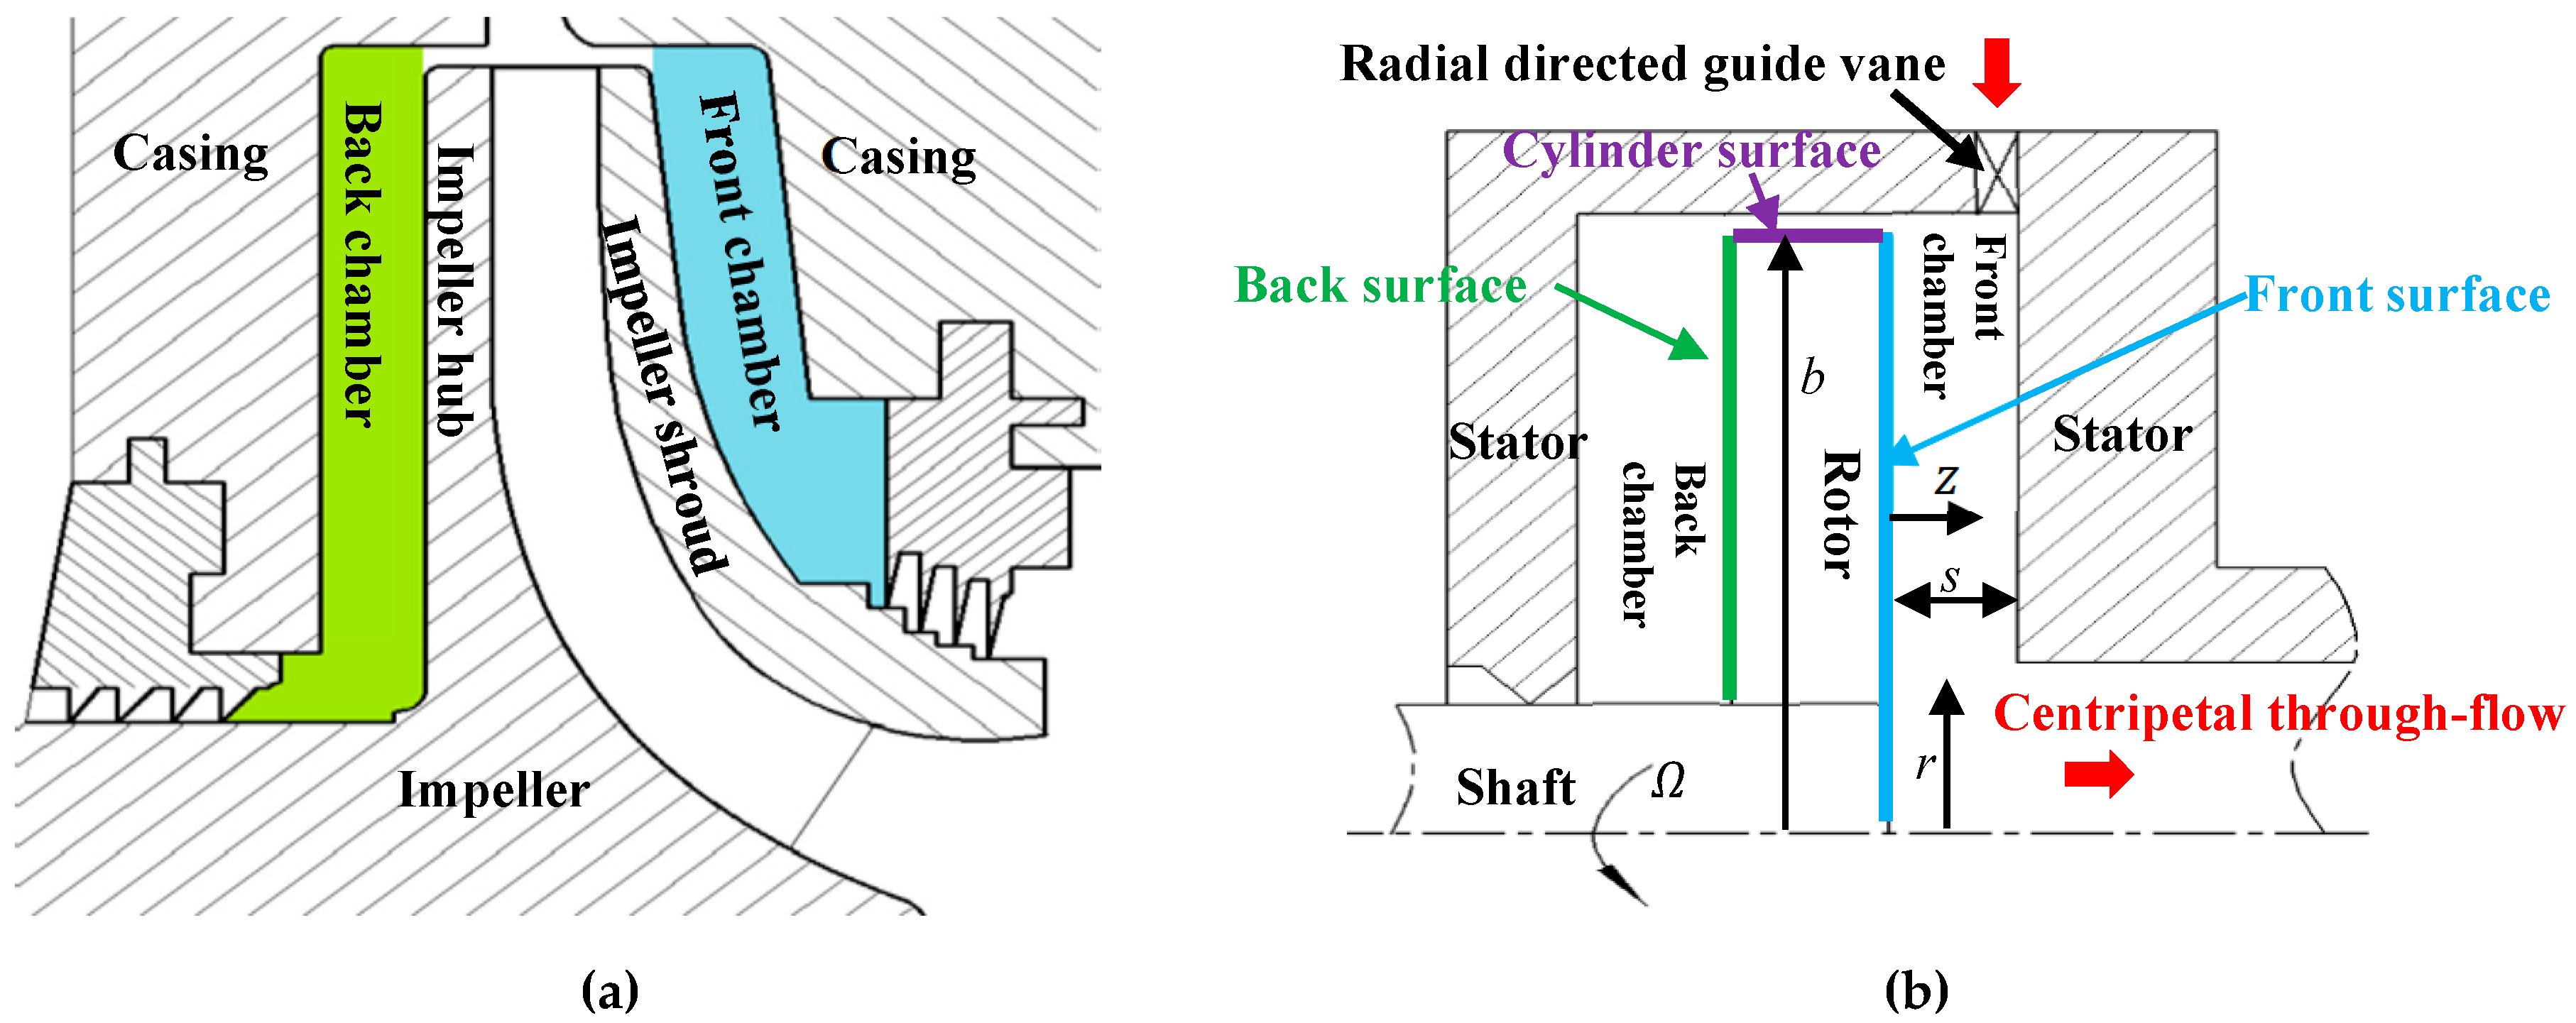
2. Rotor-Stator Cavity Test Rig

A rotor-stator cavity test rig with carbon dioxide was designed and built-up to investigate the cavity flow at the University of Duisburg-Essen. A sketch of the main region is shown in Figure 3 [1]. The main parameters of the test zone are listed in Table 1, which describes exactly the geometry of the back chamber of the original Duisburg rig [1]. The front chamber (FC) is the test section. The test rig mainly includes four parts, namely the air supply system, the pipelines, the test zone and the data acquisition system. A centrifugal compressor is used to supply the desired carbon dioxide flow. The carbon dioxide enters the test section via the pipeline and a mesh heater. The temperature of the carbon dioxide at the inlet of the test rig (see Figure 3) is around 350 K, which is measured by a thermocouple. The pressure at the inlet is around 2 bar (absolute pressure). The front cover has a special designed geometry so that the axial gap width of the front cavity can be changed. A radial directed guide vane is installed (see Figure 1) at the inlet, ensuring that the flow has no angular momentum when pumped into the cavity. The shaft of the test rig is driven by a high-speed motor. The disk frictional torque is measured by a torquemeter. The front cover of the test rig is produced with 13 holes at different radial coordinates for the implementation of hot-wire anemometry (5 positions) and the measurements of pressure or temperature (8 positions), given in Table 2. The probes of both the hot-wire and the thermocouple measure the data at the position ζ = 0.5 . The errors of the measurements are listed in Table 3.

3. Numerical Simulation

3.1. Numerical Simulation Set-Ups

Numerical simulations are carried out using the ANSYS CFX 13.0 code. Considering the axial symmetry of the problem, two segments (each 5 degree) of the two domains ( G = 0.0125 and G = 0.0375 ) are modeled and meshed. A rotational periodic boundary condition is applied. Due to the good thermal conductivity of the aluminum disk and the cooling system in the stationary wall, the temperature on the front surface, the back surface of the disk and the stationary wall (see Figure 3) are set as 300 K (environment temperature). The surface roughness on all the surfaces in contact with carbon dioxide are R z = 1 μ m . The boundary conditions at the inlet and the outlet are the pressure inlet and mass flow outlet. The values of pressure at the inlet are set as 2 bar (absolute pressure), which is obtained by the pressure measurements at the cavity inlet. At the outlet, the values of the mass flow rate are set according to the correlation m ˙ = 1 72 · μ · b · C w . The simulation type is set as steady state. The convergence criteria for all the numerical simulations are set as 10 5 in RMS type. The heat transfer model is set as total energy. The values of the temperature at the centripetal inlet and the cavity outlet are set as 350 K and 300 K. The fluid for numerical simulations is carbon dioxide at STP. The turbulent numeric is set as second-order upwind. The mesh independence analyses are performed, and the suitable numbers of elements are 1.23 million ( G = 0.0125 ) and 1.47 million ( G = 0.0375 ), respectively. The maximum value of y + in the two simulation models is 3.4. The SST k ω turbulence model in combination with the scalable wall functions is selected [1]. The values of C w and R e investigated in this paper are given in Table 4. The values of Q t , Cw and C q r are defined as negative for centripetal through-flow.

3.2. Verifications of the Numerical Simulation Set-Ups

The experiments are conducted to verify the correctness of the numerical simulation set-ups. The values of K and θ , related by Equation (9), from numerical simulations and by measurements are compared in Figure 4a,b. The distributions of K from numerical simulations are in relatively good accordance with those obtained by measurements. At a small axial gap width of G = 0.0125 , the differences of K are relatively large. It is speculated that the geometry of the hot-wire probe has a relatively large impact on the local velocity distribution for G = 0.0125 . The amounts of θ from numerical simulations follow the same trends as those by measurements. The errors are primarily attributed to the assumption that the temperatures on the surfaces of both the rotor and the stator are fixed values while there are certain temperature gradients during the experiments.
θ = T T m i n T m a x T m i n   at   ζ = 0.5
where T m a x is the maximum temperature and T m i n is the minimum temperature.

4. Results and Discussions

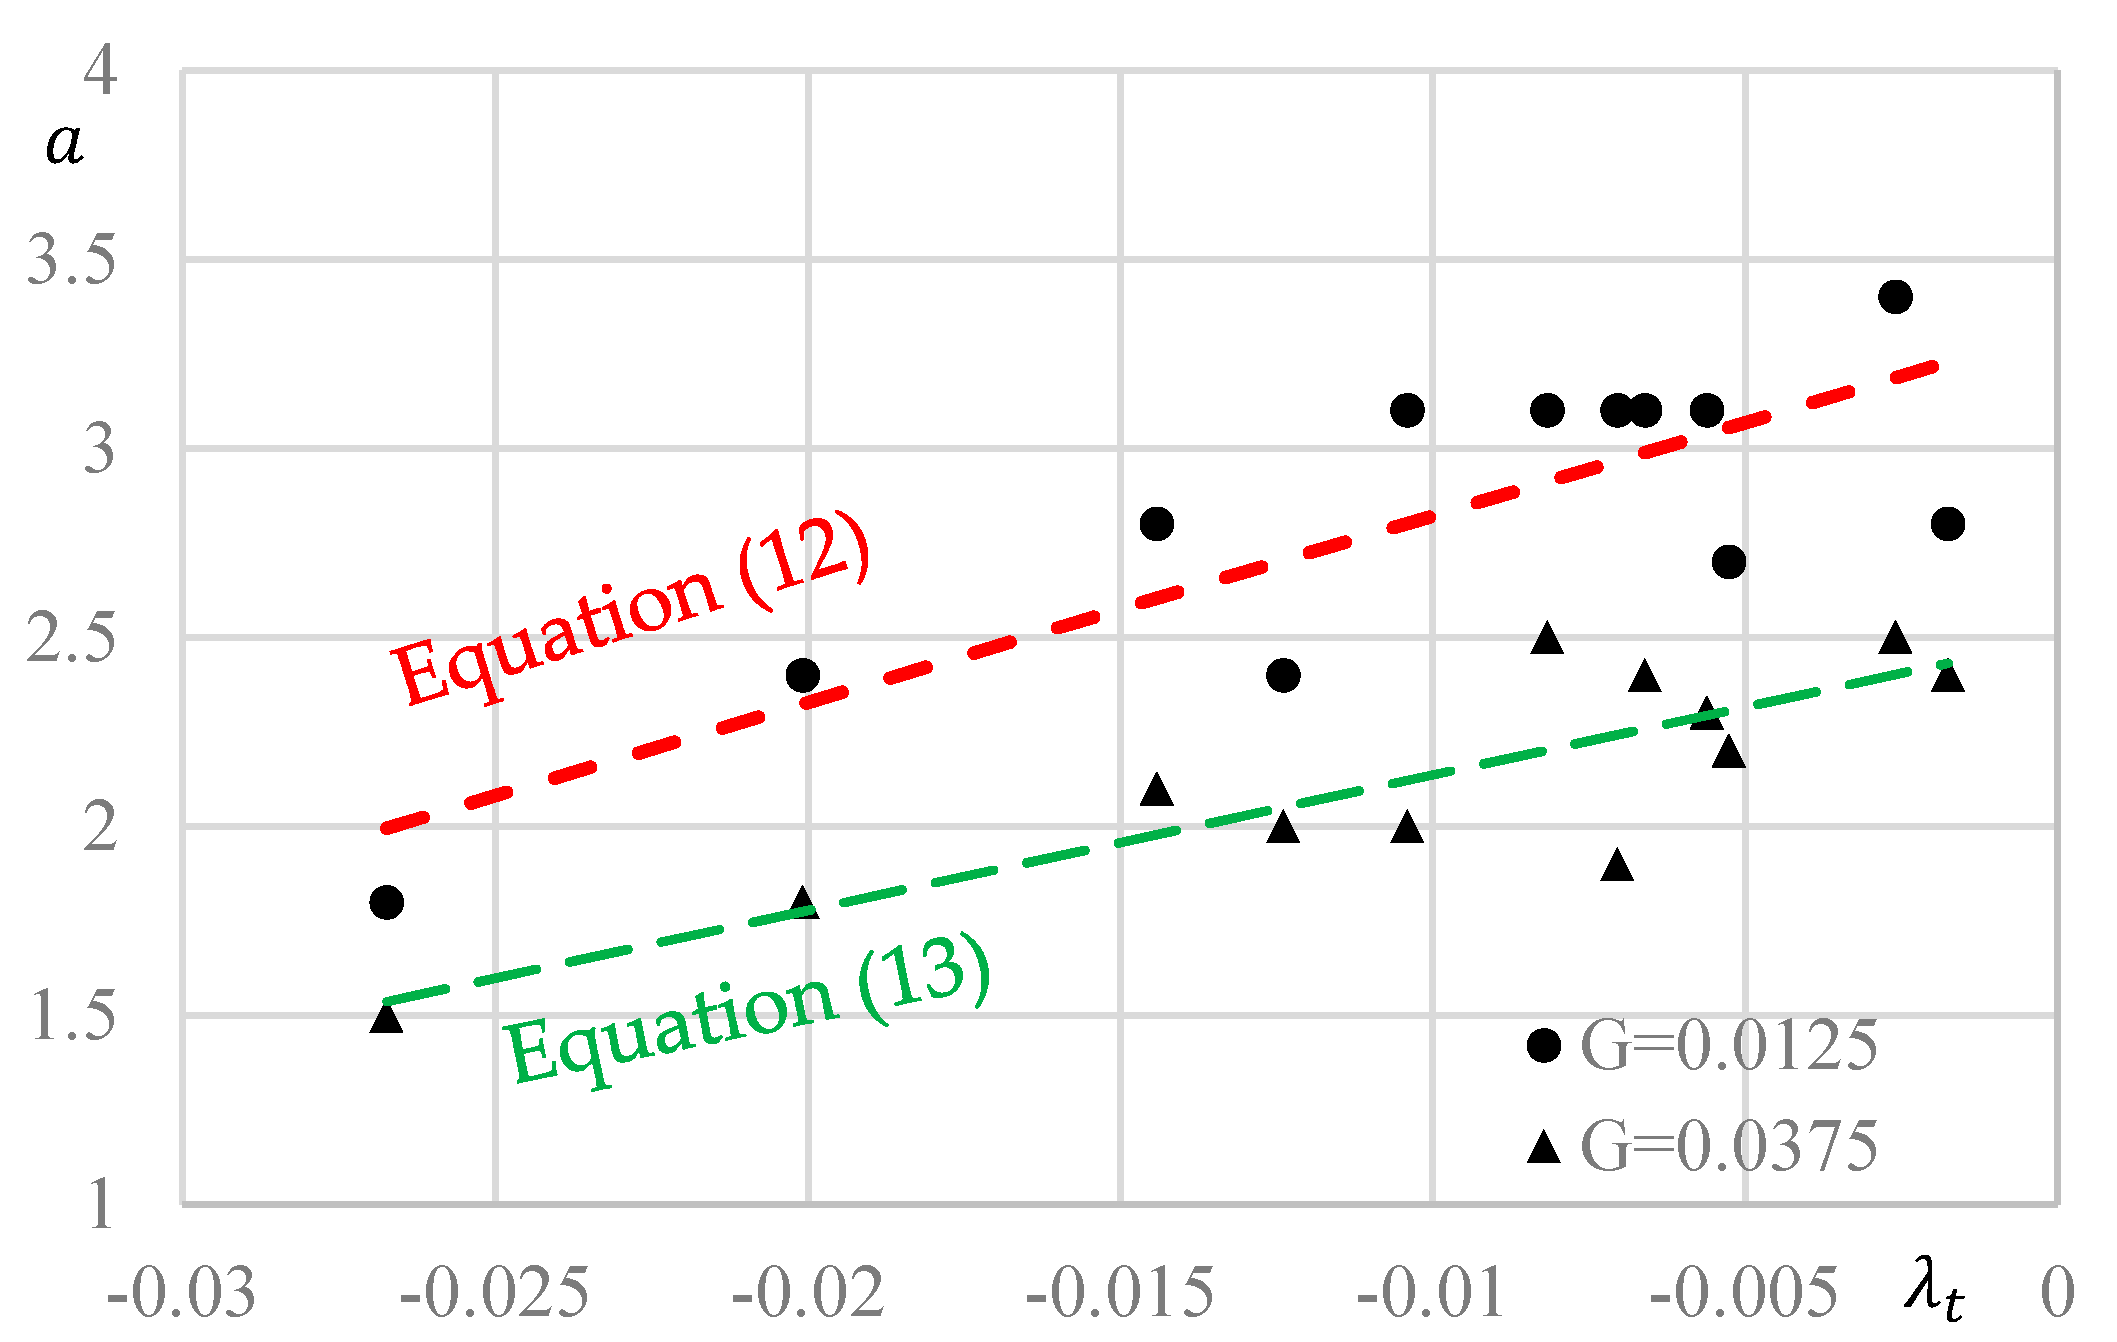
4.1. Core swirl Ratio K

According to Poncet et al. [2,3], the radial pressure distribution can be estimated with Equation (10):
p r = ρ · K 2 · Ω 2 · r
where v t is the tangential velocity, v r is the radial velocity, and Q t is the volumetric through-flow rate per second.
On the basis of theoretical derivation, Poncet et al. [2,3] determined the basic form of the correlation for K in a rotor-stator cavity with air, written as Equation (11). The values of a and a 1 are determined by LDA (Laser Doppler Anemometry) measurements. This is valid in a rotor-stator cavity with air for R e 4.15 × 10 6 , G = 0.012 and G = 0.036 .
K = 2 · ( a · C q r + a 1 ) 5 7 1 ;   C q r = Q t · R e φ 0.2 2 · π · Ω · r 3 ;   a = 5.9 ;   a 1 = 0.63
where C q r is the local flow rate coefficient and R e φ is the local circumferential Reynolds number.
According to the results from numerical simulations, the radial distributions of K are plotted in Figure 5. The results are much smaller than those from Equation (11). The amounts of a change obviously with R e and C w . With the decrease of C q r , the amounts of K increase in general. Under some computing conditions, the values of K drop after reaching their maximum values with the decrease of C q r . These results are not discussed because this phenomenon occurs at a small radius ( x 0.21 , in the impeller instead of the side chamber).
By fitting the results, the values of a and a 1 are found and are listed in Table 5. Compared with the constants in Equation (11), the amounts of a are found to be much smaller than 5.9. The values of a 1 are also smaller than 0.63. The variable a is expressed by λ t with Equation (12) and Equation (13) for the two axial gap widths. The results are compared in Figure 6. Since the values of a 1 do not change greatly, the two average values of a 1 for the various computing conditions are used ( a 1 = 0.442 for   G = 0.0125 and a 1 = 0.427 for G = 0.0375 ).
a = 50.4 · λ t + 3.317 ;   a 1 = 0.442 ; G = 0.0125
a = 36 · λ t + 2.496 ; a 1 = 0.426 ; G = 0.0375

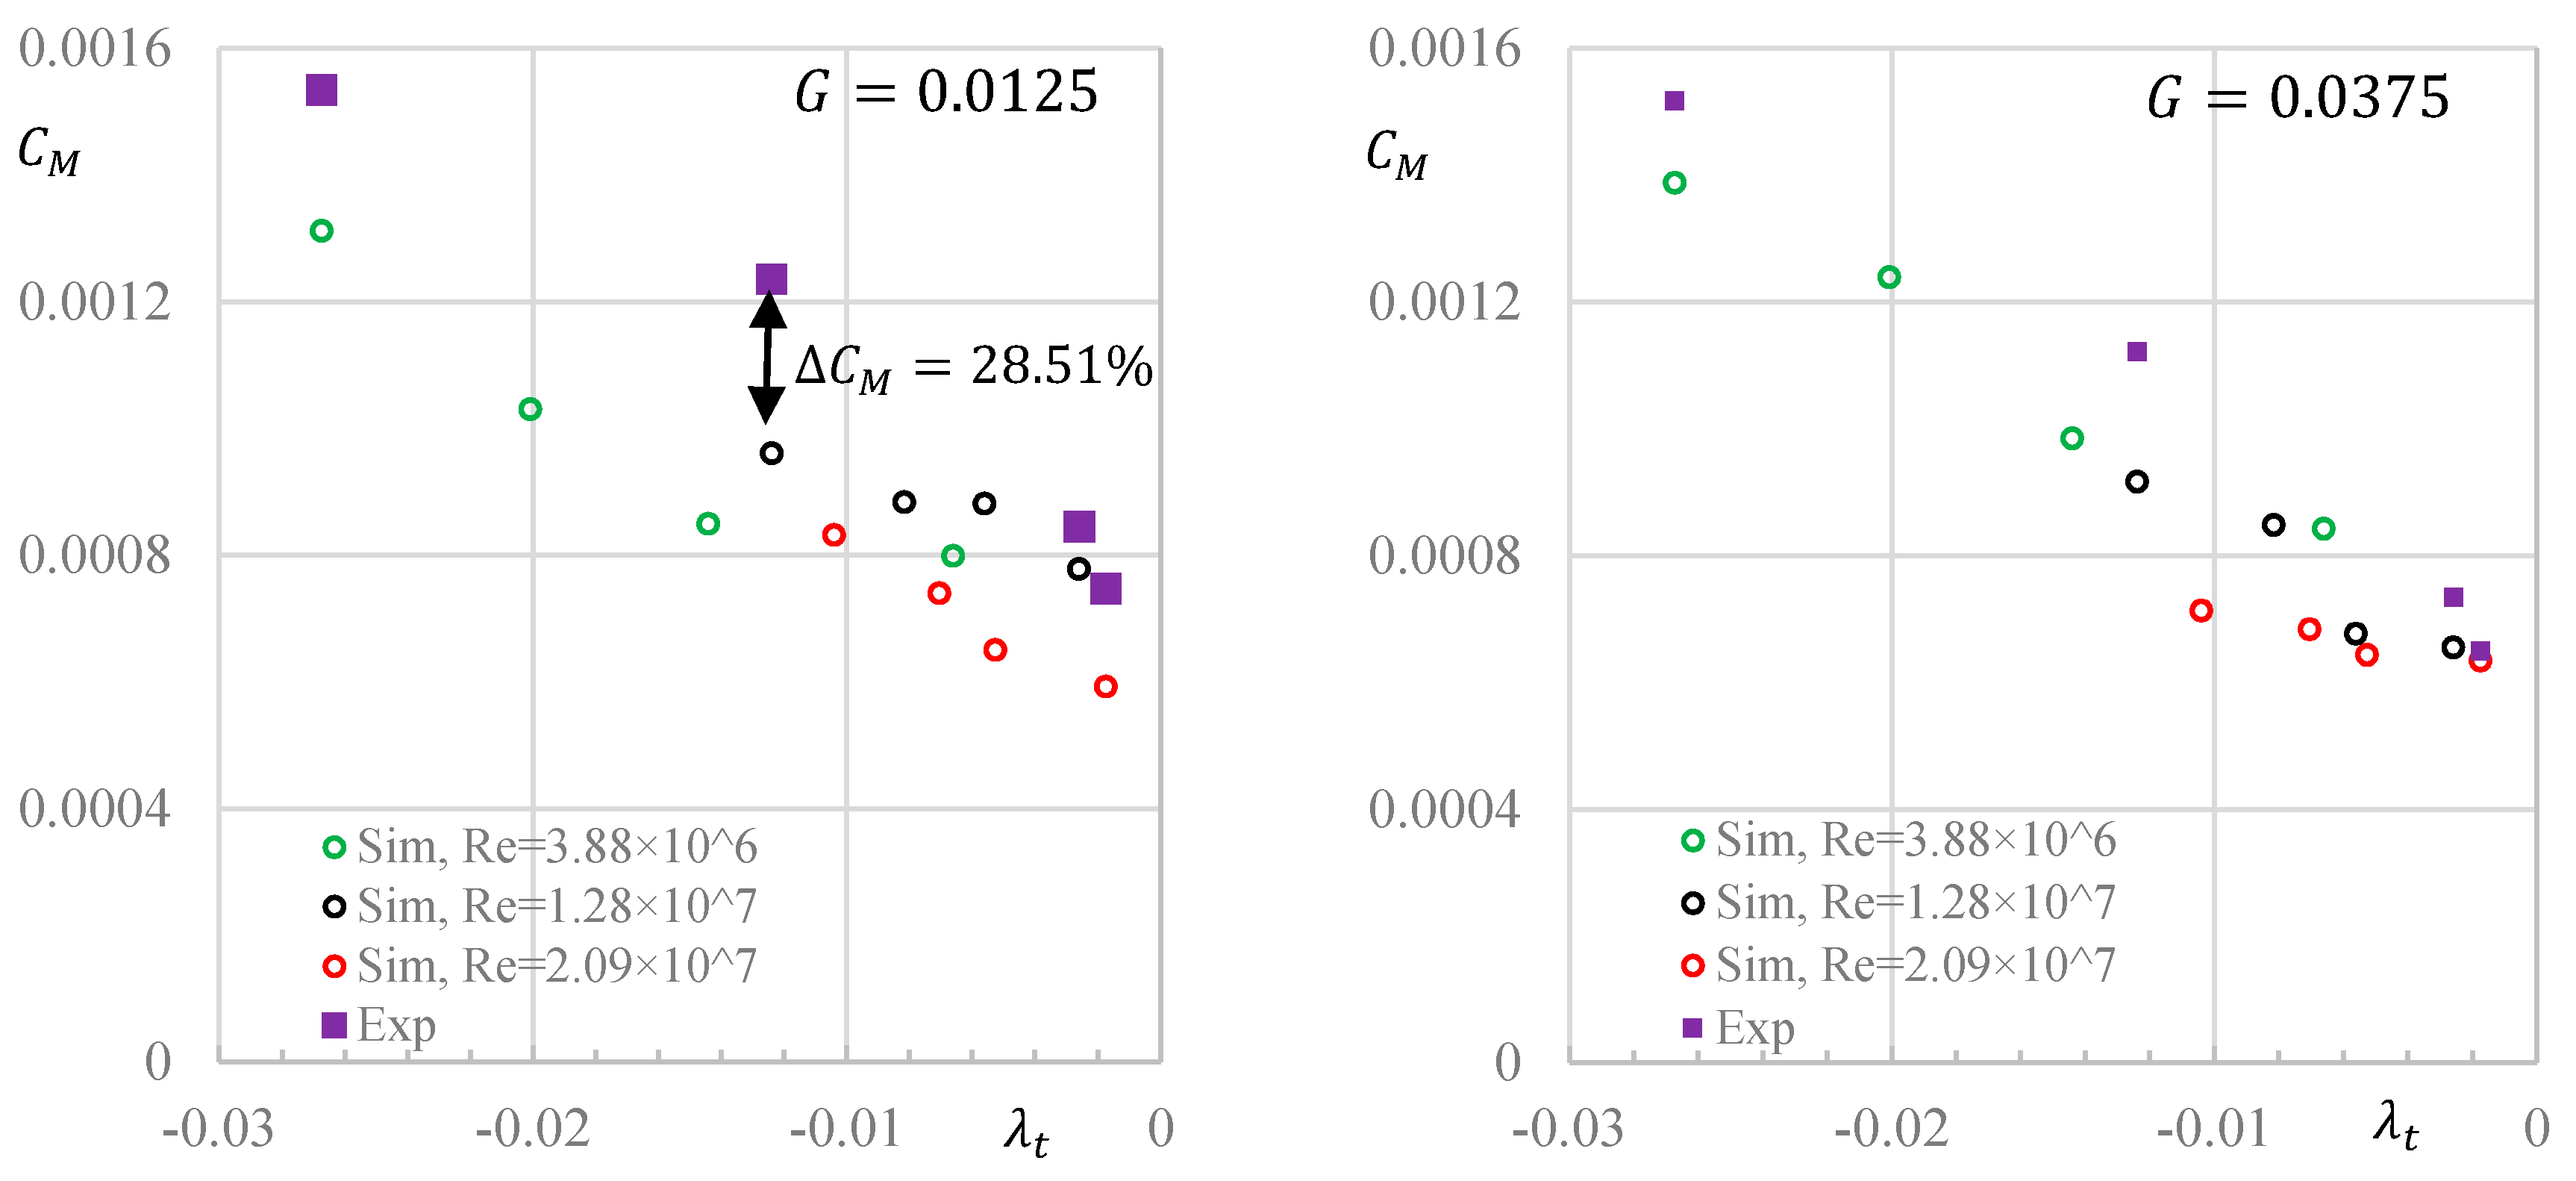
4.2. Moment Coefficient
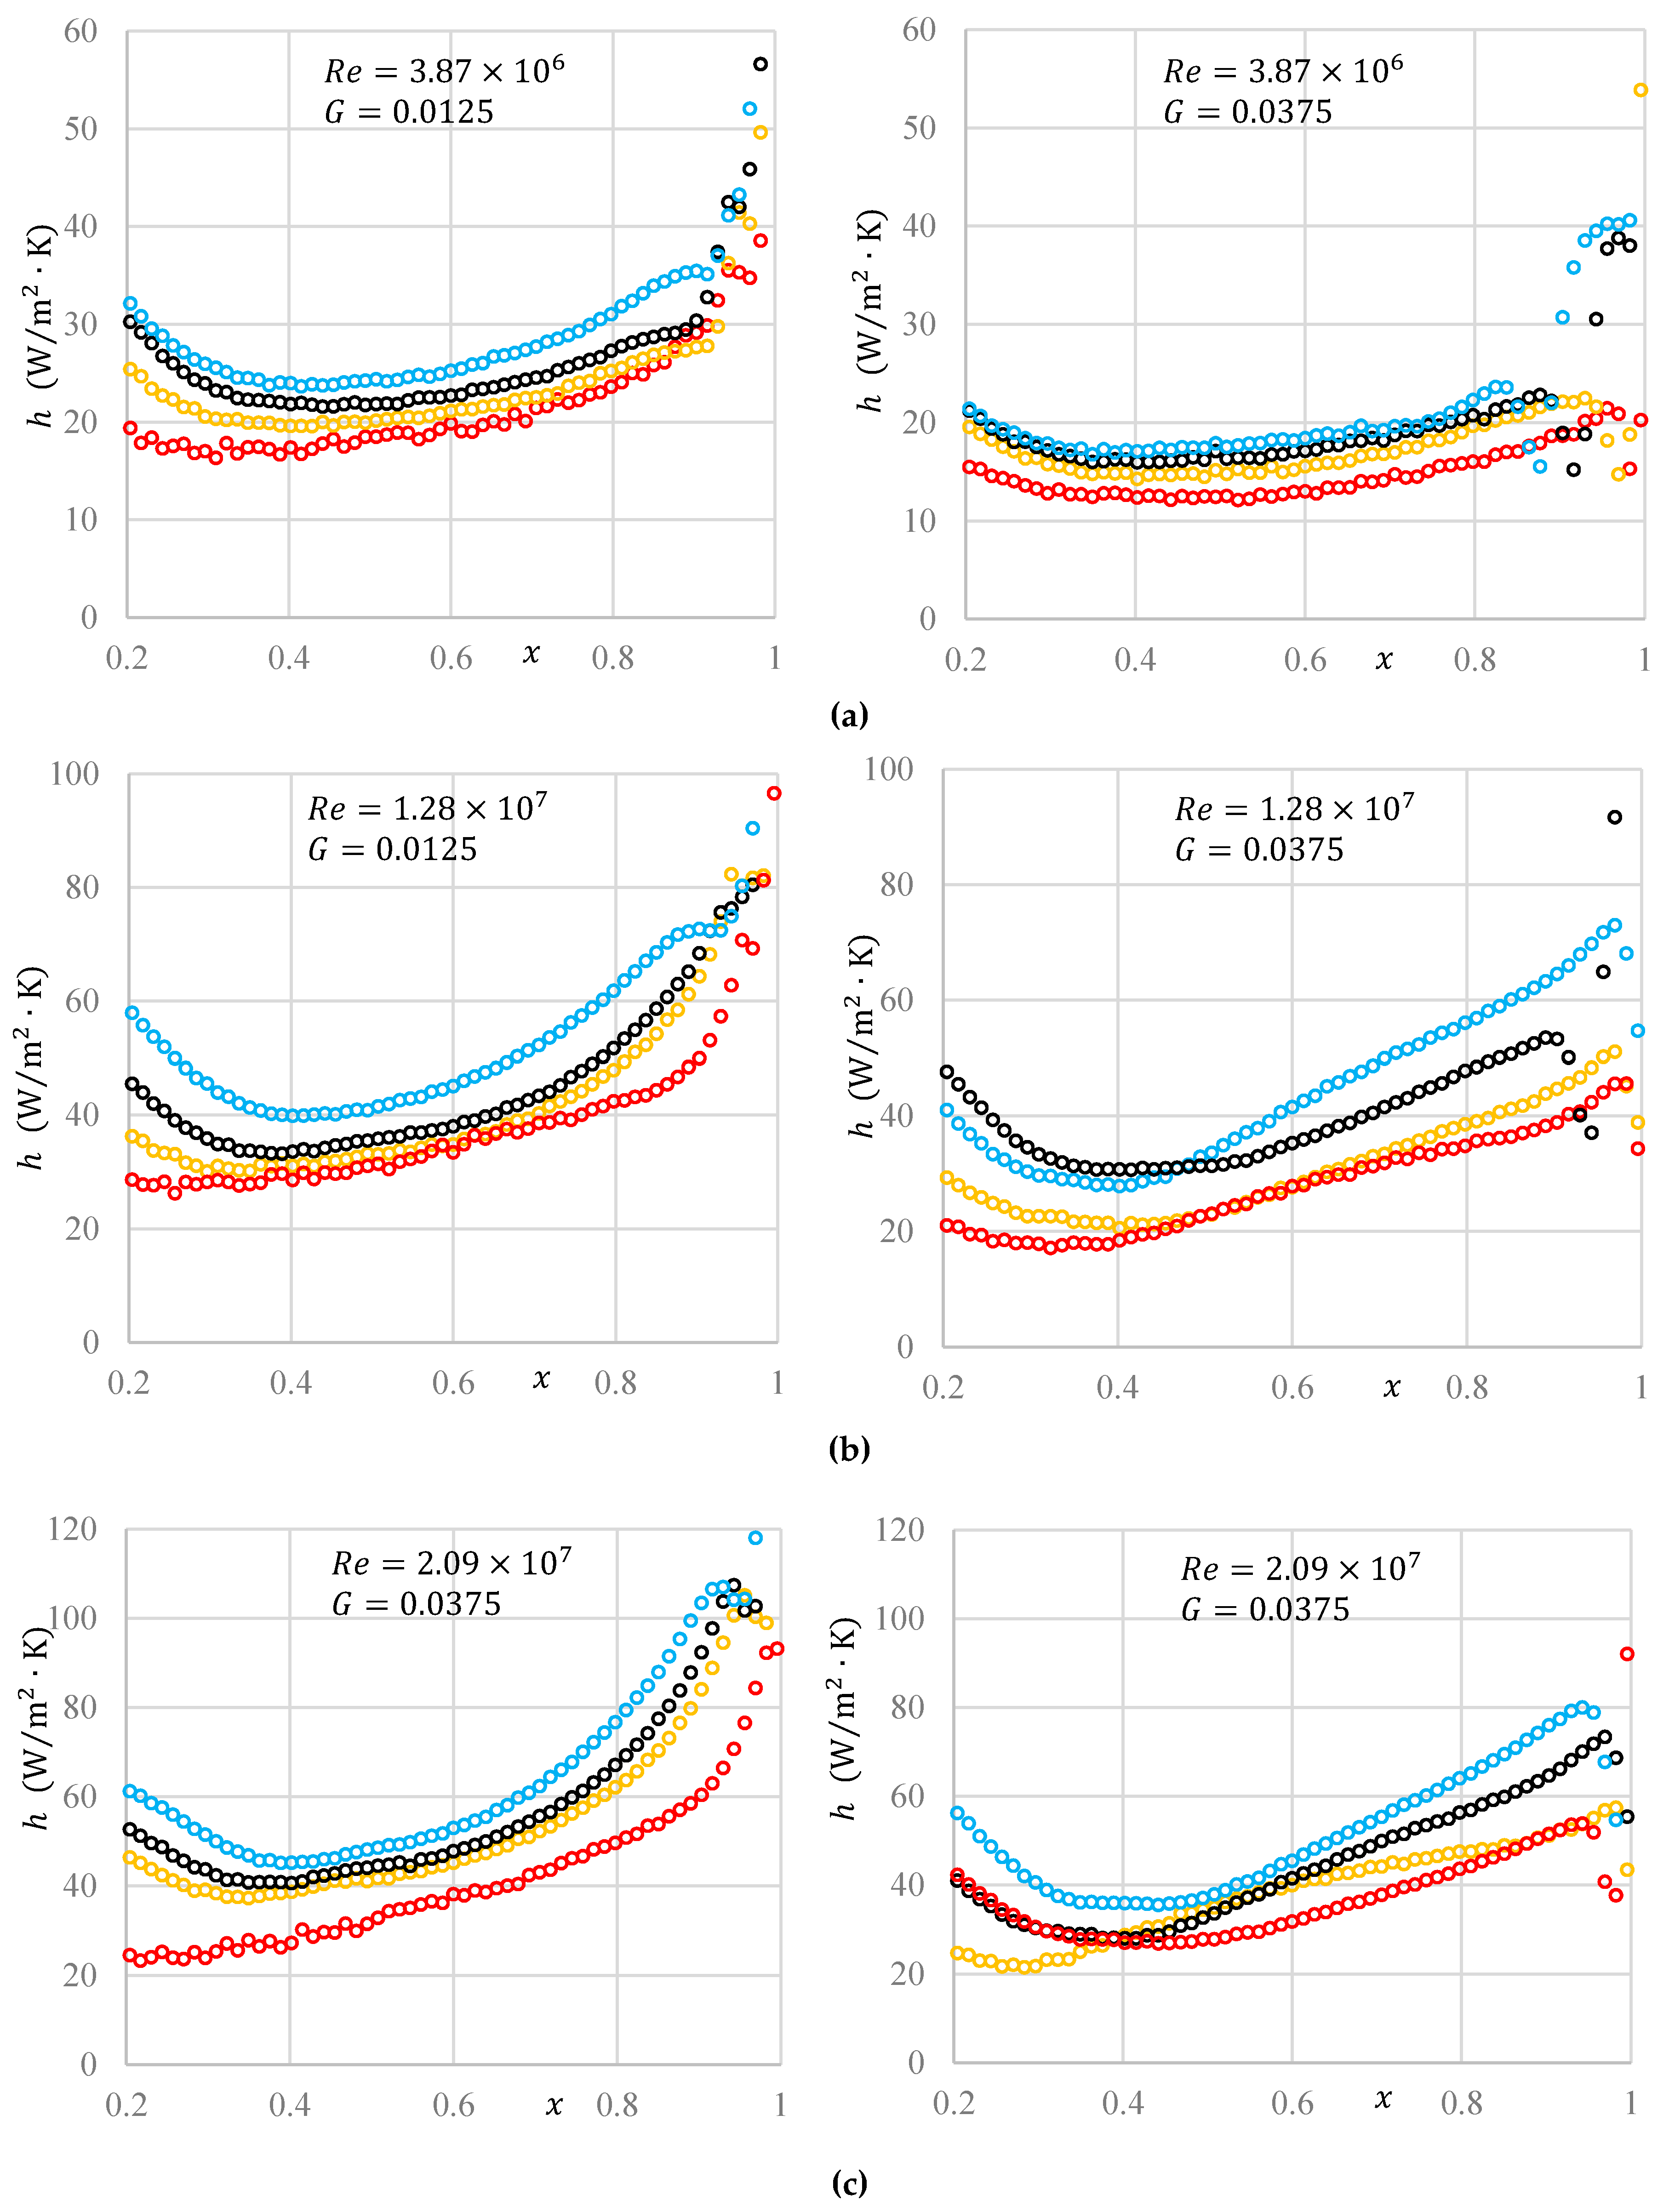
The values of C M from numerical simulations and the experimental results are plotted in Figure 7. The amounts of C M keep a decreasing trend with increasing λ t although there is some volatility. Currently, the maximum difference between the simulation results and the experimental data is 28.51%. Two reasons appear to account for the large errors. Each value of M on the front surface (see Figure 1) is obtained by reducing the torque on the back surface and on the cylinder surface M c y l (related by Equation (14) [11]). It is noted that the torques on the back surface are obtained when there is no through-flow and the axial gap widths of the two side chambers are equal at three speeds of rotation. The maximum error of 28.51% includes at least the errors on both the front and the back surfaces. The second reason is that the friction in the bearing may increase due to the vibration of the disk and the shaft for a smaller axial gap width of G = 0.0125.
M c y l = 0.042 · π · t · ρ · Ω 2 · b 5 b · ( l g Ω · b 2 υ ) 1.5152
where t is the thickness of the disk.

4.3. Distribution of h along the Radius

According to the results from numerical simulations, the radial distributions of h are plotted in Figure 8. With the decrease of C w , the amounts of h increase in general at each radial coordinate. For wider axial gap widths, the h x curves are flatter and the values of h are smaller. Near the centripetal inlet ( x 0.85 ), the parameter h is irregularly distributed versus x . The values of h are volatile for G = 0.0375 . The explanation for this phenomenon is that there is a jet flow near the centripetal inlet. The flow begins to separate when pumped into the front chamber, which significantly impacts the local heat transfer capacity. The values of h drop as x decreases from 0.85 to 0.4. It is believed that when the flow enters the cavity, it is accelerated by the disk resulting in the increase of u . The increment of u becomes smaller when x decreases from 0.85 to 0.4, resulting in the flatter h x curves (see Equation (6)). At the low radius x < 0.4 region, when the amounts of K exceed 1, the flow rotates faster than the disk and is decelerated. The values of u then drop with decreasing x . This appears to result in the increase of h with decreasing x ( x < 0.4 ) in most of the results from numerical simulations.

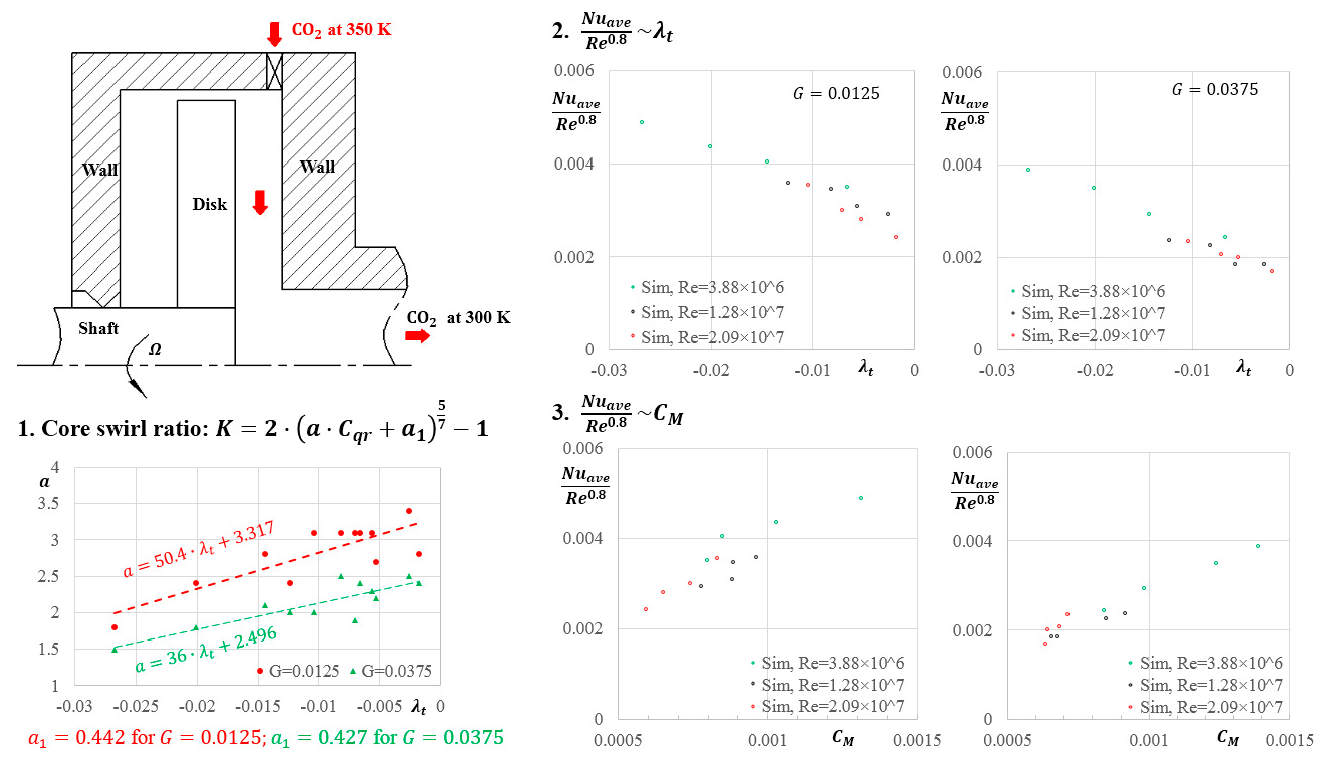
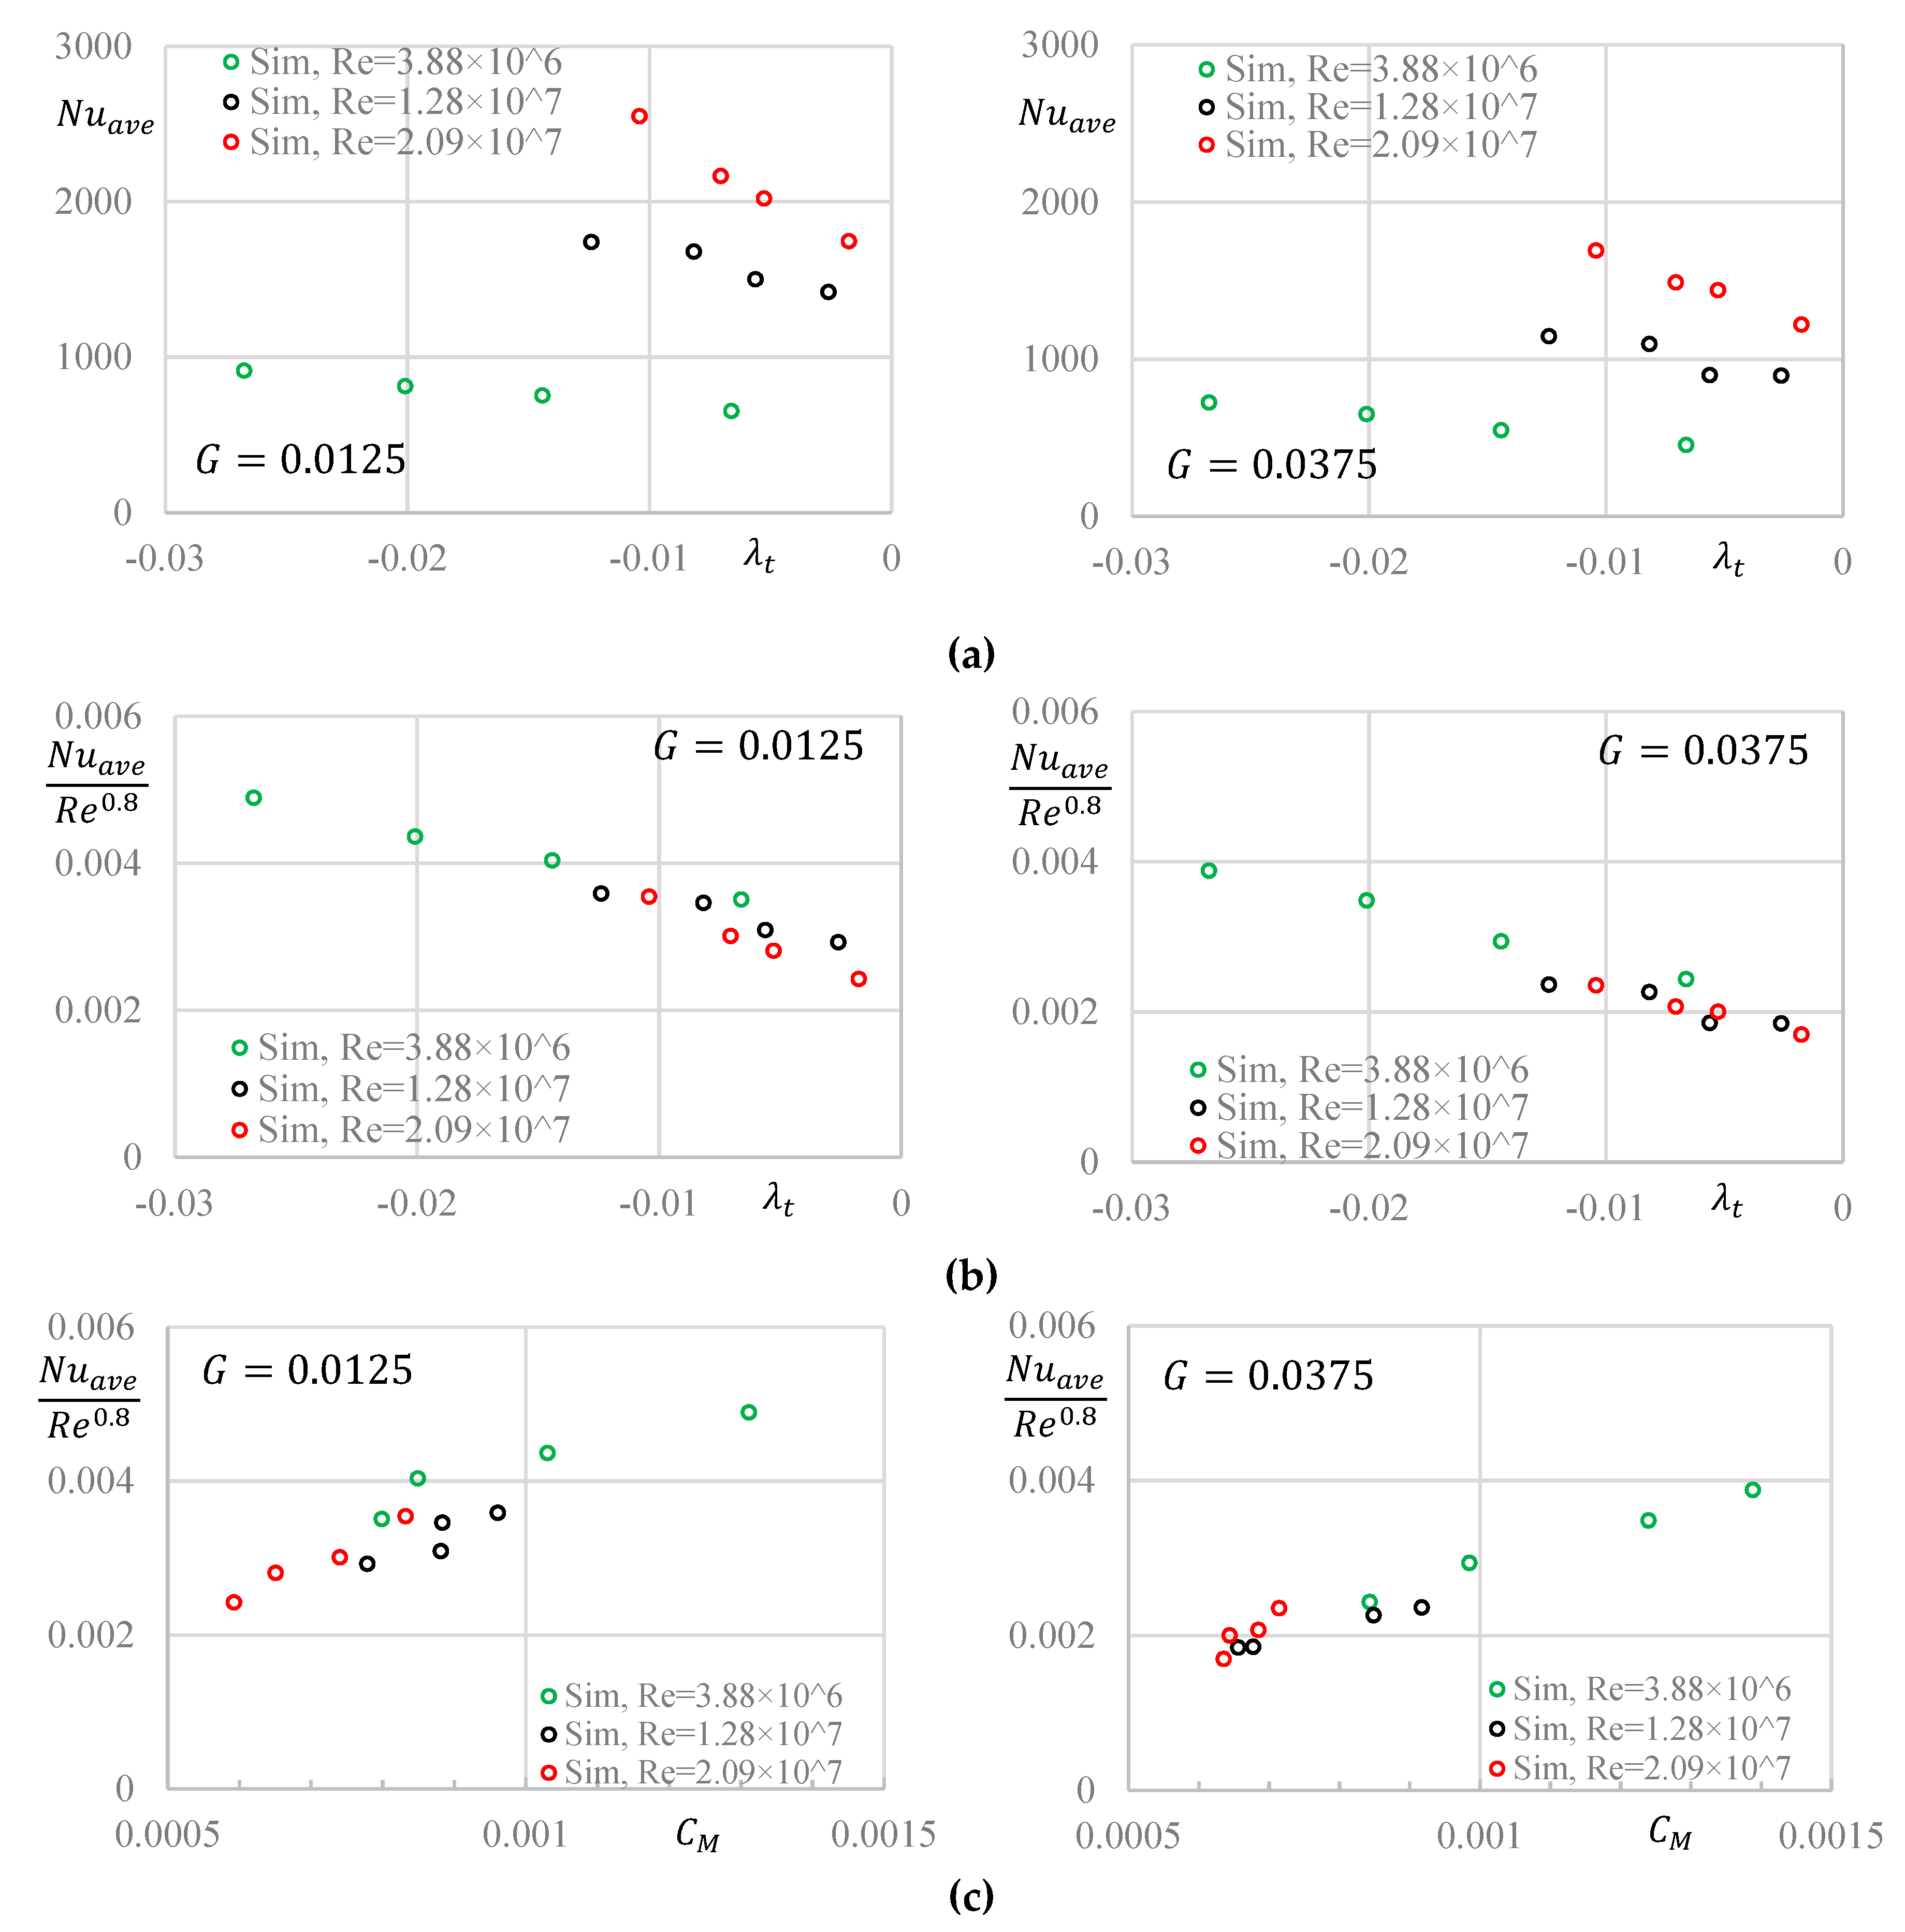
4.4. Average Nusselt Number

The parameter λ t mainly determined the flow pattern inside the cavity, and then the general heat transfer capacities [6]. The values of Nuave, computed with Equation (7), are plotted versus λ t in Figure 9a. During the calculation, the parameter k (from Equation (8)) is considered as a fixed value every 1 mm along the radius. The amounts of N u a v e increase with the increase of R e while they drop with increasing λ t . For smaller axial gap widths, the values of N u a v e are larger. When | λ t | is not large enough, the parameter N u a v e R e 0.8 is mainly affected by λt in a rotor-stator system [6,31]. In [31], the values of | λ t | range from 0 to 1.6. In this study, however, the values of | λ t | do not exceed 0.03. The parameter N u a v e R e 0.8 is therefore analyzed according to λ t . It is noted that the exponent value of 0.8 is typical for turbulent boundary layers, as put forward by Schlichting [37]. Aus der Wiesche [38] pointed out that small deviations exist with regard to the exact value of that value in the literature. However, it should be remarked that these deviations are typically of minor importance in comparison with the experimental uncertainty levels occurring in actual systems. As shown in Figure 9b, the values of N u a v e R e 0.8 are almost in linear relationships with λ t for the three values of R e and two values of G . The parameter R e has quite small impacts on N u a v e R e 0.8 at a fixed λt value. The finding is in accordance with the conclusion by Owen and Rogers [6]. Similar trends can also be found in a rotor-stator cavity with centrifugal through-flow [31]. In Figure 9c, the variations of N u a v e R e 0.8 are plotted versus C M . With the increase of C M , the values of N u a v e R e 0.8 increase in general at a fixed R e value. The results are considered reasonable because the values of N u a v e can be indirectly estimated with the values of C M [6].

5. Conclusions

In this paper, the characteristics of flow and heat transfer in a rotor-stator cavity with centripetal carbon dioxide through-flow are investigated using ANSYS CFX 13.0 code. The radial distribution of K and θ are in good agreement with the experimental data, which proves that the numerical simulation set-ups are reasonable. The conclusions are as follows:
Two empirical correlations of K are determined for the two axial gap widths and centripetal carbon dioxide through-flow. The constants in the correlations are obtained by fitting the results from numerical simulations.
The amounts of C M maintain a decreasing trend with increasing λ t in general.
The h x curves are flatter and the values of h are smaller in general for a wider axial gap width of G = 0.0375 . When x decreases from 0.85 to 0.2, the capacity of local convective heat transfer firstly decreases and then increases under most of the computing conditions. The variations of u appear to result in this trend.
The amounts of N u a v e increase with the increase of R e while they drop with increasing λ t . For a smaller axial gap width of G = 0.0125 , the capacities of average convective heat transfer are much stronger.
The values of N u a v e R e 0.8 are almost in linear relationships with λ t for the three speeds of rotation and two axial gap widths. With the increase of C M , the values of N u a v e R e 0.8 increase in general at a fixed R e value.

Author Contributions

B.H. and X.R. wrote the paper. B.H. conducted the numerical simulations; B.H. and J.L. analyzed the results. X.L. acted as the Principal Investigator of the research that funded the study.

Funding

This research was funded by National Major Science and Technology Project No. 2017-II-0007-0021, National Defense Key Laboratory Fund No. 6142A0501020317, by Natural Science Foundation of China No. 51806118, No. 51609107 and by Natural Science Foundation of Jiangsu Province No. BK20160539.

Acknowledgments

The authors express their sincere gratitude to F.-K. Benra at the Chair of Turbomachinery, University of Duisburg-Essen, Germany for his great support during Bo Hu’s PhD study. The measurements are conducted by T. R. Schroeder and analyzed by Bo Hu. The experimental results were not obtained at the Tsinghua University, and they are published only (Figure 7) to provide a better description of the numerical simulations. The experimental results were obtained by T.R. Schroeder at Duisburg-Essen and were later analyzed by Bo Hu. When in Duisburg, Hu only contributed to the small test rig experiments, and he legally gained knowledge about the large rig and the experiments while working as a Doctoral student at the University of Duisburg-Essen. The University Duisburg-Essen (Brillert) grants permission to Hu to use the geometry of the large test rig. The authors acknowledge that some numerical simulations were conducted at University of Duisburg-Essen. The results of the numerical simulations were shared between Tsinghua University and University of Duisburg-Essen.

Conflicts of Interest

The authors declare no conflict of interest.

Nomenclature

Latin Symbols
a ,   a 1 Variable
bOuter radius of the disk m
C M Moment coefficient 2 · | M | ρ · Ω 2 · b 5
C q r Local flow rate coefficient Q t · R e φ 0.2 2 · π · Ω · r 3
C w Through-flow coefficient m ˙ μ · b
GNon-dimensional axial gap s b
h Heat transfer coefficient h = q ( T a w T w ) W / ( m 2 · K )
h a v e Average heat transfer coefficient r c b 2 h r d r b 2 r c 2 W / ( m 2 · K )
K Core swirl ratio Ω f Ω
k 
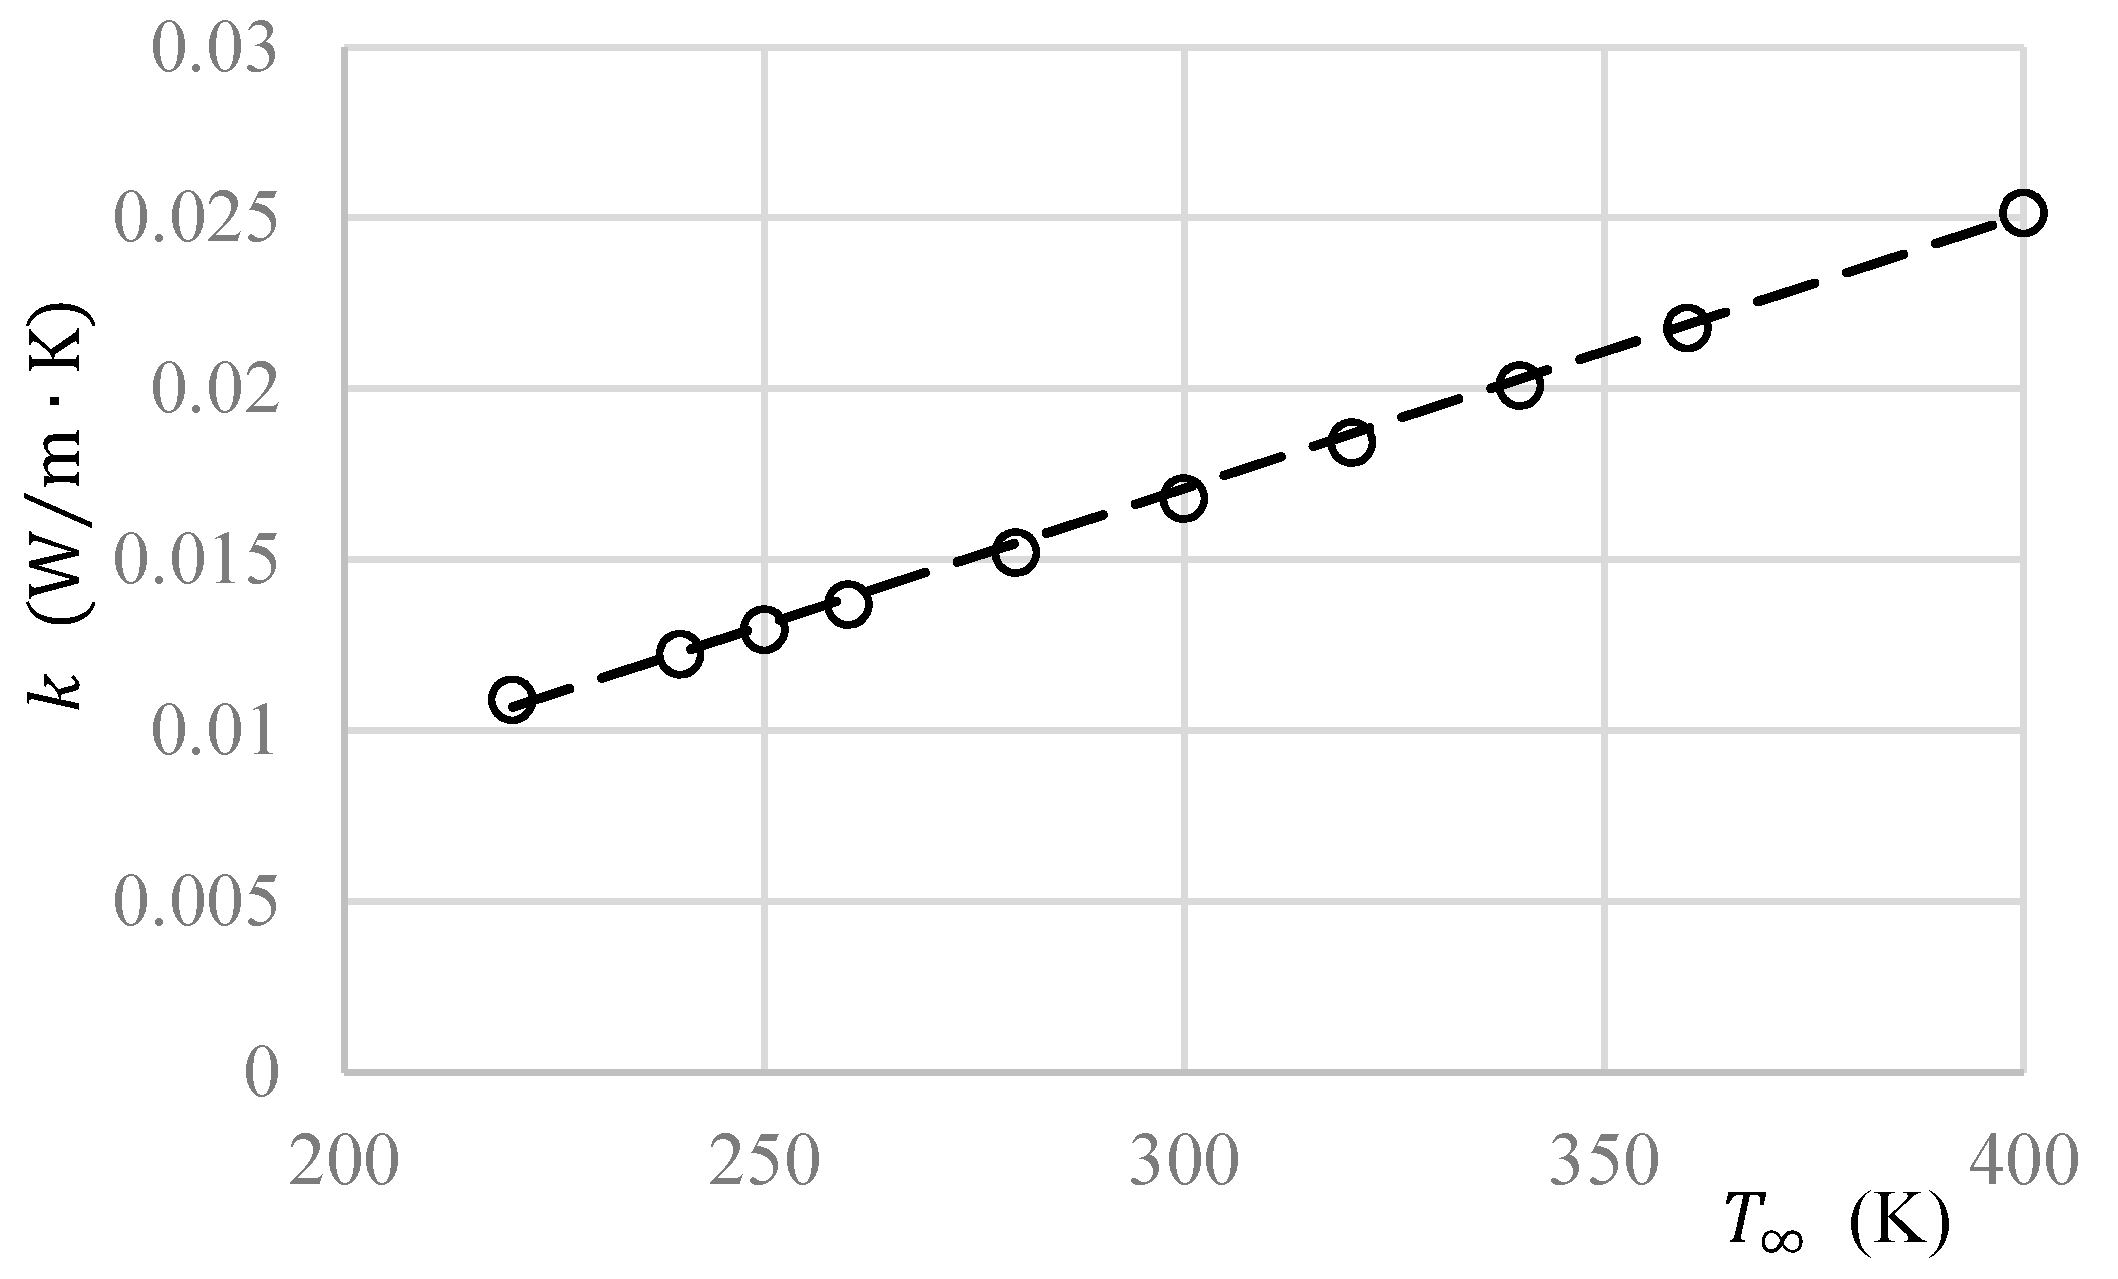
Thermal conductivity W / ( m · K )
l Specific heat at constant pressure J / ( kg · K )
M Frictional torque on a single surface Nm
m ˙ Mass flow rate ρ · Q t kg / s
N u Local Nusselt number h · r k
N u a v e Average Nusselt number r c b 2 h r 2 d r k ( b 2 r c 2 )
nSpeed of rotation rpm
pPressure Pa
Q t Volumetric through-flow rate per second m 3 / s
q Wall heat flux W / m 2
ReGlobal circumferential Reynolds number Ω · b 2 v
R e φ Local circumferential Reynolds number Ω · r 2 v
r Radial coordinate m
r c Inner radius where the measurements of h start m
r r e c Recovery factor
r o Radius of the outlet pipe m
Δ r Radial clearance mm
s Axial gap of the front chamber mm
s b Axial gap of the back chamber mm
s o Axial width of the inlet mm
T Temperature in the main stream at ζ = 0.5 K
T w Temperature on the wall K
t Thickness of the disk mm
u Velocity of the mainstream at ζ = 0.5 m / s
V t Non-dimensional tangential velocity v t Ω · r
v t Tangential velocity m / s
xNon-dimensional radial coordinate r b
Greek Symbols
θ Non-dimensional temperature T T m i n T m a x T m i n
λ t Turbulent flow parameter C w R e 0.8
μ Dynamic viscosity N · s / m 2
ν Kinematic viscosity m 2 / s
ρ Density kg / m 3
Ω Angular velocity of the disk rad / s
Ω f Angular velocity of the fluid rad / s
Abbreviations
FSFull scale
HWAHot-wire anemometry
rpmRevolution per minute
RMSRoot mean square
SSTShear stress transport
TLCThermochromic liquid crystal

References

  1. Barabas, B.; Clauss, S.; Schuster, S.; Benra, F.K.; Dohmen, H.J.; Brillert, D. Experimental and numerical determination of pressure and velocity distribution inside a rotor-stator cavity at very high circumferential Reynolds numbers. In Proceedings of the 11th European Conference on Turbomachinery Fluid dynamics & Thermodynamics, Madrid, Spain, 23–27 March 2015. [Google Scholar]
  2. Poncet, S.; Chauve, M.P.; Le Gal, P. Turbulent rotating disk flow with inward through-flow. J. Fluid Mech. 2005, 522, 253–262. [Google Scholar] [CrossRef]
  3. Poncet, S.; Schiestel, R.; Chauve, M.P. Centrifugal flow in a rotor-stator cavity. J. Fluid Eng. 2005, 127, 787–794. [Google Scholar] [CrossRef]
  4. Owen, J.M.; Pincombe, J.R. Velocity measurements inside a rotating cylindrical cavity with a radial outflow of fluid. J. Fluid Mech. 1980, 99, 111–127. [Google Scholar] [CrossRef]
  5. Owen, J.M. An Approximate Solution for the Flow between a Rotating and a Stationary Disc; Report; Thermo-Fluid Mechanics Research Centre, University of Sussex: Brighton, UK, 1987. [Google Scholar]
  6. Owen, J.M.; Rogers, R.H. Flow and Heat Transfer in Rotating-Disc Systems, Volume 1: Rotor-Stator Systems; Research Study Press: Taunton, Somerset, UK, 1989. [Google Scholar]
  7. Ewa, T.; Wojciech, M.; Kami, K. Heat Transfer in Rotor/Stator Cavity. J. Phys. Conf. Ser. 2011. [Google Scholar] [CrossRef]
  8. Ewa, T.; Majchrowski, W.; Kielczewski, K. Investigation of transitional and turbulent heat and momentum transport in a rotating cavity. Int. J. Heat Fluid Flow 2012, 35, 52–60. [Google Scholar]
  9. Hu, B.; Brillert, D.; Dohmen, H.J.; Benra, F.K. Investigation on the Flow in a Rotor-Stator Cavity with Centripetal Through-Flow. Int. J. Turbomach. Propuls. Power 2017, 2, 18. [Google Scholar] [CrossRef]
  10. Debuchy, R.; Abdel Nour, F.; Bois, G. On the flow behavior in rotor-stator system with superimposed flow. Int. J. Rotating Mach. 2008, 2008. [Google Scholar] [CrossRef]
  11. Hu, B.; Brillert, D.; Dohmen, H.J.; Benra, F.K. Investigation on thrust and moment coefficients of a centrifugal turbomachine. Int. J. Turbomach. Propuls. Power 2018, 3, 9. [Google Scholar] [CrossRef]
  12. Nguyen, T.D.; Pellé, J.; Harmand, S.; Poncet, S. PIV measurements of an air jet impinging on an open rotor-stator system. Exp. Fluids 2012, 53, 401–412. [Google Scholar] [CrossRef] [Green Version]
  13. Lock, G.D.; Yan, Y.; Newton, P.J.; Wilson, M.; Owen, J.M. Heat Transfer Measurements Using Liquid Crystal in a Pre-Swirl Rotating-Disc System. In Proceedings of the ASME Turbo Expo: Land, Sea & Air, Atlanta, GA, USA, 16–19 June 2003. [Google Scholar]
  14. Kurokawa, J.; Toyokura, T. Study on Axial Thrust of Radial Flow Turbomachinery. In Proceedings of the Second International JSME Symposium Fluid Machinery and Fluidics, Tokyo, Japan, 4–9 September 1972. [Google Scholar]
  15. Kurokawa, J.; Toyokura, T. Axial Thrust, Disc Friction Torque and Leakage Loss of Radial Flow Turbomachinery. In Proceedings of the International Conference on Pump and Turbine Design and Development, Glasgow, UK, 1–3 September 1976. [Google Scholar]
  16. Coren, D.; Childs, P.R.N.; Long, C.A. Windage sources in smooth-walled rotating disc systems. Proc. Inst. Mech. Eng. Part C 2009, 223, 873–888. [Google Scholar] [CrossRef] [Green Version]
  17. Will, B.C.; Benra, F.K. Investigation of the Fluid Flow in a Rotor-Stator Cavity with Inward Through-Flow. In Proceedings of the ASME 2009 Fluids Engineering Division Summer Meeting, Vail, CO, USA, 2–6 August 2009. [Google Scholar]
  18. Will, B.C.; Benra, F.K.; Dohmen, H.J. Numerical and Experimental Investigation of the Flow in the Side Cavities of a Centrifugal Pump. In Proceedings of the 12th International Symposium on Transport Phenomena and Dynamics of Rotating Machinery, Honolulu, HI, USA, 17–22 February 2010. [Google Scholar]
  19. Daily, J.W.; Nece, R.E. Chamber dimension effects on induced flow and frictional resistance of enclosed rotating disks. J. Basic Eng. 1960, 82, 217–232. [Google Scholar] [CrossRef]
  20. Kurokawa, J.; Toyokura, T. Roughness Effects on the Flow along an Enclosed Rotating Disc. Bull. JSME 1978, 21, 1725–1732. [Google Scholar] [CrossRef]
  21. Dibelius, G.; Radtke, F.; Ziemann, M. Experiments on Friction, Velocity and Pressure Distribution of Rotating Discs, Heat and Mass Transfer in Rotating Machinery; Hemisphere Publishing Corp: Washington, DC, USA, 1984; pp. 117–130. [Google Scholar]
  22. Gartner, W. A Prediction Method for the Frictional Torque of a Rotating Disc in a Stationary. In Proceedings of the ASME International Gas Turbine & Aero Engine Conference, Orlando, FL, USA, 2–5 July 1997. [Google Scholar]
  23. Gartner, W. A Momentum Integral Method to Predict the Frictional Torque of a Rotating Disc with Protruding Bolts. In Proceedings of the ASME International Gas Turbine & Aero Engine Conference, Stockholm, Sweden, 2–5 June 1998. [Google Scholar]
  24. Dorfman, L.A. Resistance of a rotating rough disc. Tech. phys. Zhurnal Tekhnicheskoi Fiziki 1958, 28, 353–367. [Google Scholar]
  25. Daily, J.W.; Nece, R.E. Roughness Effects on Frictional Resistance of Enclosed Rotating disk. J. Basic Eng. 1960, 82, 553–560. [Google Scholar] [CrossRef]
  26. Hu, B.; Brillert, D.; Dohmen, H.J.; Benra, F.K. Investigation on the influence of surface roughness on the moment coefficient in a rotor-stator cavity with centripetal through-flow. In Proceedings of the ASME 2017 Fluids Engineering Division Summer Meeting, Waikoloa, HI, USA, 30 July–3 August 2017. [Google Scholar]
  27. Metzger, D.E. Heat transfer and pumping on a rotating disk with freely induced and forced cooling. J. Eng. Power 1970, 92, 342–348. [Google Scholar] [CrossRef]
  28. Metzger, D.E.; Bunker, R.S.; Bosch, G. Transient liquid crystal measurement of local heat transfer on a rotating disk with jet impingement. J. Turbomach. 1991, 113, 52–59. [Google Scholar] [CrossRef]
  29. Bunker, R.S.; Metzger, D.E.; Wittig, S. Local heat transfer in turbine disk cavities. Part I: rotor and stator cooling with hub injection of coolant. J. Turbomach. 1992, 114, 211–220. [Google Scholar] [CrossRef]
  30. Bunker, R.S.; Metzger, D.E.; Wittig, S. Local heat transfer in turbine disk cavities. Part II: rotor cooling with radial injection of coolant. J. Turbomach. 1992, 114, 221–228. [Google Scholar] [CrossRef]
  31. Luo, X.; Zhao, X.; Wang, L.; Wu, H.; Xu, G. Flow structure and heat transfer characteristics in rotor-stator cavity with inlet at low radius. Appl. Therm. Eng. 2014, 70, 291–306. [Google Scholar] [CrossRef]
  32. Poncet, S.; Schiestel, R. Numerical modeling of heat transfer and fluid flow in rotor-stator cavities with throughflow. J. Heat Mass Transf. 2007, 50, 1528–1544. [Google Scholar] [CrossRef]
  33. Tuliszka-Sznitko, E.; Zieliński, A.; Majchrowski, W. LES and DNS of the non-isothermal transitional flow in rotating cavity. Int. J. Heat Fluid Flow 2009, 30, 534–548. [Google Scholar] [CrossRef]
  34. Majchrowski, W.; Kie1czewski, K.; Tuliszka-Sznitko, E. Heat transfer in rotor/stator cavity. J. Phys. Conf. Ser. 2011, 318, 32022–32031. [Google Scholar]
  35. Tuliszka-Sznitko, E.; Majchrowski, W. LES and DNS of the flow with heat transfer in rotating cavity. J. Comput. Meth. Sci. Technol. 2010, 16, 105–114. [Google Scholar] [CrossRef]
  36. Engineering ToolBox, Carbon Dioxide-Thermal Conductivity. Available online: https://www.engineeringtoolbox.com/carbon-dioxide-thermal-conductivity-temperature-pressure-d_2019.html (accessed on 1 July 2019).
  37. Schlichting, H. Boundary-Layer Theory; McGraw-Hill: New York, NY, USA, 1968. [Google Scholar]
  38. Aus der Wiesche, S. Heat Transfer in Rotating Flows. In Handbook of Thermal Science and Engineering; Kulacki, F., Ed.; Springer: Cham, Switherland, 2017. [Google Scholar]
Figure 1. Meridional sketch: (a) a centrifugal compressor stage and (b) the simplified rotor-stator cavity model for a side chamber. z : axial coordinate; r : radial coordinate; s : axial gap width of the front chamber.
Energies 12 02613 g001
Figure 2. Variation of k versus T for the carbon dioxide. Hollow points: results in [36]; Dashed line: results from Equation (8).
Energies 12 02613 g002
Figure 3. A sketch of the main region of the test rig (not to scale). r o : radius of the outlet pipe; s b : axial gap width of the back chamber (BC), Δ r : radial gap; s o : axial width of the inlet.
Energies 12 02613 g003
Figure 4. Verification of the numerical simulation set-ups: (a) distribution of K and (b) distribution of θ . Sim: from numerical simulations; Exp: by measurements.
Energies 12 02613 g004
Figure 5. Variations of K versus C q r for various R e and G from numerical simulations. Color of hollow points: red: C w = 1262 ; orange: C w = 2525 ; black: C w = 3787 ; blue: C w = 5050 ; dashed lines: results from Equation (11).
Energies 12 02613 g005aEnergies 12 02613 g005b
Figure 6. Variations of a versus λ t for G = 0.0125 and G = 0.0375
Energies 12 02613 g006
Figure 7. Variations of C M versus λ t for G = 0.0125 and G = 0.0375 . Sim: from numerical simulations; Exp: by measurements.
Energies 12 02613 g007
Figure 8. Radial distribution of h from numerical simulations for (a) Re = 3.87 × 10⁶; (b) R e = 1.28 × 10 7   and (c) Re = 2.09 × 10⁷. x : non-dimensional radial coordinated, x = r b . Color of symbols: red: C w = 1262 ; orange: C w = 2525 ; black: C w = 3787 ; blue: C w = 5050 .
Energies 12 02613 g008
Figure 9. Simulation results of heat transfer capacities: (a) N u a v e   versus λ t ; (b) N u a v e R e 0.8   versus λ t and (c) N u a v e R e 0.8   versus C M .
Energies 12 02613 g009
Table 1. Main parameters of the test zone in this study.
r o / b s / b s b / b Δ r / b s o / b
0.1750.0125, 0.03750.03750.0050.005
Table 2. Positions of the measurements in the test rig.
Parameters Non-Dimensional Radial Coordinate x   ( = r b )
Temperature or pressure0.420.50.580.670.740.820.870.955
Hot-wire anemometry0.510.670.740.870.955
Table 3. Error of the measurements.
Hot-Wire AnemometryPressureTemperatureTorque
Displacement Rotation
± 0.05 m ± 0.5 ° 1% (FS)0.02 K0.1% (FS)
Table 4. Computing conditions.
1−1262 3.87 × 10 6 7−3787 1.28 × 10 7
2−25258−5050
3−37879−1262 2.09 × 10 7
4−505010−2525
5−1262 1.28 × 10 7 11−3787
6−252512−5050
Table 5. Amounts of a and a 1 by fitting the results.
GNo.123456789101112
0.0125a3.12.82.41.83.43.13.12.42.62.53.13.1
a10.450.450.440.430.450.450.450.420.430.440.460.43
0.0375a2.42.11.81.52.52.32.51.92.42.21.92
a10.420.420.450.430.440.420.420.430.440.430.420.4

