1. Introduction
The microbial fuel cell (MFC) has been intensively studied in the development of electrode materials, proton exchange medium, harvester, and reactor configurations. MFCs are used for biodegradable substrates conversion, i.e., livestock wastewater, into renewable micro-electrical energy source [
1,
2,
3]. An MFC can use electrogenic bacteria in wastewater as catalysts to generate micro-electricity and treat wastewater simultaneously [
4]. Ganesh and Jambeck [
5] and Yuan et al. [
6] found that the maximum voltage produced by an MFC was 0.438 V during a four-day experiment and the removal efficiency of chemical oxygen demand (COD) and biochemical oxygen demand (BOD) was 88 and 74%, respectively. Other studies have shown that long-lived fuel cells converted sugars into electricity with efficiencies exceeding 80% without any electron mediators [
7,
8].
Power density and output voltage of MFCs are relatively low and this has limited their application [
9]. It was observed that membrane resistance was at least tens to thousands of ohms [
10]; thus, reducing the membrane resistance was key to promoting the operational performance of MFCs [
11]. In addition, with a controlled anodic electron-transfer mechanism the output current generation of an MFC can be optimized.
For a mediator-less proton-exchange membrane (PEM) system, charge generation depends on both the rates of the proton transfer on the anode and the reduction of the oxygen concentration on the cathode. Reactions including electron production, proton transfer, and oxygen reduction to water limited the charge generation [
12]. Therefore, several studies have been conducted with the goal to optimize operating conditions. For instances, electrode materials [
13], cell structure [
14], operational pH [
15], substrate temperature [
16], flow rate [
17], materials in the PEM [
18], and external resistance [
19] comprise some of the analyzed parameters.
The maximum cell voltage or open circuit voltage in an MFC was obtained at an open circuit, in which the external resistance was infinite. This is due to the decrease in anodic potential resulting from the slow charge-transfer kinetics and mass-transfer process [
20]. In addition, Aelterman et al. reported that the current and voltage output of an MFC could be affected by the external resistance and electrogenic microorganisms [
21].
Electricigen (i.e., electrogenic microorganisms or bacteria) are microorganisms that are able to oxidize completely organic matter to CO
2 at the same time that electrons are transferred to electrodes (
http://www.geomicrobes.com/electricigens-when-bacteria-produce-electricity/). It has been found that some electricigen populations could be accumulated and attached on the surface of a PEM and an anode.
The generated current through a low external resistance can accelerate the electron transfer to the cathode, which supports rapid cathode reaction and high electrogenic activity. Hence, the external resistance also affects the cathode potential [
22]. In addition, the external resistance controls the ratio of the cell output voltage to the generated current [
19].
Anode and cathode potential vary under different external resistances employed. Variations of anode potential under various external resistances were observed with different electrochemically active microorganisms [
23]. The variations in MFC performance with different external resistances was associated with the electrochemical activity of electrogenic microorganisms [
24].
For an electric power source, higher external resistance (load) could result in higher cell voltage and lower current. Conversely, lower external resistance resulted in lower cell voltage and higher current. Hence, the MFC should operate at an optimal external resistance under optimal conditions to minimize MFC losses for power production [
25]. Maximum power would be achieved when the external resistance equals internal resistance of the power source [
25]. Consequently, external resistance control is an important requirement for the industrial application of MFCs.
The problems for optimizing the external load were addressed by using on-line manipulation of Maximum Power Point Tracking (MPPT) [
26]. The external resistance has a significant impact on MFC performance, including micro-electricity production, COD removal efficiency, and bacterial population evolution. Despite the external resistance where the energy is dissipated, an alternative solution might be to store the power output in a capacitor by means of energetic electron collection and transfer to the electrode [
27]. Indeed, the efficiency of energy harvest from MFCs was enhanced using intermittent connection or controlling the frequency of charging and discharging [
27,
28].
Dewan et al. [
27] accumulated the generated energy in a capacitor. The amount of charge
Q equaled to the voltage across the capacitor
Vc times the capacitance of the capacitor. The instantaneous variation of output current
i(
t) was obtained by calculating the time derivative of the electrical potential difference across the capacitor (displacement current), and it was given as in Equation (1).
where
C was the capacitance of capacitor with a negligible equivalent series resistance. However, the voltage drop across the capacitor induced an external transient resistance
R (=
Vc/
i). As the capacitor was charged, the electrical potential buildup in the capacitor and the associated transient resistance increased [
27]. This time-dependent external resistance could result in a variation of anode potential, which might be detected by the microorganisms at the anode. In other words, the internal resistance also will change with the
Vc. This means that the changing
Vc could change the electrochemical activity and the microbial community utilizing organic compounds in the wastewater. In addition, the gradual increase in the
Vc with time could be a tool for selecting electricigen species.
The electrogenic bacteria autonomously adapts to the external transient resistance or the electrical potential across the capacitor until the charging of the capacitor is complete, while the
Vc remains the same as the open circuit voltage of MFC. While the optimal external resistance for maximum power generation approximates the internal resistance [
29], the effects of external capacitance on the activity of the biocatalyst in MFCs has never been investigated.
From a signal-processing point of view, the change of displacement current gives the opportunity to investigate the activity of electricigen population at the anode in real time. The Fast Fourier Transform (FFT) decomposes an electrical signal into the current components in frequencies. The spectrum of frequency components is the frequency-domain representation of the signal. Hence, the displacement current signal with time could be converted into several current components with a characteristic frequency. For example, the current component with zero frequency could be the direct current (DC), and the other current components, either with positive or negative frequency, might be the alternating current (AC).
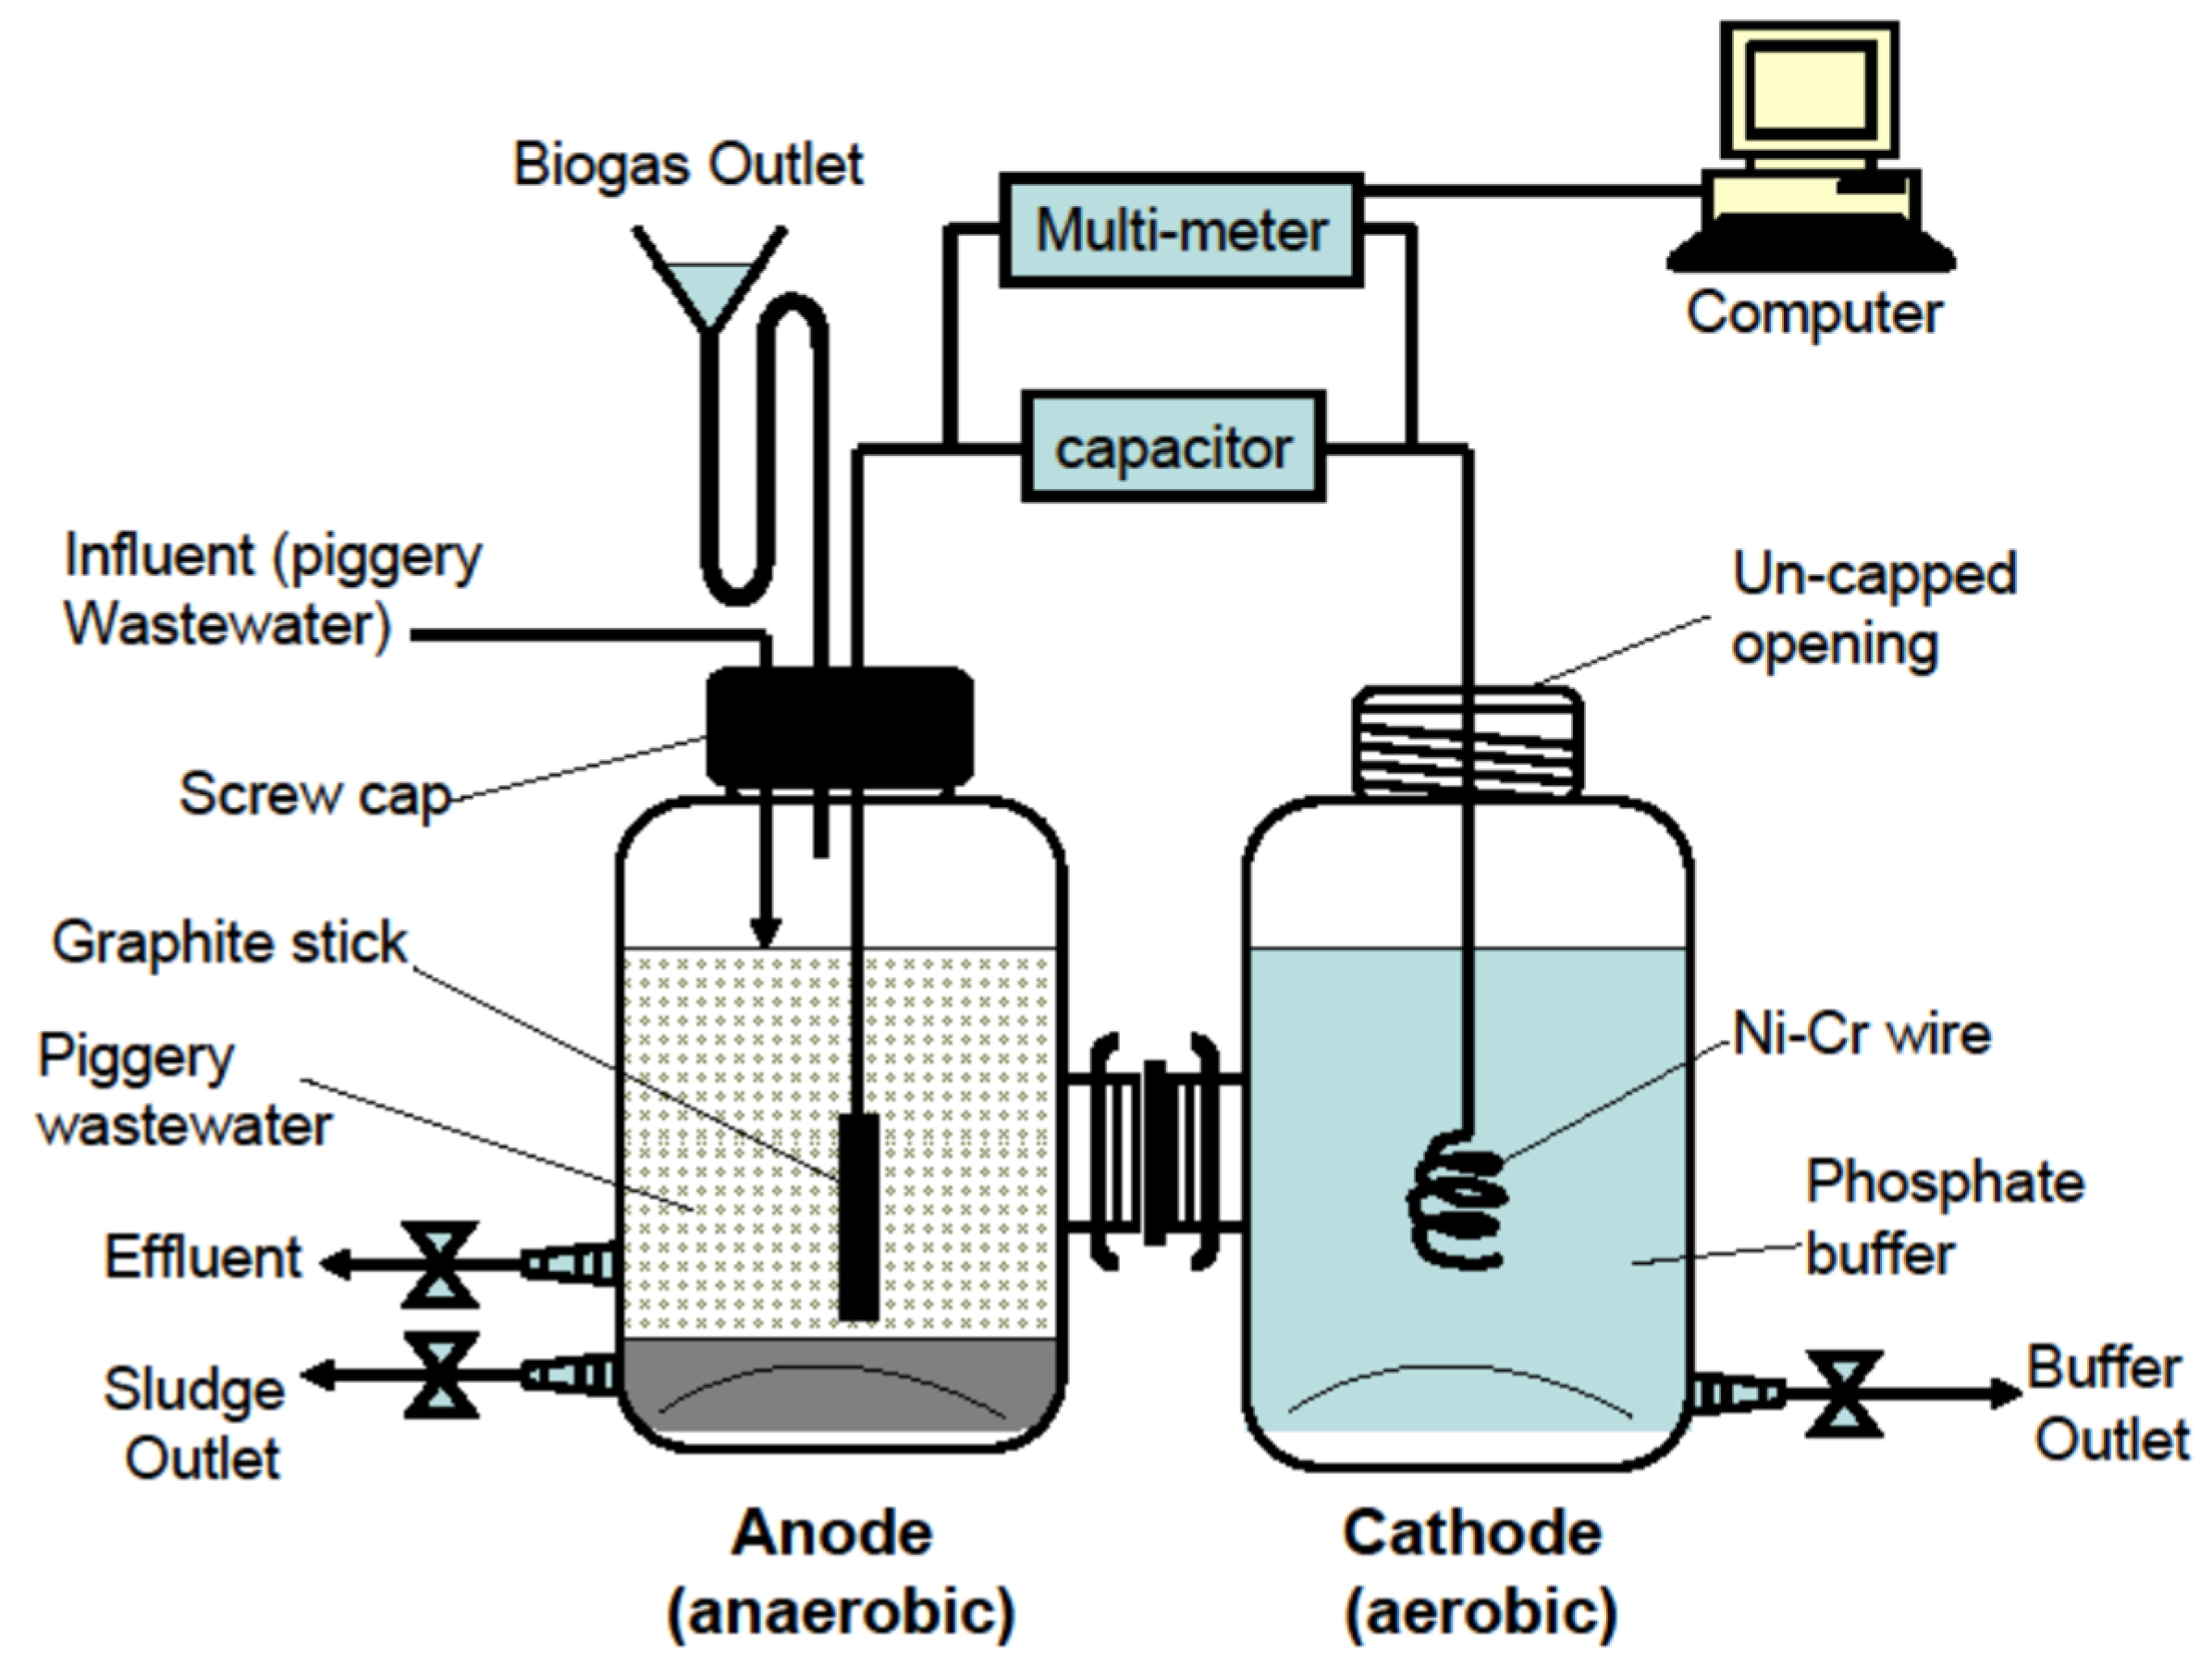
The objective of this study is to examine the unique charging characteristics of a simple batch-operated piggery wastewater MFC with a capacitor as charge storage. Simple two-chamber fuel cells (MFC) were applied by using piggery wastewater as fuel and anaerobic sludge as the source of electrogenic microorganism population.
3. Results and Discussion
3.1. Removal of COD, BOD, Cations and Anions by MFC
Piggery wastewater inside the anode chamber was degraded by anaerobic microbes. Two indices, COD and BOD, are used to determine the quality of water and piggery wastewater. As the amount of organic matter increases, COD and BOD increase. The piggery wastewater had COD = 4482 mg/L and BOD = 2548 mg/L before the experiments; after the experiments, the piggery wastewater had COD = 224.6 ± 9.5 mg/L and BOD = 34.9 ± 8.9 mg/L. Thus, the removal efficiencies of COD and BOD were 95 and 99%, respectively. Experimental results showed that both COD and BOD can be reduced by more than 90%. The removal efficiencies for NH4+, Ca2+, Mg2+, Cl−, PO43−, and SO42− in piggery wastewater were 24, 83, 52, 19, 82, and 68%, respectively, after time-course experiments.
Biogas production was also observed during the experimental periods. Both biogas (about 200–500 mL/d) and micro-electricity were produced simultaneously. The initial pH and dissolved oxygen (D.O.) of the phosphate buffer in the cathode chambers were 6.97 ± 0.01 and 4.8 ± 0.61 mg/L, respectively. The final pH and D.O. of the phosphate buffer in the cathode chambers were 7.07 ± 0.01 and 1.27 ± 0.47 mg/L, respectively, after 3 × 10⁶ s under 25.37 ± 0.06 °C. Thus, pH did not change significantly. The amount of D.O. decreased during the time-course experiments and might result from a lack of active aeration.
3.2. Monitoring Changes of Output Voltage and Current by MFCs
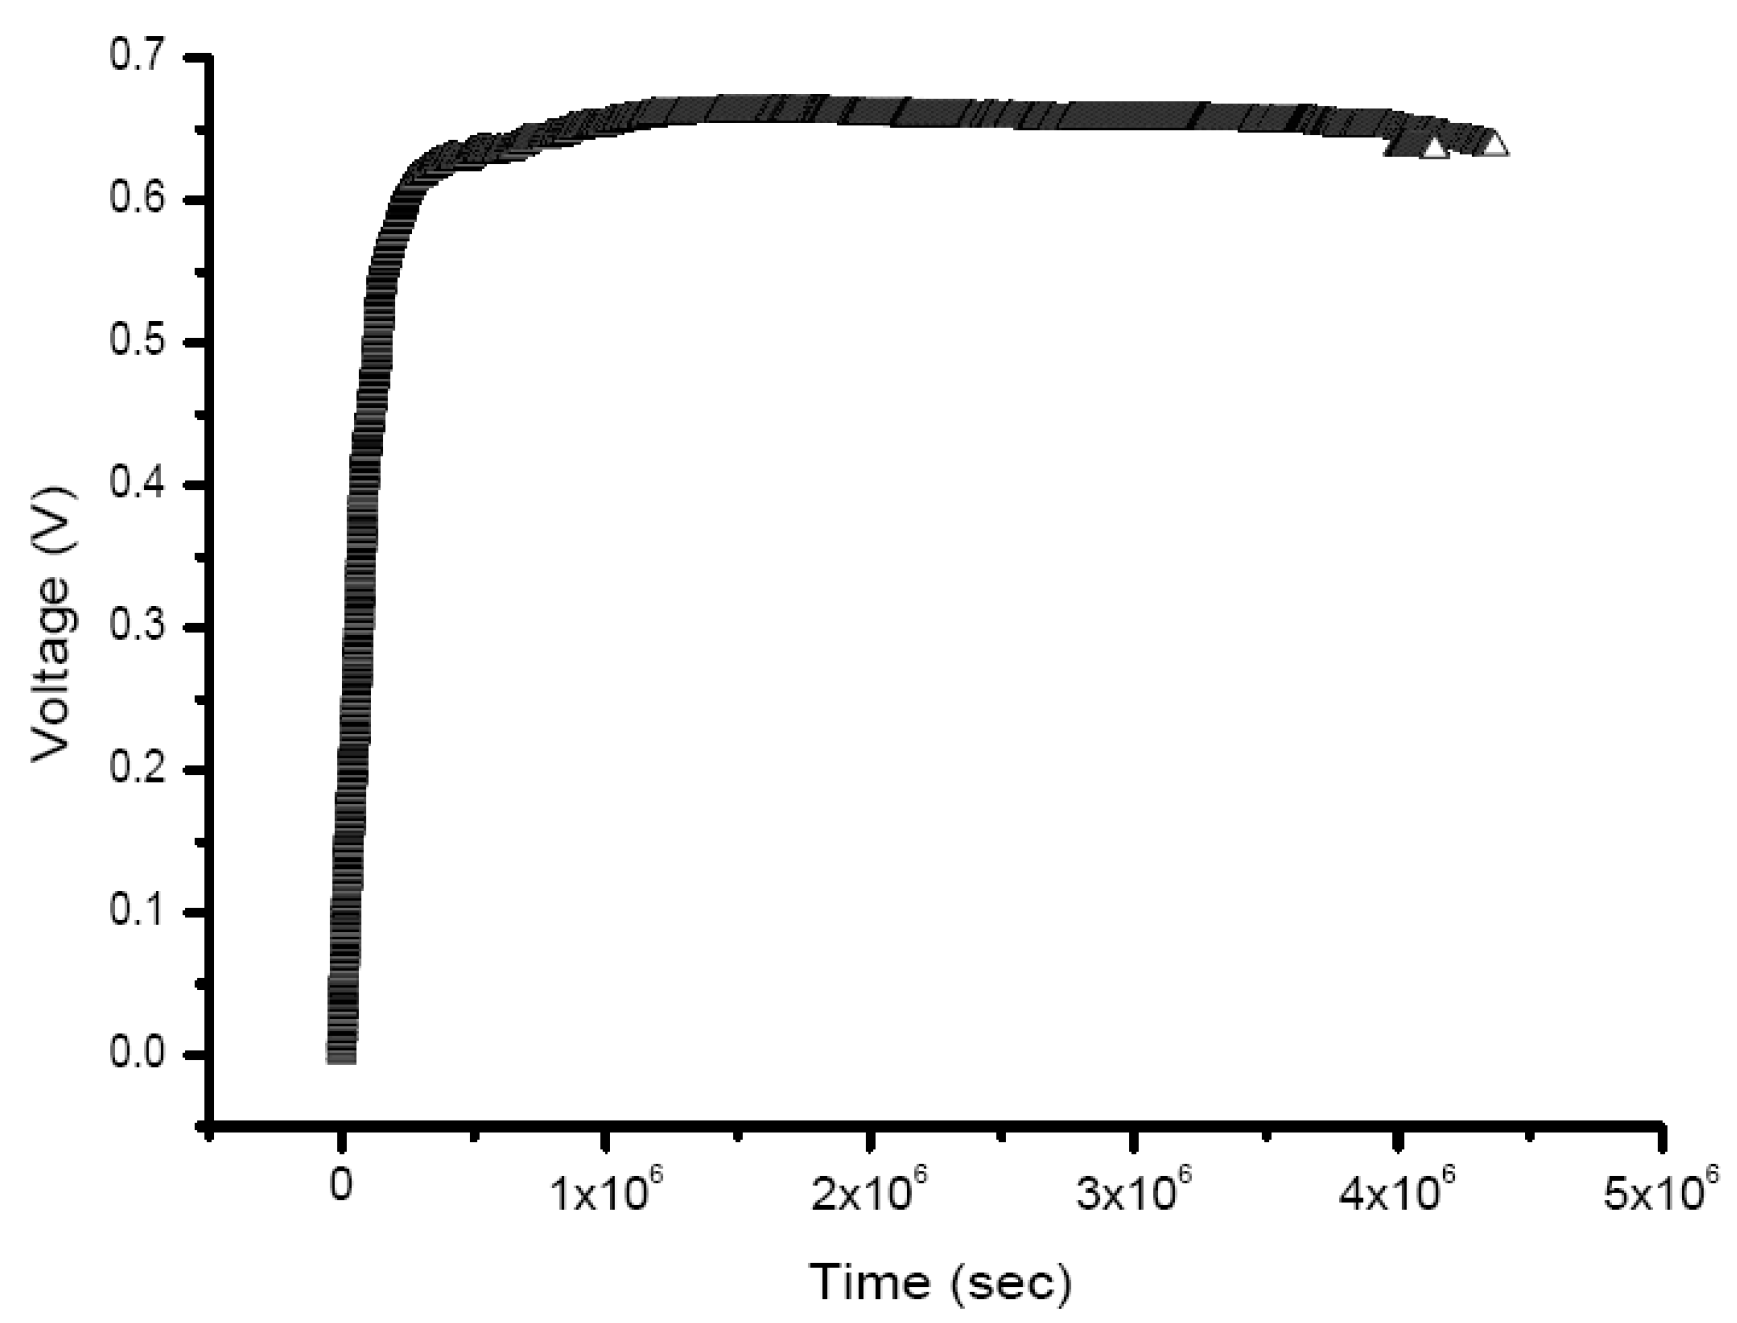
By charging the external load capacitor and measuring the instantaneous voltage across the capacitor, the recorded voltage variation with time was a function of loading capacitance and electrical charges stored. The sampling rate of voltages with time was 1 Hz due to the limitation of the data logger. The output voltage was 0.6 V after 64.58 h (232,496 s) and 0.66 V after 327.21 h (1,178,010 s) from one of the three fuel cells. That is, 108 h were required to generate 1 V (64.8 h/0.6 V). The output voltage reached a stationary phase (0.66–0.663 V) after 11.6 days (277.8 h). The experiment ended at 1149.95 h (4,139,820 s) with a final voltage of 0.636 V (
Figure 2).
For DC current generated by the MFC, internal resistance (IR) could be estimated by measuring the voltage across the capacitor and calculating the time constant of the resistor–capacitor circuit (RC circuit), according to the voltage growth model of capacitor charging and by curve fitting techniques of ORIGN software. The estimated IR increases with time, ranging from roughly 100 Ω to >10 KΩ, and remained constant for the three MFCs. The initial small resistance variation of several tens of ohms may result from the change of PEM resistance RPEM and the electrode polarization resistance RP.
Since electrode polarization resistance decreased with biofilm evolution [
36], the increase in IR was mainly attributed to the problems associated with PEM [
12]. For example, as biofilm gradually forms, the polarization resistance decreases when the anode and cathode are attached with biofilm [
37,
38]; on the contrary, the ohmic resistance of biofouling PEM increases [
39].
At the final stage of the time-course experiments, the voltage across the capacitor was stabilized eventually when the magnitude of output current decreased to <1 µA. Thus, maximum voltage of the three MFCs using piggery wastewater as fuel was 0.663 V (
Figure 2). However, the development of biofilm on the anode will mature through stimulation of the output current over time [
24] and the enhanced biofilm reduced the anodic polarization resistance with the increasing anodic capacitance [
40].
3.3. Changes of Output Voltage
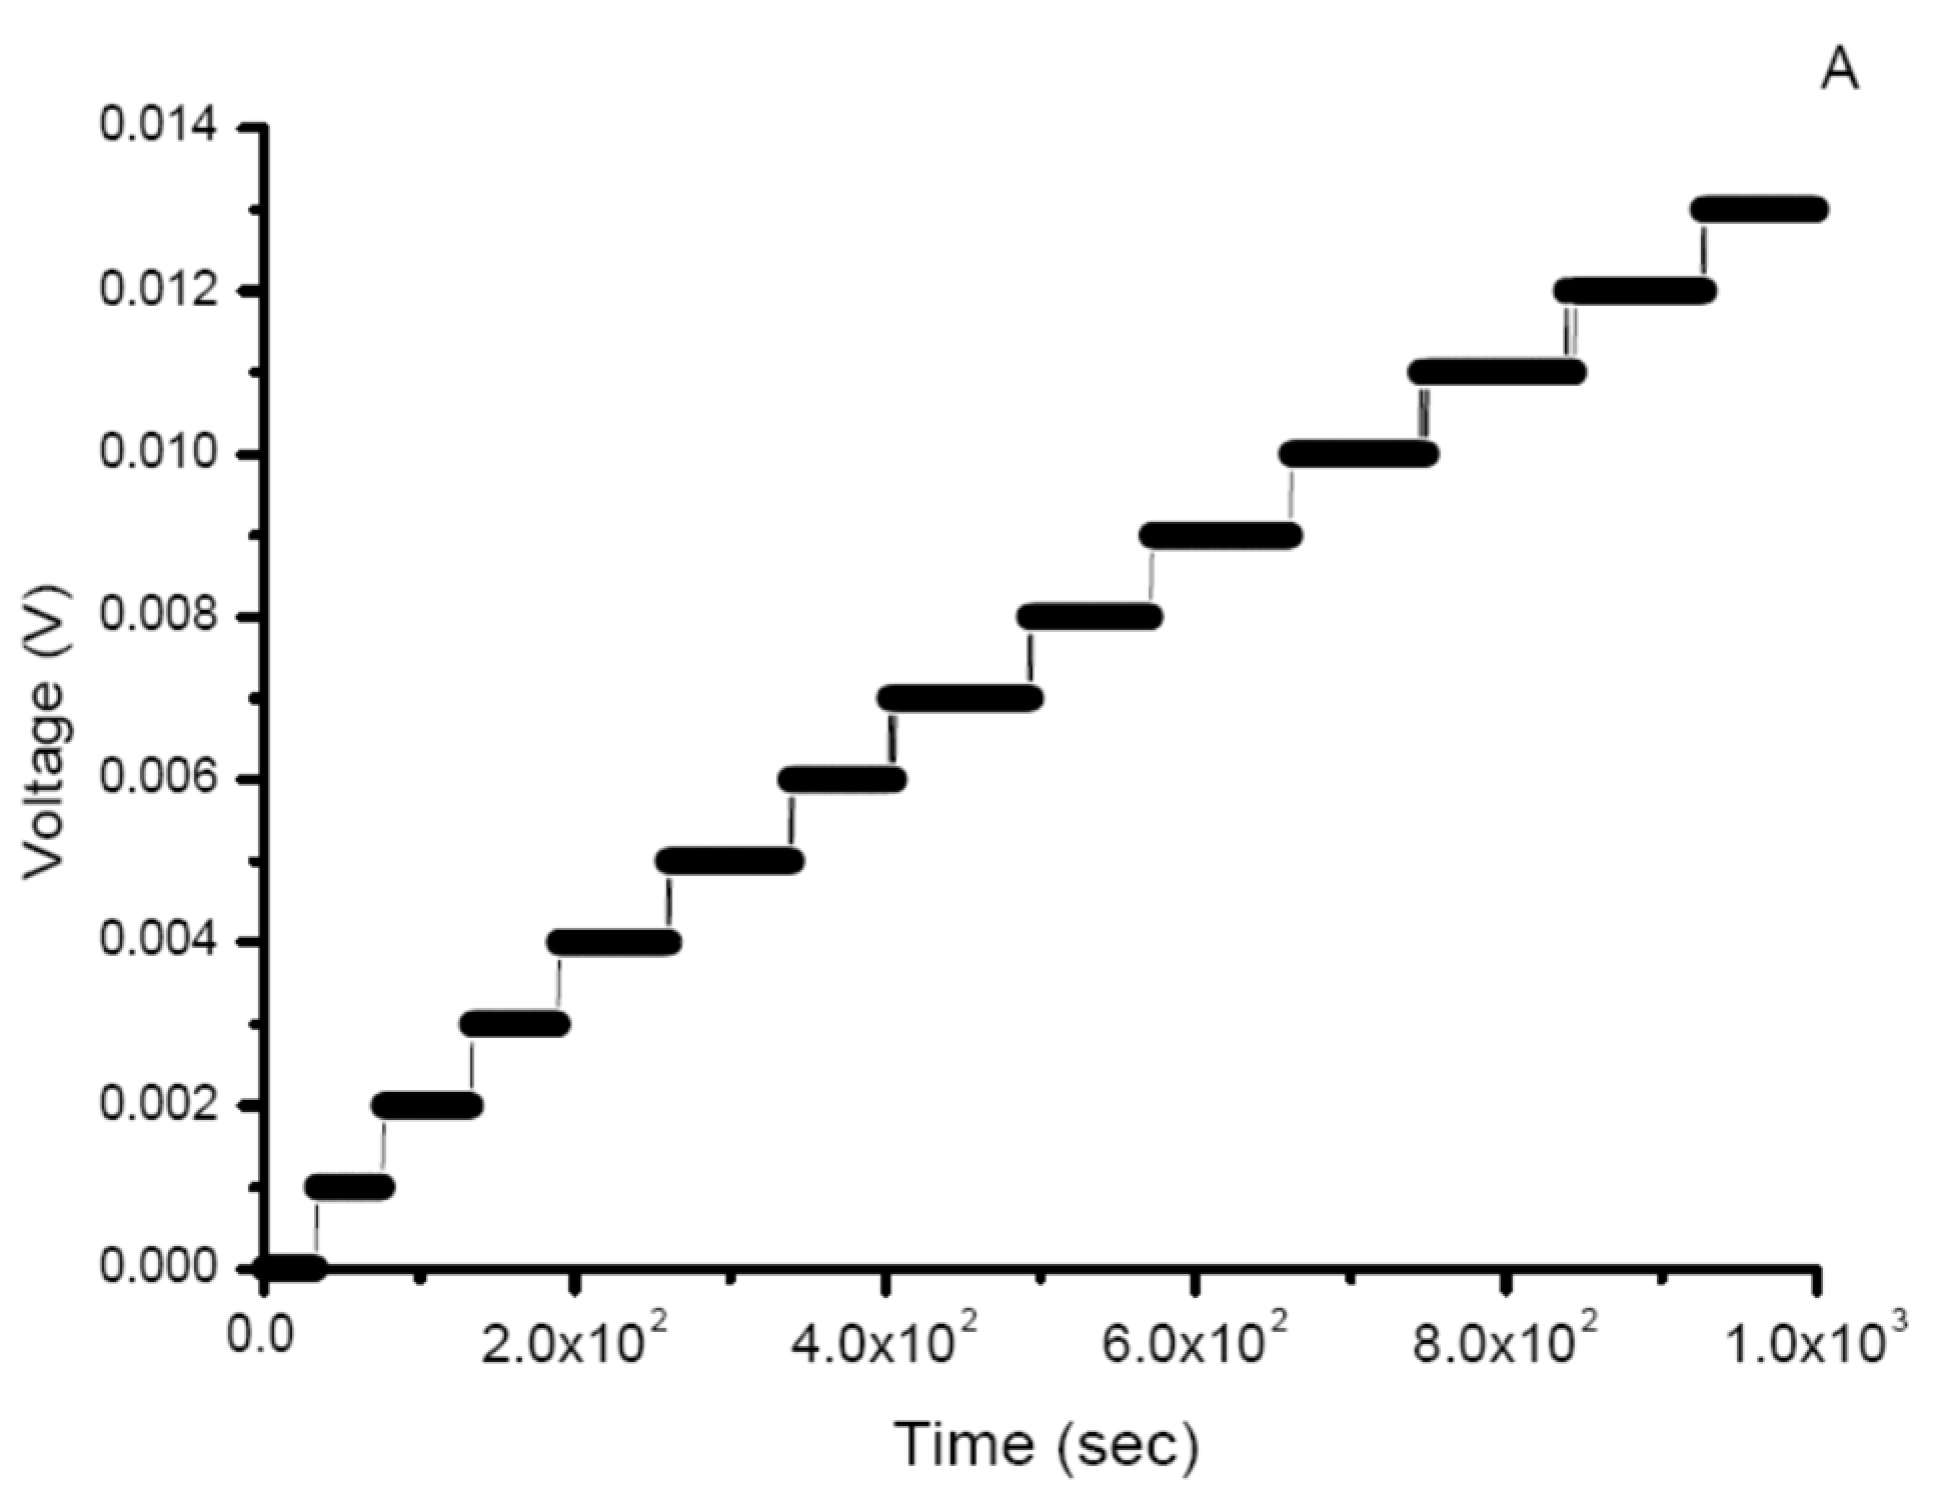
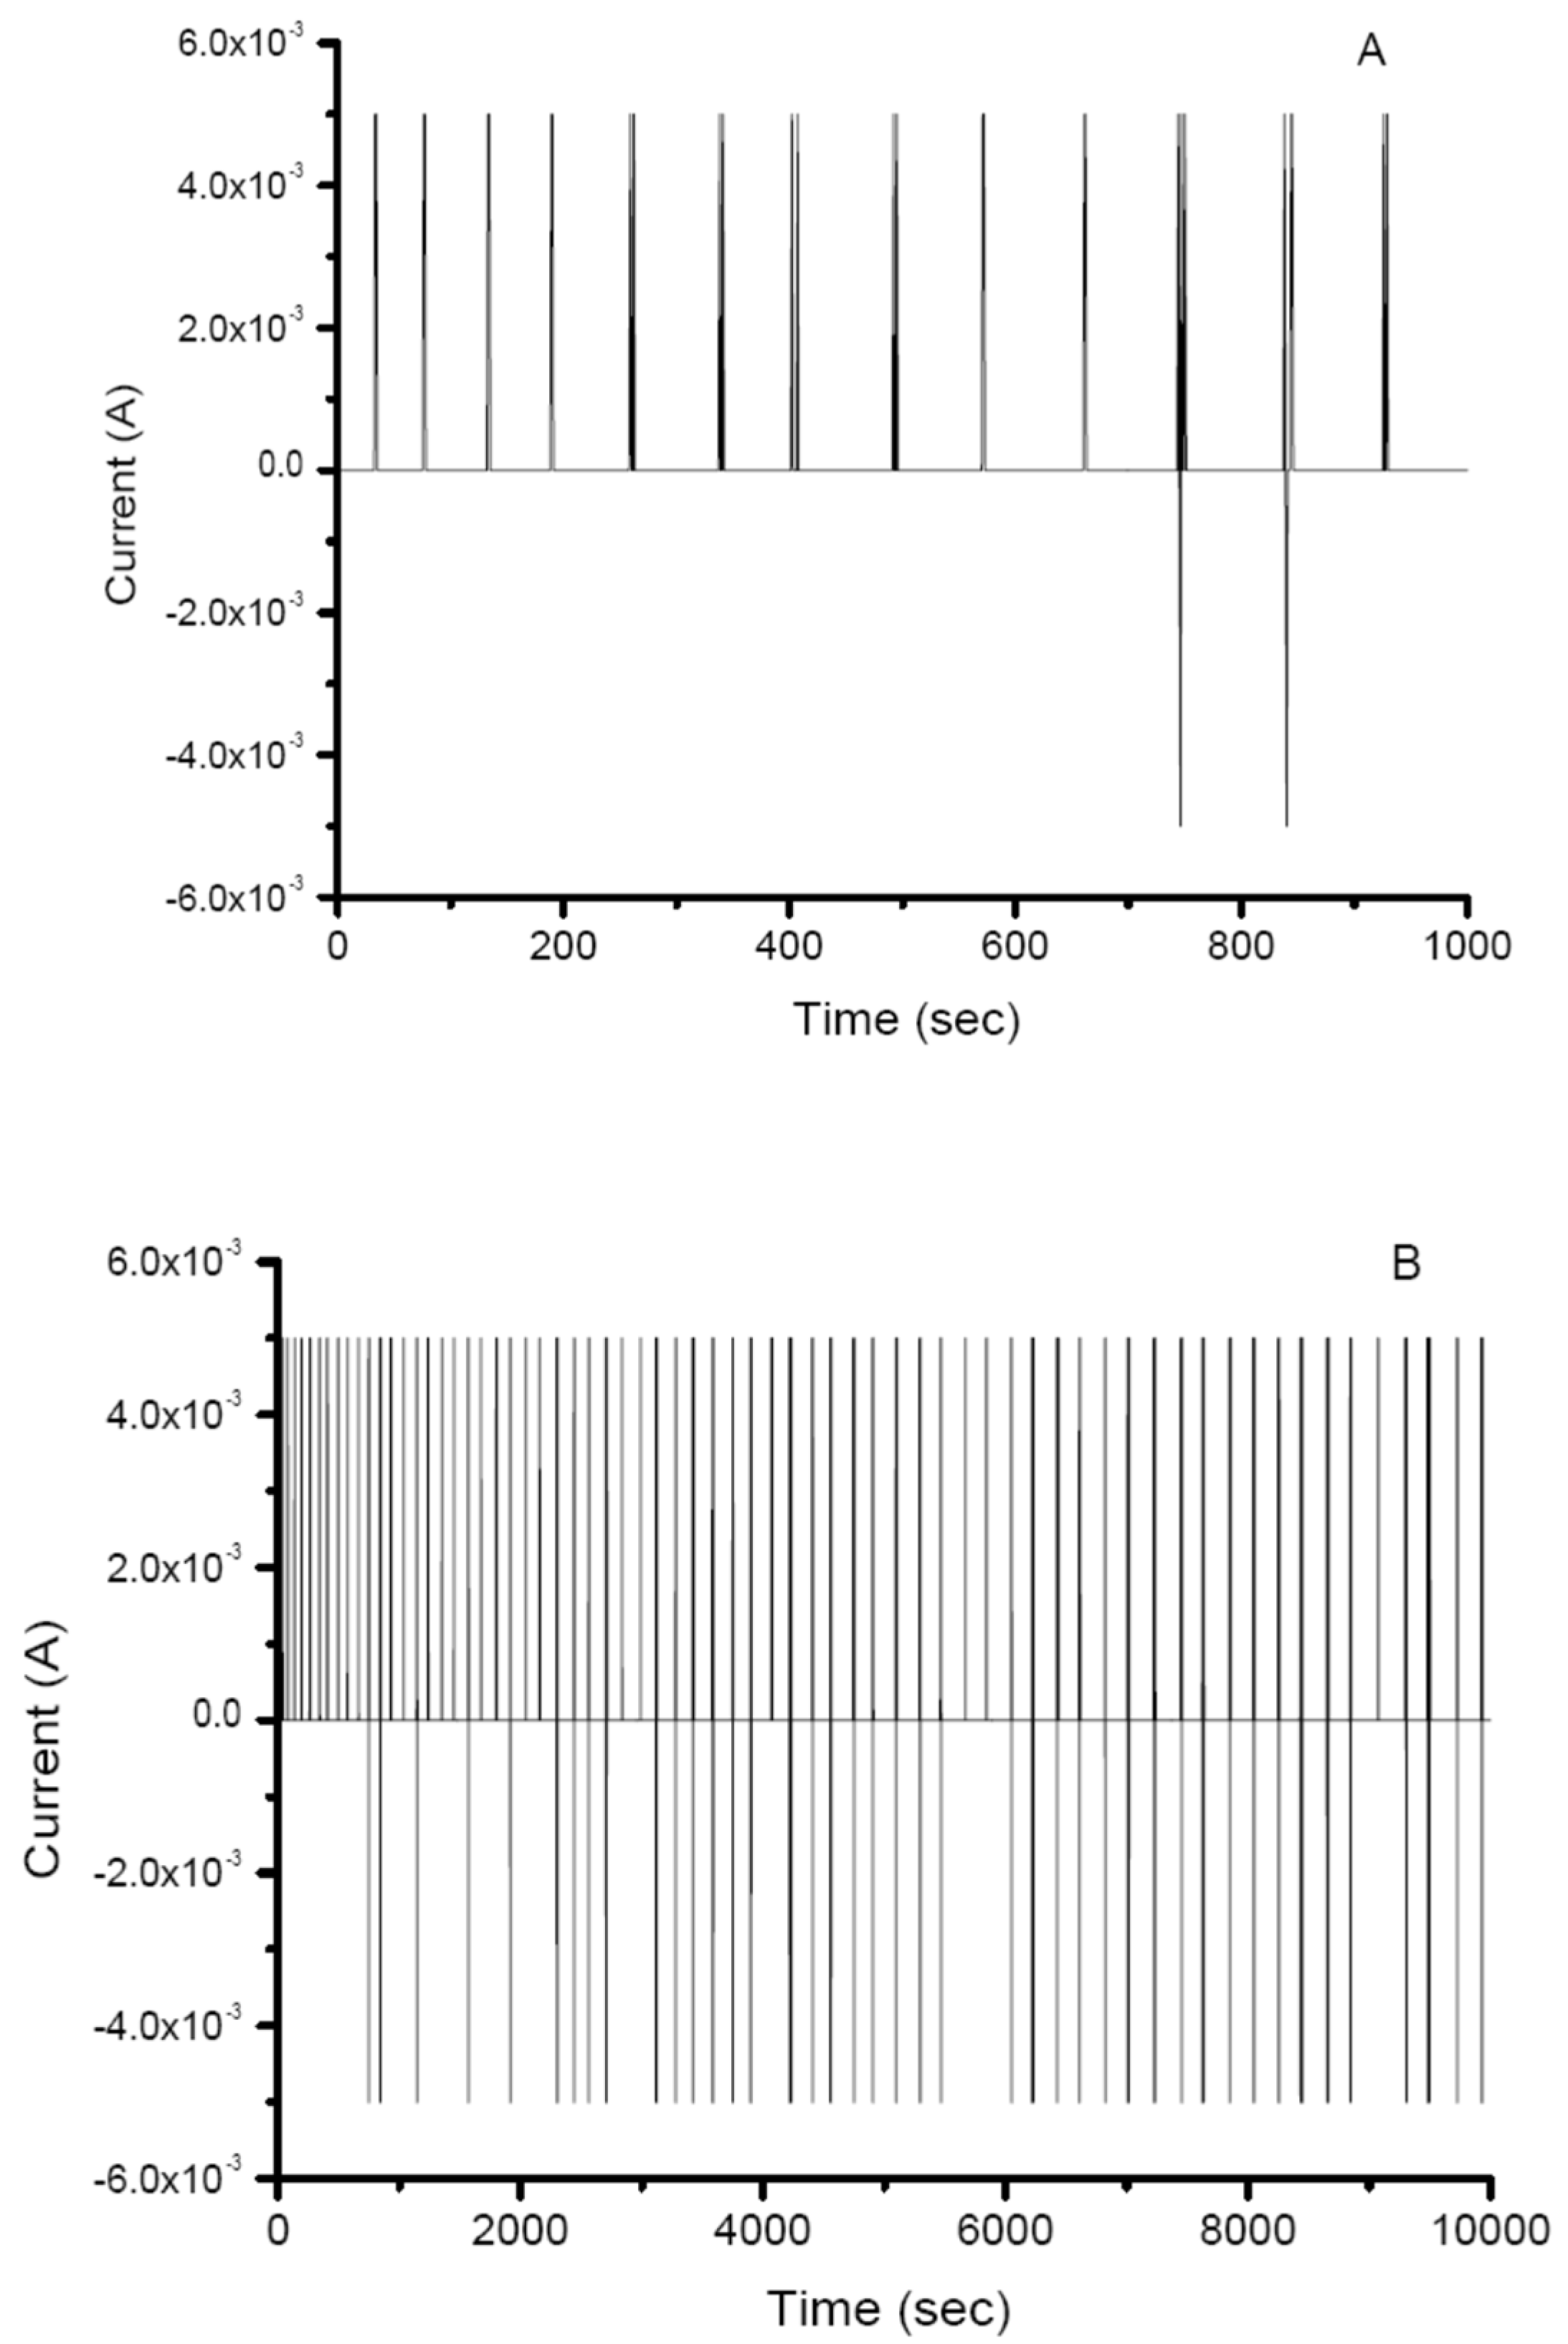
The duration of the stepwise enhancement of voltage across the capacitor increased gradually with time at the period of 0−1000 s (
Figure 3A). This phenomenon might imply the ongoing charging/discharging cycles and regrowth of bacteria on the anode after transferring electrons. This intermittently charging capacitor mode was analogous with the reported intermittent connection or switching frequency control working mode, which operated in charging/discharging switching to harvest energy from MFC [
27]. All the reported phenomena suggested that appropriate relaxation time might be necessary for the recovery of charge transport to anode by electrogenic microorganisms.
The larger the external transient resistance, the more relaxation time required for the recovery of the electrogenic activity (
Figure 3A). The study of Dewan et al. demonstrated that it is beneficial to harvest the energy intermittently for MFC operation [
27]. In addition, the experimental results of Ren et al. showed that lowering the switching time by 100 s could lead to higher current output (1.59 mA) and COD removal (63%) [
28]. For the whole picture of the charging curve, the stepwise enhancement of voltage across the capacitor increased continuously with time at the period of 0−10,000 s (
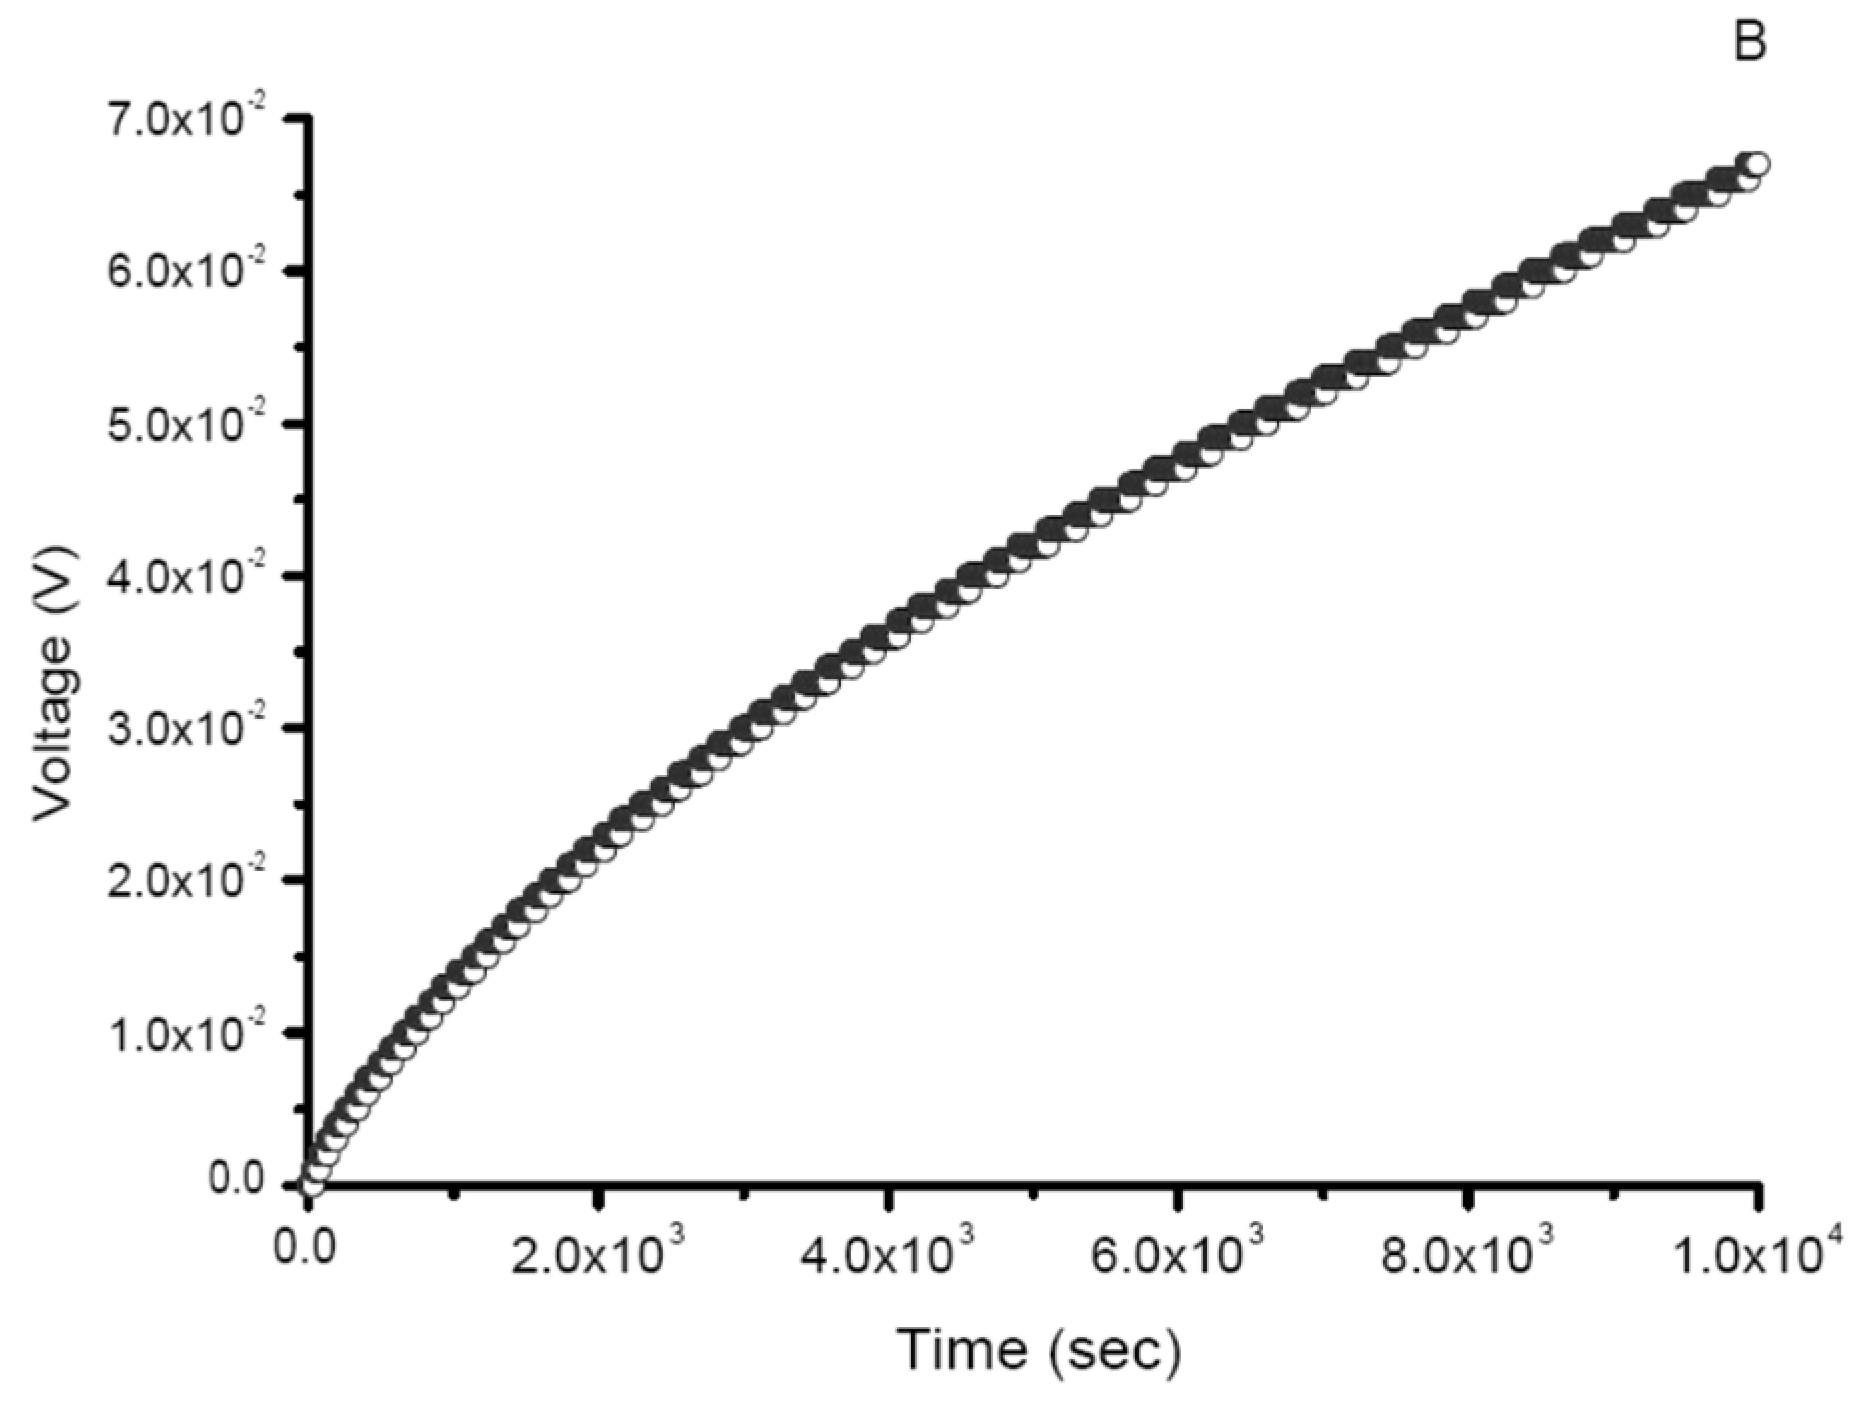
Figure 3B). The voltage across the capacitor was progressively saturated with the decreased charging current. However, the recovery of electrogenic activity was limited.
3.4. Changes of Output Current
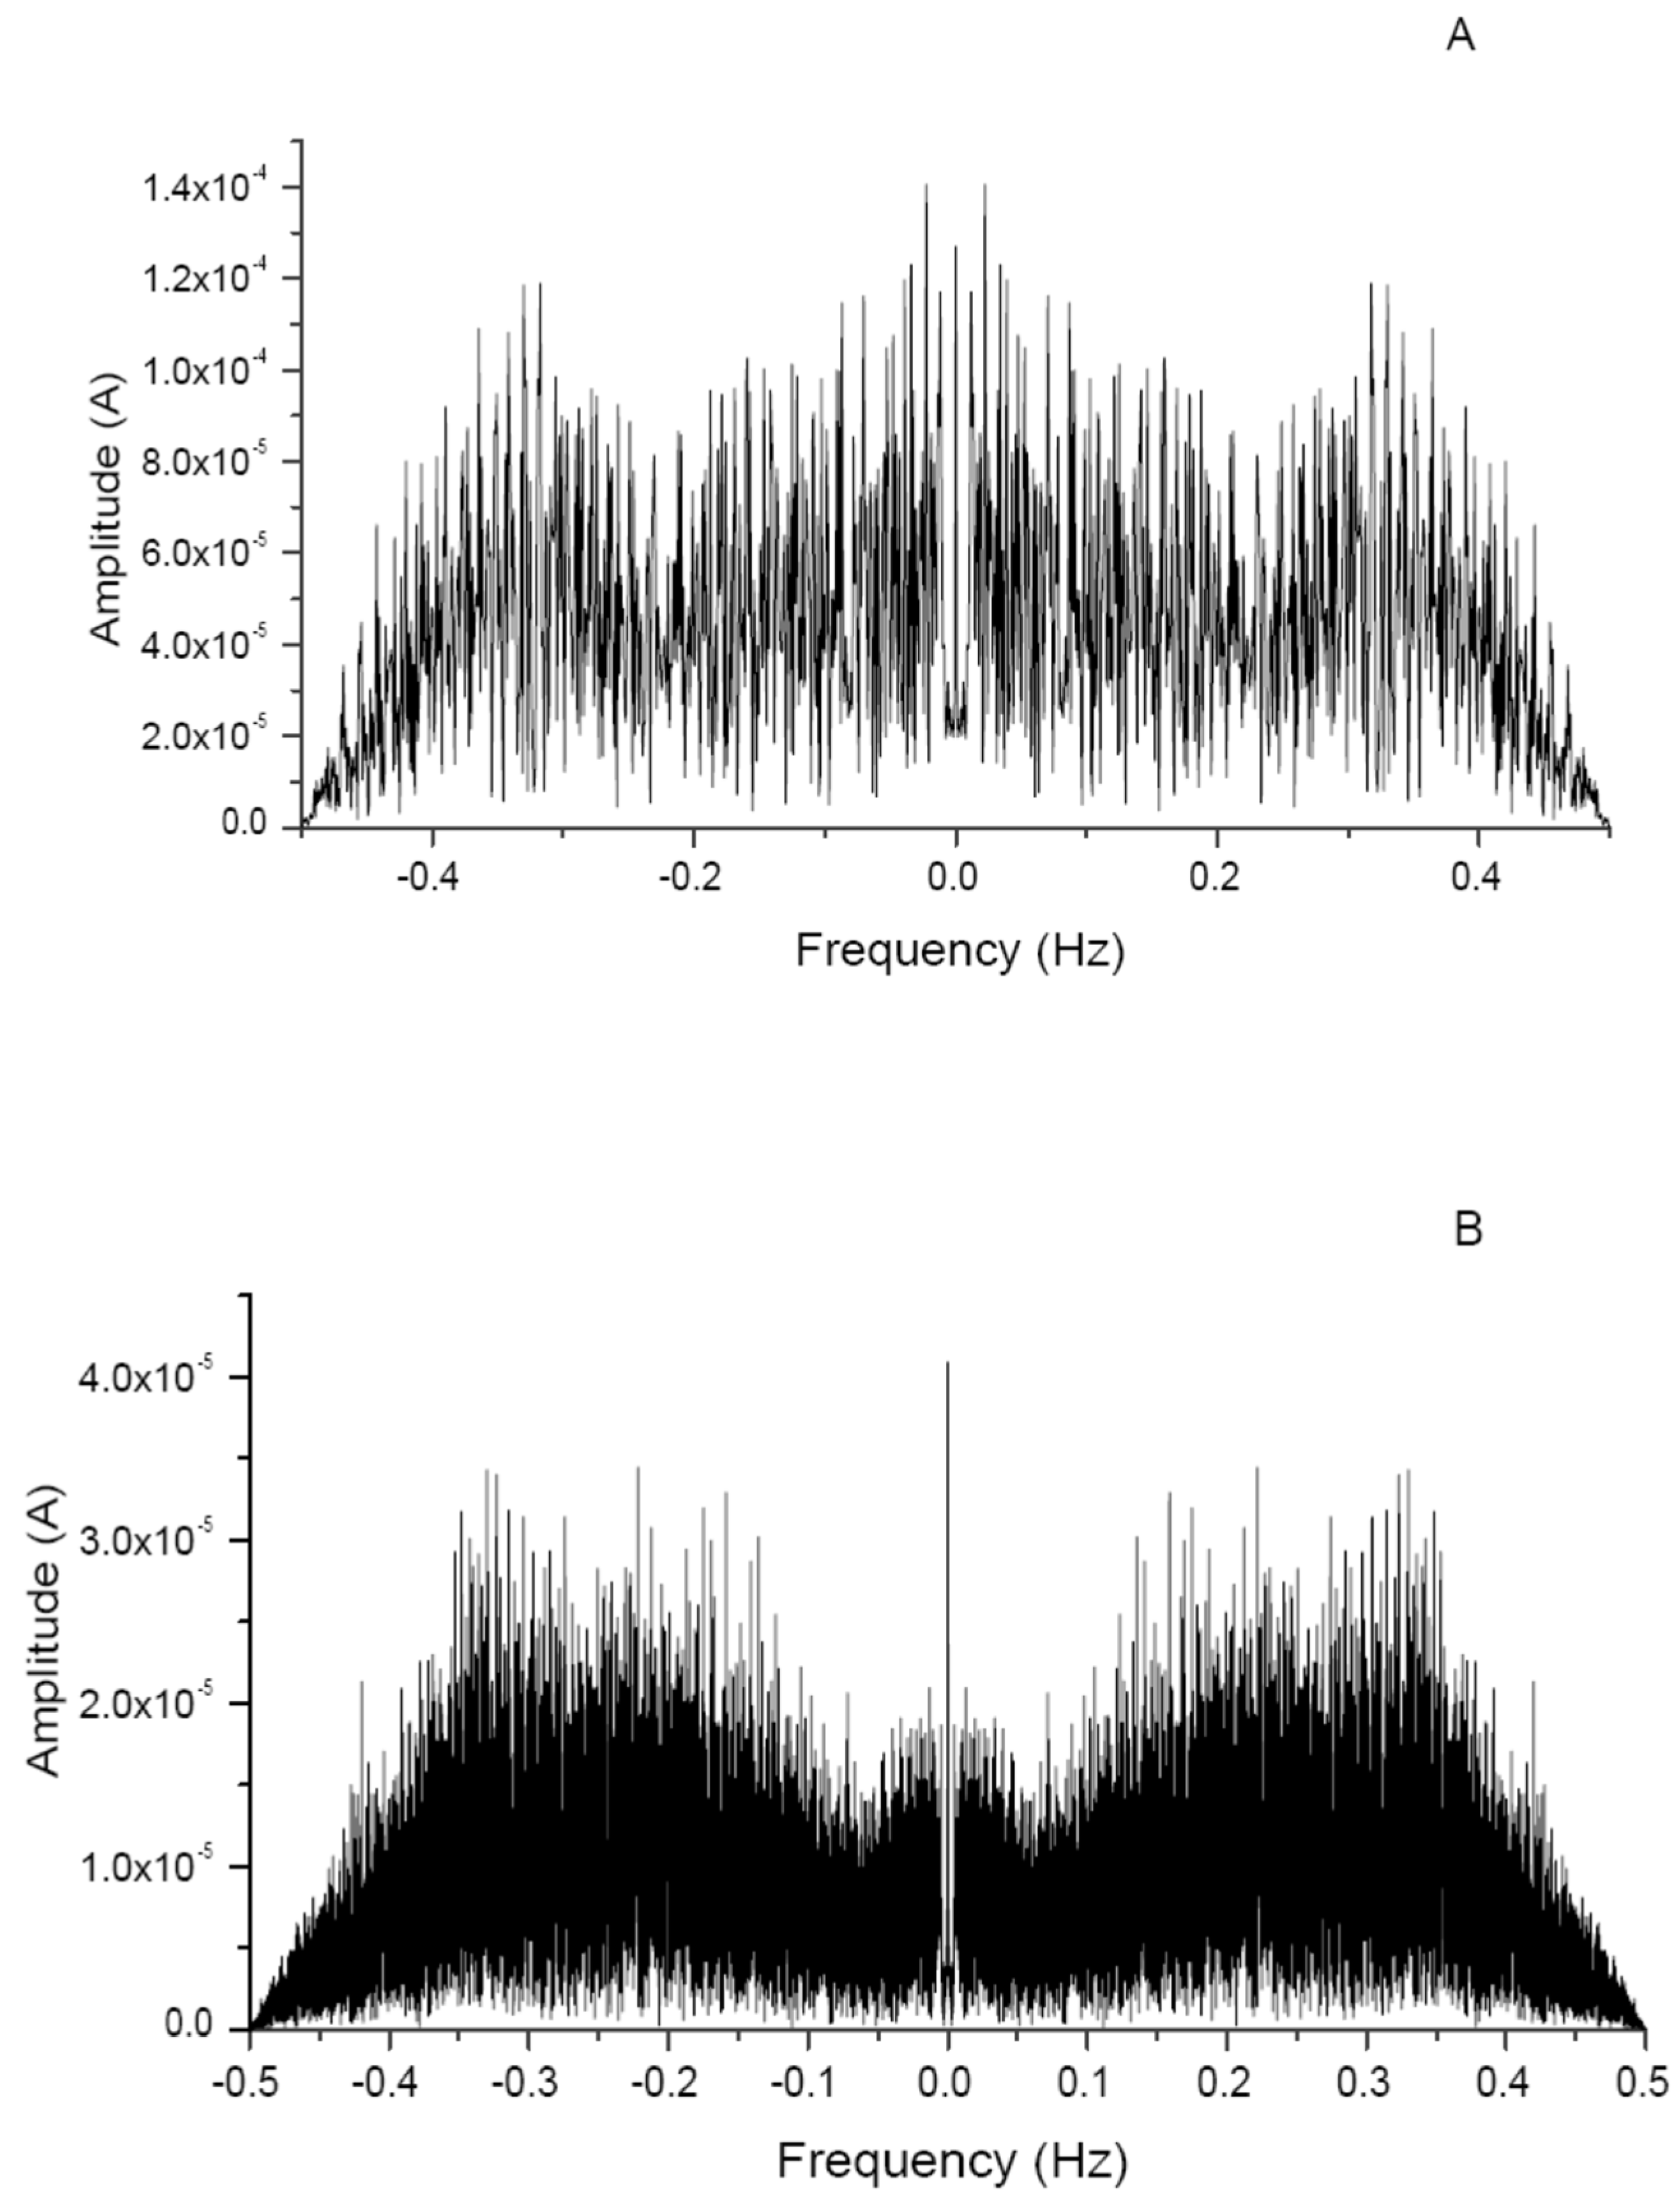
The instantaneous variation of displacement current
i(
t) was obtained by calculating the time derivative of the voltage across the capacitor, as shown in Equation (1). In this way, the output current and charges generated by MFCs can be calculated precisely based on the variation in voltage across the capacitor. Thereafter, the output displacement current with time was analyzed by FFT to decompose its AC and DC components for different periods (0–1000 and 0–10,000 s). The peaks of displacement current were roughly 5 mA in both directions (
Figure 4A,B). The displacement current indicates that the current travelled backward from the cathode to the anode and discharged the external load capacitor. At the start of charging, the electron release rate in the forward direction was markedly greater than that in the backward direction. The current generation rate in the backward direction gradually increased and was compatible with that in the forward direction (
Figure 4B).
Clearly, the output displacement current fluctuated quasi-periodically with time, and was composed of AC components that had forward and backward current flows (
Figure 4B). The quasi-periodicity of the output displacement current may result from the stepwise phenomenon, which can be interpreted as the electrochemical activity effect of microbial metabolism in the MFCs. The increased current generation rate of the AC component indicates the reproduction of electricigen community and biofilm growth by retrieving energetic electrons after transferring electrons to anode.
3.5. Calculation of the Output Current by MFC with FFT at the Periods of 0−1000 s and 0−10,000 s
The effect of external load (capacitor) on the anodic electrogenic microorganism was found to periodically charge the capacitor with a characteristic frequency; hence, this can be utilized with the FFT technique used in signal processing and analysis field. By converting the output displacement current signal from time domain to frequency domain, the electron release or electrogenic frequency spectrum was obtained in the frequency range of −0.5 to 0.5 HZ with a data-sampling rate of 1 Hz. The spectra of positive and negative frequencies centered at zero. The x- and y-axes represent the frequencies of electron released and the normalized amplitude of each frequency, respectively. In FFT analysis, each frequency represents an anaerobic microbial population distribution for electricity generation. Moreover, the DC component is the amplitude of zero frequency, and the AC components are composed of the amplitude of other frequencies. The normalized amplitude was measured in the current unit, which represented the output current contribution from each frequency.
At the start period of charging (0–10
3 s), the frequency spectrum of electron released with a 10F capacitor showed that the DC and AC components contribute equally to the output current (
Figure 5A). The data shows that the main contributions of the charging current are composed of DC and AC with frequencies of 0.1 and 0.3 Hz. After 10,000 s, excluding the DC component of zero frequency, the frequency spectrum shows that the dominant frequencies are in the range of 0.2–0.3 Hz, and the contributions from other AC components are small compared with the dominant AC components (
Figure 5B). Therefore, the electrogenic frequency spectrum data indicated that (1) when the frequencies were less than 0.2 Hz, the contribution of releasing electrons anaerobes with electrogenic period > 5 s gradually decreased; and (2) the dominant electricigen community with the frequency of 0.2–0.3 Hz maintained either release or retrieve of electrons simultaneously.
The above results demonstrate the kinetics of electron transfer through the electron transport chain, which converts the redox energy into the cross-membrane proton gradient and eventually into the external acceptors, i.e., oxygen. Electrons are transported and accumulated in the external capacitor where the energy is in the form of a built-in electric field. The internal electrical field creates a voltage drop across the capacitor to keep electrons from accumulating gradually. Therefore, the flow of electrons “through” a capacitor is directly proportional to the rate of change of voltage across the capacitor. The more voltage drops across the capacitor, the less the current flow through the capacitor.
The electrogenic frequency increases with increased voltages across the capacitor. For instance, an uncharged capacitor behaves as though it is a short circuit, but the voltage of a charging capacitor rises gradually and acts as an open circuit while it is equal to the OCV. In addition, when electricigens release or retrieve electrons simultaneously with a low electrogenic frequency, the output current of MFC has low AC frequency components, indicating that the impedance of the capacitor is high. Thus, in order to sustain the output current flow, a higher electrogenic frequency is necessary for lowering the impedance of the capacitor.
For the AC and DC components of an output voltage, an output voltage need not be pure AC or DC. In this study, the FFT was used to separate the AC and DC components of the output voltage of MFC by passing it through a capacitor. The voltage drop across the capacitor is dependent of the input current, which depends on the corresponding electron-releasing or retrieval process. Therefore, the voltage drop across the capacitor also relies on the electron-transfer mechanism. The rise or drop of the voltage implies that the electrons are being deposited at or released from the capacitor. Since the input current is obtained by differentiating the voltage with time, the calculated input current has time-dependent components, indicating that the varying current flow is forwarding or reversing in real time.
The basic technique of FFT was adopted to transform the current signal from time domain to the frequency domain and extract the DC signal, amplitude, and phase of each harmonic component, i.e., the sinusoidal current signals with some determined frequency that compose the original mixed current signal shape throughout the whole time course. However, the FFT analysis does not provide the information about the direction of the current flow in time scale. The FFT only elucidates the corresponding frequency of the electron-retrieval process in frequency scale; therefore, the amplitude of this frequency in the FFT spectrum enhances while the electron-retrieval process increases.
Experimental results indicated that there was energy loss of the generated charge owing to the small impedance of the storage capacitor for AC components. To verify this inference, a 200 mH inductor was connected directly to the cell; the voltage drop across the inductor was 0.7 V in AC mode. However, the voltage drop was zero in DC mode using multi-meter (TES 2721 LCR multi-meter), which was a proof of our theoretical prediction. The overall DC current density for the proposed MFC was estimated at 10−1 µA cm−2.
The results of Yamamoto’s study showed that bacterial communities in the anolyte and biofilm have a gentle symbiotic system through electron flow, which resulted in the advance of current density from complex organic waste [
41]. The diverse bacterial species, which were capable of electron transfer to the anode with the highest electron-transfer rate, became predominant and these anodic reducing microorganisms could adapt themselves to accommodate the varying external electrical load for a growing community [
42]. Once the dynamic equilibrium of the bacterial community in active biofilm was formed, the output power and the consumption of degradable substrate could be significantly raised and the internal resistance increased with time due to the biofouling and using up of the wastewater fuel [
43]. However, the redox systems were also dependent on the external transit resistance. Thus, the results suggested that the catalytic ability of mixed-culture bacterial communities and their biofilm on the anode depend on environmental conditions such as external impedance, temperature, and pH.
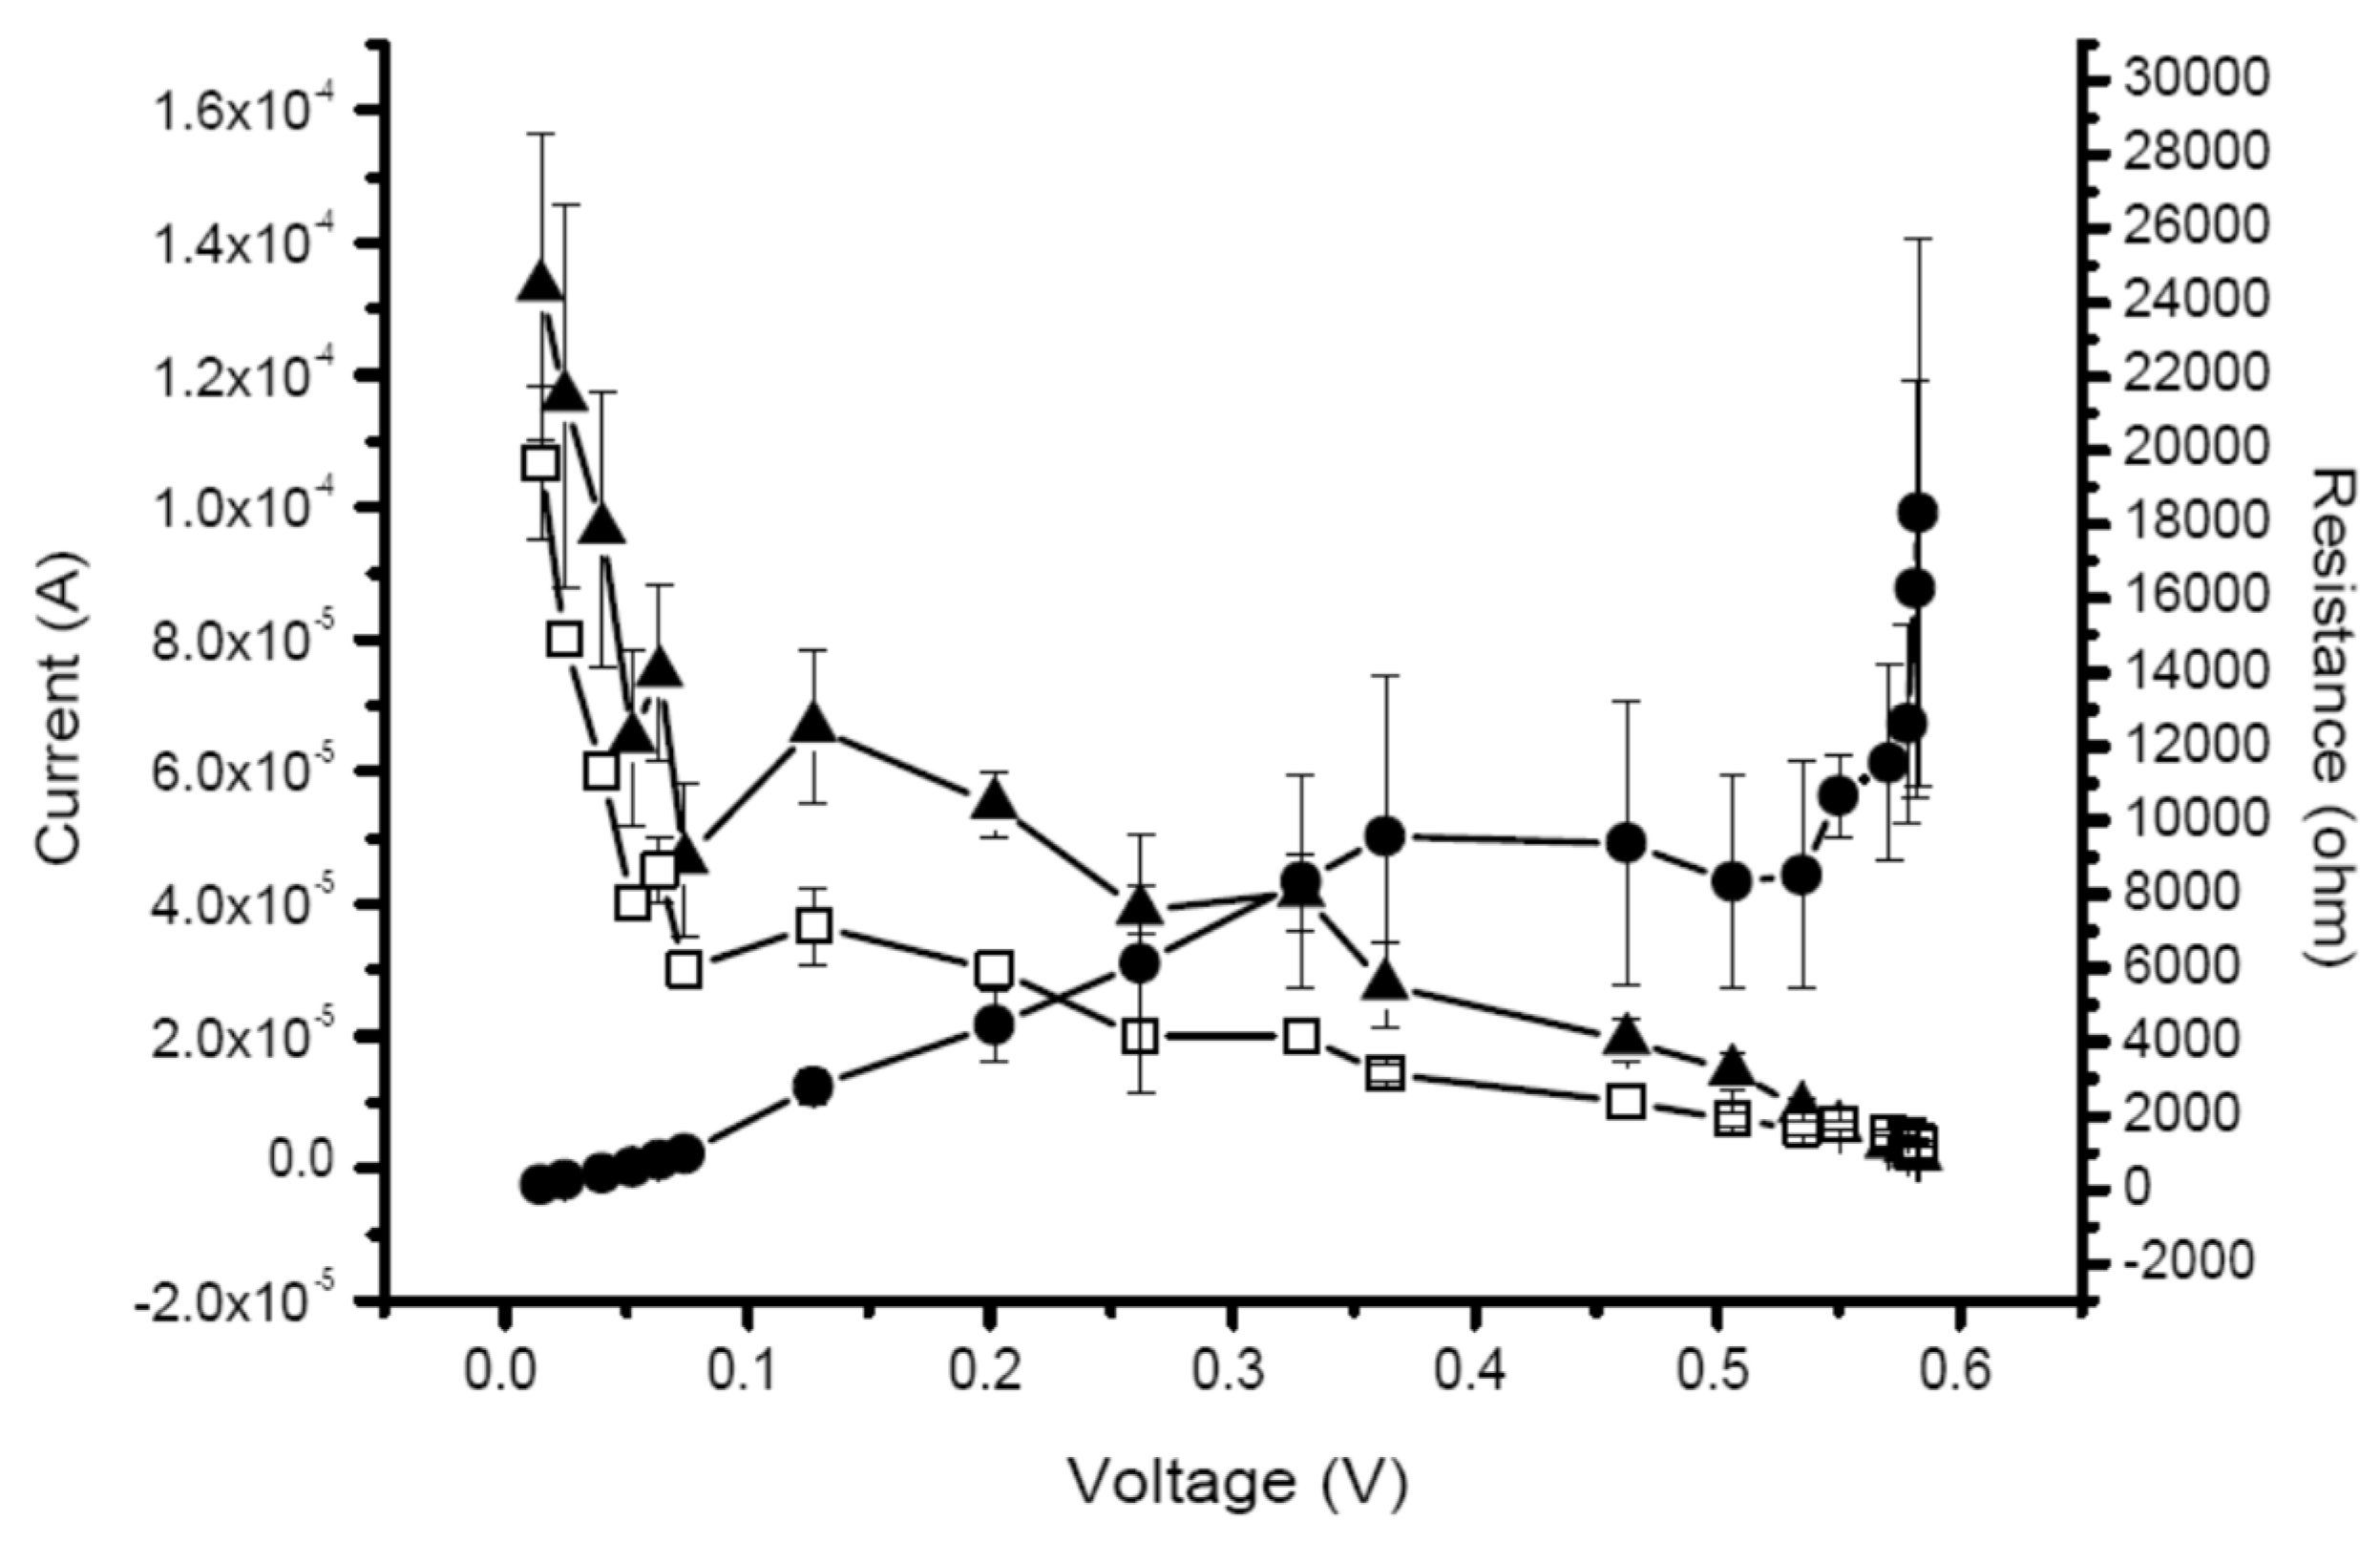
3.6. Monitoring Average Current and IR by MFC
Since voltage across the capacitor was a function of time, displaying data observed from the average AC, DC, and IR versus voltage across the capacitor is the easiest (
Figure 6). The variation of IR, which ranged from tens to thousands of ohms, was obtained from the RC time constant by the curve fitting technique. Initially, the polarization resistance of electrode
RP and
RPEM contributed to IR. Thus, the RP should decrease with time as an increasing number of electrogenic bacteria accumulated and the evolution of biofilm attached on the anode surface [
38]. Meanwhile, the biofouling of PEM, by excreted metabolites, caused ohmic resistance
RPEM to increase gradually. Therefore, variation in IR should be attributed to
RPEM at the final stage of the experiments and affect the output DC and AC currents.
The initial average AC and DC currents were 1.07 × 10
−4 ± 1.15 × 10
−5 and 1.33 × 10
−4 ± 2.31 × 10
−5 A, respectively. Both the average AC (1.07 × 10
−4 ± 1.15 × 10
−5 to 3.00 × 10
−5 A) and DC (1.33 × 10
−4 ± 2.31 × 10
−5 to 4.67 × 10
−5 ± 1.15 × 10
−5 A) dramatically decreased in 1 × 10
4 s (voltage = 0.074 ± 0.016 V). IR (125 ± 41.15 to 8333 ± 2887 ohms) of the MFC increased rapidly in 8 × 10
4 s (voltage = 0.328 ± 0.053 V) and after 8 × 10
5 s (voltage = 0.535 ± 0.112 V) when the average voltage increased in 3 × 10
6 s (voltage = 0.583 ± 0.073 V) (
Figure 6).
A small increase in both AC and DC at voltage between 1 and 1.5 V indicated that anaerobes utilized the second substrates to produce electricity. At the time, IR increased drastically with current increase and stabilized after voltage > 3.5 V, indicating the re-attachment of biofilm by the second bacterial community. Since the substrate (piggery wastewater) was added only once, the output AC and DC currents decreased with the increasing voltage across the capacitor over time. Increased IR might result from accumulation of biofilms on the PEM or increased activation resistance on the cathode surface [
44], while the biofilm formation on both electrodes reduced the polarization resistance [
37,
38].
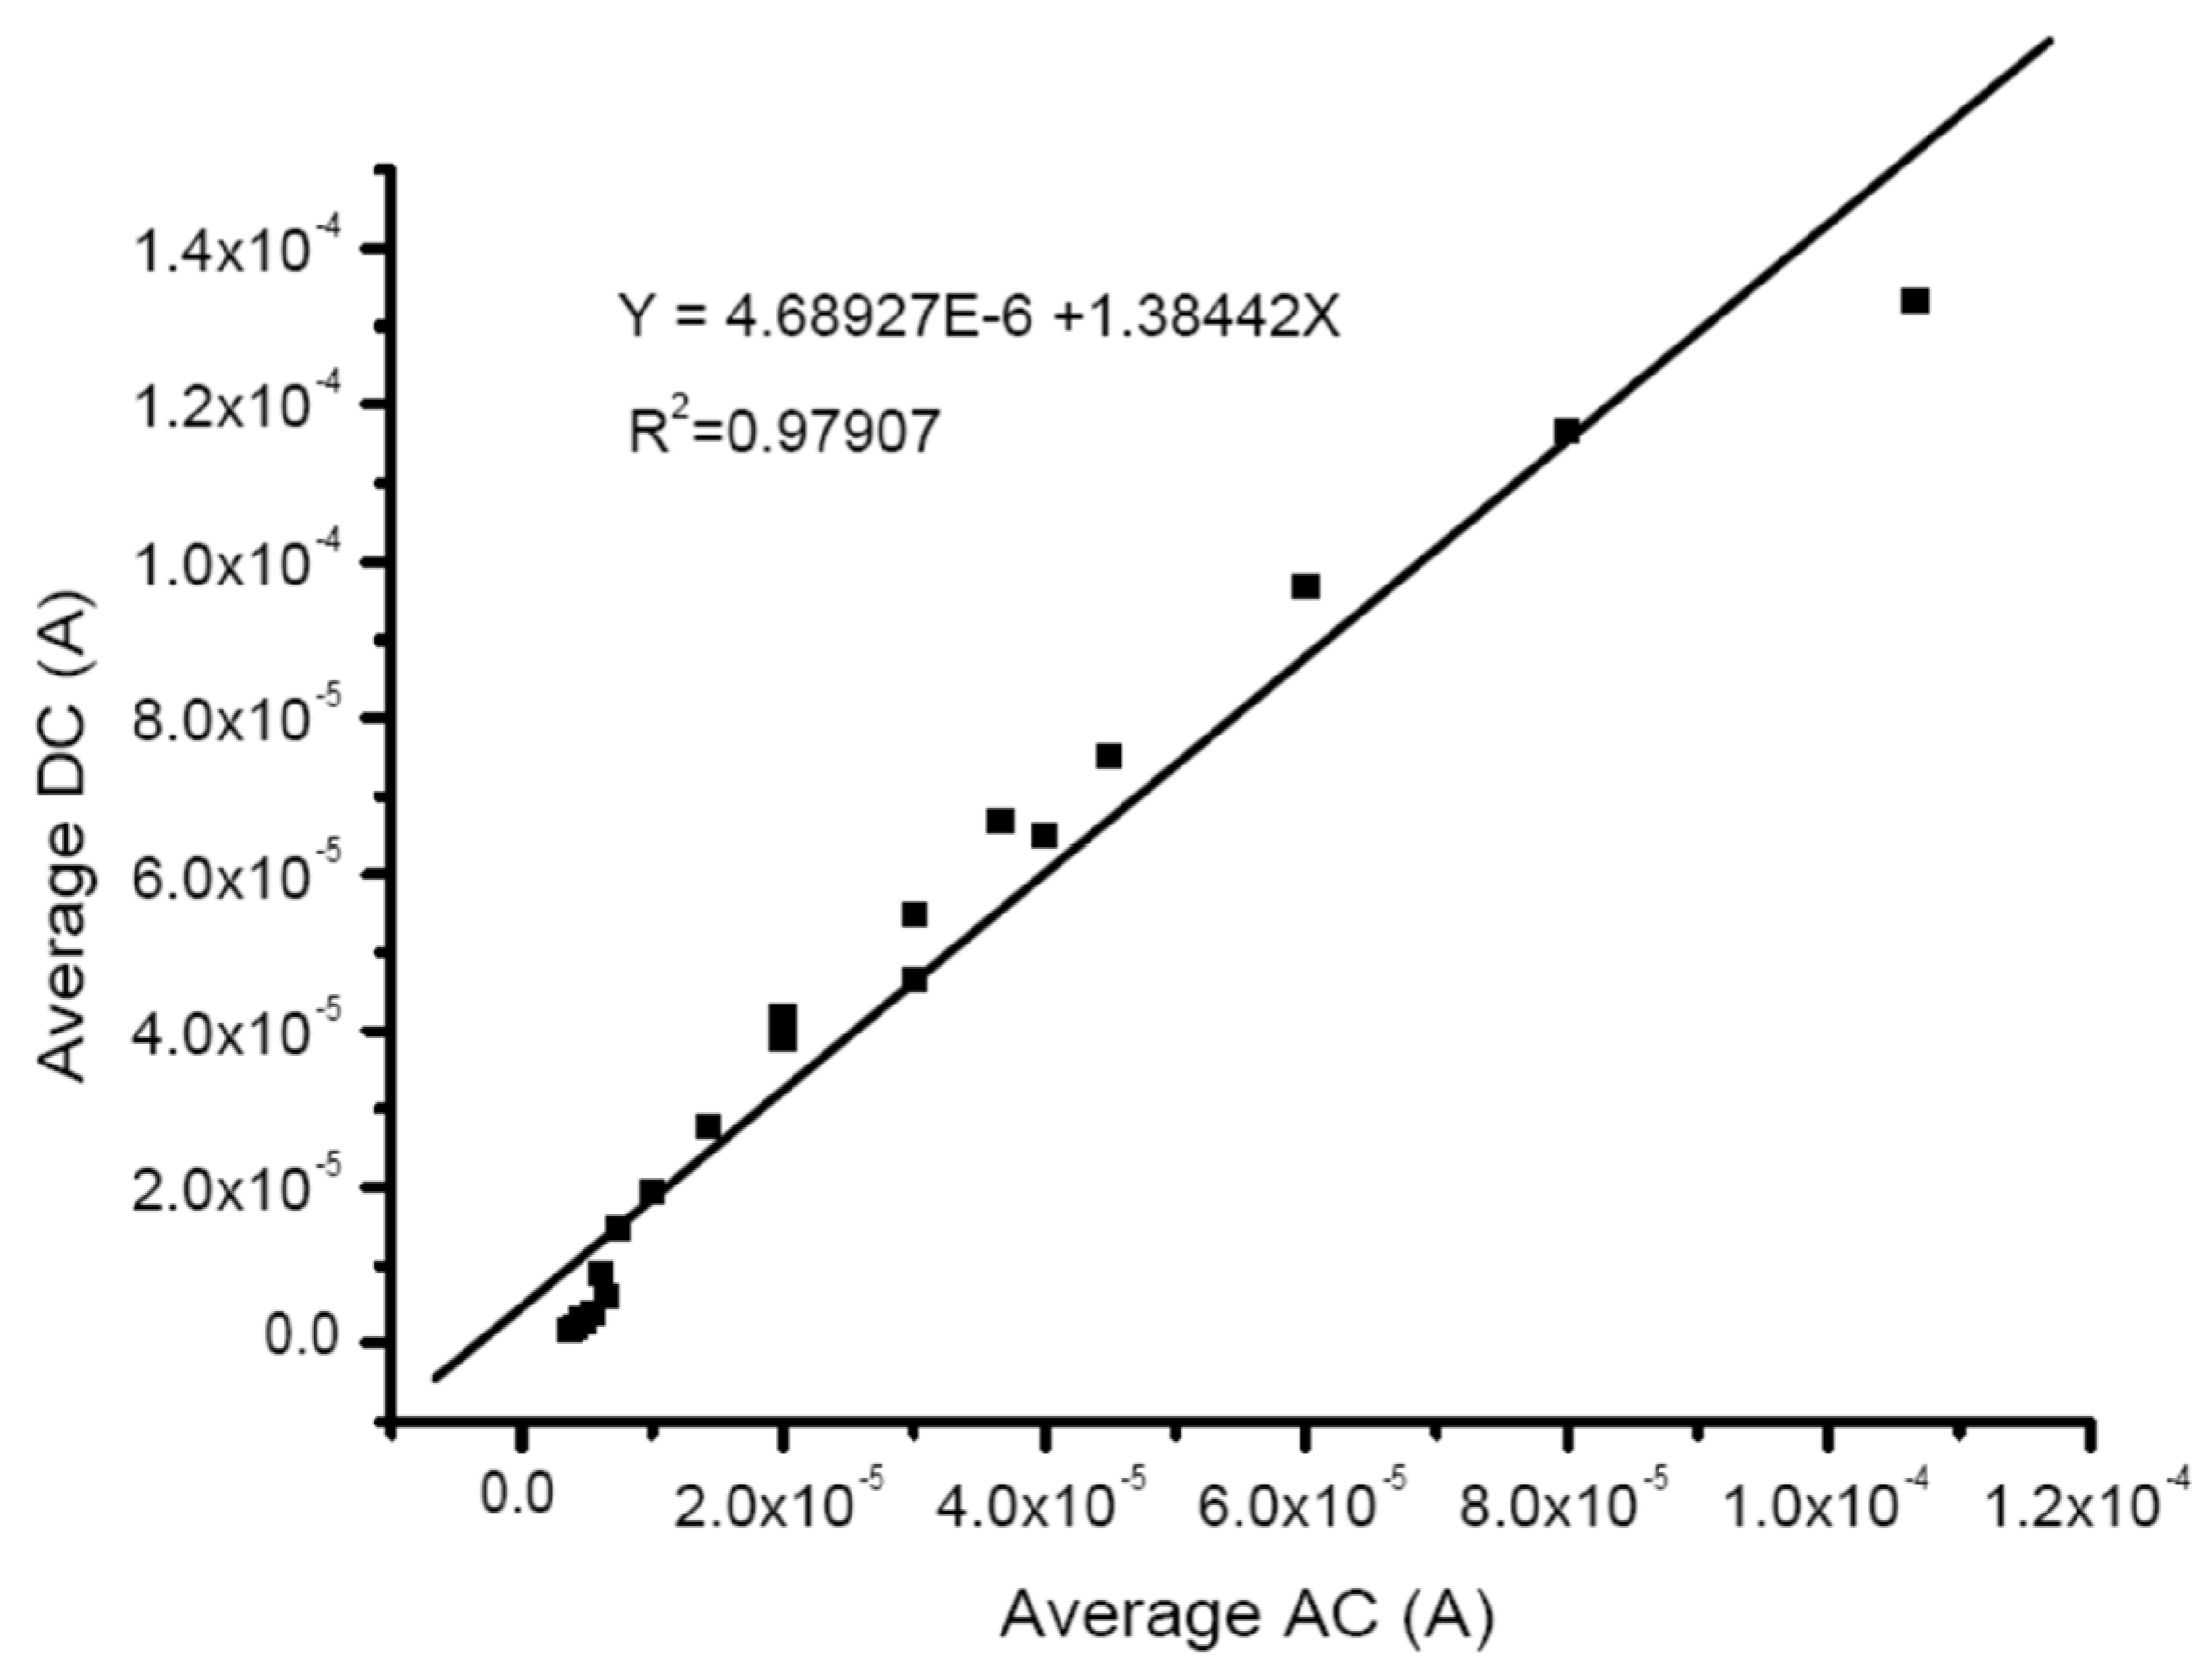
The decrease of DC and AC currents was mainly due to the increase of IR, whereas the AC components could also increase with decreasing anodic resistance. The AC current components can be enhanced by reducing the external impedance with an increase in the external capacitance. The correlations between average DC and AC currents during the time-course experiment using MFCs in triplicates were a linear regression (
Figure 7). The linear regression equation was
y = 4.68927 × 10
−6 + 1.38442
x and
R2 = 0.97907 (
p < 0.0001). The output currents of the AC component and the DC component had the same magnitude at voltage > 0.5 V, which might be caused by the reducing displacement current flowing through the capacitor. However, the decreasing displacement current was due to the increase in IR, caused by an increase of the external transient resistance as the voltage across the capacitor was close to the OCV. Thus, both the average output voltage and total internal resistance in the RC circuit were proportional to time. At the same time, biofilm formation of electricigen was observed on the electrodes in this study. Experimental results showed that increases in the magnitude of IR results in a decreased output current, including AC and DC components (
Figure 6).
From a microbiological point of view, the electron transport chain forms a proton gradient across the bacterial membrane, which drives the synthesis of adenosine triphosphate (ATP) via chemiosmosis [
45]. Electron transport chains (ETC) are composed of membrane-associate electron carriers that carry electrons to an external electron acceptor such as oxygen. When electrons are transported through an ETC system, protons are transported through the membrane, leading to a proton gradient or proton motive force. This proton motive force energizes the membrane in a manner similar to the way an electromotive force energizes a battery. The proton flows back into the bacterial cell through the enzyme ATPase generating ATP [
45].
The organic components were oxidized in the anode chamber of the MFC by anaerobic bacteria and produced electrons and protons. The electrons’ transportation through an external circuit to produce electricity and oxygen in the cathode chamber is reduced to form water with electrons and protons. Moreover, the electrons and protons produced from oxidized organics should be used to generate ATP for energizing bacterial cells. Thus, some aggressive anaerobic bacteria might tend to retrieve electrons for ATP generation, but some mild anaerobic bacteria might tend to release electrons for electricity production. Simultaneously, some anaerobic bacteria might release or retrieve electrons in the MFC. This might imply the pattern of the electrogenic frequency spectrum of the MFC. Hence, the electrogenic frequency spectrum of the MFC might also be considered as a colony spectrum of the electricigen in the sludge. However, molecular analysis of anaerobic bacterial populations, such as denaturant gradient gel electrophoresis (DGGE), should be applied to identify the hypothesis of the electrogenic frequency spectrum of the MFC as the colony spectrum of electricigen.


