Article

Application of Biochar Derived from Different Types of Biomass and Treatment Methods as a Fuel Source for Direct Carbon Fuel Cells

1
School of Engineering, Faculty of Innovation and Technology, Taylor’s University Lakeside Campus, Jalan Taylor’s, Subang Jaya 47500, Selangor, Malaysia
2
Fuel Cell Institute, Universiti Kebangsaan Malaysia, Bangi 43600, Selangor, Malaysia
3
School of Engineering, Monash University Malaysia, Jalan Lagoon Selatan, Bandar Sunway 47500, Selangor, Malaysia
*
Authors to whom correspondence should be addressed.
Energies 2019, 12(13), 2477; https://doi.org/10.3390/en12132477
Submission received: 15 May 2019 / Revised: 14 June 2019 / Accepted: 19 June 2019 / Published: 27 June 2019
(This article belongs to the Special Issue Biomass Processing for Biofuels, Bioenergy and Chemicals)

Abstract

:
The direct carbon fuel cell (DCFC) is an emerging technology for energy production. The application of biomass in DCFCs will be a major transition from the use of coal to generate energy. However, the relationship between biomass or biochar composition and the electrochemical performance of a DCFC is yet to be studied. The performance of a DCFC using fuel sources derived from woody and non-woody biomass were compared in this study. The effect of pyrolysis temperature ranges from 550 °C to 850 °C on the preparation of biochar from rubber wood (RW) and rice husk (RH) were evaluated for power generation from DCFCs. In addition, the effect of applying chemical pre-treatment and post-treatment on biochar were further investigated for DCFC performance. In general, the power density derived from rubber wood biochar is significantly higher (2.21 mW cm−2) compared to rice husk biochar (0.07 mW cm−2). This might be due to the presence of an oxygen functional group, higher fixed carbon content, and lower ash content in rubber wood biochar. The acid and alkaline pre-treatment and post-treatment have altered the composition with a lower ash content in rubber wood biochar. The structural and compositional alterations in alkaline pre-treatment bring a positive effect in enhancing the power density from DCFCs. This study concludes that woody biochar is more suitable for DCFC application, and alkaline pre-treatment in the preparation of biochar enhances the electrochemical activity of DCFC. Further investigation on the optimization of DCFC operating conditions could be performed.

1. Introduction

Fuel cell technologies have recently attracted great attention owing to their advantages in producing clean energy using renewable energy sources [1,2]. These technologies use simple electrochemical processes to convert chemical energy into electrical energy. They differ from the fossil fuel energy generation, which requires a complex conversion from heat energy to mechanical energy and to electrical energy with lower efficiency that is limited by the Carnot efficiency [3]. Several types of fuel cells have been investigated and targeted for different applications. In view of the utilisation of biomass energy, direct carbon fuel cells (DCFC) have shown their potential as energy generation devices using carbon fuel in high temperature operations. The success of this system can benefit the chemical industry, in which waste heat energy can be integrated into the DCFC system to generate extra energy on-site. With a proper design of the DCFC system, it possesses the highest electrical efficiency of almost 100% among all types of fuel cells [4,5].
In the current situation, commercial carbon black and coals have been studied as DCFC carbon fuel for energy generation, with high energy efficiency obtained [4,5]. Nonetheless, these carbon sources are non-renewable and, hence, they do not contribute to the carbon-neutral cycle. Recent efforts have been focusing on searching for renewable carbon sources derived from biomass as a more sustainable option. Several works have investigated different types of biomass to produce biochar as a fuel source for DCFCs. The literature shows that the maximum power density achieved by different types of biochars ranged from 12 to 185 mW cm−2, with the system operating at temperatures ranging between 700 and 800 °C [6]. It can be observed that biomass categorised as woody-type, such as almond shell [7], olive wood [8], and Acacia wood chips [9], obtain a relatively high power density of nearly 100 mW cm−2 and above, as compared to non-woody biomass, which only produce a power density of approximately 30 mW cm−2 and below. Among the many factors which would affect energy production in the DCFC system, the type of fuel source plays a vital role. The conversion of biomass into biochar using pyrolysis would alter the chemical composition of the fuel source and retain the highest energy value in the form of carbon content [10]. For example, the carbon content of rubber wood biochar after pyrolysis is approximately 97.3% [11], as compared to the raw rubber wood with a carbon content of only 43.98% [12].
Besides this, the presence of impurities and different functional groups in the biochar was believed to affect the DCFC performance as well [13,14]. It has been suggested that the differences in the chemical composition between woody and non-woody biomass has led to a major difference in the DCFC power density obtained. This is in line with the good cell performance of coal, with high power density of 165.4 mW cm−2 due to the presence of high fixed carbon, 81.5%, which contributed to the high chemical energy [15]. Besides the application of heat treatment, chemical treatment on the biomass or biochar can alter the chemical composition of the biochar fuel source. Acid pre-treatment of coal enhances the electrochemical activity in DCFCs, with an increment on oxygen-containing surface functional groups increasing the current density [13]. In another study using oak sawdust treated with nitric acid, the surface oxygen functional group increases and ash content reduces [16]. Thus, chemical treatment could be required for the enhancement of the carbonaceous fuel for DCFCs. However, a lack of study was observed on the comparison of pre-treatment and post-treatment in the preparation of biochar for the application of DCFCs.
Therefore, this study aims to explore the potential of woody (rubber wood) and non-woody (rice husk) biomass for DCFC application. In this research, the effect pyrolysis temperature on the preparation of biochar from rubber wood and rice husk on DCFC performance was investigated. Initial screening was conducted to choose the pyrolysis temperature that produces the biochar with the best DCFC performance. Besides this, the effect of different pre-treatment and post-treatment methods in biochar preparation on DCFC performance was investigated. Through this, the relationship between the structural composition of biochar and the performance of the DCFC can be further discovered.

2. Materials and Methods

2.1. Pyrolysis of Biomass

The rice husk was collected from PLS Marketing (M) Sdn Bhd, Sekinchan, Selangor, and the rubber wood biomass was collected from SYF Resources Bhd, Semenyih, Selangor. The biomass was washed using distilled water at room temperature. Then, it was dried in an oven at 110 °C for 24 h. The dried biomass was ground and sieved into particle size smaller than 500 µm. The pyrolysis process was conducted using a horizontal split tube furnace (Carbolite, HST 1200) under a nitrogen feed flow of 150 mL min−1. The untreated biochar was produced at different pyrolysis temperatures at 550 °C, 650 °C, 750 °C, and 850 °C with a heating rate of 10 °C min−1 for 60 min. All the samples were labelled as RW for rubber wood (RW550, RW650, RW750 and RW850) and RH for rice husk (RH550, RH650, RH750 and RH850).

2.2. Direct Carbon Fuel Cell Performance

The DCFC setup used in this study was the same as that employed in previous studies [14]. Button cell was placed on the sample holder and solid biochar was loaded on the anode. The biochar loading in this study was 100 mg per run. Silver wire was used as the current collector at both the anode and the cathode. Both the anode and the cathode chambers were compressed mechanically. Nitrogen flowed through the anode at 200 mL min−1, whereas air flowed through cathode at 200 mL min−1. The DCFC system was heated to 850 °C at a heating rate of 10 °C min−1. The electrochemical performance was studied using potentiostat (Interface 1000E, Gamry Instrument). Upon reaching the target temperature, open circuit potential (OCP) tests was performed at a scan rate of 1 mV s−1 using a potentiostat (Gamry, Interface 1000E). The internal resistance was tested at a high frequency of 1 kHz [15].

2.3. Chemical Treatment in Biochar Preparation

The results of DCFC performance in Section 2.2 show that rice husk generally produced a much lower power density compared to rubber wood. Hence, the effect of chemical treatment was further investigated for rubber wood raw biomass and biochar only. The structure and chemical composition of rubber wood biomass and biochar were further modified by applying acid and alkali treatments under different conditions. Pre-treatments of the biomass and post-treatment of rubber wood biochar, pyrolysed at 850 °C, were conducted using 2 mol dm−3 50 cm3 of HNO3 and 2 mol dm−3 50 cm3 NaOH for 24 h. The experiment was conducted at room temperature with periodic stirring. A total of 2 g of rubber wood were added into 25 mL of the acid and alkaline solution. The samples were thoroughly washed with distilled water at room temperature until neutral pH was obtained [17]. The chemically treated samples were subjected for DCFC performance testing.

2.4. Biochar Fuel Characterization

Biochar derived from rice husk and rubber wood were further subjected for characterization. Proximate analysis of the raw rubber wood, raw rice husk raw, and biochar from these two biomasses was carried out using the Thermogravimetric Analyzer (TGA800, Perkin Elmer). A total of 10 mg of the sample was subjected to heating from room temperature to 110 °C under nitrogen gas flow and was held for 20 min. Then, the temperature was ramped from 110 °C to 950 °C and was held for 20 min. Gas was switched to air flow at 950 °C and was held for another 20 min [18].
The presence of a surface functional group of biochar was analysed using Fourier transform infrared (FTIR) (Spectrum100, Perkin Elmer) transmission analysis. The samples were analysed using the attenuated total reflection (ATR) from 4000 cm−1 to 650 cm−1 at a resolution of 4 cm−1 [19].
The surface morphology of untreated and chemically treated biochar samples was further studied via a variable pressure scanning electron microscope (VP-SEM) system (Hitachi S3400N-II). Samples were applied with platinum coating prior to the imaging.

3. Results and Discussion

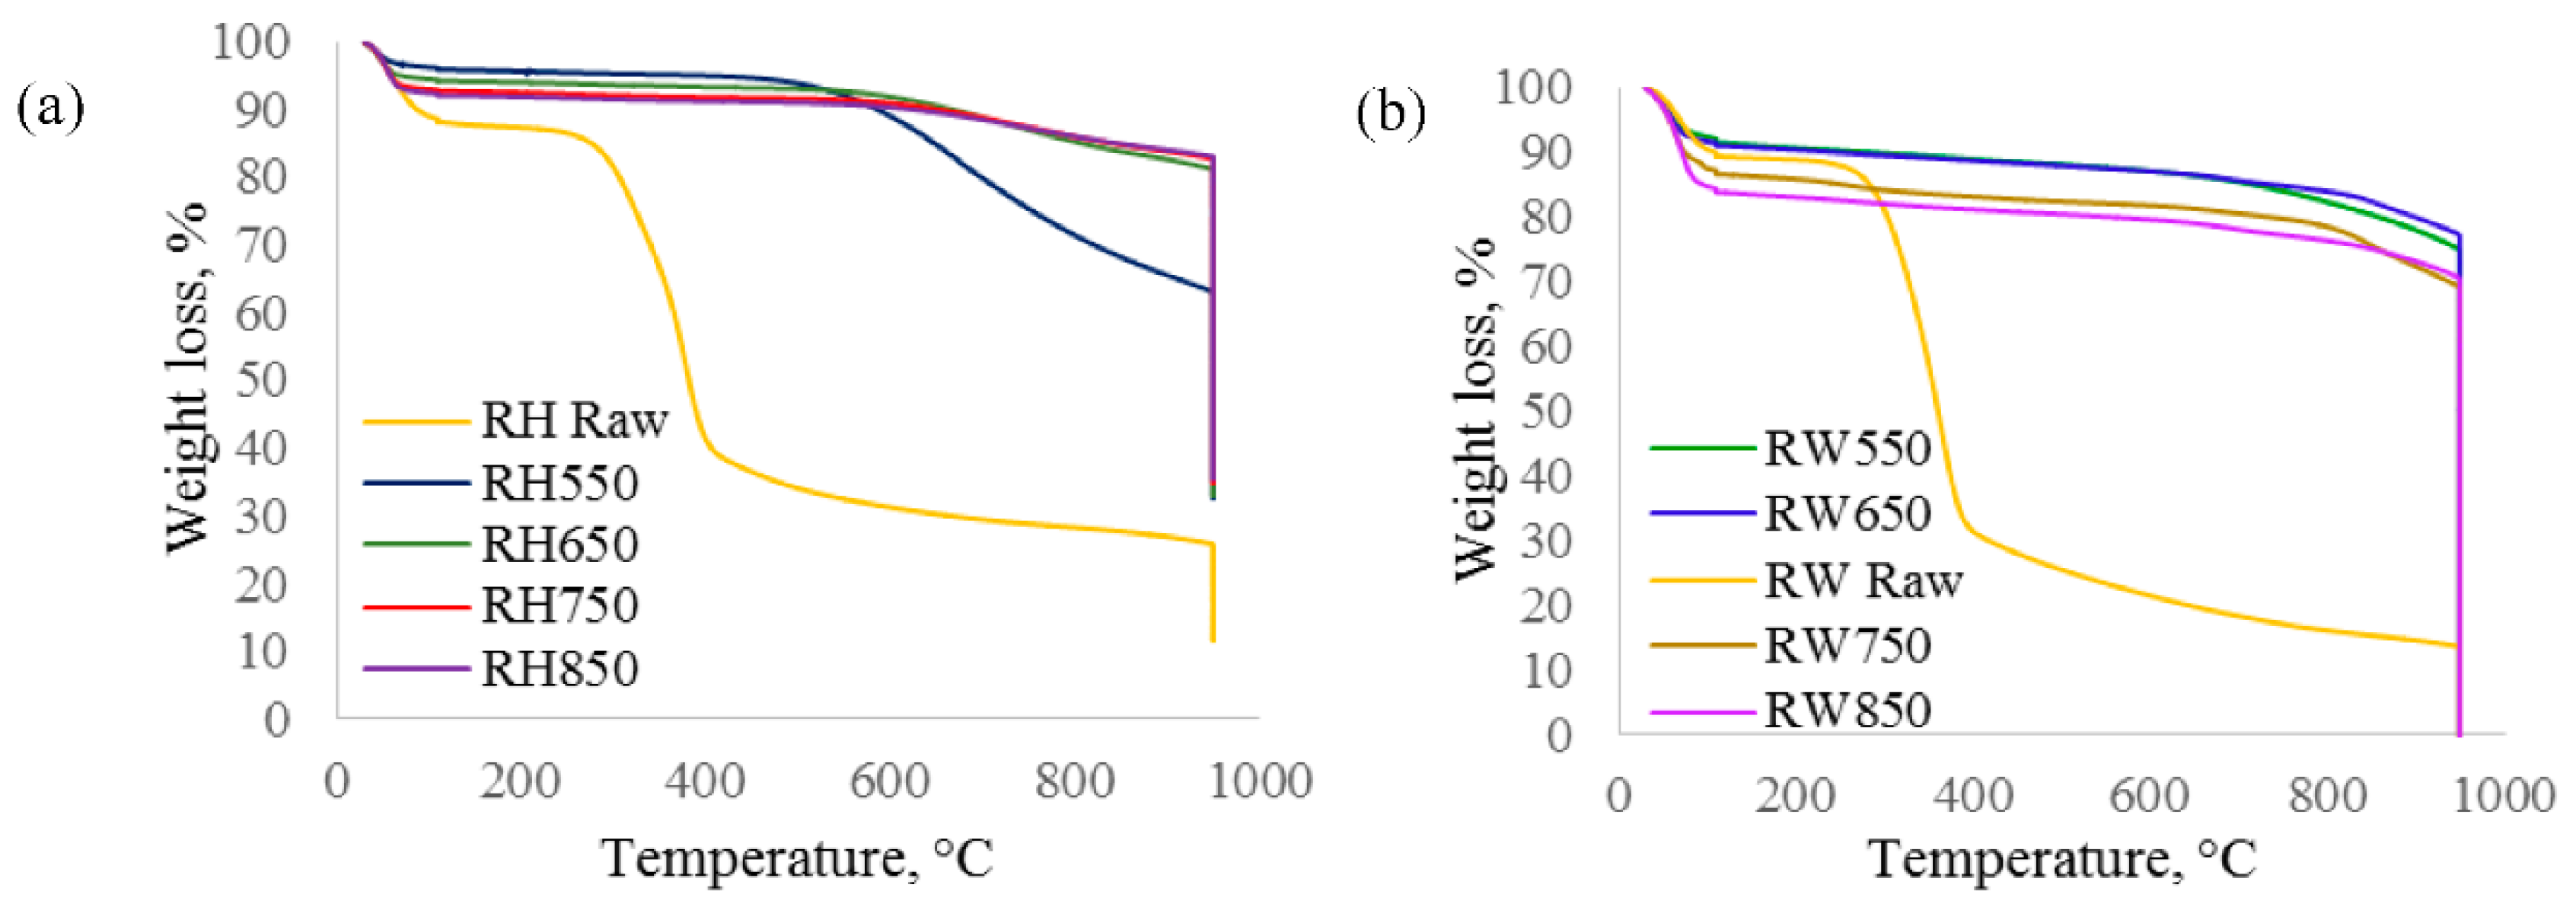
3.1. Effect of Pyrolysis Temperature on the Biochar Characteristics

3.1.1. Biochar Yield at Different Pyrolysis Temperatures

Biochar yield for both woody and non-woody biomass shows a similar decreasing trend as the pyrolysis temperature was increased. The biochar yield decreased from 28% to 21.3% for rubber wood and 33.9% to 31.4% for rice husk. A similar trend was reported for the biochar production using corn straw pellets [1]. The results in Table 1 also show that different types of biomass generate a different biochar yield.

3.1.2. Proximate Analysis for Biochar Characterization

The proximate analysis and weight loss of the biochar generated from different biomass sources are represented in Table 2 and Figure 1, respectively. The first mass loss observed at temperatures below 110 °C for all samples in Figure 1 was due to the removal of moisture. An increasing trend in the percentage of moisture was observed with the increase in pyrolysis temperature. The higher moisture content might be due to the hygroscopic characteristic of biochar pyrolysed at higher temperature, reabsorbing moisture from the surroundings [20]. The pyrolysed biochar for both rice husk and rubber wood show a significant decrease in volatile matter and increase in fixed carbon content as pyrolysis temperature increased. The production of volatile matter is due to the breakdown of carbohydrate fraction at higher temperatures [21]. Rubber wood biochar contains a higher fixed carbon content compared to rice husk in general. This might be attributed to the higher lignin and cellulose contents in raw rubber wood compared to rice husk. A maximum fixed carbon content of 67.0% was obtained from rubber wood, as compared to only 43.4% from rice husk.
Rubber wood-derived biochar has a significantly reduced ash content compared to rice husk. Fuel sources with lower ash content are reported to produce a better performance in DCFCs [16]. Generally, the ash content in rubber wood biochar reduces as the pyrolysis temperature increases. This might be attributed to the volatilization of inorganic compounds into gas or liquids at higher pyrolysis temperatures [22]. Conversely, pyrolysis temperature did not have a significant impact on the ash content in rice husk derived biochar. The high ash content may be attributed to the presence of a high silica content in the raw biomass. From Figure 1, it can be observed that the thermal stability of pyrolysed biochar increases compared to the raw biomass. The weight losses start at 550 °C for rice husk biochar, whilst significant weight losses of rubber wood start at 650 °C, showing that rubber wood possesses a higher thermal stability compared to rice husk.

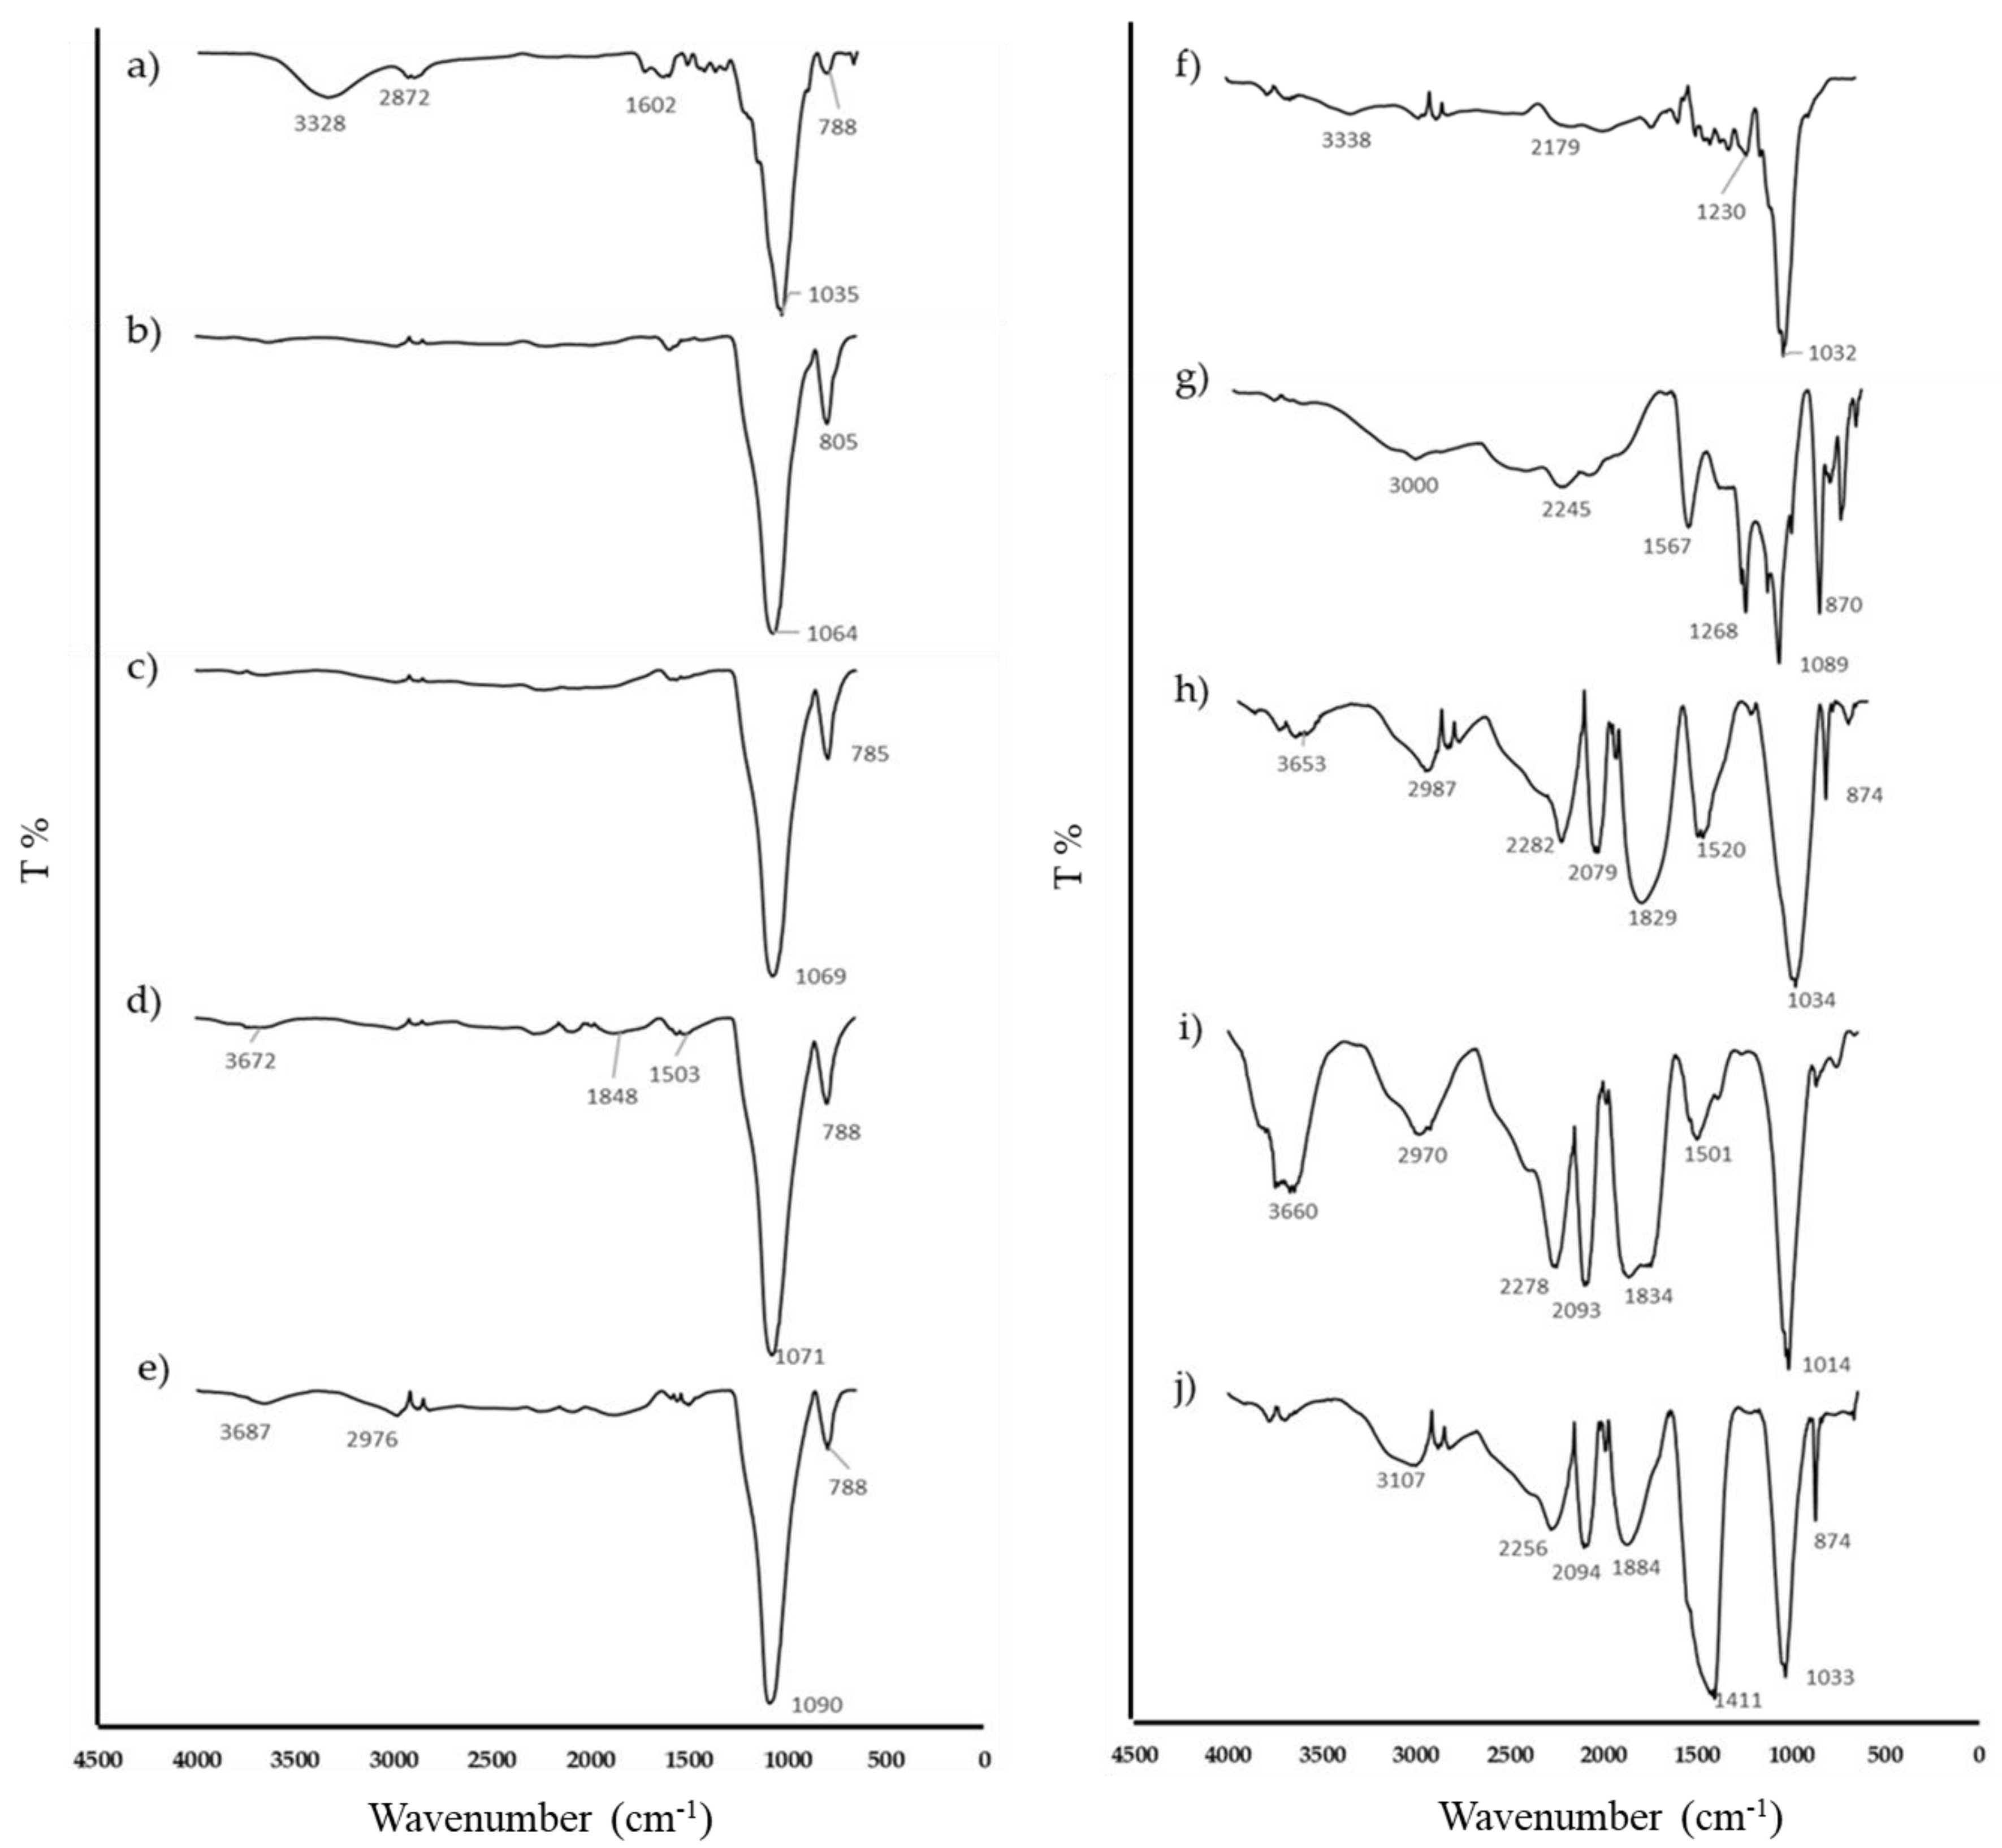
3.1.3. Surface Functional Analysis of Untreated Biochar

FTIR analysis allows the detection of the functional groups in biochar prepared at different pyrolysis temperatures. Figure 2 shows the FTIR spectra for rubber wood biochar and rice husk biochar. Prominent changes in the rubber wood biochar compared to the raw rubber wood were observed. A peak was observed at 1567 cm−1 for RW550, and this was broadened with the increase in pyrolysis temperature. This represents the aromatic C=C and C=O stretching of conjugated ketones and quinones, which suggests the presence of phenolic and carboxylic compounds in lignin increases in rubber wood biochar as pyrolysis temperature increases [22]. The peaks in the range of 1230 cm−1 to 1032 cm−1 (symmetric C=O stretching that presents in cellulose, hemicellulose, and lignin) [23] of raw rubber wood, decomposed further after an increase in pyrolysis temperature. This shows that the volatile matter starts to decompose after a pyrolysis temperature of 550 °C, and a broadened peak at approximately 1030 cm−1, which possibly shows the trait of a C–C–O asymmetric stretch, was formed [19]. The formation of peaks in the range of 3000–2900 cm−1 when rubber wood biochar was pyrolysed at a temperature higher than 650 °C shows the presence of aliphatic C–H groups.
In addition, new peaks formed at approximately 1800 cm−1 (ester group) after the biomass was pyrolysed. This can be attributed to the interaction between cellulose and lignin during the heating of the rubber wood samples [24]. The changes of the bands at the region of 1000–1400 cm−1 show the band for C–O, the oxygen-containing functional groups, whereas O–H stretching vibrations are represented at the range of 3000–3445 cm−1 [25]. These peaks increased in intensity with the increase in pyrolysis temperature. This phenomenon might be caused by the increased moisture content in biochar produced at higher pyrolysis temperatures [26]. This activity may have resulted from the cracking and reforming reactions of aromatic hydrocarbons in the biochar [27].
Rice husk biochar has significant peaks in the range of 1090 cm−1 (Si–O–Si) and 788 cm−1 (Si–H), which represent the silica functional group [28]. This has a close similarity with the proximate analysis in Section 3.1.2 of rice husk biochar, which shows a higher ash content, which might be attributed to the high silica content in all the range of pyrolysed biochar.
As shown by the FTIR results, rubber wood biochar has a higher amount of surface oxygen functional groups compared to the rice husk. In a separate study with treated coal as the fuel source, more oxygen functional groups were produced, which contributed to higher electrochemical activity of 26 mW cm−2 compared to pyrolysed untreated coal at 750 °C, which produces only 8 mW cm−2. This shows that the oxygen functional group facilitates the electrochemical kinetics [13] and provides a large number of reactive sites for the anode reaction [4].

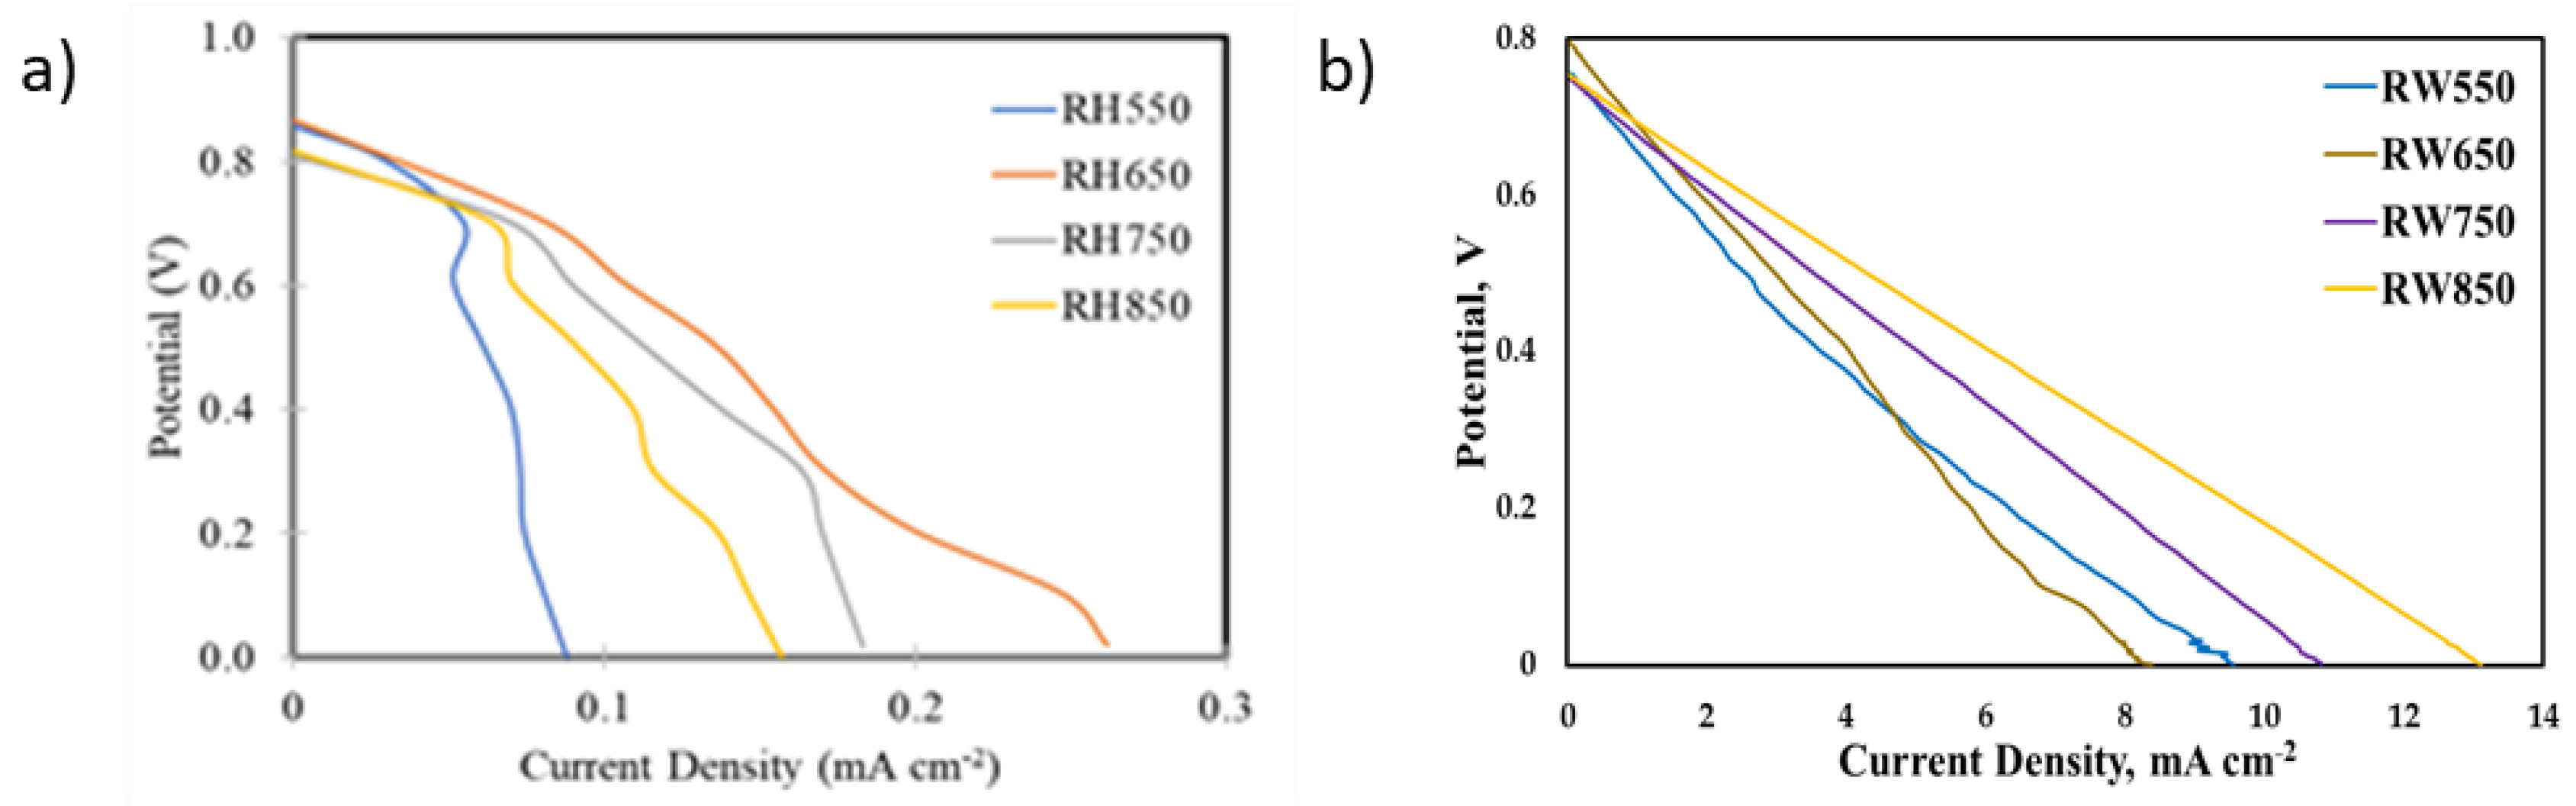
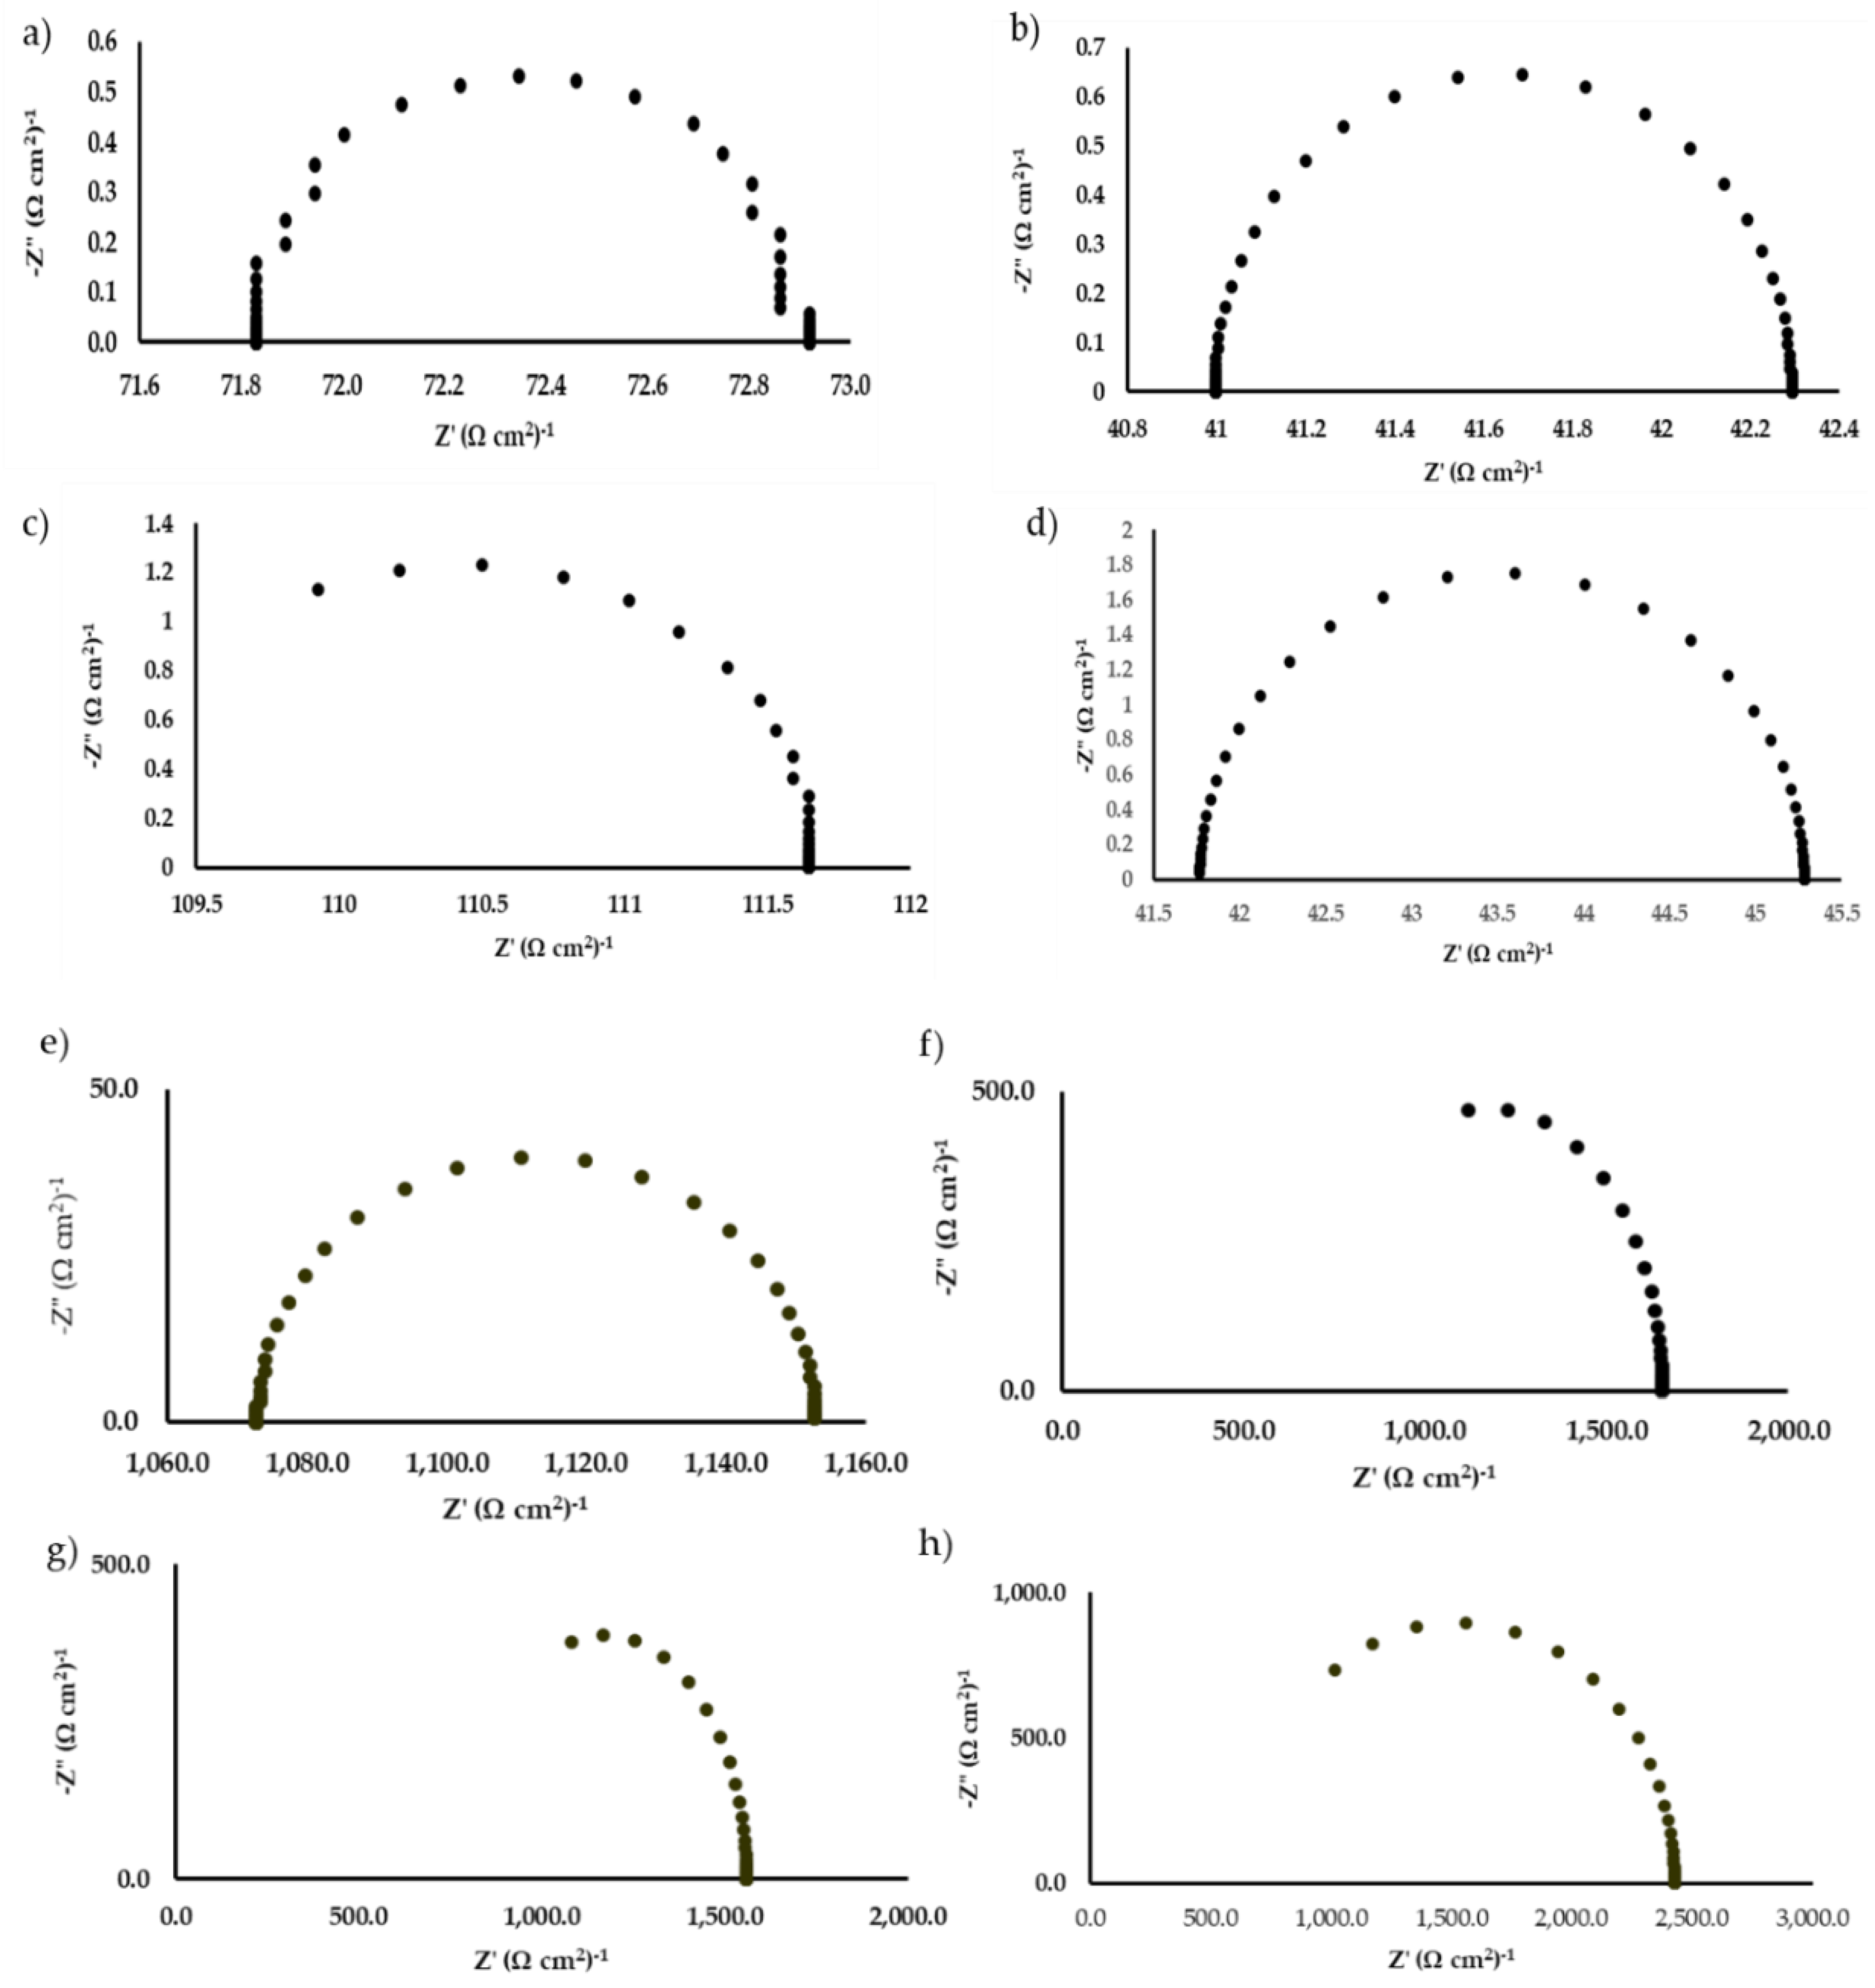
3.2. DCFC Performance Test with Biochar

DCFC performance tests were carried out by applying the solid carbonaceous fuel directly onto the button cell of the DCFC. Figure 3a,b shows the polarization curve of both rice husk and rubber wood biochar samples from various pyrolysis temperatures. From the figures, a rapid fall in the OCP for all rice husk derived biochar might be attributed to the activation resistance, as observed in other studies using activated carbon as the solid fuel [5]. However, a fast decrease with unstable potential change at a higher current density might show that the fuel consumption is faster than it is supplied to the electrode, which refers to the mass transport limitation [5]. By referring to the maximum power density, as shown Table 3, rubber wood biochar was shown to possess higher electrochemical activity (1.49–2.21 mW cm−2) than rice husk biochar (0.05–0.07 mW cm−2), disregard to the pyrolysis temperature in the biochar preparation. This indicates that woody biomass possesses a better electrochemical oxidation ability than non-woody biochar.
The relatively low power density and quick potential drop observed in rice husk biochar could be attributed to the high ash content (ca. 36–37%). It was believed that the ash, which is mainly from silica content, acted as a barrier for the carbon to be in contact with the anode surface, and thus severely blocked the active sites of the anode for oxidation [29]. This is consistent with the presence of a silica functional group in the FTIR analysis, as depicted in Figure 2. In contrast, a lower ash content in woody biochar contributes to a better electrochemical activity, with a maximum reported power density value of 2.21 mW cm−2 at RW850. In addition, the higher composition of fixed carbon in rubber wood biochar samples could also possibly contribute to their better performance, due to a better fuel utilisation per active surface area. Rubber wood pyrolysed at 850 °C shows a slightly higher reactivity with the highest power density. In general, the electrochemical reactivity for rubber wood-derived biochar increases to the order of the rising pyrolysis temperature, from 550 °C to 850 °C.
The resistance of the cell was characterized by impedance spectra, as depicted in Figure 4. A small polarization arc was observed for all the rubber wood derived biochar. This suggests that the lower the resistance is, the more it contributes to better electrochemical activity, having a higher power density (1.49–2.21 mW cm−2). Similarities were observed in another study with carbon black as the solid fuel, producing a power density output of 13.0 mW cm−2 with a lower resistance value (fuel cell operated at 900 °C) compared to the output of 3.6 mW cm−2 (fuel cell operated at 700 °C), which possessed a higher resistance value [30]. In contrast, a different trend was observed for the rice husk derived biochar, with all the samples showing a high polarization arc. Rice husk had a lower power density (0.05–0.07 mW cm−2) with impedance spectra of a larger polarization, showing the presence of a charge transfer limit which is unfavorable for DCFC operation. A high polarization arc might have resulted from the difficulties in the transportation of the oxidants at the current collector and the electrode boundary, thus limiting the electrochemical activity [15].

3.3. Effect of Pre-Treatment and Post-Ttreatment on Rubber Wood Biochar Production

From Section 3.1, rubber wood biochar pyrolysed at 850 °C recorded the best DCFC performance with the highest power density. The results show that the structural and chemical compositions of the biochar might have a significant impact on the DCFC performance. Hence, the structural and chemical composition of biochar was further altered with different chemical pre-treatment and post-treatment methods to study its effect on DCFC performance. Chemical treatments were conducted for the rubber wood biomass only as it possessed a higher electrochemical activity compared to the rice husk.

3.3.1. Biochar Yield of Pre-Treated and Post-Treated Woody Biochar

Table 4 shows the biochar yield when rubber wood was subjected to acid and alkaline pre- and post-treatment. In general, a slightly higher biochar yield was obtained from pre-treated alkali RW. In general, pre-treated samples gave a higher biochar yield compared to post-treated samples. The excessive washing imposed on biochar from the post-treatment might have caused the reduced yield.

3.3.2. Proximate Analysis of Chemically Modified Rubber Wood Biochar

Table 5 presents the proximate analysis of post-treated and pre-treated rubber wood. The post-treated acid biochar possessed a lower moisture content among the treated samples. Besides this, chemical treatment aids in ash content reduction, as reported in all the treated samples. Pre-treated acidic RW shows a better demineralization effect compared to the alkali application in the pre-treatment technique. This is supported by a study using oak sawdust, which produced a lowered ash content after acid pre-treatment. The substantial reduction of ash removal via nitric acid removed the alkaline earth metals, such as ferric oxide and calcium oxide [16].
However, not much difference was observed for the content of fixed carbon. The major differences were observed in acid pre-treated rubber wood, which provides higher fixed carbon, 76.5%, and lower volatile matter, 11.3% compared to the untreated and other treated samples. Higher fixed carbon may contribute by the further disintegration of volatile fractions into a smaller molecular weight [15]. Post-treated acid biochar leads to higher volatile matter content, and this may contribute to nitration and oxidation effects during the process nitric acid treatment [13].

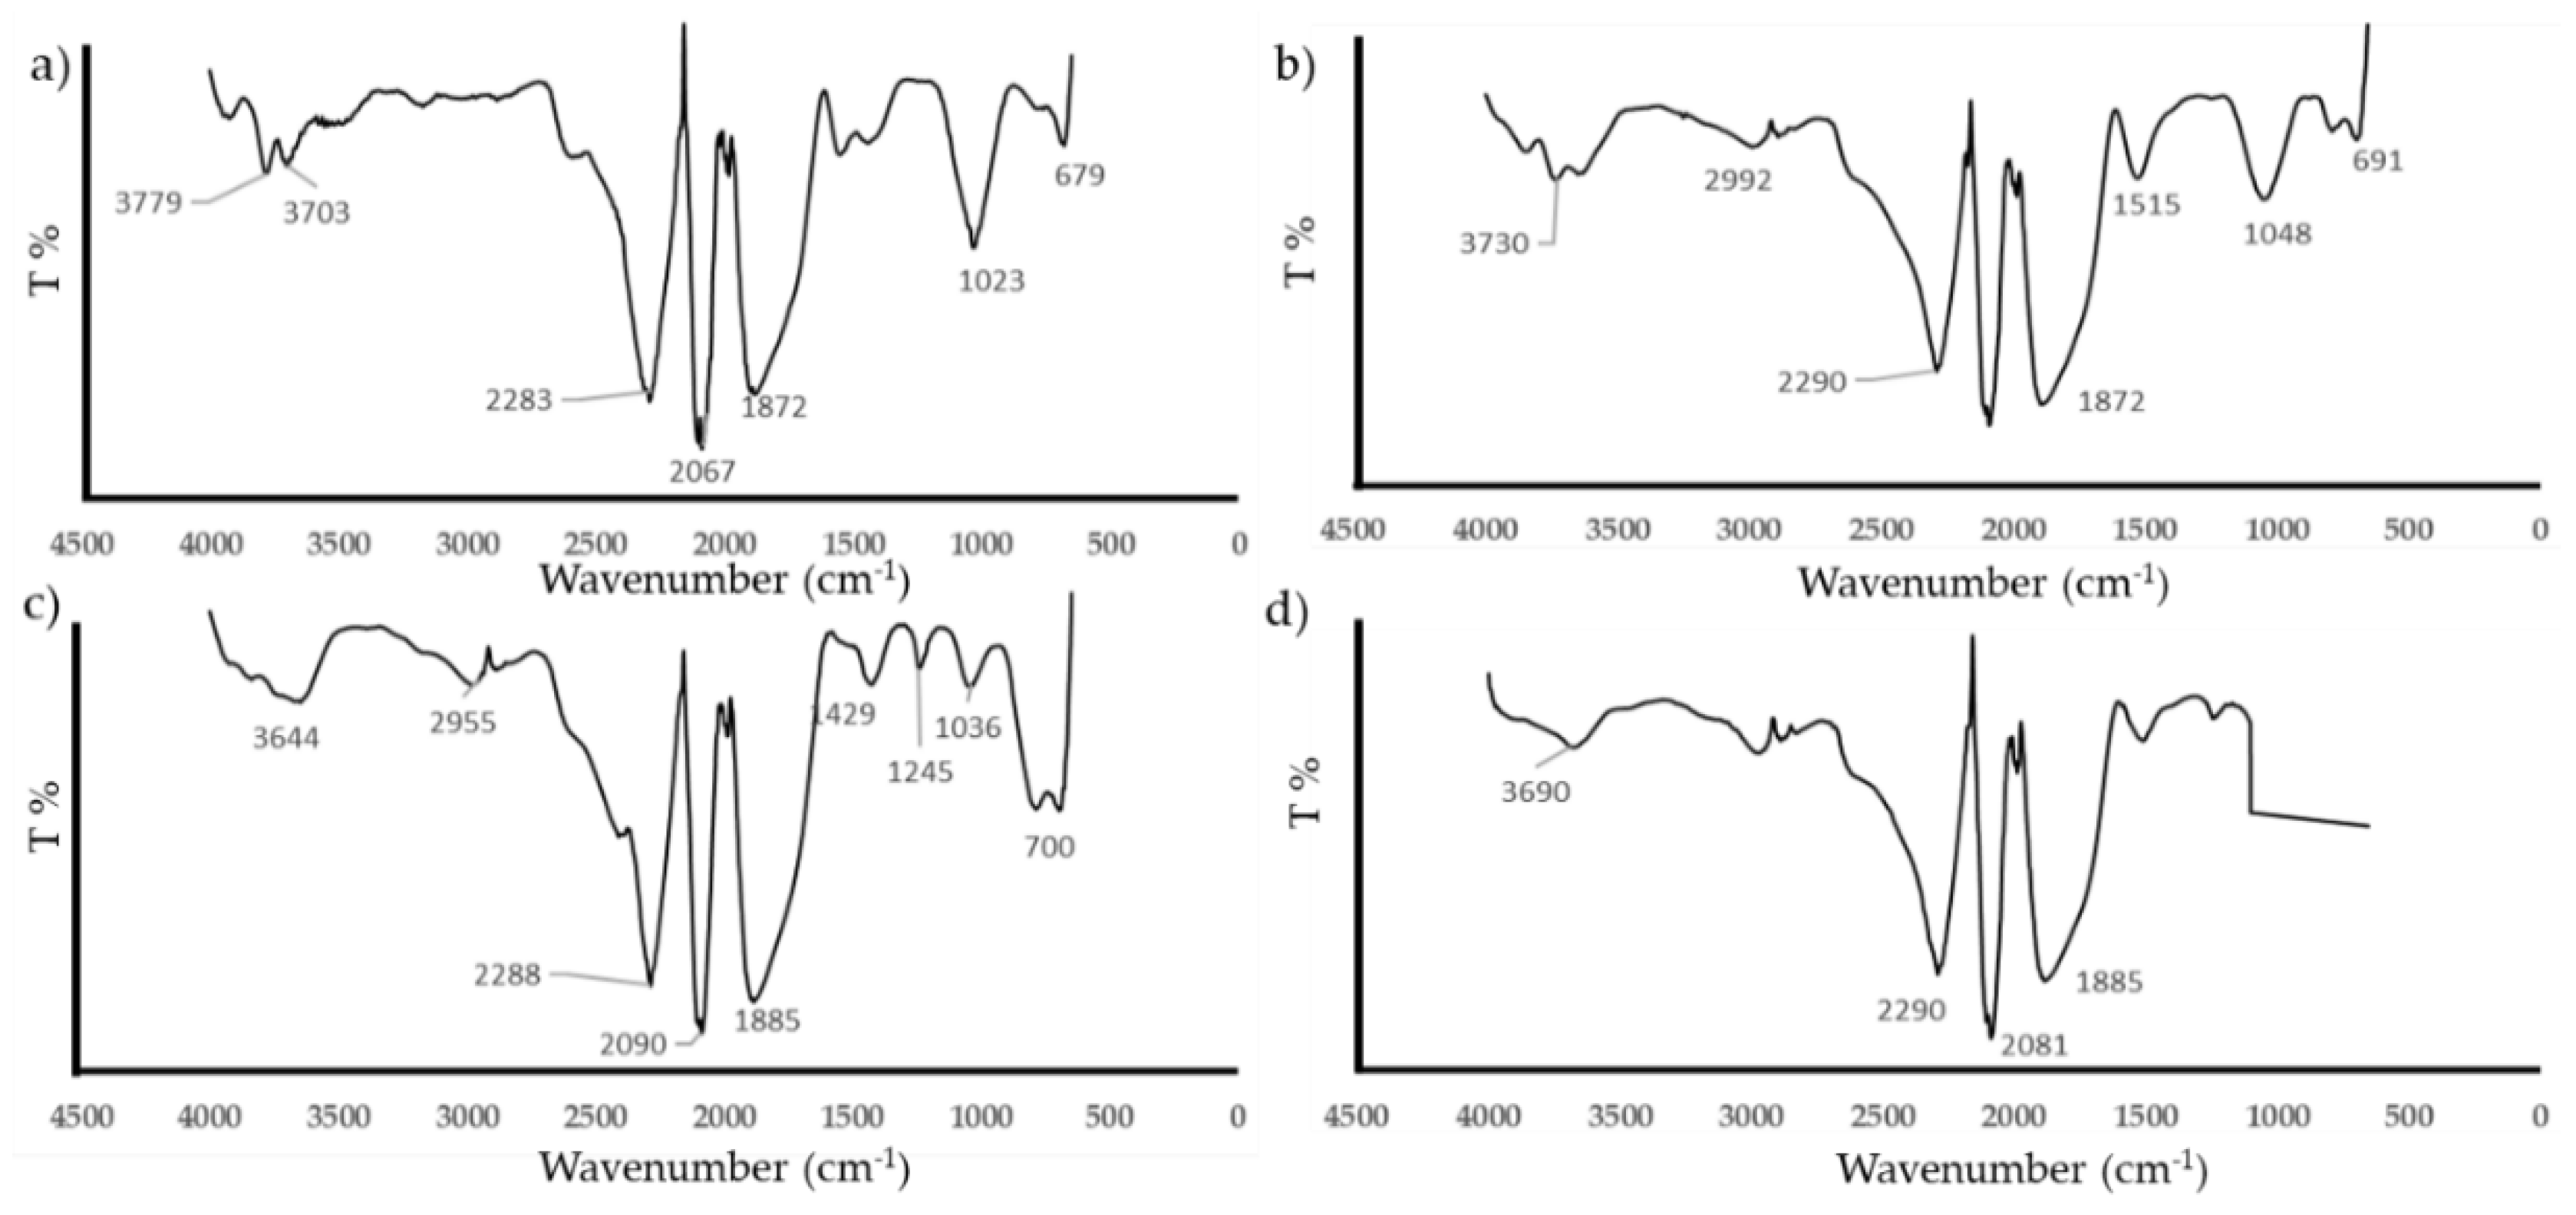
3.3.3. Surface Functional Study of Chemically Modified Rubber Wood Biochar

Figure 5 shows the spectra for chemically treated rubber wood for both pre-treatment and post-treatment techniques. It is evident that chemical treatment on biochar and biomass aids in the surface chemistry modification and disruption of structural components. The reduction of peaks at the range of 1500 cm−1, which represents aromatic C=C and C=O stretching, shows that there is lignin decomposition after the chemical treatment. The peak reduction was greatly noticed in alkali pre-treatment and post-treatment. As discussed earlier in Section 3.1.3, the peak at the range of 1230 cm−1 to 1032 cm−1, which contributes to symmetric C=O, was greatly reduced for pre-treated biochar compared to post-treated biochar. This suggests that the pre-treatment by acid and alkaline contributed to a major disruption of cellulose, hemicellulose, and lignin. Peak intensity at the range of 2300 cm−1 to 1900 cm−1 increased compared to untreated RW850. This peak may be attributed to the carboxyl and carbonyl functional group, observed for all the chemical-treated biochar samples. In addition, a new peak formation was observed at the range of 1800 cm−1, which represents C=C for alkanes and aromatics [31]. A broad peak at 700 cm−1 was observed in pre-treated alkali RW, suggesting the presence of -OH out of plane bending modes [19]. It was observed that pre-treated alkali RW possessed higher oxygen surface functional groups compared to other chemically treated rubber wood derived biochar.

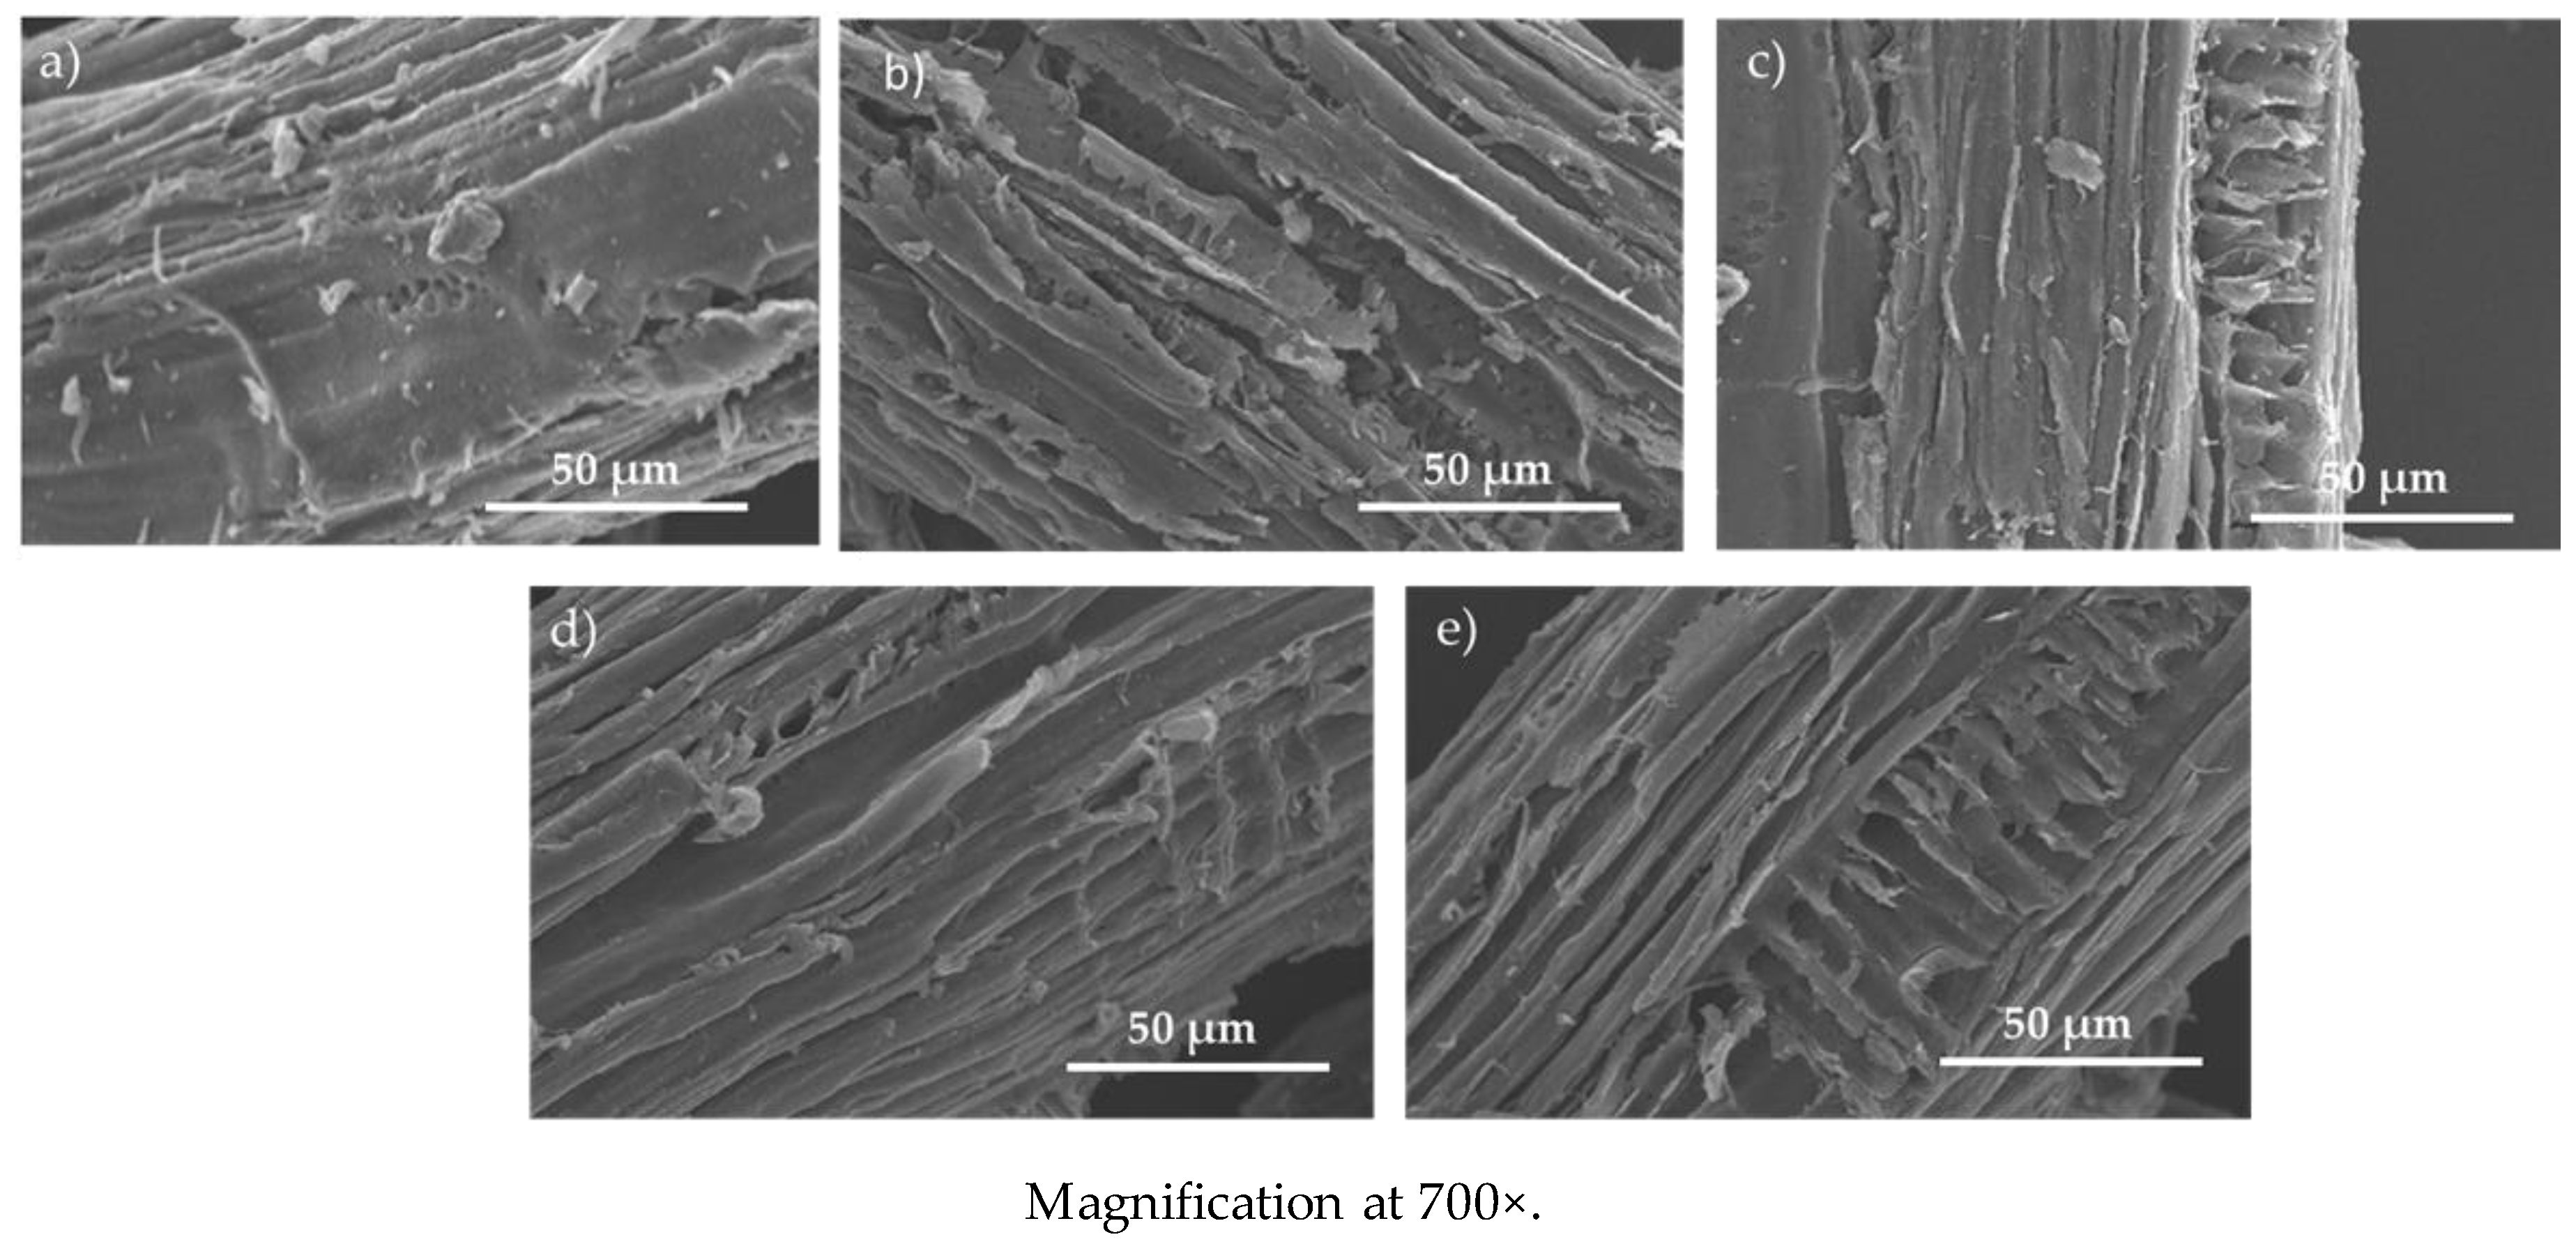
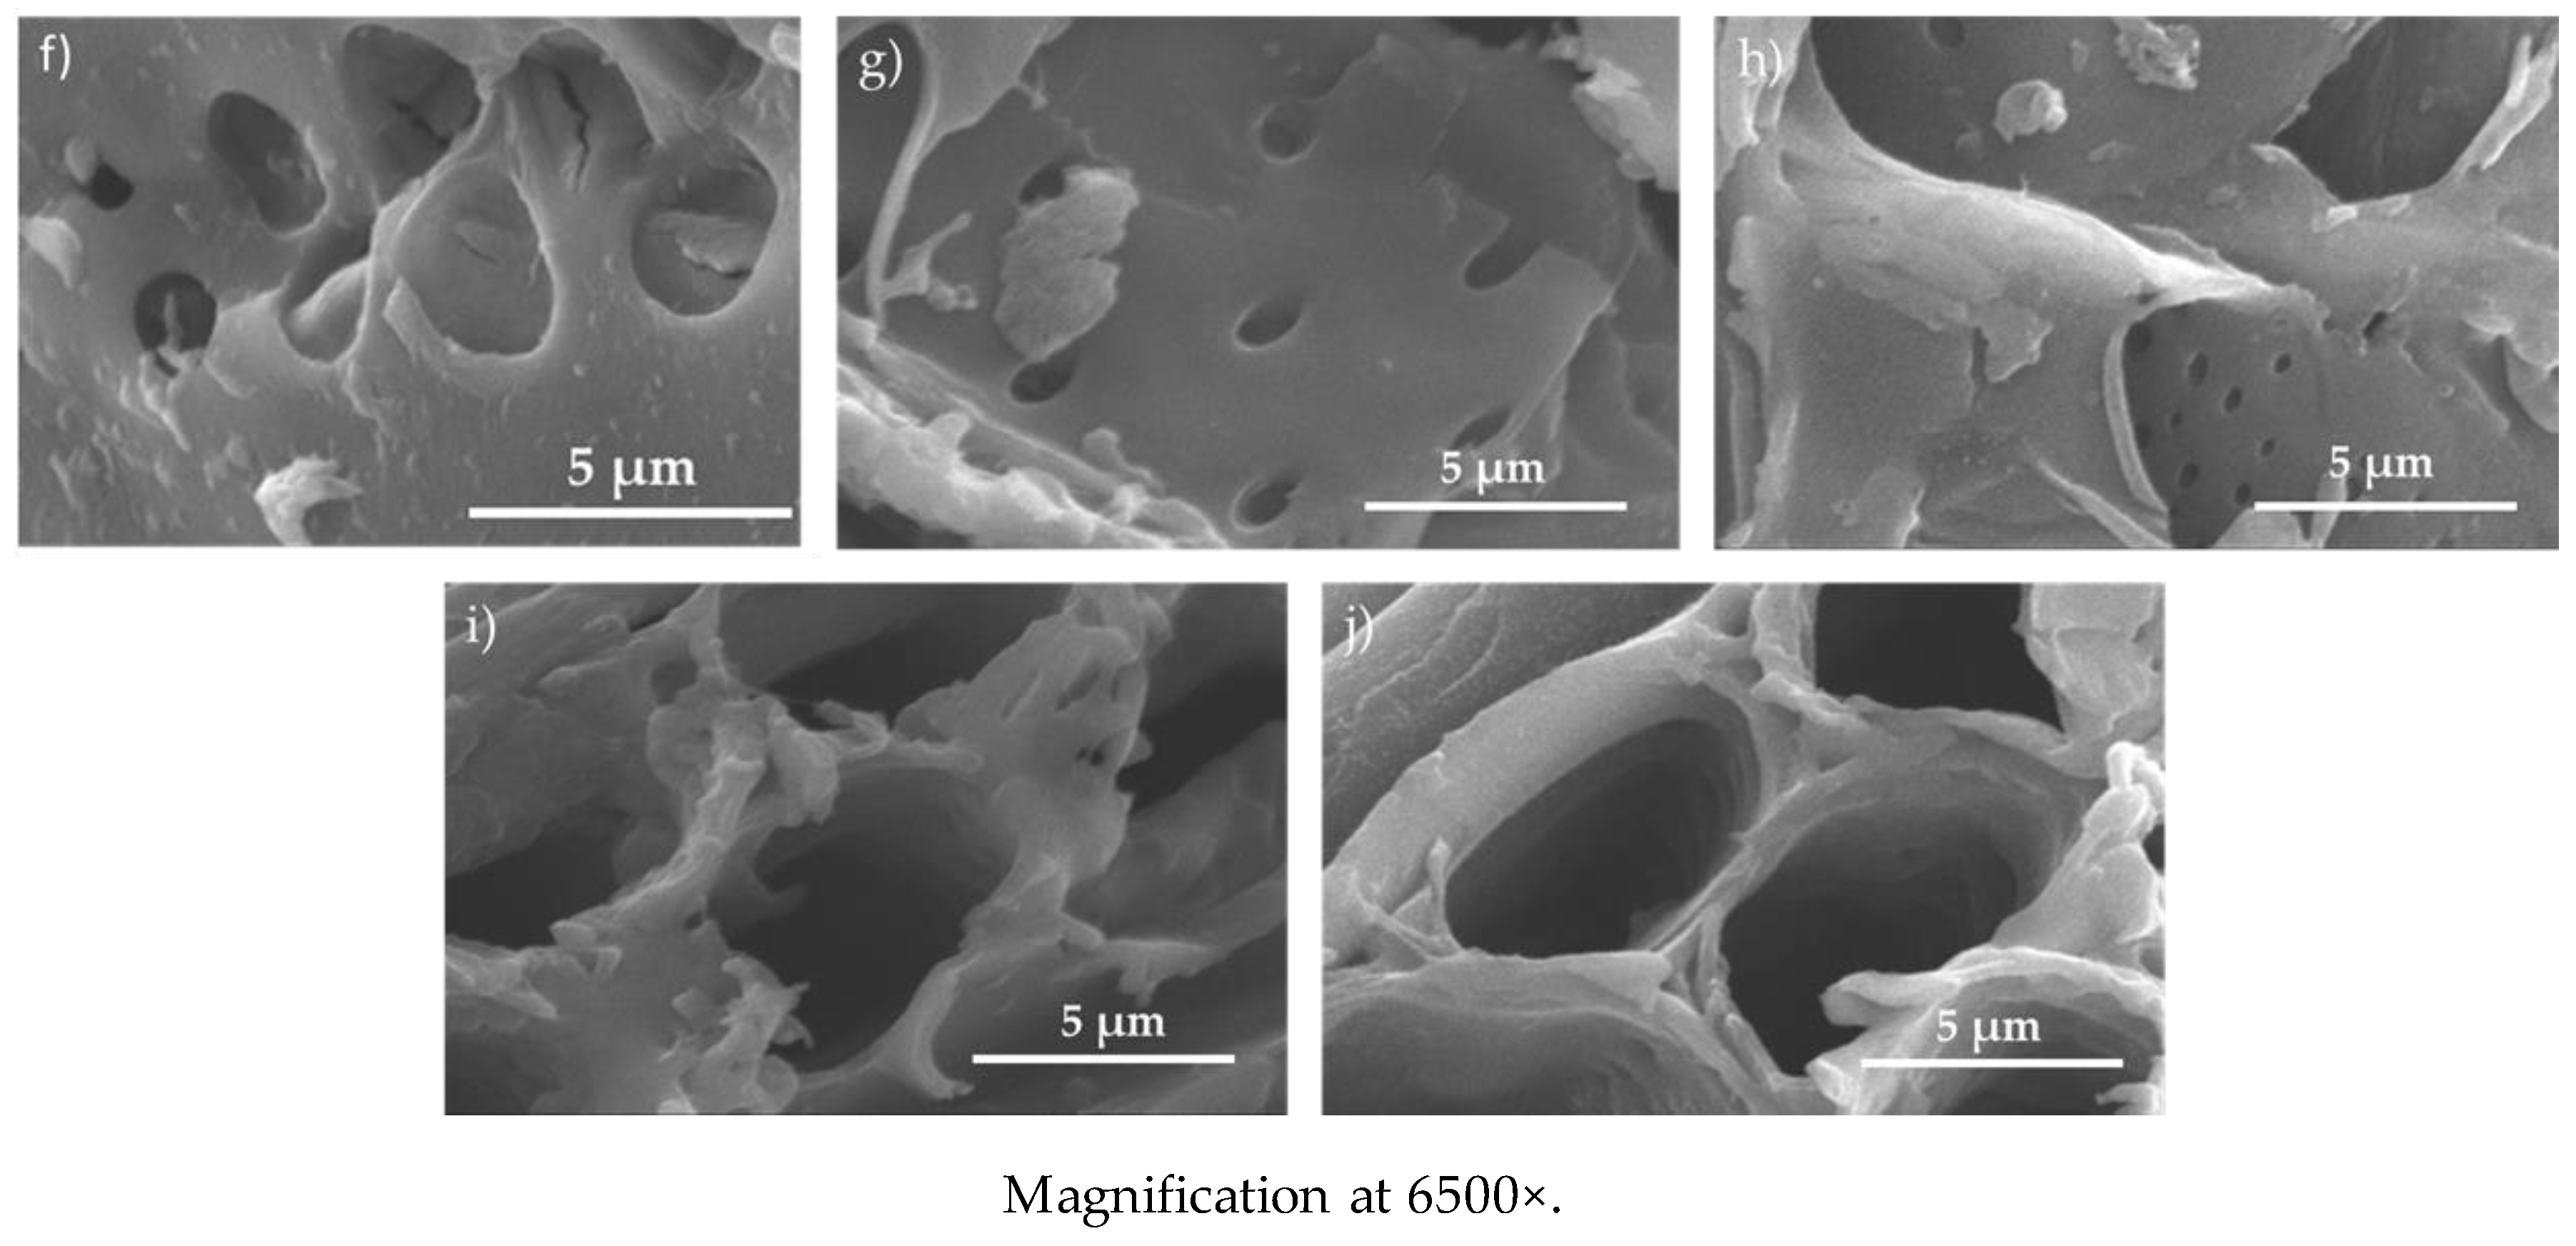
3.3.4. Surface Morphology of Untreated Biochar and Modified Woody Biochar

Figure 6 shows the SEM morphology comparison between the untreated biochar derived from rubber wood, post-treated rubber wood biochar, and pre-treated rubber wood biochar at two different magnifications. The SEM images in Figure 6 show that there are no significant structural changes observed between the chemically treated biochar samples. Despite high temperature pyrolysis and chemical treatments, biomass structures and tissue morphology still remain intact.

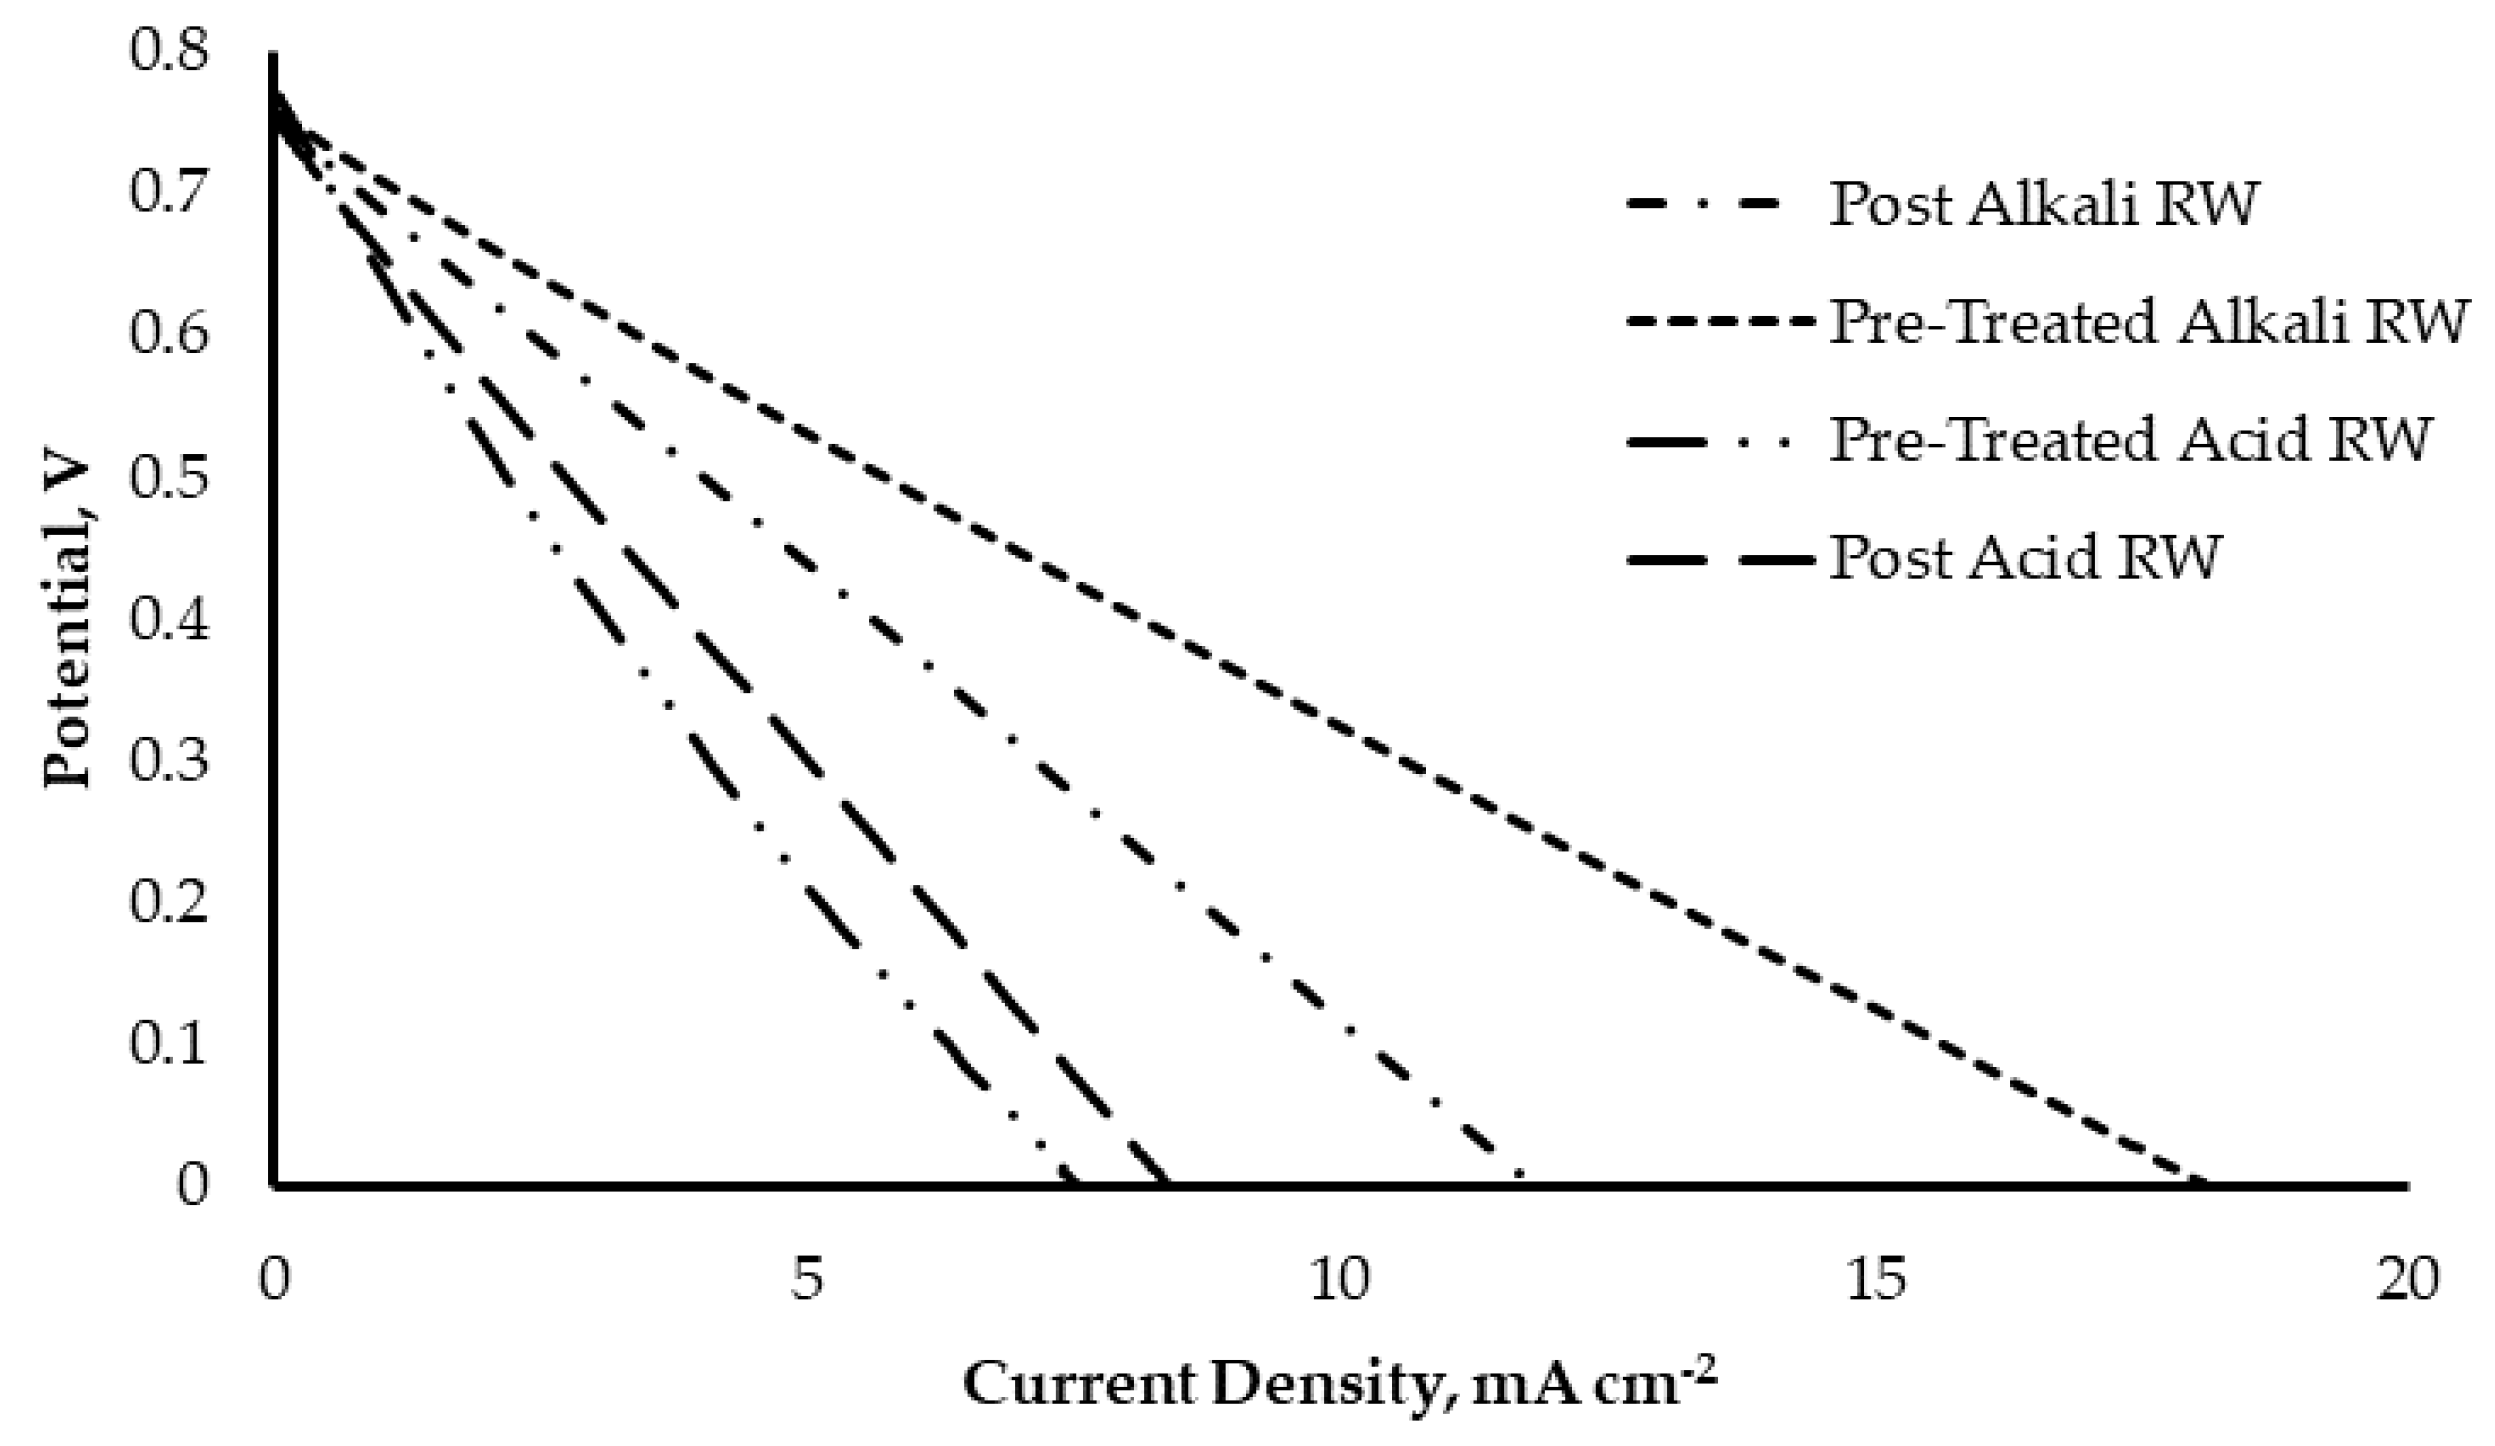
3.3.5. DCFC Performance Test with Direct Solid Fuel of Modified Woody Biochar

From the results shown in Table 6, rubber wood biochar produced from the alkali pre-treatment and alkali post-treatment have given higher OCP values of 0.77 V and 0.76 V, respectively, compared to acidic post-treatment and acidic pre-treatment. A rapid potential reduction at lower current densities was observed for all the other chemically treated biochar samples compared to the pre-treated alkali RW, as shown in Figure 7. This further explains that the biochar samples were affected by activation polarization at lower current densities [7]. This might be attribute to the application of the solid fuel biochar directly to the button cell, causing the lack of activation energy needed for the electron movement at both the cathode and anode [15].
Based on Table 6, the power density of alkali pre-treated biochar (power density of 2.94 mW cm−2) shows a better result compared to the post-treatment method. Based on the DCFC performance, alkali treatment in both conditions showed its suitability as an agent to modify the structure of rubber wood chemically, as it produced a higher power density compared to acid-treated biochar. This might be attributed to the function of alkaline in lignin removal and decomposition during treatment, which exposes more surface oxygen functional groups, that aid in better electrochemical activity. On the other hand, the power density was still higher in untreated rubber wood biochar compared to the acid-treated biochar in both post and pre-treated techniques. This suggests that the acid treatment on rubber wood did not enhance the electrochemical activity, further demonstrating that excessive degradation to the structure of biochar caused by acid treatment might not be favorable for rubber wood biochar for DCFC application. Besides, acid pre-treatment causes demineralization, which reduces the ash content [32]. However, the reduction of minerals from the acid treatment may leach out some minerals, that may act as a catalyst in enhancing DCFC performance.
Figure 8 presents the electrochemical impedance spectra for chemically-treated rubber wood biochar samples. Alkali treatment (both pre and post) shows a greatly lowered polarization compared to other chemically-treated biochar samples. Higher polarization may be attributed to the presence of the activation resistance and concentration resistance that occurs during the cell reaction mechanism [20]. This might be the reason for a higher DCFC performance by alkali pre-treated biochar.

4. Conclusions

This study explored the potential of biochar derived from woody and non-woody biomass as a fuel source for direct carbon fuel cells. The effect of pre-treatment and post-treatment on biochar was further evaluated through DCFC performance. A higher power density was generated by rubber wood biochar as compared to rice husk-derived biochar. The higher fixed carbon, lower ash content, and the presence of a surface oxygen functional group in rubber wood biochar might contribute to the better performance. The pre-treated alkali rubber wood biochar pyrolysed at 850 °C produced the highest power density, 2.94 mW cm−2. Rubber wood biochar obtained from acidic pre-treatment and post-treatment generally produced a lower power density from DCFCs. Acid solution might leach out the minerals from biochar that are potential catalysts for the oxidation reaction. Conversely, alkali pre-treatment and post-treatment would retain the minerals and increase the surface functional groups in biochar that contribute to the improved DCFC performance. Further study on optimizing the operating conditions of DCFCs can be conducted to fully understand the significant factors affecting DCFC performance.

Author Contributions

Conceptualization, W.Y.W., L.W.Y. and S.-T.Y.; Methodology, W.Y.W., L.W.Y., and L.K.P.; Formal analysis and investigation, L.K.P.; writing—original draft preparation, L.K.P.; writing—review and editing, L.W.Y. and M.M.P.; supervision, L.W.Y., W.Y.W. and M.M.P.; project administration, W.Y.W., L.W.Y.; funding acquisition, W.Y.W., L.W.Y.

Funding

The research was funded by Taylor’s University research grant scheme (TRGS/ERFS/2/2016/SOE/003) and Universiti Kebangsaan Malaysia’s research grant (GUP-2018-013).

Acknowledgments

The author would like to thank the financial support by Taylor’s University research grant scheme (TRGS/ERFS/2/2016/SOE/003) and Universiti Kebangsaan Malaysia’s research grant (GUP-2018-013). This paper is an extended and revised article presented at the International Conference on Sustainable Energy and Green Technology 2018 (SEGT 2018) on 11–14 December 2018 in Kuala Lumpur, Malaysia.

Conflicts of Interest

The authors declare no conflict of interest. The funders had no role in the design of the study; in the collection, analyses, or interpretation of data; in the writing of the manuscript, or in the decision to publish the results.

References

  1. Mahmud, L.S.; Muchtar, A.; Somalu, M.R. Challenges in fabricating planar solid oxide fuel cells: A review. Renew. Sustain. Energy Rev. 2017, 72, 105–116. [Google Scholar] [CrossRef]
  2. Shaikh, S.P.S.; Muchtar, A.; Somalu, M.R. A review on the selection of anode materials for solid-oxide fuel cells. Renew. Sustain. Energy Rev. 2015, 51, 1–8. [Google Scholar] [CrossRef]
  3. O’Hayre, R.; Cha, S.W.; Colella, W.; Prinz, B.F. Fuel Cell Fundamentals, 2nd ed.; John Wiley & Sons: Hoboken, NJ, USA, 2009; pp. 3–20. [Google Scholar]
  4. Li, X.; Zhu, Z.H.; Marco, R.D.; Dicks, A.; Bradley, J.; Liu, S.; Lu, G.Q. Factors that determine the performance of carbon fuels in the direct carbon fuel cell. Ind. Eng. Chem. Res. 2008, 47, 9670–9677. [Google Scholar] [CrossRef]
  5. Li, X.; Zhu, Z.H.; Chen, J.; Marco, R.D.; Dicks, A.; Bradley, J.; Lu, G.Q. Surface modification of carbon fuels for direct carbon fuel cells. J. Power Sources 2009, 186, 1–9. [Google Scholar] [CrossRef] [Green Version]
  6. Jafri, N.; Wong, W.Y.; Doshi, V.; Yoon, L.W.; Cheah, K.H. A review on production and characterization of biochars for application in direct carbon fuel cells. Proc. Saf. Environ. Prot. 2018, 118, 152–166. [Google Scholar] [CrossRef]
  7. Elleuch, A.; Boussetta, A.; Yu, J.; Halouani, K.; Li, Y. Experimental investigation of direct carbon fuel cell fueled by almond shell biochar: Part II. Improvement of cell stability and performance by a three-layer planar configuration. Int. J. Hydrog. Energy 2013, 38, 16605–16614. [Google Scholar] [CrossRef]
  8. Elleuch, A.; Halouani, K.; Li, Y. Investigation of chemical and electrochemical reactions mechanism in a direct carbon fuel cell using olive wood charcoal as sustainable fuel. J. Power Sources 2015, 281, 350–361. [Google Scholar] [CrossRef]
  9. Dudek, M.; Socha, R. Direct electrochemical conversion of the chemical energy of raw waste wood to electrical energy in tubular direct carbon solid oxide fuel cell. Int. J. Electrochem. Sci. 2014, 9, 7414–7430. [Google Scholar]
  10. Tripathi, M.; Sahu, J.N.; Ganesan, P. Effect of process parameters on production of biochar from biomass waste through pyrolysis: A review. Renew. Sustain. Energy Rev. 2016, 55, 467–481. [Google Scholar] [CrossRef]
  11. Ghani, W.A.W.A.K.; Mohd, A.; Silva, G.D.; Bachmann, R.T.; Taufiq, Y.; Yun, H.; Raashid, U.; Al-Muhtaseb, A. Biochar production from waste rubber-wood-sawdust and its potential use in C sequestration: Chemical and physical characterization. Ind. Crops Prod. 2013, 44, 18–24. [Google Scholar] [CrossRef]
  12. Srinivasaakannan, C.; Bakar, M.Z.A. Production of activated carbon from rubber wood sawdust. Biomass Bioenergy 2004, 27, 89–96. [Google Scholar] [CrossRef]
  13. Li, X.; Zhu, Z.; Marco, R.D.; Bradley, J.; Dicks, A. Modification of coal as a fuel for the direct carbon fuel cell. J. Phys. Chem. A 2010, 114, 3855–3862. [Google Scholar] [CrossRef] [PubMed]
  14. Palniandy, L.K.; Wong, W.Y.; Yap, J.J.; Doshi, V.; Daud, W.R.W. Effect of alkaline pre-treatment on rice husk-derived biochar for direct carbon fuel cell. J. Eng. Sci. Technol. 2017, 84–100. [Google Scholar]
  15. Chien, A.C.; Arenillas, A.; Jiang, C.; Irvine, J.T.S. Performance of direct carbon fuel cells operated on coal and effect of operation mode. J. Electrochem. Soc. 2014, 161, F588–F593. [Google Scholar] [CrossRef]
  16. Zhang, J.; Zhong, Z.; Zhao, J.; Yang, M.; Li, W.; Zhang, H. Study on the preparation of activated carbon for direct carbon fuel cell with oak sawdust. Can. J. Chem. Eng. 2012, 90, 762–768. [Google Scholar] [CrossRef]
  17. Cao, D.; Wang, G.; Wang, C.; Wang, J.; Lu, T. Enhancement of electrooxidation activity of activated carbon for direct carbon fuel cell. Int. J. Hydrog. Energy 2010, 35, 1778–1782. [Google Scholar] [CrossRef]
  18. Lim, S.H.; Yong, S.T.; Ooi, C.W.; Doshi, V.; Daud, W.R.W. Pyrolysis of palm waste for the application of direct carbon fuel cell. Energy Proc. 2014, 61, 878–881. [Google Scholar] [CrossRef]
  19. Ghani, W.A.W.A.K. Sawdust-derived biochar: Characterization and CO2 adsorption/desorption study. J. Appl. Sci. 2014, 14, 1450–1454. [Google Scholar] [CrossRef]
  20. Adam, C.R.; Giddey, S.; Kulkarni, A.; Badwal, S.P.S.; Bhattacharya, S.; Ladewig, B. Direct carbon fuel cell operation on brown coal. Appl. Energy 2014, 120, 56–64. [Google Scholar]
  21. Park, J.; Hung, I.; Gan, Z.; Rojas, O.J.; Lim, K.H.; Park, S. Activated carbon from biochar: Influence of its physicochemical properties on the sorption characteristics of phenanthrene. Bioresour. Technol. 2013, 149, 383–389. [Google Scholar] [CrossRef]
  22. Zhao, S.X.; Ta, N.; Wang, X. Effect of temperature on structural and physicochemical properties of biochar with apple tree branches as feedstock material. Energies 2017, 10, 1293. [Google Scholar] [CrossRef]
  23. Ahmad, M.; Lee, S.S.; Dou, X.; Mohan, D.; Sung, J.; Yang, J.E.; Ok, Y.S. Effects of pyrolysis temperature on soybean stover- and peanut shell-derived biochar properties and TCE adsorption in water. Bioresour. Technol. 2012, 118, 536–544. [Google Scholar] [CrossRef] [PubMed]
  24. Worasuwannarak, N.; Sonobe, T.; Taanthapanichakoon, W. Pyrolysis behaviors of rice straw, rice husk, and corncob by TG-MS technique. J. Anal. Appl. Pyrolysis 2007, 78, 265–271. [Google Scholar] [CrossRef]
  25. Leng, L.; Yuan, X.; Zheng, G.; Shao, J.; Chen, X.; Wu, Z.; Wang, H.; Peng, X. Surface characterization of rice husk bio-char produced by liquefaction and application for cationic dye (Malachite green) adsorption. Fuel 2015, 155, 77–85. [Google Scholar] [CrossRef]
  26. Claoston, N.; Samsuri, A.W.; Ahmad Husni, M.H.; Mohd Amran, M.S. Effects of pyrolysis temperature on the physicochemical properties of empty fruit bunch and rice husk biochars. Waste Manag. Res. 2014, 32, 331–339. [Google Scholar] [CrossRef] [PubMed]
  27. Xiong, S.; Zhuo, J.; Zhang, B.; Yao, Q. Effect of moisture content on the characterization of products from the pyrolysis of sewage sludge. J. Anal. Appl. Pyrolysis 2013, 104, 632–639. [Google Scholar] [CrossRef]
  28. Wei, L.; Huang, Y.; Li, Y.; Huang, L.; Mar, N.N.; Huang, Q.; Liu, Z. Biochar characteristics produced from rice husks and their sorption properties for the acetanilide herbicide metolachlor. Environ. Sci. Pollut. Res. 2017, 24, 4552–4561. [Google Scholar] [CrossRef]
  29. Ahn, S.Y.; Seong, Y.E.; Young, H.R.; Yon, M.S.; Cheor, E.M.; Gyung, M.C.; Duck, J.K. Utilization of wood biomass char in a direct carbon fuel cell (DCFC) system. App. Energy 2013, 105, 207–216. [Google Scholar] [CrossRef]
  30. Nabae, Y.; Pointon, K.D.; Irvine, J.T.S. Electrochemical oxidation of solid carbon in hybrid DCFC with solid oxide and molten carbonate binary electrolyte. Energy Environ. Sci. 2008, 1, 148–155. [Google Scholar] [CrossRef]
  31. Angin, D. Effect of pyrolysis temperature and heating rate on biochar obtained from pyrolysis of safflower seed press cake. Bioresour. Technol. 2013, 128, 593–597. [Google Scholar] [CrossRef]
  32. Dudek, M. On the utilization of coal samples in direct carbon solid oxide fuel cell technology. Solid State Ion. 2015, 271, 121–127. [Google Scholar] [CrossRef]
Figure 1. Thermogravimetric analysis curves for (a) rice husk derived biochar, (b) rubber wood derived biochar.
Energies 12 02477 g001
Figure 2. FTIR spectra for rice husk derived biochar (a) RH Raw, (b) RH550, (c) RH650, (d) RH750, (e) RH850; rubber wood derived biochar (f) RW Raw, (g) RW550, (h) RW650, (i) RW750, (j) RW850.
Energies 12 02477 g002
Figure 3. Polarization curves of (a) rice husk derived biochar, (b) rubber wood derived biochar from DCFC at 850 °C.
Energies 12 02477 g003
Figure 4. Electrochemical impedance spectra of DCFC at 850 °C for untreated rubber wood and rice husk biochar: (a) RW550, (b) RW650, (c) RW750, (d) RW850, (e) RH550, (f) RH650, (g) RH750, (h) RH850.
Energies 12 02477 g004
Figure 5. FTIR spectra for chemically treated rubber wood derived biochar: (a) post alkali RW, (b) post acid RW, (c) pre-treated alkali RW, (d) pre-treated acid RW.
Energies 12 02477 g005
Figure 6. Scanning Electron Microscope (SEM) images of untreated and chemical treated RW biochar pyrolysed at 850 °C. (a) untreated RW850; (b) post acid RW; (c) post alkali RW; (d) pre-treated acid RW; (e) pre-treated alkali RW; (f) untreated RW850; (g) post acid RW; (h) post alkali RW; (i) pre-treated acid RW; (j) pre-treated alkali RW.
Energies 12 02477 g006aEnergies 12 02477 g006b
Figure 7. Polarization curve of chemical treated rubber wood derived biochar at pyrolysis temperature of 850 °C.
Energies 12 02477 g007
Figure 8. Electrochemical impedance spectra of DCFC for chemically treated rubber wood biochar: (a) pre-treated alkali RW; (b) pre-treated acid RW; (c) post alkali RW; (d) post acid RW.
Energies 12 02477 g008
Table 1. Biochar yield from woody and non-woody biomass pyrolysed under different temperature.
Pyrolysis ConditionRice Husk (%)Rubber Wood (%)
550 °C33.9 ± 0.2628.0 ± 0.35
650 °C33.6 ± 0.0525.4 ± 0.10
750 °C33.1 ± 0.0524.6 ± 0.34
850 °C31.4 ± 0.0121.3 ± 1.40
Table 2. Proximate analysis of raw biomass and biochar.
Type of BiocharMoisture (%)Volatile Matter (%)Fixed Carbon (%)Ash (%)
Raw RH11.558.510.319.7
RH5503.540.919.536.1
RH6505.218.241.635.1
RH7506.712.942.737.7
RH8507.311.943.437.4
Raw RW10.459.911.118.6
RW5507.523.862.06.7
RW6508.122.467.02.5
RW75010.824.062.72.4
RW85014.221.862.02.0
Table 3. Electrochemical data for untreated rubber wood and rice husk derived biochar from DCFC at 850 °C.
ParameterRW550RW650RW750RW850RH550RH650RH750RH850
OCP (V)0.77 ± 0.030.78 ± 0.020.75 ± 0.010.76 ± 0.010.86 ± 0.010.86 ± 0.010.80 ± 0.020.82 ± 0.01
i at 0.7 V
(mA cm −2)
0.69 ± 0.190.79 ± 0.170.54 ± 0.160.75 ± 0.130.04 ± 0.010.09 ± 0.010.07 ± 0.010.07 ± 0.01
i at 0.4 V
(mA cm −2)
3.64 ± 0.013.95 ± 0.134.19 ± 1.165.44 ± 0.860.09 ± 0.02 0.19 ± 0.040.17 ± 0.040.13 ± 0.03
i at 0.1 V
(mA cm −2)
7.60 ± 0.417.31 ± 0.758.57 ± 1.0910.65 ± 1.030.11 ± 0.040.26 ± 0.010.21 ± 0.040.18 ± 0.05
Pmax
(mW cm −2)
1.49 ± 0.031.59 ± 0.051.74 ± 0.422.21 ± 0.330.05 ± 0.010.08 ± 0.010.07 ± 0.010.06 ± 0.01
Table 4. Biochar yield for chemically treated rubber wood biochar, pyrolysed at 850 °C.
Pyrolysis ConditionBiochar Yield, %
Post acid RW22.0 ± 0.85
Post alkali RW24.9 ± 0.49
Pre-treated acid RW25.5 ± 4.44
Pre-treated alkali RW31.8 ± 0.32
Table 5. Proximate analysis of chemical treated carbon fuel.
Type of BiocharMoisture (%)Volatile Matter (%)Fixed Carbon (%)Ash (%)
Post acid RW9.432.956.21.5
Post alkali RW16.431.363.4-
Pre-treated acid RW10.411.376.50.8
Pre-treated alkali RW11.925.355.12.3
Table 6. Electrochemical data for chemical treatment of rubber wood derived biochar at pyrolysis temperature of 850 °C.
ParameterPost Acid RWPost Alkali RWPre-Treated Acid RWPre-Treated Alkali RW
OCP (V)0.74 ± 0.000.76 ± 0.000.74 ± 0.030.77 ± 0.02
i at 0.7 V (mA cm−2)0.51 ± 0.040.79 ± 0.060.41 ± 0.201.15 ± 0.01
i at 0.4 V (mA cm−2)3.54 ± 0.435.27 ± 0.503.36 ± 0.367.23 ± 1.18
i at 0.1 V mA cm−2)6.81 ± 0.659.75 ± 0.736.66 ± 0.4814.36 ± 1.75
Pmax (mW cm−2)1.44 ± 0.182.13 ± 0.191.36 ± 0.152.94 ± 0.47

