Article

The Use of CFD for the Design and Development of Innovative Configurations in Regenerative Glass Production Furnaces

Department of Mechanical Engineering, DIME, Università di Genova, 16145 Genova, Italy
*
Author to whom correspondence should be addressed.
Energies 2019, 12(13), 2455; https://doi.org/10.3390/en12132455
Submission received: 16 April 2019 / Revised: 13 June 2019 / Accepted: 14 June 2019 / Published: 26 June 2019
(This article belongs to the Special Issue Computational Fluid Dynamics (CFD) 2018)

Abstract

:
The limitation of nitrogen oxides emissions is nowadays a challenge in several engineering fields. Recent European regulations have reduced the maximum NOx emissions and therefore forced the glass production sector to develop emission reduction strategies. Two different systems have been developed within the framework of the European LIFE project and are currently applied to glass regenerative furnaces: the Waste Gas Recirculation (WGR) and the Hybrid Air Staging (HyAS). The above systems are primary NOx reduction strategies because they both operate to control the combustion evolution. Both WGR and HyAS systems have been conceived with the extensive use of Computational Fluid Dynamics (CFD) models: design strategies for both systems have been developed based on the use of CFD and are currently under use by glass furnace designers. In the present work, the CFD procedures routinely used for the design of the above systems are described. The systems effectiveness, due to the harsh conditions in the industrial installation, can be tested with oxygen concentration measurements inside the regenerators. The oxygen concentration is correlated to the flame evolution and therefore to the nitrogen oxides formation. For the above reason, the models have been validated with experimental data from pilot furnaces using measured values of O2 mole fraction. The CFD procedures are described in the paper together with their application to different configurations.

1. Introduction

The glass industry has grown in recent years, as glass is an increasingly used material due to its recyclability. However, due to the high temperature inside the furnace (commonly obtained with combustion of natural gas) the energy consumption is very high and the environmental impact from greenhouse gases and pollutants is significant. The efforts of nitrogen oxides reduction in energy systems are very high in various engineering fields from internal combustion engines to power plants to industrial plants. Zeldovich [1] firstly postulated the formation mechanism of thermal NOx, which refers to high temperature reactions. However high temperatures are not sufficient to trigger NO formation: a crucial role is played by the residence time of the reactive species at high temperature and by the local air fuel ratio (i.e., the O2 concentration).
In order to decrease NOx emissions, several technologies and techniques have been developed [2]. They can be divided into primary and secondary reduction methods. The primary methods act on the combustion setup to limit nitrogen oxides formation. The most common techniques employed for the primary reduction are: exhaust gas recirculation systems (EGR) and staged combustion. Secondary methods tend to decrease the concentration of the pollutant gas in the exhausts after the combustion process is complete. The most widely used technologies consider urea injection into exhaust gases. Recently, new European limits for emissions [3] have forced many industrial sectors, including glass production, to adopt NOx limitation measures. Within the Life PRIMEGLASS project [4,5] two different primary methods for NOx reductions have been studied and developed: Waste Gas Recirculation system (WGR) and Hybrid Air Staging (HyAS).
Both are applied to regenerative glass production plants. They consist of a Heat Recovery System (HRS) based on regenerative chambers. Both WGR and HyAS systems have been conceived and developed with the extensive use of Computational Fluid Dynamics (CFD) models; design strategies for both systems have been developed based on the use of CFD and are currently under use by glass furnace designers. Several authors in different fields [6,7,8] have tackled the problem of modeling the HRS. The first application of CFD to the study of regenerative chambers in glass production plants was reported by Reboussin et al. [9]; they proposed an open model, validated with experimental data, and introduced an original method to take into account the effect of temperature vertical gradients by using a fictitious expansion coefficient. The research team from the University of Genoa, partner of the PRIMEGLASS project, has gained relevant experience in the simulation of regenerative glass production plants. Basso et al. [10] set up a CFD approach for the regenerative chamber where the solid phase is modeled by porous medium. They simulated the flow field and the thermal behavior both for the air and the hot gases that alternatively feed the regenerator. From the analysis of the results, they confirmed the reliability of the model in predicting thermodynamic quantities and its effectiveness in new geometry design phase. A further development of the model [11] considered the introduction of the non-equilibrium thermal model. It allowed simulating the regenerator without the need of temperature experimental data through the modelling of heat transfer coefficient distributions in the cold and hot phases. A model of gas emissivity has been developed [12] and introduced into the CFD procedure to take into account the significant radiative heat transfer from the exhaust gases (that contain CO2 and H2O molecules). In the present paper, the CFD procedures for the development of WGR and HyAS are discussed. The former is applied and tested with three configurations and validated with experimental data of O2 fraction measured in few accessible sections in the system. The procedure is based on the detection of O2 concentrations because NOx cannot be measured in those sections; the measurements of oxygen can give an indirect evaluation of the zones with the highest probability of pollutants formation. The overall effectiveness of the systems has been demonstrated in the pilot furnaces with the direct measure of nitrogen oxides at the stack [5]. The second procedure is applied to the identification of the proper injector flow rates for the HyAS system. The scope is to demonstrate the use of the CFD simulation technology to optimize the WGR system and to support the design from its systematic use.

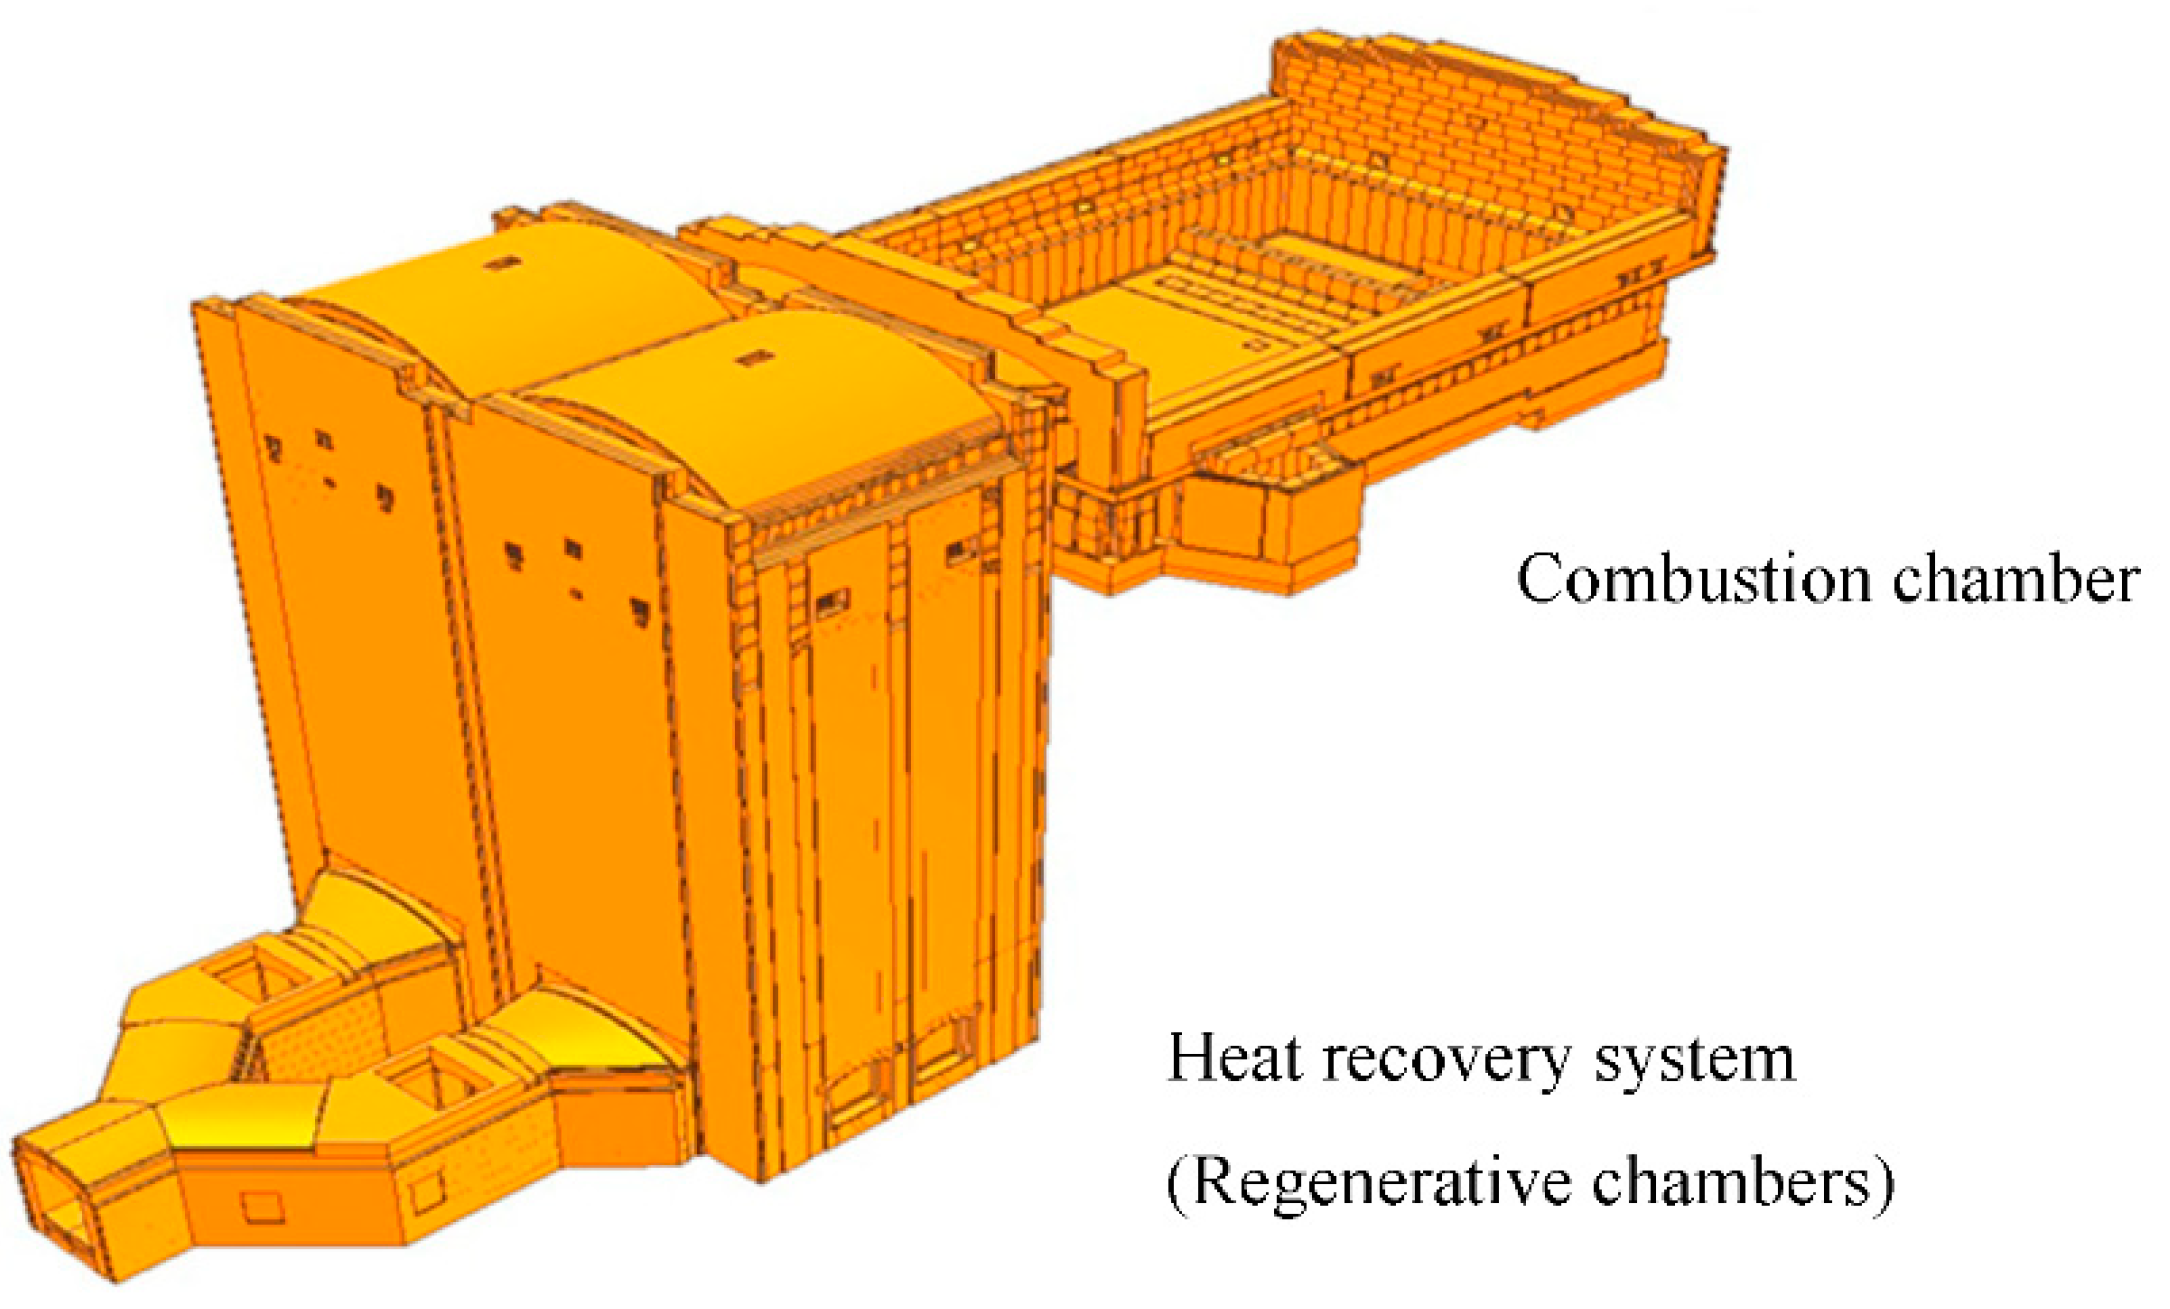
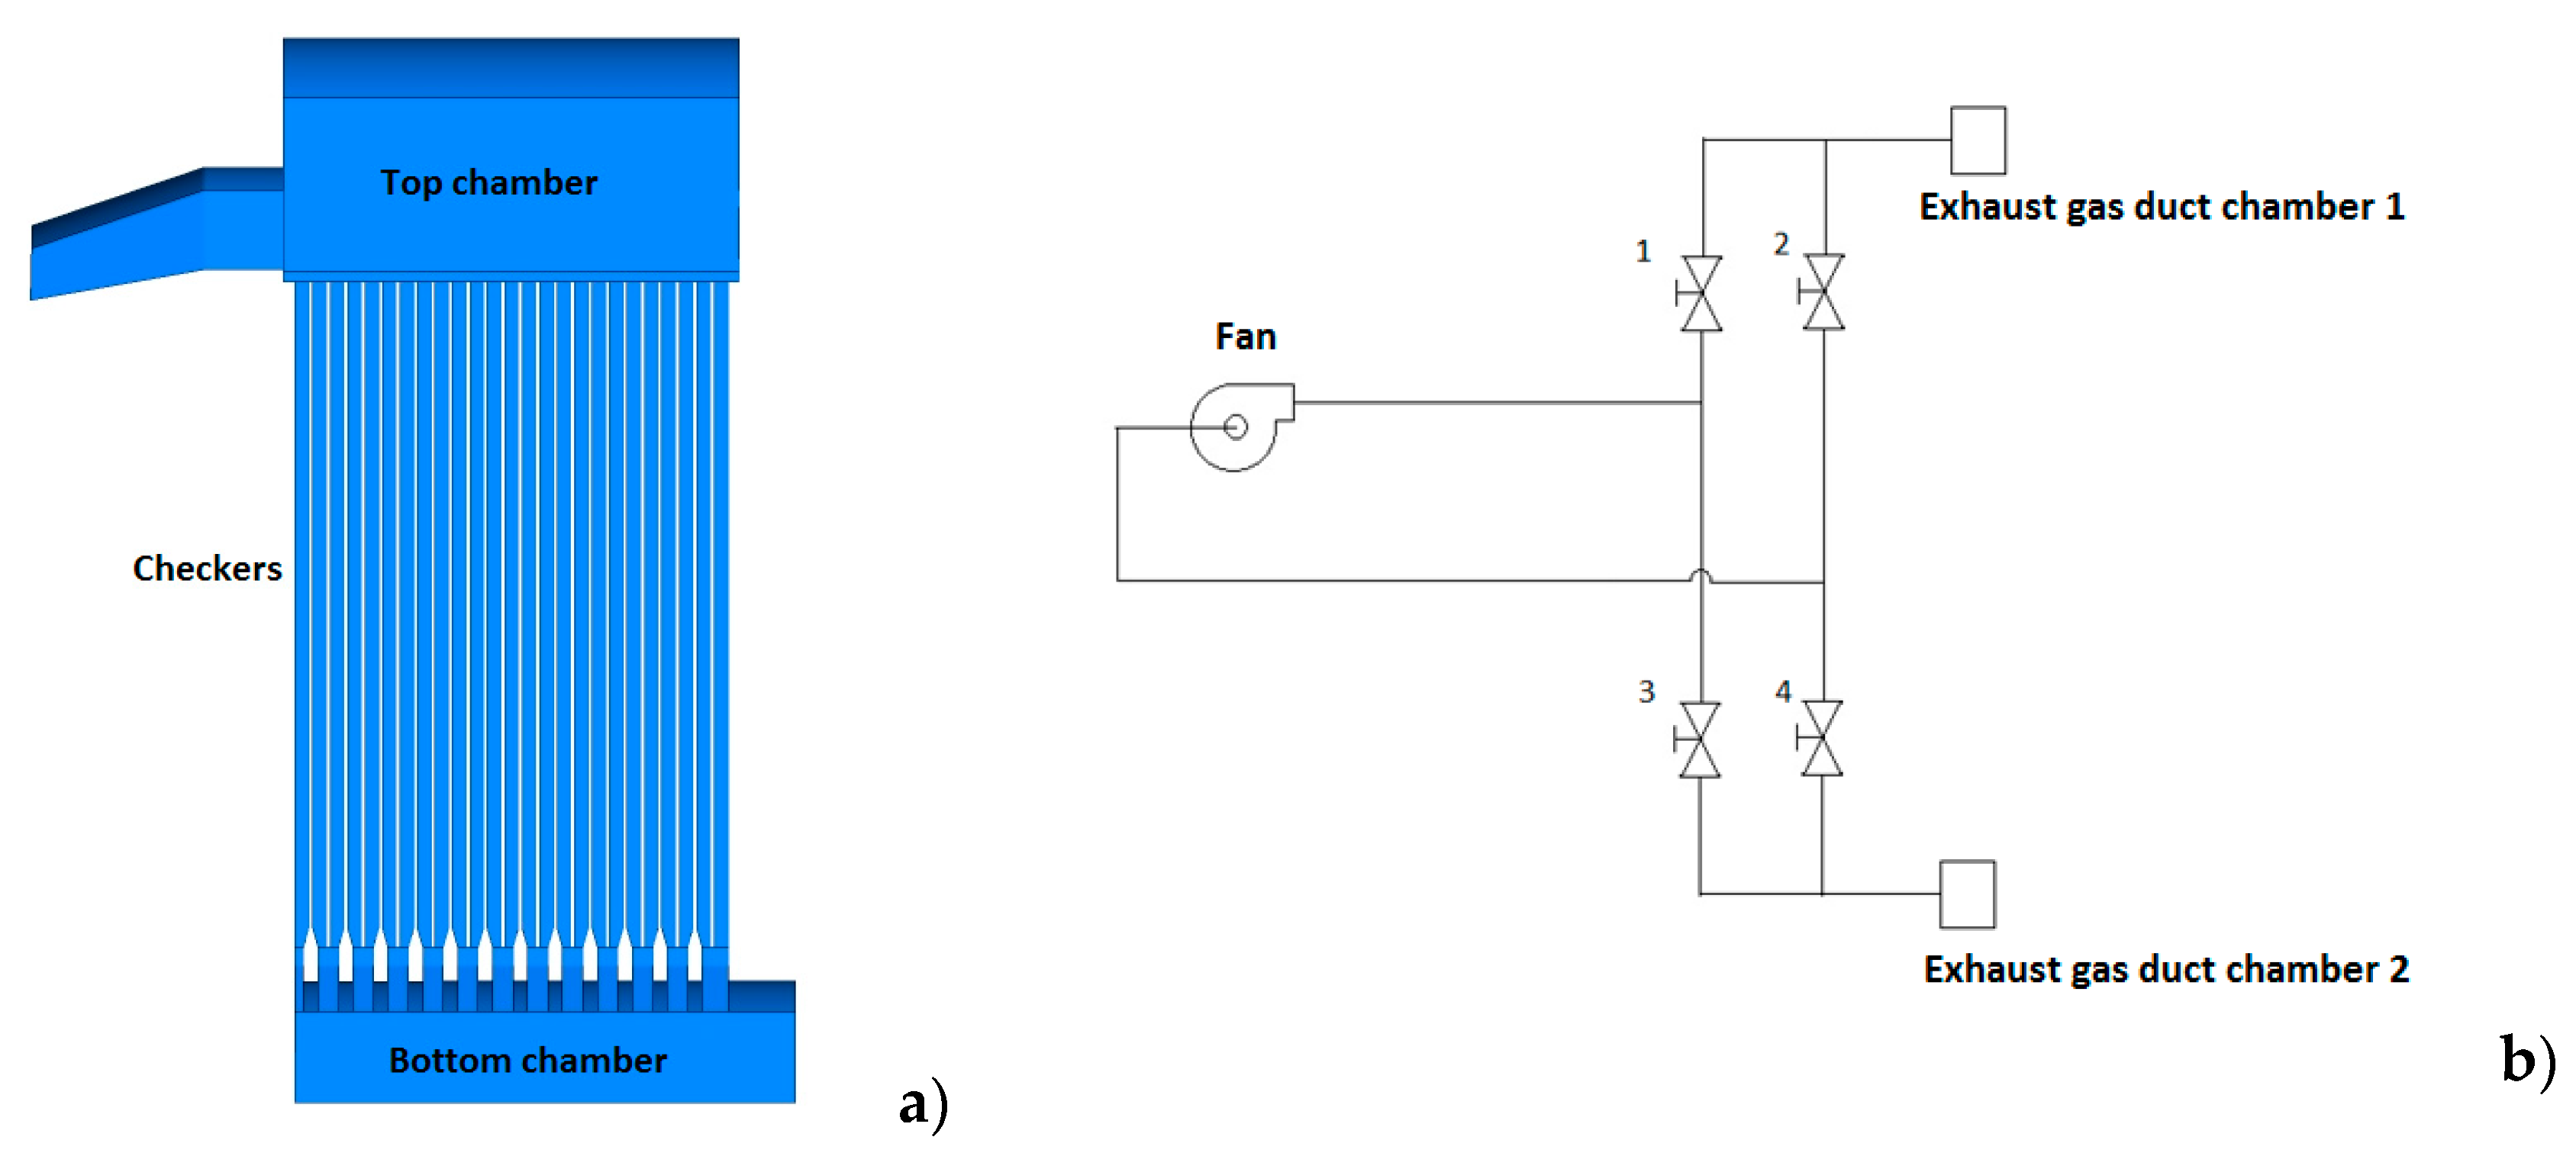
2. End-Port Glass Production Plant Layout and Regenerative Chambers

One of the most frequent regenerative furnaces is the End-Port type, as seen in Figure 1, which is composed of two main structures: the combustion chamber (CC) and the heat recovery system (HRS).
The CC is a refractory oven where the raw materials introduced are melted by a combustion process. The high temperatures required for the glass production (the glass bath reach 1700–1800 K) lead to the use of natural gas as fuel. The temperature of the exhaust gas leaving the CC is very high (1400–1500 K). In order to improve the overall efficiency a heat recovery from waste gas is mandatory. In glass production, regenerative chambers are used. The system stems from the Martin-Siemens open-hearth furnace. It is composed of two or more regenerative towers, usually situated at the end of the CC (End-Port scheme), which are alternatively fed with air and exhaust gas (cold phase and hot phase), by cycles of 20 min. The regenerative chambers can be divided into three main zones, as depicted in Figure 2a: top chamber, checkers zone and bottom chamber.
The checker zone is the crucial part of the regenerator for the heat recovery [10]: it consists of the refractory material bricks, that absorb the heat of the waste gas during the hot phase and release it to the incoming air during the cold phase. Bricks are assembled in a modular way and present different shapes in order to promote the heat exchange and to ease the maintenance operations. The WGR system is based on the recirculation of a waste gas fraction extracted from the regenerative chamber in the hot phase and injected in the bottom chamber of the tower fed with air. However, due to the adverse pressure gradient, the gas cannot naturally reach the other regenerator and the flow should be inverted according to the heat recovery cycles. For these reasons, a specific ducting system supported by a fan is needed, as reported in the scheme of Figure 2b. The recirculated waste gases allow to partially dilute the incoming air thus reducing the NOx formation during combustion. The recirculated gases enter the chamber at the bottom side and flow with the combustion air up to the upper exit where they meet the natural gas and the resulting flame. The recirculated gas injection phase (flow rate and position) is of utmost importance in order to get a required gas stratification over the flame to control its temperature and therefore the NOx formation.
An alternative method to decrease the NOx emissions is the air staging. The technique consists of injecting air inside the top chamber when it is fed with the burned gas. In order to decrease the nitrogen oxides, the combustion is performed in a reducing environment, which leads to the formation of a large amount of CO. Hence, the combustion process is completed in a second stage outside the CC [13] and inside the top chamber at a lower temperature (NOx limitation). Three different types of air staging can be considered [4] (Figure 3):
-
Cold Air Staging: mass flow of air at ambient temperature is injected inside the chamber;
-
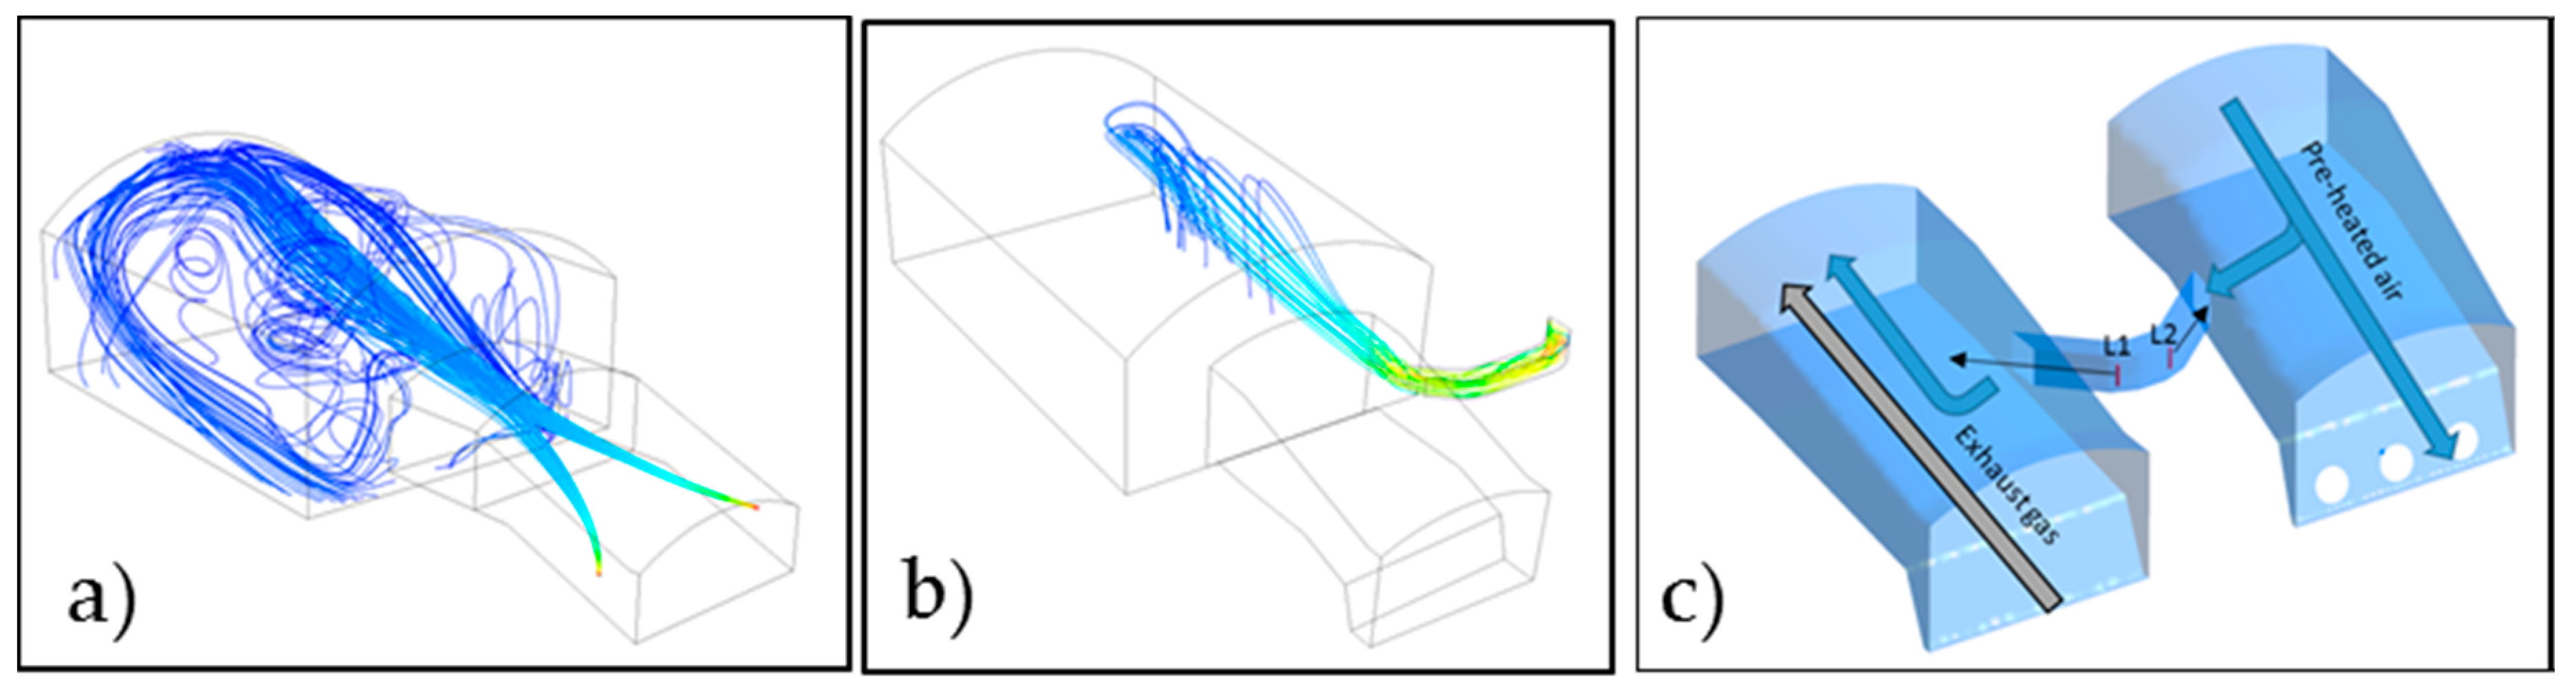
Hot Air Staging: mass flow of hot air is conveyed naturally from the adjacent chamber through a U-shaped duct located between the two port-neck;
-
Hybrid Air Staging: it combines the previous techniques.
The systematic use of CFD has allowed the understanding of the flow mechanisms and thermal effects of the above three strategies [4]. It was demonstrated that the first one is the most effective in reducing emissions; however a considerable amount of air at low temperature in the top chamber affects the effectiveness of the HRS. The second solution overcomes the problem by the injection of a percentage of air coming from the adjacent top chamber; the by-pass is provided by a duct connecting the two ports of the top chambers. In these conditions, the flow is naturally driven by the favorable pressure gradient but the mixing of combustion gases and air is uncontrolled and insufficient. Best results are achieved with the third solution. The Hybrid Air Staging differs from the Hot Air Staging for the installation of two injectors inside the connecting duct. The injectors are fed by compressed air and allow the control of the mass flow rate to be bypassed. Moreover, the jet of compressed air enhances the mixing of the gases bypassed into the regenerative chamber. They are alternatively called pros and cons injectors with respect to the air/gas cycle: the pros provides air in the same direction of the by-passed flow, the cons in the opposite (Figure 3c).

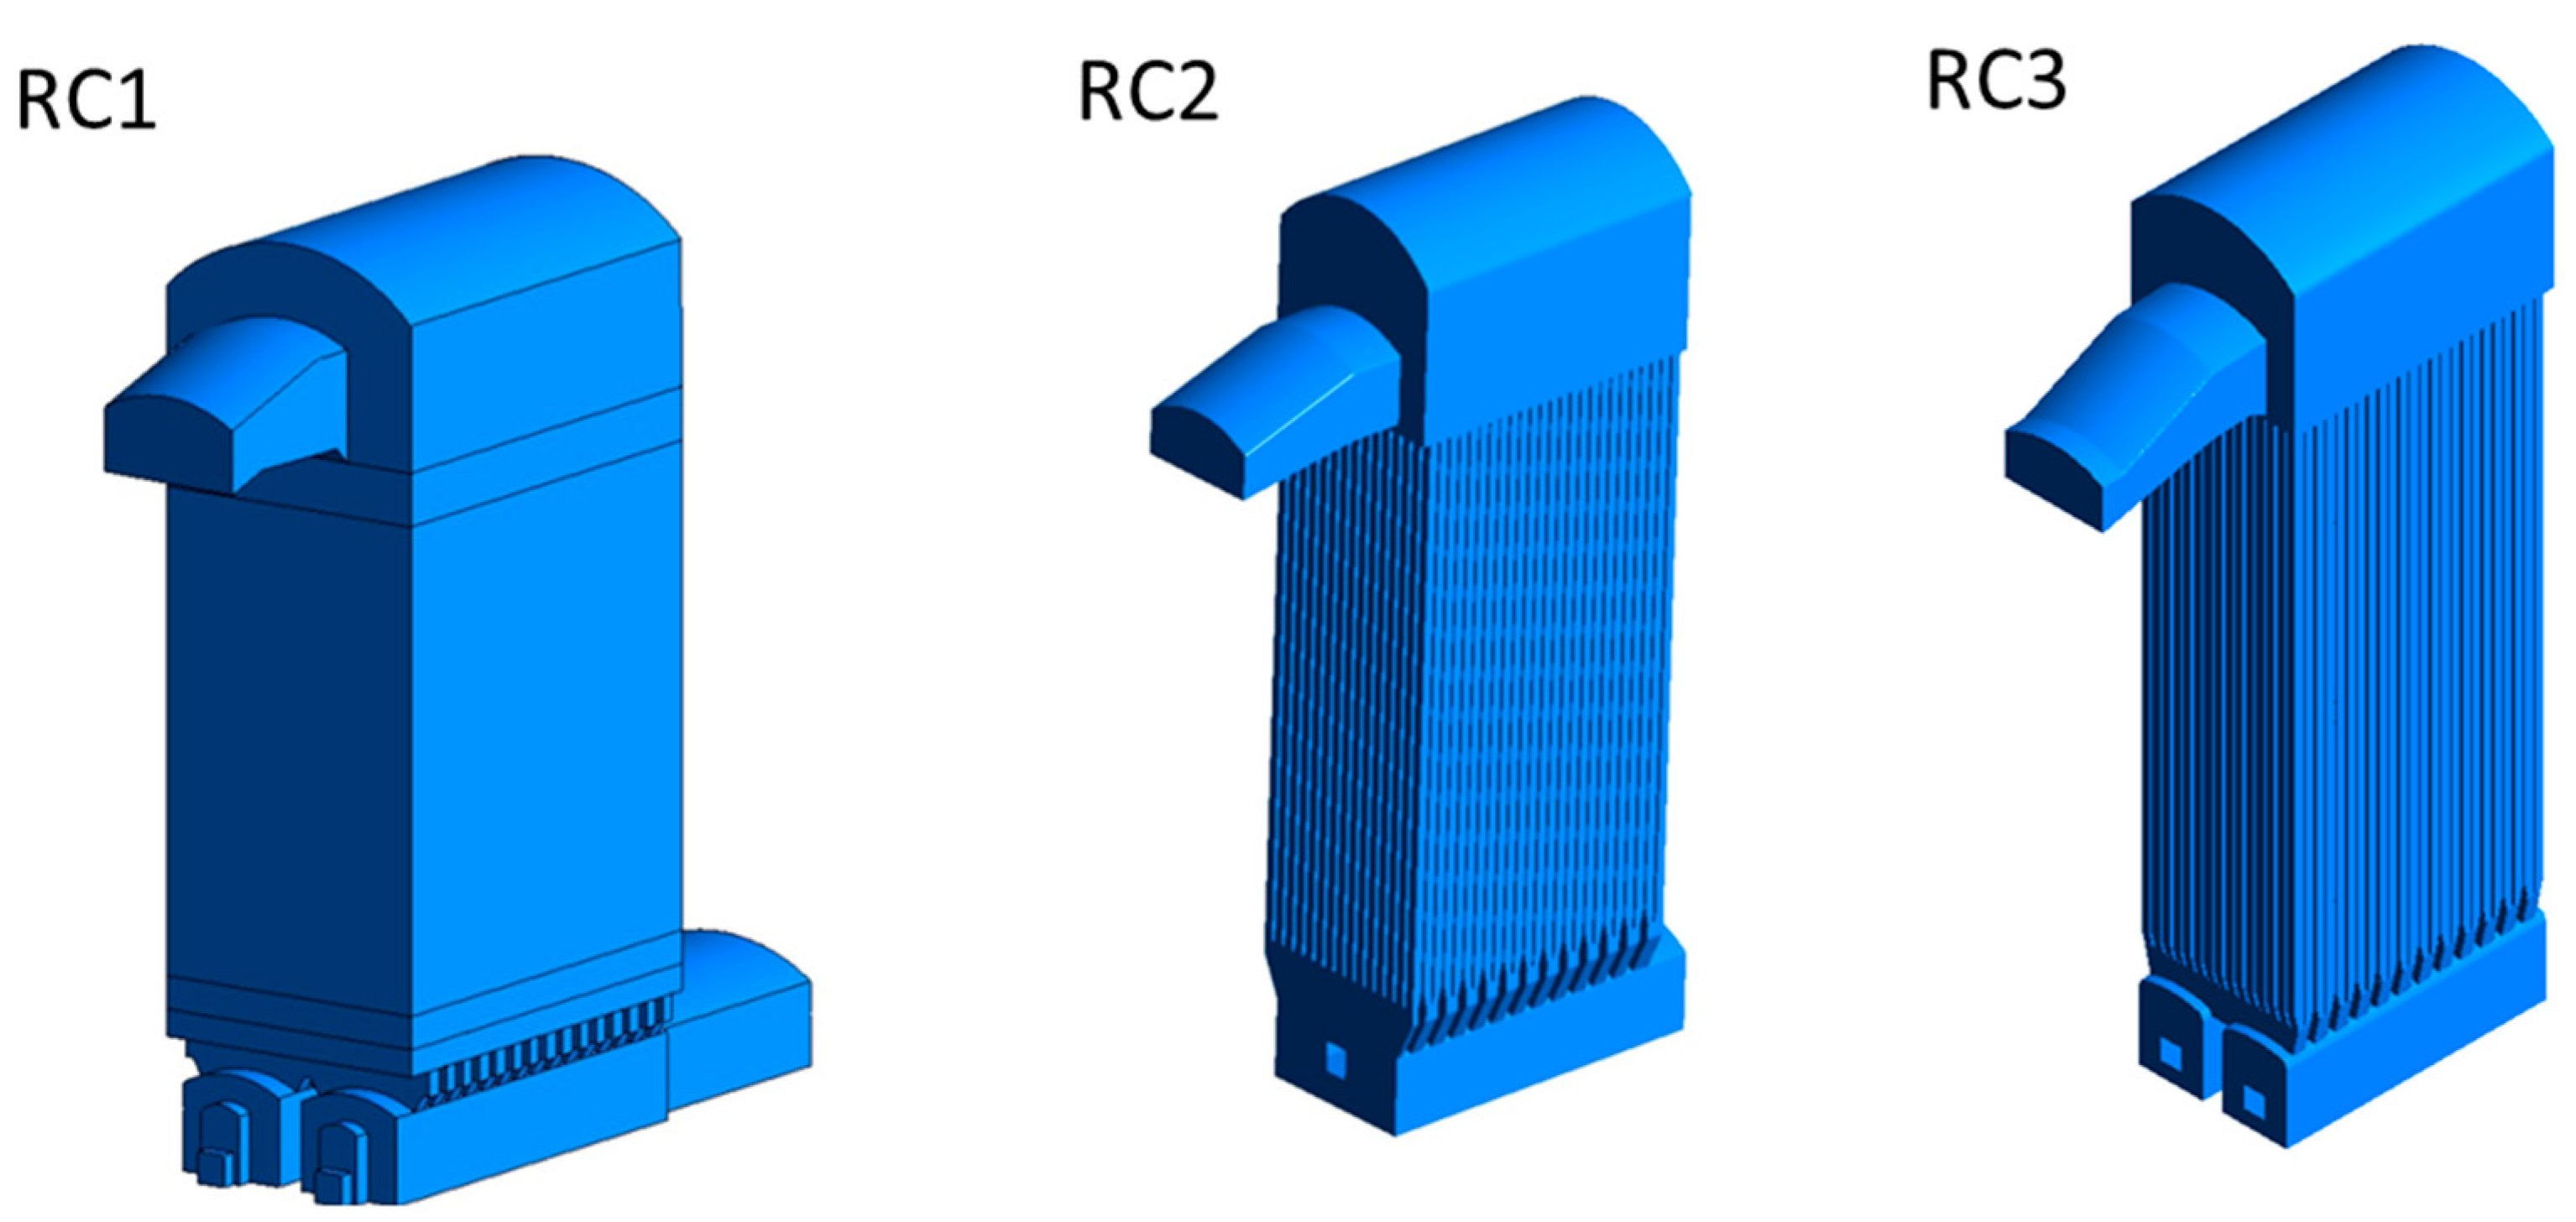
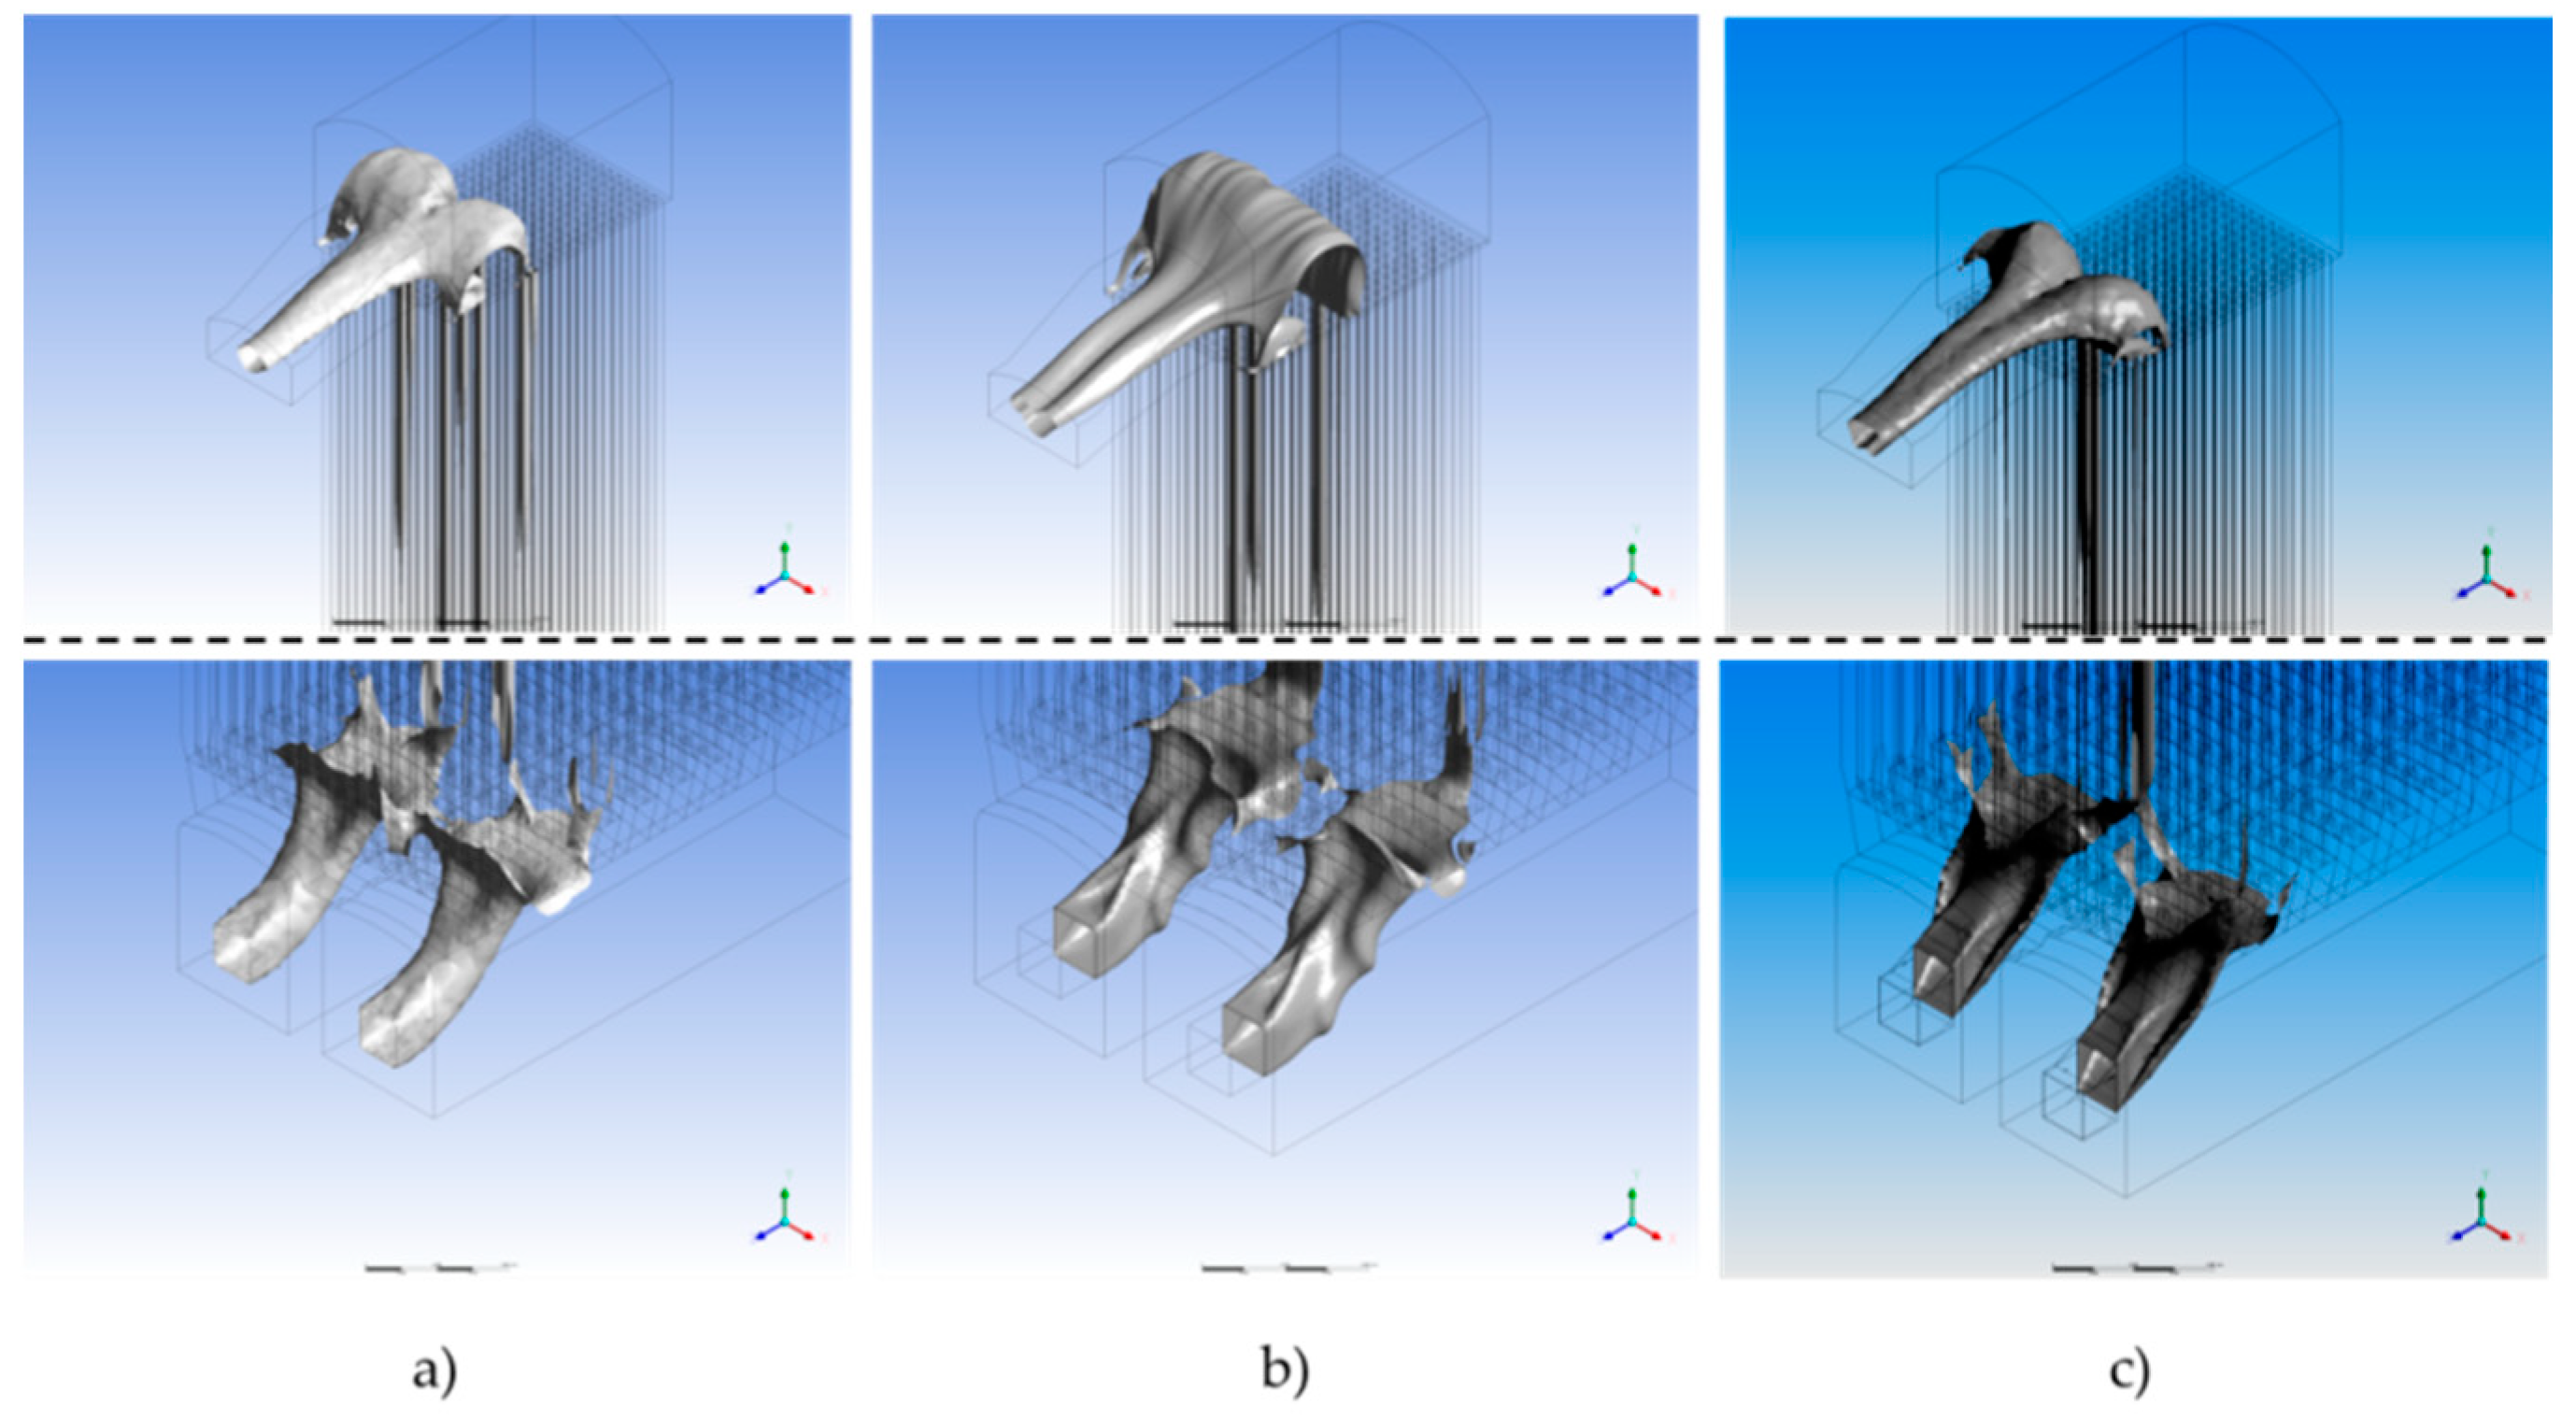
3. Reference Geometries and CFD Models

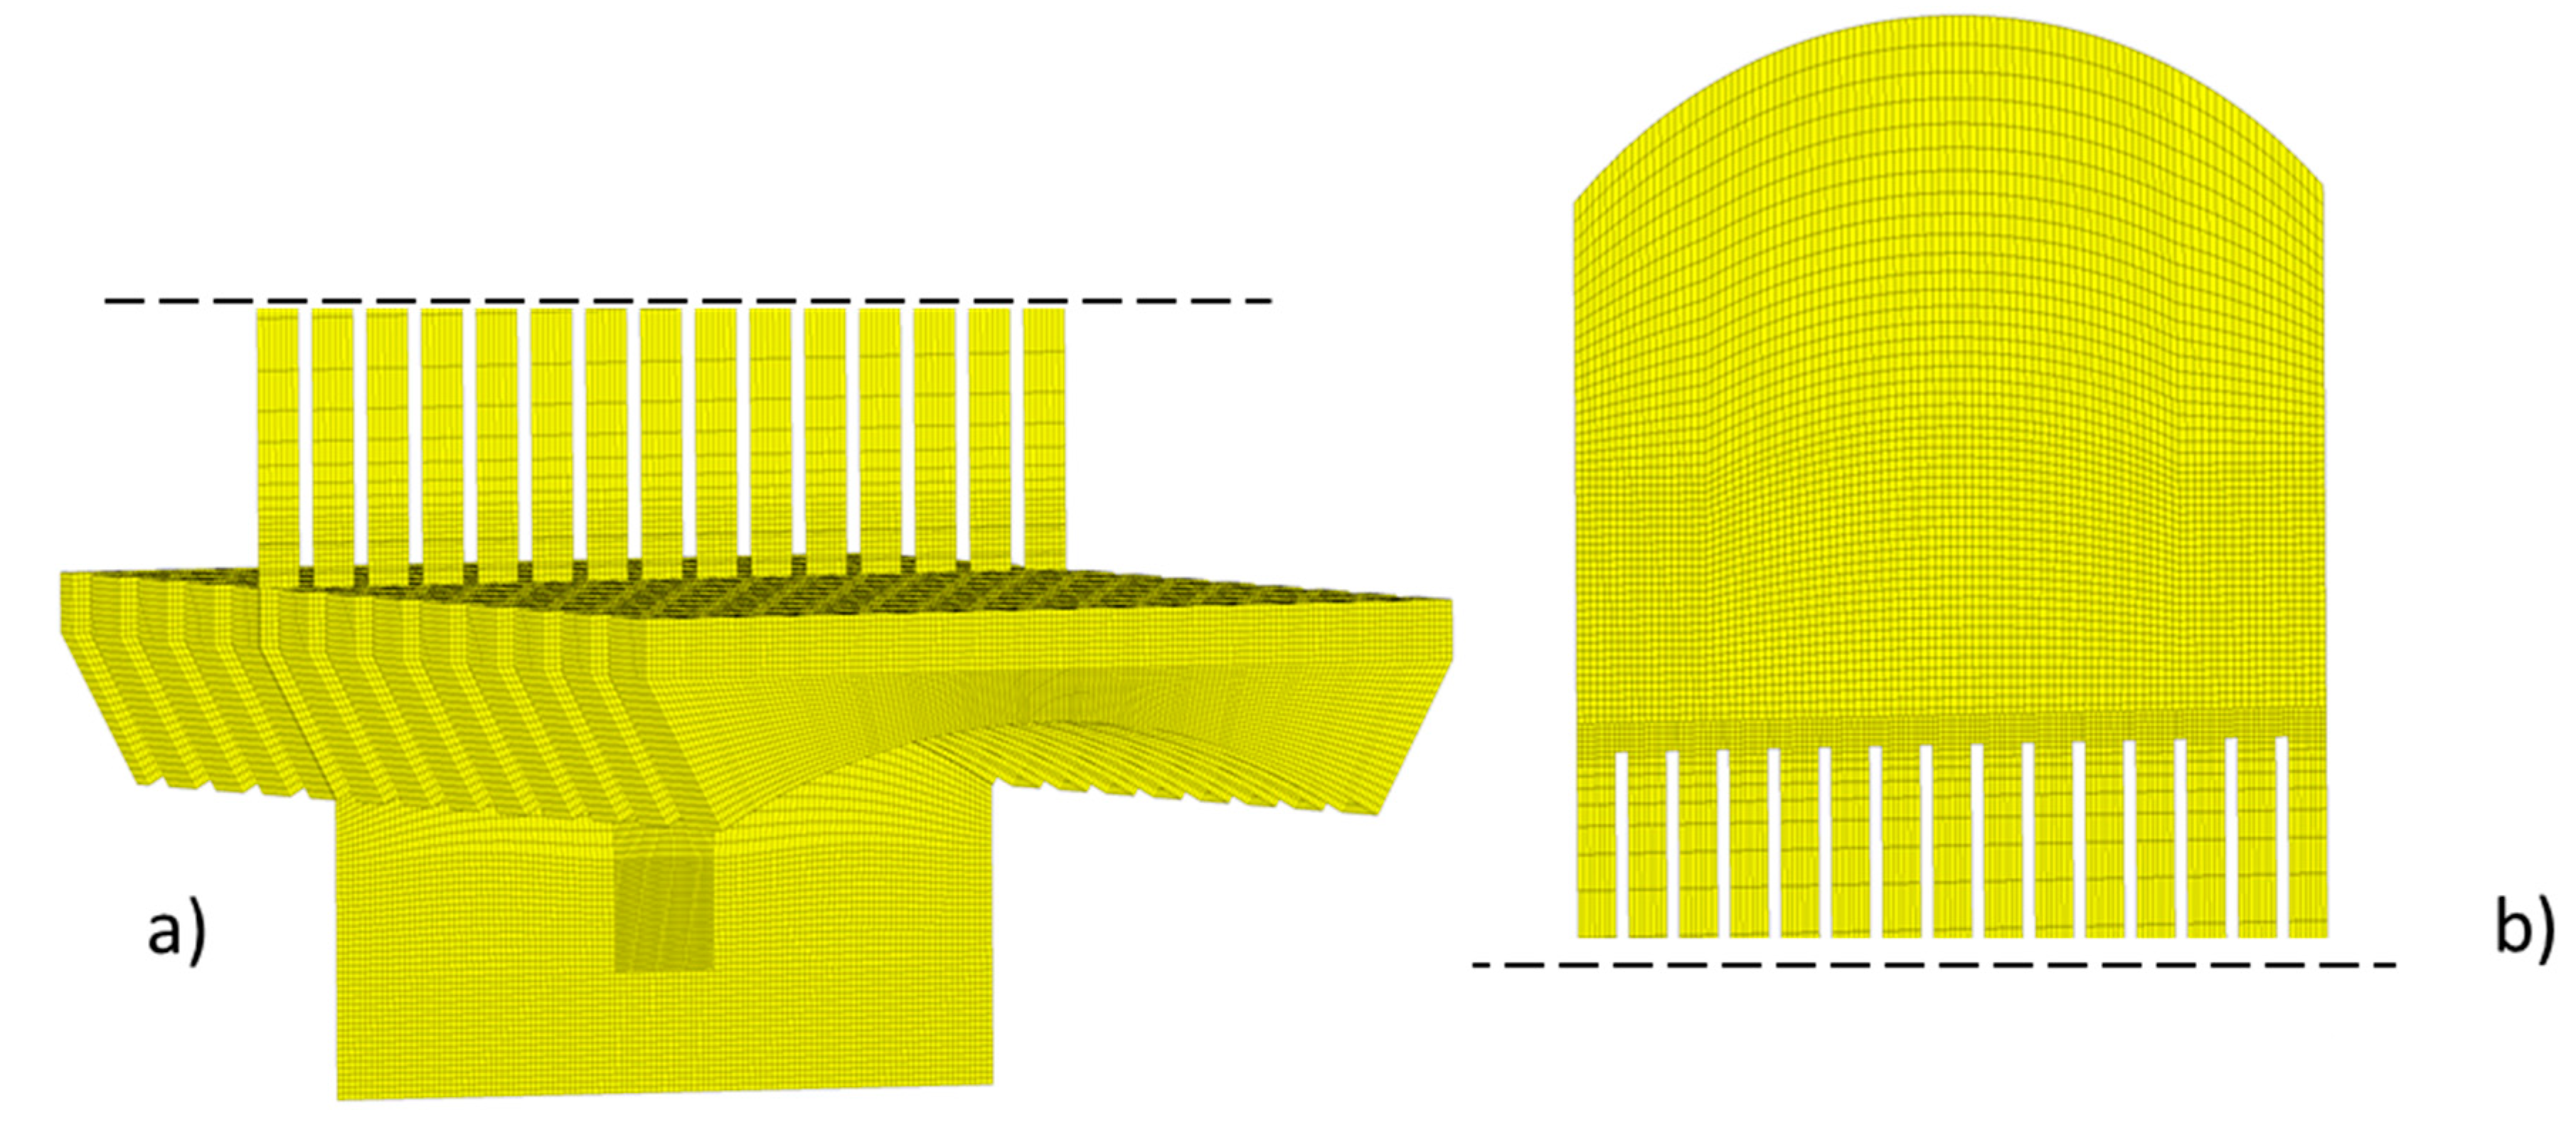
3.1. WGR Waste Gas Recyrculation Systems

Three different existing regenerative chamber geometries are considered with main geometric features, reported in Table 1. The configuration differs, as seen in Figure 4, also for the lower part geometry, (RC1 and RC3 have two separated ducts for inlet/outlet sections connected to the checkers by the arches, built with a particular shape, RC2 has one bottom chamber with single section). The checkers zone has different constructive solutions: in RC2 and RC3 bricks have a cruciform shape, whereas, in RC1 octagonal shaped bricks are present.
The regenerative domain is divided into four sub-domains where different grids are generated, as summarized in Table 2: bottom chamber, arches (i.e., the structure that links the bottom chamber to the checkers), checkers, and top chamber. Each sub-domain is meshed with a block structured approach using Ansys ICEM® software. The reference dimension of the single mesh element for the sub-domains is approximately 10 × 10 × 10 mm. In Figure 5, a typical mesh for the regenerative chamber at both lower and upper sections is shown.
The Ansys Fluent v17.2 (ANSYS Inc., Canonsburg, PA, USA) flow solver has been used for the RANS CFD simulations with SIMPLE scheme and second order spatial discretization for both governing equations and turbulence model. The SIMPLE scheme has been preferred, over more sophisticated numerical schemes, for its robustness in simulating complex flow structures with incompressible flow. The waste gasses and the air have been modelled as gas mixtures composed by N2, O2, CO2 and water vapor. The species transport model has been activated and the proper composition of the gasses has been provided. The standard k-ε turbulence model with scalable wall functions has been used. At inlet sections, the mass flow rate (air or waste gases) is fixed as boundary conditions together with temperature, gas composition and turbulence intensity of 5%. The outflow condition (zero gradient) is fixed at the outlet sections. The steady flow option with automatic flow domain initialization has been used. Depending on the target, the checker zone domain can be modelled with the following options:
-
As a porous domain, used when the geometry of the stackers is too complicated and
-
Straight vertical channels that discretize the effective geometry from checkers, used when the geometry is simpler.
In the first case, the porous domain has the source terms for momentum and energy governing to model flow resistance and heat transfer, as described in [10,11,12].
According to the checkers configurations, RC1 has been modeled with a porous domain while RC2 and RC3, have been modelled with a series of vertical channels.

3.2. HyAS—Hybrid Air Staging Configurations

The Air Staging configuration considered is obtained from case RC2. Both chambers have been considered connected by a U-shaped duct for the air bypass. As previously remarked, in the HyAS, two additional injectors are positioned inside the duct; they have a dual purpose: to provide the cold air flow rate and to regulate the amount of air recirculated and control the air-gases mixing.
Due to the presence of the injectors, an unstructured grid has been used to discretize the U-shaped duct. The same settings for the Fluent solver previously described are fixed. Mass flow rate, temperature and gas composition have been fixed at the regenerative chamber inlet, while outlet static pressure has been fixed at the other chamber exit. The mass flow rate and temperature of the injection air are fixed at the injection orifices.

4. Results and Discussion

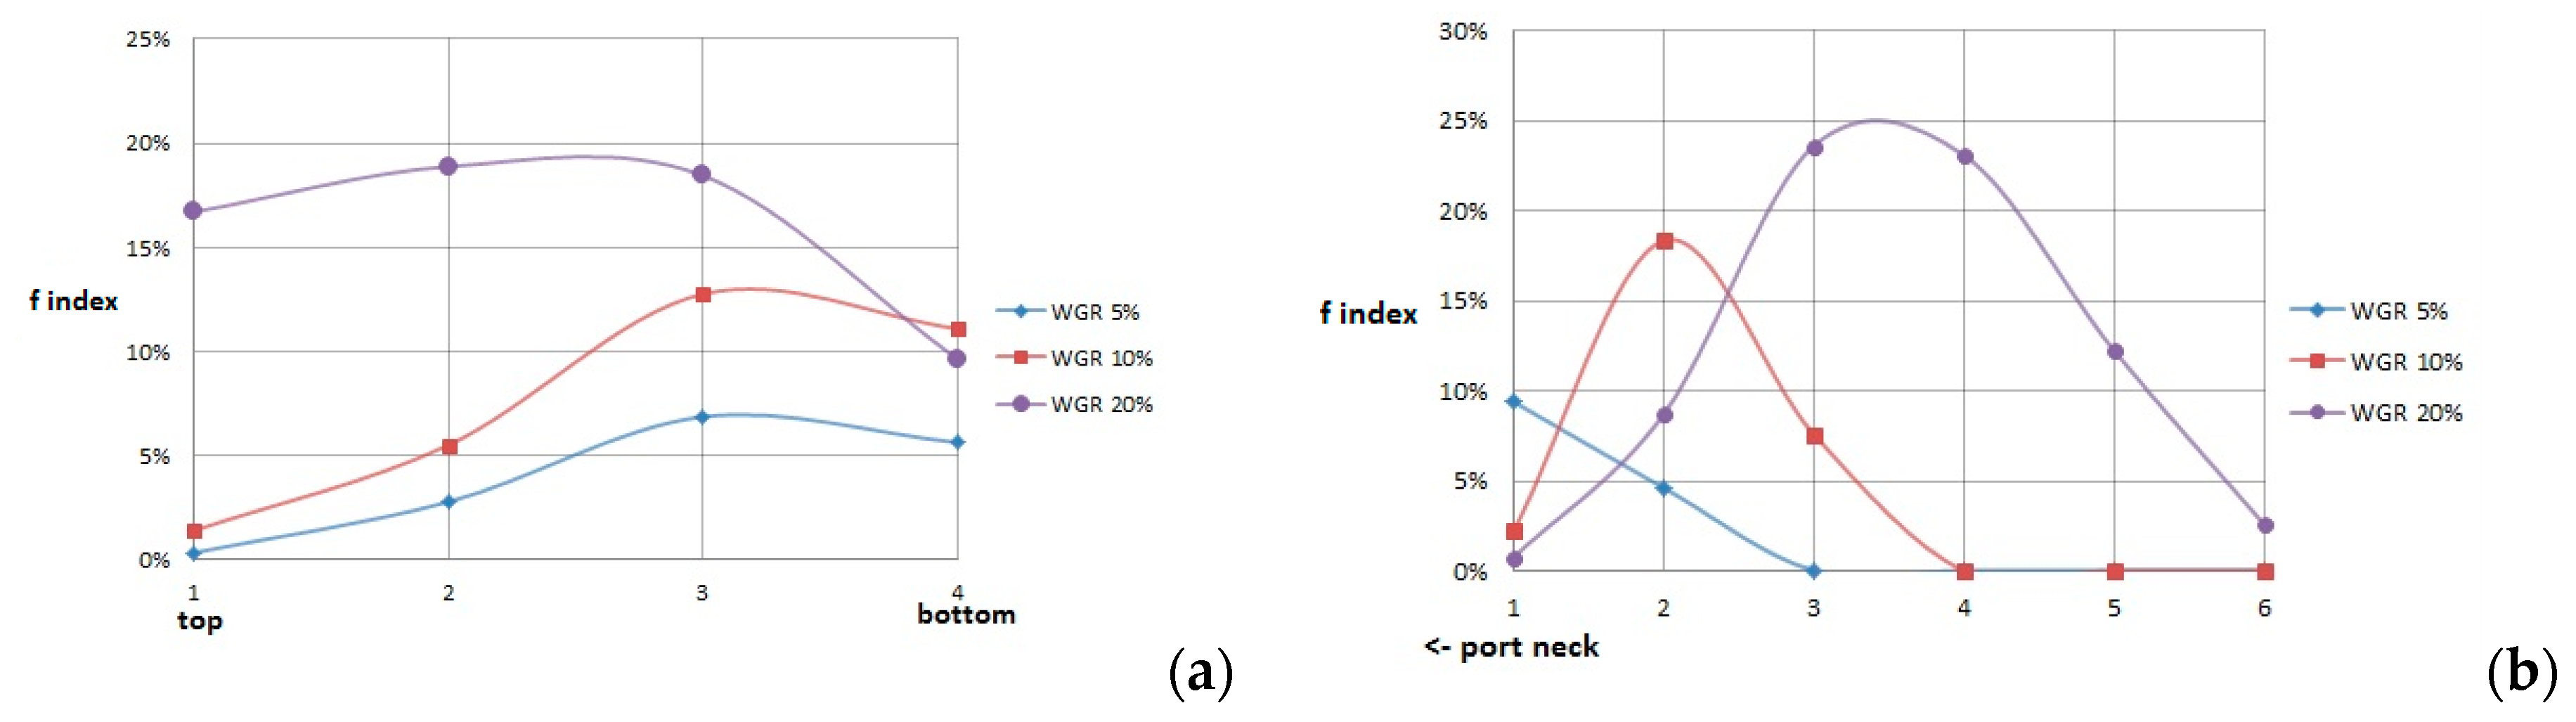
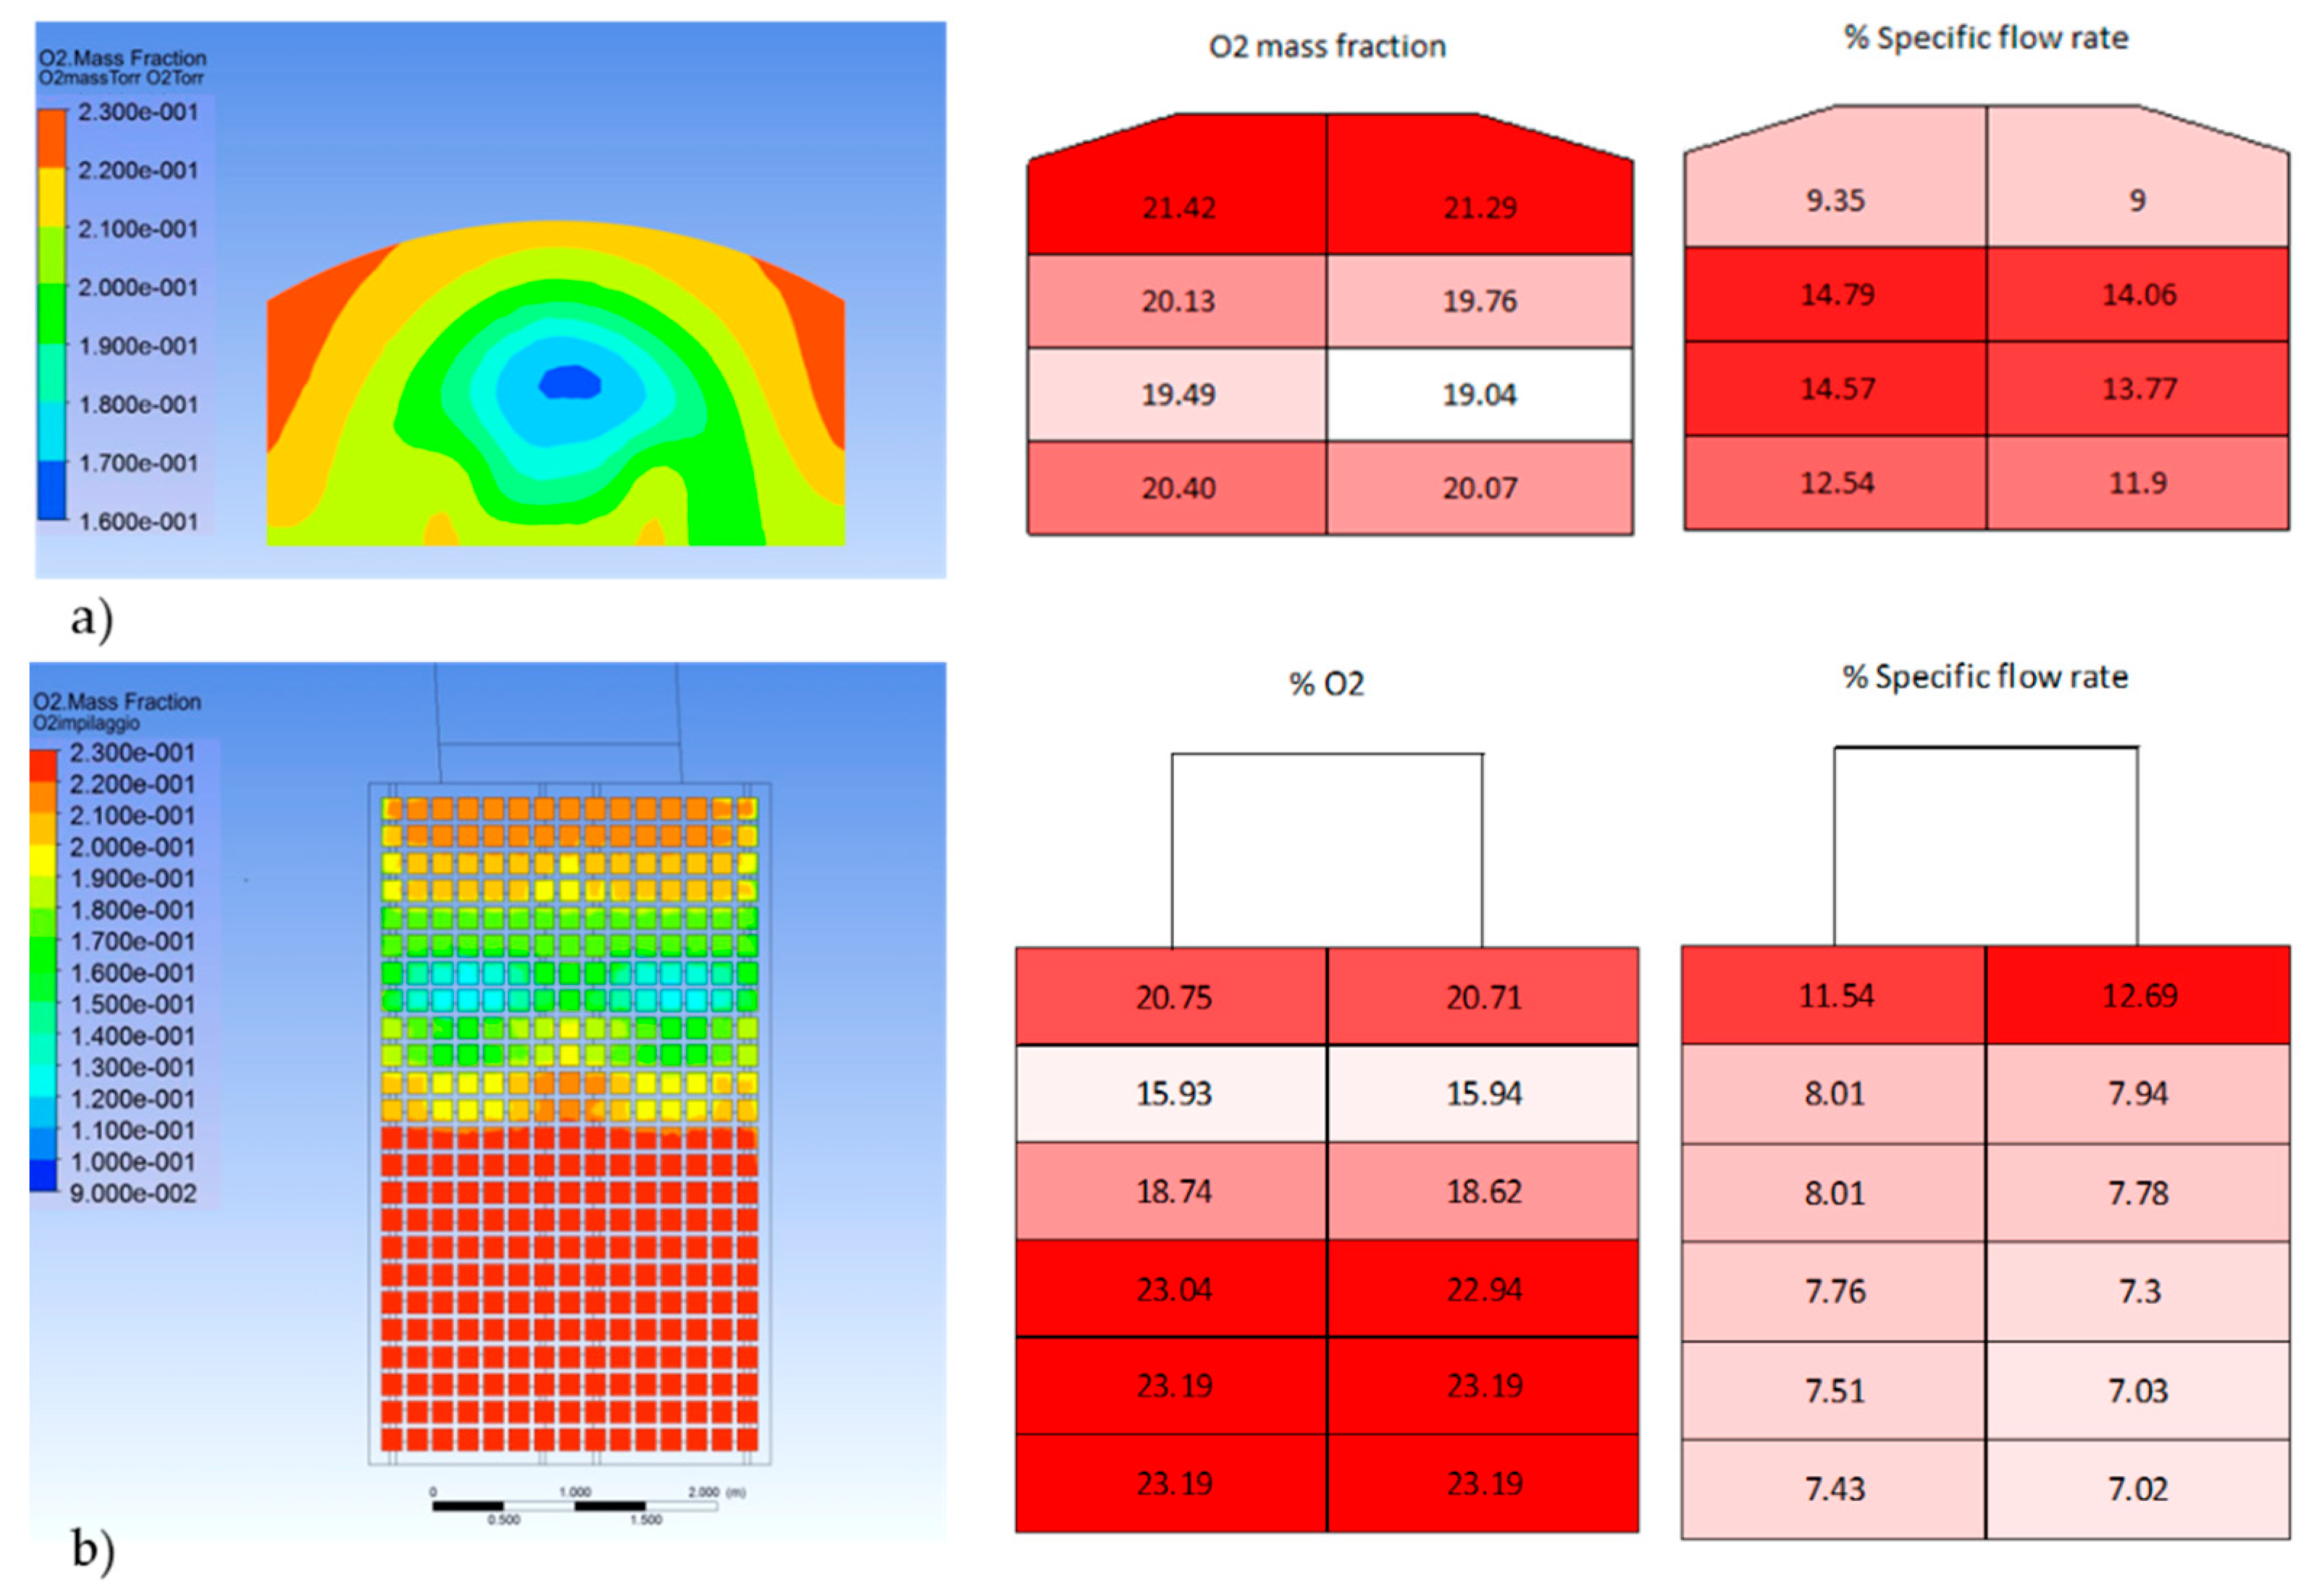
4.1. WGR—Waste Gas Recyrculation Systems

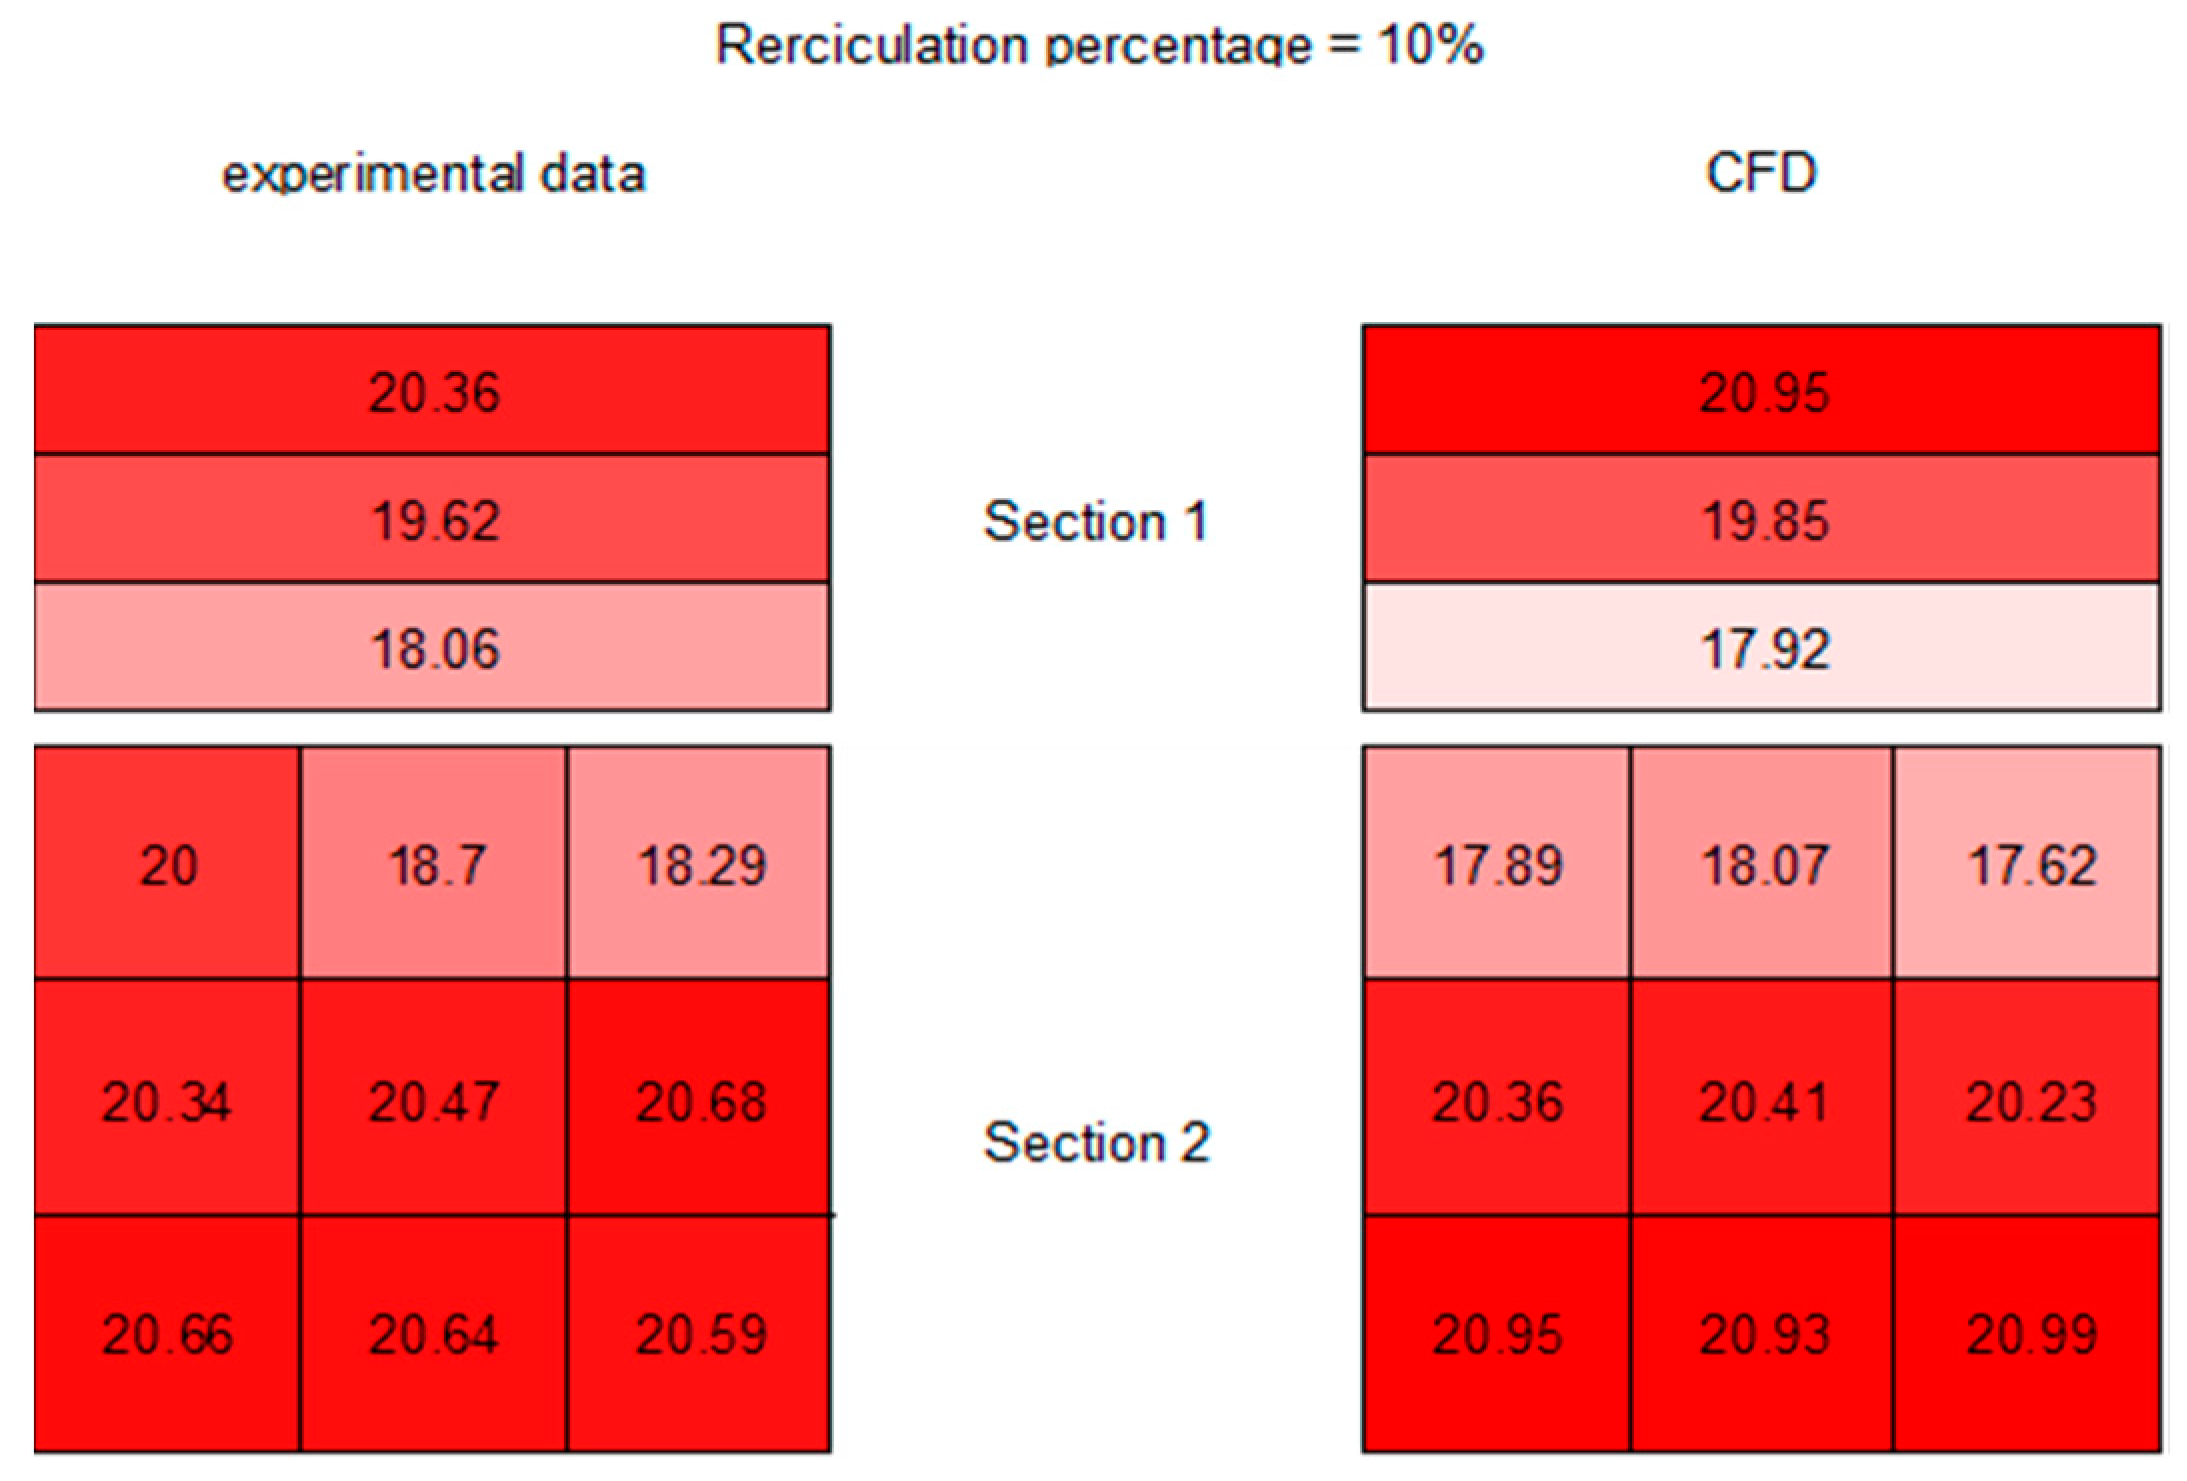
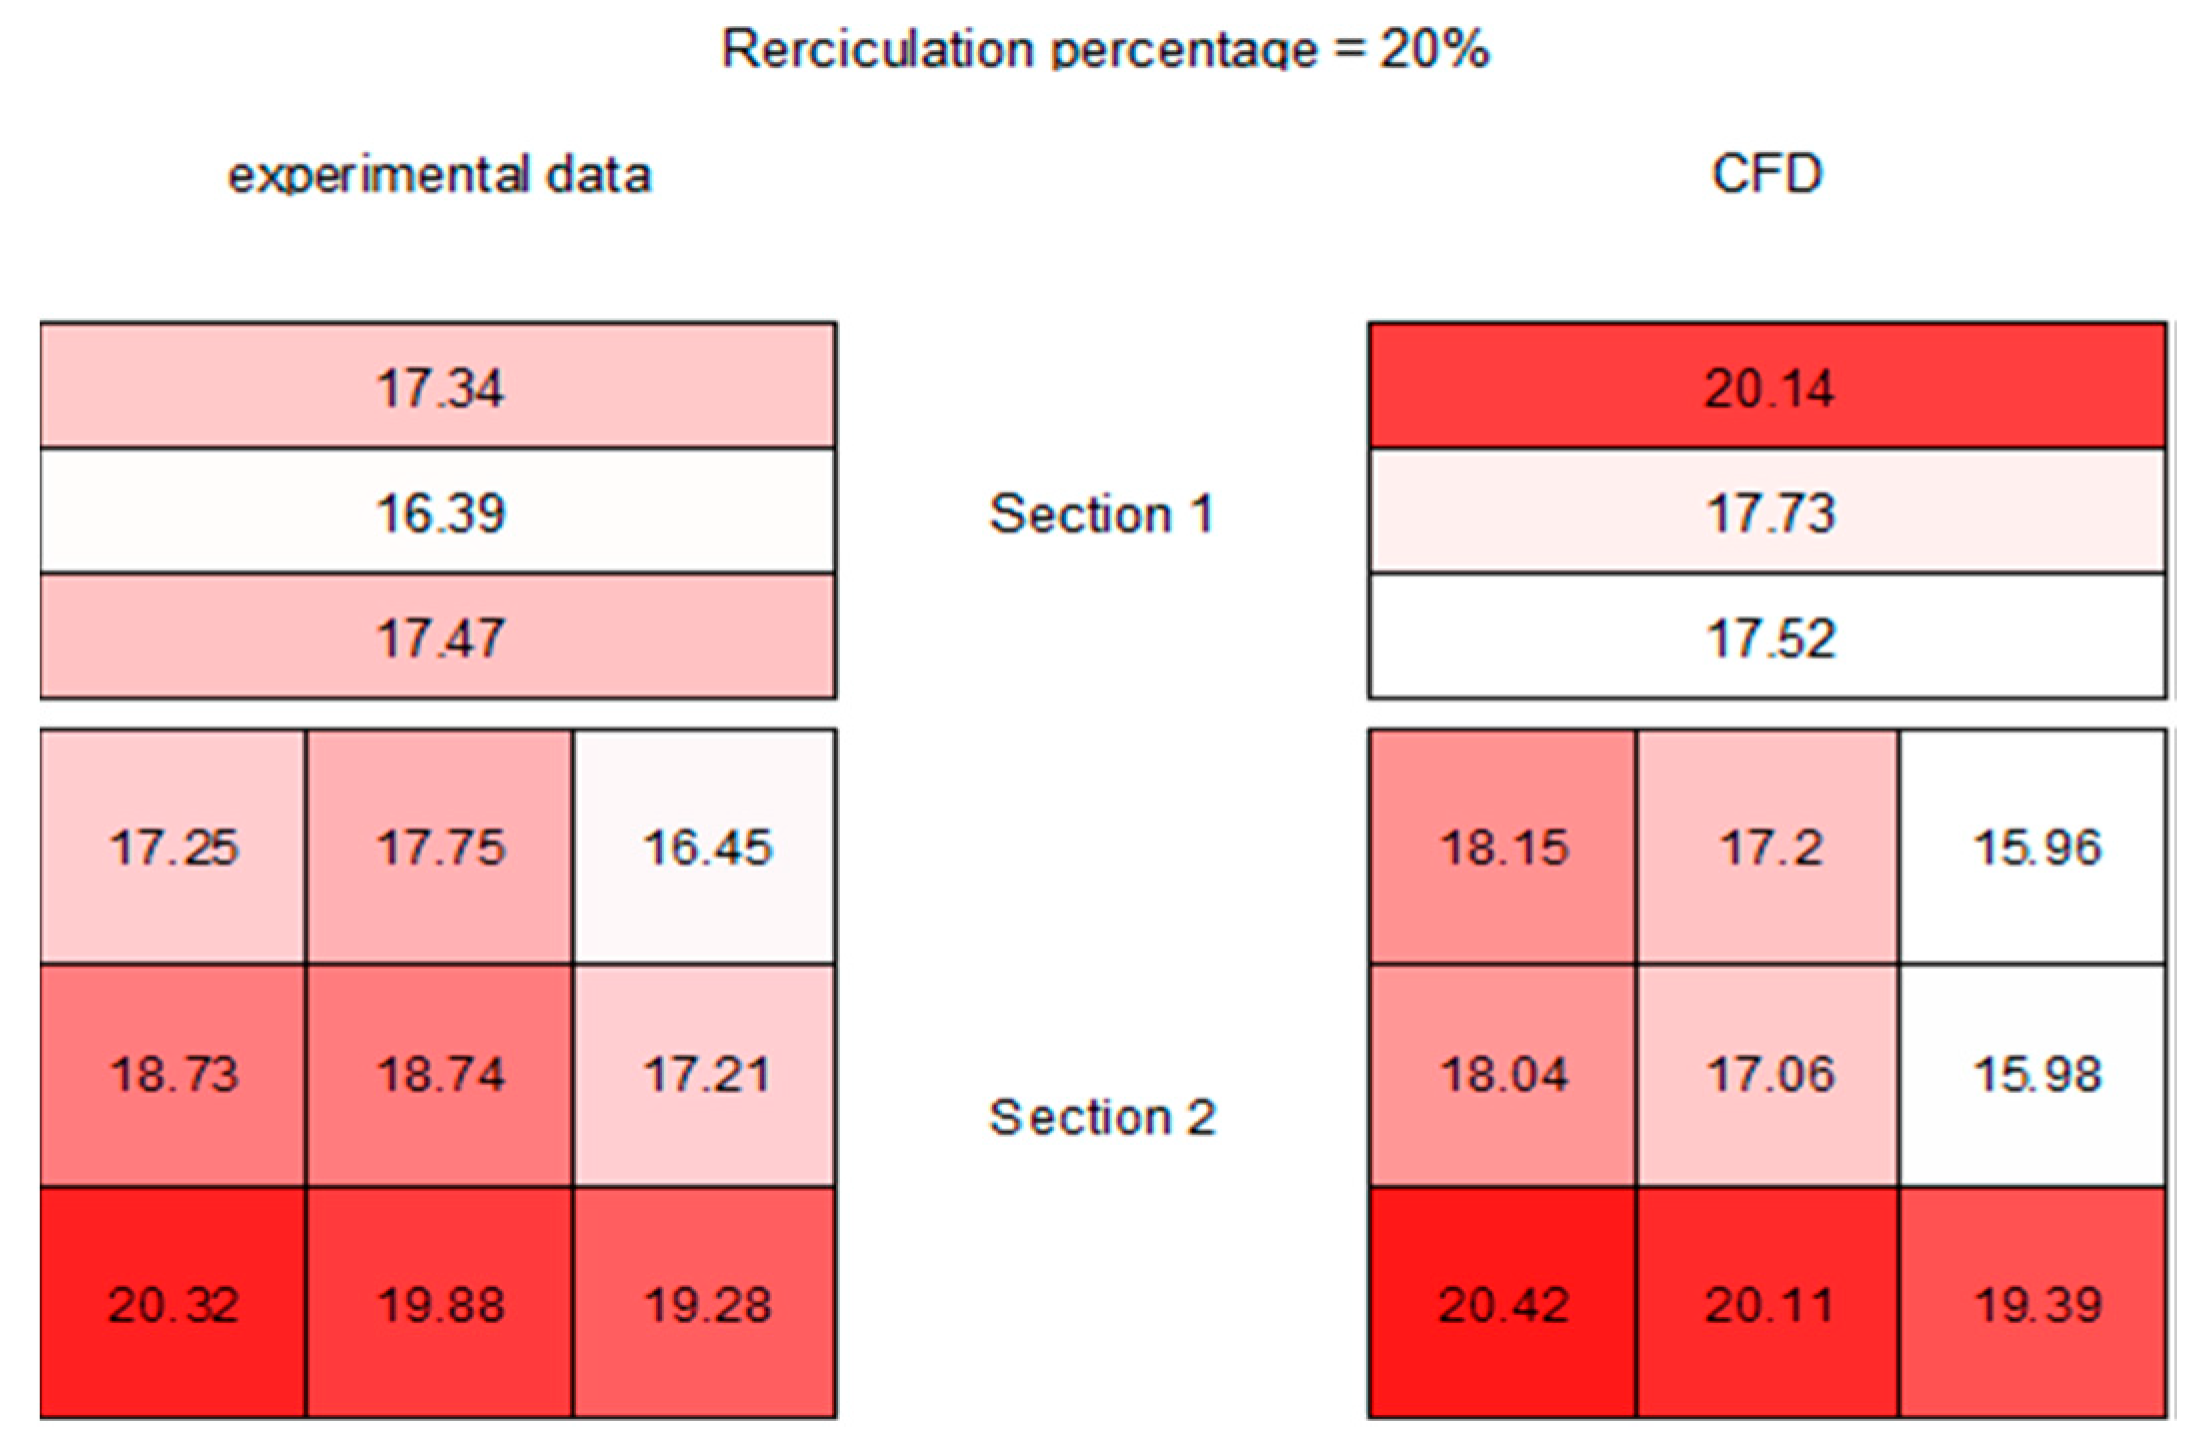
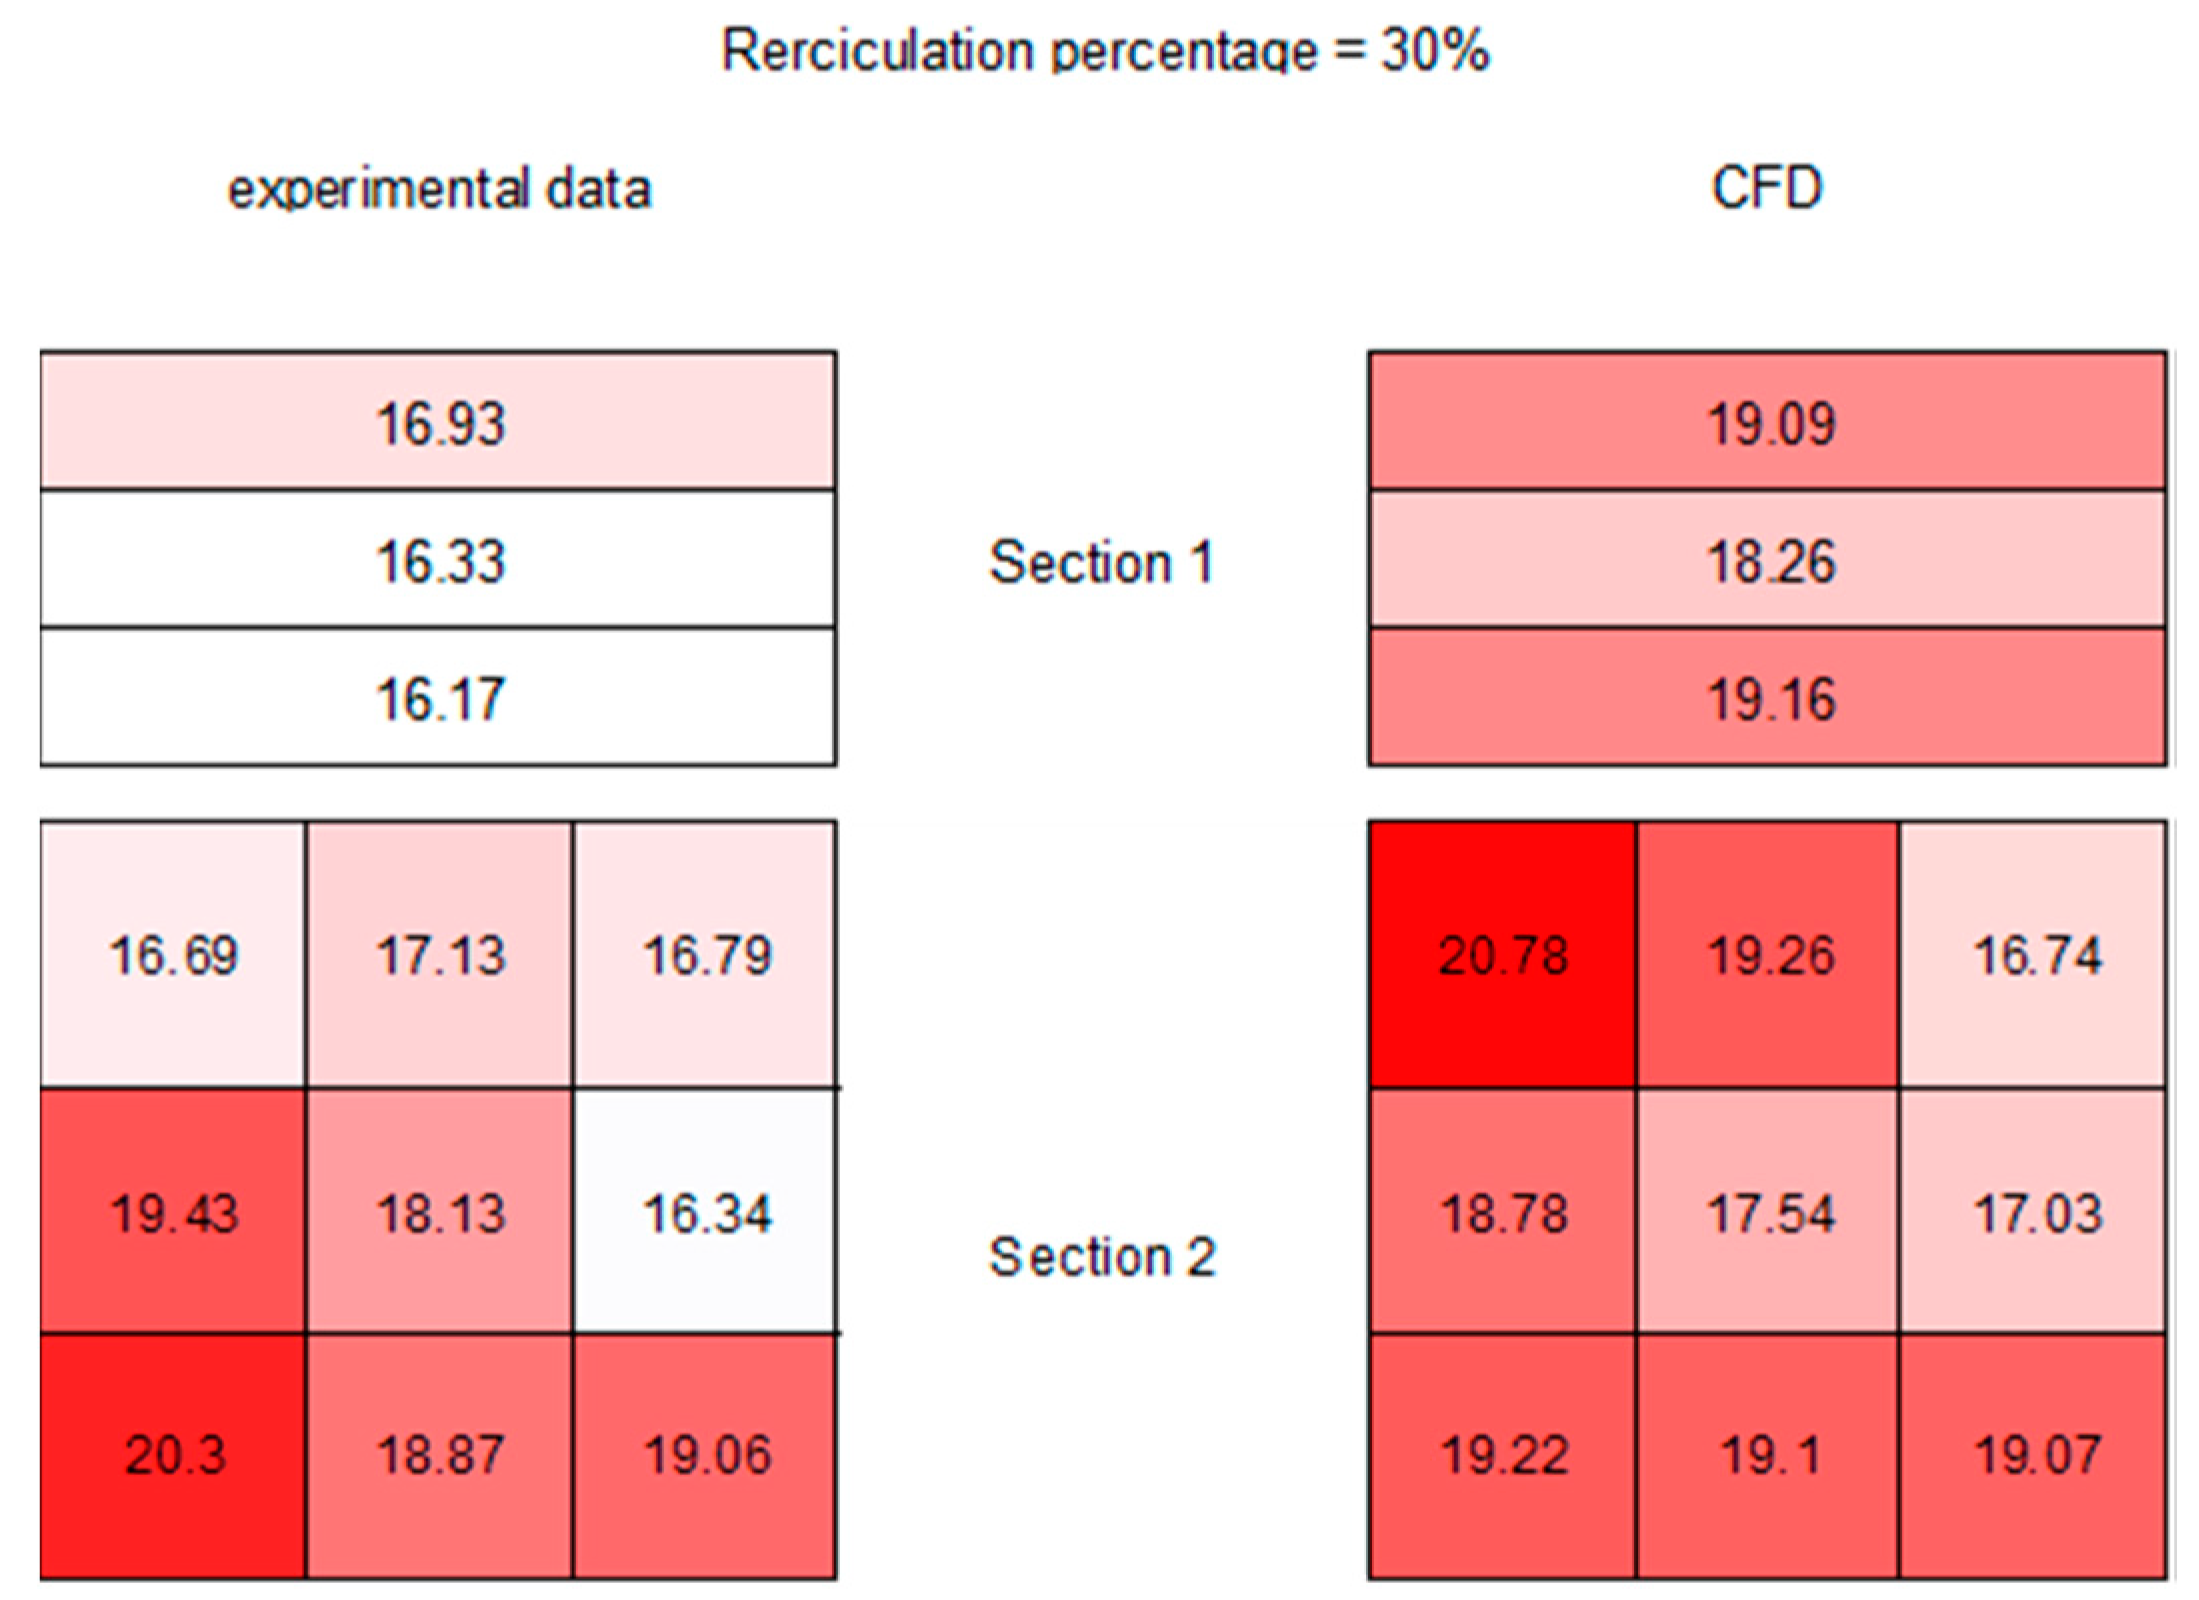
4.1.1. Simulation Campaign and Experimental Data

The CFD model and the data post-processing have been organized in order to be routinely used for design and development of the WGR systems. In the following sections, the applications to the configuration considered are described together with a validation process with a direct comparison with experimental data. The gas recirculation strategies and their effects are monitored using the O2 distributions inside some strategic sections of the domain where monitor points are considered. The experimental campaign has been provided for configuration RC1 and the O2 concentration has been measured on the sections reported in Figure 6. Section nr.1, left, is at the port outlet and section nr.2, right, is at the top of the checkers domain. Section nr.2 gives the distribution of the gasses inside the checkers and it is strategic for the stratification of the exhausts at the outlet port (section nr.1) of the top chamber, which is fundamental for the effective reduction of the NOx emissions. The above sections have been divided into zones where the measuring point has been centered. The O2 concentrations (detection of waste gas distribution) from the experimental campaign are compared to those obtained by the CFD analysis for three different exhaust gas mass flow rate percentage ratios, with respect to incoming air, 10%, 20%, 30%. The above percentages set the exhaust gas recirculation (EGR) rate of the operating point.
For each monitor section, the percentage error between O2 concentration from experimental data and CFD results are computed:
p e r c e n t a g e e r r o r = [ O 2 ] e x p [ O 2 ] C F D [ O 2 ] e x p
The O2 concentration has been measured experimentally at one probe position at the centroid of the control section numbered in Figure 6, while the CFD data are average values of O2 concentration in the above areas.
The probe consists of a water refrigerated duct inserted at different depths inside the regenerator; the aspirated gas is conveyed to the oxygen concentration meter. An accuracy of 2% and a precision of 0.2% are guaranteed for the O2 concentration in the measured data.
This is clearly an approximation and must be taken into account for the data comparison. Figure 7 shows the comparison for a waste gas recirculation percentage of 10%.; the numbers in the zones are the O2 mole fractions. As seen, the trends and data are in good agreement apart from zone 1 where the percentage error (Equation (1)) is about 10%. The area with highest discrepancy is close to the wall and measurements could have been distorted by the presence of air leakage from outside (pressure inside the checkers is always lower than atmospheric pressure). The other two cases considered show also a good agreement, especially in terms of flow distribution, between data from the numerical simulation and measurements, as reported in Figure 8 and Figure 9 for 20% and 30% of gas recirculation, respectively. It can be observed that experimental values of mole fraction can sometimes differ significantly in some sections. However, it had to be considered that probes provide a punctual measurement of the oxygen concentration, while the CFD value is the area averaged datum over the discretized area. Nevertheless, it is interesting to note that the same flow structures, O2 distribution patterns, are obtained with CFD and experiments.
Taking into account the harsh conditions for the experimental data acquisition, and the approximations discussed it can be nevertheless concluded that the CFD approach is adequate to predict the flow structure inside the chambers in order to develop the EGR strategies. In the following, the results obtained for the three configurations using the CFD models are presented with the post-processing approach that has been specifically conceived to understand the EGR performance in order to systematically use the CFD technology for the design and the development of these systems. The monitor sections nr.1 and nr.2 are discretized with 8 and 12 control surfaces respectively where the O2 mass fraction and the specific mass flow are averaged. These quantities are useful monitor to understand the EGR system performance. To reduce the NOx formation, a low fraction of O2 in the lowest part of section nr.1 is needed and a proper O2 distribution is therefore required on section nr.2. To guarantee for a good thermal efficiency of the regenerative chamber a uniform distribution of the specific mass flow rate on Section 2 is a requirement. All the configurations considered (RC1-RC2-RC3) have been simulated in a range of different WGR percentages. In the following paragraphs, a selection of relevant results for each configuration is described.

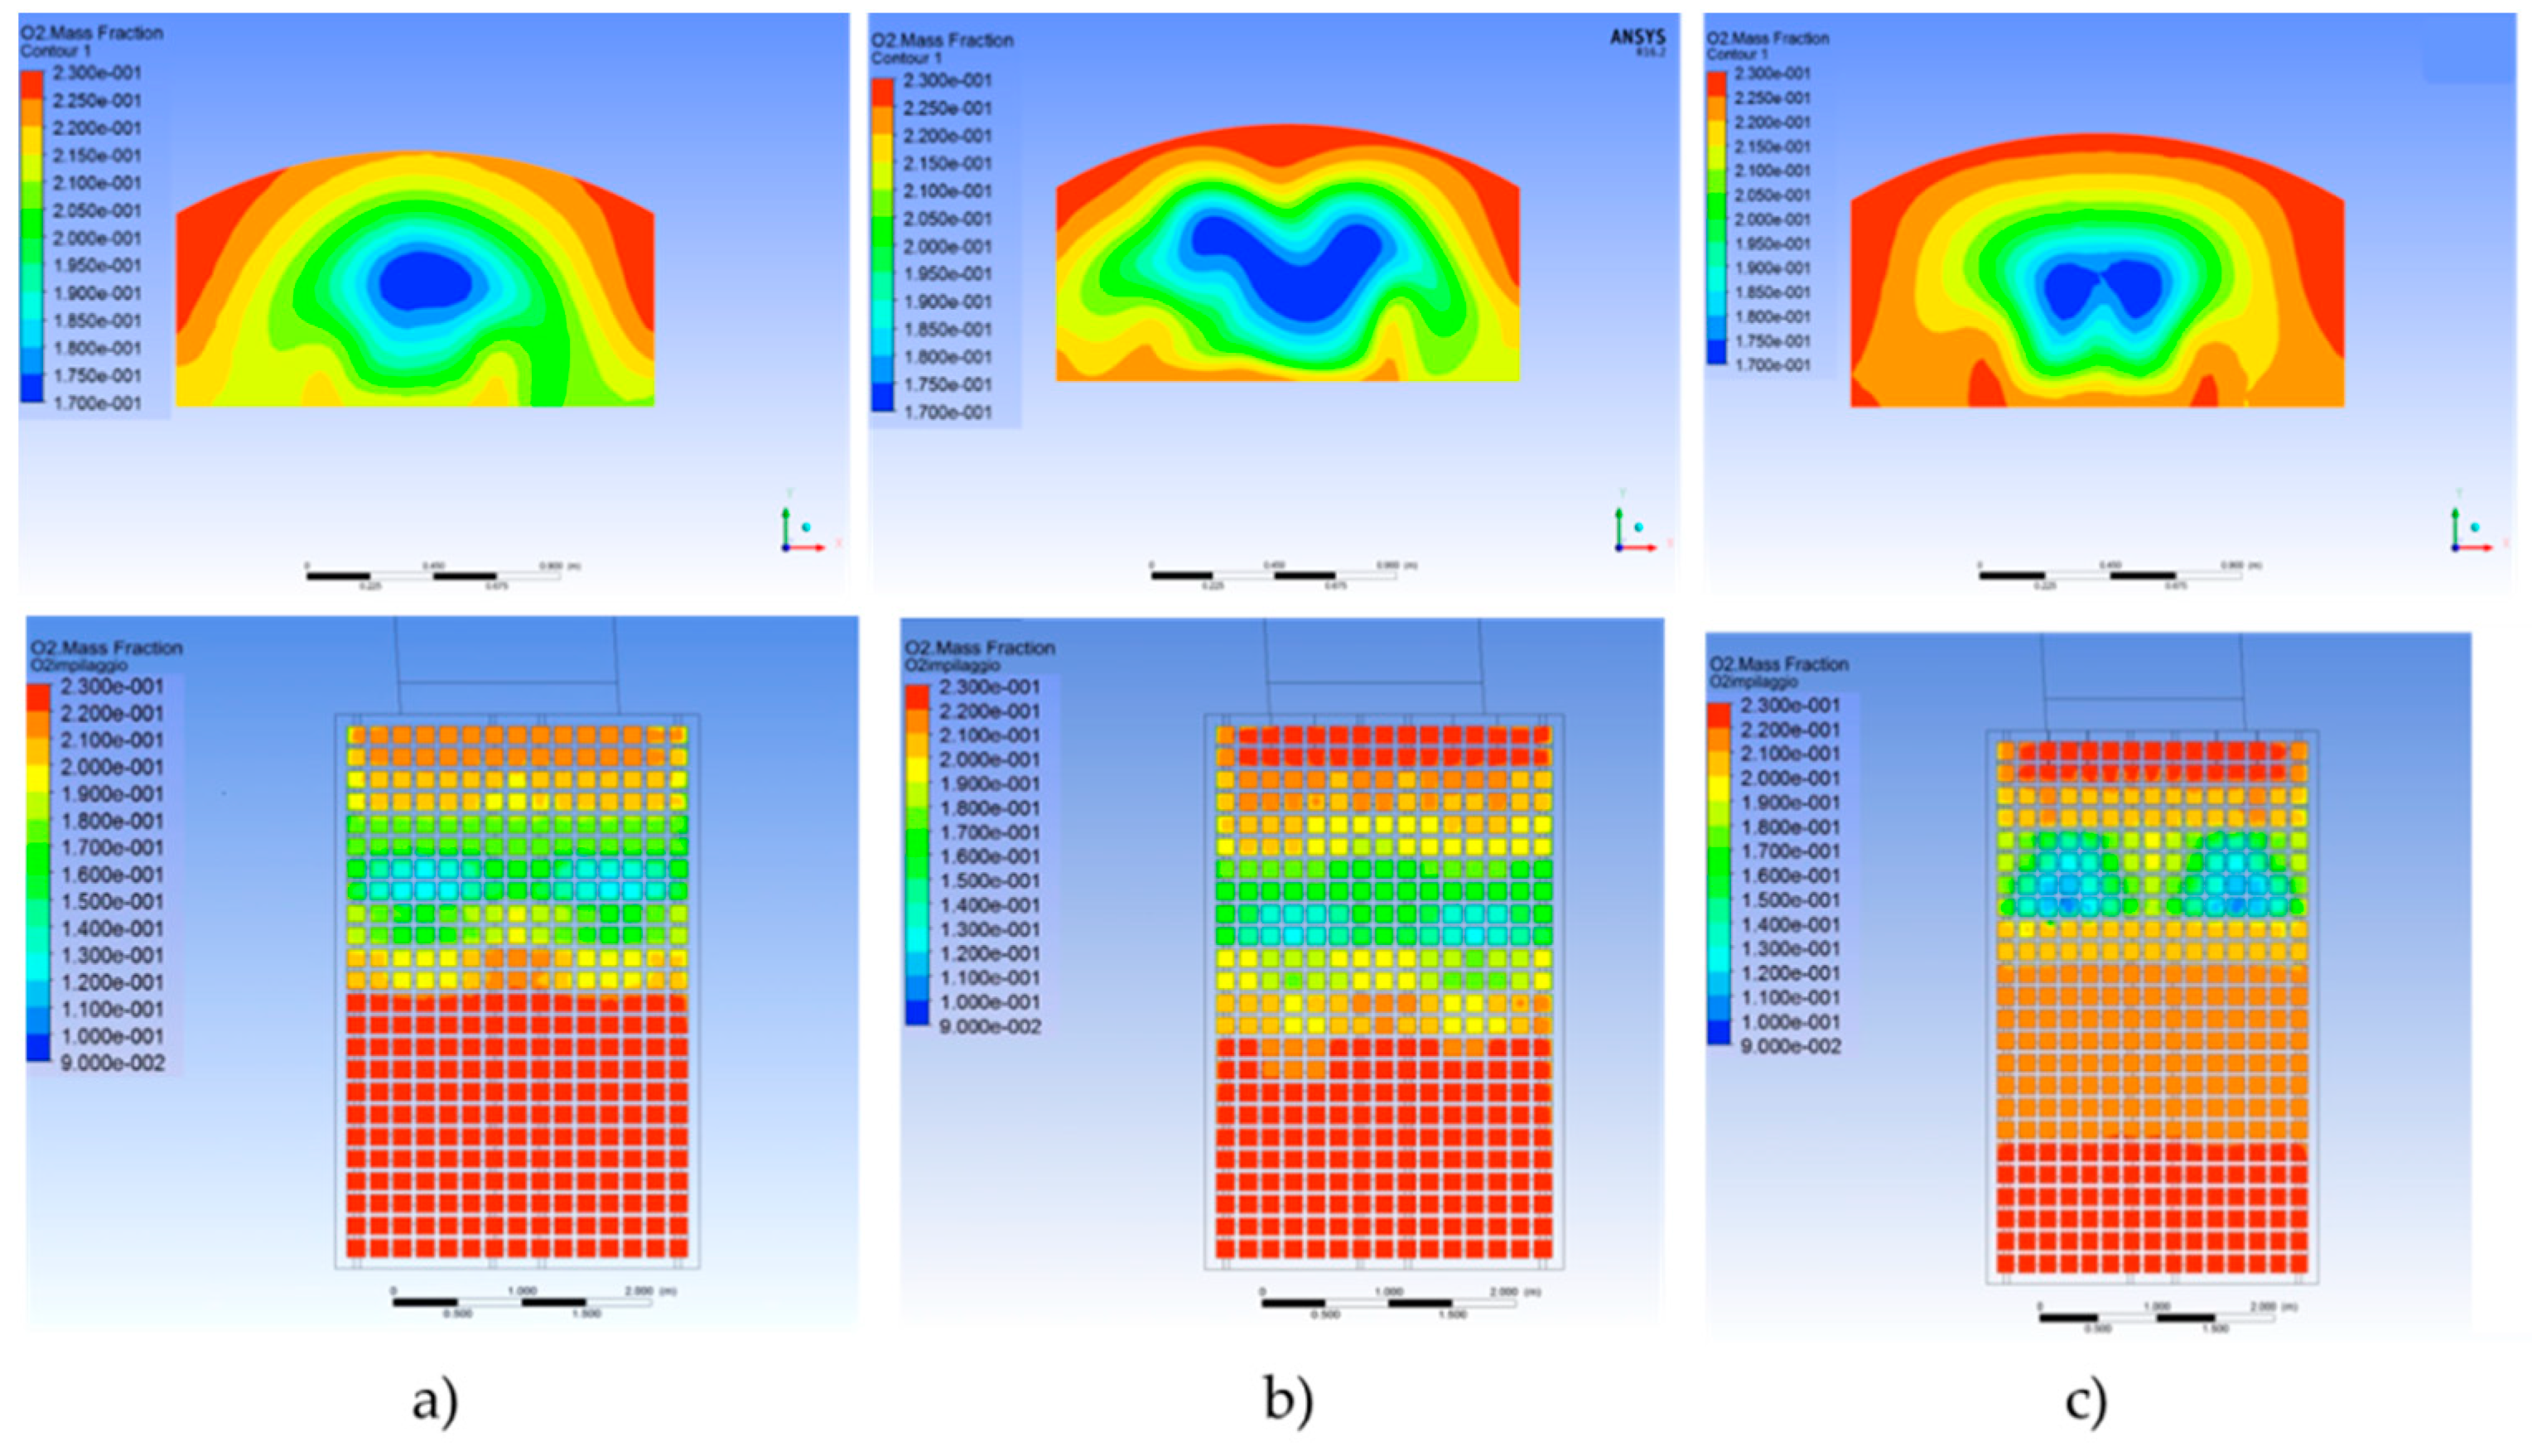
4.1.2. Configuration RC1

The 20% recirculation case is considered. In Figure 10, the O2 mass fractions on the control surfaces are reported together with the contours on the same sections.
A peculiar flow characteristics inside the regenerative chamber is observed. If recirculated mass flow increases the gases tend to reach the deepest part of the bottom chamber and, as a consequence, they flow through a larger area of the checkers. This results in a more uniform distribution at the port outlet section. However, the aim of the strategic exhaust gas recirculation is to get a gas stratification in the lower part of the port: in fact, the burners are located in this zone inside the CC, hence the presence of gases in that area is preferable since they reduce the oxygen content during the combustion. There is a best compromise among the above effects at a given mass recirculation percentage.
In order to quantify the gas distribution in a systematic way, to compare different solutions, the following O2 fraction is averaged in each reference control sections previously identified [14]:
f = Y O 2 a i r Y O 2 Y O 2 a i r Y O 2 g a s 100
The above index gives the local recirculated gas fraction (difference between fixed O2 air value to local value referred to the fixed O2 air value minus the O2 fraction in the incoming mass flow of WGR). The gas composition of the recirculated exhaust gases has been kept constant and therefore the above index f is related to the local amount of gases. Figure 11 reports the averaged values of f in the control areas for both port neck (a) and checkers top section (b). It can be observed that with 20% of WGR the gases stratify in the bottom part of the port neck outlet section with higher values than with 10% WGR. Increasing the percentage (30%) a large amount of gases stratifies to the top. The distributions of f at the chamber top section (Figure 11b) confirm that a larger fraction of gases tends to feed the sections opposite to the port neck at a higher WGR percentage; this is an undesired feature.

4.1.3. Configuration RC2

The geometrical characteristics of RC2 are very different from RC1 (bottom chamber with a different aspect ratio, only one inlet section for air and for the exhaust gasses, the top chamber has a different aspect ratio). The checkers zone is modelled by a set of straight vertical ducts. The air flow rate entering the bottom chamber is approximately a half in respect to the previous case. WGR percentage from 5% to 20% has been considered. In Figure 12, the results from the standard post-processing procedure with a WGR percentage equal to 10% are shown. In Figure 13, the values of f for both port neck (a) and chamber top control sections are reported (b). The WGR percentage of 10% is optimum because it guarantees a high waste gas fraction close to the port neck bottom side (Figure 13a) and also a higher concentration close to the port neck at the chamber top section (Figure 13b).
The appropriate distribution of recirculated gases is also confirmed by the contours of Figure 12, where low values of O2 fraction are identified at the port neck bottom and close to the port neck in the chamber top section.

4.1.4. Configuration RC3

The configuration RC3 has two air/exhaust gas entries and the checkers are modelled as vertical ducts. Results WGR percentage of 20% are discussed. In this case, the required flow structure at both port neck exit and top chamber have been partially obtained as shown in Figure 14.
The above applications have confirmed that the proposed CFD approach with its post-processing procedure are useful to identify the optimal WGR percentage for a given configuration. It is also evident that each configuration needs a tailored WGR system.

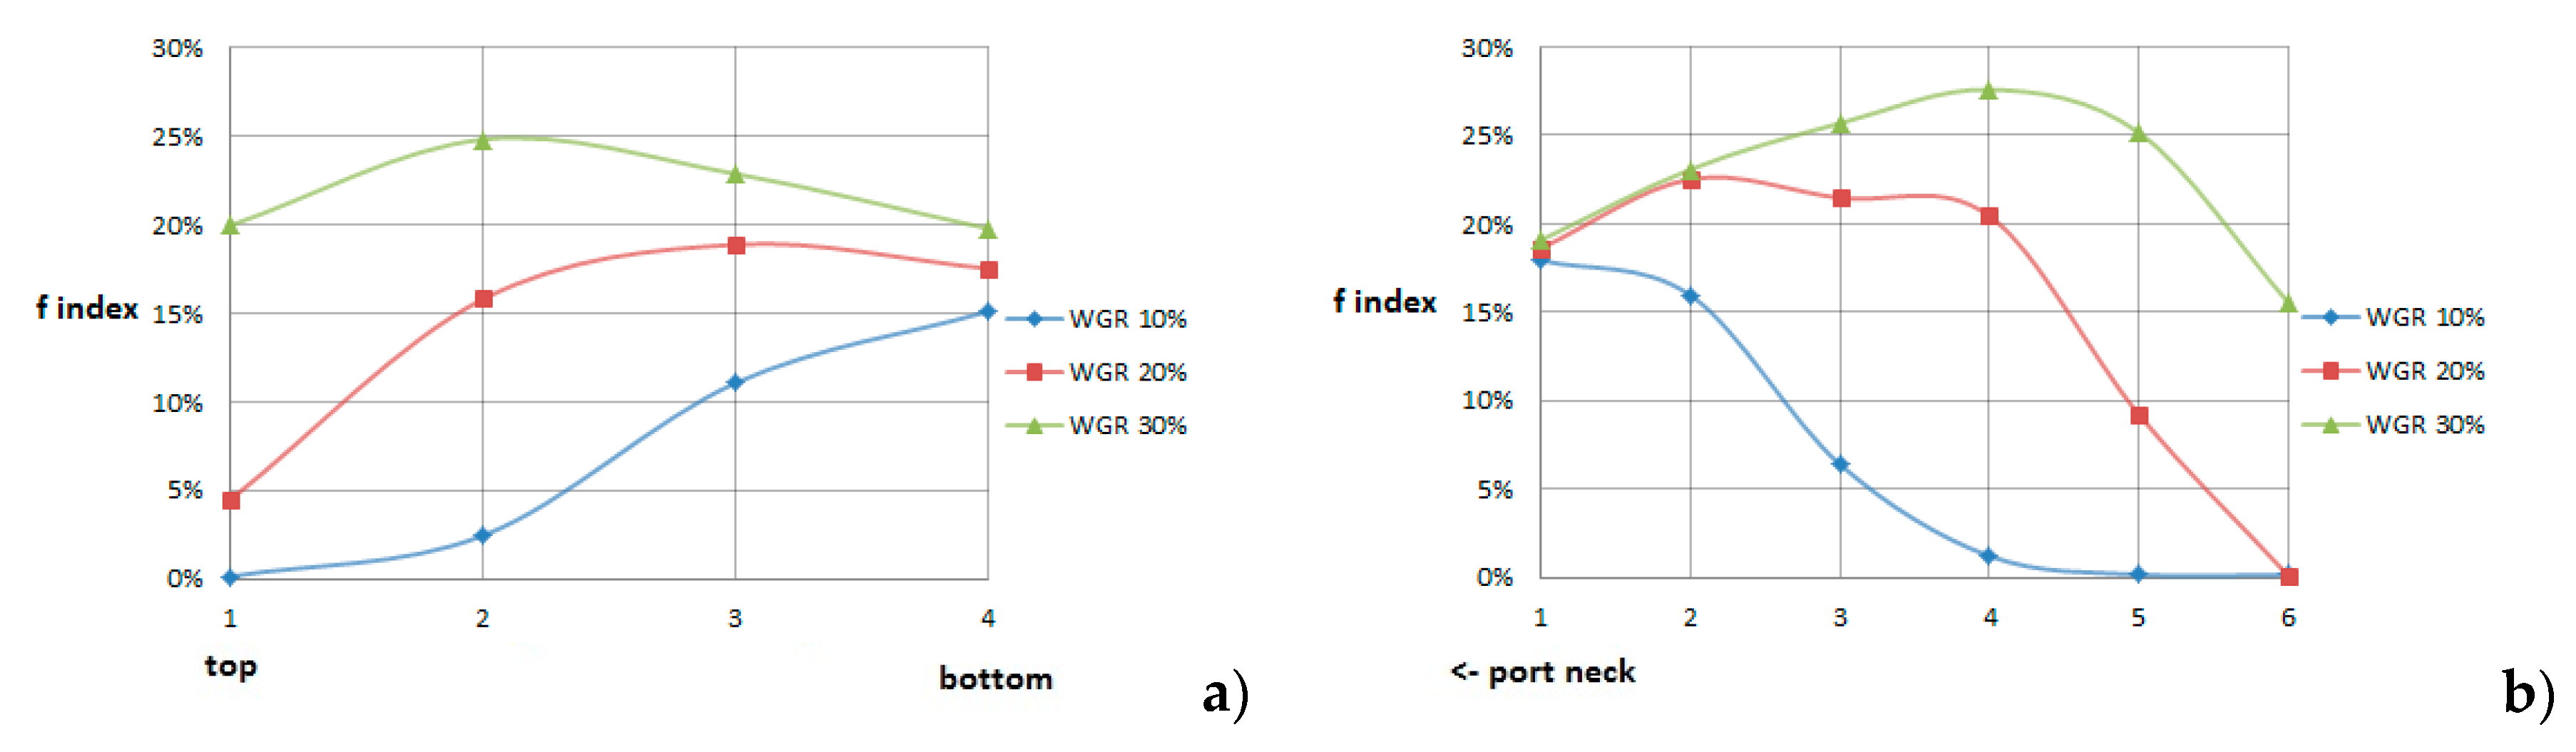
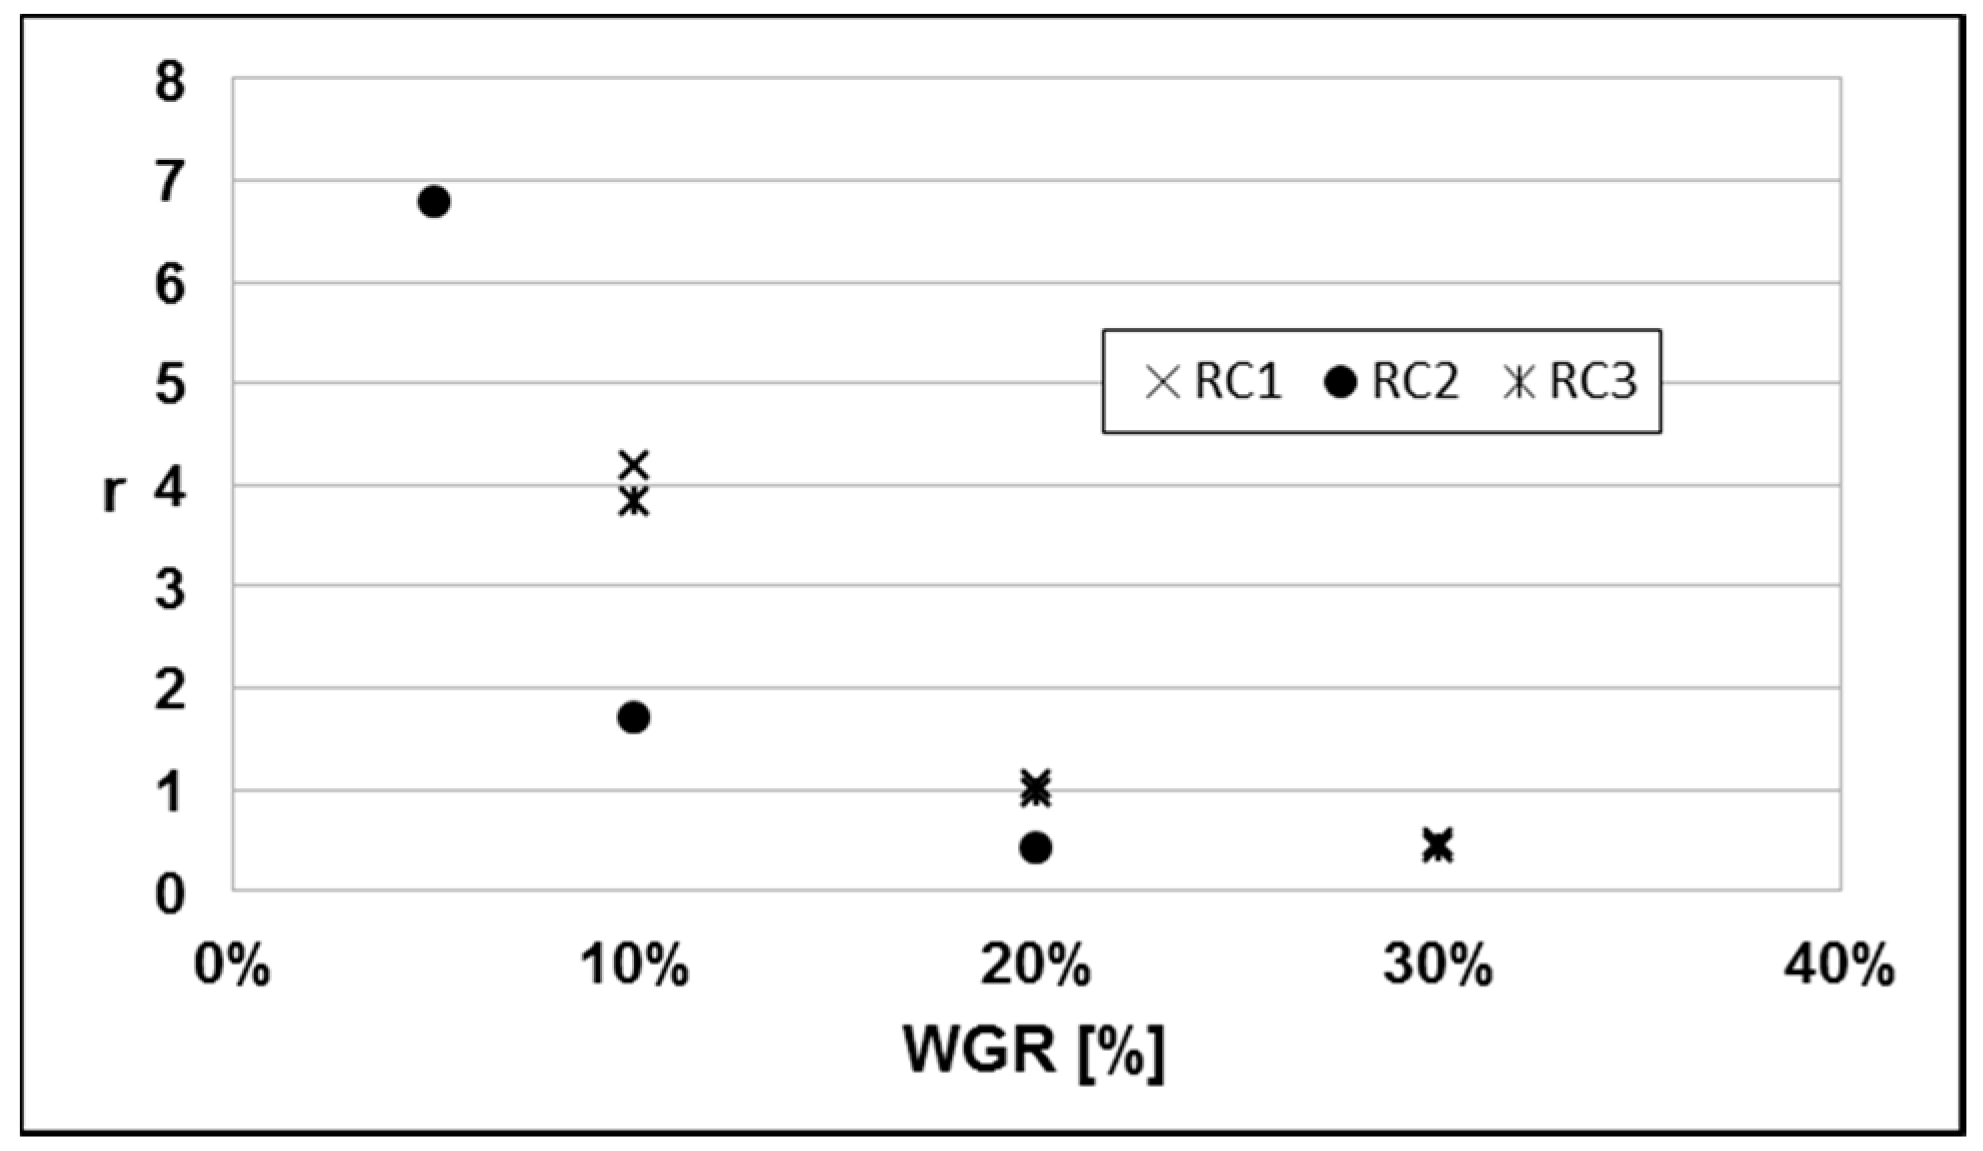
4.1.5. Momentum Index

In order to extract from a 3D CFD simulation as much synthetic and quantitative information as possible (to drive the design of the systems) different indices and correlations have been defined. The values of flow velocity at the inlet sections for both air and gases have been computed and the momentum q = m ˙ v for both streams is obtained. The flow distribution inside the regenerative chamber is related to the momentum of air and of the recirculated gases. The former is fixed while the latter increases with WGR percentage. The optimum distribution of the exhaust gas is influenced by the ratio r = q a i r q g a s between the air and the gas momenta. The values of r obtained for the three different geometries are shown in Figure 15 as a function of the WGR percentage with respect to air.
The above figure shows a good correlation of r for the different configurations. In order to take into account the geometric parameters of the different RC examined, the ratio of the gas inlet section (Agas) with the port neck exit section (Aexit) is introduced in a modified expression for r:
r = r A g a s A e x i t
If the above index r′ is computed for the optimum value of the WGR percentage of each configuration (taking into account the discussion of Section 4.1.2, Section 4.1.3, and Section 4.1.4) a constant value is obtained. The value cannot be given for confidentiality issues. This is a relevant aspect for design purposes. In fact, to design a new configuration the value of the index can be used to set the area ratio with a given design WGR percentage (that in turns fixes r). On the other hand, if the WGR system is added to an existing configuration (the area ratio is known), the value of optimum r′ is used to set the optimum value of r and therefore the WGR percentage.

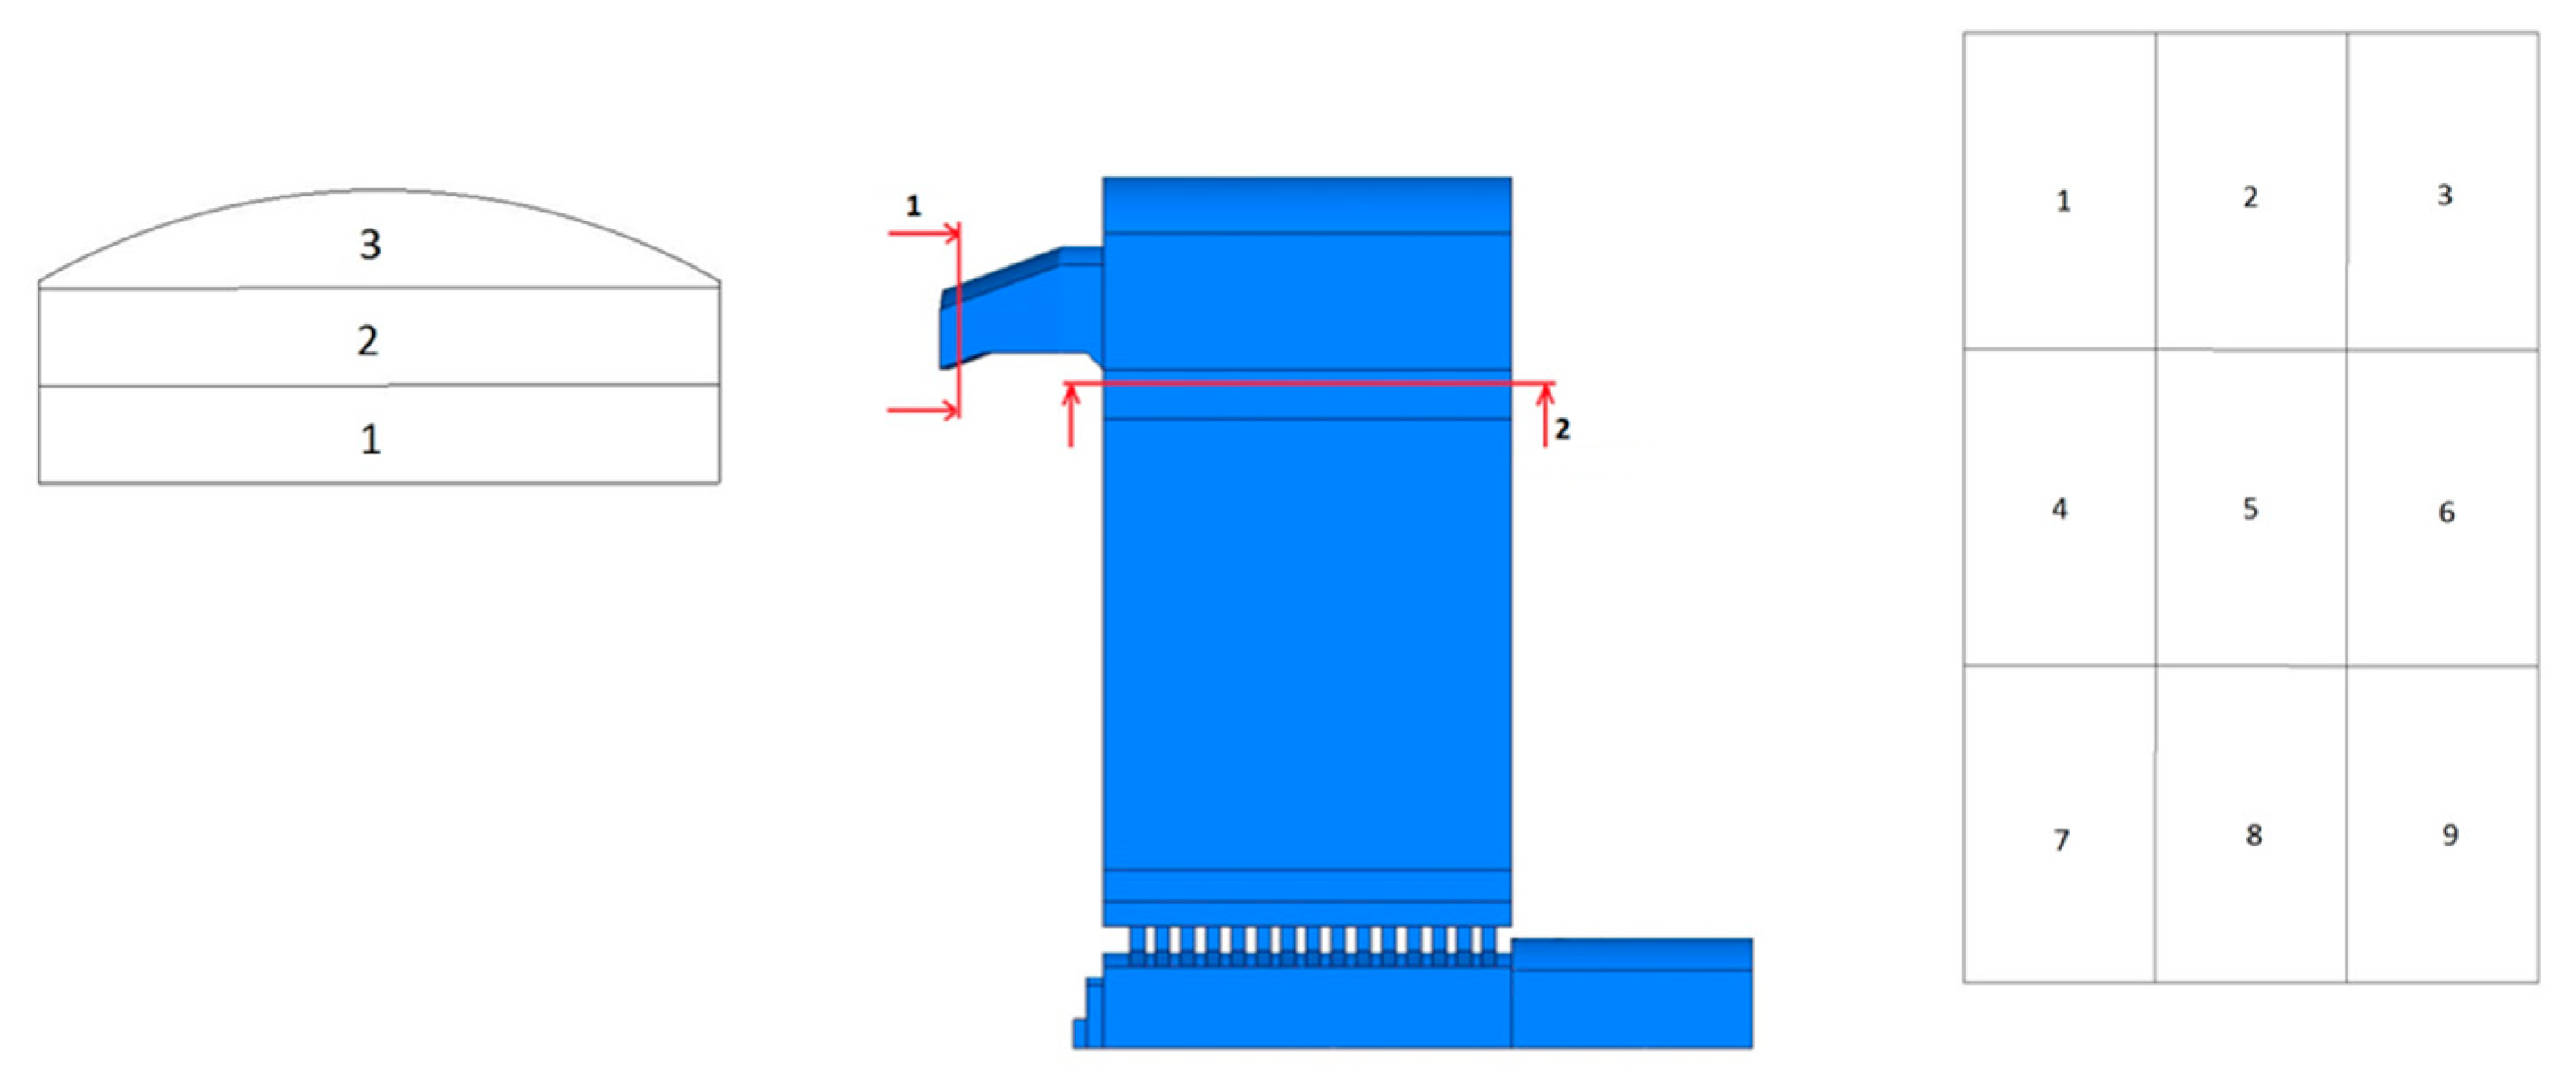
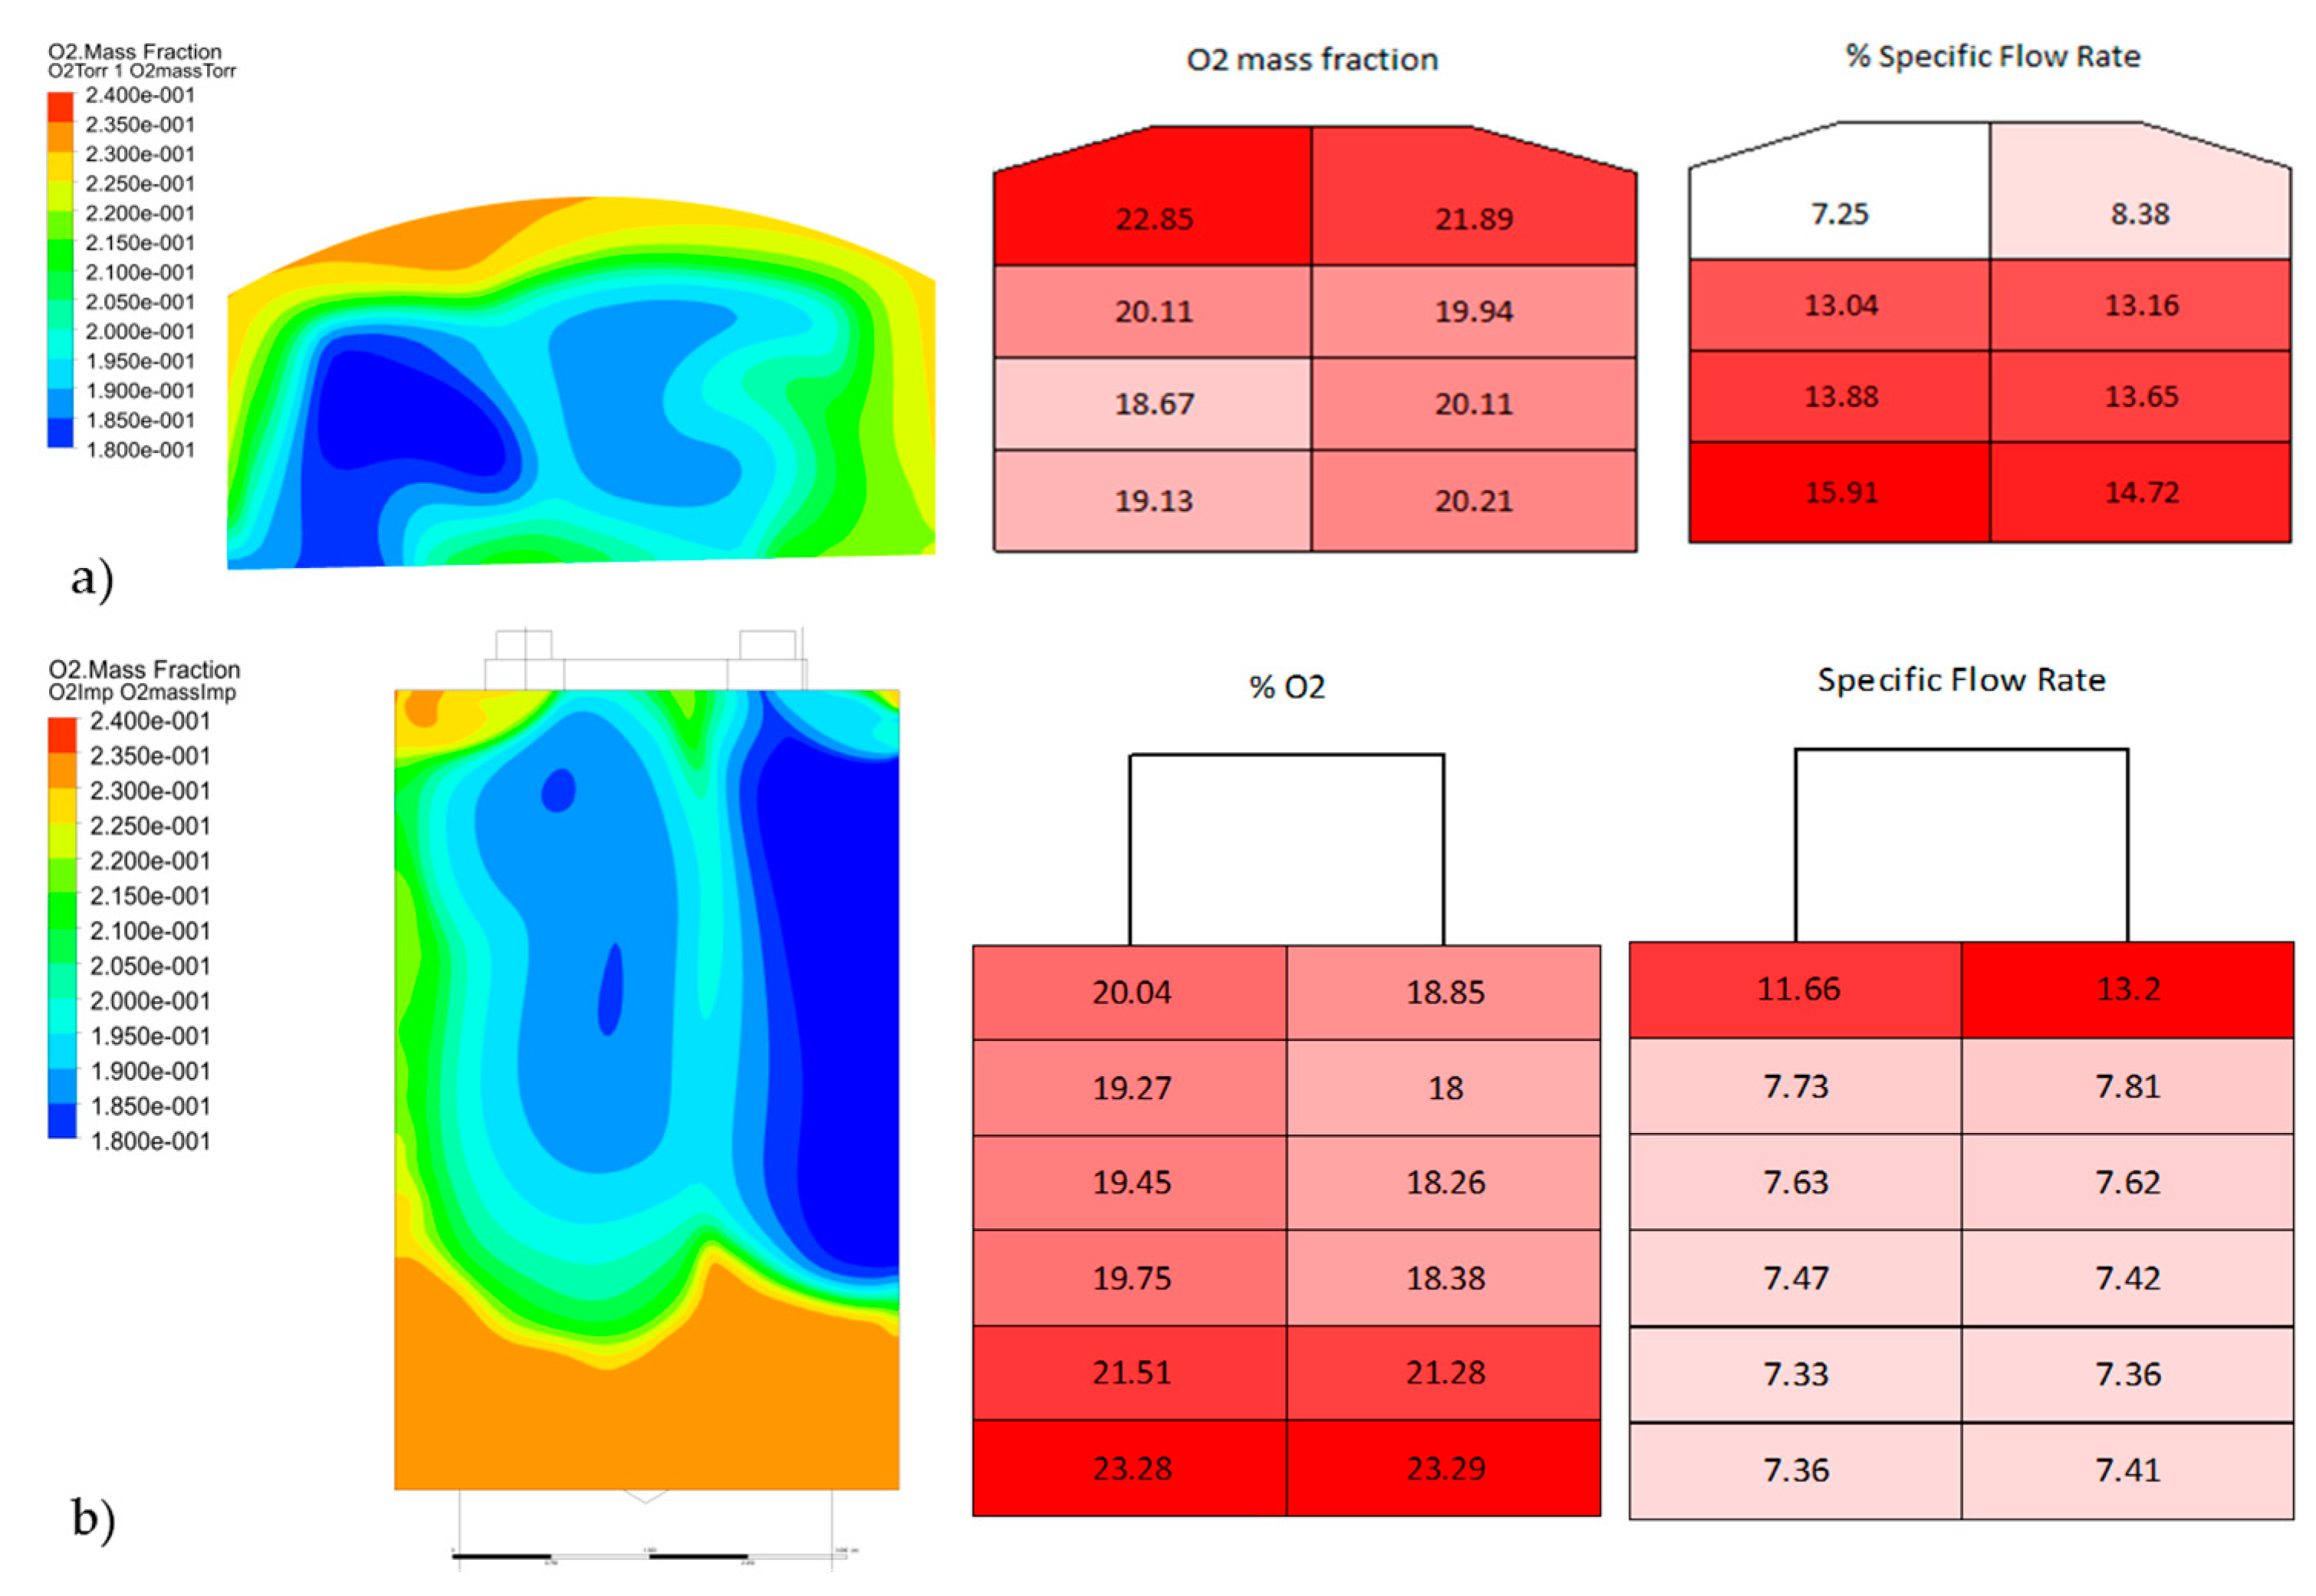
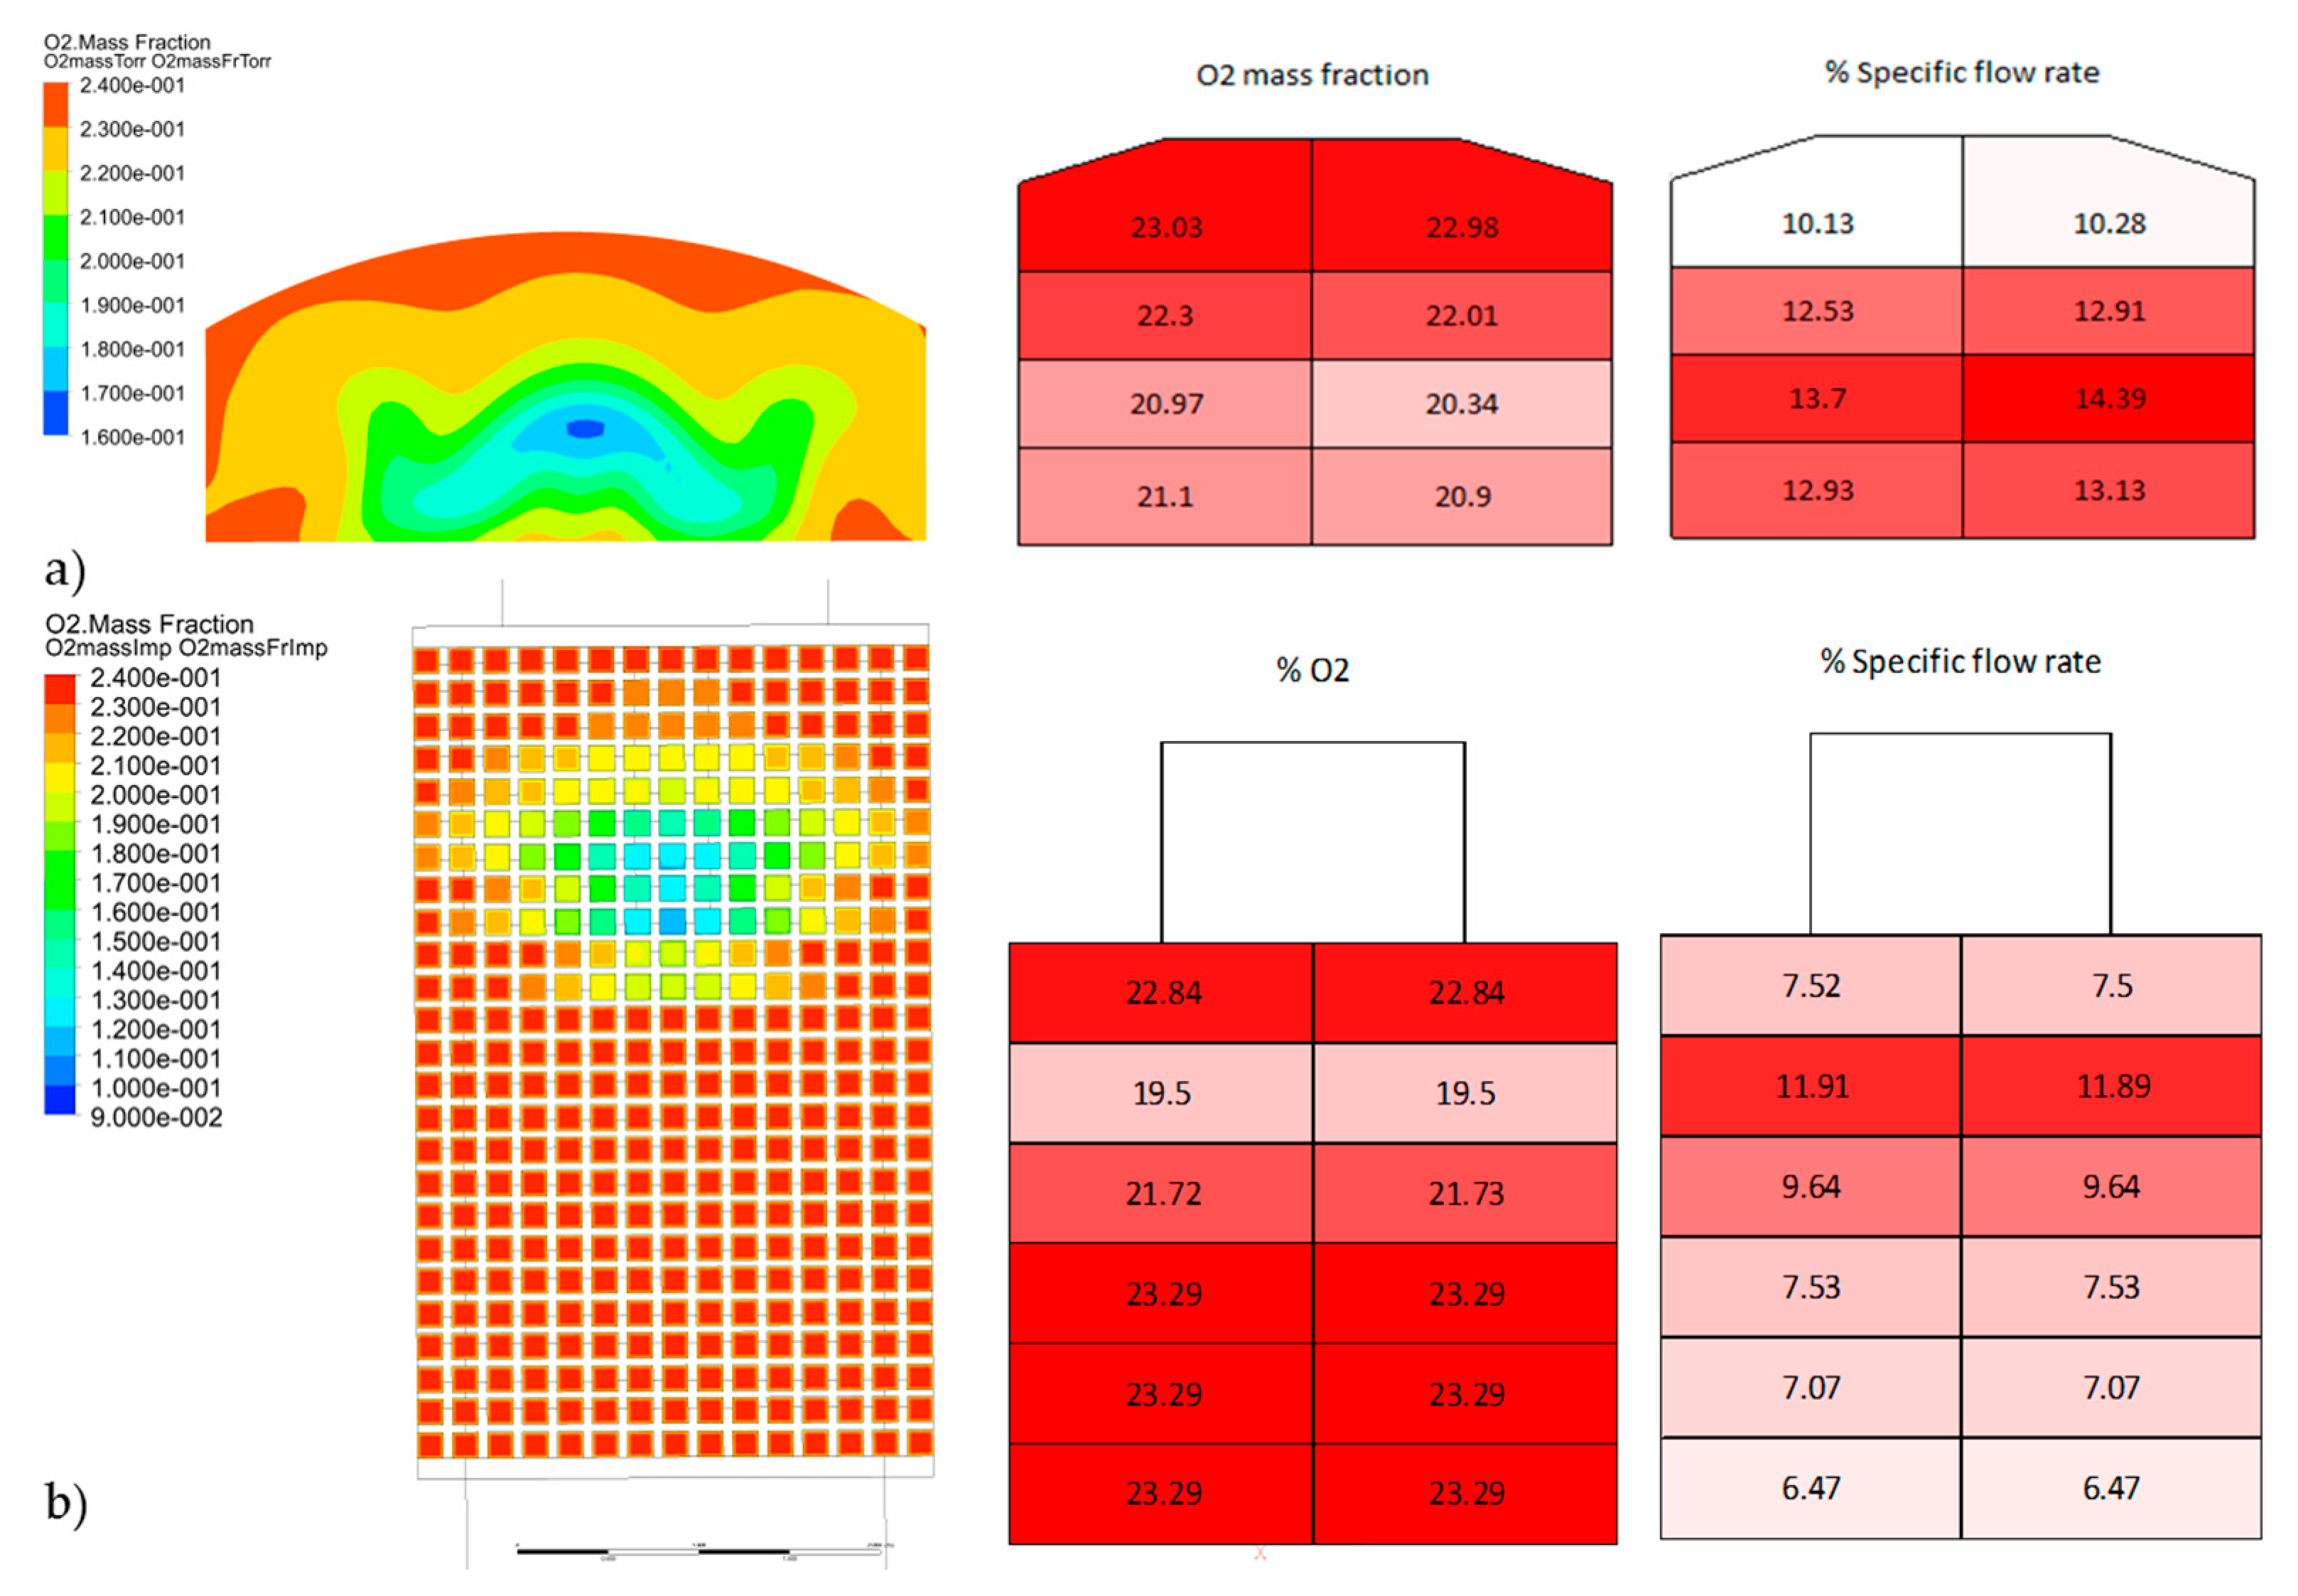
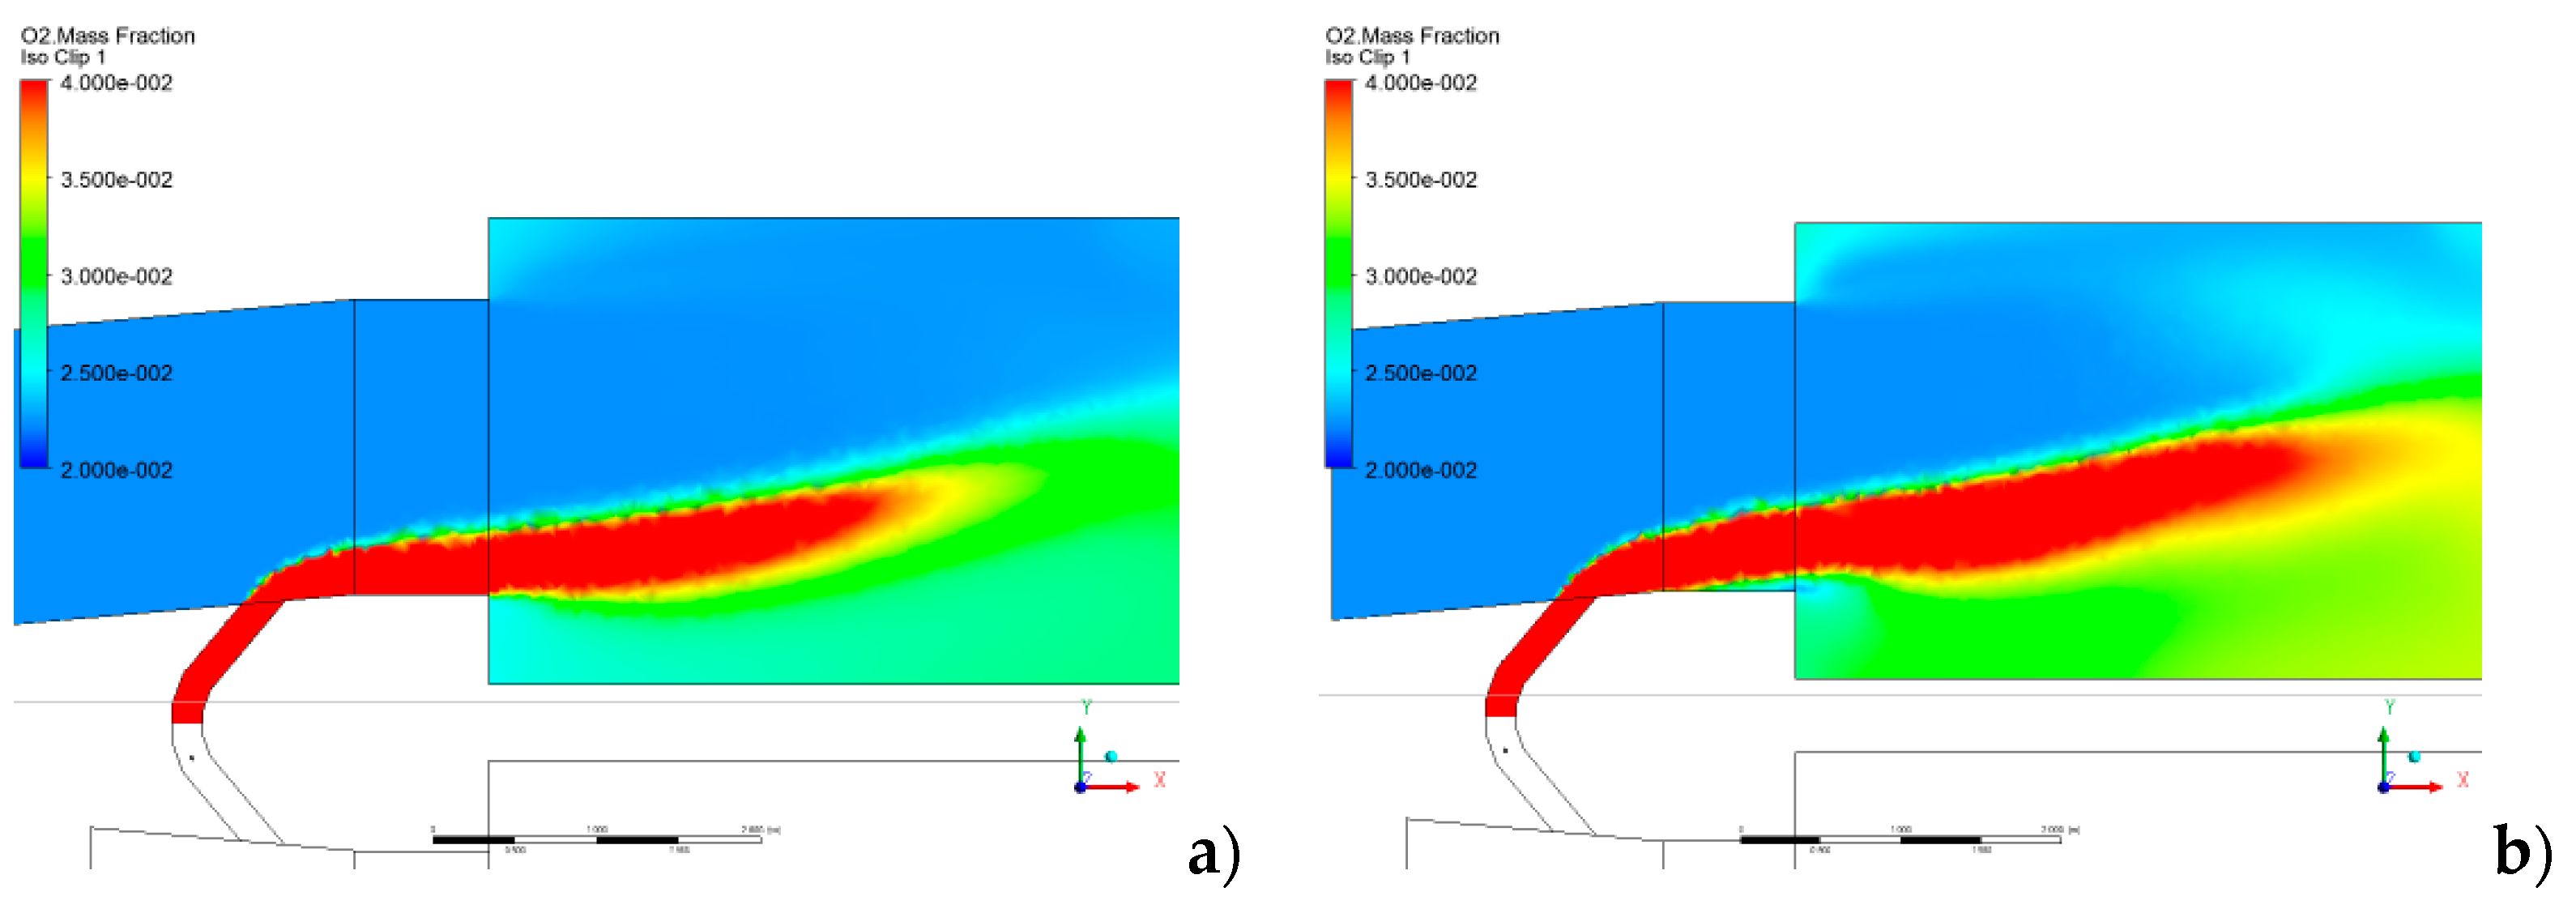
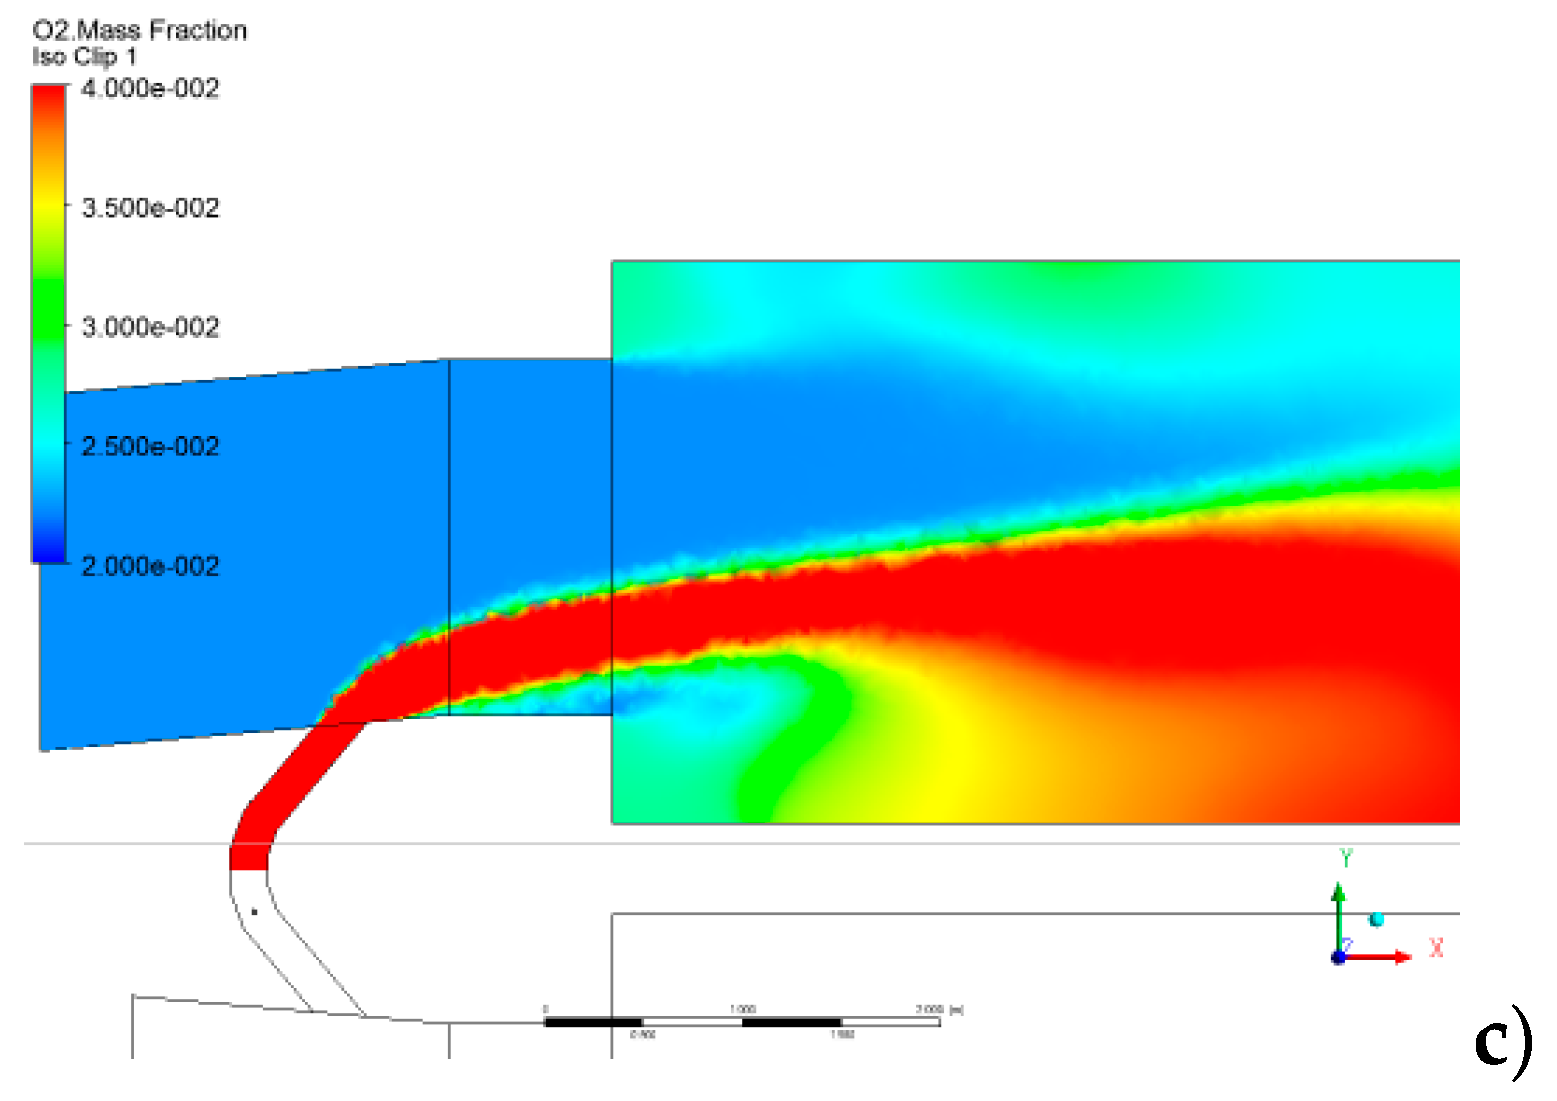
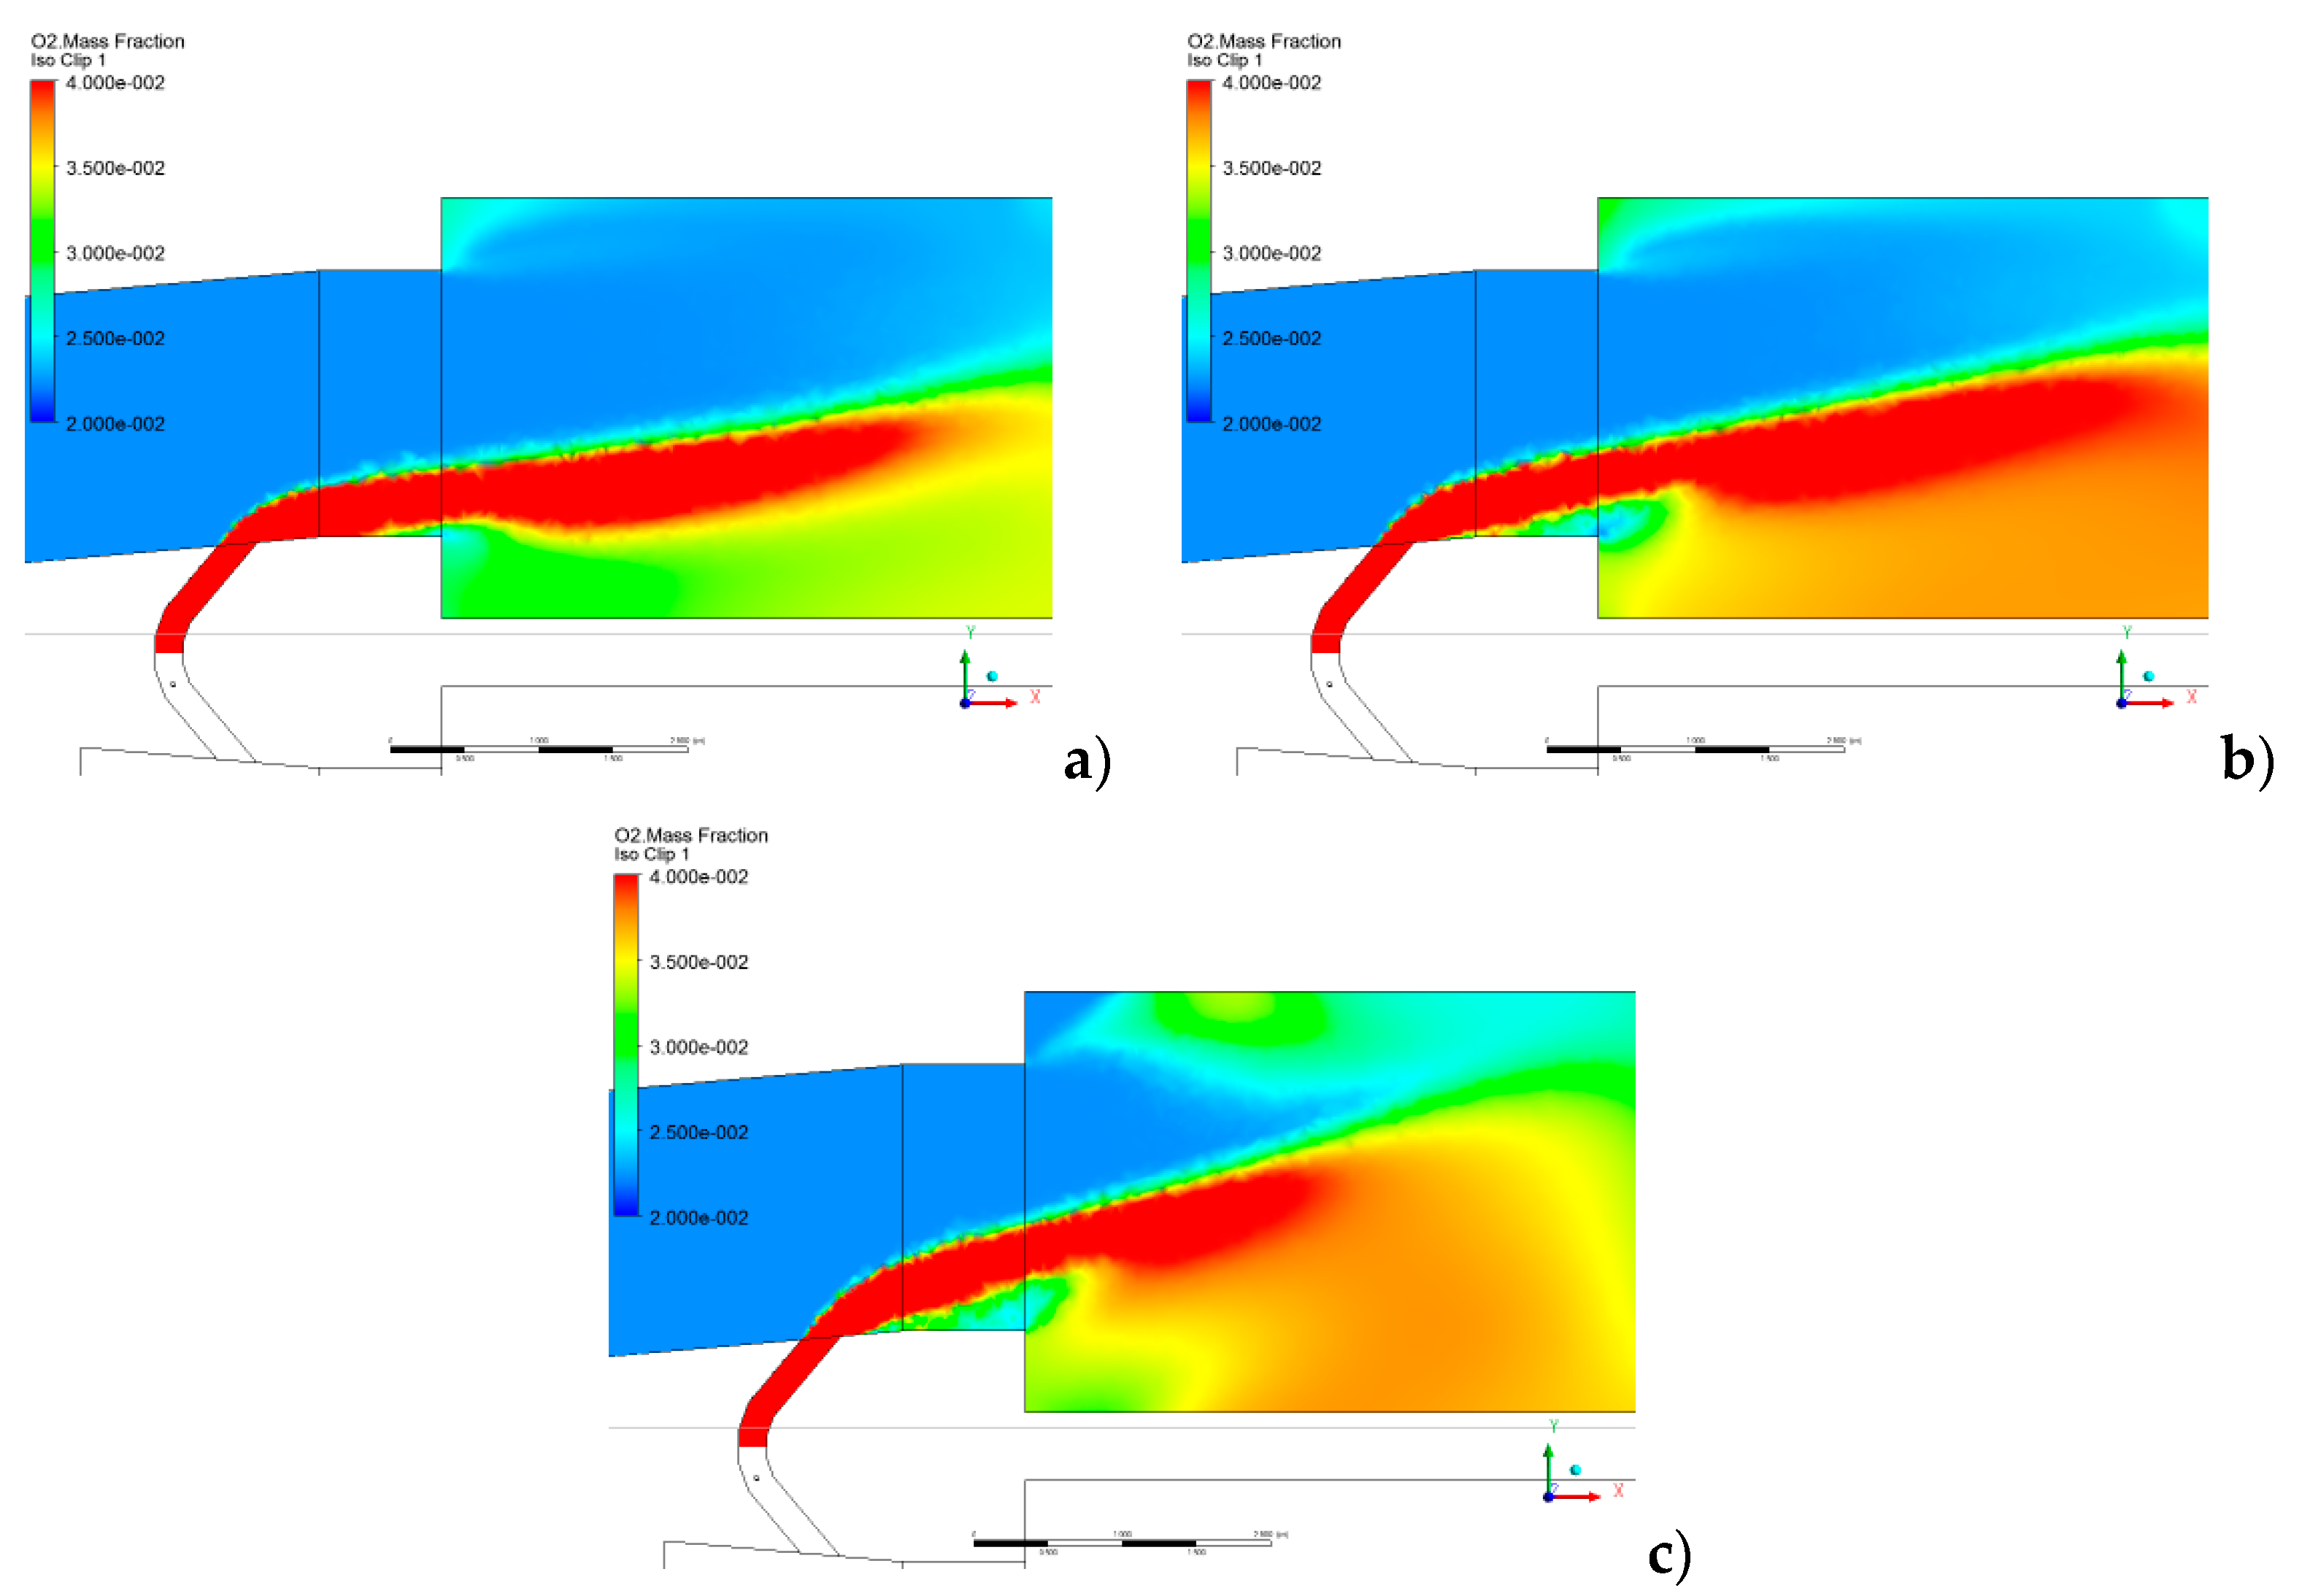
4.1.6. Recirculation System: Regenerative Chamber Inlet Section Details

As shown in previous sections, there is a relation between the distribution of the gases inside the bottom chamber and the resulting stratification of flue gases at the port neck section. The WGR system can be added to an existing operating furnace; therefore the required exhaust gas distribution during WGR activation can be achieved (with a given chamber geometry) with a proper configuration of the gas inlet duct. The shape of the duct will determine the gas penetration inside the chamber and the gas throughflow up to the port neck outlet section. CFD can be effectively used to optimize the inlet duct layout. In the following the application of the CFD model to configuration RC3 with WGR percentage of 20% is discussed for three different duct shapes. The first configuration is a simple rectangular duct that is not introduced into the chamber. The same duct which penetrates into the chamber section for a certain amount defines the second case. A duct with a divergent layout (diffuser) introduced into the chamber defines the third case. The iso-surface of O2 fraction equal to 16% has been used to detect and show the flow structure of the gases inside the regenerative chamber. In Figure 16, the above iso-surface is depicted for the three duct configurations; the picture shows the details at the chamber bottom part and at the chamber top in the port neck zone. This post processing approach, used to systematically compare different solutions, is very effective. The flow structure from configuration RC2, with the straight duct inserted into the chamber, due to the high flow velocity at the duct exit and the squared corners of the duct, develops a vertical structure. Moreover, the high speed at the duct exit give a gas stratification toward the top surface of the port neck, which is not desired. The first and third configurations are preferable. The former is the easiest to consider for the application of the WGR system to an existing operating furnace, the latter is optimized for a new furnace design including WGR system.
In order to have a quantitative comparison between the different solutions, the O2 mass fraction contours at the usual control sections (port neck exit and checkers top surface) are investigated. In Figure 17 the above contours for all configurations are shown.
As it can be seen both the first and the third configurations are quite effective to get the required exhaust gas distribution at the port neck exit; the case with the divergent duct inserted into the chamber gives a very interesting symmetric flow structure at the port neck exit with a core of gases toward the base surface.

4.2. HyAS—Hybrid Air Staging Solution

The hybrid air staging is a gas recirculation strategy operated at the port neck level. In order to control both the recirculated gas mass flow and their mixing into the chamber, a set of two injectors, as previously described, is introduced. For a given geometrical layout, the ratio of the mass flow rates of injected air in the pros and cons injectors needs to be optimized. This can be done with the CFD models developed. For chamber configuration, RC3 series of simulations for the HyAS system with different compressed air ratios have been performed. The first set has a fix mass flow rate of 30 m3/h for the cons injector and a series of three different flow rates for the pros (50 m3/h, 60 m3/h and 80 m3/h). In Figure 18, the contours of O2 mass fraction for a section of the top chamber are plotted.
It can be noticed that as the pros flow rate increases the air penetrates more inside the chamber, and the mixing of the exhaust gasses is enhanced. The second set of simulations has a fixed flow rate of 16 m3/h for the cons injector and the same range of flow rates for the pros. In Figure 19, the contours of O2 mass fraction for a section of the top chamber are plotted.
The beneficial effect of cons mass flow reduction is evident; with a lower mass flow rate of the pros injector a significant mixing in the chamber is obtained.
In Figure 20, a detail of the injectors flow structure is depicted: the cons injector (on the right) is activated because of the cooling purpose, while the pros injector (on the left) drives the recirculating flow and entrains it into the chamber. The CFD model is effective and routinely used for the design and development of the above systems.

5. Conclusions

CFD applied to the glass production field reveals to be an effective approach useful for the design and development of innovative solutions and techniques for NOx reduction based on gas recirculation systems. The authors developed several CFD procedures for the simulation of the regenerative chambers and the exhaust gas recirculation systems. Special attention has been paid on the development of systematic approach for post-processing of the CFD results in order to quantitatively compare different possible solutions. With this approach, the CFD technology becomes an effective tool for design and development. In the case of WGR systems, the recirculated mass flow, for a given geometrical layout, can be determined using CFD. A synthetic index to drive the WGR design has been identified from the systematic use of the simulation approach. For the HyAs, CFD is useful to set the amount of compressed air necessary for a proper mixing and post-combustion of the exhaust gases. Also, for these configurations, the systematic use of CFD supports the design process and is effective in understanding the management strategies of the HyAS system.

Author Contributions

All authors have equally contributed to the development of this research paper.

Funding

This research was funded within the PRIMEGLASS European Project (LIFE12 ENV/IT/001020) framework

Conflicts of Interest

The authors declare no conflict of interest.

Nomenclature

AArea
fIndex of local recirculated gas
mMass flow rate [kg/s]
qMomentum [kg m/s2]
rMomentum ratio
r′Momentum index
vVelocity [m/s]
ρDensity [kg/m3]
[X]Molar fraction
YXMass fraction
Acronyms
CCCombustion Chamber
CFDComputational Fluid Dynamics
HRSHeat Recovery System
HyASHybrid Air Staging
RCRegenerative Chamber
WGRWaste Gas Recirculation

References

  1. Zeldovich, Y.B. The oxidation of nitrogen in combustion explosions. Acta Physiochim. 1946, 21, 577–628. [Google Scholar]
  2. Skalska, K.; Miller, J.S.; Ledakowicz, S. Trends in NOx abatement: A review. Sci. Total Environ. 2010, 408, 3976–3989. [Google Scholar] [CrossRef] [PubMed]
  3. Scalet, B.M.; Garcia Muñoz, M.; Sissa, A.Q.; Roudier, S.; Delgado Sancho, L. “Best Available Tecniques (BAT) Reference Document for The Manufacture of Glass”, Industrial Emission Directive 2010/75/EU. Integrated Pollution Prevention and Control; Joint Research Centre (JRC): Seville, Spain, 2013. [Google Scholar]
  4. LIFE Project “LIFE 12 ENV/IT/001020”. Available online: http://ec.europa.eu/environment/life/project/Projects (accessed on 18 June 2019).
  5. PRIMEGLASS LIFE Project. Available online: http://www.primeglass.it/ (accessed on 18 June 2019).
  6. Zarrinehkafsh, M.T.; Sadrameli, S.M. Simulation of fixed bed regenerative heat exchangers for flue gas heat recovery. Appl. Therm. Energy 2004, 24, 373–382. [Google Scholar] [CrossRef]
  7. Yakinthos, K.; Missirlis, D.; Sideridis, A.; Vlahostergios, Z.; Seite, O.; Goulas, A. Modelling operation of system of recuperative heat exchangers for aero engine with combined use of porosity model and thermo-mechanical model. In Engineering Applications of Computational Fluid Mechanics; Taylor & Francis: Boca Raton, FL, USA, 2012; Volume 6, pp. 608–621. [Google Scholar]
  8. Sardeshpande, V.; Anthony, R.; Gaitonde, U.N.; Banerjee, R. Performance analysis for glass furnace regenerator. Appl. Energy 2011, 88, 4451–4458. [Google Scholar] [CrossRef]
  9. Reboussin, Y.; Fourmigué, J.F.; Marty, P.; Citti, O. A numerical approach for the study of glass furnace regenerators. Appl. Therm. Energy 2005, 25, 2299–2320. [Google Scholar] [CrossRef] [Green Version]
  10. Basso, D.; Cravero, C.; Reverberi, A.P.; Fabiano, B. CFD Analysis of regenerative chambers for energy efficiency improvement in glass production plants. Energies 2015, 8, 8945–8961. [Google Scholar] [CrossRef]
  11. Cravero, C.; Marsano, D. Numerical simulation of regenerative chambers for glass production plants with a non-equilibrium heat transfer model. WSEAS Trans. Heat Mass Transf. 2017, 12, 21–29. [Google Scholar]
  12. Cogliandro, S.; Cravero, C.; Marini, M.; Spoladore, A. Simulation strategies for regenerative chambers in glass production plants with strategic exhaust gas recirculation system. IIETA Int. J. Heat Technol. 2017, 35, S449–S455. [Google Scholar] [CrossRef]
  13. Spliethoff, H.; Greul, U.; Rodiger, H.; Hein, K.R.G. Basic effects on NOx emissions in air staging and reburning at a bench-scale test facility. Fuel 1996, 75, 560–564. [Google Scholar] [CrossRef]
  14. De Domenico, D. Development of CFD Procedure for Exhaust Gas Recirculation Strategies in Glass Production Plants. Master’s Thesis, University of Genova, Genova, Italy, 2018. [Google Scholar]
Figure 1. Regenerative End-Port glass production furnace.
Energies 12 02455 g001
Figure 2. (a) Regenerative tower and (b) Waste Gas Recirculation (WGR) system scheme.
Energies 12 02455 g002
Figure 3. Schematic view of air stage solutions: (a) cold, (b) hot, (c) hybrid.
Energies 12 02455 g003
Figure 4. Tested regenerative chambers.
Energies 12 02455 g004
Figure 5. Mesh section of the RC3 regenerative chamber—(a) bottom, (b) top.
Energies 12 02455 g005
Figure 6. Control sections and experimental grid.
Energies 12 02455 g006
Figure 7. Comparison between experimental and Computational Fluid Dynamics (CFD) data for 10% WGR—O2 mole fraction.
Energies 12 02455 g007
Figure 8. Comparison between experimental and CFD data for 20% WGR—O2 mole fraction.
Energies 12 02455 g008
Figure 9. Comparison between experimental and CFD data for 30% WGR—O2 mole fraction.
Energies 12 02455 g009
Figure 10. O2 mass fraction and specific flow rate for 20% WGR—(a) port neck section (b) checkers section.
Energies 12 02455 g010
Figure 11. (a) Exhaust mean gas fraction at the port neck (b) and at the checkers section.
Energies 12 02455 g011
Figure 12. O2 mass fraction and specific flow rate for 10% WGR—(a) port neck section (b) checkers section.
Energies 12 02455 g012
Figure 13. (a) Exhaust mean gas fraction at the port neck and (b) at the checkers section.
Energies 12 02455 g013
Figure 14. O2 mass fraction and specific flow rate for 20% WGR—(a) port neck section (b) checkers section.
Energies 12 02455 g014
Figure 15. Momentum ratio between air and recirculated gases at inlet sections.
Energies 12 02455 g015
Figure 16. Iso-surface 16% O2 mass fraction top and bottom—(a) simple duct (b) long duct (c) divergent duct.
Energies 12 02455 g016
Figure 17. O2 mass fraction contours—(a) first case (b) second case (c) third case.
Energies 12 02455 g017
Figure 18. O2 mass fraction at the top chamber cons massflow 30 m3/h—(a) 50 m3/h (b) 60 m3/h (c) 80 m3/h.
Energies 12 02455 g018aEnergies 12 02455 g018b
Figure 19. O2 mass fraction at the top chamber cons massflow 16 m3/h—(a) 50 m3/h (b) 60 m3/h (c) 80 m3/h.
Energies 12 02455 g019
Figure 20. Detail of the flow structure—pros and cons injector flow streamlines.
Energies 12 02455 g020
Table 1. Geometrical parameters of the tested regenerative chambers.
Geometrical ParametersRC1RC2RC3
Aexhaust/Aair0.10.050.08
Aexhaust/Aexit0.160.10.17
Bottom chamber aspect ratio2.23.94
Top chamber aspect ratio1.61.51.6
Table 2. Subdomains and mesh characteristics.
SubdomainsMesh Typen° of Elements
Bottom chamber Energies 12 02455 i001Struct.2M–4M
Arches Energies 12 02455 i002Struct.500 k
Checkers zone Energies 12 02455 i003Struct.1M–2M
Top chamber Energies 12 02455 i004Struct.1M–2M

