Article

Data-Driven Evaluation of Residential HVAC System Efficiency Using Energy and Environmental Data

1
Department of Civil Construction and Environmental Engineering, Iowa State University, Ames, IA 50011, USA
2
Faculty of Project Management, The University of Danang-University of Science and Technology, Danang 50000, Vietnam
*
Author to whom correspondence should be addressed.
Energies 2019, 12(1), 188; https://doi.org/10.3390/en12010188
Submission received: 2 December 2018 / Revised: 31 December 2018 / Accepted: 4 January 2019 / Published: 8 January 2019
(This article belongs to the Special Issue Energy Efficiency in Buildings: Both New and Rehabilitated)

Abstract

:
In the U.S., the heating, ventilation, and air conditioning (HVAC) system is generally the largest electricity-consuming end-use in a residential building. However, homeowners are less likely to have their HVAC system serviced regularly, thus inefficiencies in operation are also more likely to occur. To address this challenge, this research works towards a non-intrusive data-driven assessment method using building assessors’ data, HVAC electricity demand data, and outdoor environmental data. Building assessors’ data is first used to estimate the HVAC system size, then estimate the electricity demand curve of the HVAC system. A comparison of the proposed electricity demand curve development method demonstrates strong agreement with physics-based HVAC model results. An HVAC efficiency rating is then proposed, which compares the model-predicted and actual performance data to define whether an HVAC system is operating as expected. As a case study, detailed data for 39 occupied, conditioned residential buildings in Austin, Texas, was used demonstrating the identification of the presence of potential HVAC inefficiencies. The results prove beneficial for utilities to help target residential HVAC systems in need of service or energy efficiency upgrades, as well as for homeowners as a continuous assessment tool for HVAC performance.

1. Introduction

Residential building electricity consumption makes up approximately 40% of total electricity use in the U.S. [1,2]. Many factors impact the electricity use in residential buildings, including weather conditions, building size, building characteristics such as window and building envelope properties, air infiltration and ventilation, occupant behavior, and occupant-dependent end-uses, among others [3,4]. However, in the U.S., the heating, ventilation, and air conditioning (HVAC) system is among the largest electricity-consuming end-use in a home [5]; its electricity demand is associated with the amount of heat gains and losses in a building, as well as its size, efficiency, thermostat setpoints, and the local environmental conditions in which it operates.
The completion of a home energy audit or HVAC system tune-up is among the most common methods used to assess residential HVAC system energy efficiency and performance [6] and are often completed by a service technician who comes to the residence in person for an on-site evaluation of HVAC operations. Based on the results, recommendations of how to improve inefficiencies of the HVAC system are then made to the homeowner. This is often done by or in collaboration with programs in many utility companies that provide incentives and rebates for more energy-efficient HVAC systems or other upgraded components [7].
However, the main challenge when achieving efficiency improvements for HVAC systems in residential buildings is the periodic occurrence of inefficiencies, i.e., faults, that still allow the HVAC system to run, but in a less efficient way. These faults likely go undetected, until either the system is serviced, or the inefficiency is corrected, or until a more catastrophic failure occurs and the system is replaced. However, unlike commercial systems, most homeowners do not have their HVAC system regularly serviced [8,9], and rather, they service their system when something occurs that renders the system non-operational. As a result, survey results indicate that a large number of residential HVAC systems are considered to be operating in a faulty state [9]. This typically impacts both the electricity demand (kW) associated with the operation of the system, as well as the cycle length (minutes) associated with the system’s on–off operation. Therefore, to overcome the barrier of requiring a visit from an HVAC technician and homeowner time to assess the efficiency of operation of a system, it is beneficial to have a less intrusive and more frequent method to evaluate the operational efficiency of an HVAC system in a residential building.
The body of literature in fault detection of HVAC systems focuses mostly on commercial buildings, particularly given that a continuous service model is more common for more expensive commercial HVAC systems. However, some previous research efforts have explored the possibilities of fault detection and diagnostics for packaged unitary systems, which include mini split systems for residential buildings, and roof top units (RTUs) for small commercial buildings [10,11,12]. However, most of the literature has focused on roof top units for light commercial buildings. A limited number have focused specifically on residential heat pumps and mini split systems [10,12,13]. Common faults cited in the literature include high or low refrigerant charge, and airflow restrictions to the condenser/evaporator; others include refrigerant line restrictions, expansion valve failure, the presence of non-condensable, short cycling, and/or sensor failures [10,12,13].
To determine the occurrence of faults, these studies measured a range of variables, including environmental parameters (e.g., indoor and outdoor air temperature, dew point, relative humidity), and HVAC system-dependent parameters (e.g., refrigerant flow rate, pressure, and temperature, power, and air flow rate and pressure). These parameters are measured for use in determining HVAC efficiency and/or capacity. However, the collection of data on these variables requires additional sensors be placed for data collection in a home. Most methods have not considered the use of energy data to assess HVAC performance.
Due to the development and implementation of many state-of-the-art technologies such as smart meters and home energy management systems [14], as well as the now ubiquitous availability of the internet and cloud storage, computing, obtaining, storing, and processing data related to the energy performance of residential systems, while still challenging, has become more accessible in recent years. This availability has also benefited from the wider spread and commercialization of technologies that can reliably collect energy/electricity data [15]. Data can be collected at different frequencies depending on the technology utilized for data collection. Frequencies vary from monthly, hourly, 15-min, or 1-min intervals, with some technologies providing data at the second and sub-second level. Other data to support the evaluation of the operation of an HVAC system, including indoor environmental conditions, is also more easily collected, stored, and accessed from smart thermostats. Smart thermostat and/or energy consumption data, however, while typically available to an individual homeowner, is not typically publicly available for large-scale analysis. Utility companies have access to their customers’ energy data, or service providers and/or manufacturers, also have or could be granted access to such data by a homeowner. Weather data continues to be available from various public sources, such as ground-based weather stations (GBWS). Additionally, significant improvements have also been made in availability of satellite-based weather data available in more locations than GWBS (e.g., [16]). Finally, assessors’ data which provides basic residential building characteristics, is publicly available information in the U.S.
This research, thus, focuses on the development of a methodology that uses assessor’s data, energy data, and weather data to, first, predict residential HVAC electricity demands as a function of environmental conditions. This is ultimately used to assess the efficiency of operation of the HVAC system itself, independent of the influence that occupants may have on HVAC operation. More specifically, when looking at the information that can be extracted from an electricity use signal of an HVAC system, the electricity demand (kW) when the system is on depends only on the characteristics of the HVAC system itself and the environmental conditions in which it is operating. Runtime values and electricity consumption also depend on the characteristics of the HVAC system, but are also dependent on the interior temperature setpoints set by occupants, and occupant behavior. Therefore, the focus of this work is on electricity demand as a proxy for evaluation of efficiency.
This research works towards an assessment method that can be used to assess in real-time, the energy efficiency of residential split, all-air HVAC systems without the need for more traditional methods such as costlier time intensive, and intrusive energy audits. The focus of this work is on developing a method which requires minimal to no information or engagement from the homeowner, and strictly uses data that can be obtained from energy use data and assessors’ data. This is motivated by the needs and interests from utility companies which typically provide incentive programs for motivating energy efficiency upgrades of residential HVAC systems. Feedback received from several utilities has indicated that a methodology to better target residential customers in need of HVAC servicing or efficiency upgrades is needed using easily accessible datasets, thus the development of this methodology. In addition, the proposed method could enhance the economic efficiency with the appropriate HVAC energy efficiency upgrades and energy retrofit strategies [17,18].
This research is organized into three main sections, including the methodology, results and conclusions, limitations and future work. The methodology for estimating residential household level HVAC electricity demand of a large dataset of homes and for evaluation of residential HVAC performance efficiency is proposed. A case study then uses detailed energy and weather data, and building assessor’s data for 39 occupied, conditioned residential buildings in Austin, Texas with the proposed method to determine HVAC efficiency ratings, demonstrating the identification of the presence of potential HVAC inefficiencies using the proposed method. The results section then shows the HVAC efficiency rating that compares the model-predicted and actual performance data to define whether an HVAC system is operating as expected. This result will help target HVAC systems in homes in need of service, energy efficiency upgrades, and be a continuous assessment tool for HVAC performance.

2. Methods

To predict the level of efficiency of operation of a dataset of residential building HVAC systems, the following methodology is developed and followed in this work. This includes several overall stages. First (Figure 1) is the utilization of data collected on basic building characteristics to determine the most probable size of the HVAC system. This is among the more challenging features to estimate without detailed system-level data, as HVAC system data is not typically available except through an on-site energy audit or service call. Next is the development of a model to predict the HVAC system electricity demand as a function of environmental conditions. The final stage is the energy efficiency evaluation of the HVAC systems (Figure 2).

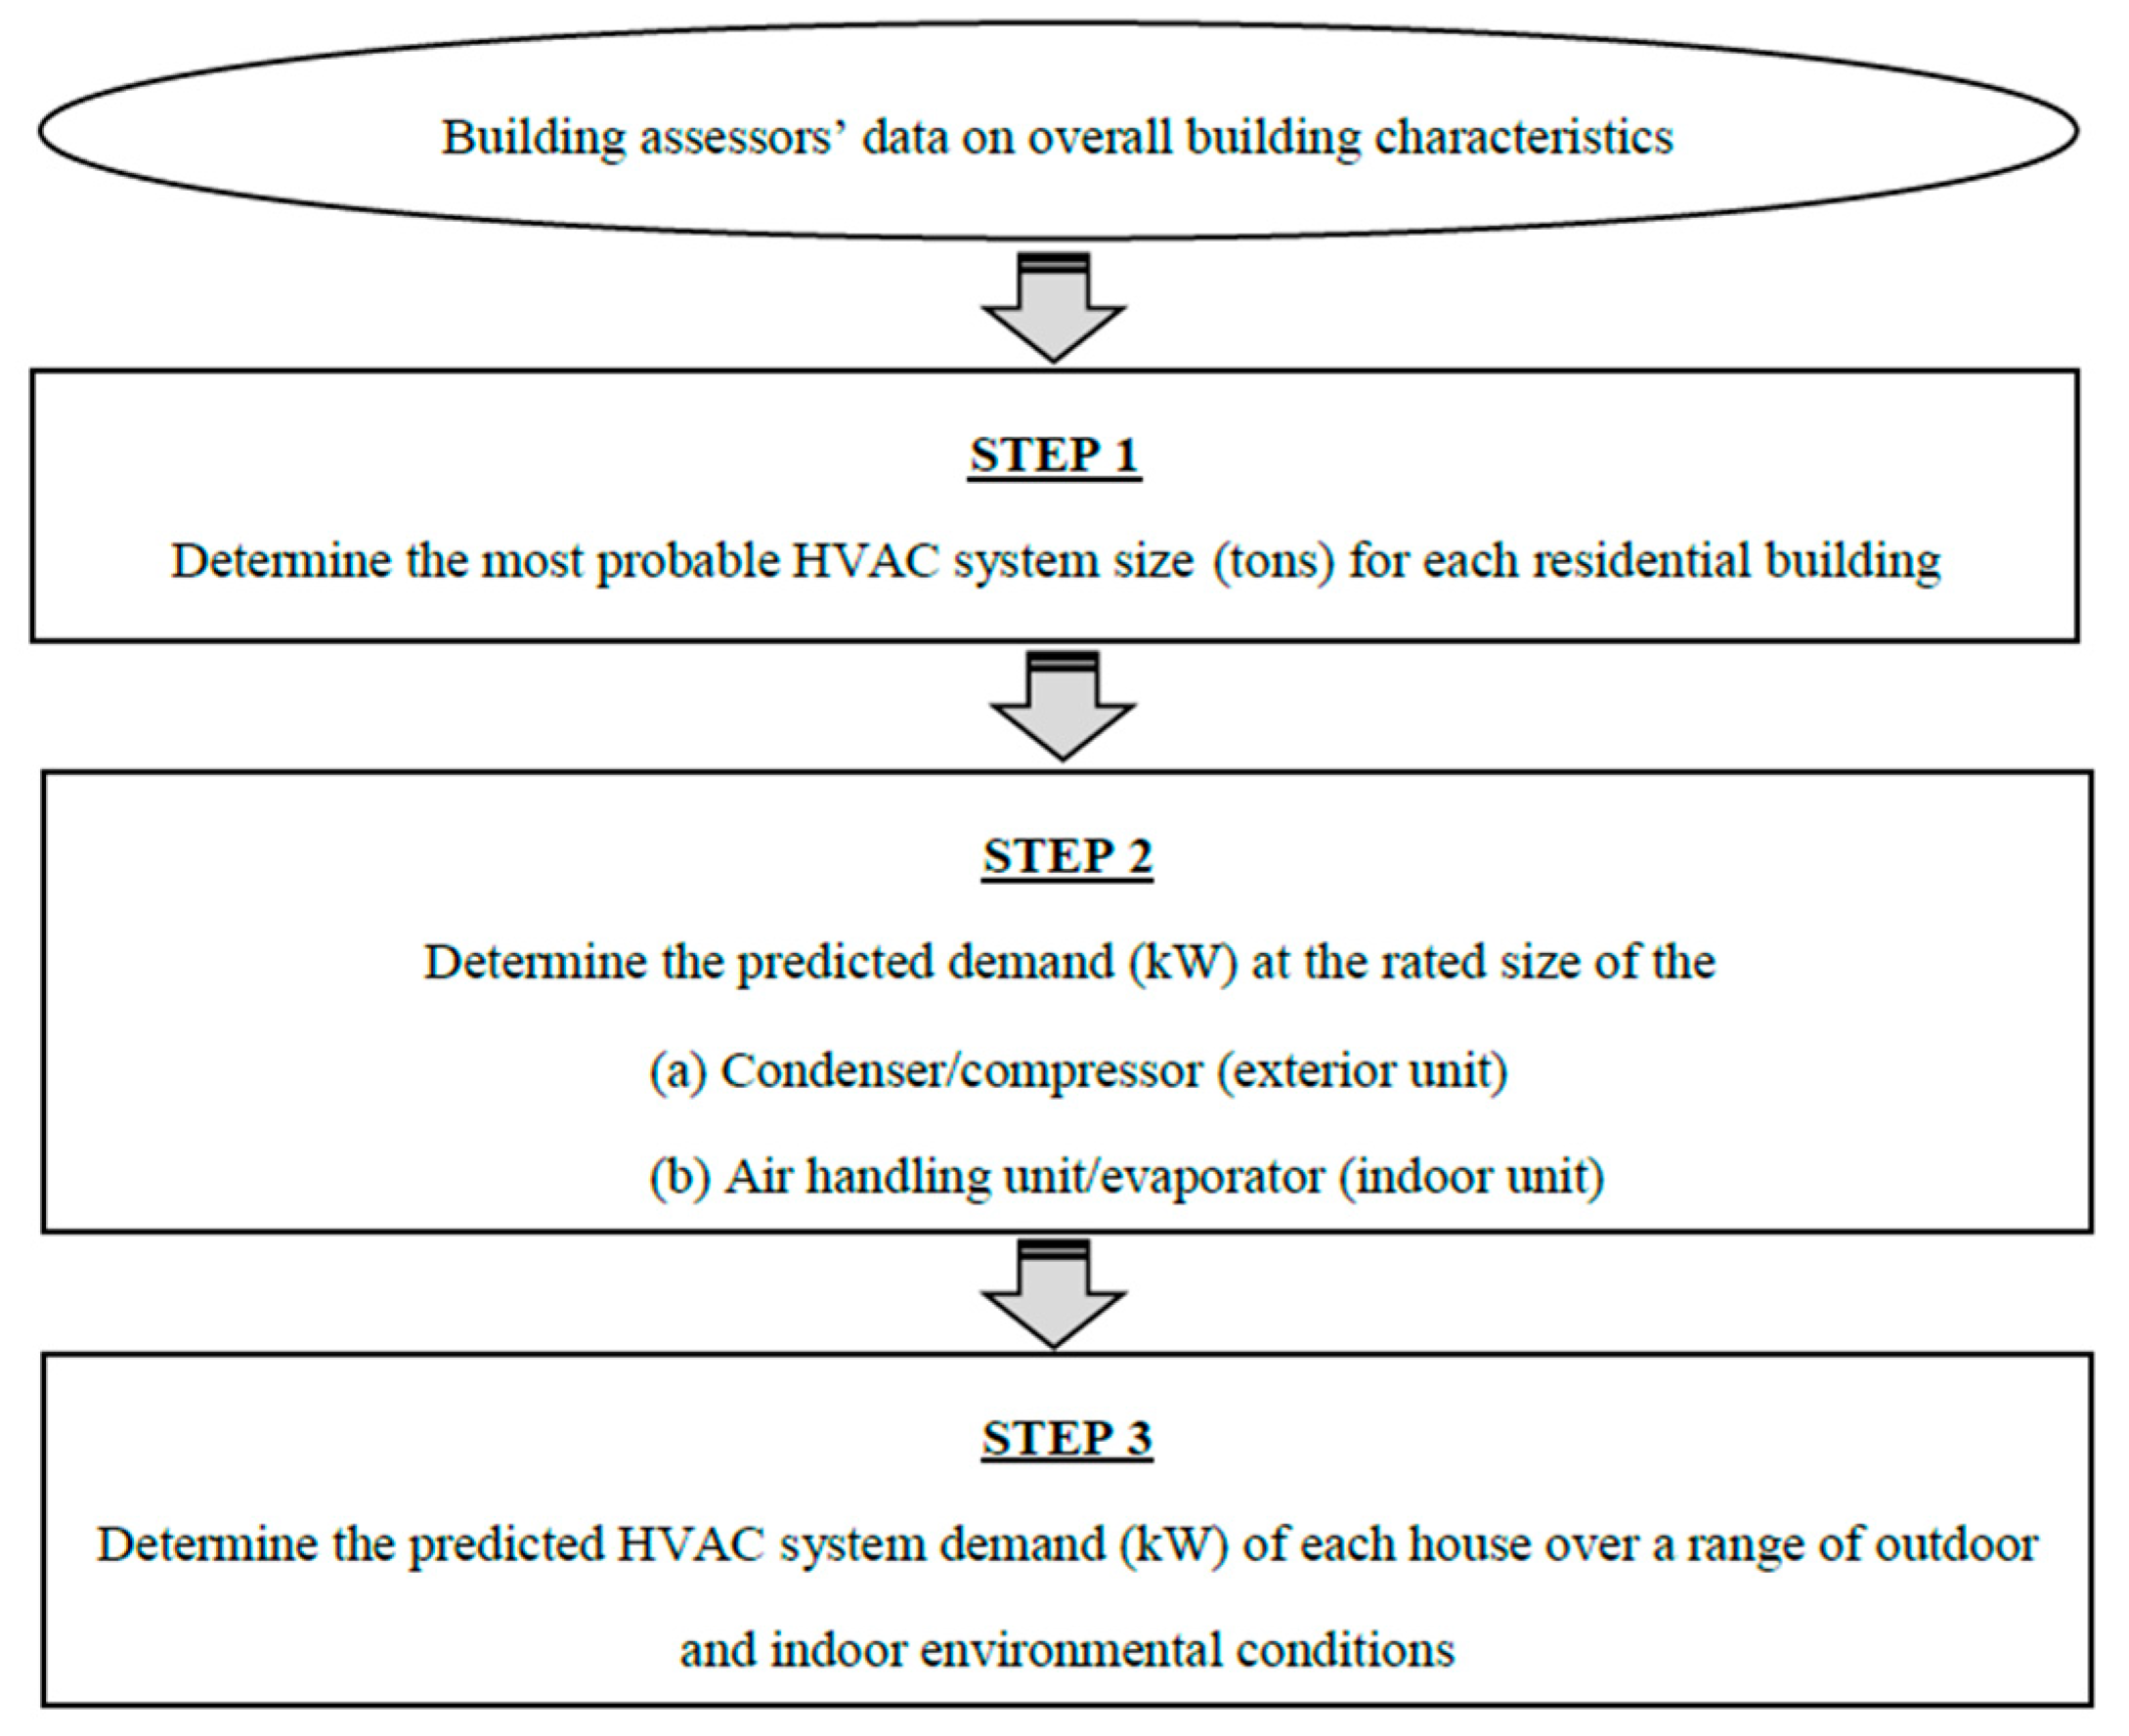
2.1. Prediction of Residential HVAC Demand

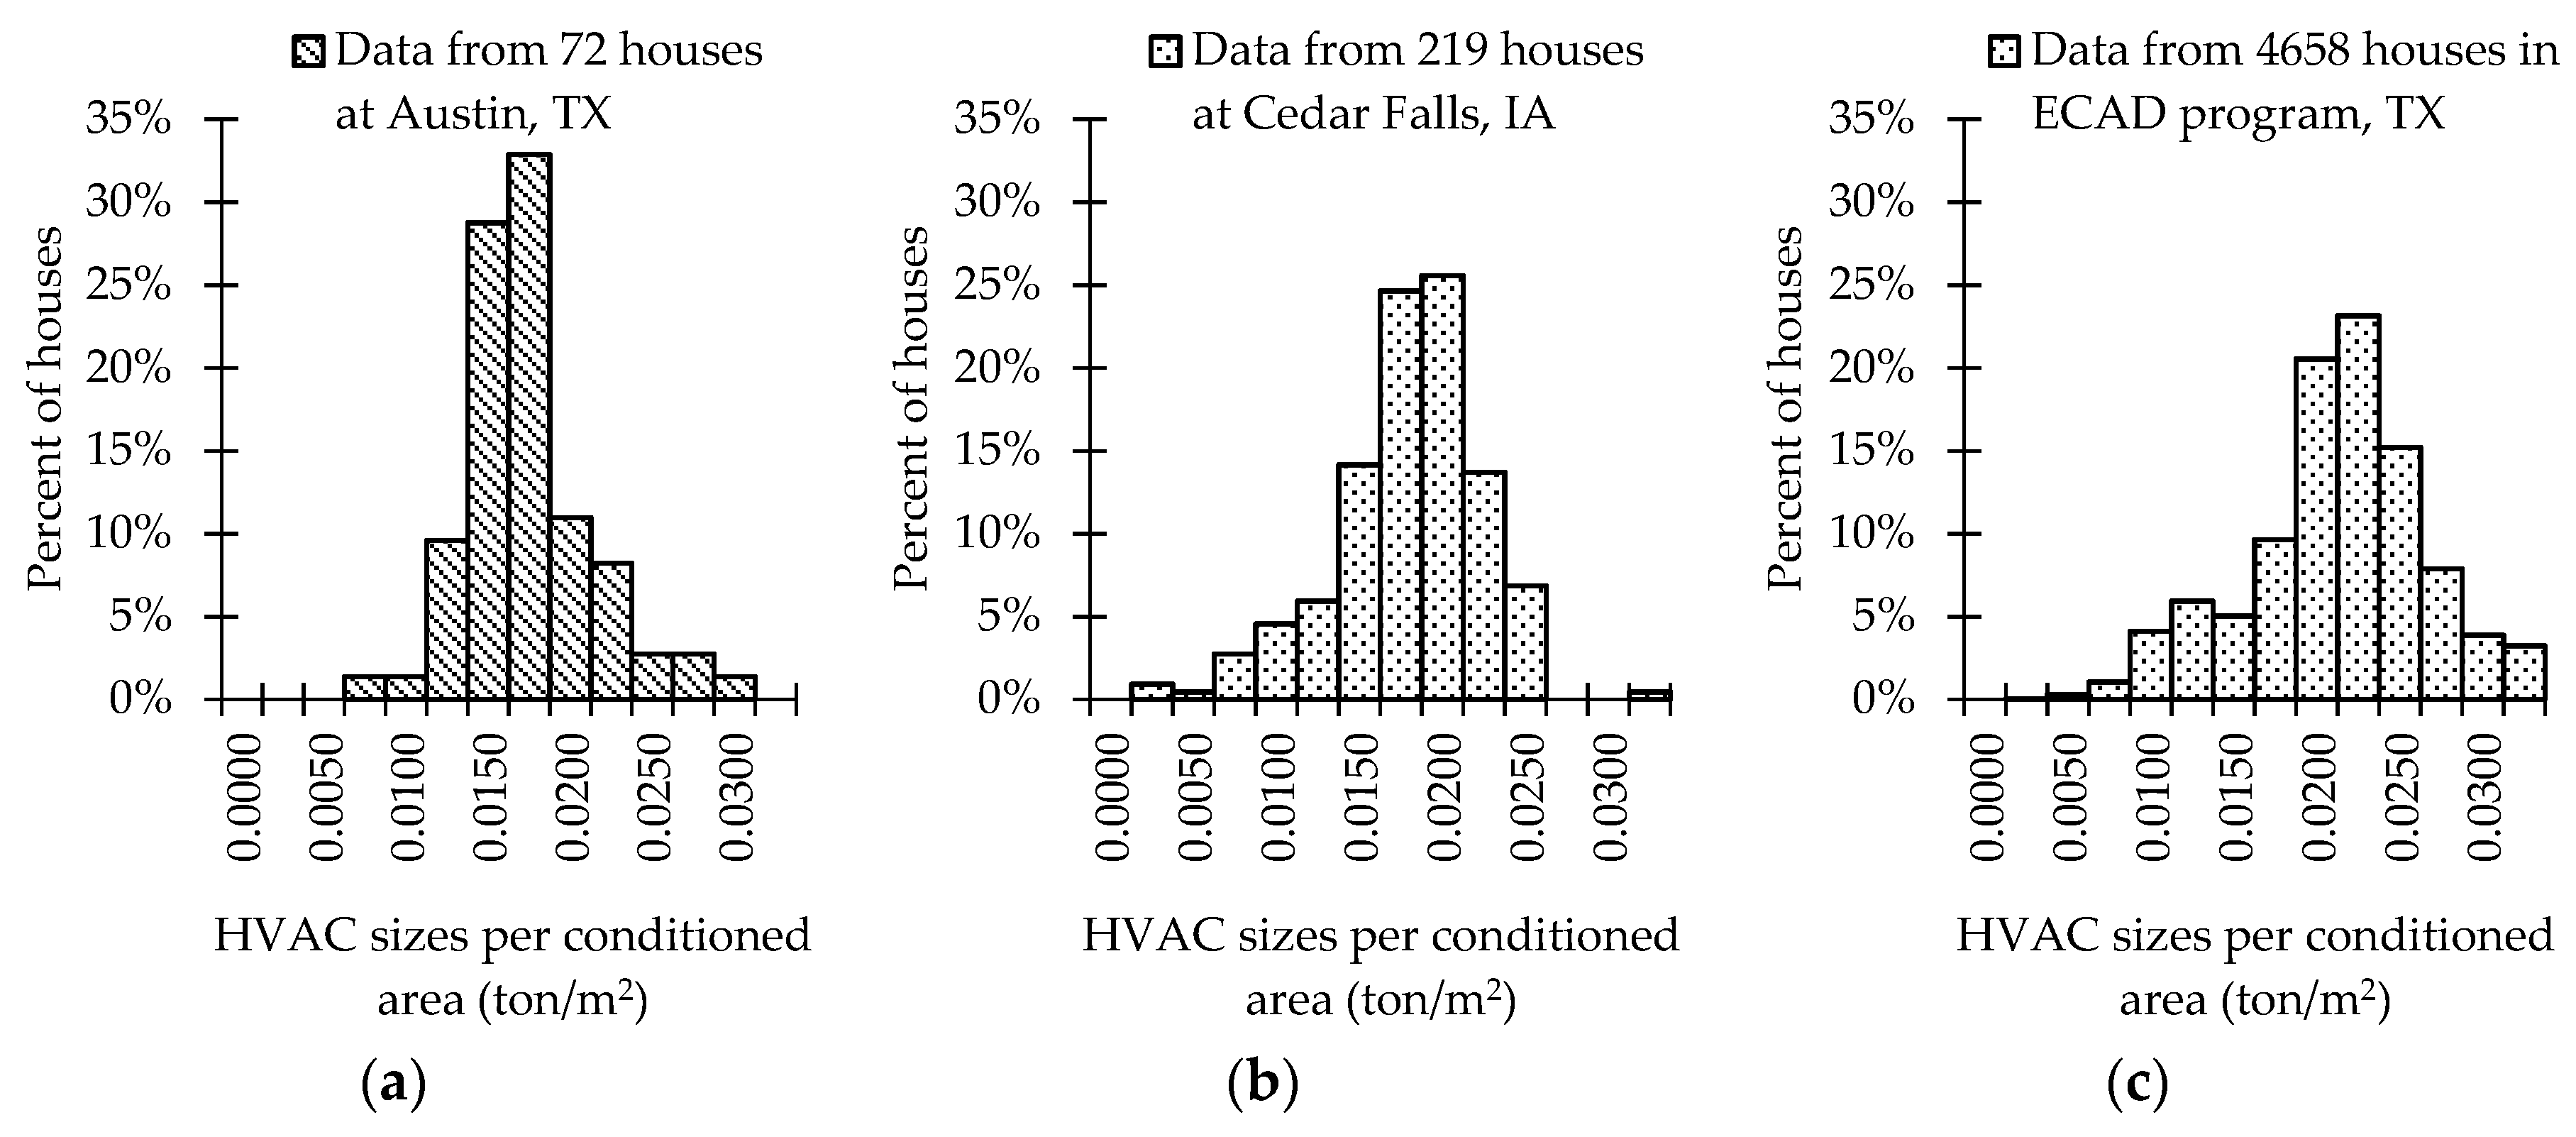
2.1.1. Step 1—Determine the Most Probable HVAC System Size

To determine the best estimates of residential heating and cooling loads for the right sizing of HVAC equipment, in the U.S. it is generally recommended to use calculation methods in Manual J from the Air Conditioning Contractors of America (ACCA) [19]. This method utilizes information on many aspects of a building’s thermal characteristics such as wall, floor, roof, windows, and door types, basement characteristics, and expected indoor and outdoor environmental conditions, among other details. [19,20]. However, the significant number of inputs and information needed to complete the Manual J calculations are not readily available for a utility company or other party attempting to assess HVAC performance of a large number of homes, without a detailed audit of the building stock. Assessor’s data (e.g., [21,22]) generally includes information such as the age of house, year of occurrence and type of any major improvement, total conditioned area, building style, exterior wall material, number of total rooms, bedrooms, and bathrooms, fuel type, HVAC system type, presence of a basement, etc. In the U.S., generally assessor’s data is publicly-available information, since it is used for tax purposes, however the level of availability and ease of accessibility varies by location. Thus, assuming there is only publicly-available assessor’s data as a worst-case scenario, this research proposes a method that uses this limited data to determine the most probable HVAC size. It is noted, however, if homeowners can provide the size of the HVAC system installed, or the system sizing can otherwise be determined from other data sources, this step can be skipped.
Assuming this is not the case, several different methods are explored. For the first method, an analysis of the 72 homes in the Austin, TX, area where home area and HVAC size (Figure 3a) is available from the utilized dataset. This indicates that the average size of the HVAC system per square meter of conditioned floor area is approximately 0.016 (tons/m2). The average size of the HVAC system per conditioned area (ton/m2) in the other datasets in Cedar Falls, Iowa and (Energy Conservation Audit and Disclosure) ECAD program are close, at 0.017 and 0.020, respectively (Figure 3b,c).
The distribution of HVAC sizes per unit area indicates there is some uncertainty associated with this estimate; however, of the potential predictor variables available in assessor’s data, the conditioned area was the most significant (p-value = 0.0007 × 10⁻⁵, R2 = 0.678). The second method considered is an industry rule of thumb, cited in a number of publications (e.g., [23]), where the HVAC size (S, in tons) is approximated as follows (Equation (1)), where A is conditioned area (m2):
S = A × 0.093 400 1
The last method depends on the U.S. climate region in which a system is located, based on the Residential Energy Consumption Survey (Figure 4, Table 1) [24,25]. Houses in Austin are in Zone 1.

2.1.2. Step 2—Determine the Predicted HVAC Capacity at the Rated Size

The sizing and efficiency rating of the HVAC system must then be converted to a cooling capacity and power demand at design conditions. The rated capacity of an HVAC system is based on the AHRI (Air-Conditioning, Heating, and Refrigeration Institute) design conditions (Table 2) [26]. While there are a range of rating conditions used to evaluate parameters such as energy efficiency ratio (EER) and coefficient of performance (COP), which are then used to calculate the seasonal energy efficiency ratio (SEER) and/or heating seasonal performance factor (HSPF), of these conditions, two standard rating conditions are generally accepted by industry to be used for evaluating HVAC capacity. For the cooling season, this rated value is associated with an outdoor drybulb temperature of 35 °C; and for the heating season, the outdoor drybulb temperature of 8.3 °C is used.
A SEER value must also be determined or assumed. If available, the HVAC system model numbers can provide information on the efficiency of the system [27]. However, this data is not always available, particularly in assessor’s data. While there are efforts to require energy benchmarking and/or energy audits to be performed for the residential building stock, such as the ECAD program in Austin, TX [28], there are very few locations in the U.S. that require such information to be gathered for residential buildings. The U.S. Department of Energy currently requires a minimum efficiency of SEER 13 or 14 for residential systems, depending on the location and climate zone where the system is installed [29]. However, this does not mean that the HVAC system being evaluated using this method will be at this level of efficiency. Previously, lower SEER ratings have been required, thus it is likely that older systems will also have a lower SEER value. For the purpose of development of the proposed methodology, in the development of the predicted HVAC electricity demand curve, it can be assumed that the SEER value is the current code-required value, as the purpose of the results of this analysis method is to determine if a system is less efficient than is code minimum (i.e., code-required, properly functioning system). The implications of this are, if the system under evaluation is less than a SEER 13/14, the results of the use of the developed method will indicate the system is less efficient than predicted, regardless of if an operational inefficiency or fault exists. This aligns with the purpose of the proposed method to identify if the system is less efficient than desired, to indicate that there are opportunities for improvement as compared to code minimum.
Using the determined size (S, tons) from the previous step and SEER value, the HVAC capacity ( Q ˙ t o t a l , r a t e d , kW) is estimated in Equation (2), based on the relationship between SEER and EER established by Wassmer [30] and widely used, including in residential building energy simulation protocols [31]:
Q ˙ t o t a l , r a t e d =   S   12 ( 1.12   ×   S E E R 0.02   ×   S E E R 2 )
In addition, the fan’s electricity demand must also be predicted. The indoor fan power demand ( P ˙ f a n , kW) is determined using 0.773 kW per m3/s with the flow rate of 0.189 m3/s per ton [32]. The 0.773 kW per m3/s is the AHRI default value for fan efficiency if the information about the indoor fan is unknown in ANSI (American National Standards Institute)/AHRI (Air Conditioning, Heating, and Refrigeration Institute) Standard 210/240 [32]. The fan is assumed to be a single stage fan. The rated energy input ratio (EIR) must also be determined and is defined as the inverse of the COP.

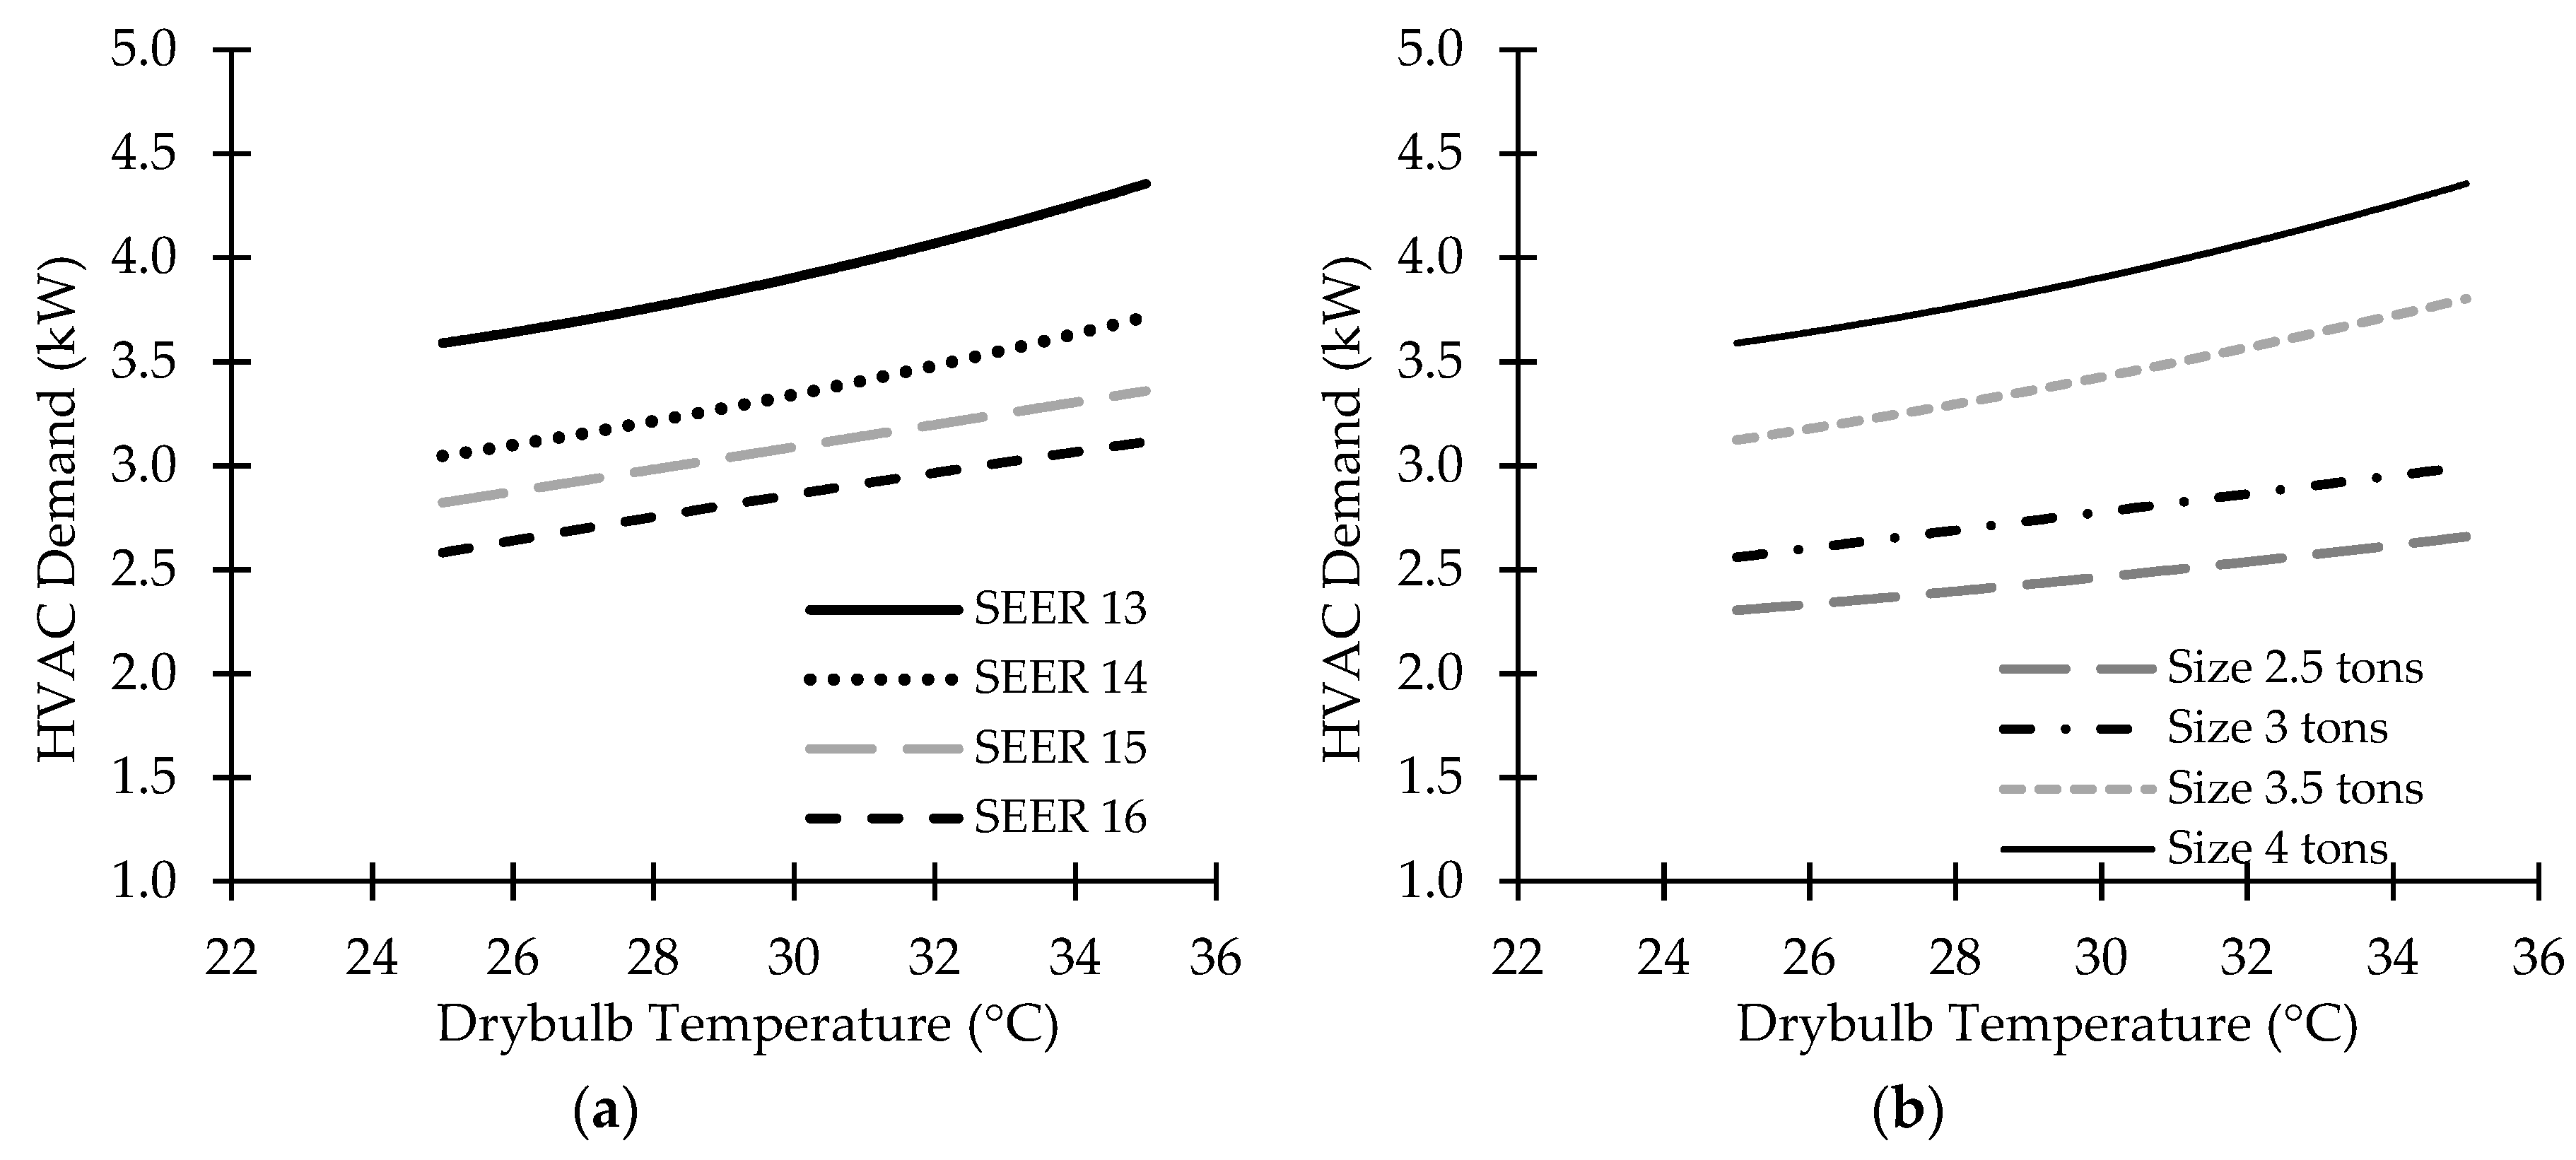
2.1.3. Step 3—Determine the Predicted HVAC System Power Demand (kW) Over a Range of Outdoor and Indoor Weather Conditions

Using these design conditions, a set of empirical equations are used to relate the estimated capacity at design conditions to an estimated electric power demand over a range of environmental conditions. These equations follow the format of the direct expansion (DX) model utilized in EnergyPlus 9.0.1 [33] to simulate DX equipment. This includes several biquadratic functions, with the values of the dependent variables being the design conditions listed in Table 2, where Tewb and Todb are the entering wet bulb temperature and outdoor drybulb temperature, respectively. These equations take the following form (Equation (3)):
y = a + b × T e w b + c × T e w b 2 +   d × T o d b + e × T o d b 2 + f × T o d b × T e w b
The gross power demand ( P ˙ g r o s s , kW) is calculated as a function of the energy input ratio (EIR) and the total cooling and/or heating capacity ( Q ˙ t o t a l , kW) (Equation (4)) [24]. By combining the gross power demand ( P ˙ g r o s s , kW) and the calculated indoor fan capacity ( P ˙ f a n ,   kW), the net power demand, i.e., the predicted HVAC system demand, ( P ˙ n e t ,   kW) is determined. The values of EIR and Q ˙ t o t a l are calculated using Equations (5) and (6), where E I R f ( T ) and Q ˙ f ( T ) are the normalized energy input ratio curve and the normalized total cooling and/or heating capacity curve that are calculated as a function of Tewb and Todb in the form of Equation (3). These curves allow for temperature-based adjustments to the final calculated EIR and Q ˙ t o t a l values from the rated values. The flow fraction and runtime fraction are assumed to be 1.
P ˙ n e t = ( E I R × Q ˙ t o t a l ) g r o s s + P ˙ f a n
E I R = E I R r a t e d × E I R f ( T )
Q ˙ t o t a l = Q ˙ t o t a l , r a t e d × Q ˙ f ( T )
The values of the coefficients (a through f) in the equations for E I R f ( T ) and Q ˙ f ( T ) are determined based on laboratory-collected data from the testing of a range of residential HVAC systems, and are summarized in Table 3. These values assume the HVAC system is a single-stage, single-zone air conditioning or heat pump system.

2.2. Evaluation of Residential HVAC Efficiency

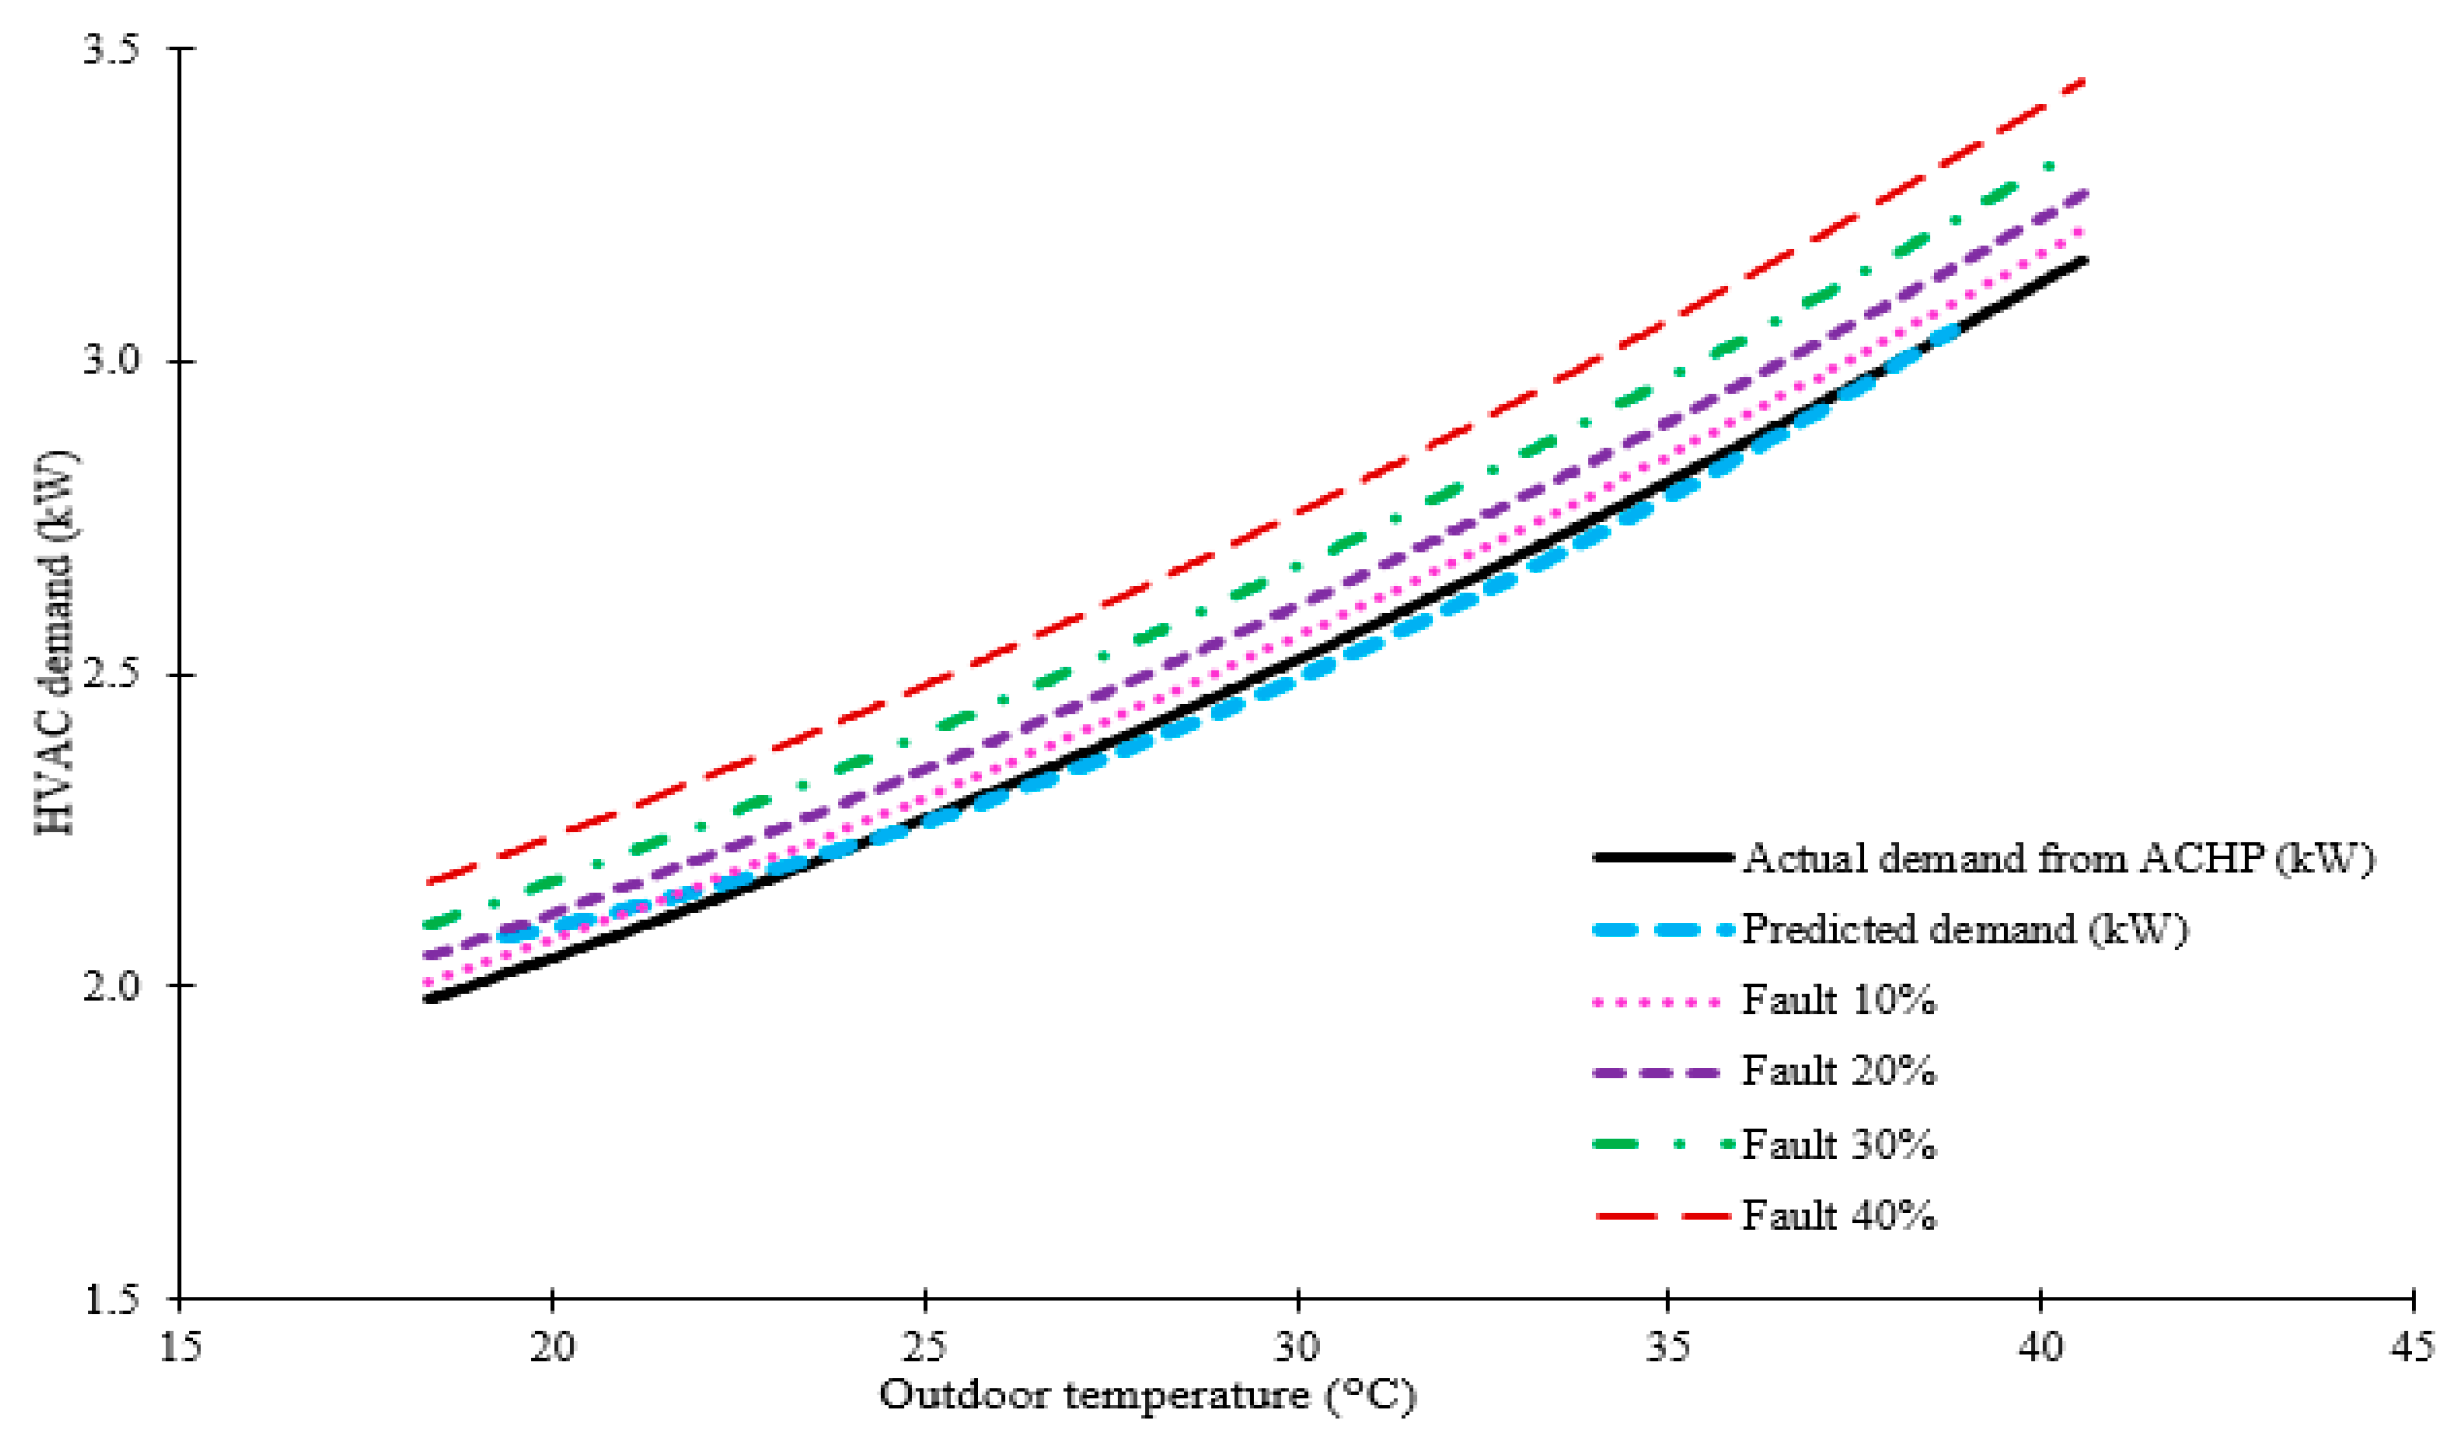
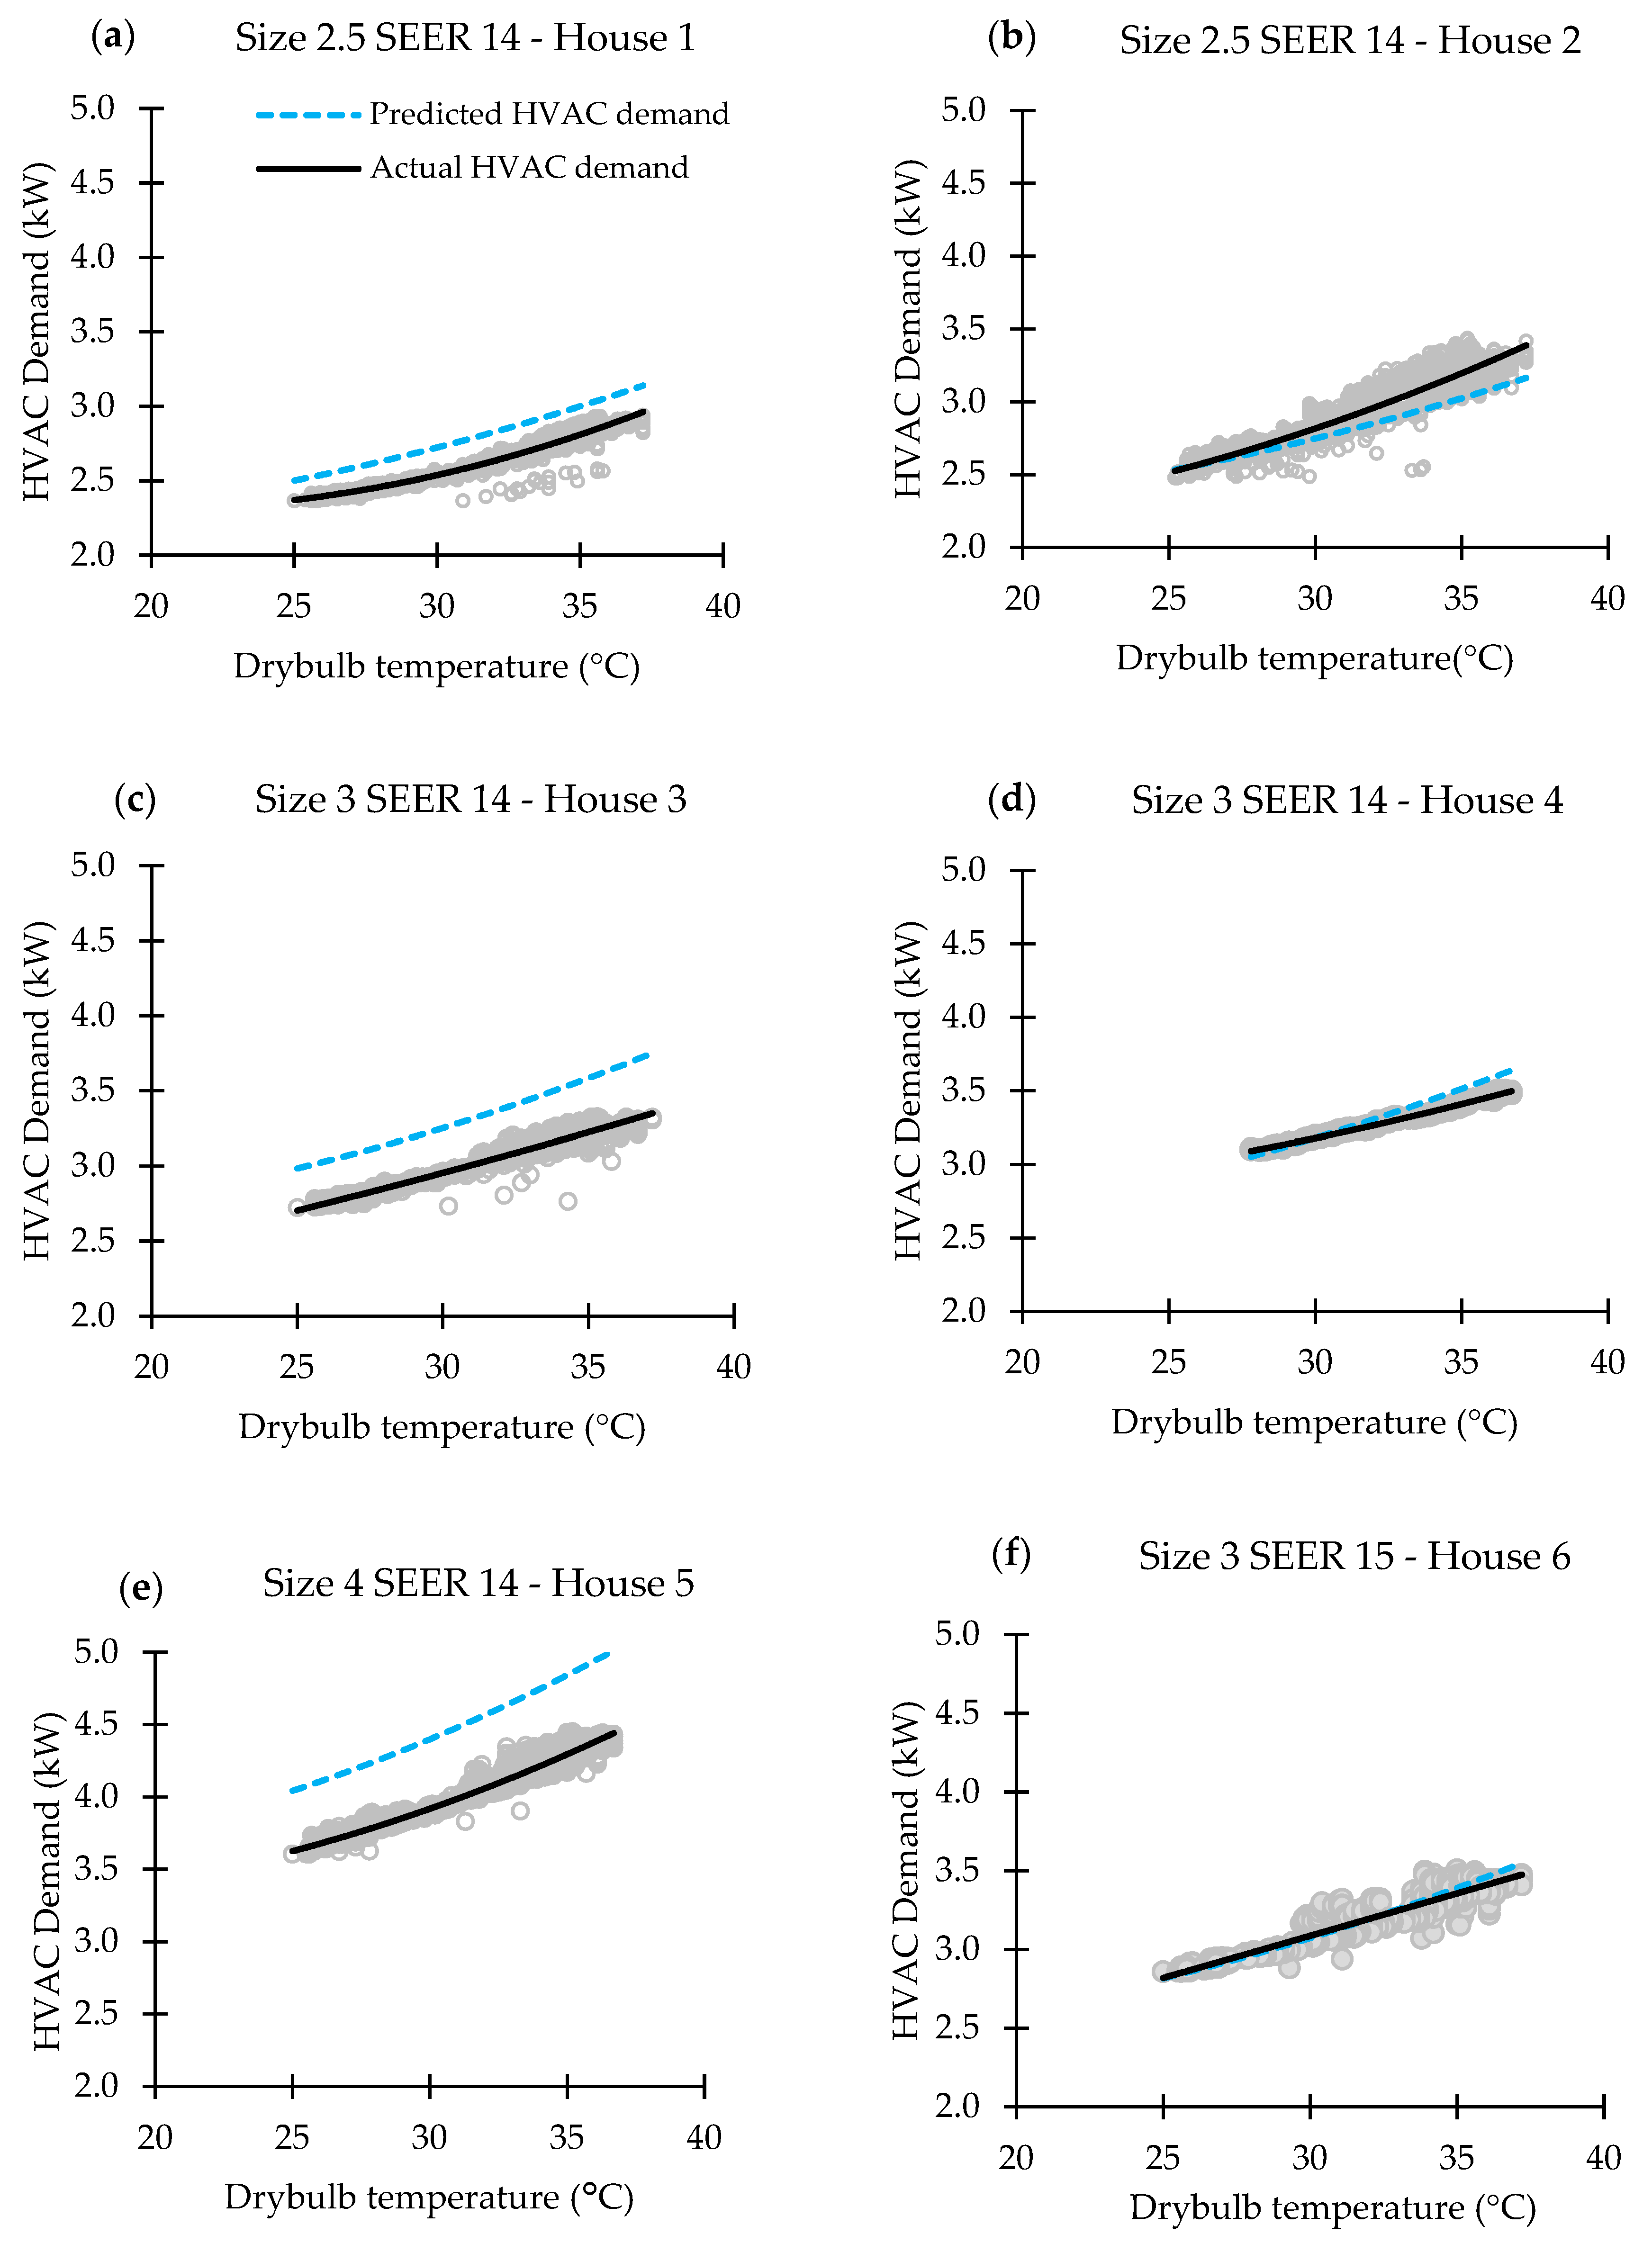
2.2.1. Step 1—Compare Predicted Electricity Demand with Actual Electricity Demand, to Establish an Efficiency Rating

To evaluate the efficiency of a particular system, the final predicted and actual (measured) demand of HVAC system are compared. An efficiency rating of an HVAC system is determined, represented as the ratio between actual (kW) and predicted (kW) values (Equation (7)). Using this ratio, if the actual demand is higher than predicted, the rating will be greater than 1; if the actual demand is lower than predicted, the rating will be less than one.
HVAC   efficiency   rating = HVAC   Demand   actual HVAC   Demand   predicted

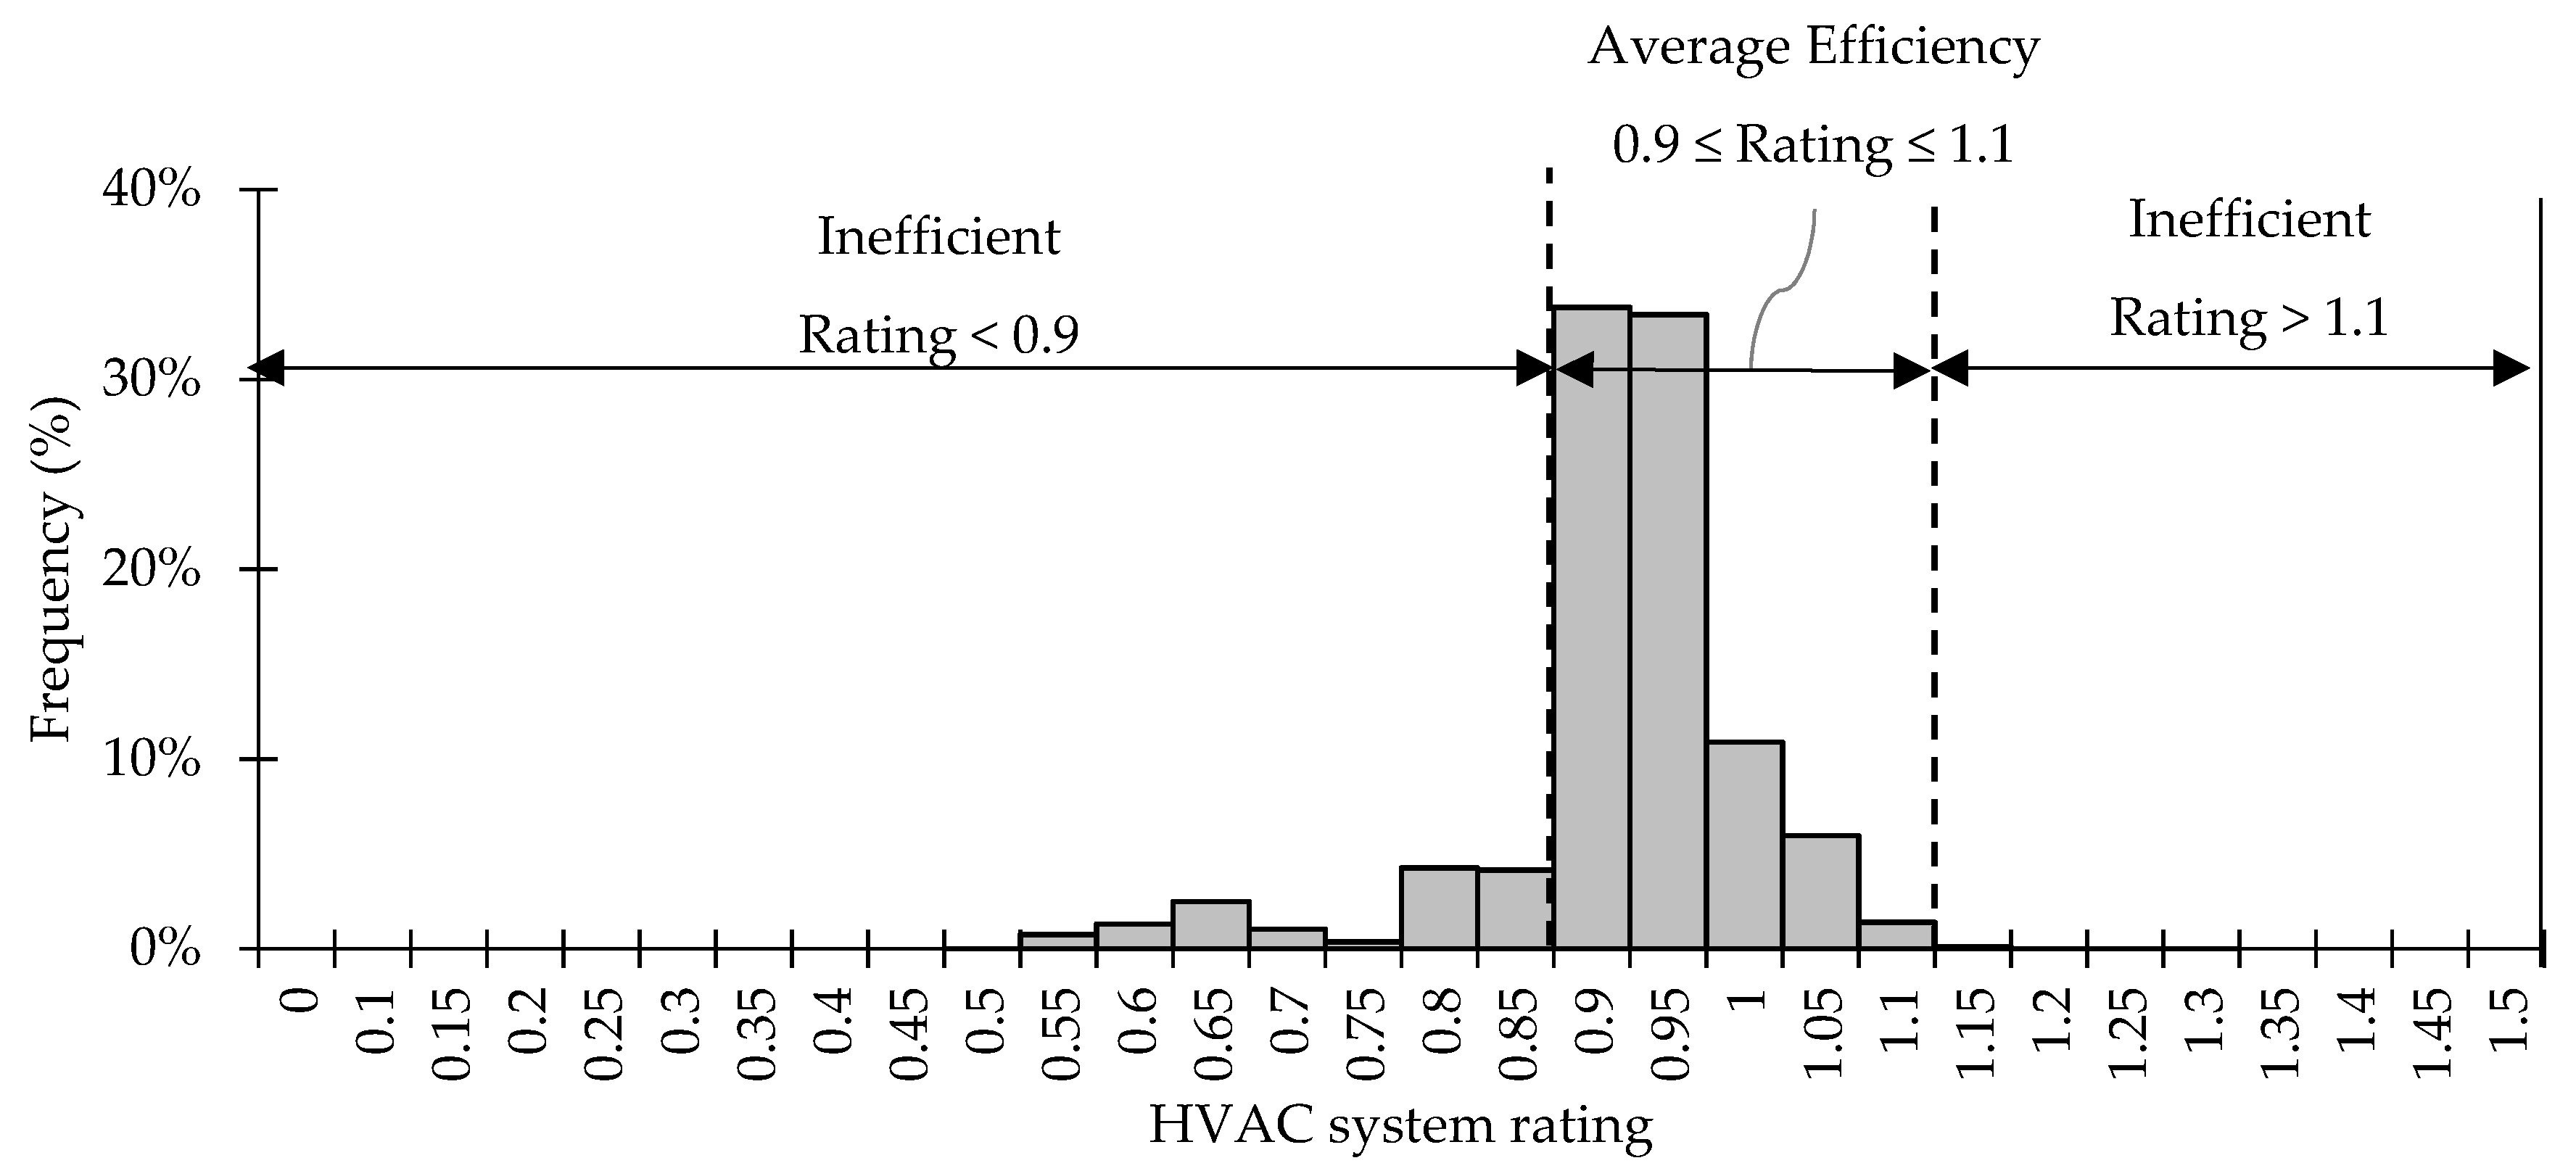
2.2.2. Step 2—Evaluate the Operational Efficiency of the HVAC System

When comparing actual and predicted values, two methods of comparison may be used. The actual performance may be compared to the expected performance based on the age of the home, expected age of the HVAC system and corresponding minimum efficiency of the required HVAC system at the time of construction. This comparison’s results would be a reflection on what the system operational characteristics should look like at a minimum, based on the code minimum performance specifications. Second, the actual performance could be compared to the predicted performance based on the rated size and SEER value of the system. This comparison would be a reflection of the overall system health and whether or not it needs to be serviced due to a fault or inefficiency.
If the HVAC system under consideration is operating as expected, then the electricity demand of the system should be similar to that of the predicted value. If the system is not functioning properly or the system is less (or more) efficient than expected, then the system will have a higher or lower electricity demand for a given set of environmental conditions, depending on the type of fault or inefficiency present. The thresholds above and below what is deemed to be acceptable performance are next determined based on the sensitivity of the curve development to faults and inefficiencies.

3. Results and Discussion

To assess the ability of the proposed methodology to identify the relative efficiency or inefficiency of an HVAC system, first a detailed HVAC modeling program air conditioning/heat pump (ACHP) [34], is used to predict the electricity demand of a residential HVAC system of a real home, which is then compared to the proposed method-predicted values. The home is a 10-year-old single-family house (111 m2) serviced by a SEER 13, 2.5 ton residential HVAC heat pump split-system with 410 A refrigerant [34]. The system electricity demand is modeled under a range of outdoor temperature conditions (18.3 °C to 40.5 °C). In Figure 5, the black line represents the HVAC model-predicted demand from ACHP (black line), which is compared to the predicted demand curve using the proposed method (blue-dashed line). The model-predicted values and the theoretical demand values are nearly identical across the range of environmental conditions considered. Based on this analysis, the proposed method provides a generally good agreement with physics-based model predictions of demand.
To determine the threshold efficiency ratio above and below which an HVAC system should evaluated to be inefficient or faulty, the impact of faults and inefficiencies is evaluated using ACHP. For faults, condenser airflow rate reduction, a common inefficiency, is modeled in ACHP, at a range of 10% to 40% airflow reduction. As shown in Figure 5, the more condenser airflow reduction, the higher HVAC demand, which is consistent with other research findings. The HVAC system efficiency rating in these cases are 1.02, 1.03, 1.09, and 1.12, respectively, for the faults of 10%, 20%, 30%, and 40%. Other literature has demonstrated that other common faults such as high- and low-refrigerant charge, also increase or decrease HVAC demand at similar levels [9,35]. Considering such fault types, electricity demand values that are both higher and lower than the predicted temperature–electricity demand curve values may be due to a fault or an inefficiency. Based on these results, and accounting for inherent uncertainties, lower and upper thresholds of 0.9 and 1.1 were chosen to be the threshold values between which an acceptable system operation is defined. Within this range, a system is considered to be within normal operational range. Outside this range could indicate either a less efficient system or a fault in the system, either of which could be interpreted as in need of attention of a utility company that is hoping to target customers who would benefit in terms of efficiency from an HVAC system upgrade or service.
Next, to mimic how a utility or service provider might use this method to identify homes with inefficient systems, this method is then used with a dataset of HVAC electricity demand of real homes, to understand if faults and inefficiencies appear to be present and detectable using the proposed method with real data. Electricity demand data for 39 residential HVAC systems was collected from Austin, Texas from January to December of 2015 [27]. Overall, the buildings studied were 28 years old on average, with a significant range of ages, from over 80 to less than 5 years old. The conditioned areas of the buildings also varied substantially, with an average size of 210 m2. These residential buildings can be divided into 15 main groups based on size (tons) and SEER value (Table 4), including sizes of 1.5 to 5 tons, and SEER values of 9 to 16. To develop the demand curves and assess overall efficiency of the HVAC systems, energy audit data was used, which included the HVAC system characteristics; this is compared to the high frequency 1-min level HVAC energy data available over the observation period.
To compare the average actual HVAC demands in each group, two cases are considered: first, the same size but different SEER values, and second, the same SEER value but different sizes (Figure 6a,b). In these figures, the actual HVAC demands associated with the data collected from the systems are classified into each category (as Table 4), then average values of actual HVAC demand in each group were calculated, and the trend lines as non-linear curves were created from these average values. With the same size (3 tons) system, when the SEER values increased from 13 to 16, the HVAC demand decreased approximately from 3.6 kW to 2.5 kW at design conditions. Thus, as expected, the higher SEER values had lower HVAC demands; this is consistent with the modeled data in Figure 5. The increase in size of HVAC systems from 2.5 tons to 4 tons also increased the HVAC demand, also as expected. Using this same data, the predicted curve of the HVAC system demand was developed. Some examples of predicted and actual demands of HVAC systems are represented in Figure 7. In these figures, the actual HVAC demands were created from the actual data points of 1-min interval electricity data (kW).
The observed data in Figure 7 is shown as grey data points; the black solid lines represent a curve fit to the data. The blue-dashed lines represent the predicted demand based on the method proposed in this work. In these examples, the differences between the blue and black line likely represent a fault in the HVAC systems rather than a lower than required efficiency system, given that all systems in the figure are of a SEER 14 or above. Several trends are noted. In Figure 7a,c,e the measured energy consumption is lower than the predicted values. As this difference is not due to a difference in SEER value, and literature on the impact of various HVAC faults on power demand, this may be due to low refrigerant charge. Each of these homes would have an efficiency rating of 0.89, 0.86, and 0.81, respectively, if measured at the rated temperature, thus in all cases, using the proposed thresholds for faults, these systems would be considered inefficient. In addition, it is observed that the difference between the predicted and actual measure data is consistent across the data collected over a range of outdoor temperatures. Figure 7f shows nearly identical agreement between the measured and actual data. Figure 7b,d shows strong agreement for lower outdoor temperature conditions; however, at higher temperatures there is more of a difference between measured and predicted data. This points to the importance of, for the efficiency rating evaluation proposed, determining at what specific conditions this is evaluated.
Summarizing the results of the 39 homes of observed data, a histogram was created to understand the distribution of efficiency ratings. For this data, all ratings indicate HVAC faults rather than the presence of an inefficient HVAC system, as all SEER ratings for the HVAC systems considered are at or above the code-required values. Using the values of predicted and actual HVAC demands in the HVAC system rating Equation (Equation (7)), the resulting distribution of HVAC system ratings is shown in Figure 8. Most of the houses (85%) have the HVAC system rating ranging from 0.9 to 1.1.

4. Conclusions

To evaluate the energy efficiency in residential HVAC systems, a methodology was developed which uses limited building and HVAC data, similar to the data that would be available to a utility company on the building stock from assessor’s data, to predict a HVAC electricity demand curve. When compared to the demand prediction from a detailed HVAC system model ACHP, the proposed prediction method was found to have strong agreement. This methodology was then used to compare to the actual measured electricity demand of HVAC systems to assess the efficiency of operation. Based on analysis of 39 homes in the Austin area, using a proposed set of thresholds of 0.9 to 1.1, it was found that approximately 85% of total houses were evaluated as having average HVAC energy efficiency. If the value of HVAC rating is under 0.9 or higher than 1.1, the HVAC system in this house is evaluated as faulty or inefficient and would benefit from servicing or replacement. As HVAC systems continue to become more efficient, and as efficiency standards require higher efficiency residential HVAC systems, these values can be updated with results from new data and information.
One limitation of this effort is that a smaller subset of residential buildings in Texas was studied. While HVAC systems are typically similar in type and characteristics throughout the U.S., climate conditions can vary by location, thus it would be beneficial to further study buildings and their HVAC systems located in different climate zones. In addition, more HVAC systems with a broader range of SEER values would be beneficial to include in future studies. This will help to further assess the method’s applicability for the evaluation of HVAC efficiency. In addition, other fault types should be investigated to understand the impact on HVAC electricity demand, and what level of detection of such faults can be achieved through the proposed methods. Another potential limitation is the weather data. This effort uses airport-based weather data which is not necessarily representative of the building microclimate in which the HVAC system operates. This may be a source of error from the input data which could impact the ability of the model to predict electricity demands. However, as building microclimate data was not measured at each home considered, this was not a factor that could be considered in this work. In addition, further study is needed to assess the economics associated with the collection and analysis of data to achieve early detection of faults and/or system inefficiencies, and act on these issues with corrective actions or system replacement earlier than otherwise is likely to occur.
The findings of this study have significance, in particular for the residential building systems, energy efficiency, and HVAC areas of research. The ability to predict demand and rate efficiency of an HVAC system without the additional collection of detailed data on the HVAC system characteristics is highly beneficial in the case where evaluating the efficiency of a system is desired, yet there is limited availability of energy and weather data. Such would be the case, for example, if a utility company is seeking to determine which homes in their service area to target for HVAC energy efficiency upgrades. Traditionally such evaluation would require more costly and intrusive energy audits and require the collaboration with homeowners. The proposed methods developed as part of this investigation can overcome such barriers to identify potential opportunities for efficiency improvements without the need for significant time or homeowner engagement. The continuous monitoring of the HVAC system demand data and reevaluation of the efficiency over time would also enable ongoing evaluation of performance, thus also enabling the identification of issues with HVAC systems earlier on, before failure occurs.
The application of this research has benefits for homeowners and/or occupants of residential buildings and the utility companies that supply energy to these homes. The feedback provided to homeowners using the HVAC efficiency evaluation can raise awareness of the homeowners and/or occupants in energy savings in their residential buildings, and in particular, know the efficiency status of HVAC system and be notified of abnormal energy consumption. For utilities, the information resulting from the proposed models can be used to target those customers that would most benefit from efficiency upgrades and other commonly implemented rebate programs.

Author Contributions

Conceptualization, K.S.C.; Methodology, K.S.C., H.D.; Software, H.D.; Formal Analysis, H.D.; Data Curation, H.D.; Writing—Original Draft Preparation, H.D.; Writing—Review & Editing, K.S.C.; Visualization, H.D.; Supervision, K.S.C.

Funding

This research was funded, in part, by the Vietnam Ministry of Education and Training.

Acknowledgments

The HVAC energy data is from the Pecan Street Research Institute. This research was conducted in collaboration with Whisker Labs. However, any opinions, results, and conclusions from this paper do not reflect the views of these organizations.

Conflicts of Interest

The authors declare no conflict of interest. The funders had no role in the design of the study, in the collection, analyses, or interpretation of data, in the writing of the manuscript, or in the decision to publish the results.

References

  1. United Nations Environment Program (UNEP). Sustainable Building and Climate Initiative. Available online: http://staging.unep.org/sbci/AboutSBCI/Background.asp (accessed on 12 October 2018).
  2. United States Energy Information Administration (US EIA). How much Energy Is Consumed in Residential and Commercial Buildings in the United States? Available online: https://www.eia.gov/tools/faqs/faq.php?id=86&t=1 (accessed on 12 October 2018).
  3. Swan, L.G.; Ugursal, V.I. Modeling of end-use energy consumption in the residential sector: A review of modeling techniques. Renew. Sustain. Energy Rev. 2009, 13, 1819–1835. [Google Scholar] [CrossRef]
  4. Pérez-Lombard, L.; Ortiz, J.; Pout, C. A review on buildings energy consumption information. Energy Build. 2008, 40, 394–398. [Google Scholar] [CrossRef]
  5. United States Energy Information Administration (US EIA). Residential Energy Consumption Survey (RECS). 2015 RECS Survey Data. Available online: https://www.eia.gov/consumption/residential/data/2015/ (accessed on 12 October 2018).
  6. U.S. Department of Energy. Home Energy Audits. Available online: https://energy.gov/public-services/homes/home-weatherization/home-energy-audits (accessed on 12 October 2018).
  7. Database of State Incentives for Renewables & Efficiency (DSIRE). NC Clean Energy Technology Center. Available online: http://www.dsireusa.org/ (accessed on 12 October 2018).
  8. Cetin, K.S.; Novoselac, A. Single and multi-family residential central all-air HVAC system operational characteristics in cooling-dominated climate. Energy Build. 2015, 96, 210–220. [Google Scholar] [CrossRef]
  9. Cetin, K.S. Smart Technology Enabled Residential Building Energy Use and Peak Load Reduction and Their Effects on Occupant Thermal Comfort. Ph.D. Thesis, The University of Texas at Austin, Austin, TX, USA, 2015. [Google Scholar]
  10. Kim, M.; Payne, W.V.; Domanski, P.A.; Yoon, S.H.; Hermes, C.J. Performance of a residential heat pump operating in the cooling mode with single faults imposed. Appl. Therm. Eng. 2009, 29, 770–778. [Google Scholar] [CrossRef]
  11. Palmiter, L.; Kim, J.H.; Larson, B.; Francisco, P.W.; Groll, E.A.; Braun, J.E. Measured effect of airflow and refrigerant charge on the seasonal performance of an air-source heat pump using R-410A. Energy Build. 2011, 43, 1802–1810. [Google Scholar] [CrossRef]
  12. Yoon, S.H.; Payne, W.V.; Domanski, P.A. Residential heat pump heating performance with single faults imposed. Appl. Therm. Eng. 2011, 31, 765–771. [Google Scholar] [CrossRef] [Green Version]
  13. Southern California Edison (SCE). Laboratory Assessment of a Retrofit Fault Detection and Diagnostics Tool on a Residential Split System. HT.11.SCE.005 Report. 2013. Available online: https://www.etcc-ca.com/reports/laboratory-assessment-retrofit-fault-detection-and-diagnostics-tool-residential-split-system (accessed on 12 October 2018).
  14. Cooper, A. Electric Company Smart Meter Deployments: Foundation for a Smart Grid; IEI Report; The Edison Foundation, Institute for Electrical Innovation: Washington, DC, USA, 2016. [Google Scholar]
  15. Cetin, K.S.; O’Neill, Z. Smart meters and smart devices in buildings: A review of recent progress and influence on electricity use and peak demand. Curr. Sustain. Renew. Energy Rep. 2017, 1, 1–7. [Google Scholar] [CrossRef]
  16. National Aeronautics and Space Administration (NASA). Modern-Era Retrospective Analysis for Research and Applications, Version 2. Goddard Space Flight Center. Available online: https://gmao.gsfc.nasa.gov/reanalysis/MERRA-2/data_access/ (accessed on 12 October 2018).
  17. Valdiserri, P.; Biserni, C. Energy performance of an existing office building in the northern part of Italy: Retrofitting actions and economic assessment. Sustain. Cities Soc. 2016, 27, 65–72. [Google Scholar] [CrossRef]
  18. Biserni, C.; Valdiserri, P.; D’Orazio, D.; Garai, M. Energy Retrofitting Strategies and Economic Assessments: The Case Study of a Residential Complex Using Utility Bills. Energies 2018, 11, 2055. [Google Scholar] [CrossRef]
  19. Air Conditioning Contractors of America. Speed-Sheet for ACCA Manual J. 2015. Available online: https://www.acca.org/communities/community-home/librarydocuments/viewdocument?DocumentKey=0bc73e80-6c3c-43cb-bdb2-43316a380fa4 (accessed on 12 October 2018).
  20. Proud Green Home. Can You Do a Manual J HVAC Calculation in Less than 60 Seconds? Available online: https://www.proudgreenhome.com/news/can-you-do-a-manual-j-hvac-calculation-in-less-than-60-seconds/ (accessed on 12 October 2018).
  21. New York State Office of Real Property Services. Assessor’s Manual. Data Collection—Residential/Farm/Vacant Land. Available online: https://www.tax.ny.gov/pdf/publications/orpts/manuals/rfv_manual_published.pdf (accessed on 12 October 2018).
  22. Jon, S.; Nancy, M. Collecting Parcel Data from Assessors. The U.S. Department of Housing and Urban Development (HUD). Office of Policy Development and Research (PD&R). Available online: https://www.iaao.org/uploads/FE_April_Parcel_Data.pdf (accessed on 12 October 2018).
  23. Bell, A.A., Jr. HVAC: Equations, Data, and Rules of Thumb; McGraw-Hill: New York, NY, USA, 2008; ISBN 9780071482424. [Google Scholar]
  24. Tim, K.; What Size Central Air Conditioner Do I Need for My House? A Short Consumer’s Guide from ASM. All System Mechanical (ASM). Available online: https://asm-air.com/airconditioning/what-size-central-air-conditioner-for-my-house/ (accessed on 12 October 2018).
  25. United States Energy Information Administration (US EIA). Residential Energy Consumption Survey (RECS). Maps. Available online: https://www.eia.gov/consumption/residential/maps.php (accessed on 12 October 2018).
  26. Cutler, D.; Cutler, J.; Kruis, N.; Christensen, C.; Brandemuehl, M. Improved Modeling of Residential Air Conditioners and Heat Pumps for Energy Calculations; Technical Report; NREL/TP-5500-56354; National Renewable Energy Laboratory (NREL): Golden, CO, USA, 2013.
  27. The Pecan Street Research Institute, The University of Texas at Austin. The Dataport Database. Available online: http://www.pecanstreet.org/category/dataport/ (accessed on 12 October 2018).
  28. Austin Energy. Energy Conservation Audit and Disclosure (ECAD) Ordinance. The City of Austin. Available online: https://austinenergy.com/ae/energy-efficiency/ecad-ordinance/energy-conservation-audit-and-disclosure-ordinance (accessed on 12 October 2018).
  29. U.S. Department of Energy. Appliance and Equipment Standards Rulemakings and Notices. Available online: https://www1.eere.energy.gov/buildings/appliance_standards/standards.aspx?productid=48&action=viewlive#current_standards (accessed on 12 October 2018).
  30. Wassmer, M. A Component-Based Model for Residential Air Conditioner and Heat Pump Energy Calculations. Master’s Thesis, University of Colorado at Boulder, Boulder, CO, USA, 2003. [Google Scholar]
  31. Hendron, R.; Engebrecht, C. Building America House Simulation Protocols. Available online: https://www.nrel.gov/docs/fy11osti/49246.pdf (accessed on 12 October 2018).
  32. Air Conditioning, Heating, and Refrigeration Institute (AHRI). Standard 210/240—2017 Standard for Performance Rating of Unitary Air-conditioning & Air-source Heat Pump Equipment. 2017. (ANSI/AHRI 2017). Available online: http://www.ahrinet.org/App_Content/ahri/files/STANDARDS/AHRI/AHRI_Standard_210-240_2017.pdf (accessed on 12 October 2018).
  33. United States Department of Energy. Energy Plus. Engineering Reference. Washington, DC, USA. Available online: https://energyplus.net/ (accessed on 12 October 2018).
  34. Ian, B. Air Conditioning/Heat Pump (ACHP). Purdue University. Available online: http://achp.sourceforge.net/ (accessed on 12 October 2018).
  35. Cetin, K.S.; Kallus, C. Data-driven methodology for energy and peak load reduction of residential HVAC systems. Procedia Eng. 2016, 145, 852–859. [Google Scholar] [CrossRef]
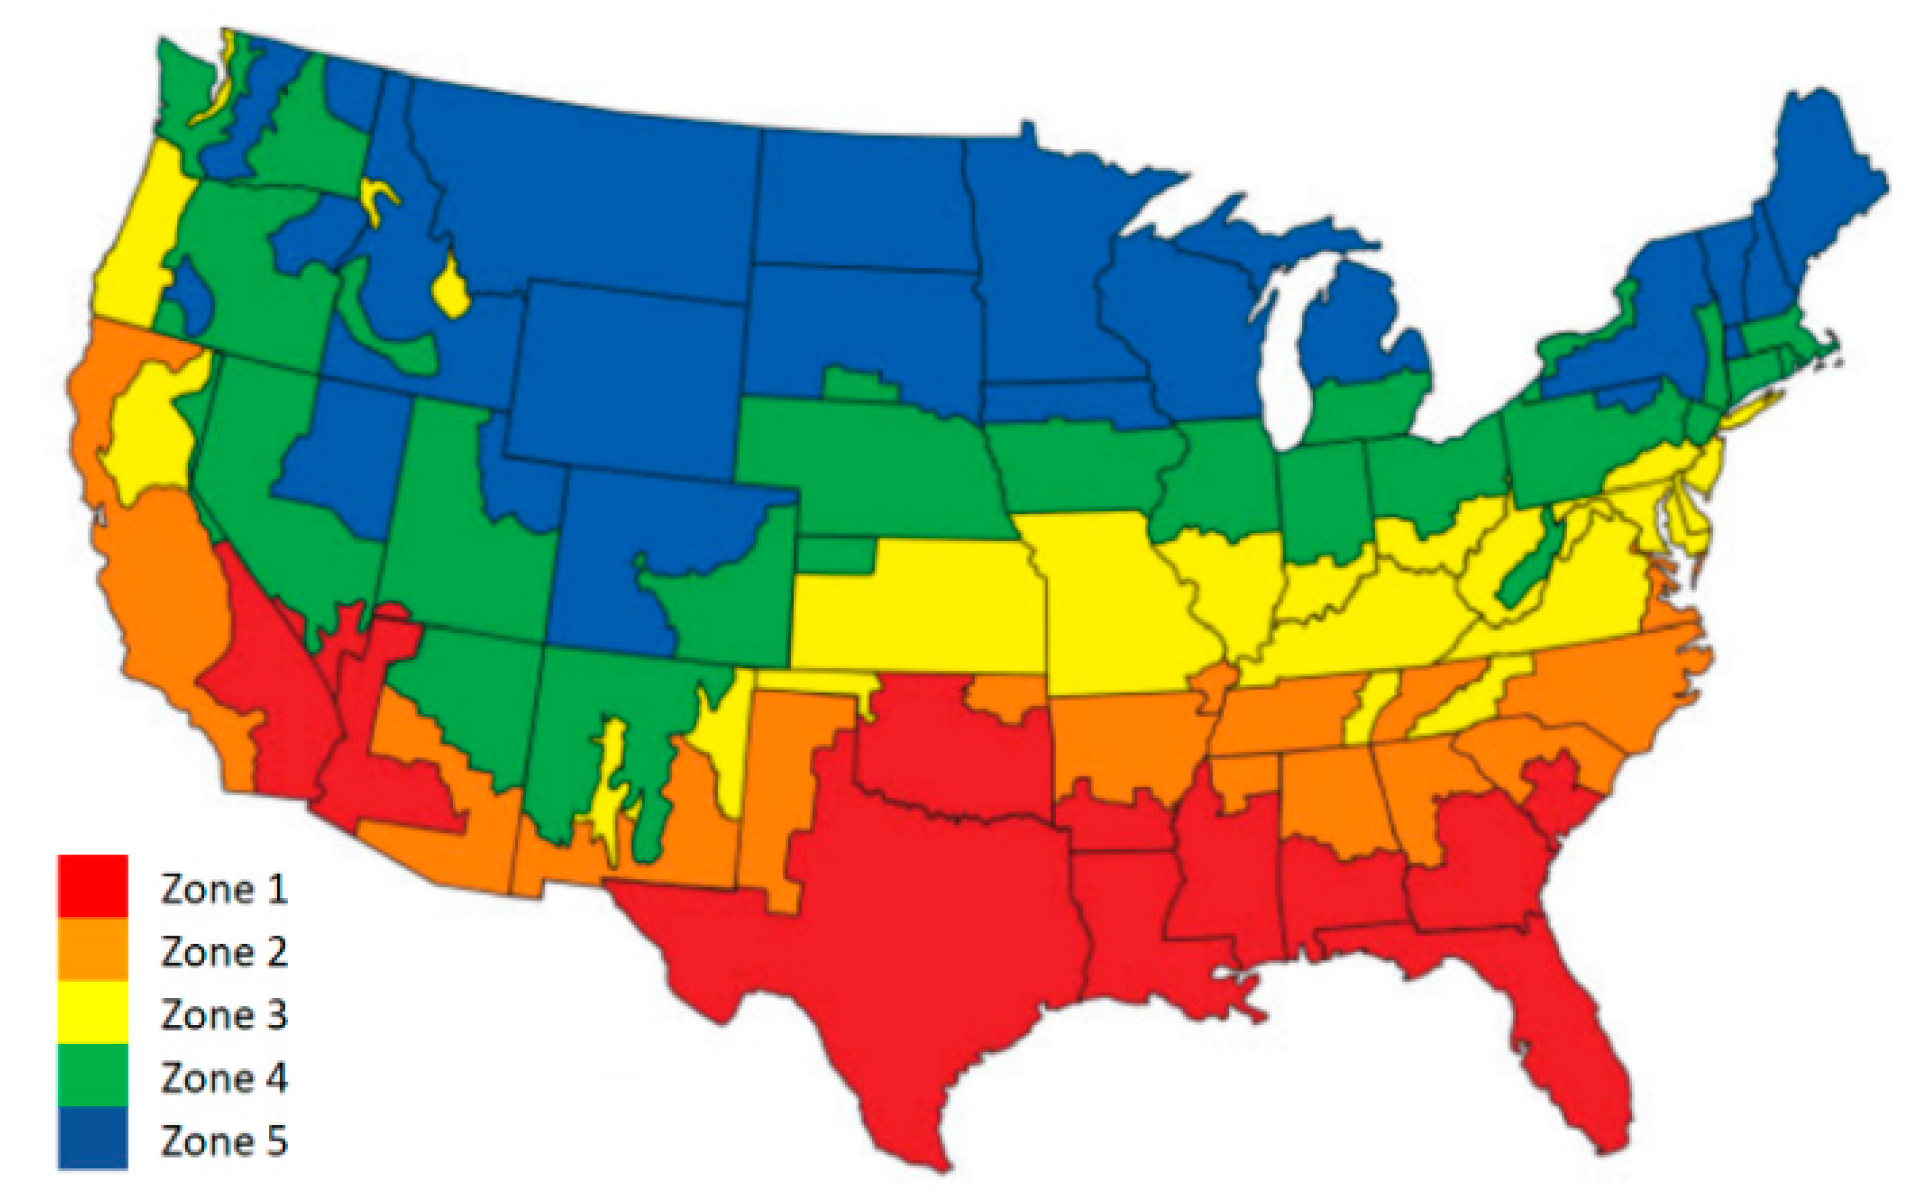
Figure 1. Methodology for estimating residential household level heating, ventilation, and air conditioning (HVAC) system electricity demand of a large dataset of homes.
Energies 12 00188 g001
Figure 2. Methodology for evaluation of residential HVAC performance efficiency.
Energies 12 00188 g002
Figure 3. HVAC sizes per conditioned area (m2) for houses in three locations: (a) the utilized Austin, Texas dataset; (b) Cedar Falls, Iowa dataset, and (c) ECAD program in Texas.
Energies 12 00188 g003
Figure 4. U.S climates zone divisions from the U.S. EIA (Energy Information Administration) Residential Energy Consumption Survey (RECS) [25].
Energies 12 00188 g004
Figure 5. HVAC demand curves using the air conditioning/heat pump (ACHP) model and predicted data for a properly functioning, and faulty HVAC system (Note: The fault indicated is due to reduced HVAC condenser airflow).
Energies 12 00188 g005
Figure 6. Comparison of two cases of HVAC demand: (a) same size (size 3 tons) but different seasonal energy efficiency ratio (SEER) values, and (b) same SEER value (SEER 14) but different sizes.
Energies 12 00188 g006
Figure 7. Examples of predicted and measured demands of residential HVAC systems by size.
Energies 12 00188 g007
Figure 8. HVAC efficiency evaluation based on the distribution of HVAC system efficiency rating.
Energies 12 00188 g008
Table 1. Size of HVAC system based on home size (m2) by RECS climate zone [24].
Size (Tons)Zone 1Zone 2Zone 3Zone 4Zone 5
1.556–8456–8856–9365–9865–102
284–11188–11693–12198–125102–130
2.5112–138116–144121–149126–149130–153
3139–167144–172149–177149–186153–195
3.5167–195172–200177–204186–209195–214
4195–223200–232204–242209–251214–251
5223–279232–288242–297251–307251–307
Table 2. Air-Conditioning, Heating, and Refrigeration Institute (AHRI) design conditions for a residential HVAC system [26].
AHRI Design ConditionsAir Entering Indoor Units Air Entering Outdoor Units (°C)
Drybulb (°C)Wetbulb (°C)Drybulb (°C)Wetbulb (°C)
Cooling26.719.435.023.9
Heating21.115.6 8.36.1
Table 3. Curve coefficients of the energy input ratio ( E I R f ( T ) ) and total capacity ( Q ˙ f ( T ) ) [26].
CoefficientsAir Conditioner (Cooling)Heat Pump (Cooling)Heat Pump (Heating)
Energy Input RatioTotal CapacityEnergy Input RatioTotal CapacityEnergy Input RatioTotal Capacity
a−3.107154.77794−3.132754.78154−2.539994.40420
b0.20088−0.164050.19920−0.16377−0.01249−0.00030
c−0.001900.00172−0.001890.001720.00026−0.00002
d−0.030950.00333−0.024420.00244−0.021630.00596
e0.00039−0.000030.00033−0.000020.000250.00009
f−0.00026−0.00024−0.00026−0.00024−0.00039−0.00001
Table 4. Characteristics of grounds of residential buildings and their HVAC systems.
Group# of HousesAverage Area (m2)Size (Tons)SEER
1114039
221042.510
31367212
422262.513
51287313
661652.514
77190314
852203.514
95274414
1021592.515
111166315
122145316
1312213.516
141200417
152199319

