Article

Using SoC Online Correction Method Based on Parameter Identification to Optimize the Operation Range of NI-MH Battery for Electric Boat

1
The College of Electrical and Information Engineering, Hunan University, Changsha 410082, Hunan, China
2
The National Engineering Research Center of Advanced Energy Storage Materials, Changsha 410205, Hunan, China
*
Authors to whom correspondence should be addressed.
Energies 2018, 11(3), 586; https://doi.org/10.3390/en11030586
Submission received: 15 November 2017 / Revised: 21 February 2018 / Accepted: 26 February 2018 / Published: 8 March 2018
(This article belongs to the Special Issue The International Symposium on Electric Vehicles (ISEV2017))

Abstract

:
This paper discusses a design of a Battery Management System (BMS) solution for extending the life of Nickel-Metal Hydride (NI-MH) battery. Combined with application of electric boat, a State of Charge (SoC) optimal operation range control method based on high precision energy metering and online SoC correction is proposed. Firstly, a power metering scheme is introduced to reduce the original energy measurement error. Secondly, by establishing a model based parameter identification method and combining with Extended Kalman Filter (EKF) method, the estimation accuracy of SoC is guaranteed. Finally, SoC optimal operation range control method is presented to make battery running in the optimal range. After two years of operation, the battery managed by proposed method has much better status, compared to batteries that use AH integral method and fixed SoC operating range. Considering the SoC estimation of NI-MH battery is more difficult becausing special electrical characteristics, proposed method also would have a very good reference value for other types of battery management.

1. Introduction

As an important type of rechargeable battery, NI-MH batteries are used in many energy storage scenarios. At present, the application of NI-MH batteries has been expanded from consumer markets to propulsion and telecommunication field. Due to its relatively low energy density compared to lithium-ion battery, the market share of NI-MH batteries reduced in portable electronic devices such as cell phones, notebook computers and digital cameras. However, NI-MH battery technology had been successfully used in the alkaline battery market and the Nickel Cadmium (NiCD) power tool market, because of its non-toxic, low self-charge and voltage compatibility. While lithium-ion batteries occupy the leading position in Electric Vehicles (EVs), NI-MH batteries are widely used in powering hybrid electric vehicles (HEV) [1]. The success of NI-MH in powering HEV stems from its superb cycle stability, abuse tolerance, wide temperature range, as well as being environmentally friendly [2].
The electrical characteristics of NI-MH batteries also have certain advantages. Under the situation of large current rate discharge, the energy efficiency is larger for NI-MH batteries than for lithium-ion batteries [3]. The self-discharge rate for the metal-hydride battery can be further reduced by enhancement on electrode structures and improvement of the metal-hydride storage alloys [4]. Good discharge ratio, high temperature characteristics and other factors ensure high safety of NI-MH battery [5]. In addition, more advanced material technology is being used to improve the comprehensive performance of NI-MH batteries. Although lithium-ion batteries have dominant position in the consumer and pure electric vehicle market, NI-MH batteries will continue to play an important role well into the future [6,7,8].
However, the feature of NI-MH batteries makes its SoC estimation difficult, which limits its application to a certain extent. Conventionally, the methods of SoC estimation can be categorized into three types: (1) method based on the mathematical model and the empirical formula, which need analysis of battery characteristics; (2) method based on the coulometric measurement in which the accumulated error must be corrected by the Open Circuit Voltage (OCV); (3) method based on the impedance measurement [9,10]. Due to the cost factor, the impedance measurement method is difficult to apply. Moreover, because NI-MH batteries have flat and broad charge-discharge voltage plateaus, the OCV curve of NI-MH batteries charging and discharging are very gradual relative to the lithium-ion battery [11]. The independent methods such as the integration of ampere hours, measurement of OCV, use of artificial intelligence often suffer from low accuracies and large accumulated errors [12,13,14]. Because of the need to change battery structure, the new method for estimating SoC based on battery’s stable internal pressure is also difficult to achieve practical application [15].
For the application scenario described in this paper, the accuracy of SoC estimation is more important. Earlier studies have shown that the performance of lithium-ion batteries is very sensitive to even traces of moisture contamination [16]. Considering fire accidents during the project test conducted with lithium batteries, they are not considered to be the best option for the moist and closed environment of cave [3]. Due to lithium-ion battery safety concerns and lead-acid battery capacity, NI-MH is chosen as the driving power provider of the electric boat running in Huanglong Cave. In order to complete transport of large number of passengers using AH capacity limited by size of the hull, NI-MH batteries have to run in a wide SoC scope. To avoid damage caused by improper management and ensure cycle life, the optimal management of NI-MH battery based on precise SoC estimation becomes particularly important [17,18,19].
This paper discusses a design of a BMS solution for extending the life of NI-MH battery. A high precision dedicated energy metering chip is used to solve the problem of traditional Ampere-Hour (AH) integral measure error. Using the equation for estimating the loss error, combined with the battery state estimation model, the online correction loop is established. Compared to the AH integral method, the battery status is more accurately estimated. The SoC correction of each operating cycle ensures that the accumulated error is controllable. Based on the accurate estimation of SoC, the adaptive adjustment method of operation interval is proposed. The voltage difference of the single monomer and the attenuation of the battery capacity are used to compare battery life. In contrast with BMS using AH integral method and fixed SoC operating range, the life of battery is extended efficiently after two years of operation.

2. System Introduction and Problem of Battery Life

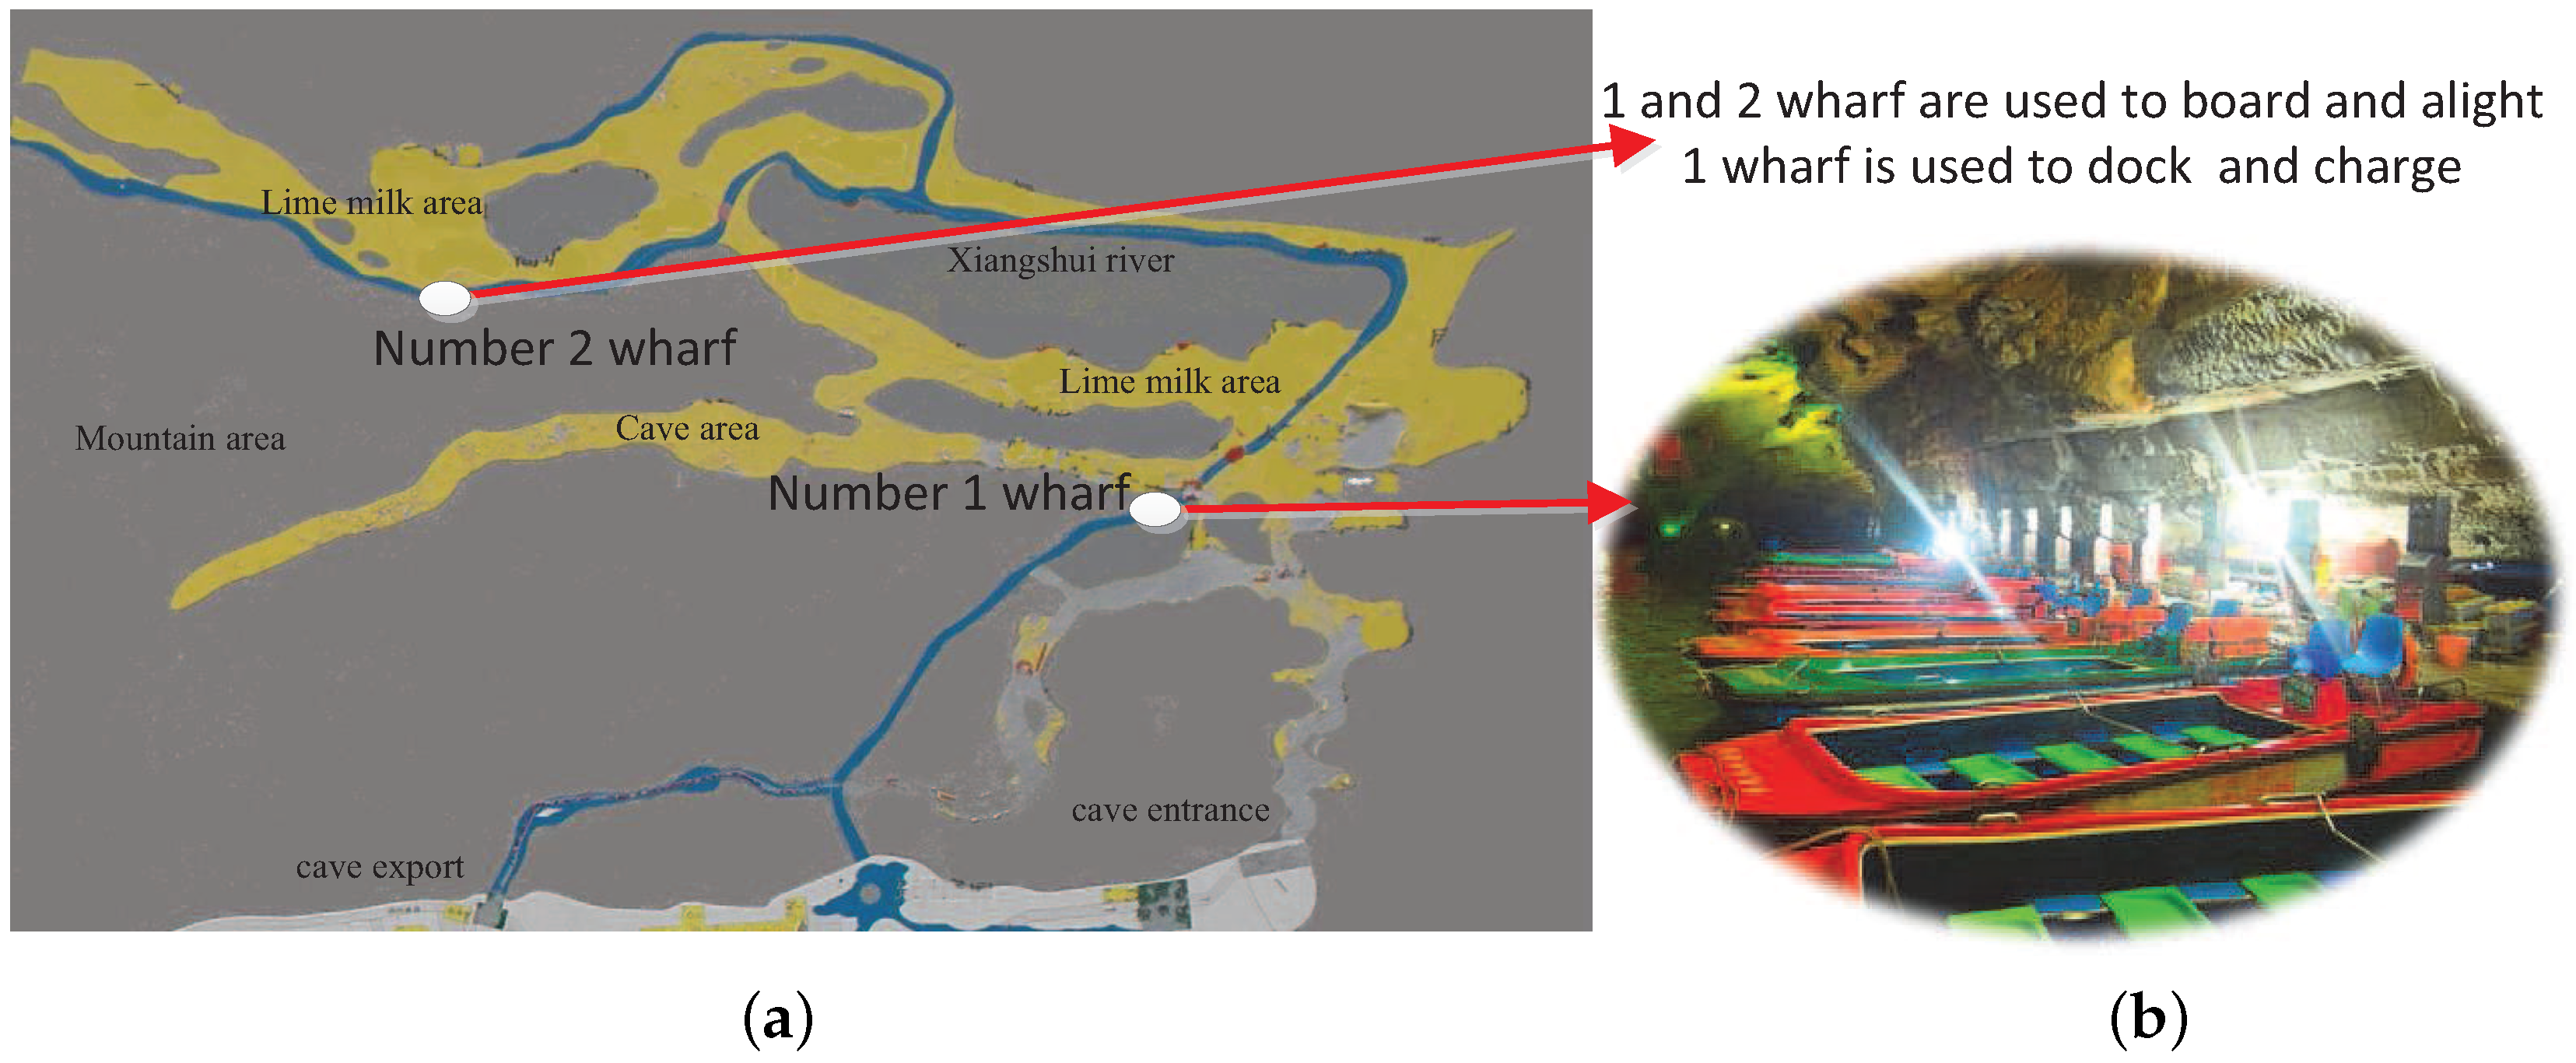
2.1. Running Environment of Electric Boat

Huanglong Cave is a karst cave, which is located near the Wulingyuan of Zhangjiajie City, Hunan Province, China. As a national 4A rated scenic area, it has over three million visitors per year. The guided tour through the cave lasts about two hours and includes a boat ride down one of the underground rivers. The underground river is scheduled by boats. Since the karst cave is a closed system, boats that run on oxygen consuming fuel are strictly prohibited in the cave.
As shown in Figure 1, the boat operates during the day and recharges at night. Two wharfs are placed at each end of the river in the cave. The number 1 and 2 wharf are used to board and alight, while number 1 wharf is used to dock and charge. There are more than 30 boats, each with a special berth for docking and charging. Each boat is designed to load 15 passengers and needs to operate about 20 runs per day. The actual operating load and the number of trips are affected by the passenger flow.
The shipping lane is very narrow in the cave, limiting the size of boat and capacity of the batteries. Although the designed battery capacity can meet the daily operation, the fluctuation of passenger flow will have an impact on the optimal operating range of the battery.

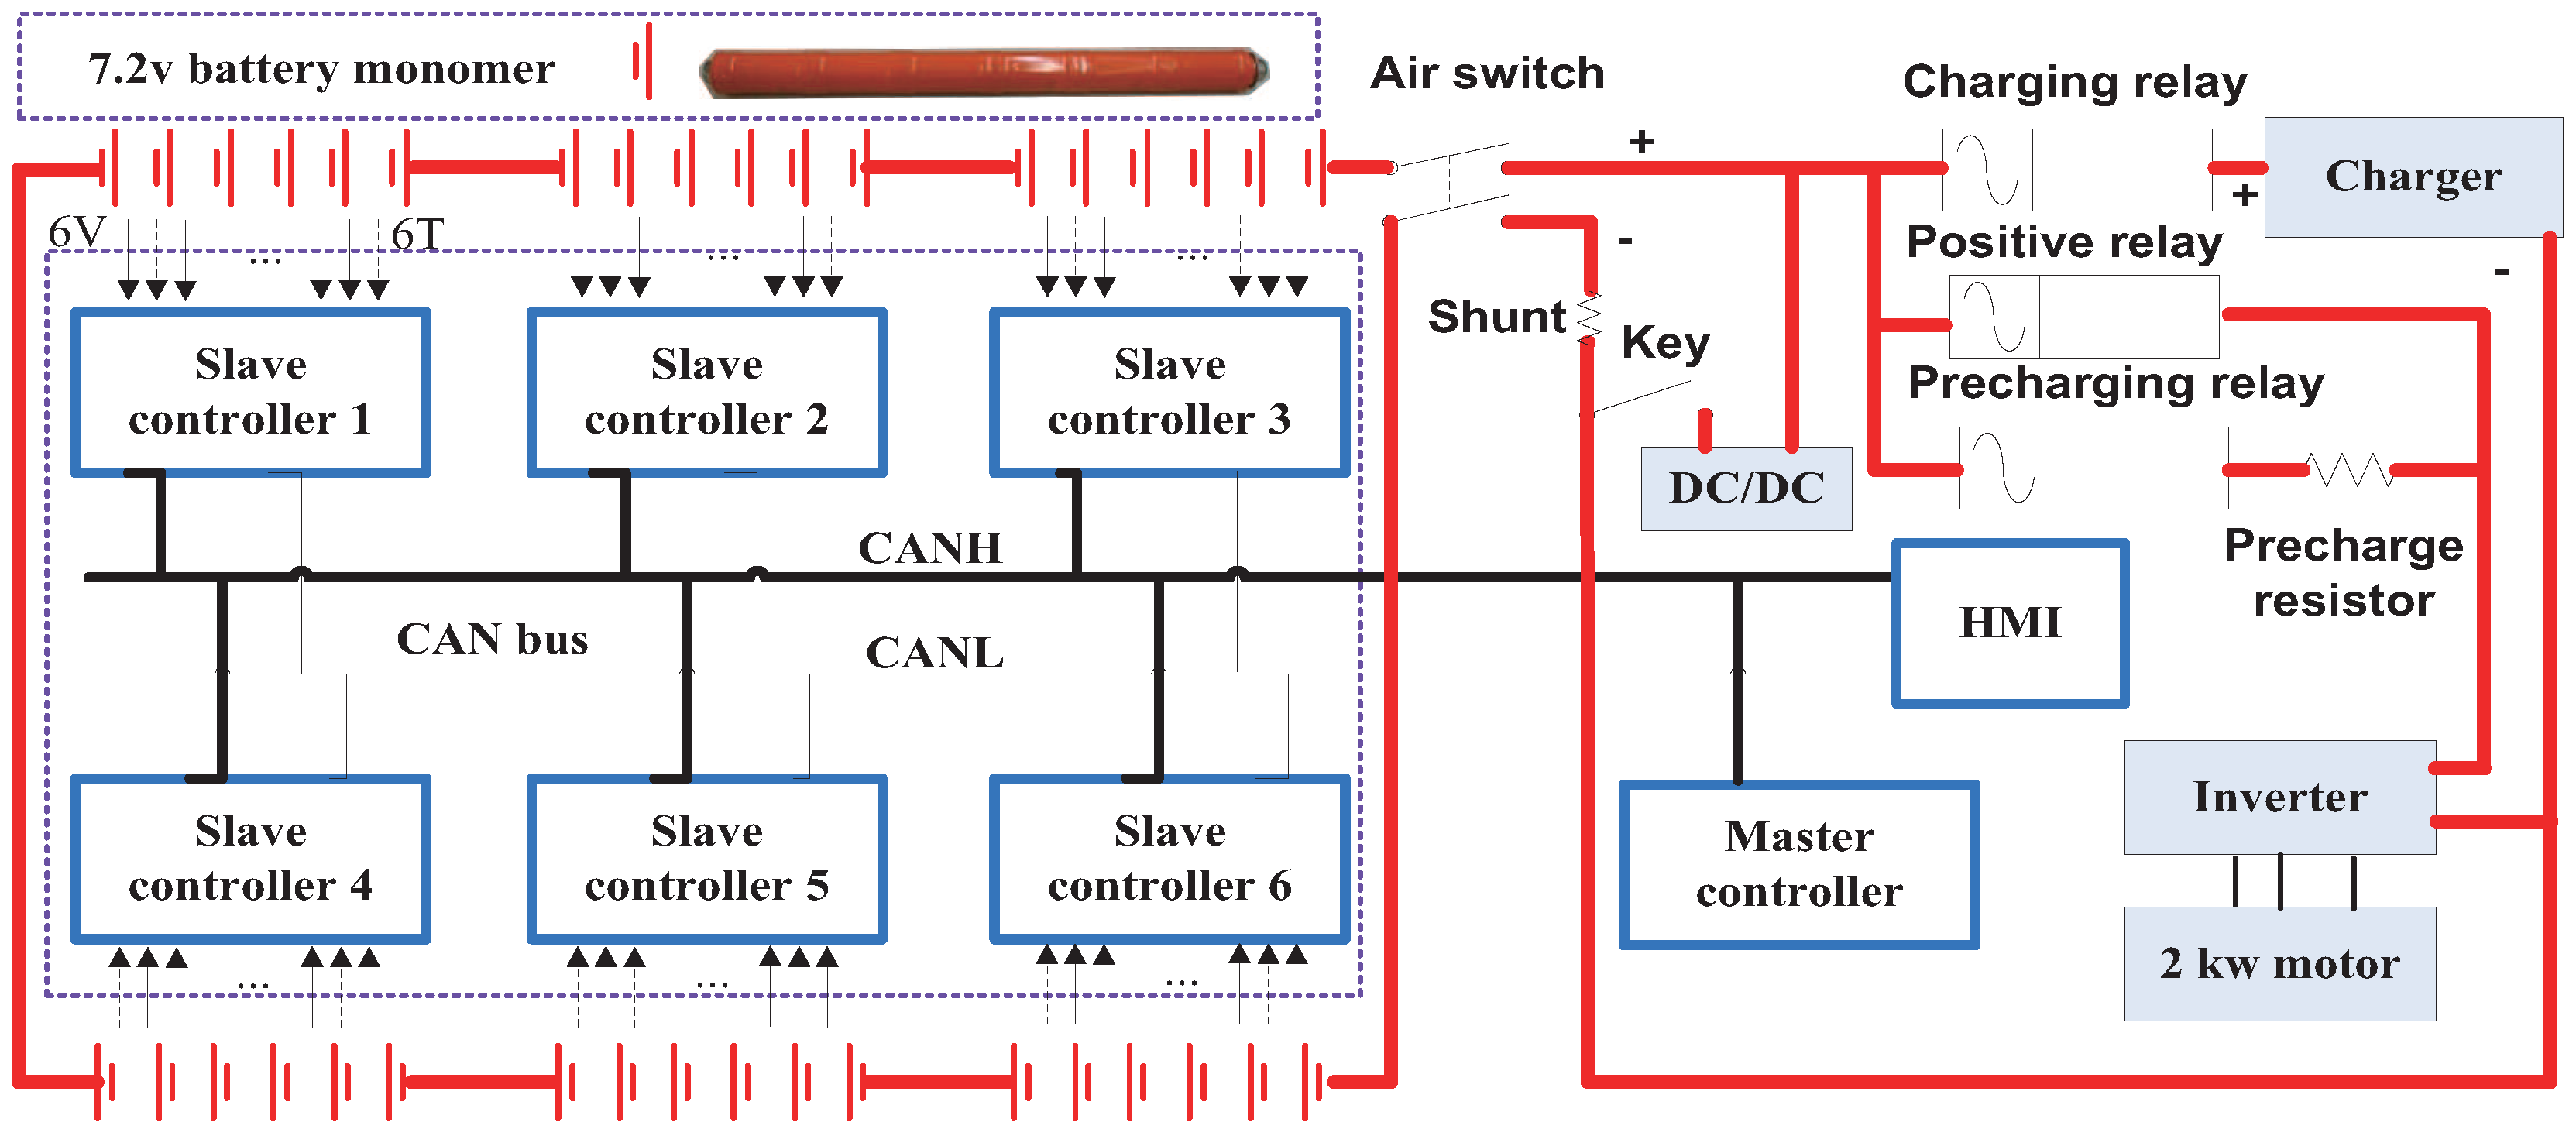
2.2. The System Structure of Electric Boat

Considering the actual installation conditions, the capacity and cost, the electrical system structure is designed as shown in Figure 2. Each monomer is composed of six series cells. The nominal voltage of each cell is 1.2 V, while capacity is 6 Ah. The six parallel connected monomers form a unit, while thirty-six units are connected in series. Every six units is monitor encapsulated in a package, which is managed by a slave controller. The slave controller is responsible for the monitoring of voltage, balance management, temperature detection and fan control.
The six-piece slave controllers send real-time status information through Controller Area Network (CAN) bus, while receiving control and dispatch commands from the master controller. The main controller samples the current using the shunt, measures the total voltage and receives the data from the slave controller. This information allows us to draw conclusions regarding the status of the battery. When the driver input operation instruction and safety conditions allow, the battery is connected to the electricity equipment through coordination of pre-charging relay and positive relay. During the charging process, charging relay is closed to connect charger and battery. If there are safety risks, all relays will be disconnected.
Through Human Machine Interface (HMI), buttons, keys and switches, the driver obtain information of the boat and drive the boat according to a fixed schedule. The nominal total voltage of 260 V from all battery packs will be converted to 24 V through Direct Current Direct Current (DCDC) converter, which will supply power for all low-voltage electronic devices. A 2 kW motor and its controller are used to drive the boat. Master controller to control charging relay, the main relay and pre-charging relay which realize the charging and discharging. Through acquisition boards in each of the six series of 7.2 V module on all voltages and her temperature.
The overall battery capacity is 36 Ah. To complete the operation of about 20 trips every day, the Depth of Discharge (DoD) may increase up to 70%. At the same time, it is requested to ensure the operation of charging and discharging cycle to 5 years of operation. In the continuous discharging and charging cycle, the improvement of battery life needs a reasonable strategy to make the battery work in a reasonable range.

2.3. Effective Methods of Prolonging Battery Life

Due to the inherent characteristics of the high power discharge capacity, high safety and high cycle life, NI-MH battery is suitable for Hybrid Electrical Vehicle (HEV) [20]. With relatively small energy density compared to lithium battery, extending NI-MH battery life for purely electric application is a challenging problem [19,21,22,23]. It mainly involves key issues as follows:
(a)
Improvements of the battery-electrode materials and formula: formula optimizations of negative electrode and positive electrode, selection of binder and additives, optimization of electrolyte and cell design are effective methods to extend NI-MH cell cycle life [2].
(b)
Rational control of charging current: in general, the charging efficiency of battery decreases as the current increases, and the charging and discharging using small current has certain repairing effect on the battery [24]. However, the voltage may be not increase significantly, when NI-MH battery is charged under high SoC using small current. In this situation, improper charging current may result in battery damage.
(c)
Reasonable control of DoD: in a multi-cell pack, reasonable DoD is very important to improve the cycle life performance. According to the tests in a HEV NI-MH pack, cycle life can be reduced from 5000 cycles to 500 cycles while the DoD is increased from 10% to 90% [2]. Allowing the battery to run in a neutral state with low resistance characteristics can effectively reduce the battery loss and improve the service life. Certainly, it heavily relies on accuracy of SoC estimate.
(d)
Suitable temperature range control: at different temperatures, the battery shows different cycle life. Due to the thermostatic properties of the cave, the main consideration is heat management in charge process [5].
(e)
Strict protection against overcharging: The test results have shown that a small amount of over-charging or over-discharging will significantly shorten the life of batteries, although it does not cause premature failure. For example, over-charging NI-MH batteries by 0.2 V can resulted in a 40% loss of cycle life in some tests [25].
For improvement of battery cycle life, it is very important to control battery operates within a reasonable range [21]. Accurate estimation of SoC through appropriate methods, is the basis to ensure battery work in the optimal operation range.

3. The Key Factors Affecting High Precision SoC Estimation

The estimation accuracy of the battery state is mainly guaranteed by these aspects: accurate measurement methods assuring the accuracy of basic data such as voltage current and energy; in-depth analysis of battery characteristics ensuring the rationality of computing processes; accurate battery parameter identification usd to reduce interference and cumulative error.

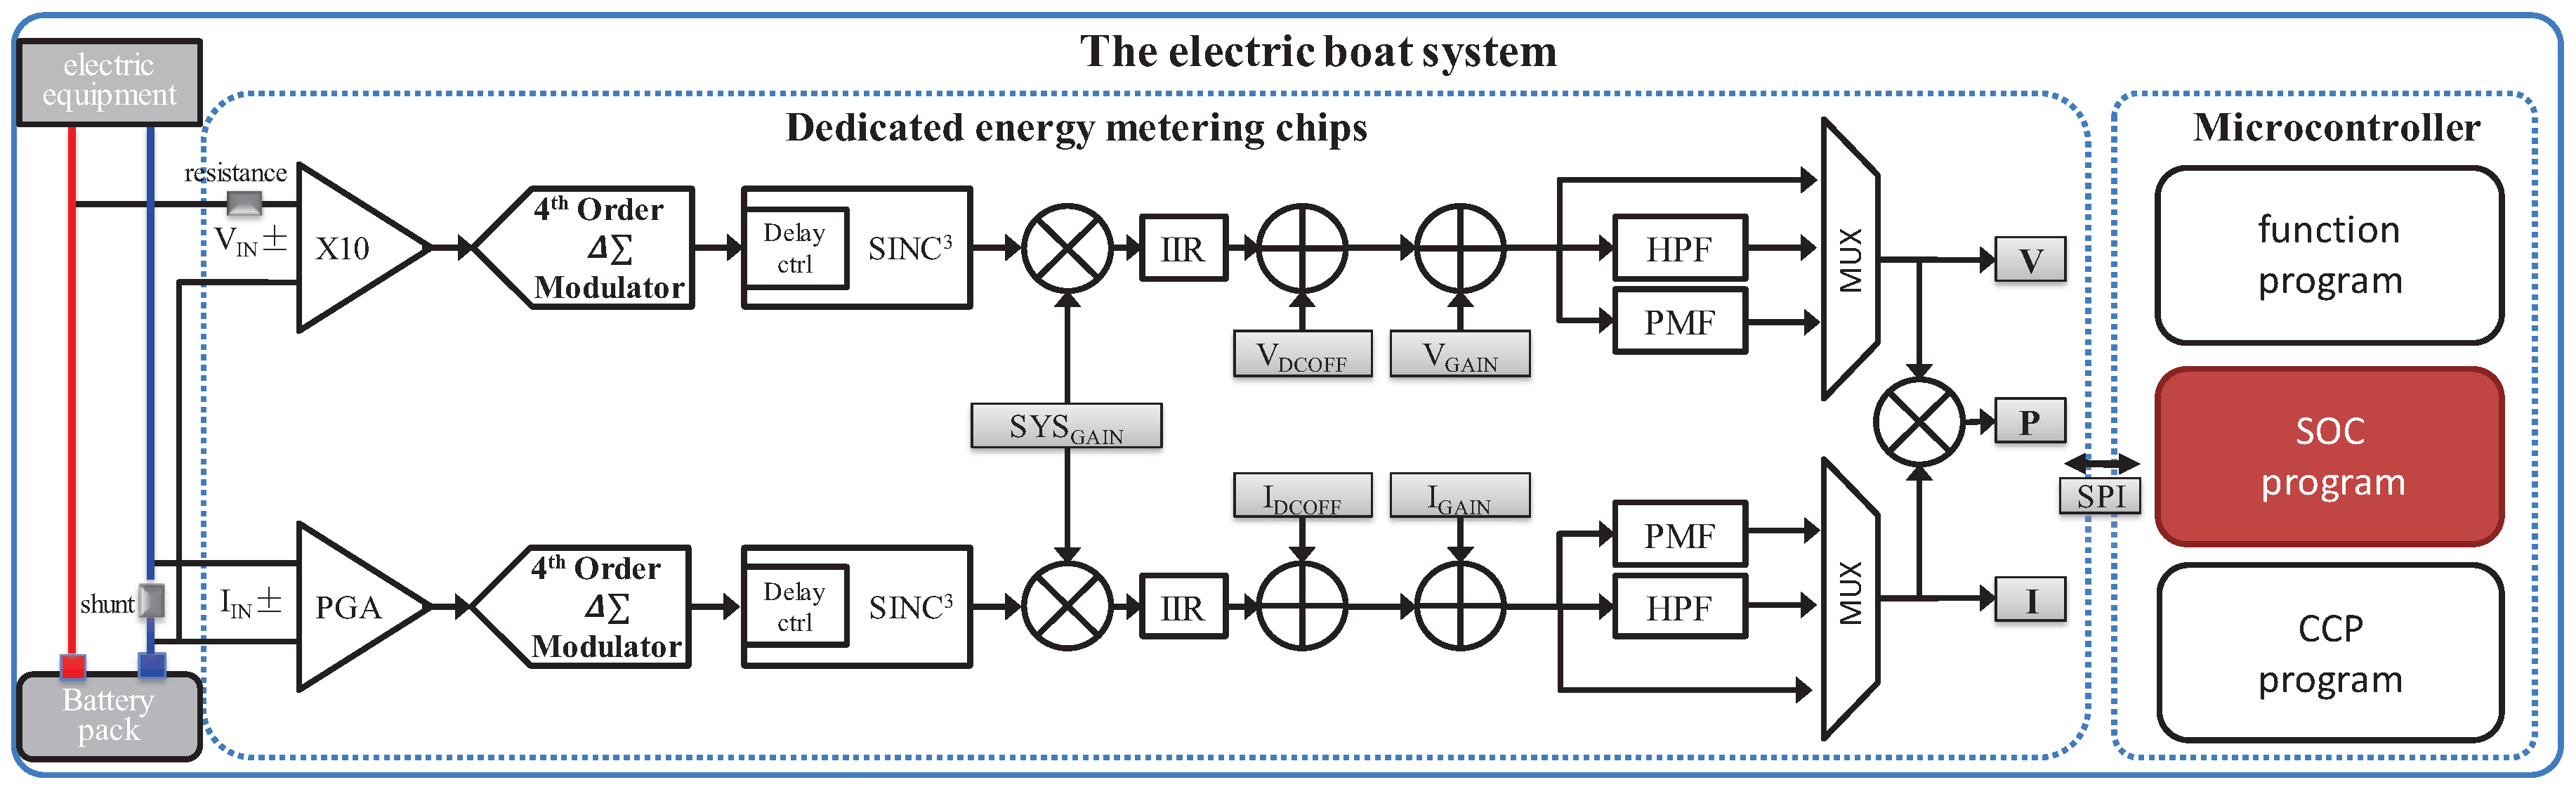
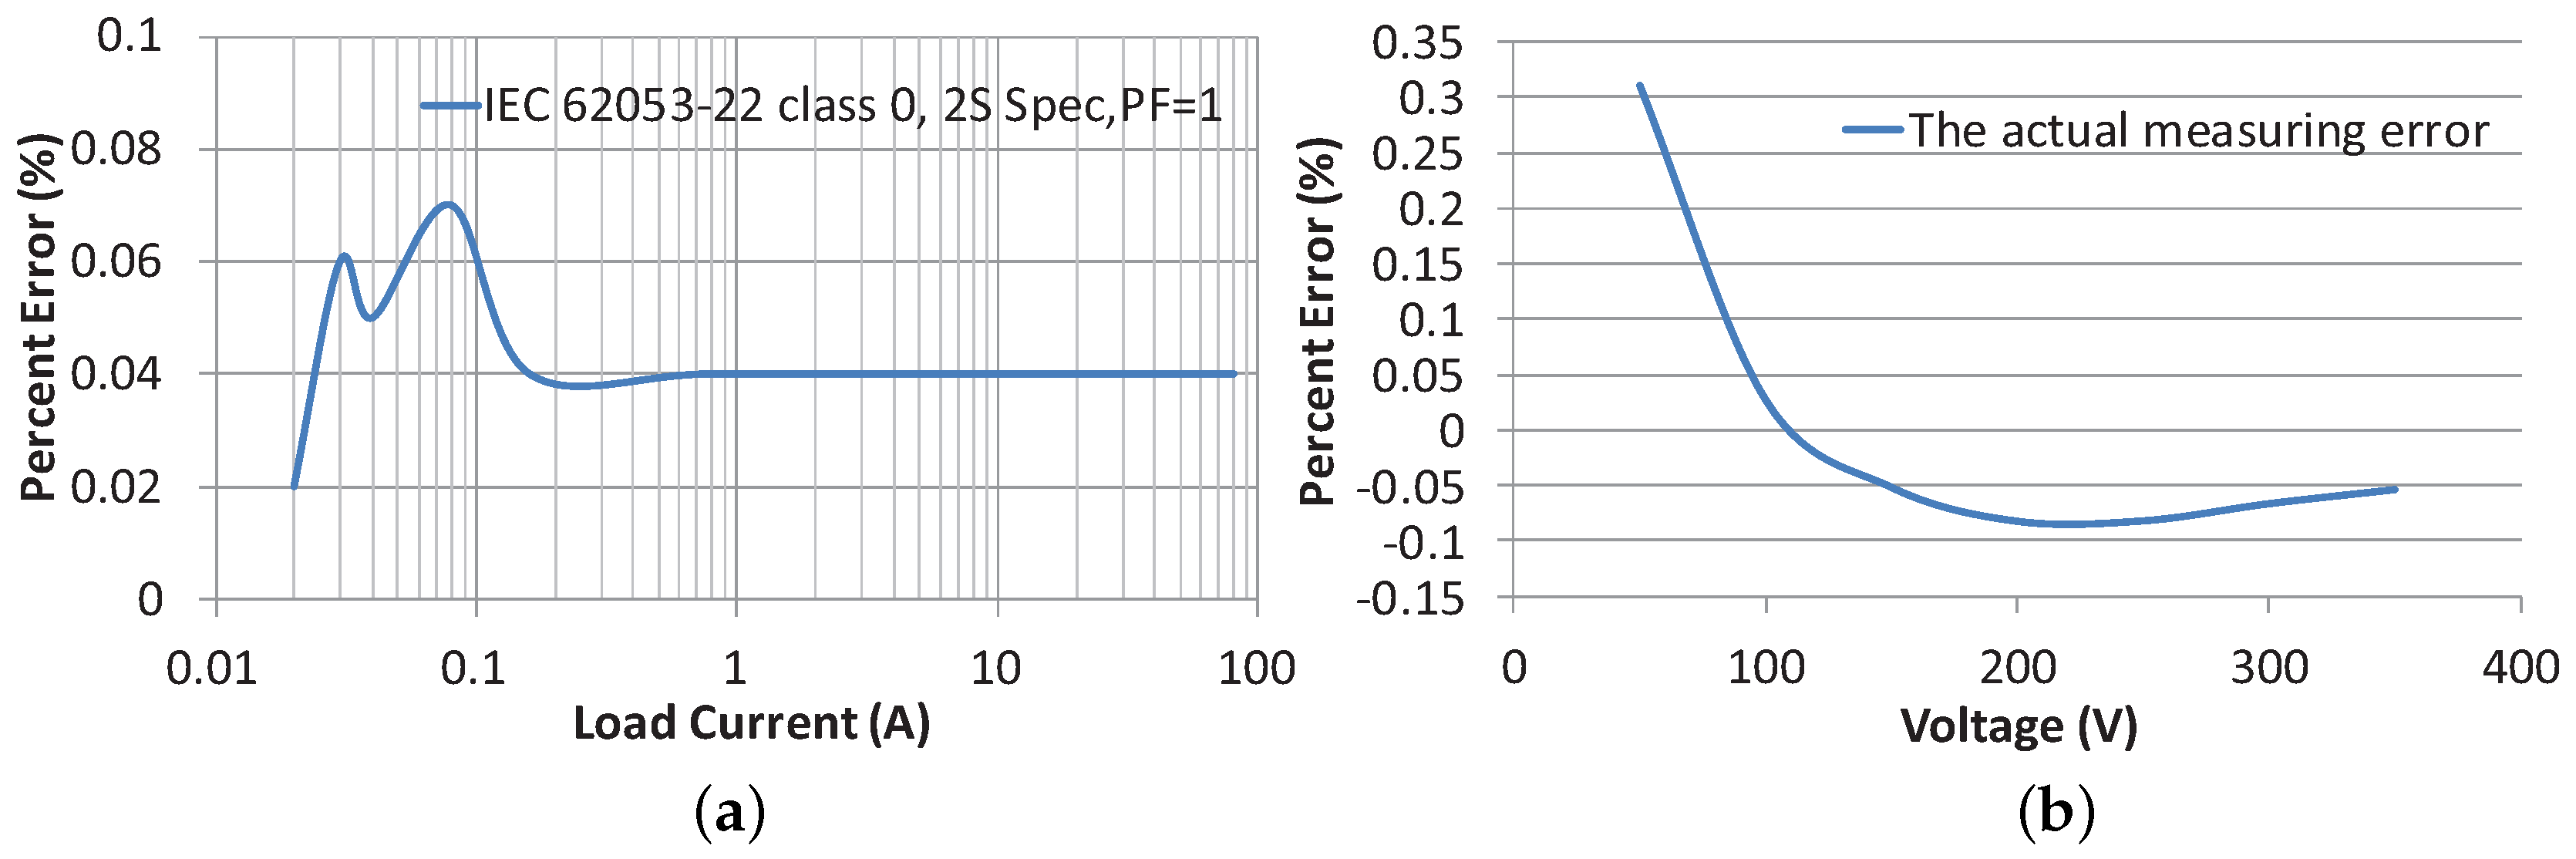
3.1. Structure and Precision of Energy Metering System

In order to complete the accurate measurement, a specialized energy metering hardware solution is used to accurately calculate the energy in the running process. As shown in Figure 3, hardware system is designed to sample voltage and current. Meanwhile, power and energy are computed through complex signal processing.
The voltage from the shunt is used to measure current, after properly amplified. The total voltage of battery pack can be measured, using necessary voltage divider and signal conditioning method. For V I N , a 10X gain is set. In order to match different parameter of shunt circuit, a Programmable Gain Amplifier (PGA) is used to select input gains of the current chanel. The delta-sigma modulators with fourth-order for both input channels are used to convert analog inputs to digital data. The rate of converters sample is MCLK/8. The master clock (MCLK) is up to 4 MHz. The design of high sampling rate not only provides a wide dynamic range, but also simplifies the design of the anti-alias filter. To improve the sampling accuracy, output data from the single-bit digital data modulater is widened to 24 bits. With low-pass third-order Sinc decimation filters, it also can be down sampled to M C L K / 1024 . System Gain ( SY S GAIN ) is finely adjusted to compensate error of voltage reference, which is applied to two channels. The “ a n t i - s i n c ” Infinite Impulse Response (IIR) filter is used to compensate for the amplitude roll-off of decimation filters.
The filter outputs pass through an droop-correction filter. Through flatten the magnitude response to the Nyquist frequency, accurate measurements of the channel out can up to 2 KHz. The DC gain and offset errors are corrected by gain and offset values for every instantaneous current and voltage sample in each channel. Any DC component from the selected signal paths is removed by Optional High-Pass Filters (HPF). Because each power calculation contains a voltage and current channel, a Phase-Matching Filter (PMF) should be applied to the other channel to match the phase response of the HPF, if an HPF is enabled in only one channel. Using suitable multiplexer, the voltage (V), current (I) and power (P) are measured. To eliminate any harmonics and help the crossing detection on the 50 Hz or 60 Hz fundamental component, cut-off frequency of low-pass filter is set to 80 Hz [26,27].
For high accuracy measurement, high precision charging-discharging equipment from bitrode and voltage source minimum voltage resolution up to 1 uV are used for calibration. Through CAN Calibration Protocol (CCP), the calibrated data and information interact between the calibration equipment and BMS. Then, the real-time measurement data is sent to microcontroller of BMS by Serial Peripheral Interface (SPI), while calibration data is sent to dedicated energy metering chips. The calibration data refer to the deviation values between measured data and the data from the calibration equipment [28].
The sampling accuracy of voltage and energy is shown in Figure 4. Due to the fact that the data of the current is involved in the immediacy of the data transfer, it is easier to understand the current trend from the contrast between energy and voltage.
The energy calculation is realized through high frequency sampling and hardware multiplication in proposed method. Due to the small current change of high frequency can be measured, the measurement accuracy can be improved. Under the same voltage and current sampling accuracy, the integral of an ampere hour will be one thousandth of the error in a charge and discharge period. In contrast, the proposed low-cost hardware scheme is of an order of magnitude with the use of high-end equipment and algorithms [29].
There are many practical factors: temperature, internal resistance loss, the uncertainty of electric static loss, operation characteristics, and so on. Due to changing factors, the actual running of SoC is not completely consistent with loss of energy. Although the high accuracy of proposed solution will be of great help to SoC estimation, an online correction method associated with battery characteristics is still necessary. To complete the scientific management of BMS, it need in-depth understanding of the battery characteristics in addition to high precision measurement of voltage, current and energy.

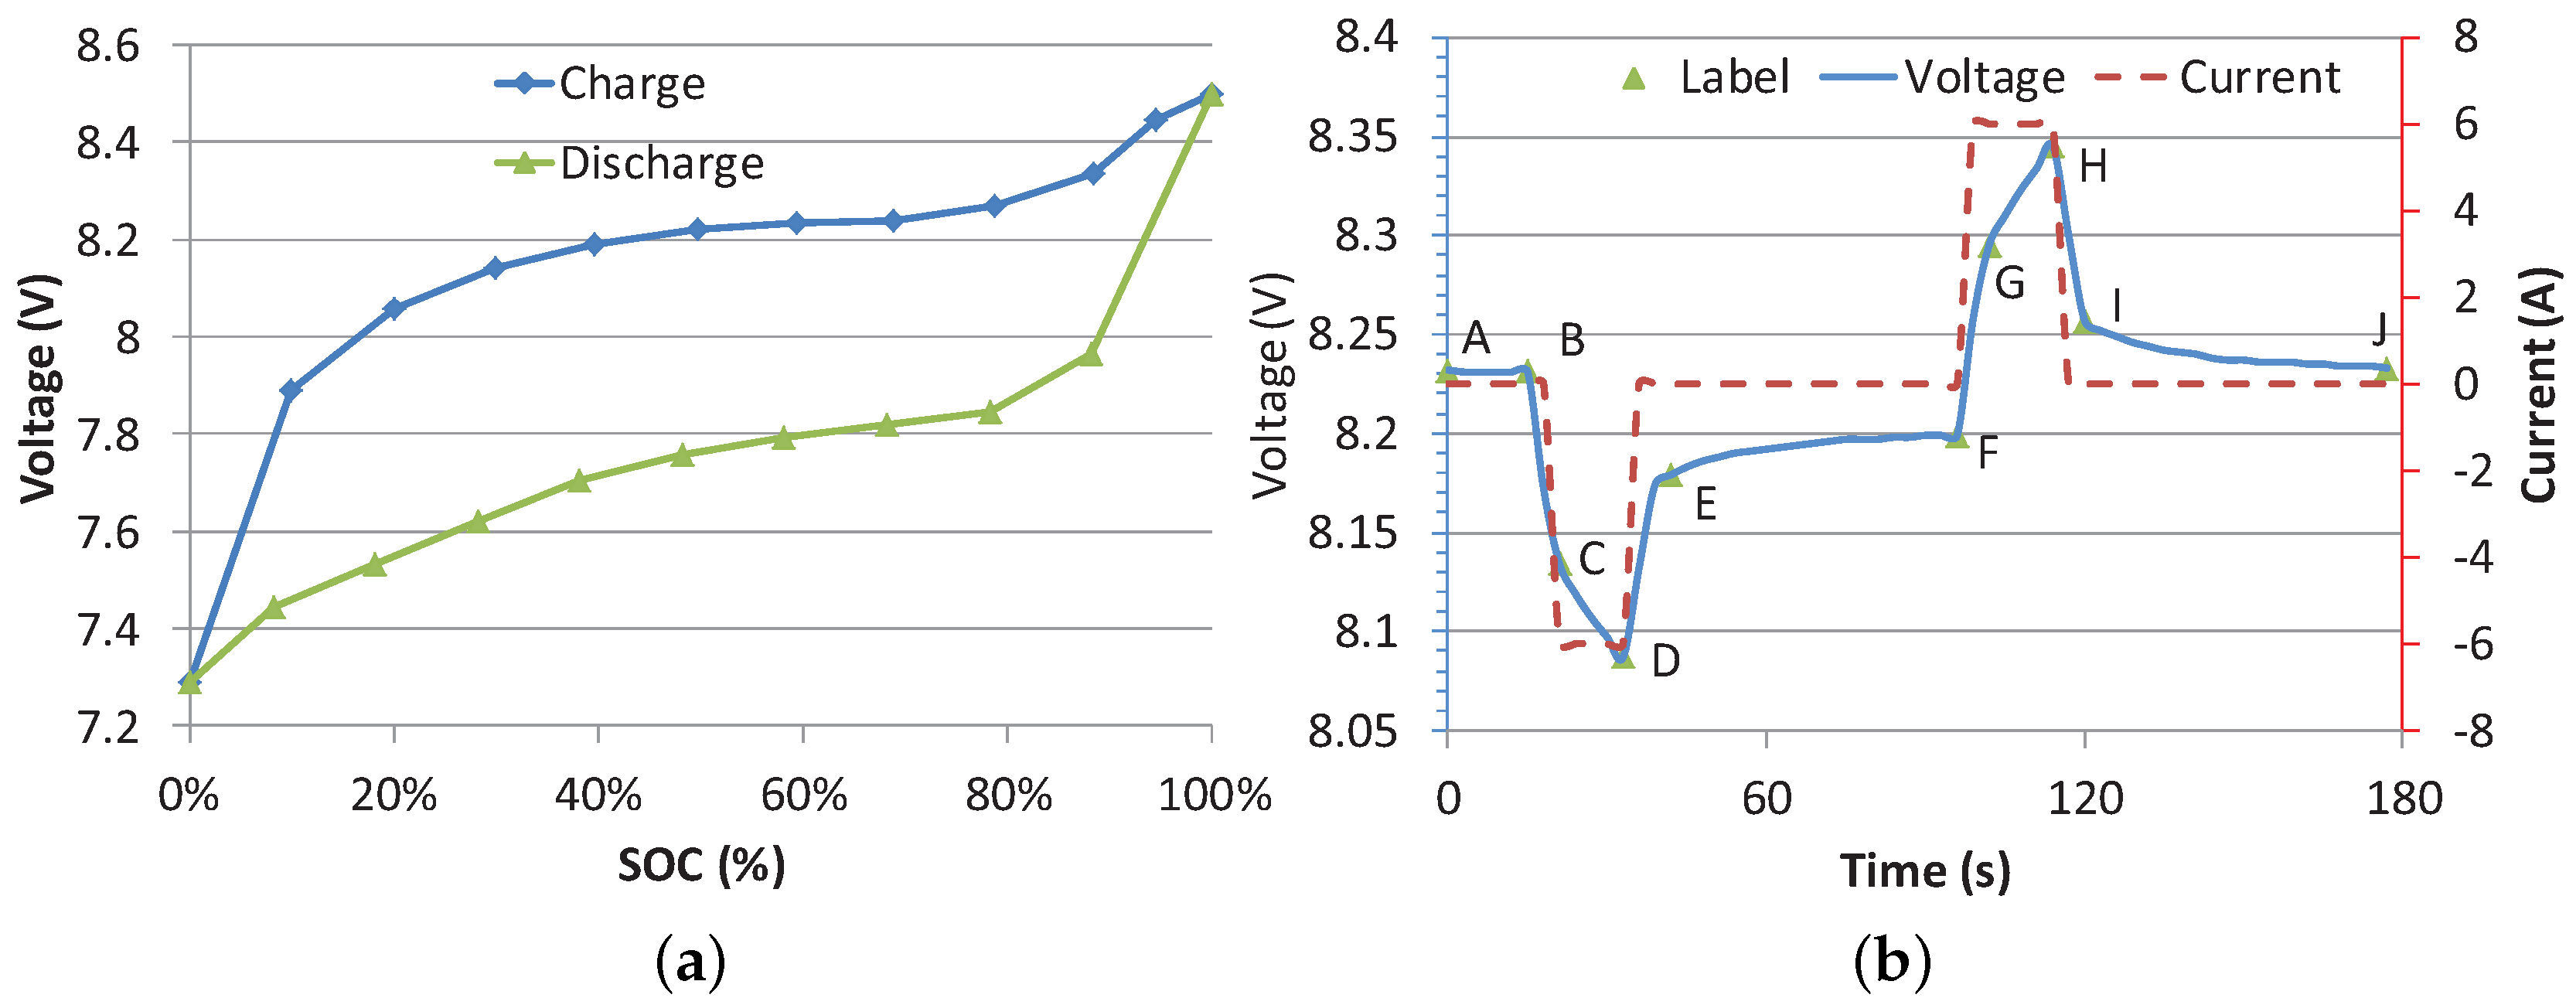
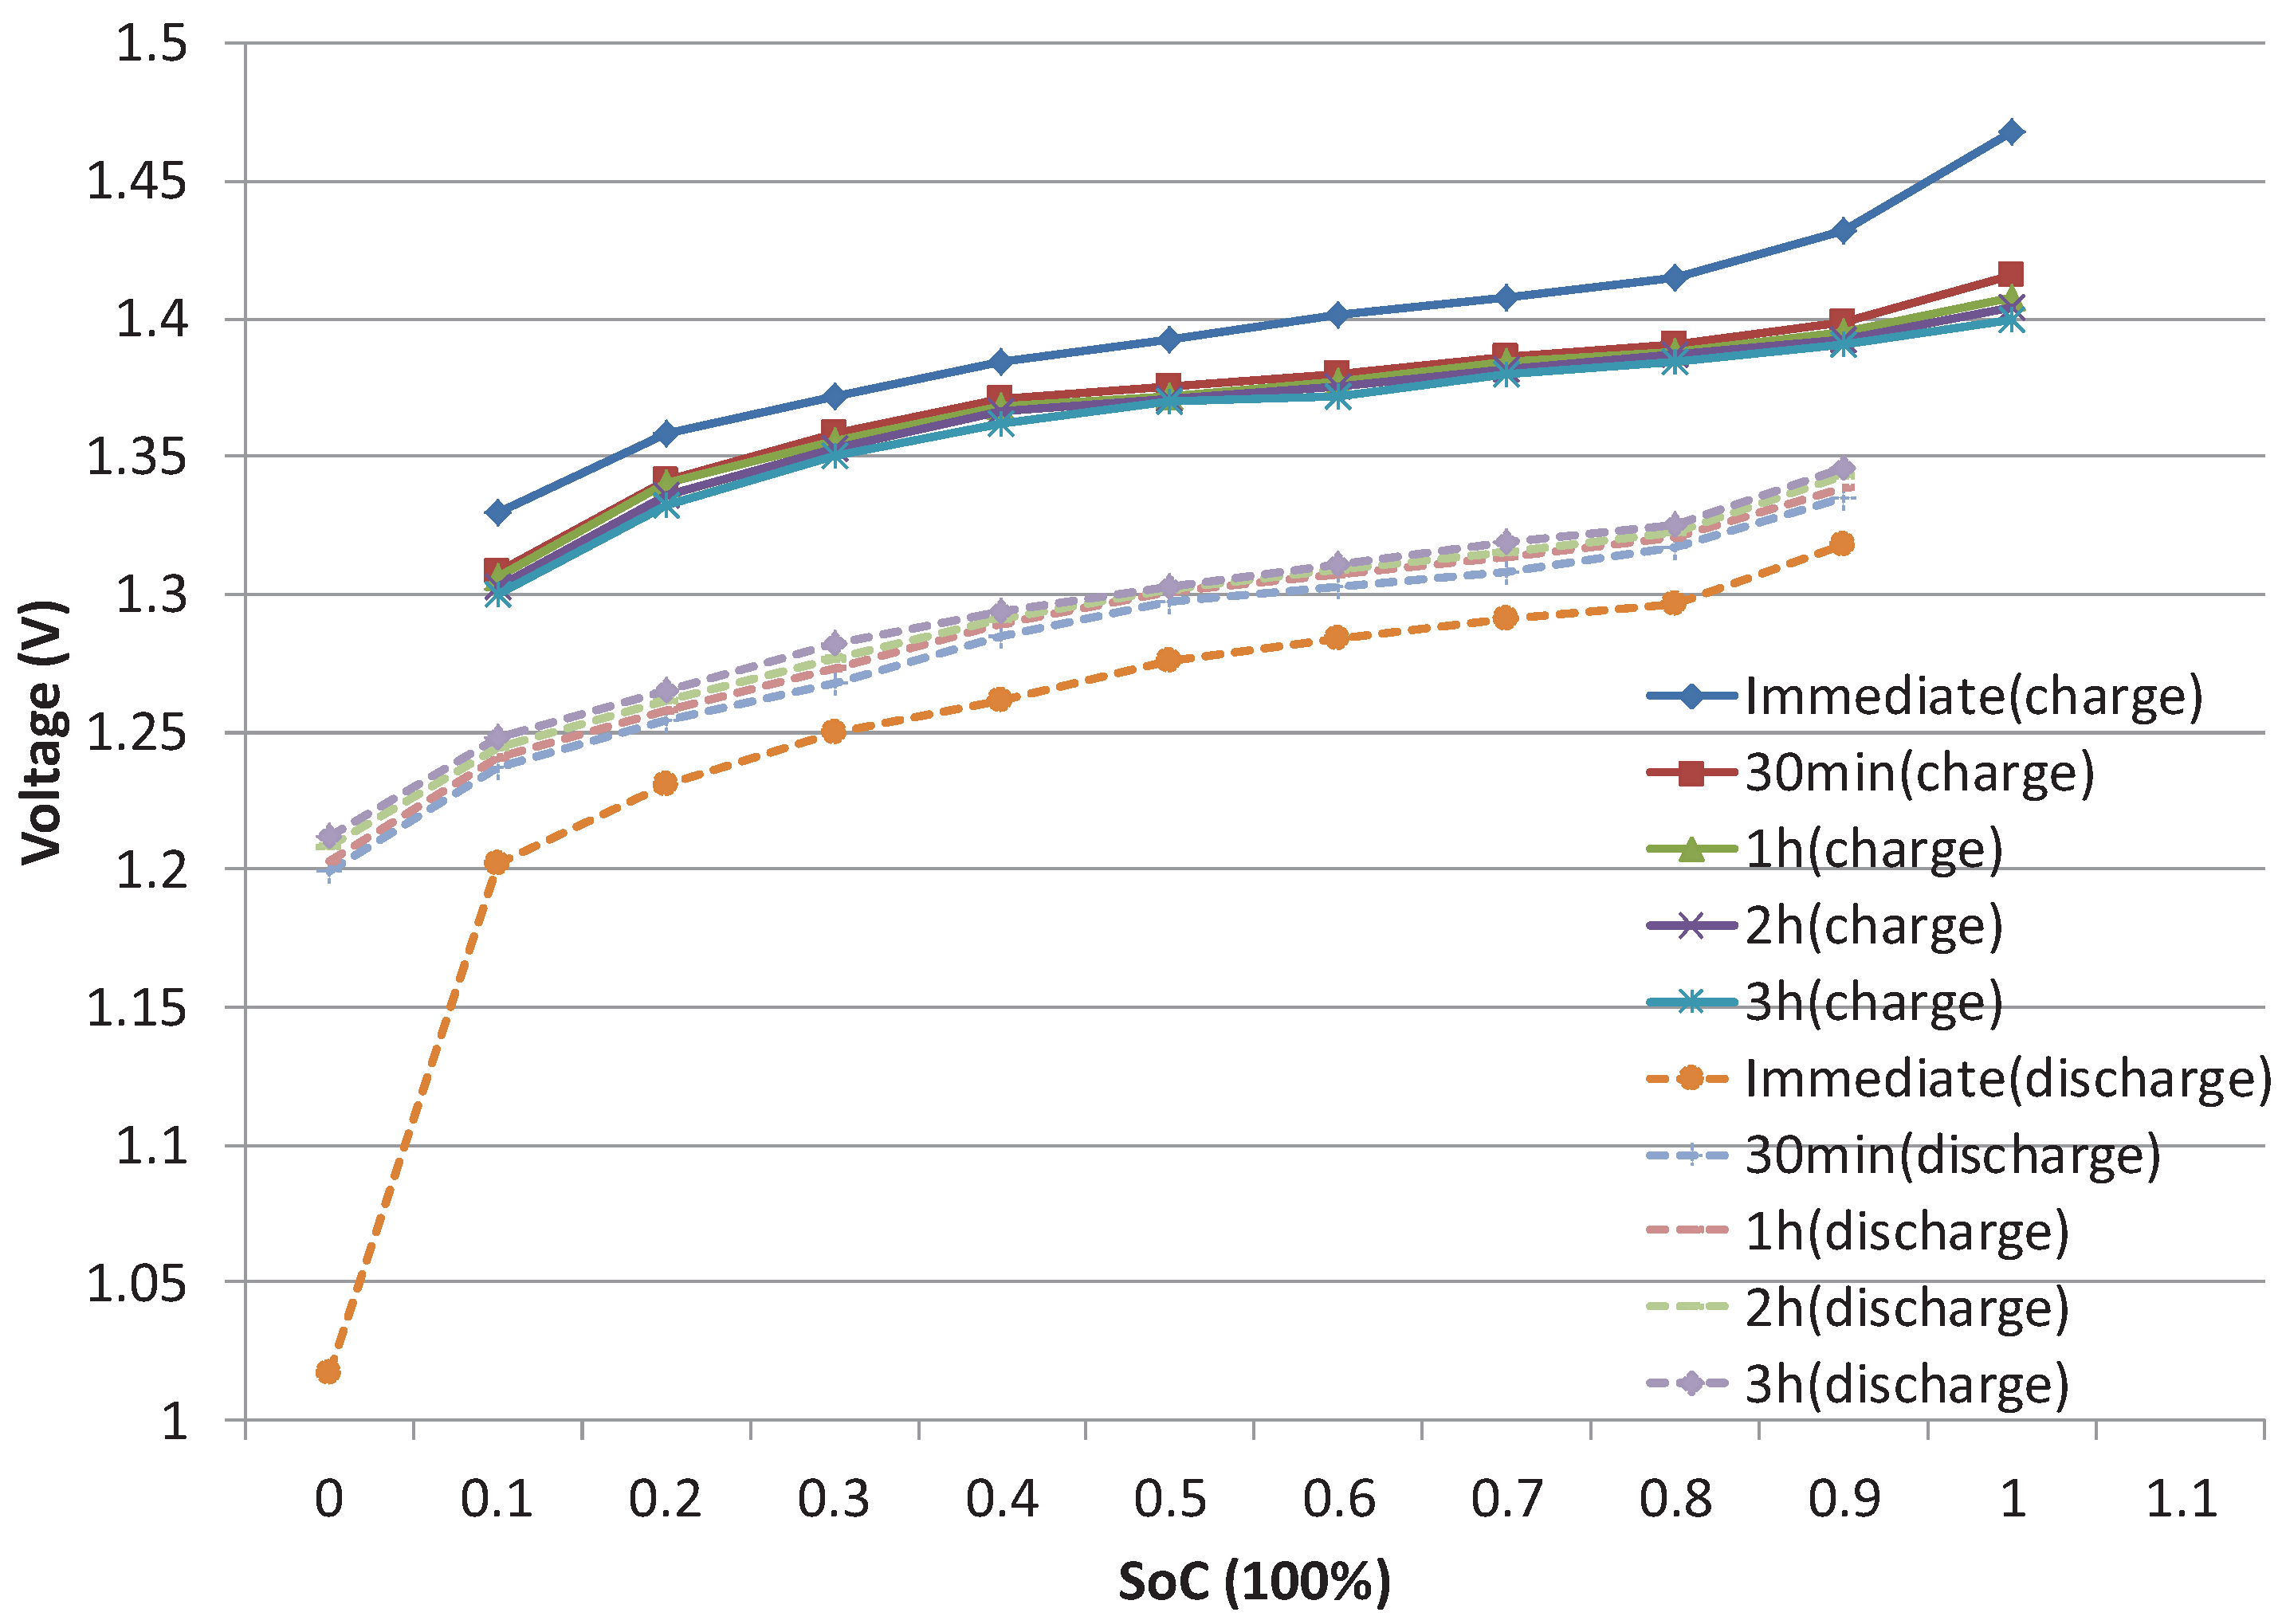
3.2. Electrical Characteristics of NI-MH Power battery

To assess electrical characteristics of NI-MH battery, L6 monomer formed by 6 battery cells is adopted to Hybrid Pulse Power Characterization (HPPC) test. The nominal voltage and the nominal capacity of L6 monomer are 7.2 V and 6 Ah, respectively. Meanwhile, the OCV feature of the NI-MH battery also obtained through corresponding experiment. The detail of battery characteristics of HPPC and OCV is shown in Figure 5 [30,31,32].
In the OCV test, the battery is charged to 100% and discharged to 0% by constant current. In HPPC test: the monomer lay aside from time period A to B; from B to D period, battery is discharged for 15 s; from E to F battery lay aside for 60 s; from F to H period battery is charged for 15 s; from the moment I, the battery lay aside for 60 s. The laying aside means a status that is no charge or discharge.
By the test curve, in the middle range of different SoC corresponding voltage change is very gradual. The correction of SoC estimation is not sensible in the whole voltage range. The time of laying aside has an important influence on OCV.
Due to constant temperature in the working environment, as well as the low current charge and discharge of low amplitude changes in temperature, the temperature factor is not a major concern. However, the proper temperature protection is still necessary.
In order to compare different SoC status after laying aside for difference time, OCV test for NI-MH cell is carried out under the condition of laying aside for different time. As shown in Figure 6, the change of OCV can be leveled off after laying aside for a long time.
It should be noted that the OCV is uncertain due to continuous changes in actual operating conditions. Although the voltage measurement is very accurate, this OCV correction will still lead to some correction error. To realize accurate SoC estimation, analysis and calculation the battery model are effective way in addition to accurate measurements.

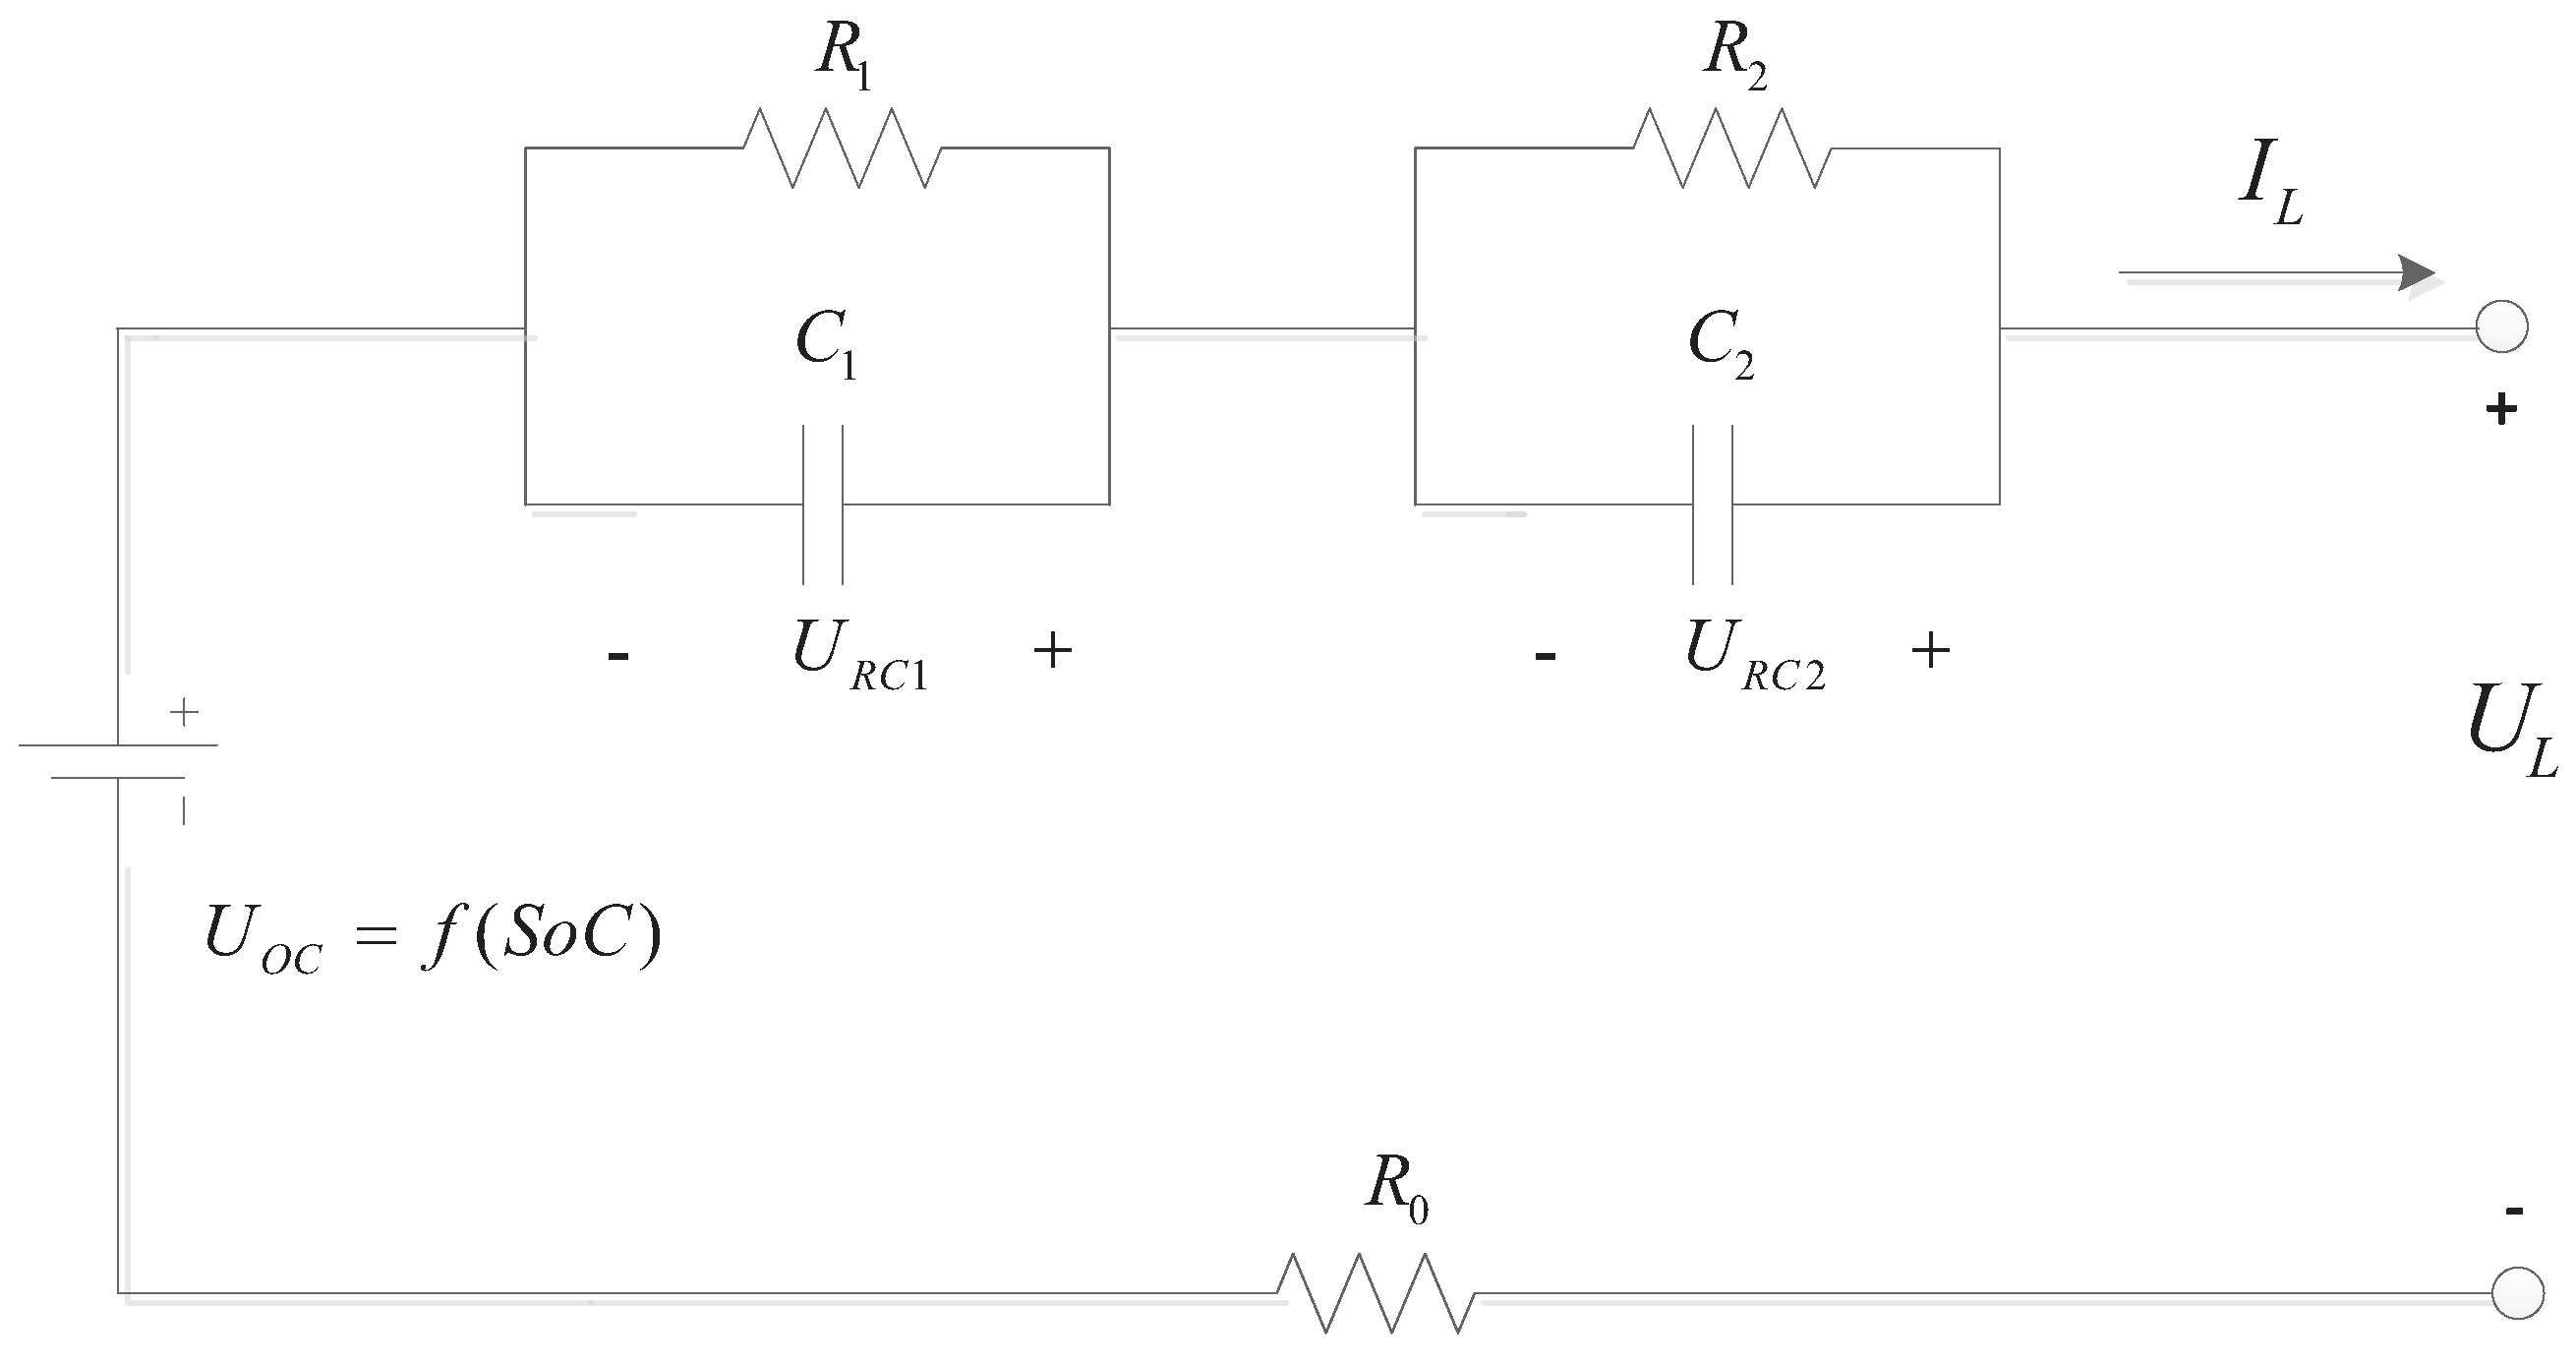
3.3. Suitable Model for NI-MH Battery

The RC model is a common model for describing battery characteristics. According to the actual test, the second-order RC model has higher precision than first-order, while 1 to 3 order have no significant improvement in accuracy. Finally, the second-order RC model is used for parameter identification and SoC estimation [33,34].
The schematic diagram of second-order RC model is shown in Figure 7, which has following parameters to be identified: the internal resistance of Ohm named R 0 , and the polarization resistance named R 1 and R 2 , polarization capacitance named C 1 and C 2 . Good modeling method not only considers the electrical characteristic of battery, but also needs to be combined with the working status of battery and charging-discharging strategy [35,36,37]. Because the proposed method requires correction parameters in the operation process, selection of high precision battery model for this method is very important.

4. SoC Online Calibration and Operation Range Optimization Method

Because running environment is relatively fixed, larger scale correction indexes can be set. The following section describe detail of optimizing the running parameters using the parameter online estimation method of Forgetting Factor Recursive Least Square (FFRLS) and Extended Kalman Filter (EKF), which makes the SoC run in a reasonable interval [38,39,40].

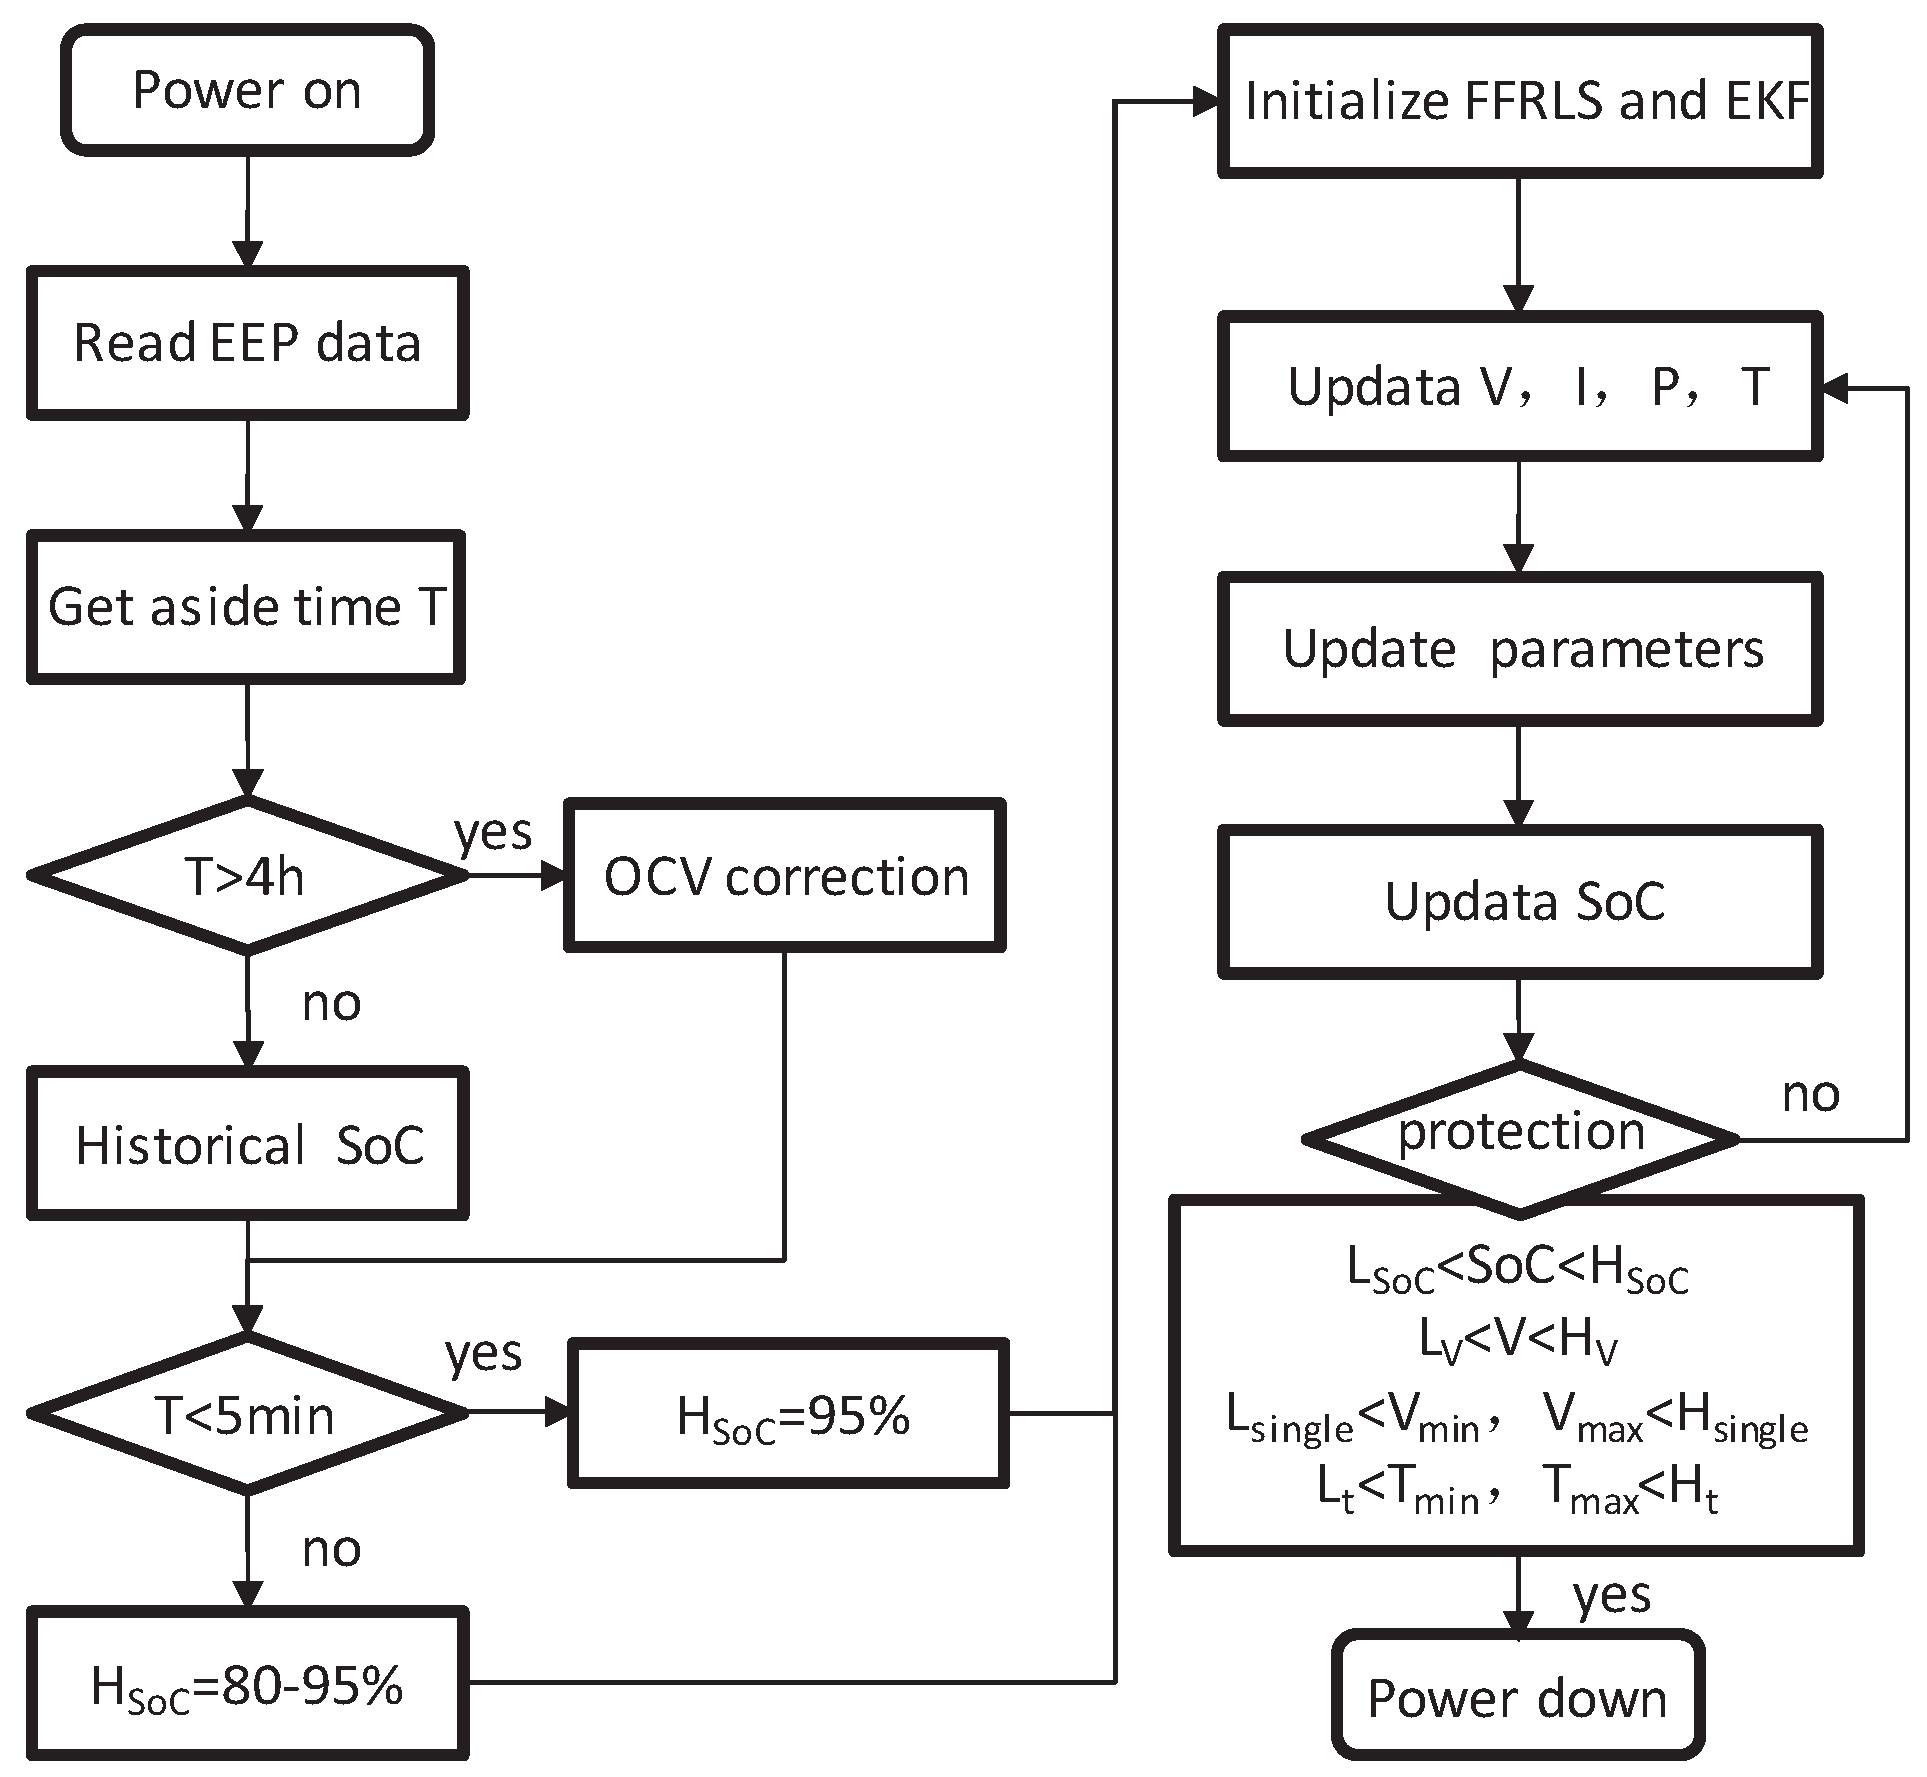
4.1. The Flow Chart of SoC Online Correction

The flow chart of BMS is shown in Figure 8. When system is powered on, the historical parameter are read from Electrically Erasable Programmable Read—Only Memory (EEPROM, abbreviated as EEP), which is stored when the power is off. The historical data include the SoC, time and the running parameters of last time power down. After system initialization, the voltage range and the deposited time decide whether to fix the OCV correction.
If SoC conditions meet the requirements, and time of laying aside is more than four hours, the SoC is allowed to calibrate by OCV, otherwise historical data of SoC is used as running data. The charging volume is determined by the assignment of H SoC . Under normal circumstances, H SoC is determined by the DoD of previous day. In particular, time interval between power-off and power-on within 5 min is considered to be a human input, indicating that there will be a peak passenger flow tomorrow and battery has to be fully charged in advance.
The Recursive Least Squares of the Forgetting Factor (FFRLS) and Extended Kalman Filter (EKF) are initialized to update running parameters. Then, the real-time voltage (V), current (I), power (P) and running parameters are used to update SoC accurately. When the battery is full or needs protection, the program control system loses power. The conditions of protection include over limit of SoC, total voltage, single voltage and temperature.
As shown in Figure 8, H SoC and L SoC are allowable maximum and minimum SoC. H V and L V are allowable maximum and minimum total voltage. V max and V min are maximum and minimum single unit voltage, while H single and L single are allowed maximum and minimum unit voltage. T max is T min are maximum and minimum single unit temperature, while H t and L t are allowed maximum and minimum unit temperature.
Through the OCV correction, SoC probably range can be locked in a certain range. As shown in Figure 6, OCV correction can bring a certain uncertainty due to the time of laying aside. Although energy metering accuracy is high, the factors such as self-discharge and different discharge efficiency still can cause uncertainty of SoC. Due to the charging current is relatively constant, with the parameter identification method to compensate the running error of SoC is a good method.

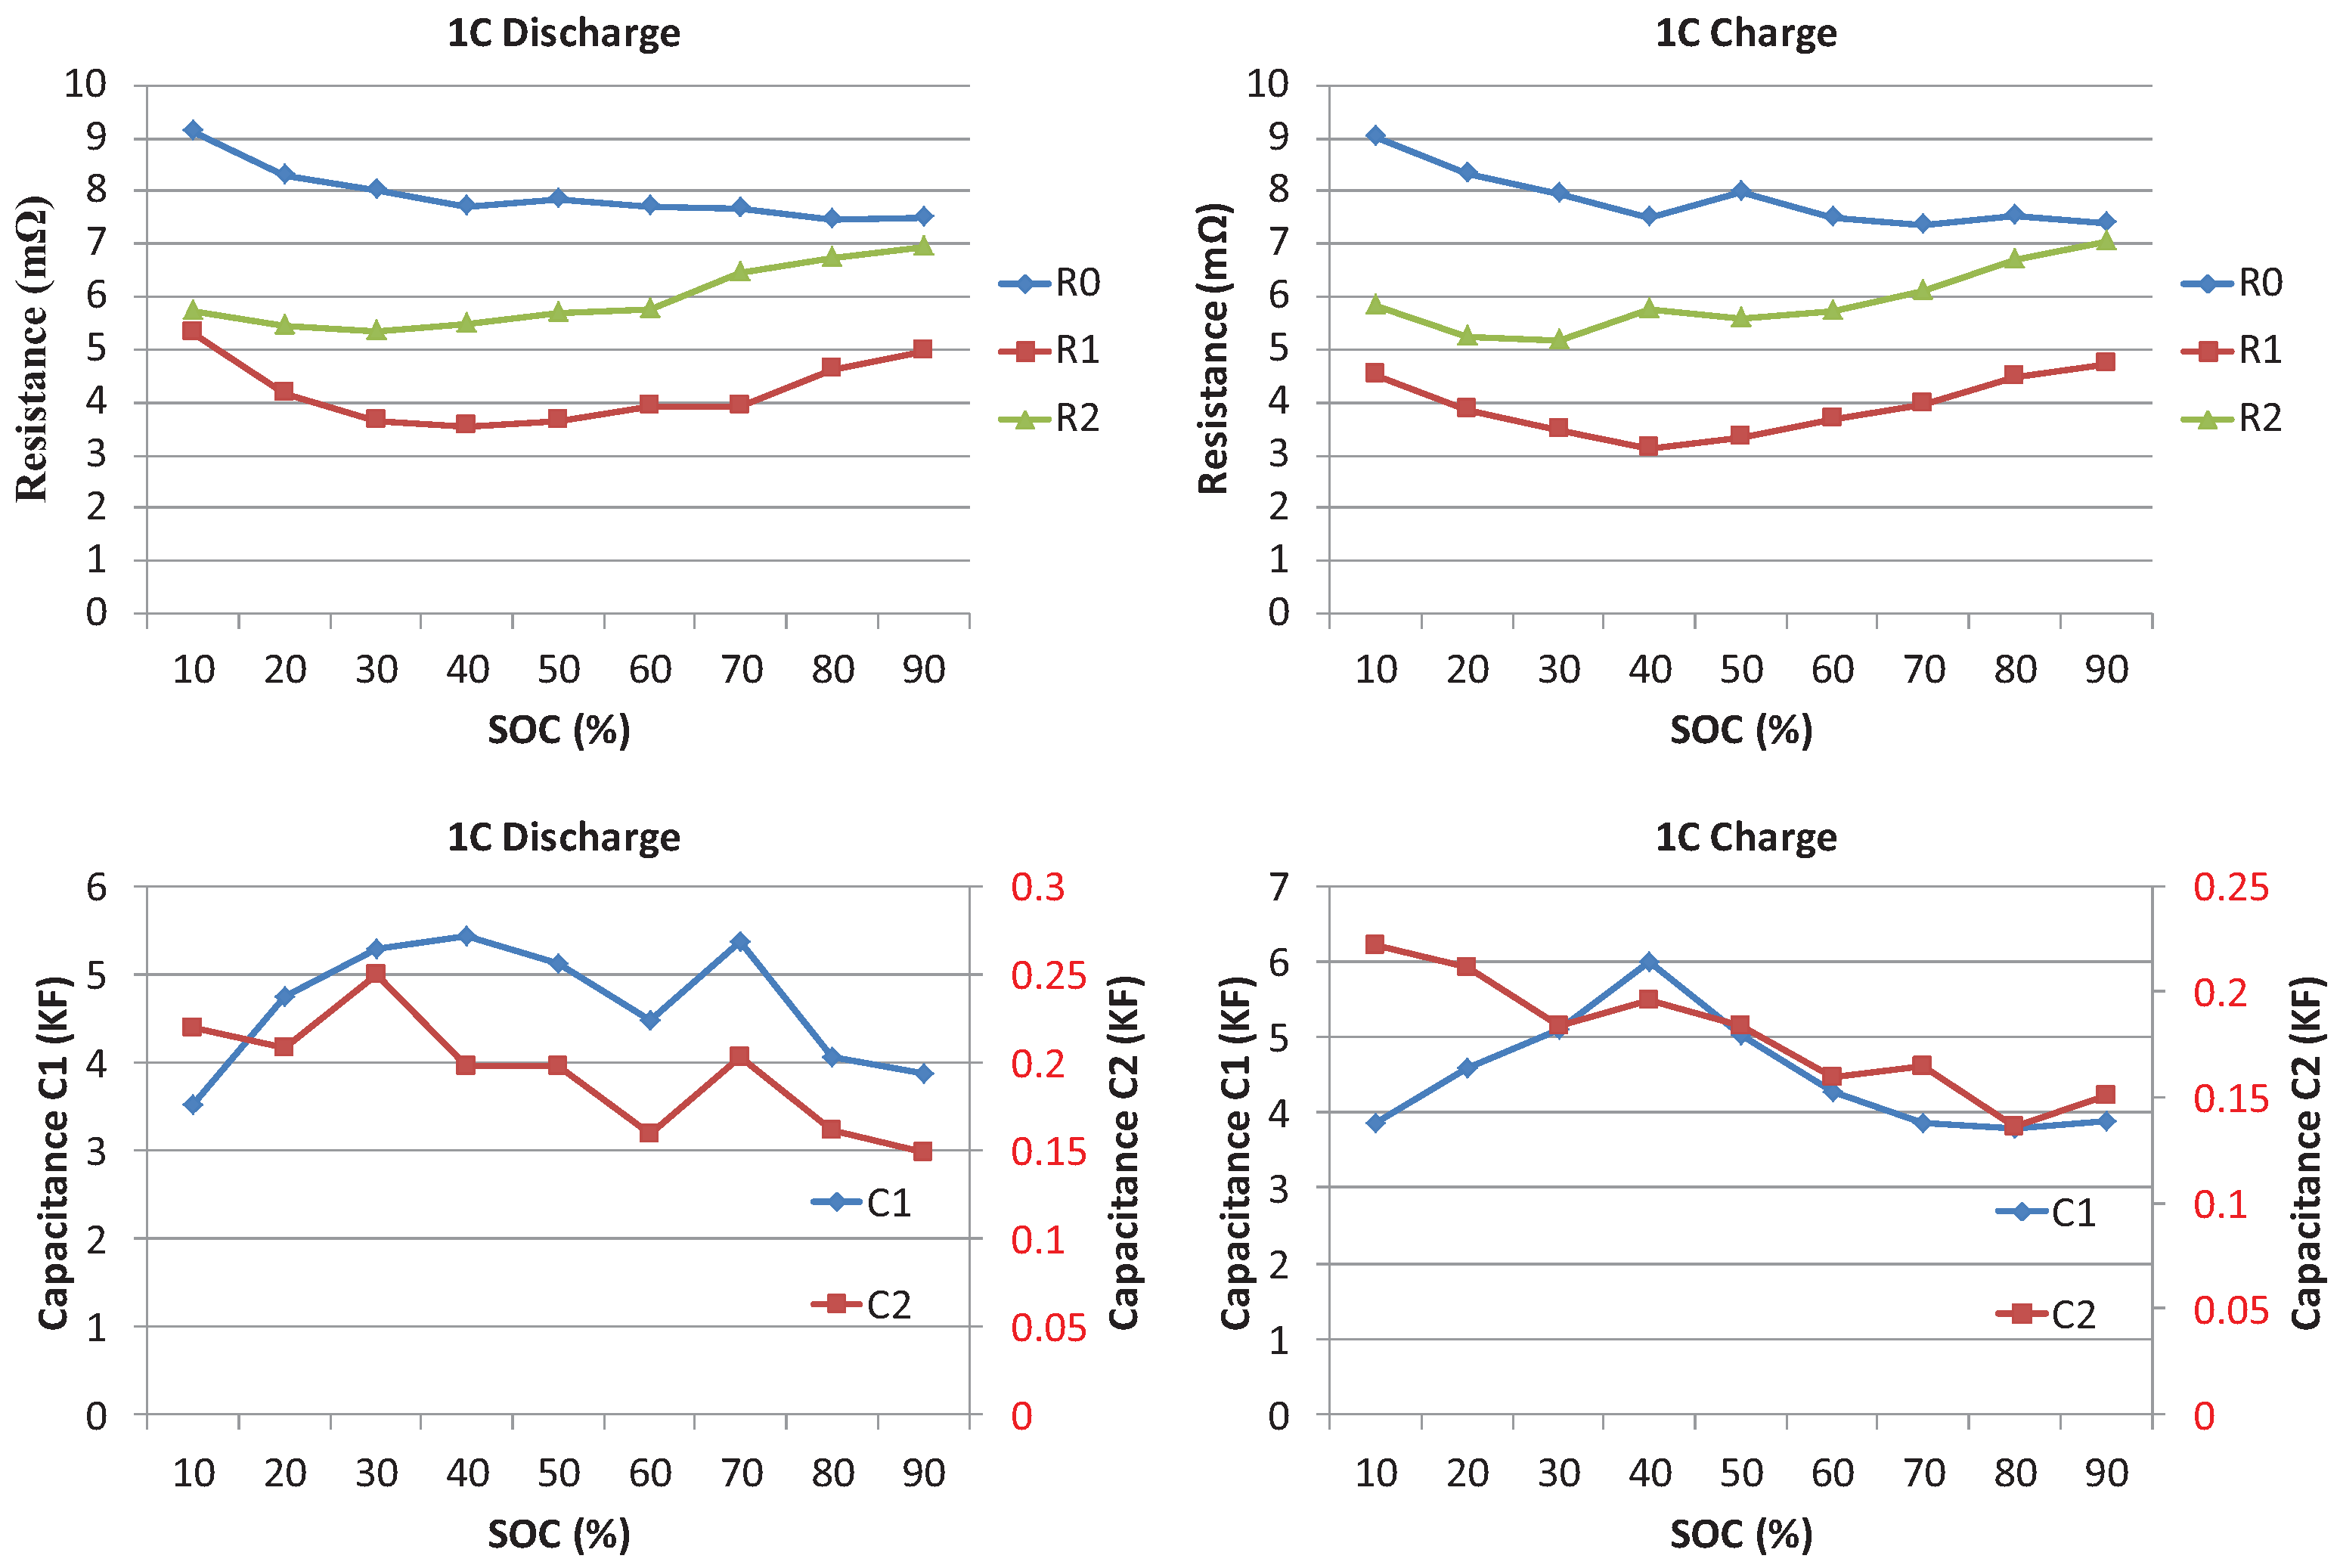
4.2. The Off-Line Parameters Fitting

The effectiveness of the degradation state recognition method to estimate the remaining capacity online had been validated [41]. According to second-order RC electrical equivalent circuit model and Kirchhoff’s voltage theorem mathematical expression for the load voltage U L is available as follows:
U L = U o c + U R C 1 + U R C 2 + R 0 I L
The parameters of the model to be identified are R 0 (ohm), R 1 and R 2 , C 1 and C 2 respectively obtained by the following formula:
R 0 = | U D U E | I
U D and U E are voltage values in HPPC tests, which correspond to the labels in Figure 5. When the current is removed, the formula is calculated for the zero input response:
U R C = U R C 1 e t / τ 1 + U R C 2 e t / τ 2
τ 1 and τ 2 are the constant of polarization time. Where, τ 1 = R 1 C 1 , τ 2 = R 2 C 2 . U R C 1 and U R C 2 are the voltage of previous moment on RC circuit, while end of charging or discharging. Taking U R C 1 , U R C 2 , τ 1 , τ 2 as a factor, which can be obtained using data fitting method. When the time to end charging or discharging, the formula is calculated for zero state response, the formula is:
U R C = I R 1 ( 1 e t / τ 1 ) + I R 2 ( 1 e t / τ 2 )
Taking I, τ 1 , τ 2 into the equation, R 1 and R 2 can be obtained. According to time constant τ , polarization capacitance value C 1 and C 2 can be obtained by the formula C = τ / R [35,36].
At the temperature of 15 degrees Celsius, the battery model parameter characteristics are identified through HPPC test. As shown in Figure 9, the internal resistance Ro (ohm) decreases with the increase of SoC, and the polarization resistance first increases and then decreases with the increase of SoC. The polarization capacitance increases with SoC and then decreases. In the same charge-discharge ratio, the internal resistance and capacitance of discharge state are higher than charging state. While the battery runs under low internal resistance, the battery’s self-discharge and heat will be smaller and the operating conditions will be better. The range between 20% and 80% is a better range for battery running, and the closer to the middle of the SoC the better.

4.3. The On-Line Parameters Identification

The basic principle of online identification is to reduce the predictive error, which is based on current value [37]. The parameters of model are identified in real time by using the FFRLS method. Identify formula expressed as follows:
y ( k ) = φ T ( k ) θ + e ( k )
e ( k ) = y ( k ) φ T ( k ) θ ^ ( k 1 )
θ ^ ( k ) = θ ^ ( k 1 ) + K ( k ) e ( k )
K ( k ) = P ( K 1 ) φ ( k ) λ + φ T ( k ) P ( k 1 ) φ ( k )
There into: θ is a vector made up of the errors caused by not equal to actual value vector of the system and the system noise. I is a unit matrix; e ( k ) is the prediction error of y ( k ) ; K ( k ) is kalman gain for the algorithm; θ ^ ( k ) is estimated value of θ ; P ( k ) is covariance matrix; λ is the forgetting factor, which is improved by making it variable according to the circumstance.
y ( k ) = U ( k ) = ϕ T ( k ) θ
ϕ ( k ) = [ 1 , U , U , I ( k ) , I , I ] T
U = U ( k 1 ) and U = U ( k 2 ) , I = I ( k 1 ) and I = I ( k 2 ) .
θ = [ k 0 , k 1 , k 2 , k 3 , k 4 , k 5 ] T
The forgetting factor λ is took as a variable. When there are big deviation between the estimated value and actual value, λ is set small enough, the convergence of algorithm can more quickly. When the estimate and the actual value deviation smaller, value of λ becomes large enough, to reduce the estimation error.
λ ( n ) = λ min + ( 1 λ min ) 2 L ( n )
L ( n ) = N I N T ( ρ e ( n ) 2 )
Among them, e ( n ) is estimate value minus the actual value; N I N T is smallest integer that is close to ρ e ( n ) 2 ; as a sensitive gain, ρ control reaching rate of λ toward 1; when e ( n ) tends to 0, λ = 1 . When e ( n ) tends to infinity, λ = λ min . λ min is an empirical value that controls the impact of the old and new data. This article take λ min = 0.85 , based on contrast test and experience.
The steps of online identification are described as follows:
(1)
The real-time voltage U and the current I have to be obtained at two points.
(2)
Initialize θ ^ ( 0 ) and P ( 0 ) using the results of the off-line identification, as well as the forgetting factor λ 0 .
(3)
Using the improved FFRLS algorithm, R 0 , R 1 , R 2 , C 1 , C 2 is deduced.
(4)
Update the covariance matrix P ( k ) and forgetting factor λ ( k ) . After loop executes of step 3 and 4 continuously, system parameters be identified in real-time.
To analyze the availability of identification method, the following working condition is used for testing. The L6 battery module is used to test at 15 degrees Celsius environment. First, the emptied battery is filled with a 3 A current. Then, the test is started after put off 10% power. During discharging to empty using 2 A current, the terminal voltage of actual and preestimated are used to compare. As shown in Figure 10, the result of identification is very close to the actual value.

4.4. The SoC Correction Using EKF

The Kalman filter provide an efficient means to estimate the changing state, through minimizes the recursive mean of squared error using a set of mathematical equations. In order to solve nonlinear problem, Kalman filter is transformed into the EKF by linearizing about the covariance of the state and current mean. Because EKF can reduce the model error and improve the accuracy, it is suitable for battery SoC estimation [42,43,44]. It can be described as follows for the equation of state and the measurement:
x ( k ) = f ( x ( k 1 ) , u ( k 1 ) ) + w ( k 1 )
y ( k ) = g [ x ( k ) , u ( k ) ] + v ( k )
where, x ( k ) is state variables of the system. f ( x ( k 1 ) , u ( k 1 ) ) is equation of state, which is respond to state variables x ( k 1 ) and excite function u ( k 1 ) of k 1 time. y ( k ) is observation variable, which is composed of measurement equation and g [ x ( k ) , u ( k ) ] and observation noise v ( k ) .
The estimated value of the state vector is modified through the kalman gain and the corresponding covariance matrix. The following formula is used.
P ( k | k 1 ) = ϕ ( k , k 1 ) P ( k 1 ) ϕ T ( k , k 1 ) + Q ( k 1 )
K ( k ) = P ( k | k 1 ) H T ( k ) [ H ( k ) P ( k | k 1 ) H T ( k ) + R ( k ) ] 1
P ( k | k 1 ) is covariance matrix, while K ( k ) is kalman gain. Where, intermediate variable is ϕ ( k , k 1 ) = f x | x ( k 1 ) = x ^ ( k 1 ) and jacobian matrix is H ( k ) = g x | x ( k 1 ) = x ^ ( k 1 ) . Q ( k 1 ) and R ( k ) are covariance matrix of process excitation noise and observation noise respectively.
For the second-order RC model used in this paper, the predicted value of state variables is discribed as follow.
x ( k | k 1 ) = [ SoC ( K | K 1 ) , U R C 1 ( K | K 1 ) , U R C 2 ( k | k 1 ) ]
Equations (14) and (15) are developed by the first order Taylor formula, the equation of state and output equation are obtained as follow.
x ( k ) = A x ( k 1 ) + B u ( k 1 ) + w ( k 1 )
y ( k ) = C x ( k ) + D u ( k ) + v ( k )
In the equivalent model, the input quantity is current I, output quantity is voltage U, the following equation is established under the action of excitation current:
SoC ( t ) = η I ( t ) Q N
U R C 1 ( t ) = 1 R 1 C 1 U 1 ( t ) + 1 C 1 I ( t )
U R C 2 ( t ) = 1 R 2 C 2 U 1 ( t ) + 1 C 2 I ( t )
The observational equation is described below:
U ( t ) = U O C [ SoC ( t ) ] U 1 ( t ) U 2 ( t ) R 0 I ( t )
After discretization of Equations (21) and (24), the following observation Equation (25) and state Equation (26) can be obtained.
SoC ( k ) U 1 ( k ) U 2 ( k ) = 1 0 0 0 1 T R 1 C 1 0 0 0 1 T R 2 C 2 · SoC ( k 1 ) U 1 ( k 1 ) U 2 ( k 1 ) + η T Q N T C 1 T C 2 · I ( k 1 )
U ( k ) = U O C [ SoC ( k ) ] U 1 ( k ) U 2 ( k ) R 0 I ( k )
where, η is the efficiency of charge and discharge, T is the sampling time, U O C [ SoC ( k ) ] is the relationship between OCV and SoC. U 1 ( k ) and U 2 ( k ) is voltage on the RC1 and RC2. According to the following formula, A ( k ) , B ( k ) , C ( k ) , D ( k ) can be established respectively through the experiment.
A ( k ) B ( k ) C ( k ) D ( k ) = 1 0 0 0 1 T R 1 C 1 0 0 0 1 T R 2 C 2 η T Q T C 1 T C 2 [ U O C SoC 1 1 ] | x ^ ( k + 1 | k ) [ R 0 ]
Based on the above operation principle, the steps of proposed method summarized as follow:
(1)
Initialize SoC ( 0 ) , U 1 ( 0 ) , U 2 ( 0 ) , w ( 0 ) , v ( 0 ) and other factor.
(2)
Calculate R 0 , R 0 , R 0 , C 1 , C 2 using FFRLS algorithm.
(3)
Obtain estimation of the state variables at k times using x ( k | k 1 ) = A x ( k 1 ) + B i ( k 1 ) + w ( k 1 ) . Accordingly, covariance matrix is computed by P ( k | k 1 ) = A ( k 1 ) P ( k 1 ) A T ( k 1 ) + Σ w .
(4)
Solve the kalman gain K ( k ) by (17).
(5)
Correct estimation value and covariance matrix by (19) and (16).
The steps 2 to 5 are repeated at the next moment to complete the estimated iteration.
To evaluate the effect of proposed method, Dynamic Stress Test (DST) working condition is used for the estimation test. First, the battery is discharged to empty by the current of 2 A. Then, the battery is charged to full state with 6 A and ready for testing after a period of time. As shown in Figure 11, the proposed online correction method is better than AH. The proposed online correction method is better than AH integral method. Due to the effect of online correction, the cumulative error can be effectively eliminated in a wider range of time.

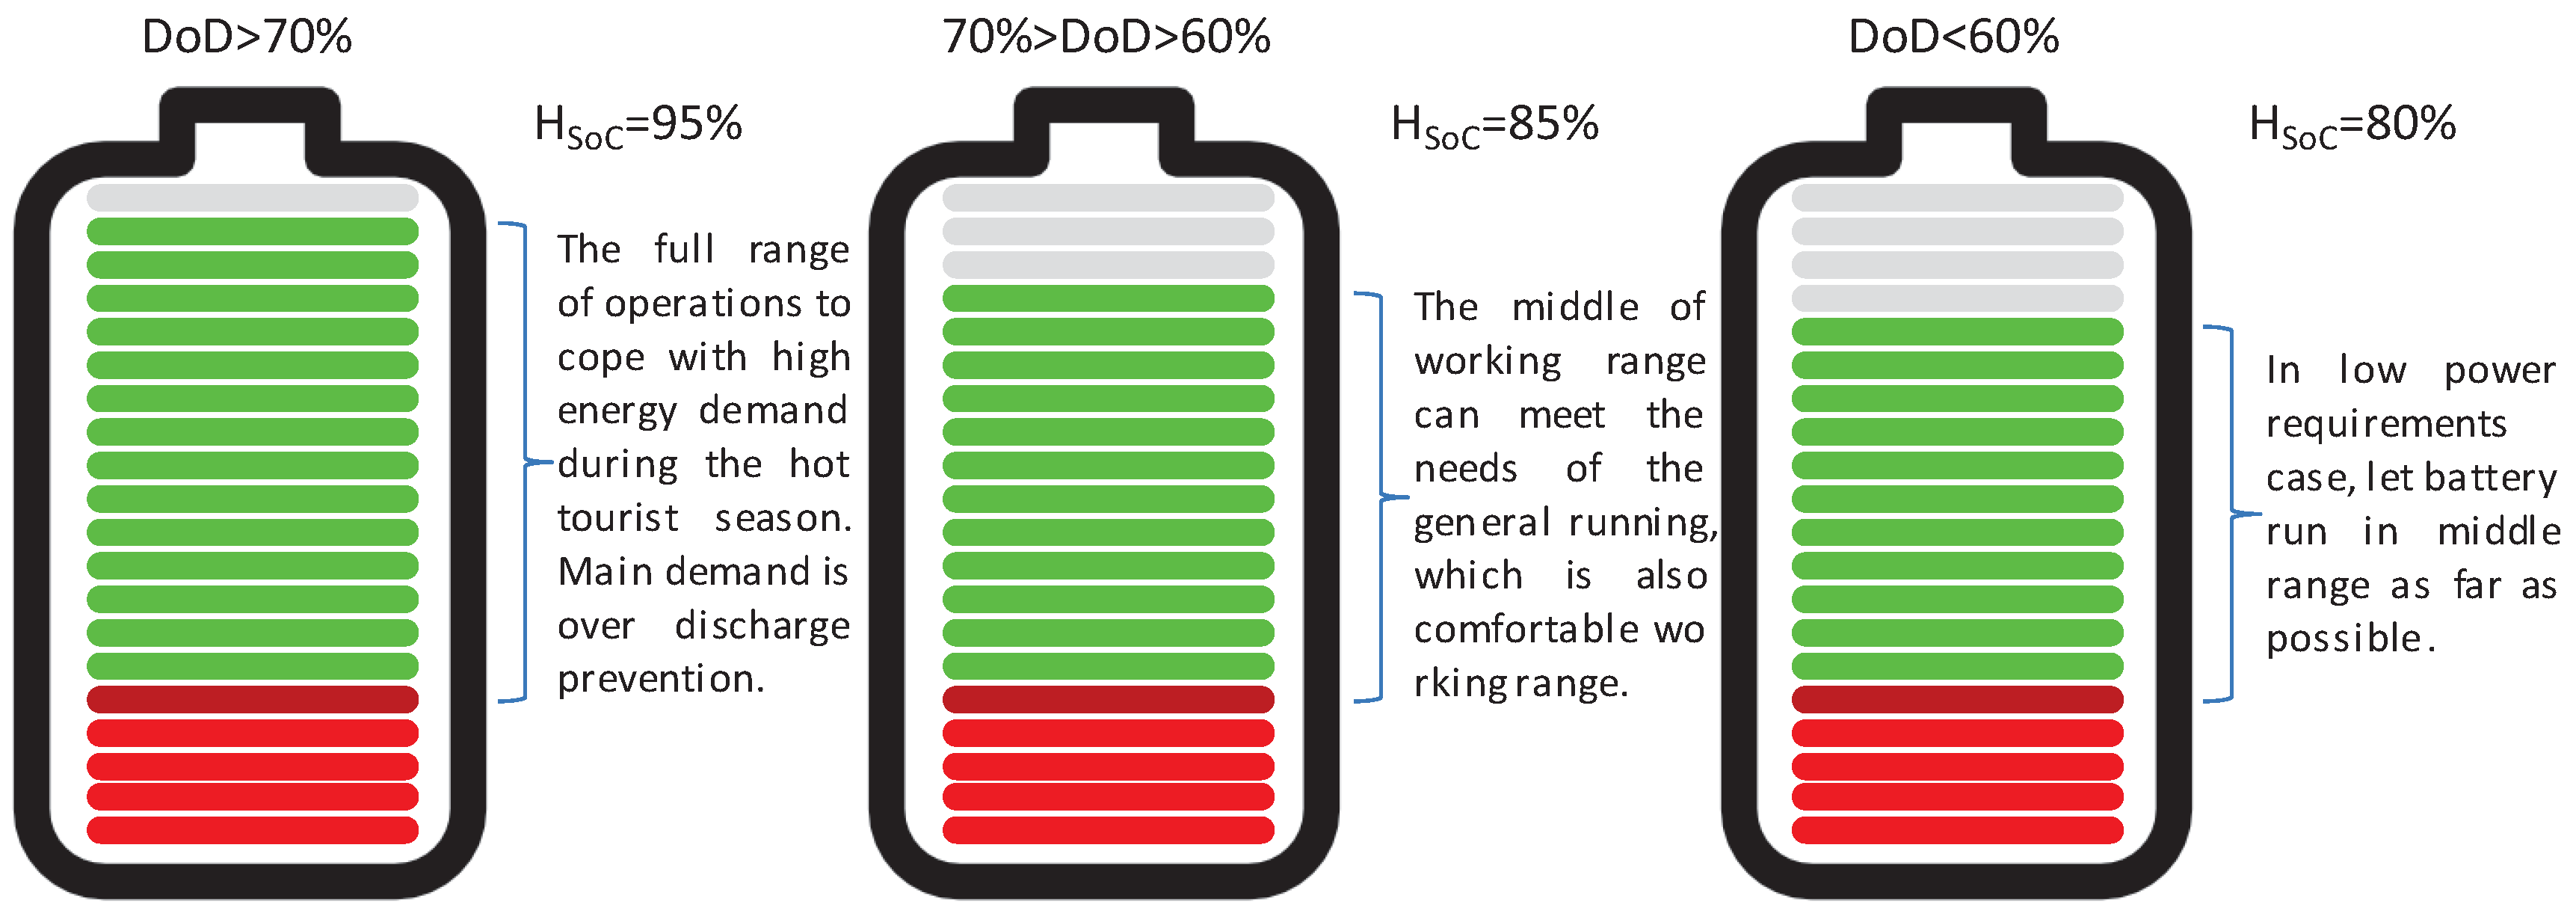
4.5. Optimization Strategy of SoC Operation Range

According to the characteristics of NI-MH battery, the SoC range between 20% and 80% is optimal operating range. Running in this range, battery has a lower internal resistance, low self-discharge and heat loss. Based on the proposed online SoC correction method, estimation accuracy of SoC can be effectively guaranteed by limiting effect of cumulative error. Furthermore, optimal operation range control method will be an effective way to prolong the cycle life of battery, which adjusts battery SoC dynamically.
In the application of this article, the number of tourists has certain regularity. There are consecutive days of travel peak during the holiday season. This regularity is reflected in the DoD of battery, which is represented as continuously increase during the holiday season. The three operating intervals shown in Figure 12 are used to deal with this rule of passenger flow change. The previous day’s DoD is used as a reference to optimize the allowable maximum SoC H SoC of the next working day. As the peak of passenger flow can be predicted, the charging limit will be increased manually in the holiday season. According to the flow chart of BMS shown in Figure 8, recharging in 5 min will be considered as an manually control command input. In this way, the battery charging limit of SoC is adjusted to 95%. In the next running cycle, the battery will maintain a high amount of charge untill the peak passenger flow past. Using this optimal operation range control method, the SoC operation interval is always close to the optimal range in the middle segment.
Because the usual DoD operating range is around 60%, optimal operation range control method is applicable to most working condition. However, there are still certain circumstances where the SoC cannot meet the demand. The system will alarm when discharging to less than 25%. When the SoC is reduced to less than 20%, the discharge will be forced to stop to protect the battery.
According to the operation of the previous day, the operation condition of the next day can be optimized during charging after forecast, the maximum charge of SoC can be as low as possible. In predictable travel peaks, the battery can be charged full with artificial operation. In this way, the battery can avoid the high SoC range with high heat characteristics, and can satisfy all operating conditions. Theoretically, it can improve the battery state and increase the cycle life, but it still needs to be tested.

5. Interpretation of Result

The designed boat has relatively constant operating environment, changing and continuous working conditions. It provided a very good test verification environment to verify the various methods of battery operation. In order to make an overall comparison of the practical application, the optimization of battery operation is analyzed from three aspects: continuous days of operation; annual operation range optimization; the battery status after two years of operation.

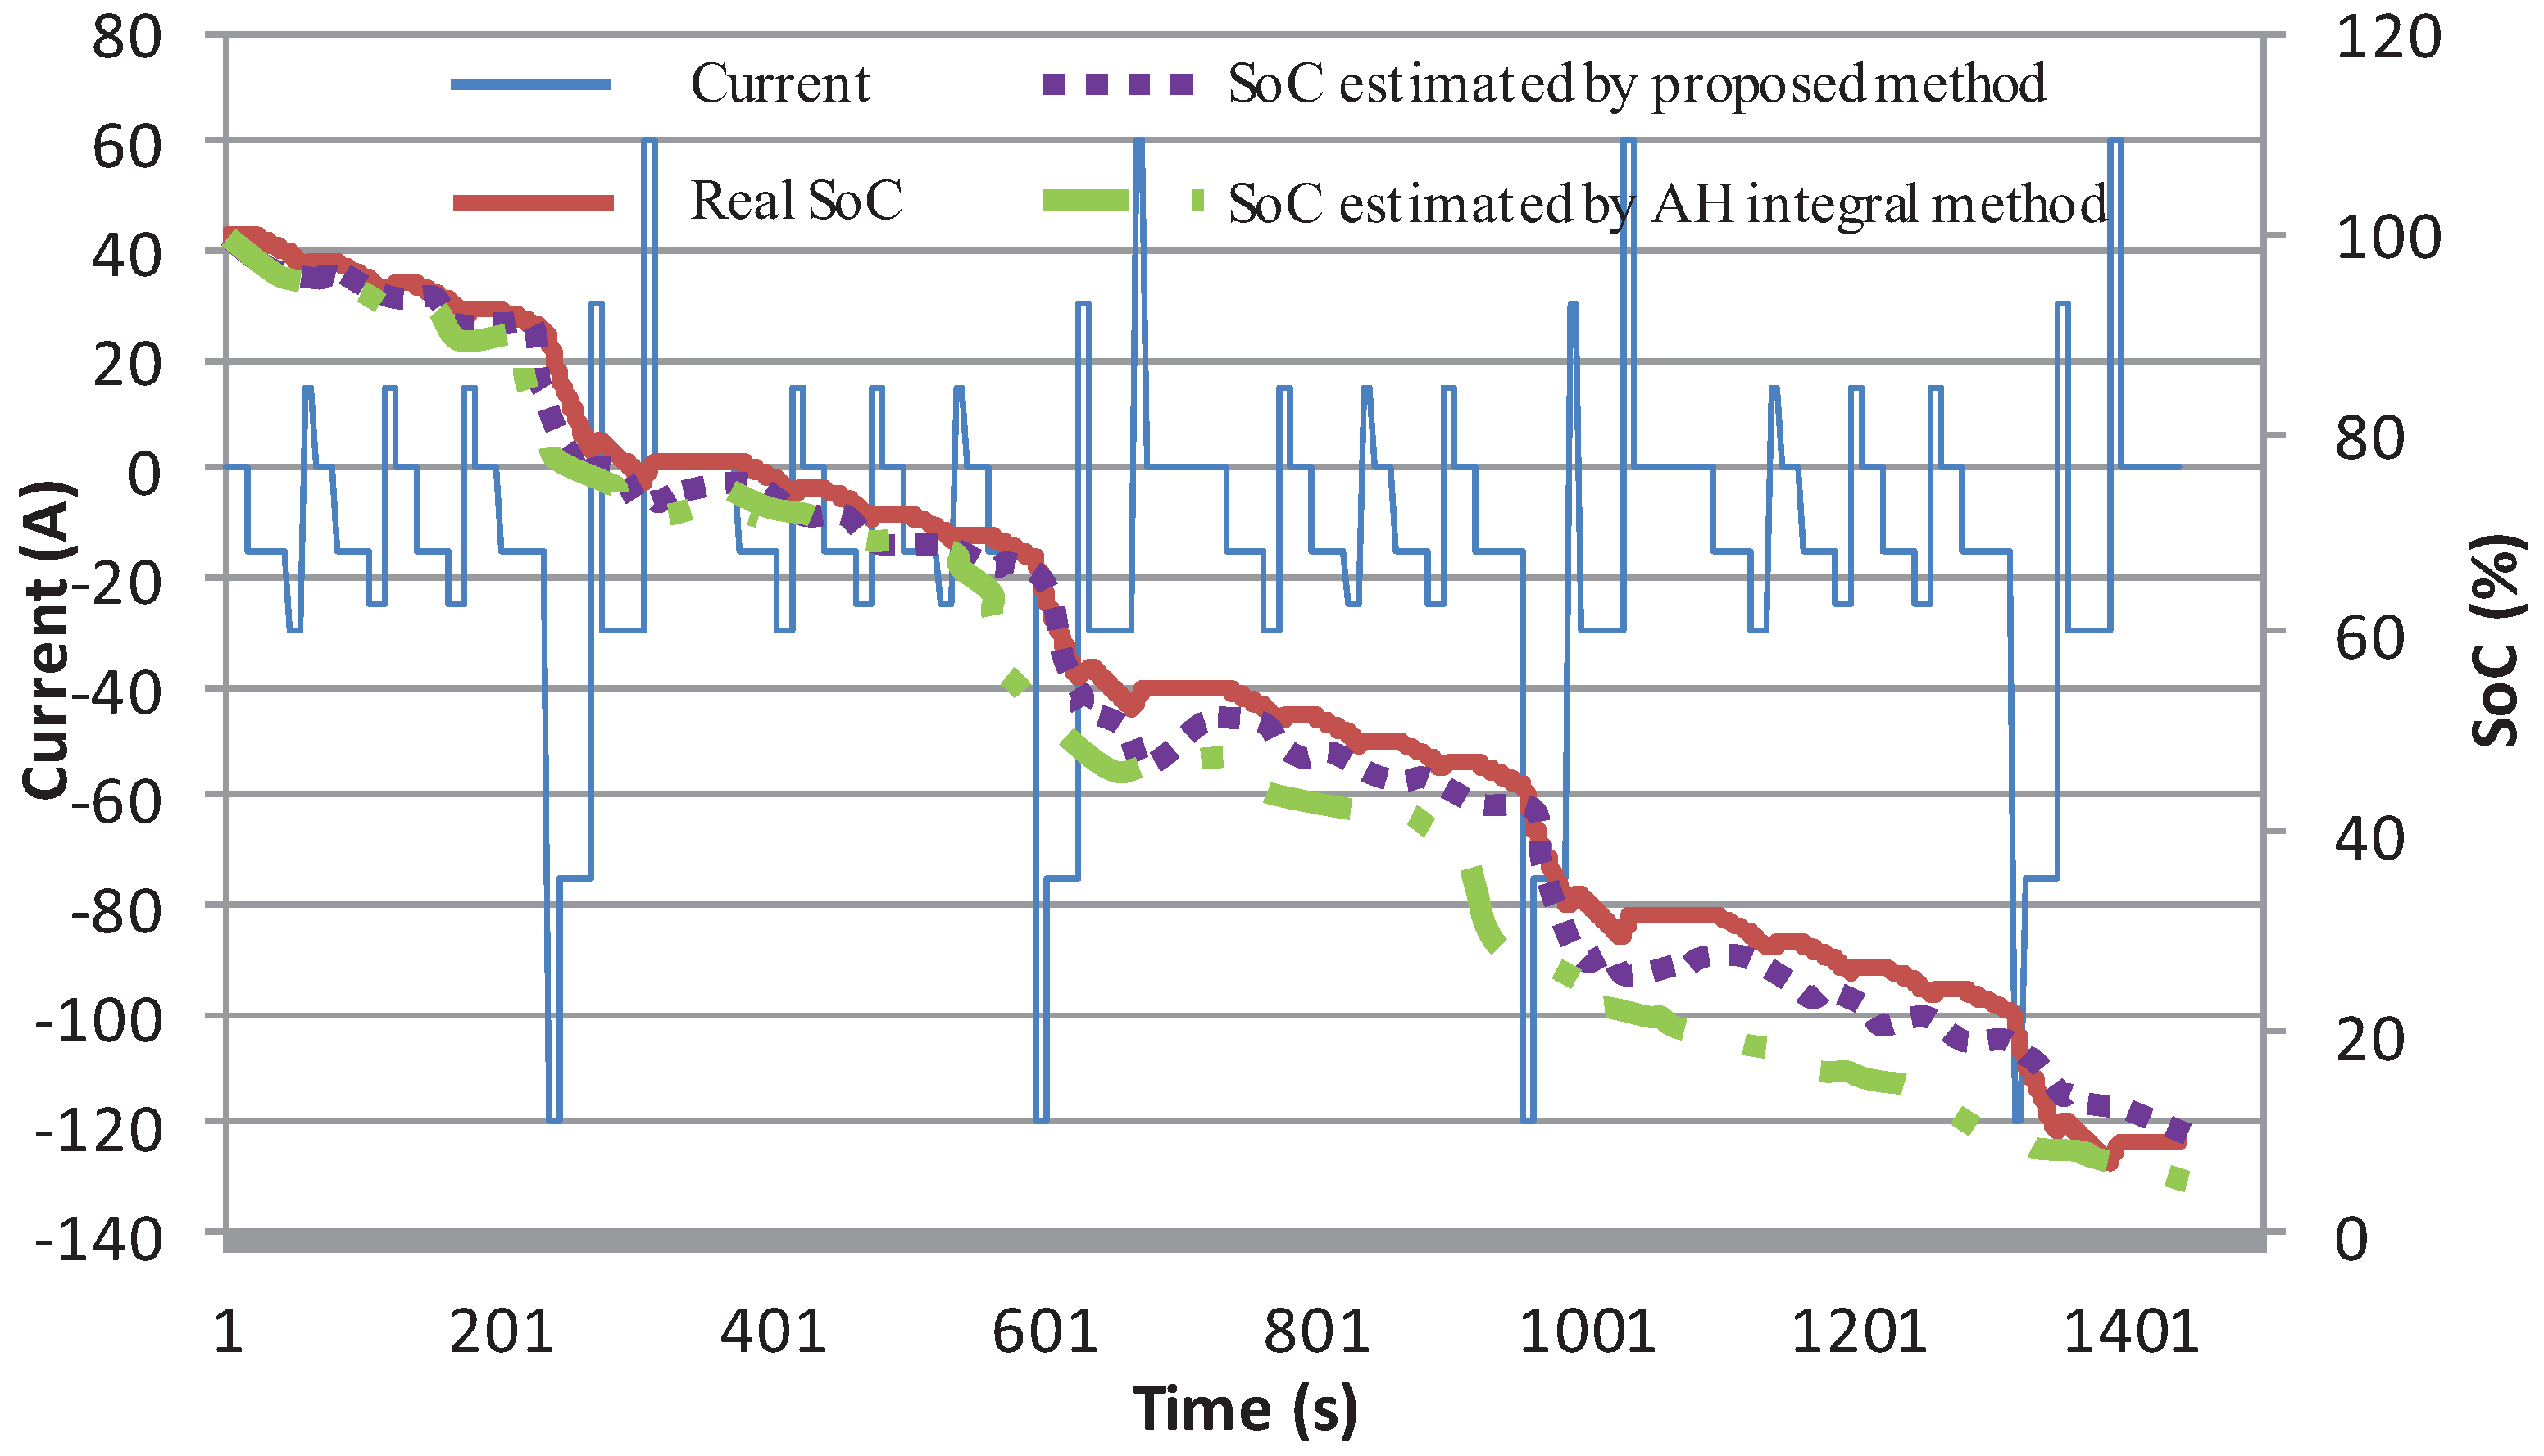
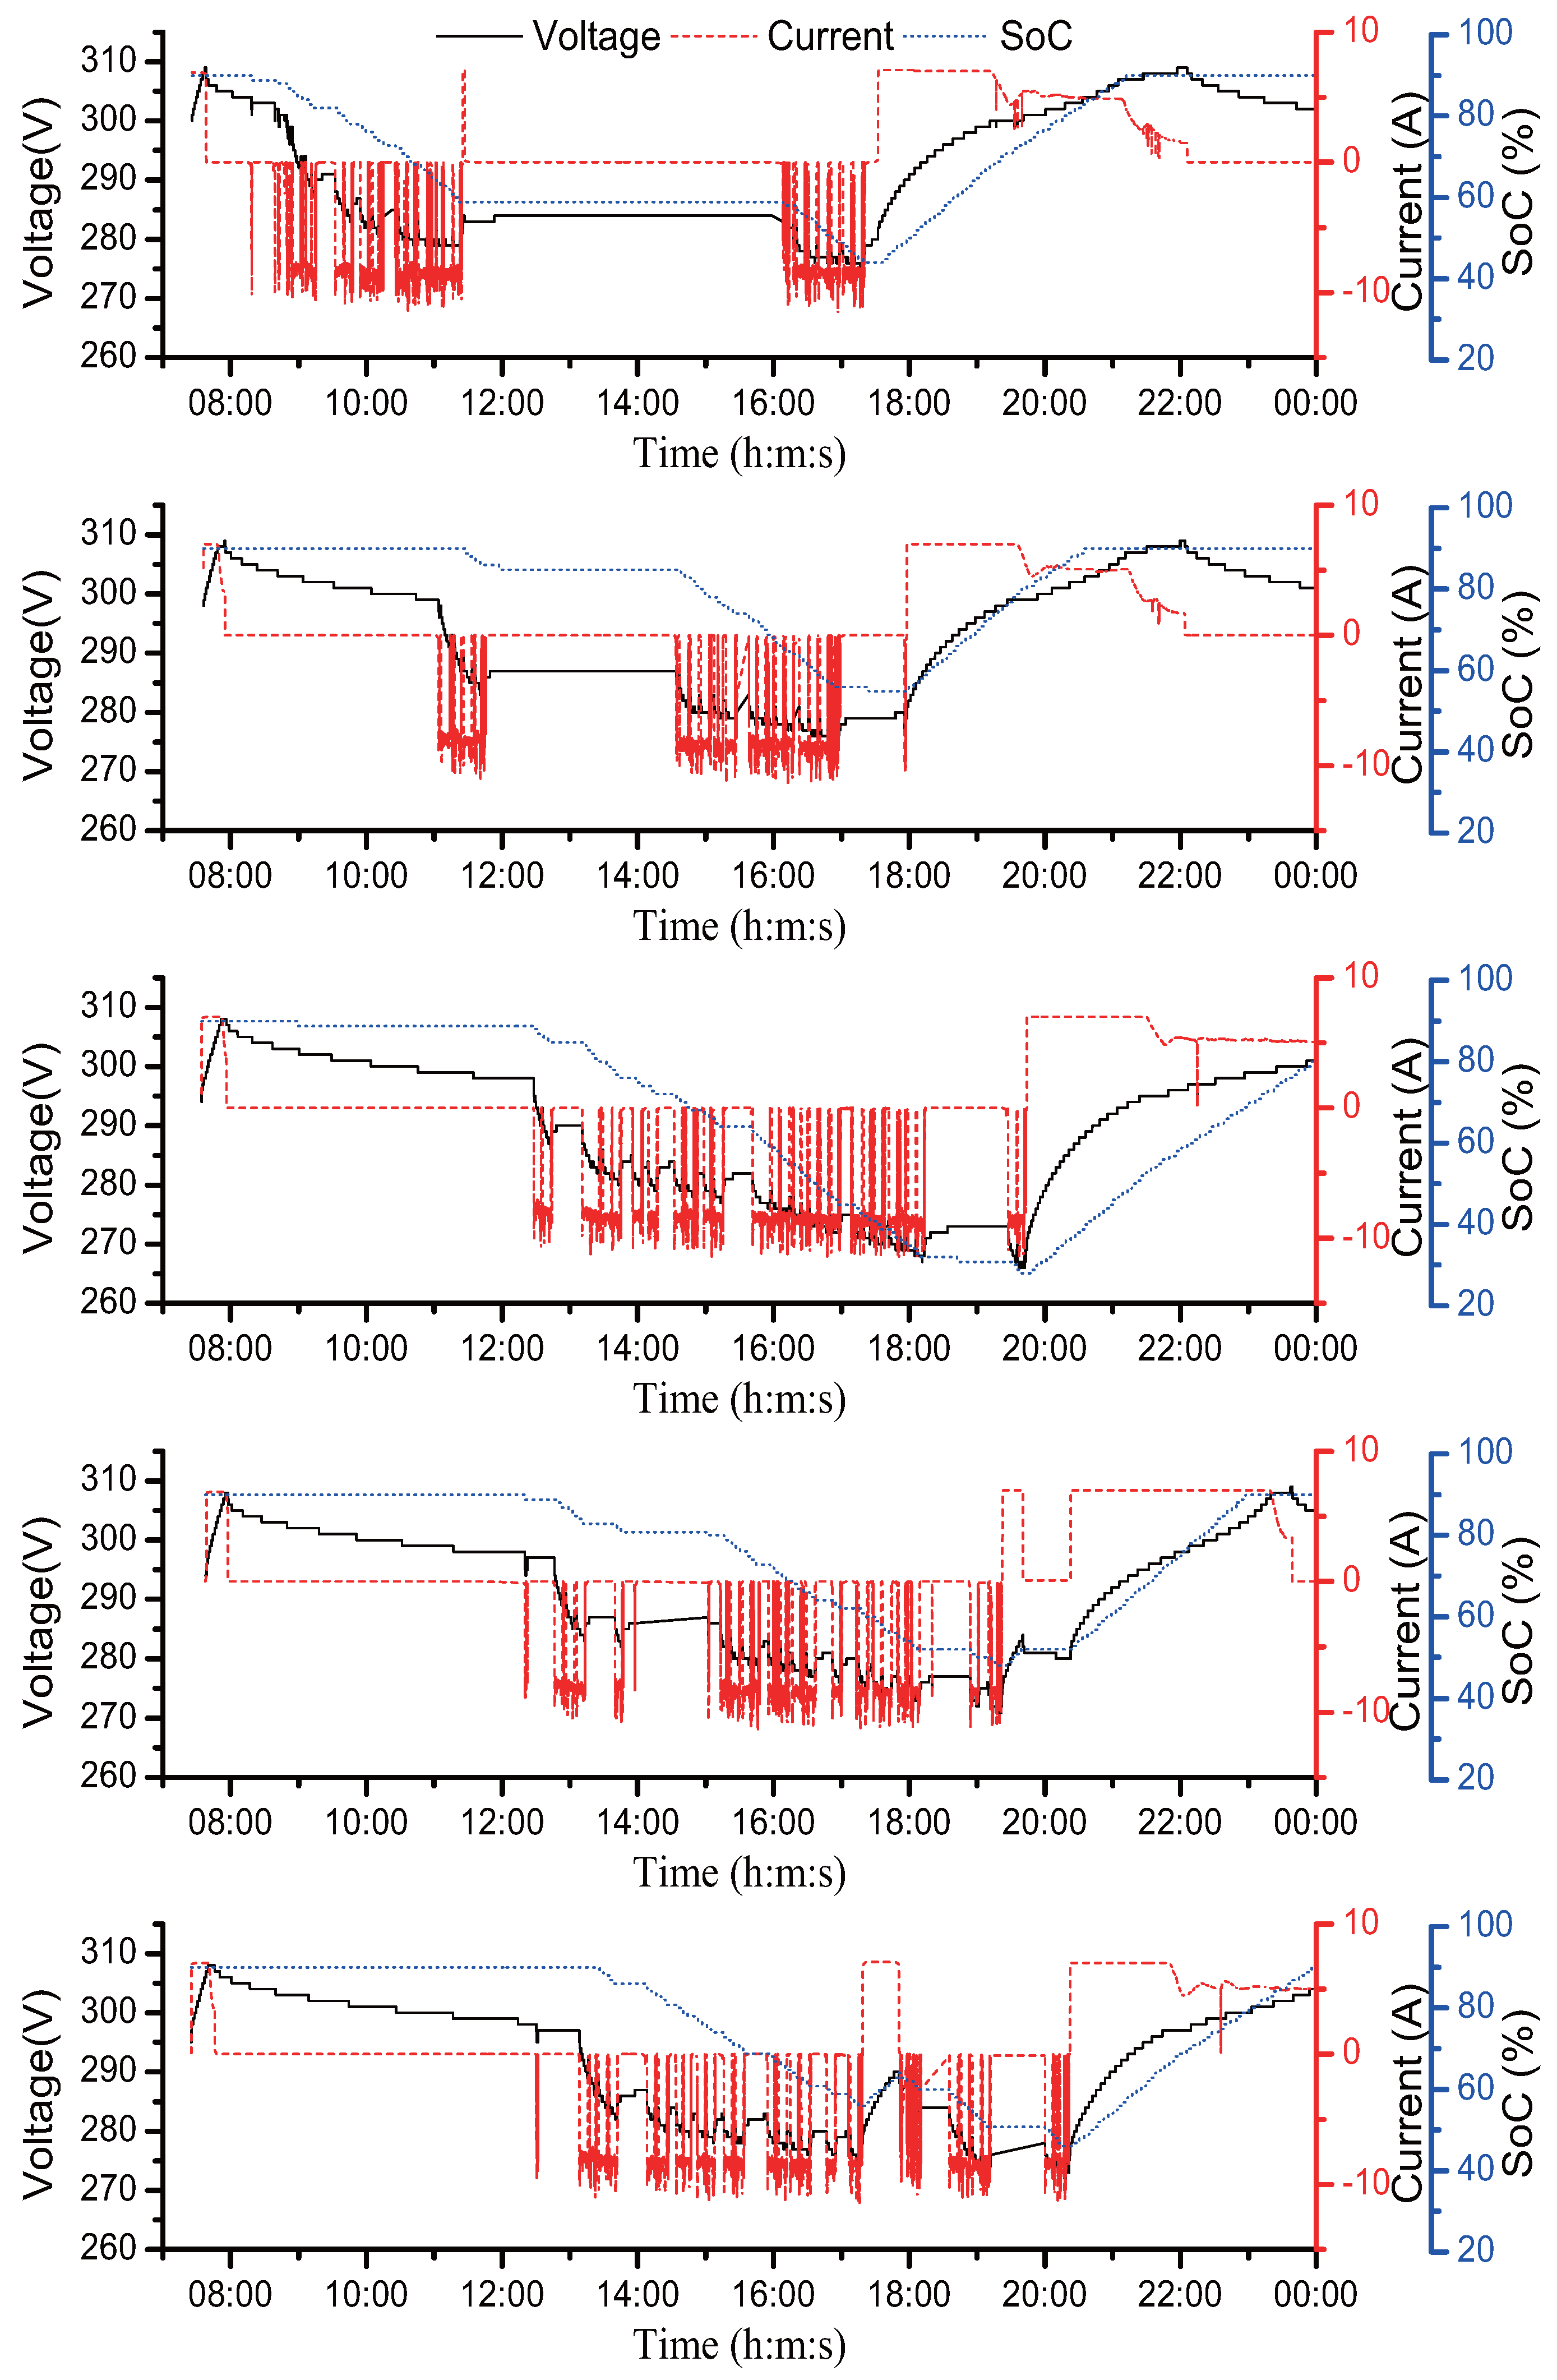
5.1. Accuracy of SoC in Continuous Days of Operation

The working condition of the electric boat for five consecutive days can be seen in Figure 13. As for the interaction between artificial charging and OCV calibration, the accuracy of the SoC in the initial stage of power supply can be guaranteed while the ship starting to work at 7:00. Under different operating conditions, SoC can be effectively estimated when discharging and charging. The not smooth stairway up and down of voltage is caused by the rounding operation of CAN bus transmission voltage data, the actual accuracy is higher than the accuracy of figure.
In Figure 13, the operating interval is not optimized, the SoC is always charged to 90%. The proposed estimation method only ensures the accurate estimation of the battery’s SoC, which ensure the accumulated error is not overrun after long period operation. As can be seen from the working conditions in the figure, the rest of SoC may be more than 45% after a day of running. Because the upper limit is fixed, battery does not run in the optimal range. In order to extend the battery cycle life, while meet the needs of operation. It is meaningfull that adjust the operating range of SoC using a reasonable strategy.

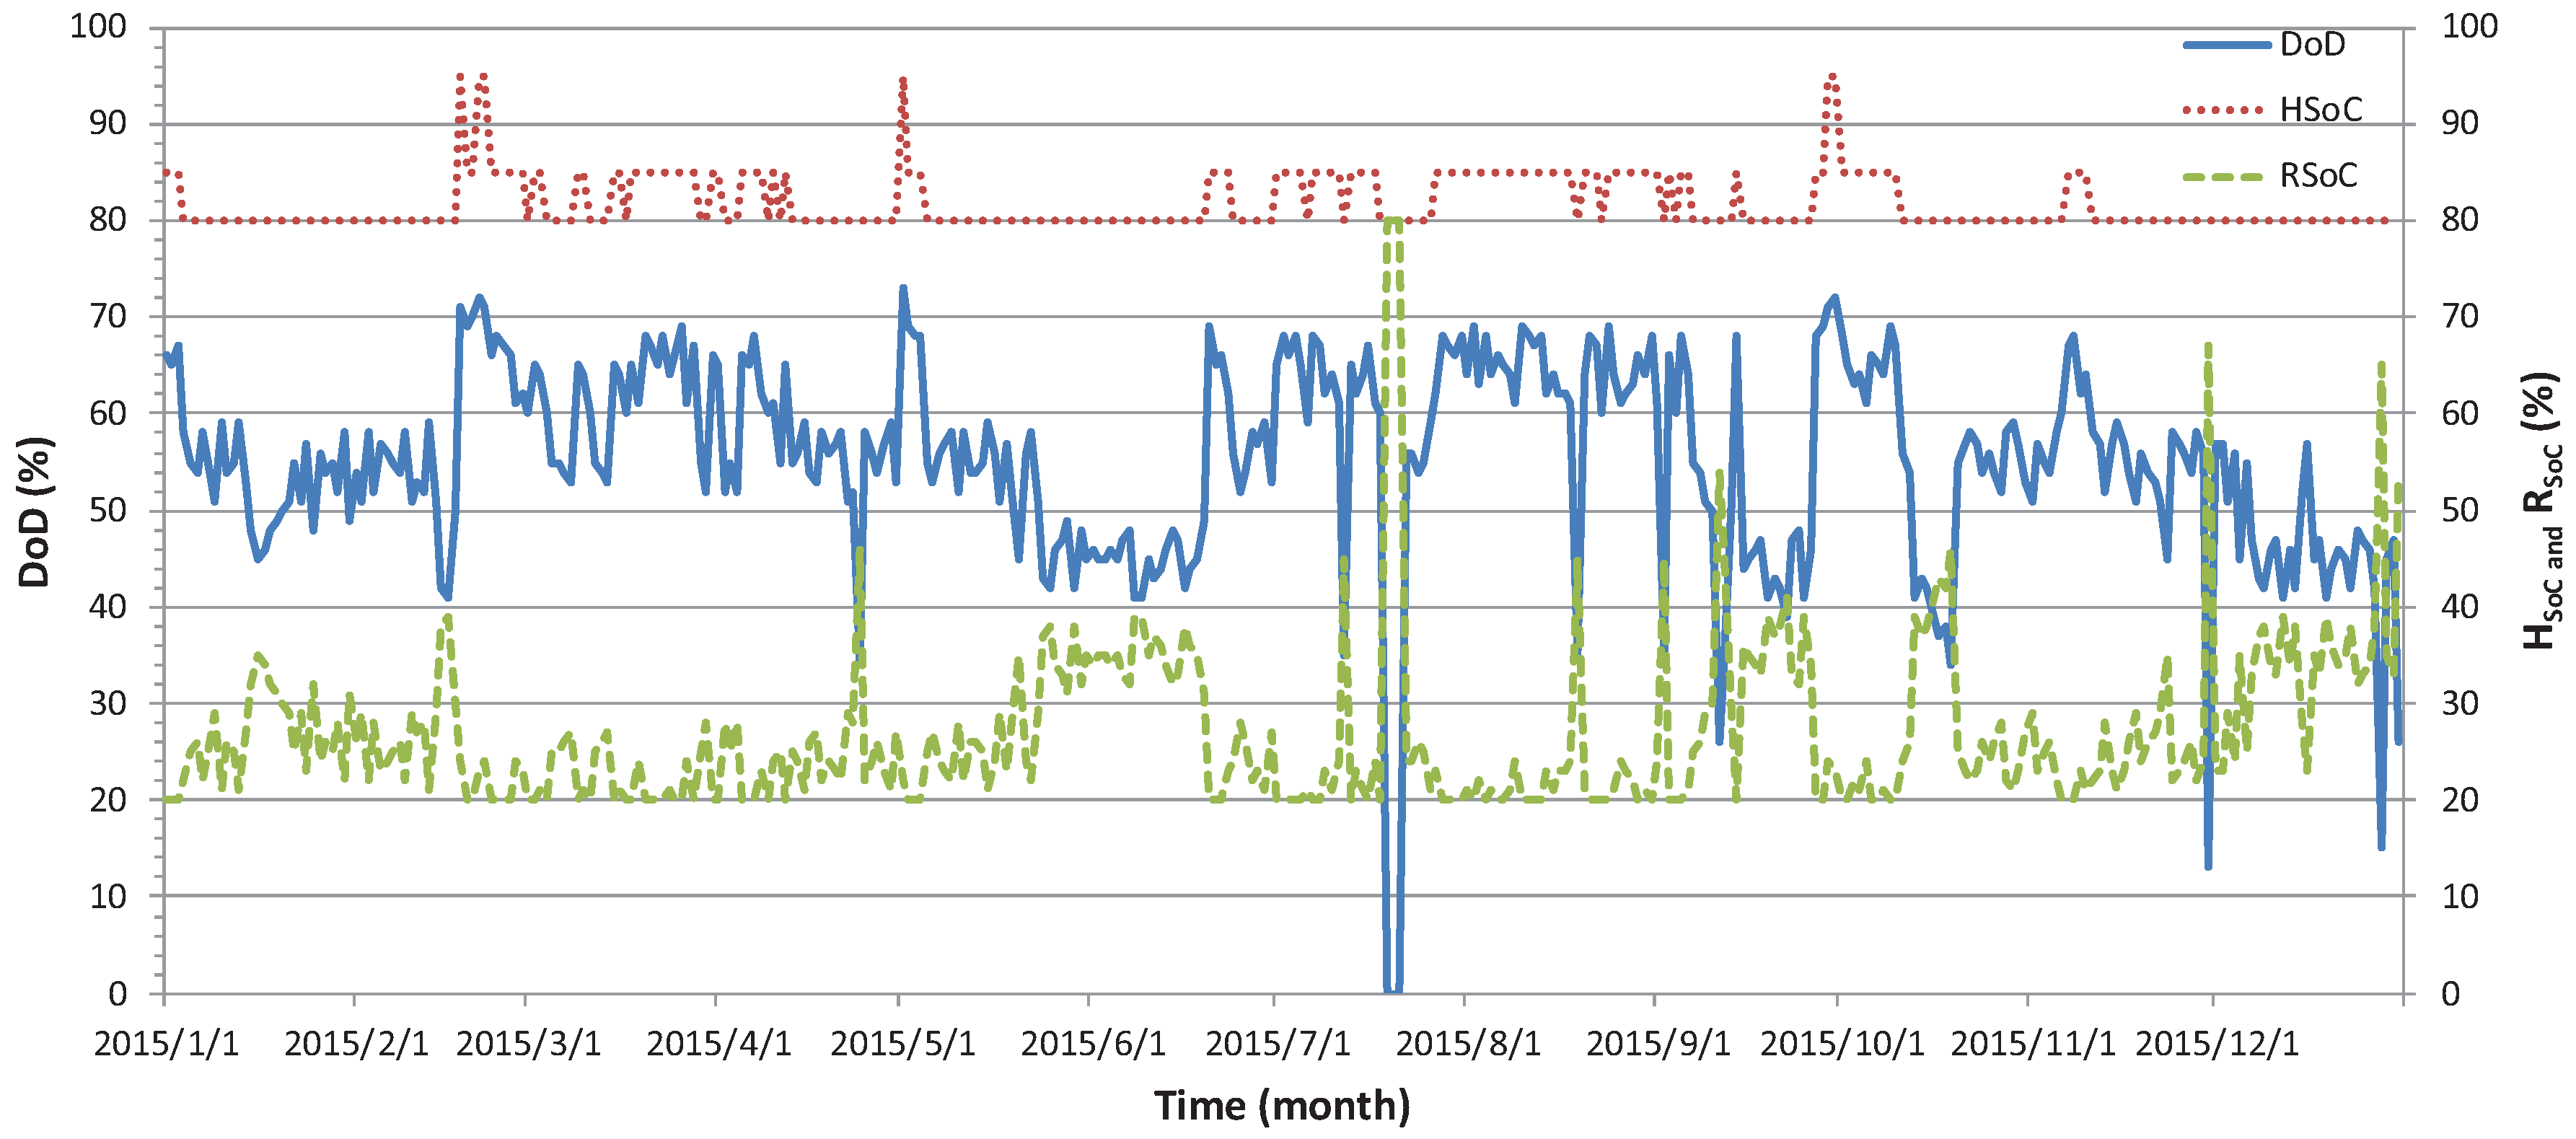
5.2. Optimal Operating Condition

As shown in Figure 14 , the DoD and the predicted volume of charging for next day are exhibited for one year’s running cycle. H SoC is SoC charging limit obtained through the optimizing strategy in Figure 8 and Figure 12. R SoC is the residual capacity after a day of running. As can be seen from the diagram, the battery is not fully filled in most cases. Meanwhile, the lower limit of the battery can meet the operational requirements. Since the off-season and peak season has certain periodicity, adjustment of charge volume brings a better charge and discharge circulation.

5.3. Improvement of Battery Life

To compare the improvements in battery life, two boats of the same configuration were compared. One adopts the method shown in the text, while general method with AH integral and fixed SoC operating limits is used for another. The battery monomer which differential of voltage is within 10 mV are selected for battery packs. After two years of operation, the consistency of battery is compared under charging condition.
Because system cannot be tested by equipment after the actual operation, it is difficult to make the accurate comparison of battery performance. The performance of the battery can be compared intuitively by voltage changes of battery monomer during charging and discharging.
As shown in Figure 15, the consistency of battery monomer is guaranteed using proposed method. As shown in Figure 16, the consistency of the battery without interval optimization is very poor after two years. Due to poor management, the performance of the battery is decreased significantly. The lower performance of the individual monomer is reflected in slow charge and discharge response, and the voltage increased sharply charge in individual monomer. These also affect the battery capacity, which leads to further cycle life loss.
In contrast, the battery pack capacity of this method is still more than 95%, while the maximum attenuation of the battery pack with AH integral method with fixed operation interval is over 40%.

6. Conclusions

The proposed accurate energy measurement and battery state estimation methods solve the problem of high precision SoC estimation. SoC optimal operation range control method based on high precision energy metering and online SoC correction is presented to ensure battery running in the optimal range. After two years of operation, the battery using this method is more efficient than the battery that uses other battery management method. Predictably, if considering the influence of the temperature factor, the significance of battery run interval optimization will be more obvious [45]. In future research, the multiscale prediction algorithm and the new method around OCV may provide the possibility for further improvement of performance [46,47]. Of course, the proposed method not only proves the importance of interval optimization in the management system of NI-MH power battery, but also has positive reference for other battery management system.

Acknowledgments

This work was supported in part by the National Natural Science Foundation of China under Grant 61573134, 61573133 and 61733004, National Science and Technology Support Program of the Ministry of Science and Technology of China (No.2015BAF13B00) and in part by the National High Technology Research and Development Program of China under Grant 2012AA111004.

Author Contributions

Bumin Meng, Yaonan Wang, Jianxu Mao designed the study. Bumin Meng and Jianwen Liu analyzed the data and carried out optimal operation range control method based on high precision energy metering and online SoC correction. Bumin Meng, Guochang Xu and Jian Dai performed the experiments. YaonanWang managed the funding, prepared the manuscript and supervised the whole project. Bumin Meng, Yaonan Wang, Jianxu Mao and Jianwen Liu wrote the manuscript. All of the authors read and approved the final manuscript.

Conflicts of Interest

The authors declare no conflict of interest.

References

  1. Pollet, B.G.; Staffell, I.; Shang, J.L. Current status of hybrid, battery and fuel cell electric vehicles: From electrochemistry to market prospects. Electrochim. Acta 2012, 84, 235–249. [Google Scholar] [CrossRef]
  2. Young, K.; Yasuoka, S. Capacity degradation mechanisms in nickel/metal hydride batteries. Batteries 2016, 2, 3. [Google Scholar] [CrossRef]
  3. Kang, J.; Yan, F.; Zhang, P.; Du, C. Comparison of comprehensive properties of Ni-MH (nickel-metal hydride) and Li-ion (lithium-ion) batteries in terms of energy efficiency. Energy 2014, 70, 618–625. [Google Scholar] [CrossRef]
  4. Zhu, W.H.; Zhu, Y.; Tatarchuk, B.J. Self-discharge characteristics and performance degradation of Ni-MH batteries for storage applications. Int. J. Hydrogen Energy 2014, 39, 19789–19798. [Google Scholar] [CrossRef]
  5. Meng, T.; Young, K.; Koch, J.; Ouchi, T.; Yasuoka, S. Failure mechanisms of nickel/metal hydride batteries with cobalt-substituted superlattice hydrogen-absorbing alloy anodes at 50 C. Batteries 2016, 2, 20. [Google Scholar] [CrossRef]
  6. Mahlia, T.M.I.; Saktisahdan, T.J.; Jannifar, A.; Hasan, M.H.; Matseelar, H.S.C. A review of available methods and development on energy storage; technology update. Renew. Sustain. Energy Rev. 2014, 33, 532–545. [Google Scholar] [CrossRef]
  7. Liu, Y.; Pan, H.; Gao, M.; Wang, Q. Advanced hydrogen storage alloys for Ni/MH rechargeable batteries. J. Mater. Chem. 2011, 21, 4743–4755. [Google Scholar] [CrossRef]
  8. Young, K.; Nei, J. The current status of hydrogen storage alloy development for electrochemical applications. Materials 2013, 6, 4574–4608. [Google Scholar] [CrossRef] [PubMed]
  9. Cheng, B.; Zhou, Y.; Zhang, J.; Wang, J.; Cao, B. Ni-MH batteries state-of-charge prediction based on immune evolutionary network. Energy Convers. Manag. 2009, 50, 3078–3086. [Google Scholar] [CrossRef]
  10. Xu, L.; Wang, J.; Chen, Q. Kalman filtering state of charge estimation for battery management system based on a stochastic fuzzy neural network battery model. Energy Convers. Manag. 2012, 53, 33–39. [Google Scholar] [CrossRef]
  11. Ouyang, L.; Huang, J.; Wang, H.; Liu, J.; Zhu, M. Progress of hydrogen storage alloys for Ni-MH rechargeable power batteries in electric vehicles: A review. Mater. Chem. Phys. 2017, 200, 164–178. [Google Scholar] [CrossRef]
  12. Chen, C.; Xiong, R.; Shen, W. A Lithium-Ion Battery-in-the-Loop Approach to Test and Validate Multiscale Dual H Infinity Filters for State-of-Charge and Capacity Estimation. IEEE Trans. Power Electron. 2018, 33, 332–342. [Google Scholar] [CrossRef]
  13. Xiong, R.; Cao, J.; Yu, Q.; He, H.; Sun, F.C. Critical Review on the Battery State of Charge Estimation Methods for Electric Vehicles. IEEE Access 2017, 6, 1832–1843. [Google Scholar] [CrossRef]
  14. Xiong, R.; Cao, J.; Yu, Q. Reinforcement learning-based real-time power management for hybrid energy storage system in the plug-in hybrid electric vehicle. Appl. Energy 2018, 211, 538–548. [Google Scholar] [CrossRef]
  15. Zhang, J.; Shao, G.; Guo, W.; Lou, Y.; Xia, B. Estimating the state of charge of MH-Ni batteries by measuring their stable internal pressure. J. Power Sources 2017, 343, 183–187. [Google Scholar] [CrossRef]
  16. Cho, M.H.; Trottier, J.; Gagnon, C.; Hovington, P.; Clément, D.; Vijh, A.; Kim, C.S.; Guerfi, A.; Black, R.; Nazar, L.; et al. The effects of moisture contamination in the Li-O2 battery. J. Power Sources 2014, 268, 565–574. [Google Scholar] [CrossRef]
  17. Gao, Z.; Chin, C.S.; Chiew, J.H.K.; Jia, J.; Zhang, C. Design and Implementation of a Smart Lithium-Ion Battery System with Real-Time Fault Diagnosis Capability for Electric Vehicles. Energies 2017, 10, 1503. [Google Scholar] [CrossRef]
  18. Yang, H.; Qiu, Y.; Guo, X. Prediction of State-of-Health for Nickel-Metal Hydride Batteries by a Curve Model Based on Charge-Discharge Tests. Energies 2015, 8, 12474–12487. [Google Scholar] [CrossRef]
  19. Galeotti, M.; Giammanco, C.; Cinà, L.; Cordiner, S.; Di Carlo, A. Synthetic methods for the evaluation of the State of Health (SOH) of nickel-metal hydride (NiMH) batteries. Energy Convers. Manag. 2015, 92, 1–9. [Google Scholar] [CrossRef]
  20. Andwari, A.M.; Pesiridis, A.; Rajoo, S.; Martinez-Botas, R.; Esfahanian, V. A review of Battery Electric Vehicle technology and readiness levels. Renew. Sustain. Energy Rev. 2017, 78, 414–430. [Google Scholar] [CrossRef]
  21. Rongeat, C.; Grosjean, M.H.; Ruggeri, S.; Dehmas, M.; Bourlot, S.; Marcotte, S.; Roué, L. Evaluation of different approaches for improving the cycle life of MgNi-based electrodes for Ni-MH batteries. J. Power Sources 2006, 158, 747–753. [Google Scholar] [CrossRef]
  22. Li, M.M.; Yang, C.C.; Chen, L.X.; Jiang, Q. Hydrogen storage alloys/reduced graphite oxide: An efficient hybrid electrode with enhanced high-rate dischargeability. Electrochim. Acta 2016, 200, 59–65. [Google Scholar] [CrossRef]
  23. Fernandez, I.J.; Calvillo, C.F.; Sánchez-Miralles, A.; Boal, J. Capacity fade and aging models for electric batteries and optimal charging strategy for electric vehicles. Energy 2013, 60, 35–43. [Google Scholar] [CrossRef]
  24. Taheri, P.; Yazdanpour, M.; Bahrami, M. Analytical assessment of the thermal behavior of nickel-metal hydride batteries during fast charging. J. Power Sources 2014, 245, 712–720. [Google Scholar] [CrossRef]
  25. Serrao, L.; Chehab, Z.; Guezennee, Y.; Rizzoni, G. An aging model of Ni-MH batteries for hybrid electric vehicles. In Proceedings of the 2005 IEEE Conference on Vehicle Power and Propulsion, Chicago, IL, USA, 7 September 2005; p. 8. [Google Scholar]
  26. Kang, S.J. Signal Converting Apparatus of Power Metering System, Power Metering System and Method for Signal-Converting in Power Metering System. U.S. Patent 13/678,487, 18 November 2011. [Google Scholar]
  27. Pastorello, D.F.; King, E.T. Energy-To-Pulse Converter Systems, Devices, and Methods Wherein the Output Frequency Is Greater Than the Calculation Frequency and Having Output Phasing. U.S. Patent 6,522,982, 18 February 2003. [Google Scholar]
  28. Delle Femine, A.; Gallo, D.; Landi, C.; Luiso, M. Advanced instrument for field calibration of electrical energy meters. IEEE Trans. Instrum. Meas. 2009, 58, 618–625. [Google Scholar] [CrossRef]
  29. He, H.W.; Zhang, Y.Z.; Xiong, R.; Wang, C. A novel Gaussian model based battery state estimation approach: State-of-Energy. Appl. Energy 2015, 151, 41–48. [Google Scholar] [CrossRef]
  30. Sun, B.X.; Jiang, J.C.; Wang, Z.G. SoC Estimation of Ni-MH Battery Pack Based on Approved HPPC Test and EKF Algorithm for HEV. Adv. Mater. Res. 2012, 403–408, 4398–4402. [Google Scholar] [CrossRef]
  31. Zhang, H.; Mu, H.W.; Zhang, Y.; Han, J. Calculation and Characteristics Analysis of Lithium Ion Batteries’ Internal Resistance Using HPPC Test. Adv. Mater. Res. 2014, 926–930, 915–918. [Google Scholar] [CrossRef]
  32. Zhan, F.; Jiang, L.J.; Wu, B.R.; Xia, Z.H.; Wei, X.Y.; Qin, G.R. Characteristics of Ni/MH power batteries and its application to electric vehicles. J. Alloys Compd. 1999, 293, 804–808. [Google Scholar] [CrossRef]
  33. El Ghossein, N.; Salameh, J.P.; Karami, N.; El Hassan, M.; Najjar, M. Survey on electrical modeling methods applied on different battery types. In Proceedings of the 2015 Third International Conference on Technological Advances in Electrical, Electronics and Computer Engineering (TAEECE), Beirut, Lebanon, 29 April–1 May 2015; pp. 39–44. [Google Scholar]
  34. Wang, Q.; Wang, J.; Zhao, P.; Kang, J.; Yan, F.; Du, C. Correlation between the model accuracy and model-based SoC estimation. Electrochim. Acta 2017, 228, 146–159. [Google Scholar] [CrossRef]
  35. Lou, T.T.; Zhang, W.G.; Guo, H.Y.; Wang, J.S. The Internal Resistance Characteristics of Lithium-Ion Battery Based on HPPC Method. Adv. Mater. Res. 2012, 455–456, 246–251. [Google Scholar]
  36. Pisu, P.; Rizzoni, G. A comparative study of supervisory control strategies for hybrid electric vehicles. IEEE Trans. Control Syst. Technol. 2007, 15, 506–518. [Google Scholar] [CrossRef]
  37. Rahimi-Eichi, H.; Baronti, F.; Chow, M.Y. Online adaptive parameter identification and state-of-charge coestimation for lithium-polymer battery cells. IEEE Trans. Ind. Electron. 2014, 61, 2053–2061. [Google Scholar] [CrossRef]
  38. He, H.; Xiong, R.; Zhang, X.; Sun, F.; Fan, J. State-of-charge estimation of the lithium-ion battery using an adaptive extended Kalman filter based on an improved Thevenin model. IEEE Trans. Veh. Technol. 2011, 60, 1461–1469. [Google Scholar]
  39. Tang, X.; Mao, X.; Lin, J.; Koch, B. Li-ion battery parameter estimation for state of charge. In Proceedings of the American Control Conference (ACC), San Francisco, CA, USA, 29 June–1 July 2011; pp. 941–946. [Google Scholar]
  40. Partovibakhsh, M.; Liu, G. An Adaptive Unscented Kalman Filtering Approach for Online Estimation of Model Parameters and State-of-Charge of Lithium-Ion Batteries for Autonomous Mobile Robots. IEEE Trans. Control Syst. Technol. 2014, 23, 357–363. [Google Scholar] [CrossRef]
  41. Xiong, R.; Tian, J.; Mu, H.; Wang, C. A systematic model-based degradation behavior recognition and health monitoring method for lithium-ion batteries. Appl. Energy 2017, 207, 372–383. [Google Scholar] [CrossRef]
  42. Kalman, R.E. A new approach to linear filtering and prediction problems. J. Basic Eng. 1960, 82, 35–45. [Google Scholar] [CrossRef]
  43. Zheng, C.; Fu, Y.; Chris Mi, C. State of charge estimation of lithium-ion batteries in electric drive vehicles using extended Kalman filtering. IEEE Trans. Veh. Technol. 2013, 62, 1020–1030. [Google Scholar]
  44. Yu, Q.; Xiong, R.; Lin, C.; Shen, W.; Deng, J. Lithium-ion battery parameters and state-of-charge joint estimation based on H-infinity and unscented Kalman filters. IEEE Trans. Veh. Technol. 2017, 66, 8693–8701. [Google Scholar] [CrossRef]
  45. Gao, Z.; Chin, C.S.; Woo, W.L.; Jia, J. Integrated Equivalent Circuit and Thermal Model for Simulation of Temperature-Dependent LiFePO4 Battery in Actual Embedded Application. Energies 2017, 10, 85. [Google Scholar] [CrossRef]
  46. Xiong, R.; Zhang, Y.; He, H.; Zhou, X.; Pecht, M.G. A double-scale, particle-filtering, energy state prediction algorithm for lithium-ion batteries. IEEE Trans. Ind. Electron. 2018, 65, 1526–1538. [Google Scholar] [CrossRef]
  47. Xiong, R.; Yu, Q.; Wang, L.; Lin, C. A novel method to obtain the open circuit voltage for the state of charge of lithium ion batteries in electric vehicles by using H infinity filter. Appl. Energy 2017, 207, 346–353. [Google Scholar] [CrossRef]
Figure 1. This is a figure describing running map and designed boats. Two parts are separately explained as follows: (a) Map of the Huanglong Cave. Underground rivers are annotated using blue lines; (b) The scene graph of wharf is contained in the right. The actual operation electric boat and charging pile are also shown in the figure.
Energies 11 00586 g001
Figure 2. The electrical system diagram of electric boat. Charge relay, positive relay and precharging relay are controlled by master controller to realize charging and discharging. The serial 7.2 V monomers are monitored by each slave controller through collecting 6 road temperature (6 T) and voltage (6 V).
Energies 11 00586 g002
Figure 3. Energy metering hardware structure of BMS.
Energies 11 00586 g003
Figure 4. Measurement accuracy of energy and voltage. The figure on the left is the energy metering error ratio in the corresponding charging current, while right is the voltage measurement errors. Conditions for testing are listed as: (a) Energy metering error is measured according to the standards of IEC 62053-22. (b) Voltage error value is compared with standard high precision voltage source.
Energies 11 00586 g004
Figure 5. Battery characteristics under OCV and HPPC test. The left in the figure is curve of OCV test, the right side is curve of HPPC test. Test conditions are listed as: (a) At the constant temperature environment of 15 degrees Celsius, 6A charge and discharge current is test conditions for HPPC. (b) For OCV, test conditions is under a constant temperature environment of 25 degrees Celsius, charge and discharge current of 0.5C, lay aside for three hours. Test equipment is battery tester Series4000 from MACCOR (Tulsa, OK, USA).
Energies 11 00586 g005
Figure 6. The OCV curve of charging and discharging after laying aside for difference time. The data is obtained by charging and discharging experiment using 6 A current. The nominal voltage and the nominal capacity of tested battery cell are 1.2 V and 1 Ah.
Energies 11 00586 g006
Figure 7. A schematic diagram of RC model with second-order.
Energies 11 00586 g007
Figure 8. The flow chart of the battery management system. The power on and the charging are performed by manual operation, and normal protection and power down are controlled by the program.
Energies 11 00586 g008
Figure 9. The internal resistance and polarization capacitance of battery.
Energies 11 00586 g009
Figure 10. The online identification effect of terminal voltage.
Energies 11 00586 g010
Figure 11. The contrast of SoC estimation accuracy under the working condition of Dynamic Stress Test (DST).
Energies 11 00586 g011
Figure 12. The SoC operation range correction in different situations.
Energies 11 00586 g012
Figure 13. The operation condition of electric boat continuously for five days (From top to bottom, it is the operation condition of electric boat from first day to the fifth day).
Energies 11 00586 g013
Figure 14. The DoD and recharge limit of SoC in one year period.
Energies 11 00586 g014
Figure 15. The voltage characteristic of monomer using proposed method of two years later.
Energies 11 00586 g015
Figure 16. The voltage characteristic of monomer after two years of operation without range optimization.
Energies 11 00586 g016

