Article

Luminescent Electrochromic Devices for Smart Windows of Energy-Efficient Buildings

1
Department of Chemistry and CQ-VR, University of Trás-os-Montes e Alto Douro, 5000-801 Vila Real, Portugal
2
Department of Physics and CICECO, University of Aveiro, 3810-193 Aveiro, Portugal
3
CENIMAT/I3N, Departamento de Ciência dos Materiais, Faculdade de Ciências e Tecnologia, FCT, Universidade Nova de Lisboa and CEMOP-UNINOVA, 2829-516 Caparica, Portugal
4
Department of Chemistry, University of Minho, Gualtar, 4710-057 Braga, Portugal
5
Current address: Leibniz Institute for Solid State and Materials Research (IFW) Dresden e.V., Institute for Complex Materials, D-01069 Helmholtzstr, Germany
*
Authors to whom correspondence should be addressed.
Energies 2018, 11(12), 3513; https://doi.org/10.3390/en11123513
Submission received: 19 November 2018 / Revised: 4 December 2018 / Accepted: 11 December 2018 / Published: 17 December 2018
(This article belongs to the Special Issue Building-Integrated Photovoltaics/Luminescent Solar Concentrators)

Abstract

:
To address the challenges of the next generation of smart windows for energy-efficient buildings, new electrochromic devices (ECDs) are introduced. These include indium molybdenum oxide (IMO), a conducting oxide transparent in the near-infrared (NIR) region, and a NIR-emitting electrolyte. The novel electrolytes are based on a sol-gel-derived di-urethane cross-linked siloxane-based host structure, including short chains of poly (ε-caprolactone) (PCL(530) (where 530 represents the average molecular weight in g mol−1). This hybrid framework was doped with a combination of either, lithium triflate (LiTrif) and erbium triflate (ErTrif3), or LiTrif and bisaquatris (thenoyltrifluoroacetonate) erbium (III) ([Er(tta)3(H2O)2]). The ECD@LiTrif-[Er(tta)3(H2O)2] device presents a typical Er3+ NIR emission around 1550 nm. The figures of merit of these devices are high cycling stability, good reversibility, and unusually high coloration efficiency (CE = ΔOD/ΔQ, where Q is the inserted/de-inserted charge density). CE values of −8824/+6569 cm2 C−1 and −8243/+5200 cm2 C−1 were achieved at 555 nm on the 400th cycle, for ECD@LiTrif-ErTrif3 and ECD@LiTrif-[Er(tta)3(H2O)2], respectively.

1. Introduction

Electrochromic (EC) materials [1,2] are a special class of materials characterized by a change in their optical properties as a small voltage is applied. This change can be reversible and persistent. Several applications of electrochromic devices (ECDs), such as information displays, helmet visors, and self-dimming rear mirrors for automobiles or car roofs [3], have been on the market for more than a decade.
The fabrication of smart windows for glazing technology remains one of the most interesting applications of ECDs [4,5,6,7,8,9,10]. These devices are very appealing from environmental and economical points of view [11], and some of them have already reached commercialization [12,13]. In the last few years, it has been demonstrated that ECDs offer great prospects for future zero-energy performance buildings [14,15]. Smart windows can provide effective dynamical control of the amount of solar heat and lighting input, resulting in energy savings through reduced cooling and heating loads. This allows energy savings with lighting and, in parallel, decreases the consumption of alternative sources of heat and light. Important issues to take into account in the control of the transmittance of visible sunlight and solar heat into a building are the climate zones or seasons and the time zones [16]. Nowadays, it is accepted that the control of the visible and near-infrared (NIR) regions of the solar spectrum is a key target for the development of advanced ECDs for the next generation of smart windows. Indeed, solar energy from the invisible solar spectrum (ultraviolet (UV) and NIR regions) encompasses about 60% of the whole solar spectrum, of which 50% belongs to the NIR region.
A classical ECD comprises a typical sandwich multilayer configuration, usually represented by the notation glass/TCO/EC1/IC/IS/TCO/glass, where TCO is a transparent conducting oxide (e.g., indium tin oxide (ITO)), EC1 is an electrochromic electrode layer (e.g., cathodic tungsten oxide (WO3)), IC is an ion conductor (electrolyte/separator), and IS is an ion storage electrode.
Herein, we have combined for the first time in an ECD a TCO transparent in the NIR region with a NIR-emitting hybrid electrolyte. The latter includes, either a mixture of a lithium salt plus a lanthanide (Ln) salt sharing the same anion, or a mixture of a lithium salt and a Ln β-diketonate aquocomplex. These types of complexes are very attractive because they exhibit high luminescence efficiency, their emission bands are narrow, and their luminescence lifetimes are long. Some of the disadvantages associated with Ln3+ ions, such as quenching effects and poor absorption ability, may be overcome through complexation with β-diketonate ligands, which shield the cations from luminescence quenching and enable the so-called antenna effect [17]. The incorporation into the hybrid structures, prepared by the sol–gel method, of this sort of complex is of the utmost interest, as it solves the major drawbacks of β-diketonate complexes (poor photo-, mechanical, and thermal stability) [18].
The ECDs introduced in this work comprise NIR-transparent indium molybdenum oxide (IMO) TCOs [19,20], WO3 as EC1, and no IS. The electrolytes employed, inspired by a previous work of our group [21], were prepared by the sol-gel method and are based on a di-urethane cross-linked poly(ε-caprolactone) (d-PCL(530))/siloxane (where d stands for di and 530 is the average molecular weight in g mol–1) hybrid network [22]. Mixtures of lithium and erbium triflates (LiTrif and ErTrif3.xH2O, respectively), and LiTrif and bisaquatris (thenoyltrifluoroacetonate) erbium (III) ([Er(tta)3(H2O)2]) were then added to this framework to form the electrolytes IC1 and IC2, respectively. The former electrolyte was used here for comparison purposes, since it was already employed to prepare glass/ITO/WO3/IC1/ITO/glass ECDs. This device presented fast switching speed, cyclic stability, and high electrochromic reversibility, as well as good coloration efficiency and open circuit memory [21]. The IC1 and IC2 electrolytes were prepared with concentrations n = 4.9 and 9.1, respectively, where n corresponds to the number of (C(O)(CH2)5O) repeat units of PCL(530) per mixture of Li+ and Er3+ ions. The concentration of the lithium salt was kept practically the same in both materials, whereas the concentration of Er3+ was lower in IC2. Based on previous works [21,22,23], the electrolytes were noted as d-PCL(530)4.9LiTrifm-ErTrif3m’ and d-PCL(530)9.1LiTrifm-[Er(tta)3(H2O)2]m’’, where m, m’, and m’’ indicate the amount of LiTrif, ErTrif3, and [Er(tta)3(H2O)2], respectively. It must be noted that only a few ECDs incorporating electrolytes doped with erbium salts have been reported in the literature. To the best of our knowledge, k-carrageenan (k-Cg) [24], deoxyribonucleic acid (DNA) [25], and chitosan [26] have been the only host matrices doped with ErTrif3 proposed so far for ECDs. No references of electrolytes doped with Er3+ complexes have been found in the same context.
The electrolyte sol precursors were cast onto glass slides coated with IMO and IMO/WO3. The electro-optical performance and photoluminescence features of the glass/IMO/WO3/electrolyte/IMO/glass ECDs were studied. Replicas of the electrolytes were produced as films and their chemical-physical properties were characterized.

2. Materials and Methods

Erbium (III) chloride hexahydrate (ErCl3.6H2O, Aldrich, 99%), thenoyltrifluoroacetone (HTTA, Aldrich, 99%), ethanol (EtOH, Merck, PA grade), sodium hydroxide (NaOH, Carlo Erba, pellets for analysis), 3-isocyanatepropyltriethoxysilane (ICPTES, Fluka, 95%), α,ω-hydroxyl poly(ε-caprolactone) (PCL(530) with a molecular weight of 530 g mol1, Fluka, Er(CF3SO3)3.xH2O (ErTrif3.xH2O, Aldrich, 98%), and anhydrous LiCF3SO3 (LiTrif, Aldrich, 99.995%) were used as received. Tetrahydrofuran (THF, Merck, puriss PA grade) was maintained over molecular sieves. Deionized water was used.
Synthesis of the [Er(tta)3(H2O)2] complex: The complex, produced as a pink powder, as seen in Figure S1a,b of the Supporting Information, was synthesized according to the method reported previously for the corresponding europium complex [18]. The elemental analysis was done at CACTI (University of Vigo). Calculated: C: 33.23, H: 1.85, S: 11.11. Found: C: 33.32, H: 1.74, S: 11.48.
Synthesis of the d-PCL(530)/siloxane4.9LiTrif-ErTrif3 electrolyte: The preparation of this material was performed using the procedure reported earlier [21], as seen in Scheme 1SA and Table S1 of the Supporting Information.
Synthesis of the d-PCL(530)/siloxane9.1LiTrif-[Er(tta)3(H2O)2] electrolyte: The LiTrif- and [Er(tta)3H2O2]-doped d-PCL(530)/siloxane-based hybrid was prepared under the same conditions reported previously [18,19,20], as seen in Scheme 1SB and Table S1 of the Supporting Information.
Characterization of the [Er(tta)3(H2O)2] complex and of the d-PCL(530)/siloxane9.1LiTrif-[Er(tta)3(H2O)2] electrolyte: The thermogravimetric analysis (TGA) curve of the complex was obtained using a TA Instruments Q50 thermobalance. The complex was first dried in a dessicator with phosphorous pentoxide (P2O5). It was then transferred to an open platinum crucible and analyzed with a heating rate of 10 °C min−1 from room temperature to 800 °C. The purge gas used was high-purity nitrogen (N2) (50 cm3 min−1 flow rate). The TGA curves of the electrolytes were recorded twice in a NETZSCH STA 449F3 thermal analyzer, using Proteus software, from room temperature up to 700 °C in a N2 atmosphere (50 cm3 min−1 purge, 20 cm3 min−1 protective flow). The sample, with a mass of approximately 3 to 5 mg, was reduced to small pieces, and was then transferred to an open alumina (Al2O3) crucible.
The differential scanning calorimetry (DSC) analyses were performed in a Setaram (DSC131) calorimeter with a heating rate of 10 °C min−1, from room temperature to 160 °C, using hermetically sealed aluminum crucibles (30 µL). A mass of approximately 10 mg was used for each experiment. The purge gas employed was N2 (30 cm3 min−1 flow rate). The samples were pre-dried in the same conditions as reported above for the TGA analysis of the complex.
The Fourier transform infrared (FT-IR) spectrum of the complex (analyzed as a potassium bromide-based pellet) was recorded at room temperature in the 4000–500 cm−1 range in a spectrophotometer from Unicam (120 scans, resolution of 4 cm−1).
The absorption spectra of solutions of HTTA and of the complex were recorded in the 200–700 nm range with a UV-visible spectrophotometer from Spectronic Genesys 2PCC. The solutions were prepared using ethanol as solvent.
Scanning electronic microscopy (SEM) and polarized optical microscopy (POM) images of the electrolytes were recorded using a SEM/ESEM-FEI Quanta 400 (high acceleration voltage (20 kV)) and an OPTIKA B-600POL microscope equipped with an 8 megapixel digital photo camera, respectively. For SEM analysis, the sample was fixed on an aluminum stub using carbon tape and then coated with gold/palladium. The POM images were analyzed with OPTIKAVision Pro software.
A Philips X’Pert MPD Powder diffractometer was used to register the X-ray diffraction (XRD) patterns of the electrolytes over the 3–70° 2θ range at room temperature (resolution of 0.02°). CuKα monochromated radiation (λ = 1.54 Å) was employed.
An Autolab PGSTAT-12 (Eco Chemie) was employed to determine the ionic conductivity of the electrolytes. A symmetrical cell was composed of 10-mm diameter ion-blocking gold electrodes (Goodfellow, >99.95%) with a small piece of the electrolyte sandwiched between them. The cell was transferred to a Buchi TO51 tube oven equipped with a type K thermocouple located near the electrolyte disk to monitor the sample temperature. Bulk conductivities of the electrolytes were determined between room temperature and 100 °C, in the heating cycles, using complex plane impedance spectroscopy (frequencies ranging from 65 kHz to 500 mHz).
ECD construction: IMO thin films were deposited by radio frequency magnetron sputtering at room temperature according to the procedure reported in a previous work [19], using a ceramic target (99.99%) (Super Conductor Materials, Inc., USA, In2O3 (98 wt %): Mo (2 wt %)) and soda-lime glass substrates (100 mm3 × 100 mm3 × 1 mm3). Amorphous WO3 was deposited by sputtering on an IMO glass substrate. The film was produced in a Pfeiffer Vacuum Classic 500 system using a 3″ diameter ceramic target from Plasmaterials, an argon and oxygen atmosphere (oxygen partial pressure of 0.2 Pa), and a deposition pressure of 1.0 Pa, achieving thicknesses of 300 nm.
The electrolyte was deposited by solvent casting on the WO3/IMO plate. Then it was sandwiched between this plate and the IMO layer of the second plate, gently pressed between them, and finally allowed to dry. The two ECDs tested, i.e., glass/IMO/WO3/d-PCL(530)/siloxane4.9LiTrif-ErTrif3/IMO/glass and glass/IMO/WO3/d-PCL(530)/siloxane9.1LiTrif-[Er(tta)3(H2O)2]/IMO/glass, are henceforth abbreviated as ECD@LiTrif-ErTrif3 and ECD@LiTrif-[Er(tta)3(H2O)2], respectively.
ECD characterization: A UV-visible Spectronic Genesys 2PCC spectrophotometer was employed to determine the optical transmittances (T, in %) of the ECDs in a 400–700 nm range. Voltages of −4.0/+4.0 V were applied for coloring/bleaching for 30/10 s, respectively.
A potentiostat/galvanostat (Autolab model 302) was used to perform the cyclic voltammetry (CV) tests. Cyclic voltammograms were recorded upon the application of voltages of ±3.0 V for ECD@LiTrif-ErTrif3 and ±3.5 V for ECD@LiTrif-[Er(tta)3(H2O)2] at different scan rates (50, 20, and 50 mV s−1). The same equipment was employed to conduct the chronoamperometric (CA) measurements. The ECD current response was monitored as a function of time while the applied voltage was stepped between ±3.0 V for ECD@LiTrif-ErTrif3 and ±3.5 V for ECD@LiTrif-[Er(tta)3(H2O)2] with a delay time at each voltage of 50 s. Voltages lower than these did not produce any color switch. Integration of the CA curves during the coloring and bleaching processes yielded the cathodic and anodic charge densities, respectively. In the set-up used for electrochemical measurements, WO3 was the working electrode and the IMO acted as counter and reference electrodes.
To evaluate the photoluminescence features of the ECDs, two drops of the electrolyte solution were deposited on the glass/IMO and on the glass/IMO/WO3 plates and then allowed to dry. The photoluminescence spectra were recorded at room temperature in the NIR range, using the front face acquisition mode. A modular double grating excitation spectrofluorometer (Fluorolog-3, Horiba Scientific), equipped with an emission monochromator (TRIAX 320) coupled to a Hamamatsu photomultiplier (H9170), were used. A 450-W Xe arc lamp was employed as an excitation source. A photodiode reference detector was used to correct the emission spectra for detection and optical spectral response of the spectrofluorometer, as well as the excitation spectra for the spectral distribution of the lamp intensity.

3. Results

3.1. Characterization of the Complex and of the C2 Electrolyte

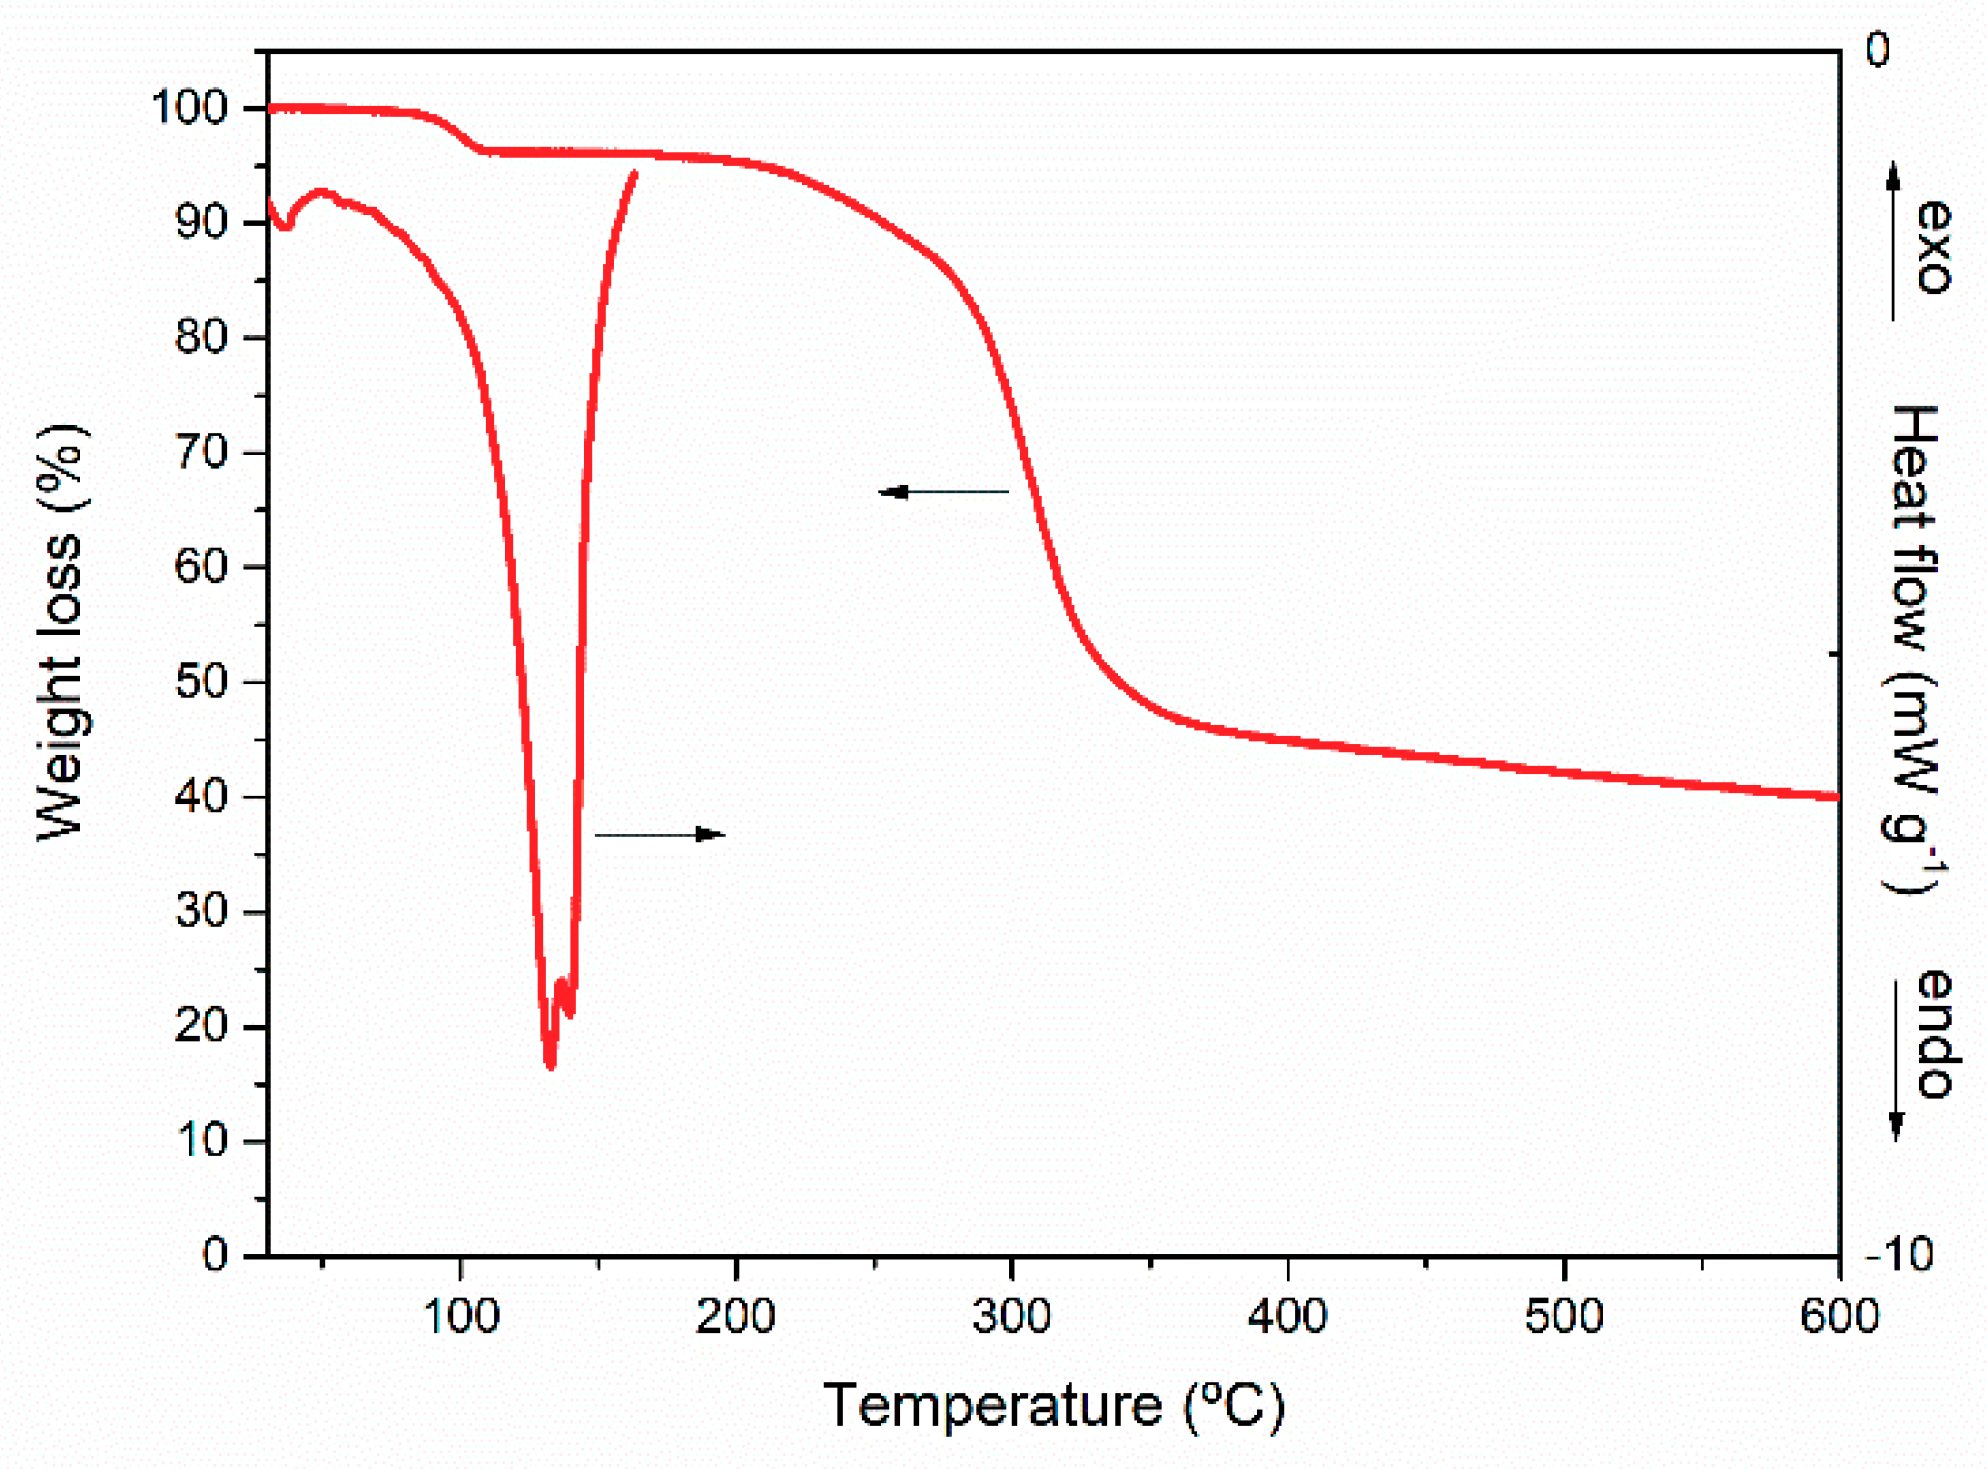
3.1.1. [Er(tta)3(H2O)2] Complex

Figure 1 (left side y axis) shows the TGA curve of [Er(tta)3(H2O)2], which clearly demonstrates a weight loss of 5% between 83 and 110 °C attributed to the release of two water molecules from the first coordination sphere of Er3+. The empirical formula deduced from elemental analysis was confirmed by the data retrieved from the TGA experiment. After this initial weight loss, the sample remained stable up to 180 °C. Beyond this temperature, a major weight loss occurred up to about 350 °C. At this stage, approximately 40% of the sample remained to be decomposed. A further weight loss of 3% took place until the end of the experiment at 600 °C.
The DSC curve of [Er(tta)3(H2O)2] exhibits a weak low-temperature endotherm (onset temperature (Tonset) = 25 °C and peak temperature (Tpeak) = 35 °C) and a prominent event centered at about 140 °C (Figure 1, right y axis). The profile of the latter endotherm is resolved into a pair of peaks with Tpeak = 132 and 139 °C, assigned to the loss of the two water molecules from the first coordination sphere of Er3+ and with the fusion of the complex, respectively [18].
The FT-IR spectrum of the complex, represented in Figure S1c of the Supporting Information, displays a band at 3347 cm−1 and a pair of bands at 1604 and 1584 cm−1, attributed to the stretching vibration of bonded OH groups of the water ligands, and to the stretching vibration of the C=O and C=C groups, respectively [18].
The UV-visible spectrum of an ethanolic solution of [Er(tta)3(H2O)2], seen in Figure S2 of the Supporting Information, displays its lowest-energy absorption maximum at 341 nm due to the singlet–singlet transition of the tta-ligands [18]. The low-energy absorption edge is close to 400 nm. A sharp band is also detected at 282 nm.

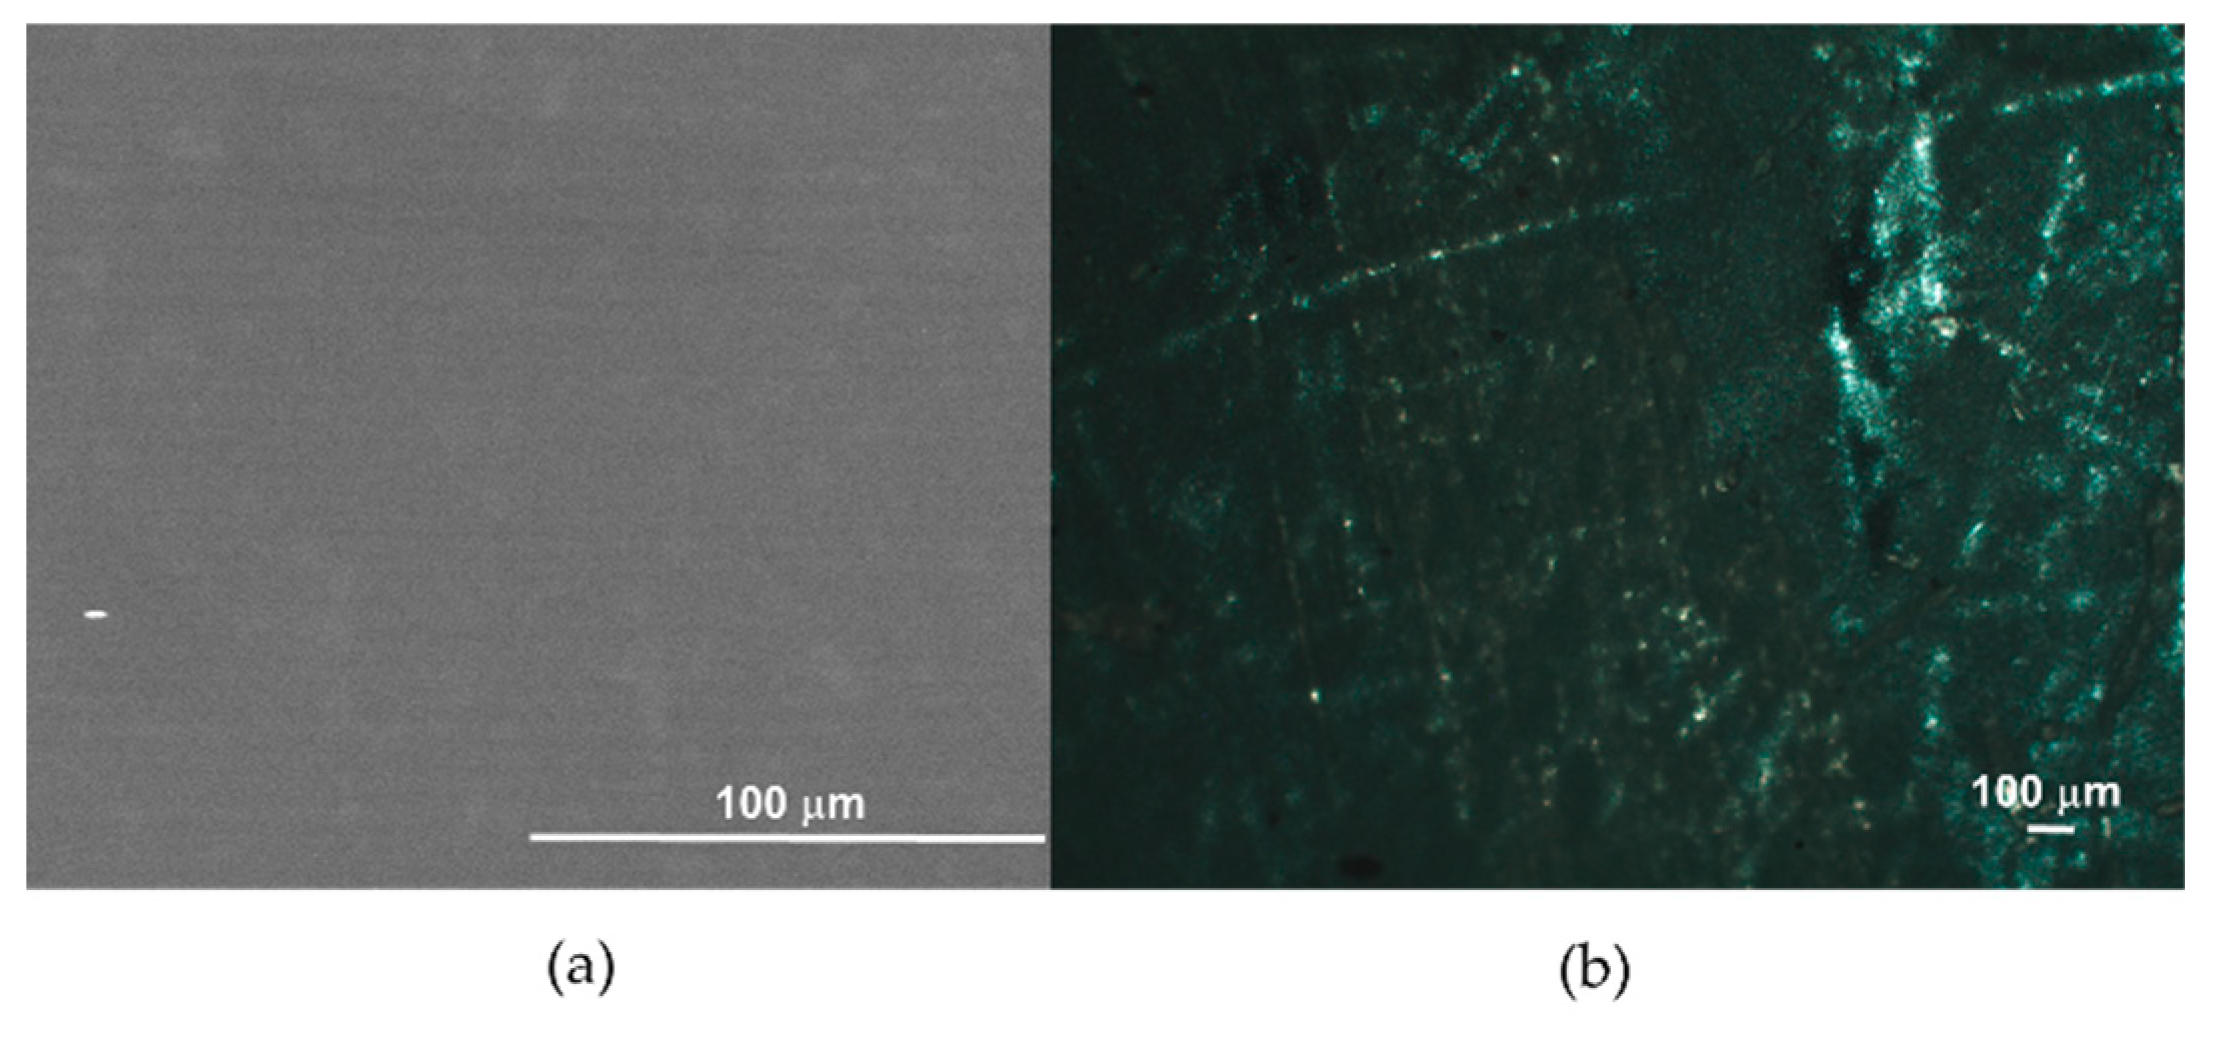
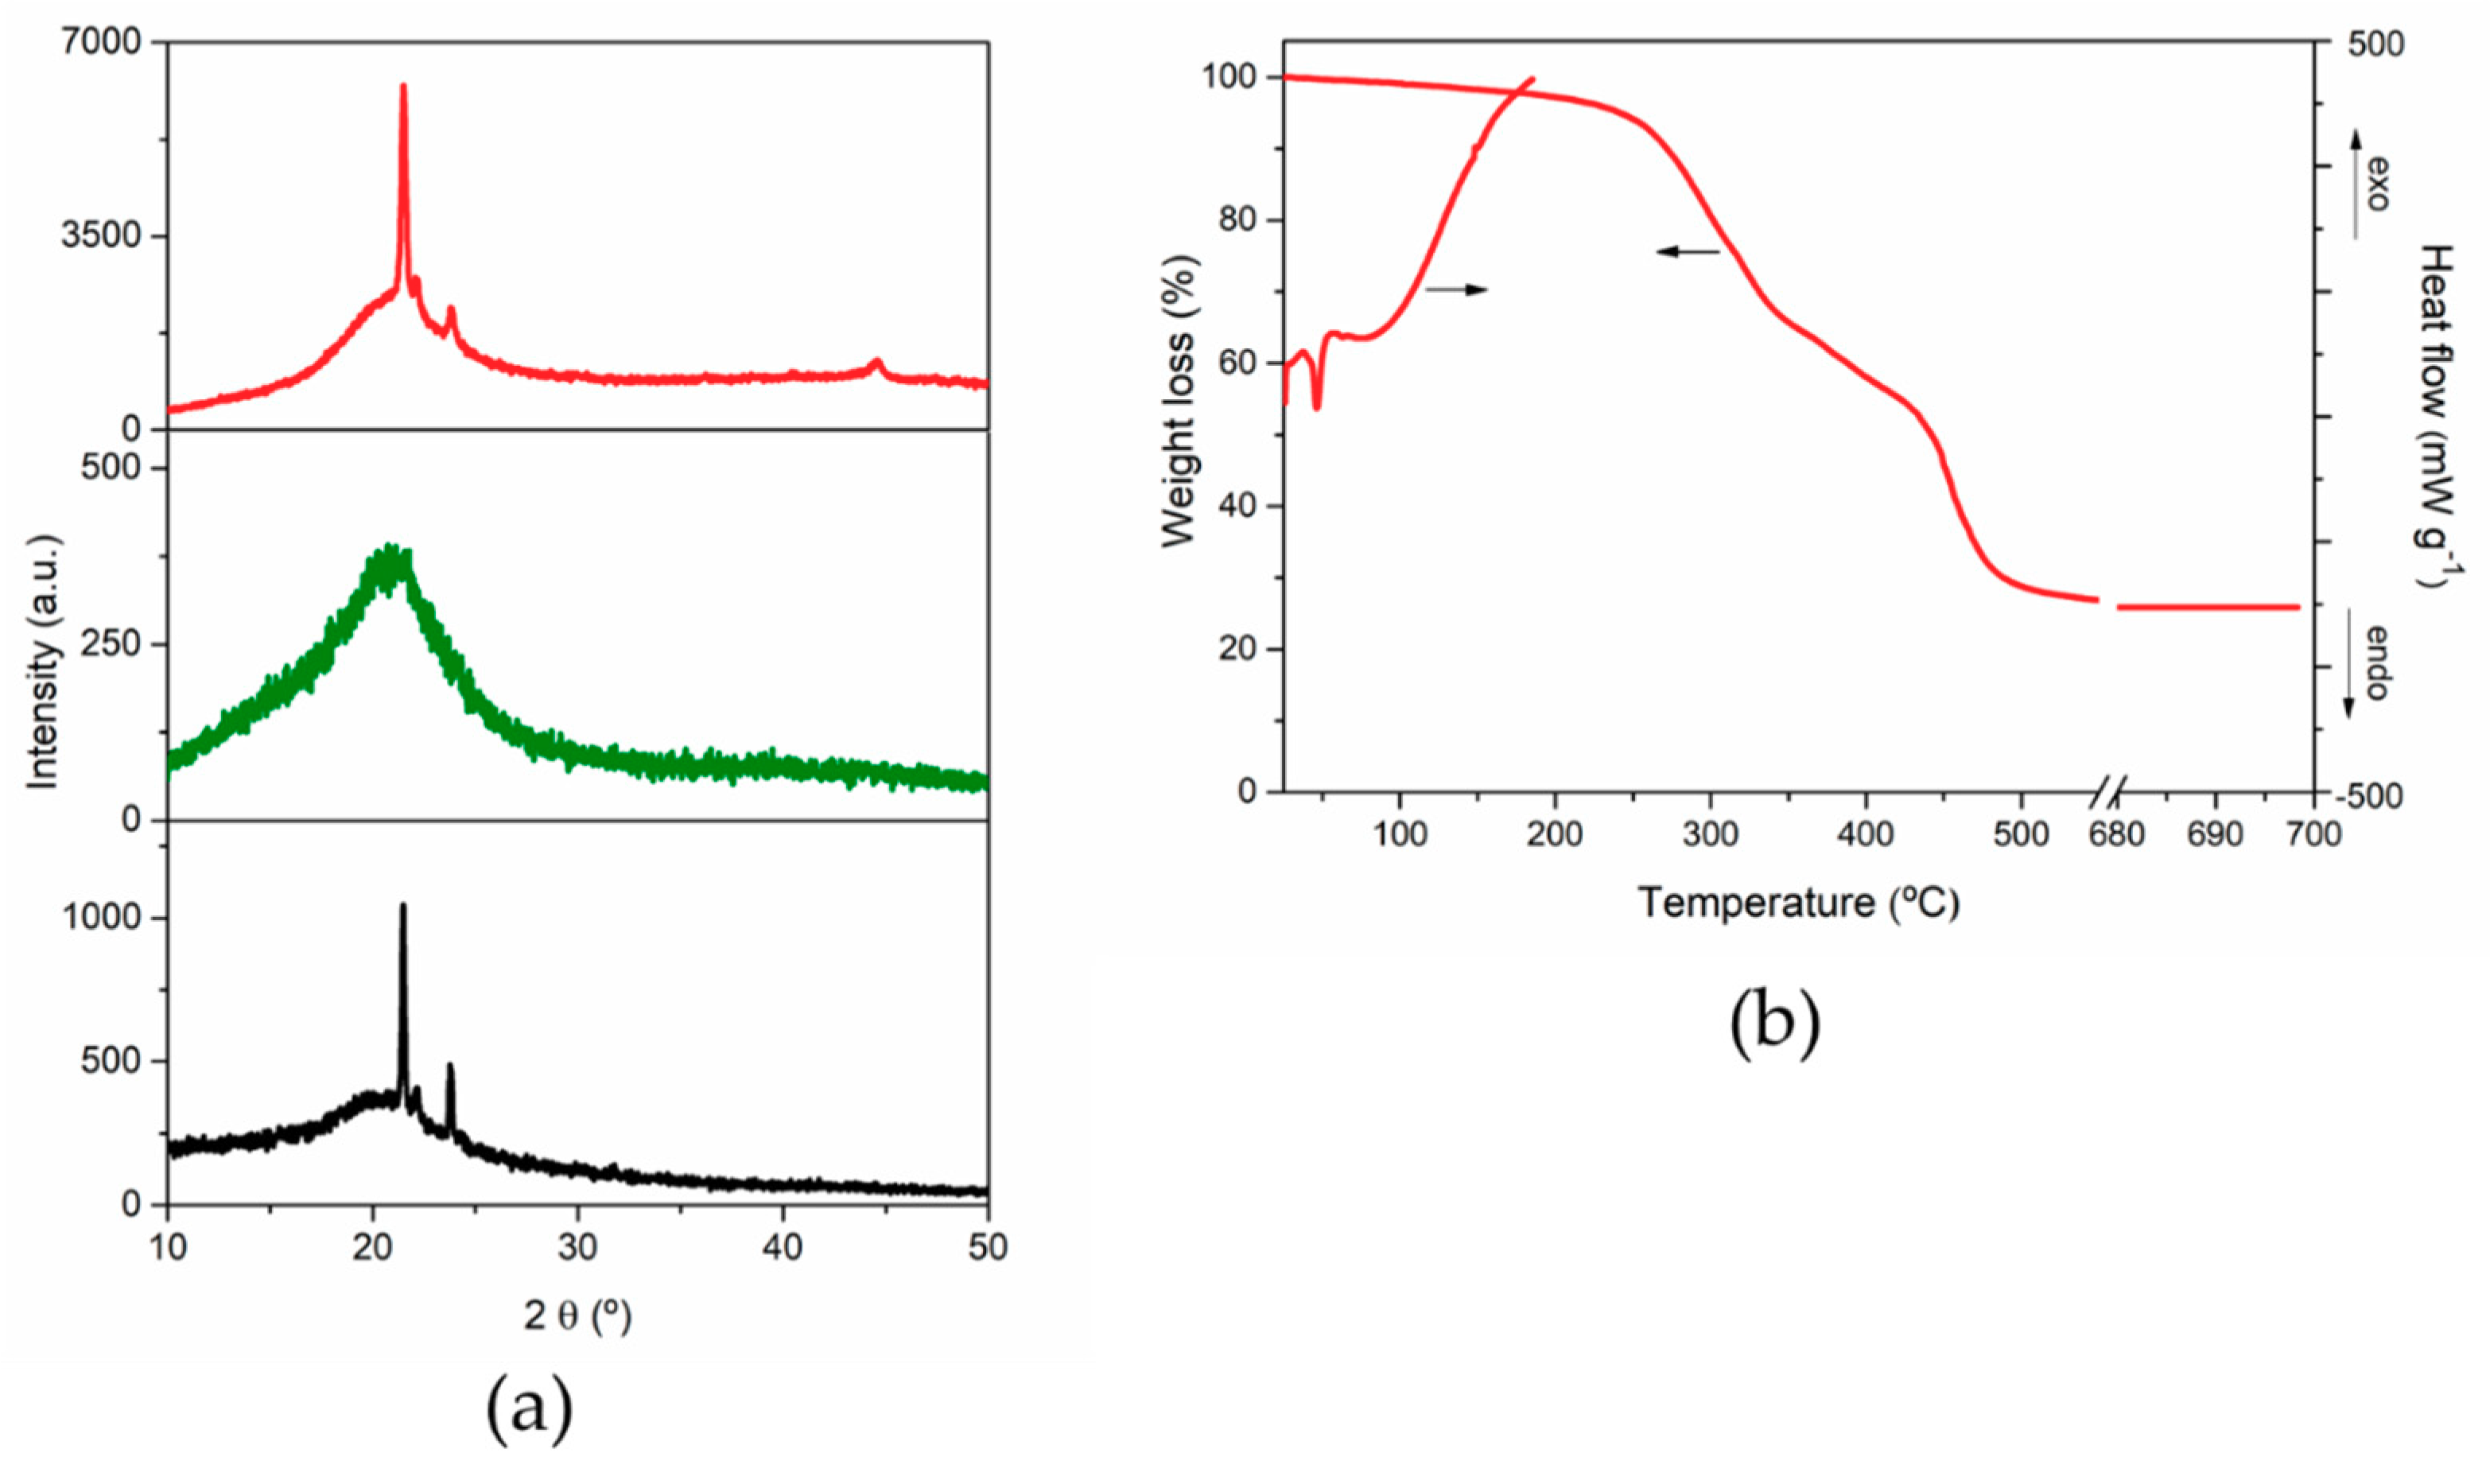
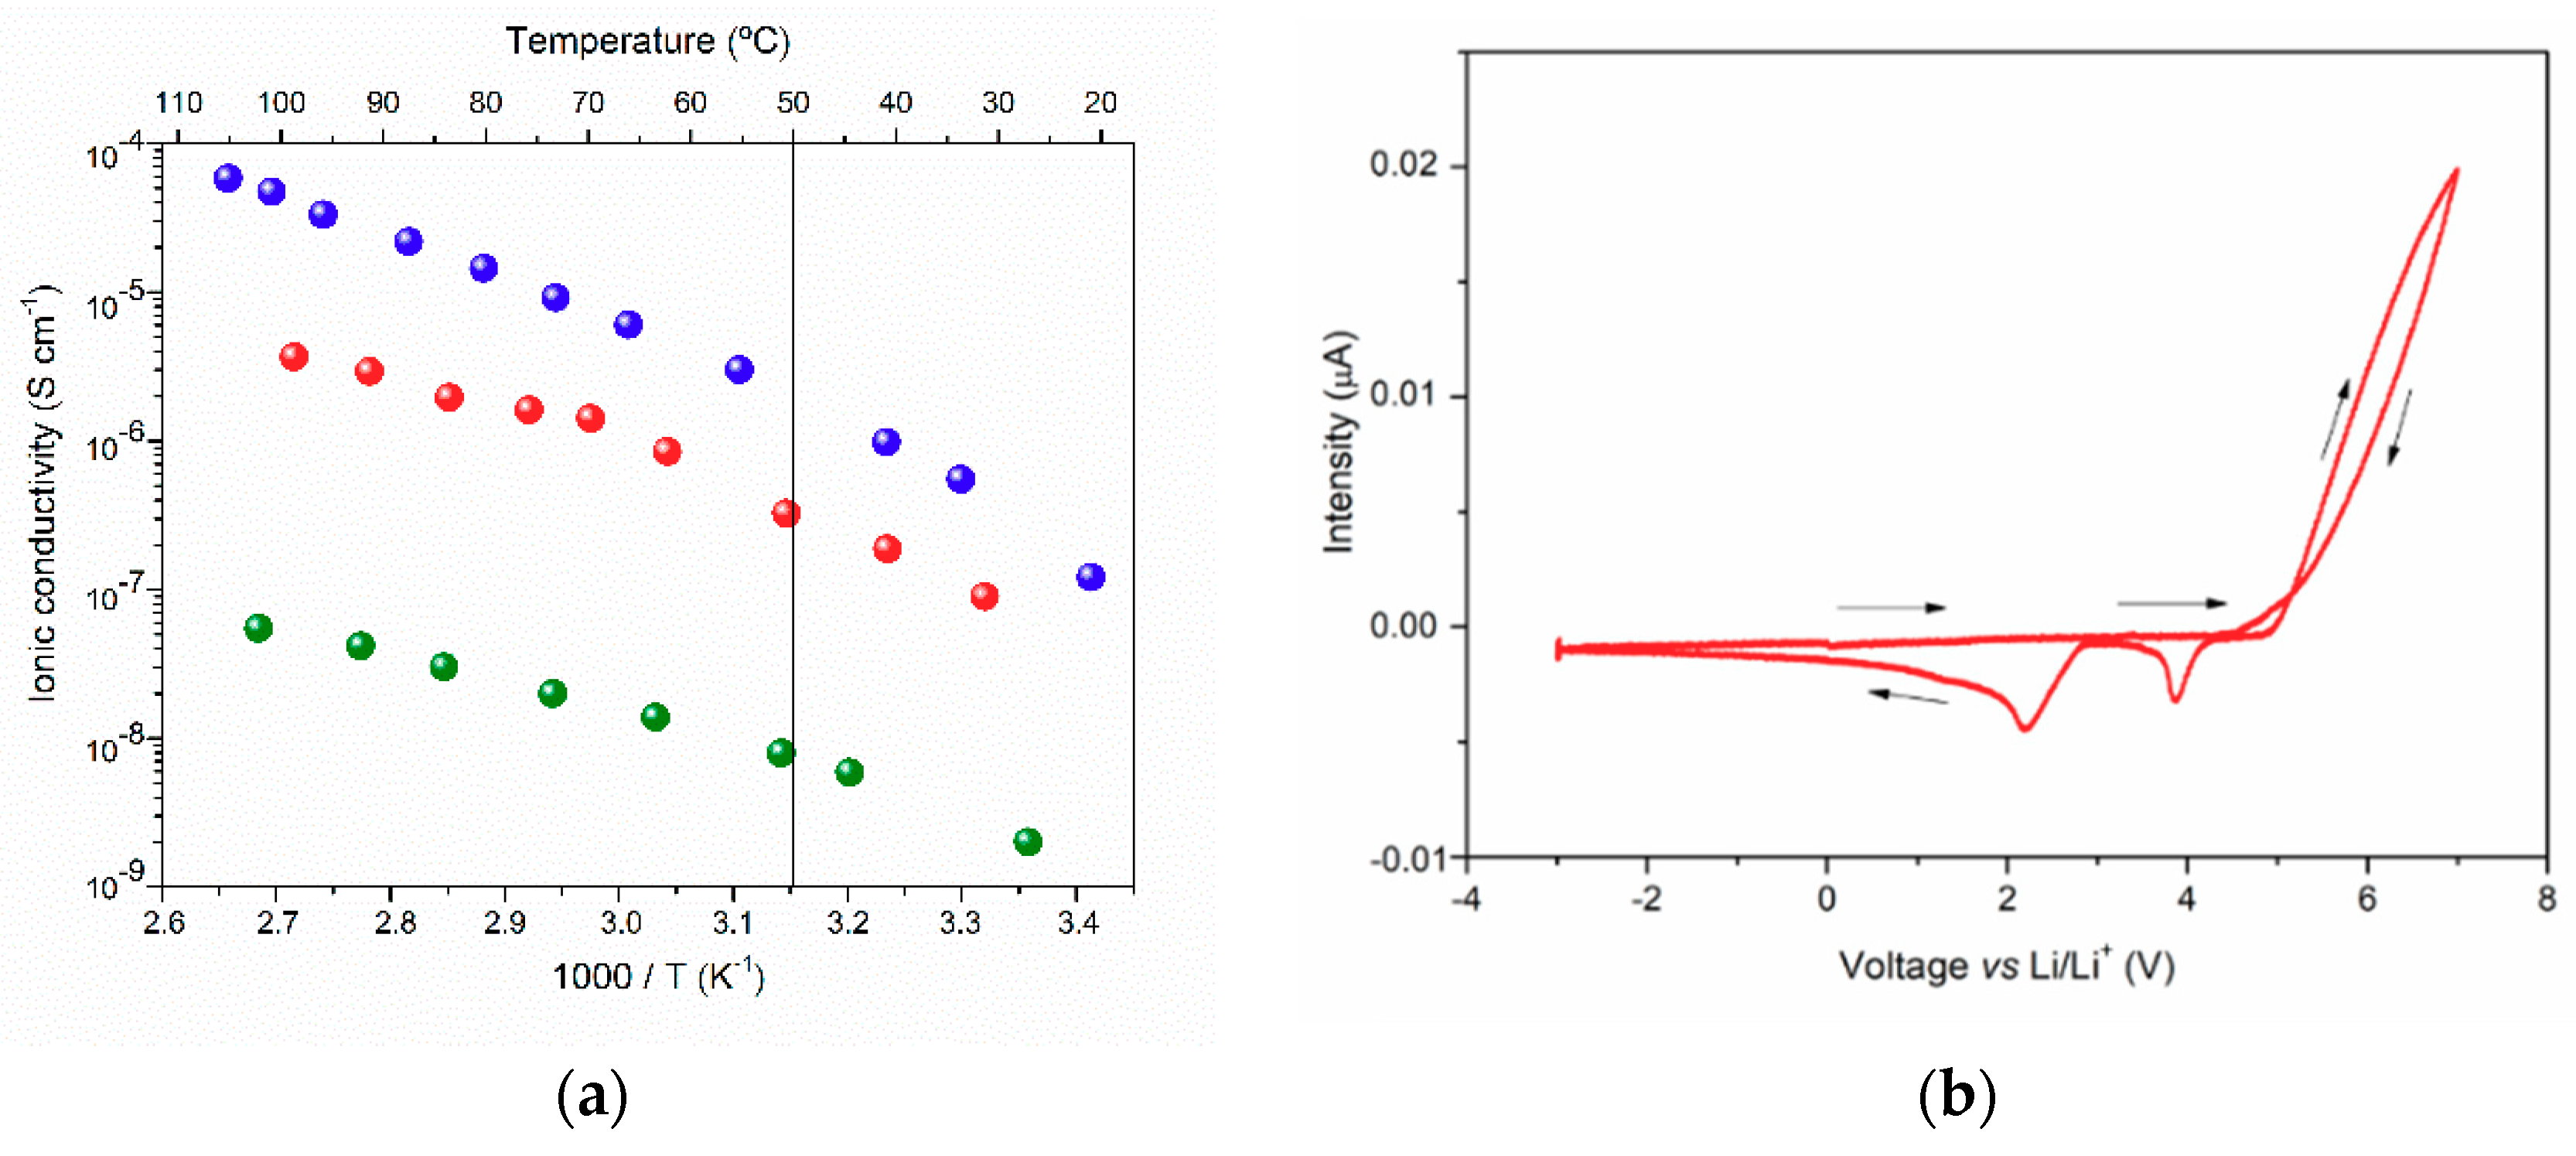
3.1.2. d-PCL(530)9.1LiTrif-[Er(tta)3(H2O)2] Electrolyte

The SEM image reproduced in Figure 2a reveals that d-PCL(530)9.1LiTrifm-[Er(tta)3(H2O)2] has a homogeneous texture.
The XRD pattern of this electrolyte is reproduced in Figure 3a (red line), together with those of commercial PCL(530), (Figure 3a (black line) [27]), and of the d-PCL(530)/siloxane host matrix, (Figure 3a (green line) [27]). All the XRD patterns exhibit a broad band, Gaussian in shape, centered at approximately 21°, associated with the coherent diffraction of the siliceous domains [28]. The characteristic peaks of LiTrif [29] or [Er(tta)3(H2O)2] (not shown) are missing, indicating that the host hybrid matrix efficiently encapsulated the lithium salt and the erbium complex. This electrolyte has a semi-crystalline nature, as substantiated by the presence of the Bragg peaks at about 21.5 and 23.8°, (Figure 3a (red line)), which confirms the existence of crystalline chains of PCL(530), (Figure 3a (black line)). This pair of peaks, already reported for a higher-molecular-weight semi-crystalline PCL [30], was attributed to the (110) and (200) diffracting planes of the crystalline regions (orthorhombic crystal structure) [31]. These peaks are absent in the XRD pattern of the d-PCL(530)/siloxane host matrix, as seen in Figure 3a (green line), indicating that the mixture of LiTrif and [Er(tta)3(H2O)2] induced the crystallization of a significant fraction of the polymer chains. The birefringence evident in the POM image shown in Figure 2b confirms the presence of sub-micrometer anisotropy in d-PCL(530)/siloxane9.1LiTrif-[Er(tta)3(H2O)2].
The TGA curve of d-PCL(530)/siloxane-LiTrifm-[Er(tta)3(H2O)2], reproduced in Figure 3b (left y-axis), shows that the decomposition of this material is a multistep process, which is initiated at approximately 100 °C. Between this temperature and 420 °C, a major loss of weight occurs (about 46%). Another step of marked weight loss follows up to 515 °C. At higher temperatures, a plateau is reached, which remains until the maximum temperature analyzed. At this point, 27% of the hybrid remains to be decomposed.
The d-PCL(530)/siloxane9.1LiTrifm-[Er(tta)3(H2O)2]) gives rise to a weak peak (Tonset = 38 °C and Tpeak = 48 °C) in the DSC curve, as seen in Figure 3b (right y-axis), attributed to the melting of short non-complexed polymer chains of the d-PCL(530)/siloxane hybrid host [18,21,27,32,33]. There is no evidence of the formation of free LiTrif [27] or [Er(tta)3(H2O)2], corroborating the conclusion retrieved from the XRD data.
Figure 4a shows the Arrhenius conductivity plot of d-PCL(530)/siloxane (green spheres) [34], d-PCL(530)/siloxane5.2LiTrif-ErTrif3 (blue spheres) [21], and d-PCL(530)/siloxane9.1LiTrif-[Er(tta)3(H2O)2] (red spheres). As expected, the doped systems exhibit higher ionic conductivity than the non-doped matrix [34] over the range of temperatures studied.
In the case of d-PCL(530)/siloxane9.1LiTrif-[Er(tta)3(H2O)2], the inflection observed at about 50 °C corresponds to the fusion of the sample, as suggested by the DSC data seen in Figure 3b. At temperatures higher than 50 °C, a non-linear behavior, typical of amorphous materials, is observed. The ionic conductivity attains 8.96 × 10⁻⁸ and 3.68 × 10⁻⁶ S cm−1 at room temperature and 100 °C, respectively. These values are one order of magnitude lower than those reported for d-PCL(530)/siloxane5.2LiTrif-ErTrif3 [21]. This finding may be correlated with the presence of the very bulky [Er(tta)3(H2O)2] complex, which probably reduces the number of the mobile species responsible for ion transport (presumably Er3+ and Trif-ions).
The electrochemical stability of d-PCL(530)/siloxane9.1LitTrif-[Er(tta)3(H2O)2] was determined by microelectrode cyclic voltammetry over the potential range −3.0 V → +7.0 V. The voltammogram recorded in Figure 4b indicates that this sample is anodically stable up to about 5.0 V versus Li/Li+, in accordance with analogue systems [22,35]. The peaks observed are attributed to the reduction of decomposition products [35].

3.2. Characterization of the IMO Layers

The SEM image reproduced in Figure S3a of Supporting Information reveals a homogeneous distribution of the deposited film of IMO. This result is consistent with the two-dimensional (2D) atomic force microscopy (AFM) image, as seen in Figure S3b.
The XRD pattern of IMO, (Figure S3c of the Supporting Information), contains, as expected, the diffraction peaks corresponding to crystallographic planes (211), (222), (400), (440), and (622) of a cubic bixbyite indium oxide In2O3 structure (ICDD file no. 06-0416, 1997) [19].
The transmittance spectrum of the IMO layer allows concluding that this TCO exhibits a transmittance higher than 70% over the entire spectral range studied, as seen in Figure S3d of the Supporting Information, thus confirming its suitability for applications in the NIR region [19].
Table S2 of the Supporting Information gathers the main parameters retrieved from the electrical characterization performed on the IMO layer prepared here, together with the values reported previously for the deposition of IMO at different partial pressures of oxygen [19]. The analysis of these data allows inferring that the values obtained here are in the same range as those previously determined.

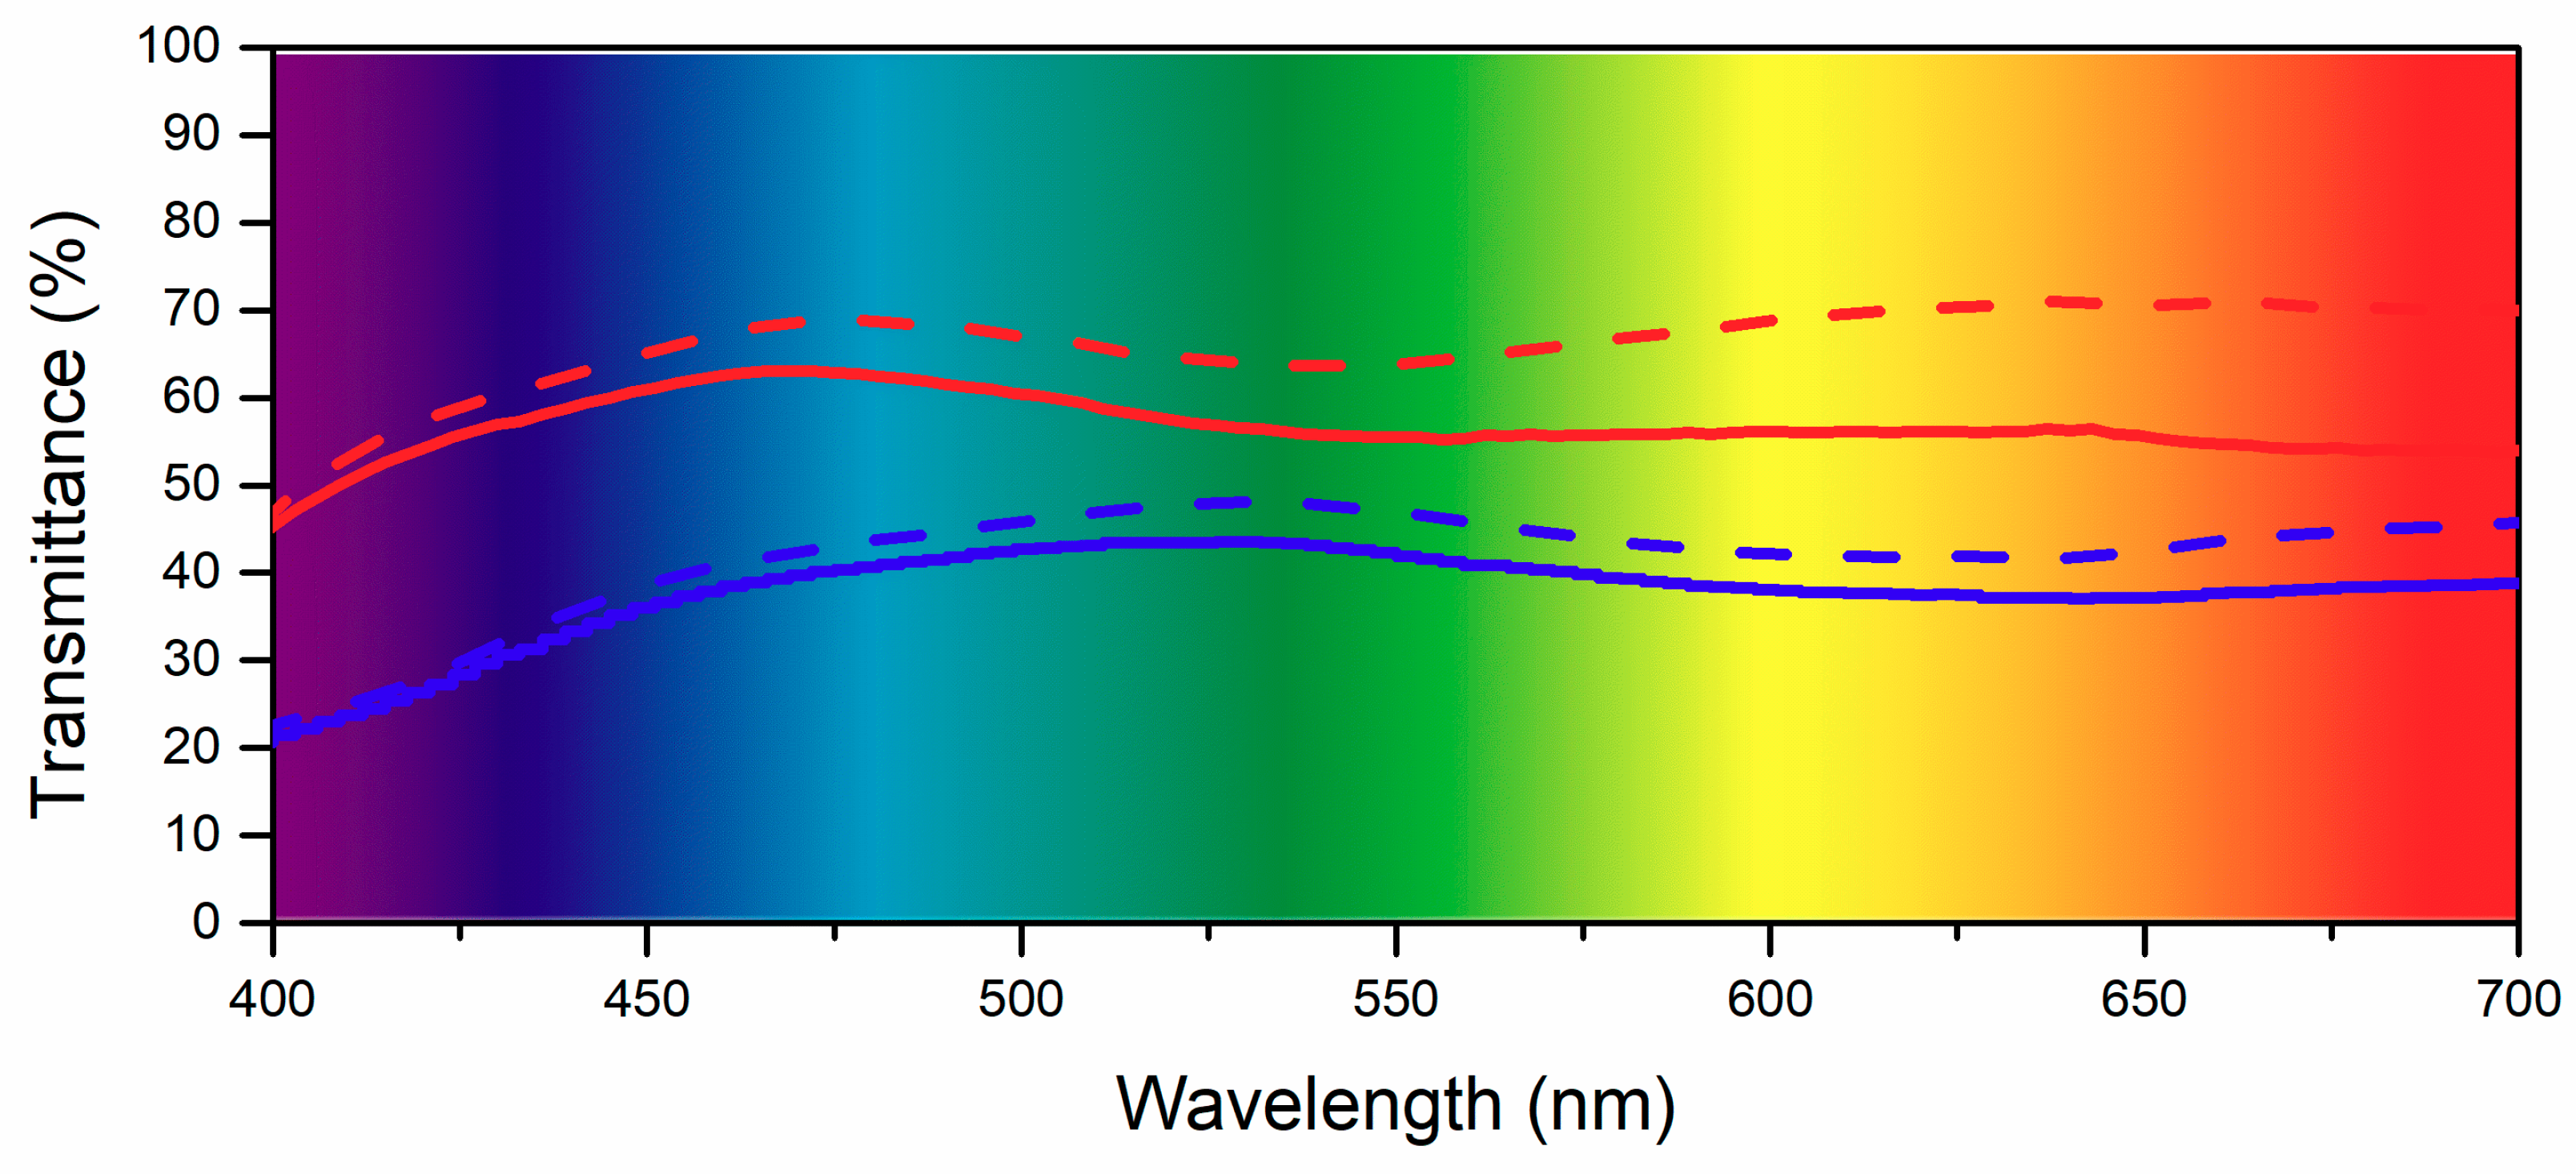
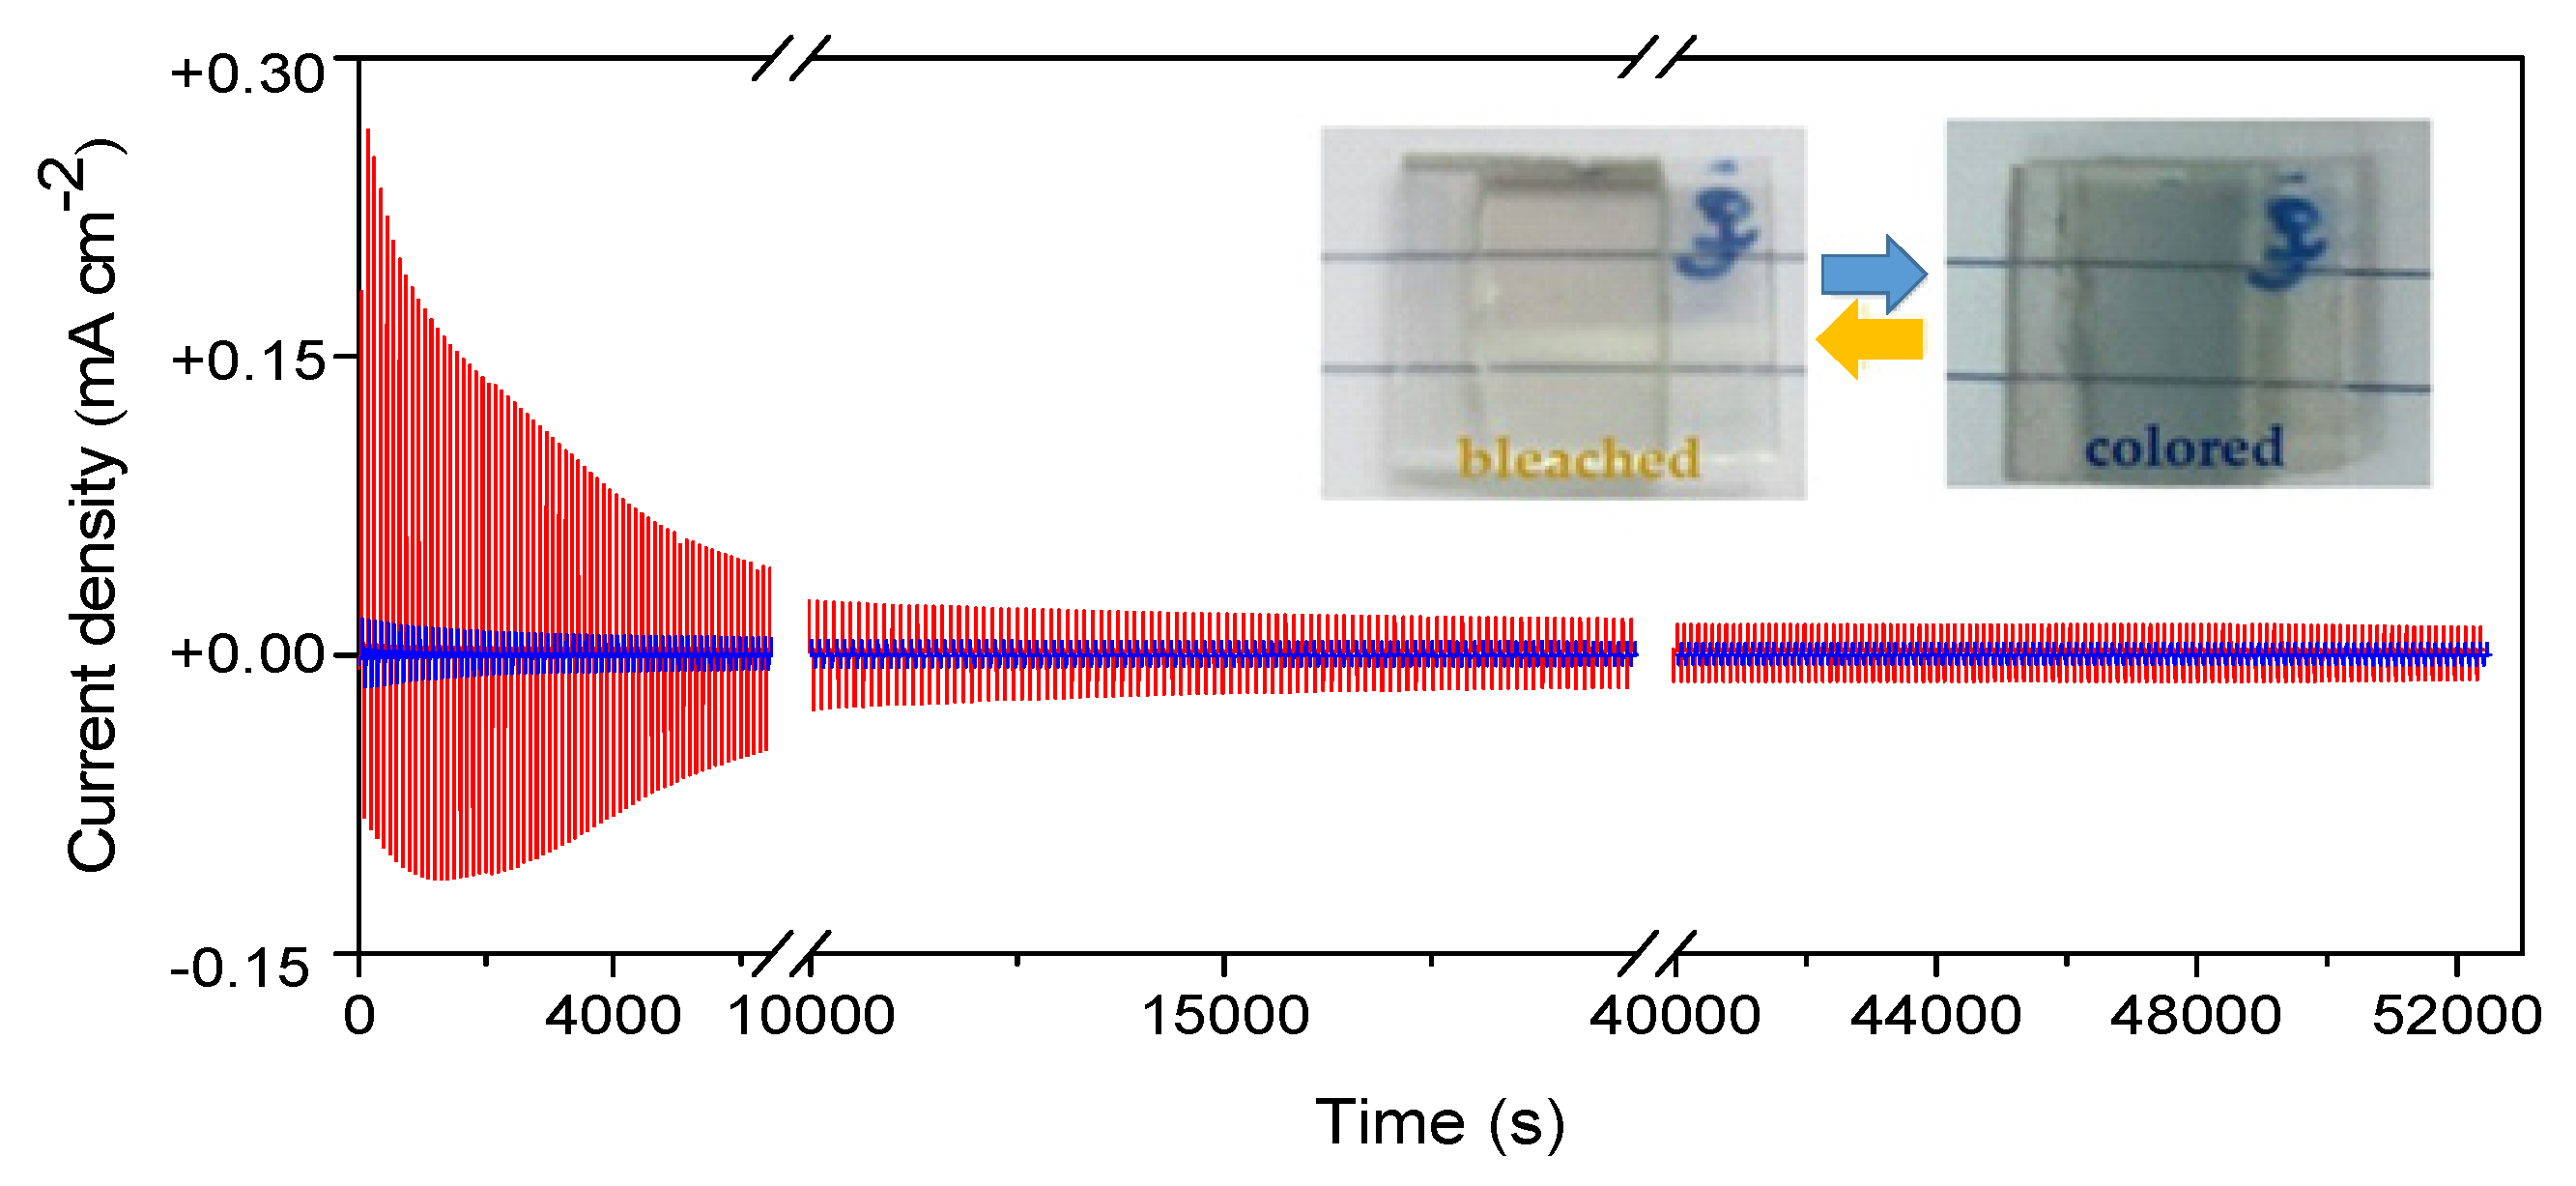
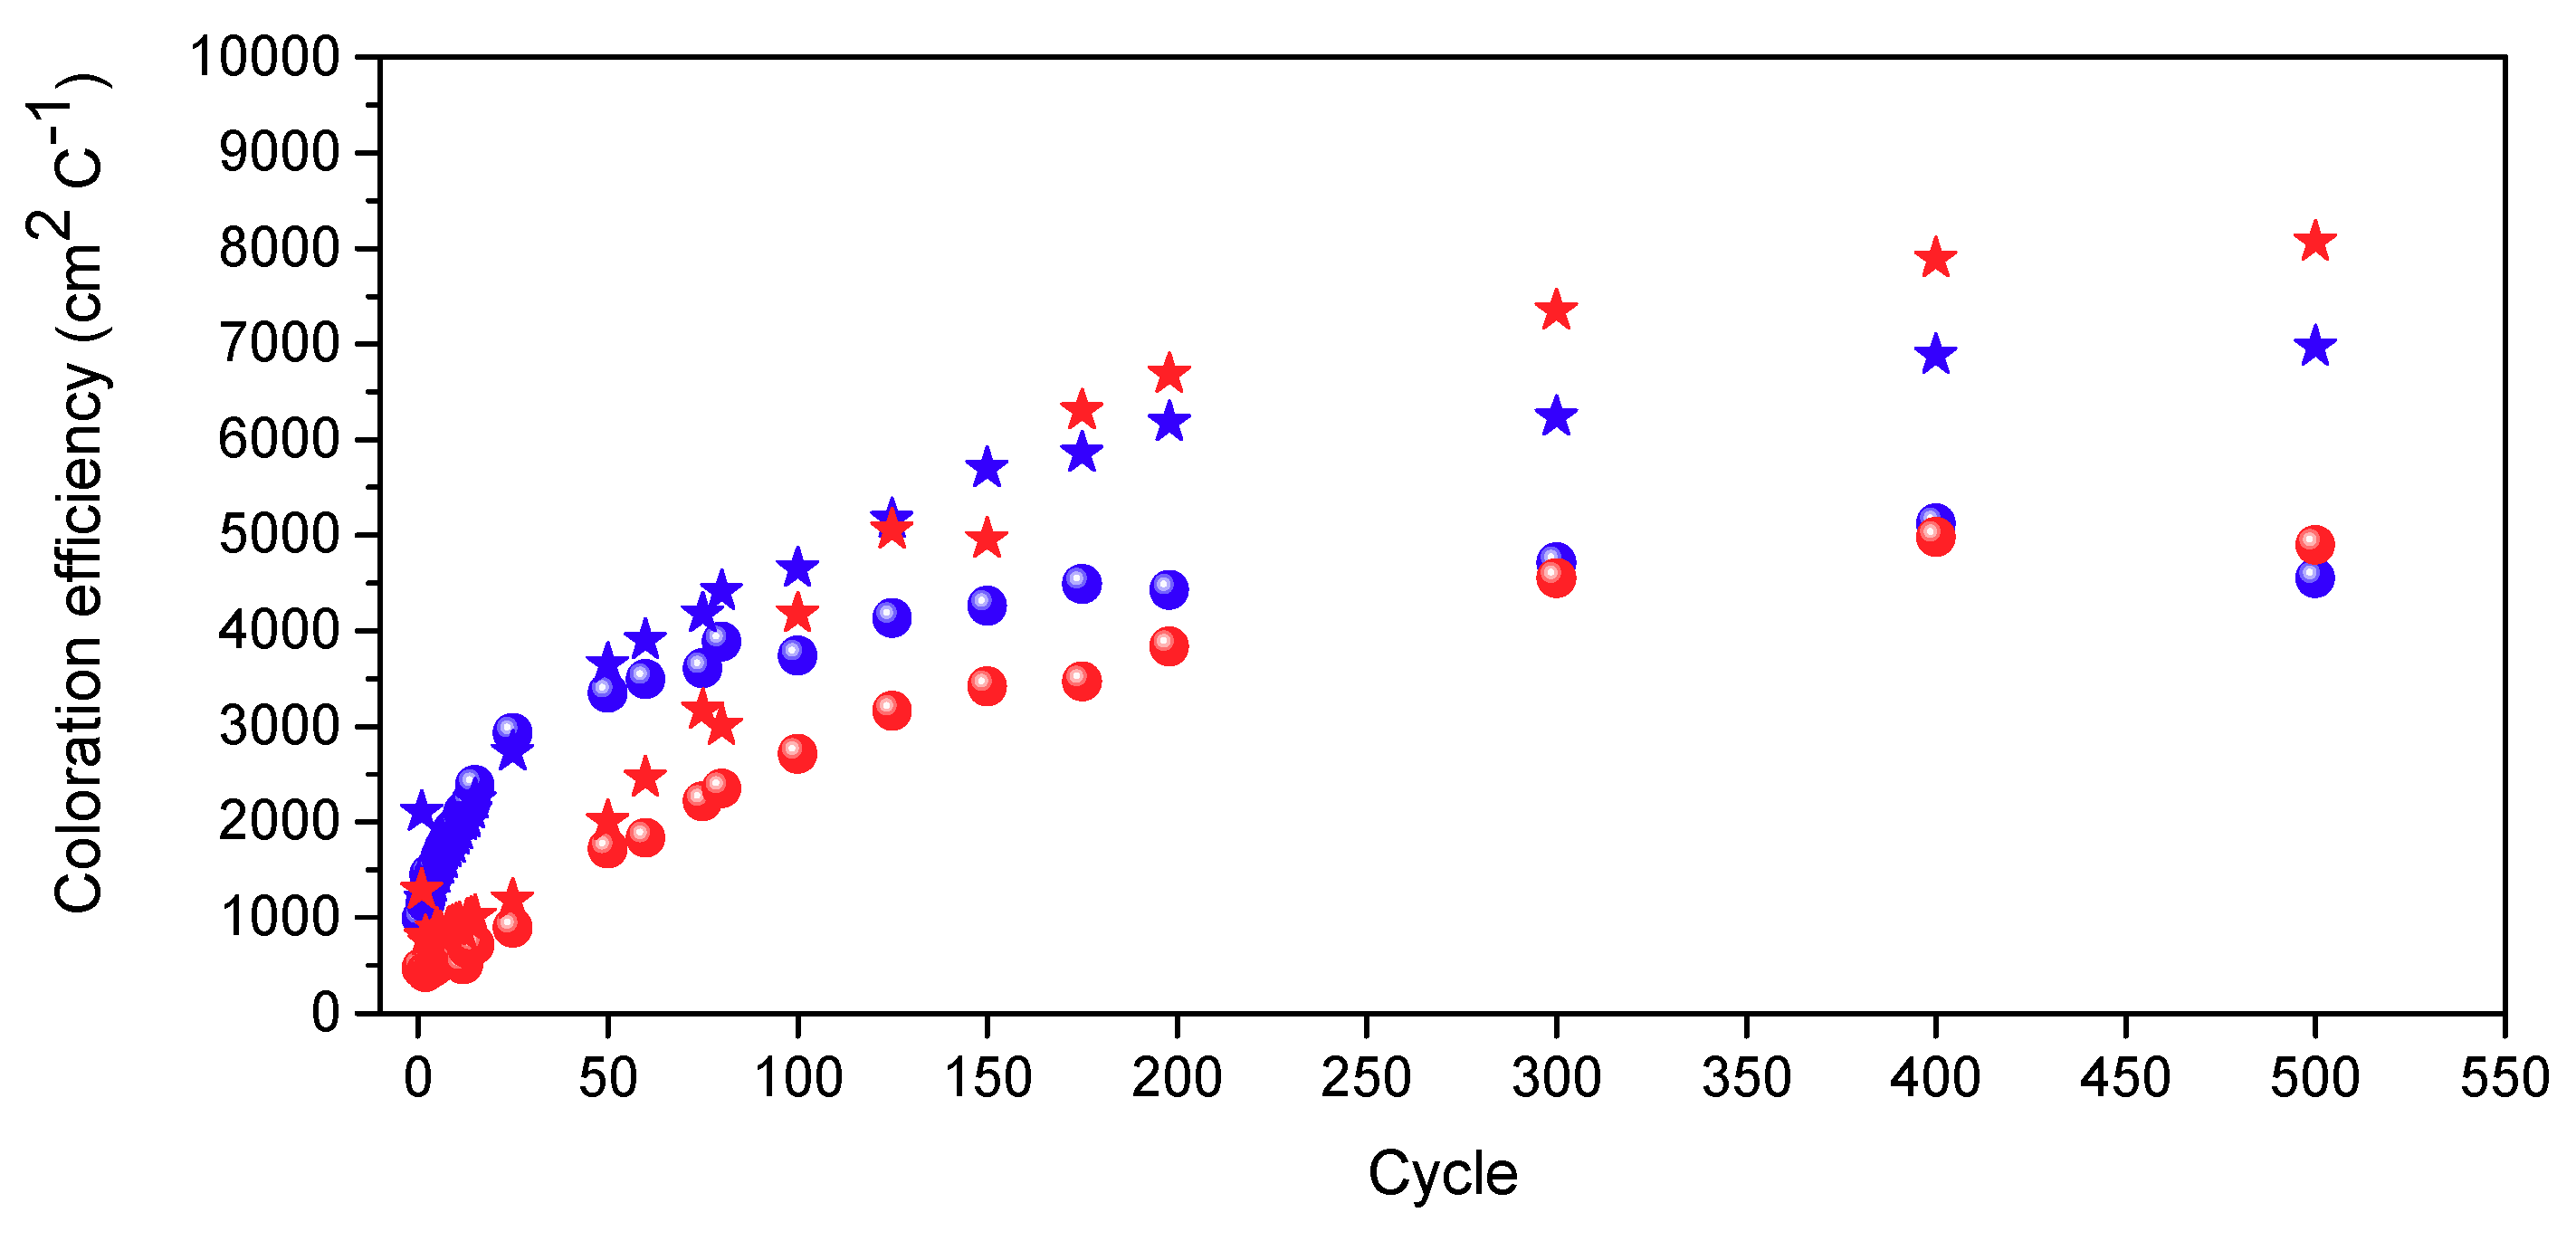
3.3. Characterization of the ECDs

The performance of the ECD@LiTrif-ErTrif3 and ECD@LiTrif-[Er(tta)3(H2O)2] devices was evaluated by means of the following parameters: switching speed (time needed for the coloring/bleaching process), electrochromic contrast (transmittance change ΔT = Tbleached − Tcolored, in %, at a given wavelength), optical density (ΔOD = −log (Tcolored/Tbleached)), the coloration efficiency (CE = ΔOD/ΔQ, where Q is the inserted/de-inserted charge density), electrochromic stability, and optical memory (or open circuit memory).
The UV-visible spectra of ECD@LiTrif-ErTrif3 and ECD@LiTrif-[Er(tta)3(H2O)2] in the 400–700 nm region recorded after the application of +4.0 V for 30 s and −4.0 V for 10 s (first cycle) are reproduced in Figure 5 (blue and red lines, respectively). At 555 nm the Tbleached/Tcolored values were 46/41% and 64/55%, respectively. The ΔT and ΔOD values were 0.05 and 0.09, and 0.05 and 0.07, respectively, as seen in Table S3 of the Supporting Information.
Both ECDs were then subject to the three following treatments under the application of ±3.0 V for ECD@LiTrif-ErTrif3 and ±3.5 V for ECD@LiTrif-[Er(tta)3(H2O)2]: (i) 10 cyclic voltammetry (CV) cycles at 50, 20, and 50 mV s−1, as seen in Figure S4 of Supporting Information; (ii) 500 chronoamperometry (CA) cycles (100 s/cycle); (iii) 5 CV cycles at 50 mV s−1, as seen in Figure S5 of the Supporting Information.
Figure 6 confirms that the ECD devices display high cycling stability and reversibility. The inset in this figure shows representative photographs of the materials in the bleached and colored states. In the first cycles, the de-inserted and inserted charge density values (Qout and −Qin, respectively) of ECD@LiTrif-[Er(tta)3(H2O)2] were significantly higher than those of ECD@LiTrif-ErTrif3, as seen in Figure S5a,b of the Supporting Information. The same applies to the reversibility ratio (Qout /−Qin), which yielded average values of 1.6 and 1.1, respectively, as seen in Figure S5c of the Supporting Information.
Figure 7 shows the cycle dependence of CE. A high CE value, obtained when a large change in optical density is driven by a low amount of inserted charge, is sought for an energy-efficient device. For the ECD@LiTrif-ErTrif3/ECD@LiTrif-[Er(tta)3(H2O)2] devices, the CE values calculated at 555 nm in the 400th cycle were unusually high: −8824/−8243 cm2 C−1 for coloration and +6569/+5200 cm2 C−1 for bleaching.
In both systems studied, the ΔT and ΔOD values are be very small, whereas the CE values are unusually high. A comparison of the performance of ECD@LiTrif-ErTrif3 and ECD@LiTrif-[Er(tta)3(H2O)2] with ECDs reported in the literature is of interest. In the case of the ITO-based analogue of ECD@LiTrif-ErTrif3 (i.e., the glass/ITO/WO3/d-PCL(530)/siloxane5.2LiTrif-ErTrif3/ITO/glass device), the ΔT and ΔOD values are similar, but the CE value is three orders of magnitude lower (7.7%, 0.05 and 8.1 cm2 C−1, first cycle, visible region) [21], suggesting that the type of TCO used exerts a major role on the device performance. ECDs with different ITO-based configurations and incorporating ErTrif3-based electrolytes, including different host matrices, also exhibited similar ΔT and ΔOD values, as seen in Table S3 of the Supporting Information: glass/ITO/WO3/DNA12.5ErTrif3/CeO2-TiO2/ITO/glass (average visible region: 7%, 0.085, respectively [25]), and glass/ITO/PB/CS(ErTrif)0.05Gly0.70/CeO2-TiO2/ITO (where PB, CS, and Gly are Prussian blue, chitosan, and glycerol, respectively) (550 nm: 4.6% [26]). Finally, it is useful to refer to the performance of the glass/a-IZO/WO3/CG50Er40/NiO/a-IZO/glass (where a-IZO is amorphous indium zinc oxide and CG50Er40 is a k-Cg-based electrolyte doped with ErTrif3) ECD that was introduced very recently, because a-IZO is also a TCO transparent in the NIR region. In this device, the ΔT, ΔOD, and CE values were 46%, 0.89, and −15902/+3072 cm2 C−1 for coloration/bleaching (450th cycle), respectively [24].

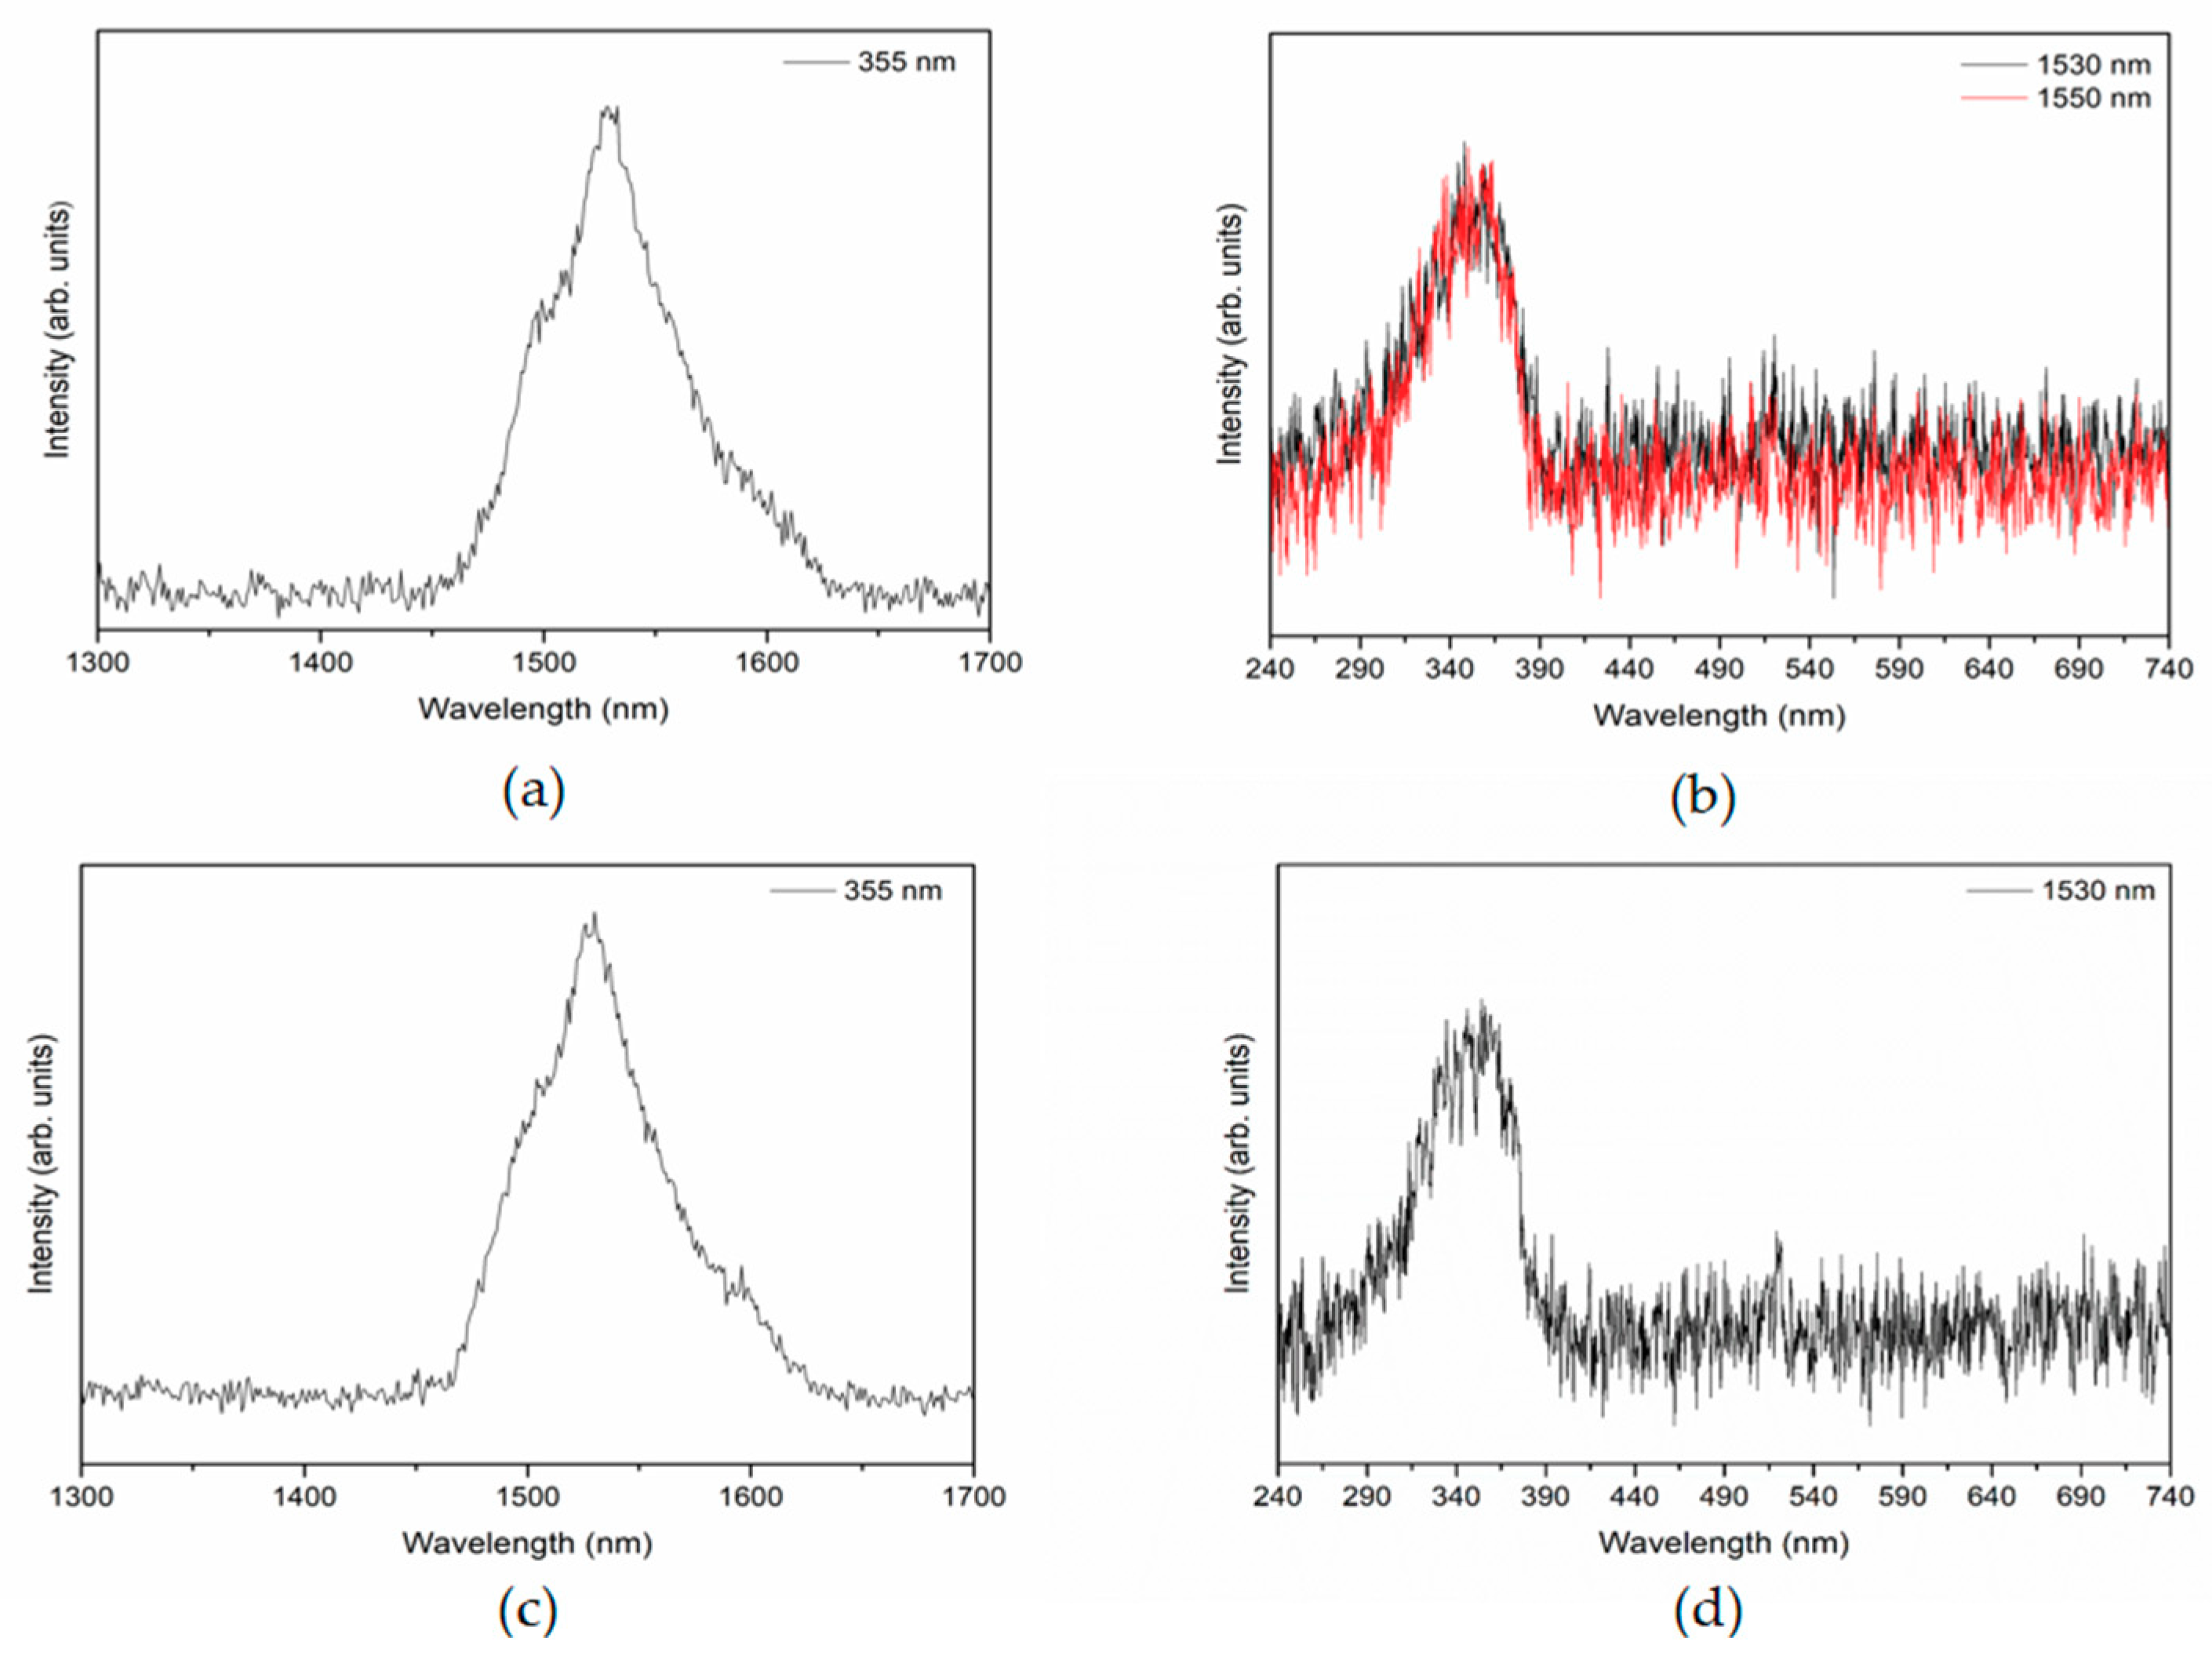
3.4. Photoluminescence Characterization

The emission features of the IC1 electrolyte alone were already studied in a previous work [21]. Under UV/blue irradiation, the d-PCL(530)nLiTrifm-ErTrif3m’ electrolytes are multi-wavelength emitters from the UV-visible to the NIR spectral regions.
In this work, the emission and excitation spectra of the IC2 electrolyte were recorded after the precursor solution of the latter was deposited by solvent-casting onto the IMO and WO3/IMO layers. The emission spectra recorded under these conditions in the UV-visible region (excitation at 355 nm) present the typical Er3+ NIR emission around 1550 nm, due to the 4I13/24I15/2 transition, as seen in Figure 8a,c. The excitation spectra, shown in Figure 8b,d, exhibit a large band centered at 340 nm characteristic of the π-π* electron transition, suggesting the existence of non-radiative energy transfer between the hybrid host and the Er3+ levels [18,36,37].

4. Discussion

Following previous recent works of our group focused on the development of novel ECDs with improved features to meet the requirements of the next generation of smart windows for future zero-energy buildings [24,38], we introduce here, for the first time, a new ECD concept that relies on the combination of NIR transparent TCO and NIR-emitting electrolyte. The TCO chosen was IMO. The new electrolyte, synthesized by the sol–gel method, comprises the hybrid host structure d-PCL(530)/siloxane doped with a mixture of LiTrif and [(Er(tta)3(H2O)2]. The structural, thermal, morphological, and optical characterization of the electrolyte were evaluated. An ECD incorporating the d-PCL(530)/siloxane-based electrolyte doped with LiTrif and ErTrif3, introduced earlier [21], was also tested for comparative purposes.
The ECD including the electrolyte doped with the LiTrif and [(Er(tta)3(H2O)2] mixture presents the typical Er3+ NIR emission around 1550 nm. The ΔT and ΔOD values are of the same order of magnitude as other values obtained for ITO-based ECDs incorporating electrolytes composed of ErTrif3. However, the CE values determined in the current work are significantly higher than those reported in the literature, indicating that the TCO type plays a key role in the ECD operation. This result probably due to the fact that IMO, which has visible and NIR transmittance higher than ITO, exhibits lower carrier concentration and higher charge mobility than ITO. In spite of the very high CE values produced, the ECD@LiTrif-[Er(tta)3(H2O)2] device needs further improvements so that the ΔT and ΔOD values are substantially increased. At present, the addition of the same salt/complex mixture to cheap, abundant, and benign natural host polymers is being considered (e.g., proteins [39] or polysaccharides [24]) is being considered.

Supplementary Materials

The following are available online at https://www.mdpi.com/1996-1073/11/12/3513/s1.

Author Contributions

V.d.Z.B.: conceptualization, methodology; M.F: synthesis of the complex and electrolytes, characterization via DSC, TGA, POM, FT-IR analysis, UV-visible, XRD, and SEM measurements, assembly of the ECDs, organization of all data; R.L. and M.M.S.: complex impedance and cyclic voltammetry measurements of the electrolytes; S.P. and E.F.: deposition and characterization of the IMO and IMO/WO3 layers; V.F., L.D.C., and R.A.S.F.: photoluminescence measurements and characterization; R.R.: cyclic voltammetry and chronoamperometry measurements of the ECDs and organization of the corresponding data; M.F.: writing—original draft preparation; V.d.Z.B.: writing—review and editing; all the authors: visualization; V.d.Z.B.: supervision; V.d.Z.B.: project administration.

Funding

This research was funded by National Funds through the Foundation for Science and Technology (FCT) and by FEDER funds through the POCI-COMPETE 2020, Operational Programme Competitiveness and Internationalisation in Axis I: Strengthening research, technological development and innovation (FCT Ref. UID/QUI/00616/2013, POCI-01-0145-FEDER-007491, FCT Ref. UID/Multi/00709/2013), and LUMECD (POCI-01-0145-FEDER-016884 and PTDC/CTM-NAN/0956/2014).

Conflicts of Interest

The authors declare no conflict of interest.

References

  1. Mortimer, R.J. Electrochromic materials. Annu. Rev. Mater. Res. 2011, 41, 241–268. [Google Scholar] [CrossRef]
  2. Thakur, V.K.; Ding, G.; Ma, J.; Lee, P.S.; Lu, X. Hybrid materials and polymer electrolytes for electrochromic device applications. Adv. Mater. 2012, 24, 4071–4096. [Google Scholar] [CrossRef] [PubMed]
  3. 2012 Mercedes SLK Teased: Electrochromic Roof. Available online: https://www.autoevolution.com/news/2012-mercedes-slk-teased-electrochromic-roof-25175.html (accessed on 9 November 2018).
  4. Wang, Y.; Runnerstom, E.L.; Milliron, D.J. Switchable Materials for Smart Windows. Annu. Rev. Chem. Biomol. Eng. 2016, 7, 283–304. [Google Scholar] [CrossRef] [PubMed]
  5. Jelle, B.P. Electrochromic Smart Windows for Dynamic Daylight and Solar Energy Control in Buildings. In Electrochromic Materials and Devices; Mortimer, R.J., Rosseinsky, D.R., Monk, P.M.S., Eds.; Wiley-VCH: Weinheim, Germany, 2015; Chapter 15; pp. 154–196, 419–502. [Google Scholar]
  6. Runnerstrom, E.L.; Llordés, A.; Lounis, S.D.; Milliron, D.J. Nanostructured electrochromic smart windows: Traditional materials and NIR-selective plasmonic nanocrystals. Chem. Commun. 2014, 50, 10555–10572. [Google Scholar] [CrossRef] [PubMed]
  7. Granqvist, C.G. Electrochromics for smart windows: Oxide-based thin films and devices. Thin Solid Films 2014, 564, 1–38. [Google Scholar] [CrossRef]
  8. Barawi, M.; Veramonti, G.; Epifani, M.; Giannuzzi, R.; Sibillano, T.; Giannini, C.; Rougier, A.; Manca, M. A dual band electrochromic device switchable across four distinct optical modes. J. Mater. Chem. A 2018, 6, 10201–10205. [Google Scholar] [CrossRef]
  9. Eh, A.L.-S.; Tan, A.W.M.; Cheng, X.; Magdassi, S.; See Lee, P. Recent Advances in Flexible Electrochromic Devices: Prerequisites, Challenges, and Prospects. Energy Technol. 2018, 6, 33–45. [Google Scholar] [CrossRef]
  10. Alesanco, Y.; Viñuales, A.; Rodriguez, J.; Tena-Zaera, R. All-in-one gel-based electrochromic devices: Strengths and Recent Developments. Materials 2018, 11, 414. [Google Scholar] [CrossRef]
  11. Yang, P.; Sun, P.; Mai, W. Electrochromic energy devices. Mater. Today 2016, 19, 394–402. [Google Scholar] [CrossRef]
  12. Kraft, A.; Rottmann, M. Properties, performance and current status of the laminated electrochromic glass of Gesimat. Sol. Energy Mater. Sol. Cells 2009, 93, 2088–2092. [Google Scholar] [CrossRef]
  13. Baetens, R.; Jelle, B.P.; Gustavsen, A. Properties, requirements and possibilities of smart windows for dynamic daylight and solar energy control in buildings: A state-of-the-art review. Sol. Energy Mater. Sol. Cells 2010, 94, 87–105. [Google Scholar] [CrossRef] [Green Version]
  14. Tavares, P.F.; Gaspar, A.R.; Martins, A.G.; Frontini, F. Evaluation of electrochromic windows impact in energy performance of buildings in Mediterranean climates. Energy Policy 2014, 67, 68–81. [Google Scholar] [CrossRef]
  15. Granqvist, C.G.; Arvizu, M.A.; Bayrak Pehlivan, İ.; Qu, H.-Y.; Wen, R.-T.; Niklasson, G.A. Electrochromic materials and devices for energy efficiency and human comfort in buildings: A critical review. Electrochim. Acta 2018, 259, 1170–1182. [Google Scholar] [CrossRef]
  16. Rezaei, S.D.; Shannigrahi, S.; Ramakrishna, S. A review of conventional, advanced, and smart glazing technologies and materials for improving in door environment. Sol. Energy Mater. Sol. Cells 2010, 94, 87–105. [Google Scholar] [CrossRef]
  17. Bunzli, J.-C.G.; Piguet, C. Taking advantage of luminescent lanthanide ions. Chem. Soc. Rev. 2005, 34, 1048–1077. [Google Scholar] [CrossRef] [PubMed]
  18. Fernandes, M.; de Zea Bermudez, V.; Sá Ferreira, R.A.; Carlos, L.D.; Charas, A.; Morgado, J.; Silva, M.M.; Smith, M.J. Highly photostable luminescent poly(ε-caprolactone)siloxane biohybrids doped with europium complexes. Chem. Mater. 2007, 19, 3892–3901. [Google Scholar] [CrossRef]
  19. Elangovan, E.; Gonçalves, G.; Martins, R.; Fortunato, E. RF sputtered wide work function indium molybdenum oxide thin films for solar cell applications. Sol. Energy 2009, 83, 726–731. [Google Scholar] [CrossRef]
  20. Parthiban, S.; Gokulakrishnan, V.; Ramamurthi, K.; Elangovan, E.; Martins, R.; Fortunato, E.; Ganesan, R. High near-infrared transparent molybdenum-doped indium oxide thin films for nanocrystalline silicon solar cell applications. Sol. Energy Mater. Sol. Cells 2009, 93, 92–97. [Google Scholar] [CrossRef]
  21. Fernandes, M.; Freitas, V.T.; Pereira, S.; Fortunato, E.; Ferreira, R.A.S.; Carlos, L.D.; Rego, R.; de Zea Bermudez, V. Green Li+- and Er3+-doped poly(ε-caprolactone)/siloxane biohybrid electrolytes for smart electrochromic windows. Sol. Energy Mater. Sol. Cells 2014, 123, 203–210. [Google Scholar] [CrossRef]
  22. Nunes, S.C.; de Zea Bermudez, V.; Silva, M.M.; Smith, M.J.; Morales, E.; Carlos, L.D.; Sá Ferreira, R.A.; Rocha, J. Sol-gel derived Li+-doped poly(ε-caprolactone)/siloxane biohybrid electrolytes. J. Solid State Electrochem. 2006, 10, 203–210. [Google Scholar] [CrossRef]
  23. Fernandes, M.; Botas, A.M.P.; Leones, R.; Pereira, S.; Silva, M.M.; Ferreira, R.A.S.; Carlos, L.D.; Fortunato, E.; Rego, R.; de Zea Bermudez, V. Luminescent Electrochromic Device Based on a Biohybrid Electrolyte Doped with a Mixture of Potassium Triflate and a Europium β-diketonate Complex. ECS Trans. 2014, 61, 213–225. [Google Scholar] [CrossRef]
  24. Nunes, S.C.; Saraiva, S.M.; Pereira, R.F.P.; Pereira, S.; Silva, M.M.; Carlos, L.D.; Fortunato, E.; Ferreira, R.A.S.; Rego, R.; de Zea Bermudez, V. Sustainable dual-mode smart windows for energy-efficient buildings. ACS Appl. Energy Mater. 2018. submitted. [Google Scholar]
  25. Leones, R.; Fernandes, M.; Sentanin, F.; Cesarino, I.; Lima, J.F.; de Zea Bermudez, V.; Pawlicka, A.; Magon, C.J.; Donoso, J.P.; Silva, M.M. Ionically conducting Er3+-doped DNA-based biomembranes for electrochromic devices. Electrochim. Acta 2014, 120, 327–333. [Google Scholar] [CrossRef]
  26. Alves, R.; Sentanin, F.; Sabadini, R.C.; Pawlicka, A.; Silva, M.M. Green polymer electrolytes of chitosan doped with erbium triflate. J. Non-Cryst. Solids 2018, 482, 183–191. [Google Scholar] [CrossRef]
  27. Fernandes, M.; Rodrigues, L.C.; Ferreira, R.A.S.; Gonçalves, A.; Fortunato, E.; Silva, M.M.; Smith, M.J.; Carlos, L.D.; de Zea Bermudez, V. K+-doped poly(ε-caprolactone)/siloxane biohybrid electrolytes for electrochromic devices. Solid State Ionics 2011, 204–205, 129–139. [Google Scholar] [CrossRef]
  28. Carlos, L.D.; de Zea Bermudez, V.; Ferreira, R.A.S.M.; Marques, L.; Assunção, M. Sol–gel derived urea cross-linked organically modified silicates. 2. Blue-light emission. Chem. Mater. 1999, 11, 581–588. [Google Scholar] [CrossRef]
  29. Gomes Correia, S.M.; de Zea Bermudez, V.; Silva, M.M.; Barros, S.; Sá Ferreira, R.A.; Carlos, L.D.; Passos de Almeida, A.P.; Smith, M.J. Morphological and conductivity studies of di-ureasil xerogels containing lithium triflate. Electrochim. Acta 2002, 47, 2421–2428. [Google Scholar] [CrossRef] [Green Version]
  30. Ha, J.C.; Kim, S.Y.; Lee, Y.M. Poly(ethylene oxide)–poly(propylene oxide)–poly(ethylene oxide) (Pluronic)/poly(e-caprolactone) (PCL) amphiphilic block copolymeric nanospheres I. Preparation and characterization. J. Control. Release 1999, 62, 381–392. [Google Scholar] [CrossRef]
  31. Balu, R.; Sampath Kumar, T.S.; Ramalingam, M.; Ramakrishn, S. Electrospun Polycaprolactone/Poly(1,4-butylene adipate-co-polycaprolactam) blends: Potential biodegradable scaffold for bone tissue regeneration. J. Biomater. Tissue Eng. 2011, 1, 30–39. [Google Scholar] [CrossRef]
  32. Fernandes, M.; Leones, R.; Pereira, S.; Costa, A.M.S.; Mano, J.F.; Silva, M.M.; Fortunato, E.; de Zea Bermudez, V.; Rego, R. Eco-friendly sol-gel derived sodium-based ormolytes for electrochromic devices. Electrochim. Acta 2017, 232, 484–494. [Google Scholar] [CrossRef]
  33. Fernandes, M.; Nobre, S.S.; Rodrigues, L.C.; Gonçalves, A.; Rego, R.; Oliveira, M.C.; Ferreira, R.A.S.; Silva, M.M.; Fortunato, E.; Carlos, L.D.; de Zea Bermudez, V. Li+ and Eu3+-doped poly(ε-caprolactone)/siloxane biohybrid electrolytes for electrochromic devices. ACS Appl. Mater. Interfaces 2011, 3, 2953–2965. [Google Scholar] [CrossRef]
  34. Teixeira, J.C.S.; Fernandes, M.; de Zea Bermudez, V.; Barbosa, P.C.; Rodrigues, L.C.; Silva, M.M.; Smith, M.J. Mg2+-doped poly(ε-caprolactone)/siloxane biohybrids. Electrochim. Acta 2010, 55, 1328–1332. [Google Scholar] [CrossRef]
  35. Silva, M.M.; Nunes, S.C.; Barbosa, P.C.; Evans, A.; de Zea Bermudez, V.; Smith, M.J.; Ostrovskii, D. Sol–gel preparation of a di-ureasil electrolyte doped with lithium perchlorate. Electrochim. Acta 2006, 52, 1542–1548. [Google Scholar] [CrossRef] [Green Version]
  36. Carlos, L.D.; SáFerreira, R.A.; de Zea Bermudez, V.; Ribeiro, S.J.L. Full-Color Phosphors from Amine-Functionalized Crosslinked Hybrids Lacking Metal Activator Ions. Adv. Funct. Mater. 2001, 2, 111–115. [Google Scholar] [CrossRef]
  37. Carlos, L.D.; Sá Ferreira, R.A.; Pereira, R.N.; Assunção, M.; de Zea Bermudez, V. White-light emission of amine-functionalized organic/inorganic hybrids:  Emitting centers and recombination mechanisms. J. Phys. Chem. B 2004, 108, 14924–14932. [Google Scholar] [CrossRef]
  38. Cardoso, M.A.; Pereira, R.F.P.; Pereira, S.; Gonçalves, H.; Silva, M.M.; Carlos, L.D.; Nunes, S.C.; Fortunato, E.; Ferreira, R.A.S.; Rego, R.; de Zea Bermudez, V. Three-mode modulation electrochromic device with high energy efficiency for windows of buildings located in continental climatic regions. Adv. Sustain. Syst. 2018, 1800115. [Google Scholar] [CrossRef]
  39. Pereira, R.F.P.; Sentanin, F.; Pawlicka, A.; Gonçalves, M.C.; Silva, M.M.; Zea Bermudez, V. de Smart windows prepared from Bombyx mori silk. ChemElectroChem 2016, 3, 1084–1097. [Google Scholar] [CrossRef]
Figure 1. Thermogravimetric analysis (TGA) (left side y axis) and differential scanning calorimetry (DSC) (right side y axis) traces of the [Er(tta)3(H2O)2] complex.
Energies 11 03513 g001
Figure 2. SEM (a) and POM (crossed polarizers) (b) images of the d-PCL(530)/siloxane9.1LiTrif-[Er(tta)3(H2O)2] electrolyte.
Energies 11 03513 g002
Figure 3. (a) Commercial PCL(530) (black line) [27], d-PCL(530)/siloxane [27] (green line), and d-PCL(530)/siloxane9.1LiTrif-[Er(tta)3(H2O)2] (red line); (b) TGA (left y-axis) and DSC (right y-axis) curves of the d-PCL(530)/siloxane9.1LiTrif-[Er(tta)3(H2O)2] electrolyte.
Energies 11 03513 g003
Figure 4. (a) Arrhenius conductivity plots of d-PCL(530)/siloxane [34] (black symbols), d-PCL(530)/siloxane5.2-LiTrif-ErTrif3 [21] (blue symbols), and d-PCL(530)/siloxane9.1LiTrif-[Er(tta)3(H2O)2] (red symbols); (b) voltammogram of d-PCL(530)/siloxane9.1LiTrif-[Er(tta)3(H2O)2] (scan rate = 100 m Vs1).
Energies 11 03513 g004
Figure 5. Transmission spectra of the ECD@LiTrif-ErTrif3 (blue) and ECD@LiTrif-[Er(tta)3(H2O)2] (red) devices in the colored (solid line) and bleached (dashed line) states (first coloring/bleaching cycle).
Energies 11 03513 g005
Figure 6. Current density as a function of time for the ECD@LiTrif-ErTrif3 (blue line, voltage steps of ±3.0 V) and ECD@LiTrif-[Er(tta)3(H2O)2] (red line, voltage steps of ±3.5 V).
Energies 11 03513 g006
Figure 7. Coloration efficiency for the de-inserted (spheres) and inserted (stars) charges for ECD@LiTrif-ErTrif3 (blue symbols) and ECD@LiTrif-[Er(tta)3(H2O)2] (red symbols).
Energies 11 03513 g007
Figure 8. Emission (a and c) and excitation (b and d) spectra of the glass/IMO/d-PCL(530)9.1LiTrifm-[Er(tta)3(H2O)2] (top) and glass/IMO/WO3/d-PCL(530)/siloxane9.1LiTrif-[Er(tta)3(H2O)2] (bottom) plates.
Energies 11 03513 g008

