Article

A Combined Electro-Thermal Breakdown Model for Oil-Impregnated Paper

1
School of Electrical and Electronic Engineering, North China Electric Power University, Beijing 102206, China
2
State Key Lab of Control and Simulation of Power Systems and Generation Equipment, Department of Electrical Engineering, Tsinghua University, Beijing 100084, China
*
Author to whom correspondence should be addressed.
Energies 2017, 10(12), 2160; https://doi.org/10.3390/en10122160
Submission received: 6 November 2017 / Revised: 6 December 2017 / Accepted: 11 December 2017 / Published: 18 December 2017
(This article belongs to the Section F: Electrical Engineering)

Abstract

:
The breakdown property of oil-impregnated paper is a key factor for converter transformer design and operation, but it is not well understood. In this paper, breakdown voltages of oil-impregnated paper were measured at different temperatures. The results showed that with the increase of temperature, electrical, electro-thermal and thermal breakdown occurred successively. An electro-thermal breakdown model was proposed based on the heat equilibrium and space charge transport, and negative differential mobility was introduced to the model. It was shown that carrier mobility determined whether it was electrical or thermal breakdown, and the model can effectively explain the temperature-dependent breakdown.

1. Introduction

Whether a converter transformer performs well or not in service is determined by the insulation property of oil-impregnated paper. Once breakdown takes place within oil-impregnated paper insulation, the converter transformer cannot run any longer, which can cause huge social and economic loss. The breakdown property and mechanisms of oil-impregnated paper have been key factors that restrict the design and operation of converter transformers. A few investigations have shown that breakdown is related to thermal equilibrium, mechanical fracture, oil ionization, tree propagation and partial discharge [1,2,3,4,5]. However, there is still a lack of understanding regarding the breakdown of oil-impregnated paper under DC voltage [6,7], especially concerning the breakdown model.
According to polymer breakdown theory, breakdown is generally divided into three types: thermal breakdown, electric breakdown and long-term breakdown. Thermal breakdown results from heating of dielectrics. Due to dielectric loss, heat is generated under an applied electric field, and this will lead to the temperature of the material rising. The conductivity is consequently enhanced by temperature rise, and so is the current density. As a result, the heat generation further increases. Once heat generation exceeds dispersion, this keeps going and the temperature becomes higher and higher, leading to decomposition and carbonation. Finally, failure occurs. Electric breakdown is caused by collision ionization, and long-term breakdown is caused by irreversible physical and chemical degradation from the influence of long applied electric fields. All these theories are related to the electric fields, but neglect space charge.
It is widely known that space charge leads to electric field distortion, with local electric fields enhanced or weakened; therefore, space charge should have an important role in breakdown. A pre-stress experiment has shown that dielectric breakdown can be initiated by the space charge effect [8]. Dissado et al. [9] and Zheng et al. [10] have summarized the influence of space charge on breakdown: where the local electric field is enhanced by space charge, the Maxwell stress is enhanced so that it leads to cracks in dielectrics; that injected charge is accelerated by the electric field, and hits the medium or the energy released by the recombination of heteropolar charges, which leads to the development of electric trees [10,11].
With the development of the space charge transport model and simulation technology, some scholars have begun to explore breakdown models based on space charge. George has introduced negative differential mobility and set up a space charge transport model under high electric fields [12]. The simulation results show that local electric field enhancement by space charge induces breakdown, and space charge dynamics are responsible for thickness- and ramp speed-dependent breakdown. Choi has made an attempt to propose an electro-thermal model, but there is no change in temperature, and it is still the electric field that leads to breakdown [13]. Boughariou has simulated the breakdown process under constant high electric fields and finds that temperature and current density rise rapidly before breakdown [14]. These simulations have clearly demonstrated breakdown dynamics, such as variation of temperature, electric field and current density. They only, however, focus on those under high electric fields, generally above 400 kV/mm, therefore improvements are required so that they are more capable of describing breakdowns that occur under lower electric fields.
In this paper, we aim to develop an electro-thermal breakdown model under a low electric field. Firstly, temperature-dependent breakdown voltages of oil-impregnated paper were measured. Then an electro-thermal breakdown model based on the heat equilibrium equation and space charge transport was established to explain the temperature-dependent breakdown characteristics. With the introduction of temperature- and electric field-dependent mobility and the combined electro-thermal criterion, the simulated results agreed well with experimental results.

2. Materials and Methods

This section covers the details regarding the electro-thermal breakdown test, Thermal Gravimetric (TG) analysis and conductivity measurement.

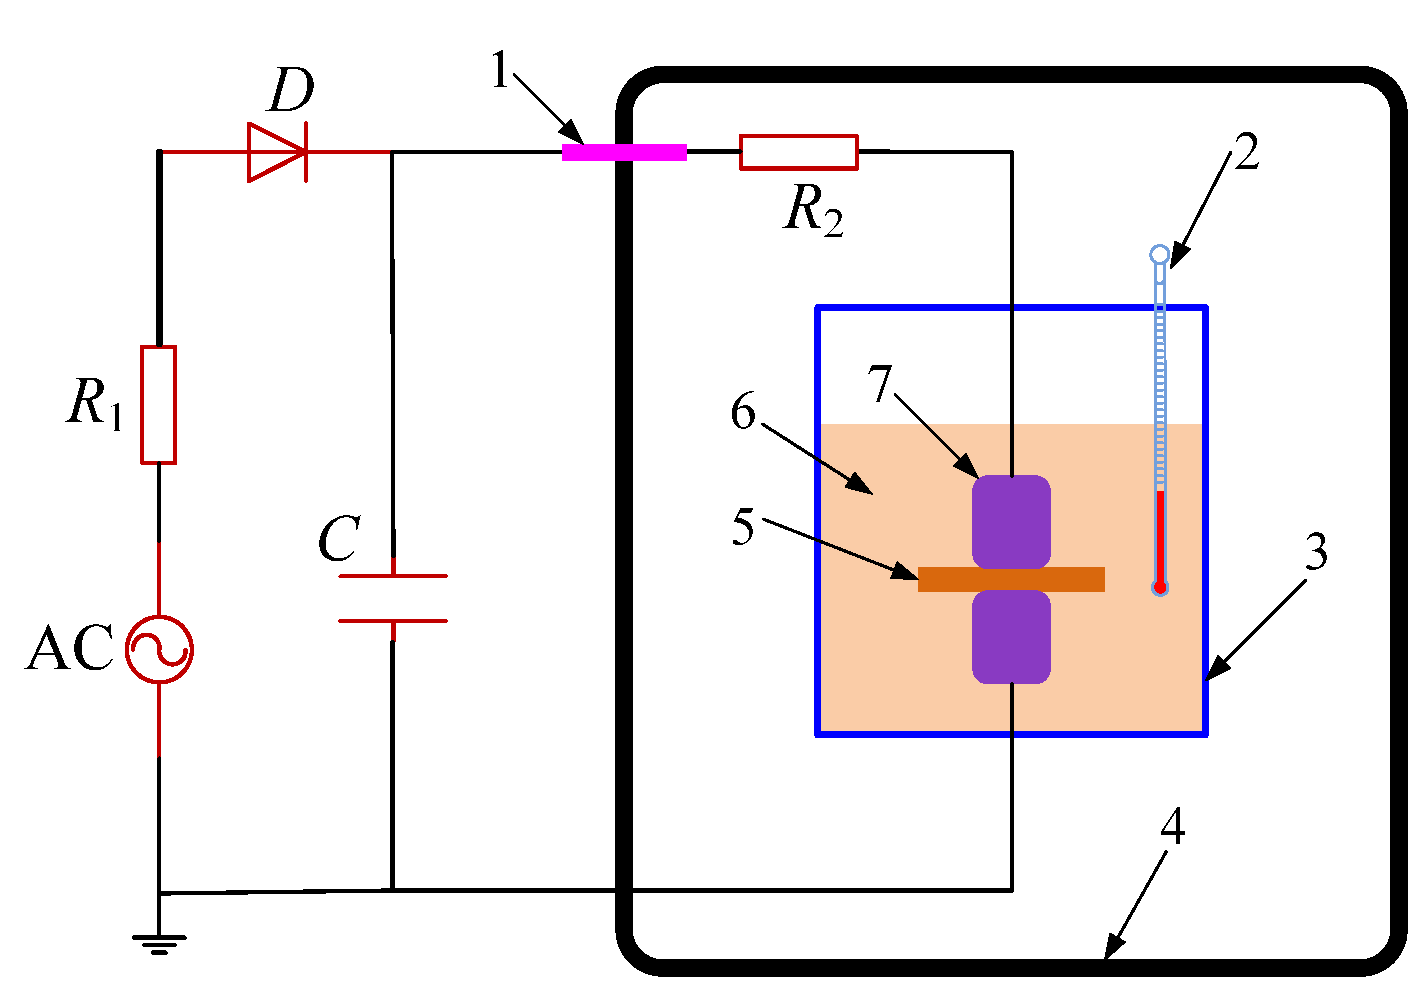
2.1. Electro-Thermal Breakdown Test

It is known that insulating paper is a porous material and oil-impregnated paper is a kind of composite, therefore the breakdown of oil-impregnated paper is very complicated and influenced by many factors. Hence a proper breakdown system is required. Figure 1 shows breakdown systems for oil-impregnated paper insulation under DC voltage but different temperatures, where 1 denotes wall bushing, 2 denotes thermometer, 3 denotes vessel, 4 denotes calorstat, 5 denotes sample, 6 denotes oil and 7 denotes electrodes. To avoid the influence of moisture, the sealed calorstat was filled with dry nitrogen.
The capacity of the AC source is 40 kVA and the highest output is 200 kV. Through a half-wave rectifier, DC voltage is generated from the AC source. The AC voltage was increased quickly from zero, and so was the DC voltage. The DC voltage ramp speed was 1.87 kV/s. A parallel resistive divider (10,000:1) was connected to the sample, and an oscilloscope was joined to the low voltage side of it to record the waveform of the applied voltage. The breakdown voltage can be obtained from the waveform just before breakdown.
The electrodes were made up of two identical stainless-steel cylinders, which were 25 mm in diameter and 25 mm high. They met the demand of standard IEC 60243-1: 1998.
Kraft paper samples were 170 μm in thickness and 100 mm in diameter. Karamay HV transformer oil was used. Its viscosity is of 9.6 × 10⁻⁶ m2/s, which ranks tenth and its acid value is 0.012 mg KOH/g. The amount of oil dissolved as alkane gases was 1.24 μL/L. Both paper and oil were strictly processed before the breakdown experiments. Details regarding how samples were processed could be found in [15]. At least 15 samples were used for the breakdown voltage measurement at each temperature.

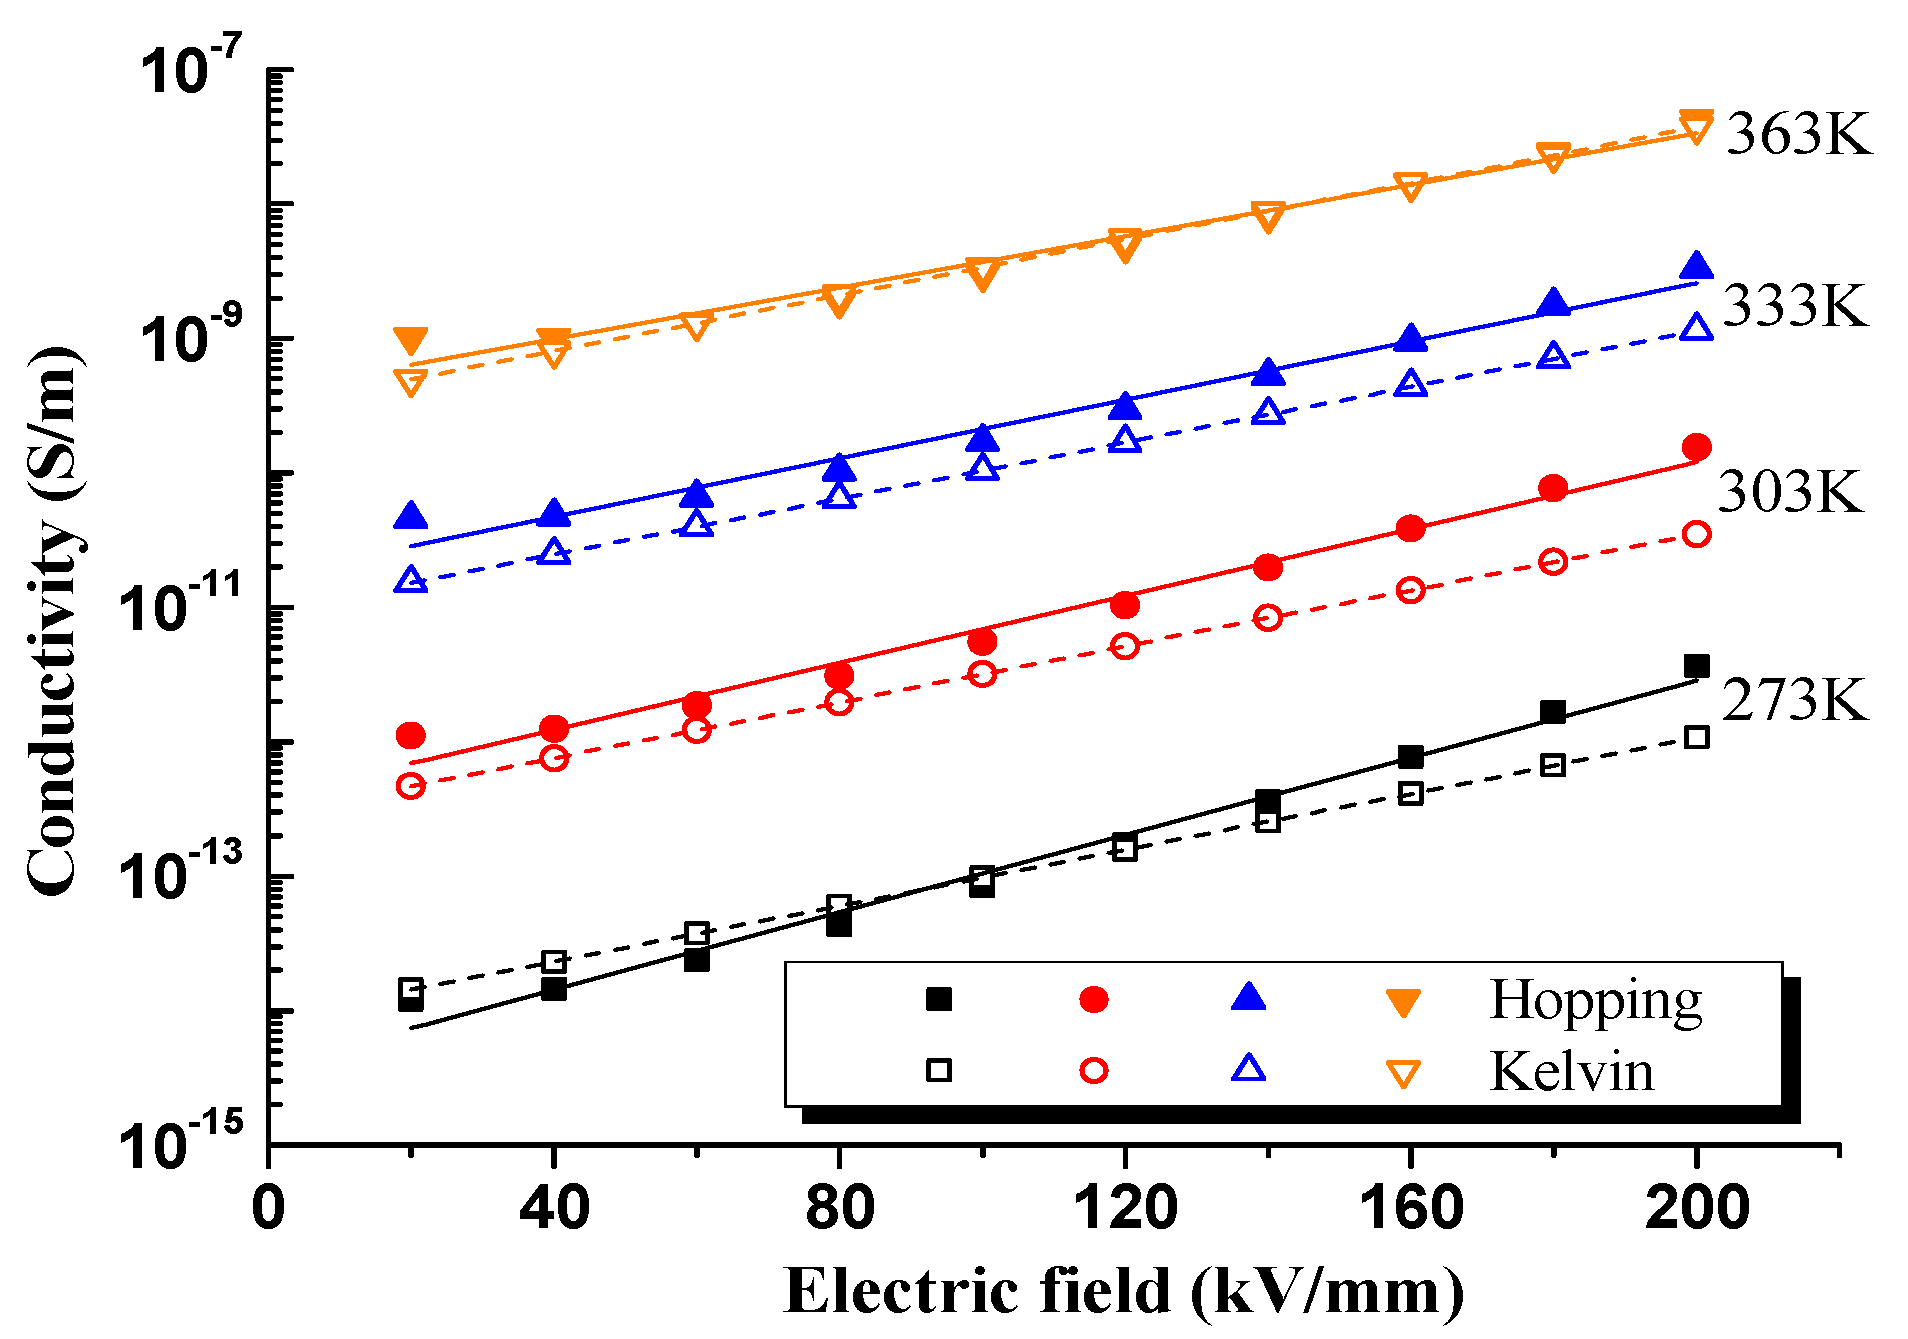
2.2. Thermal Gravimetric Analysis and Conducitivity Measurement

TG of insulating paper was analyzed by a DSC Q2000 Thermal Gravimetric Analyzer (TA Instruments, New Castle, DE, USA). Precision balance was achieved with a sample pan located inside a furnace with a programmable control temperature. The TG analyzer continuously measured mass while the temperature of the sample changed over time. The rate of temperature increase was 5 °C per minute. The data from a thermal reaction was compiled into a plot of percentage of initial mass versus temperature.
The conductivity was measured with a Keithley 6517A electrometer (Keithley Instruments, Inc., Cleveland, OH, USA) through a cell containing three electrodes. The capability of Keithley 6517A is from 10 aA to 21 mA. Its sensitivity and accuracy meet the requirement for low current measurement as well, and the deviation is always less than ±1%. The current density to be measured was so small that low noise cables were used. Furthermore, strict shielding and guarding techniques were also adopted.

3. Results

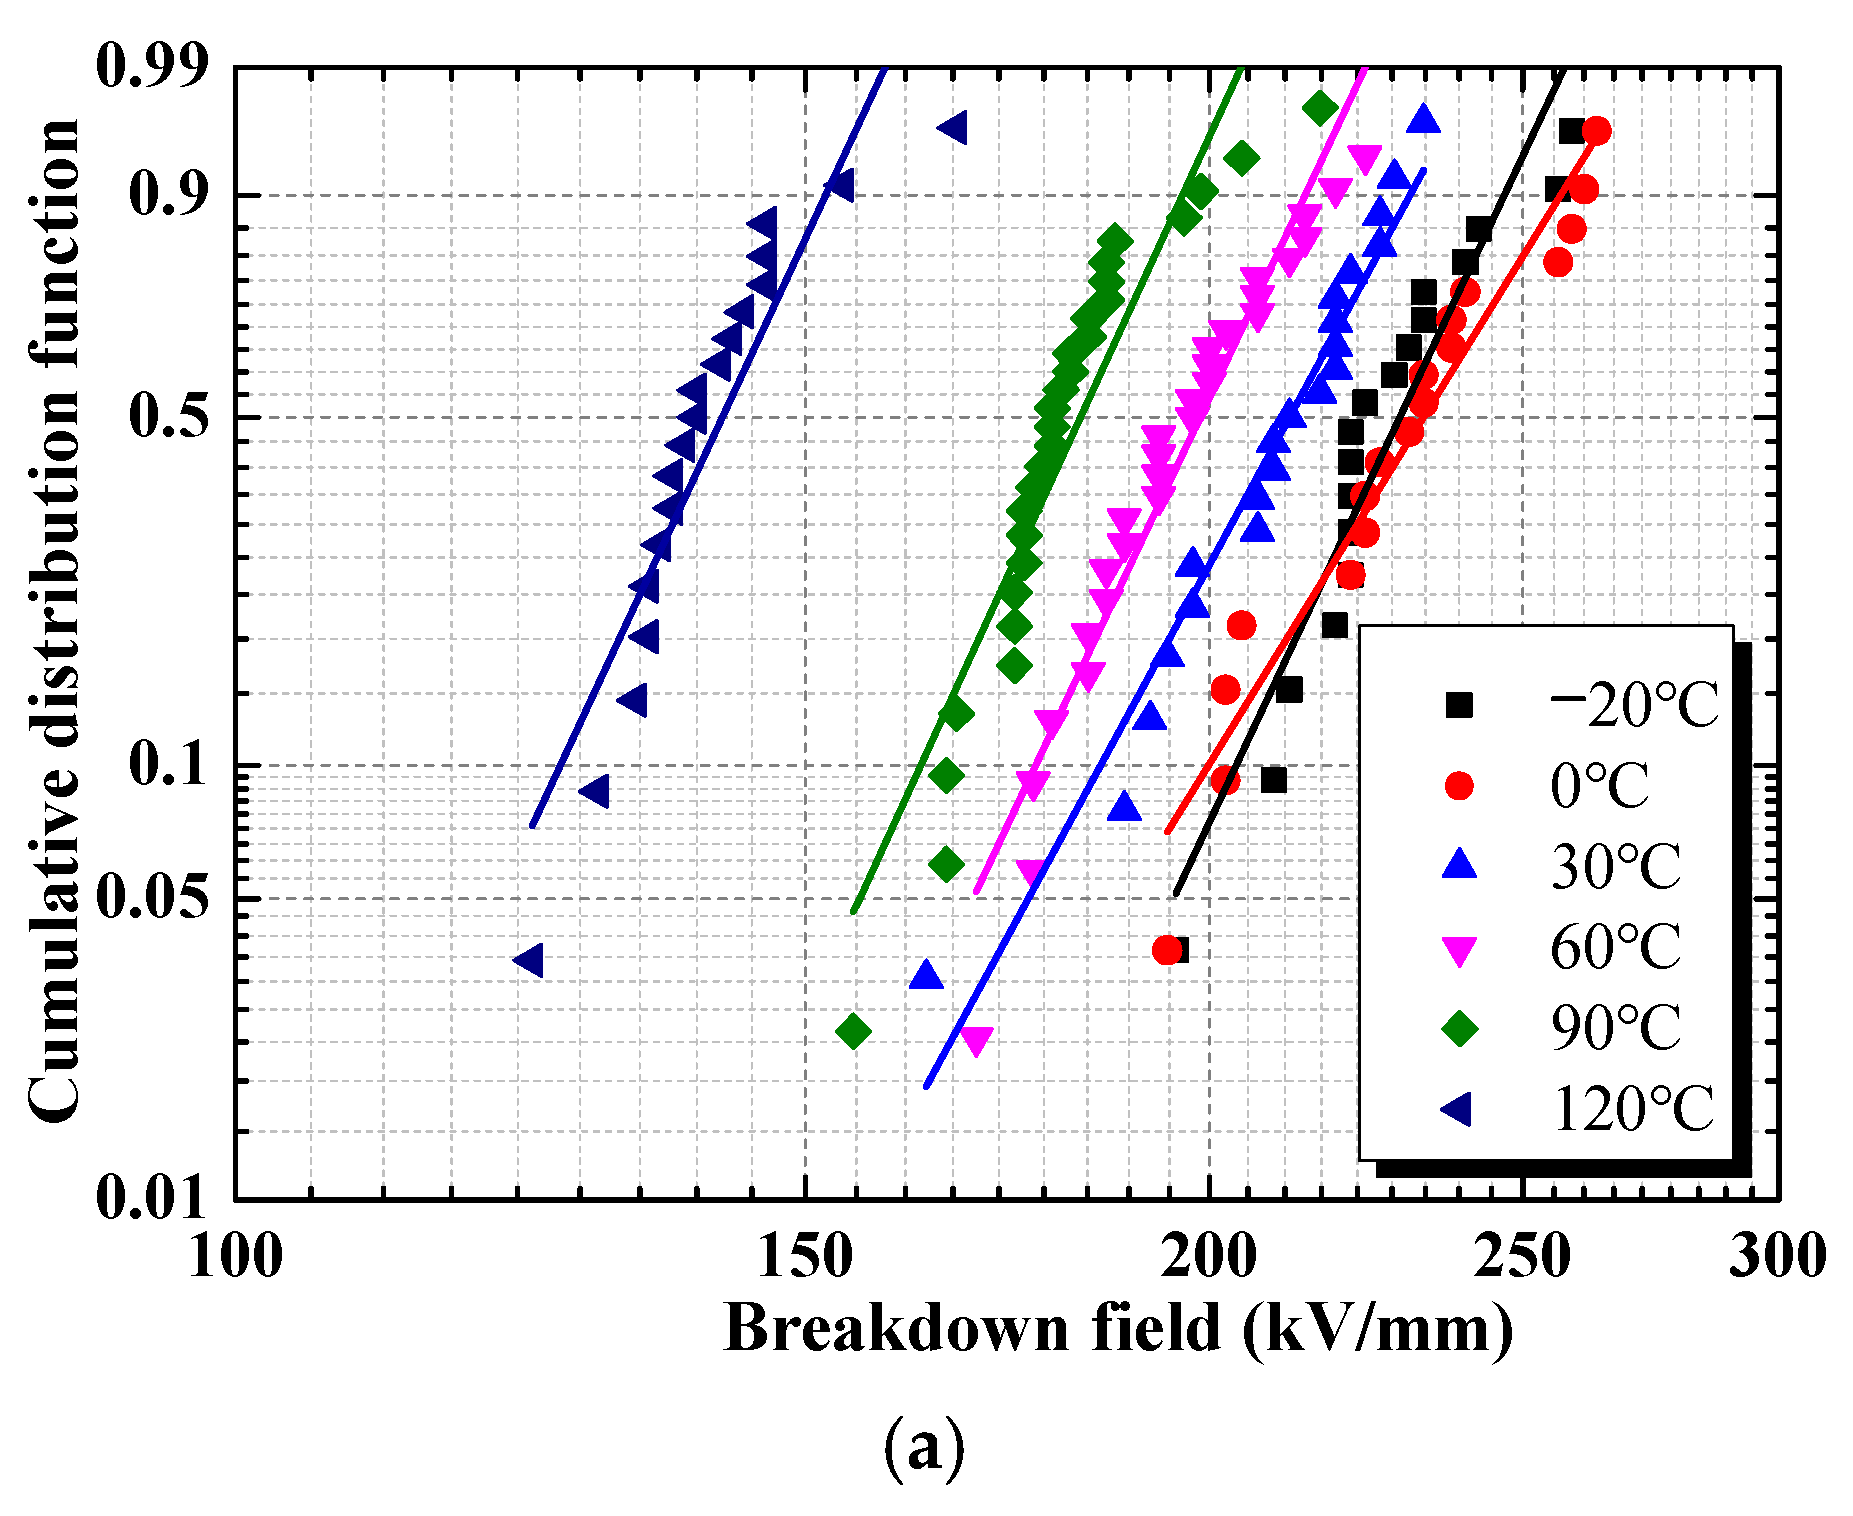
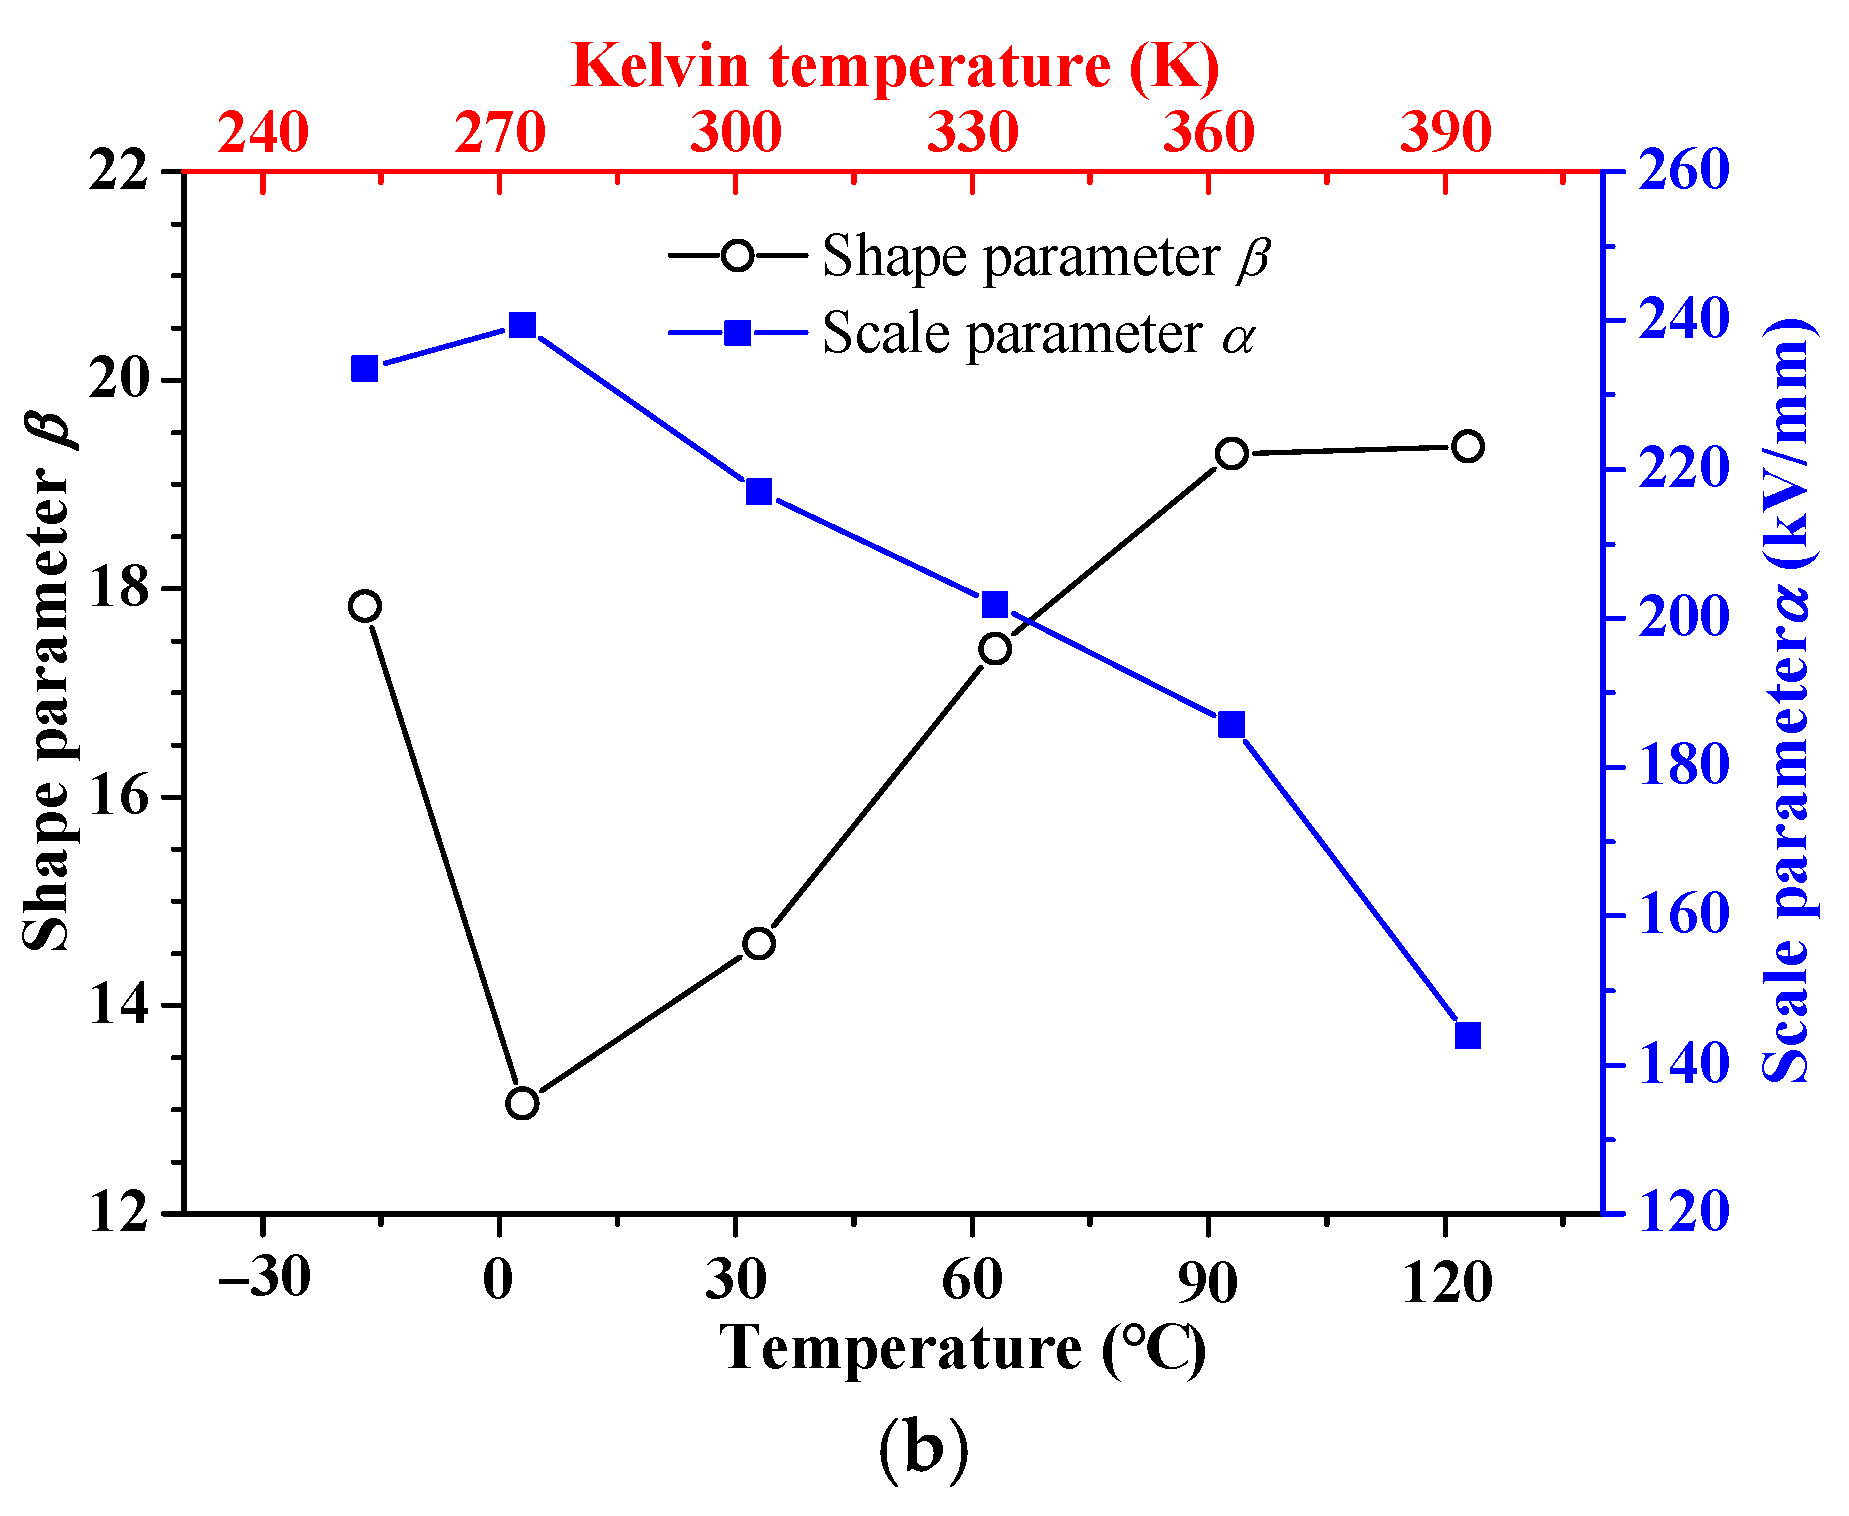
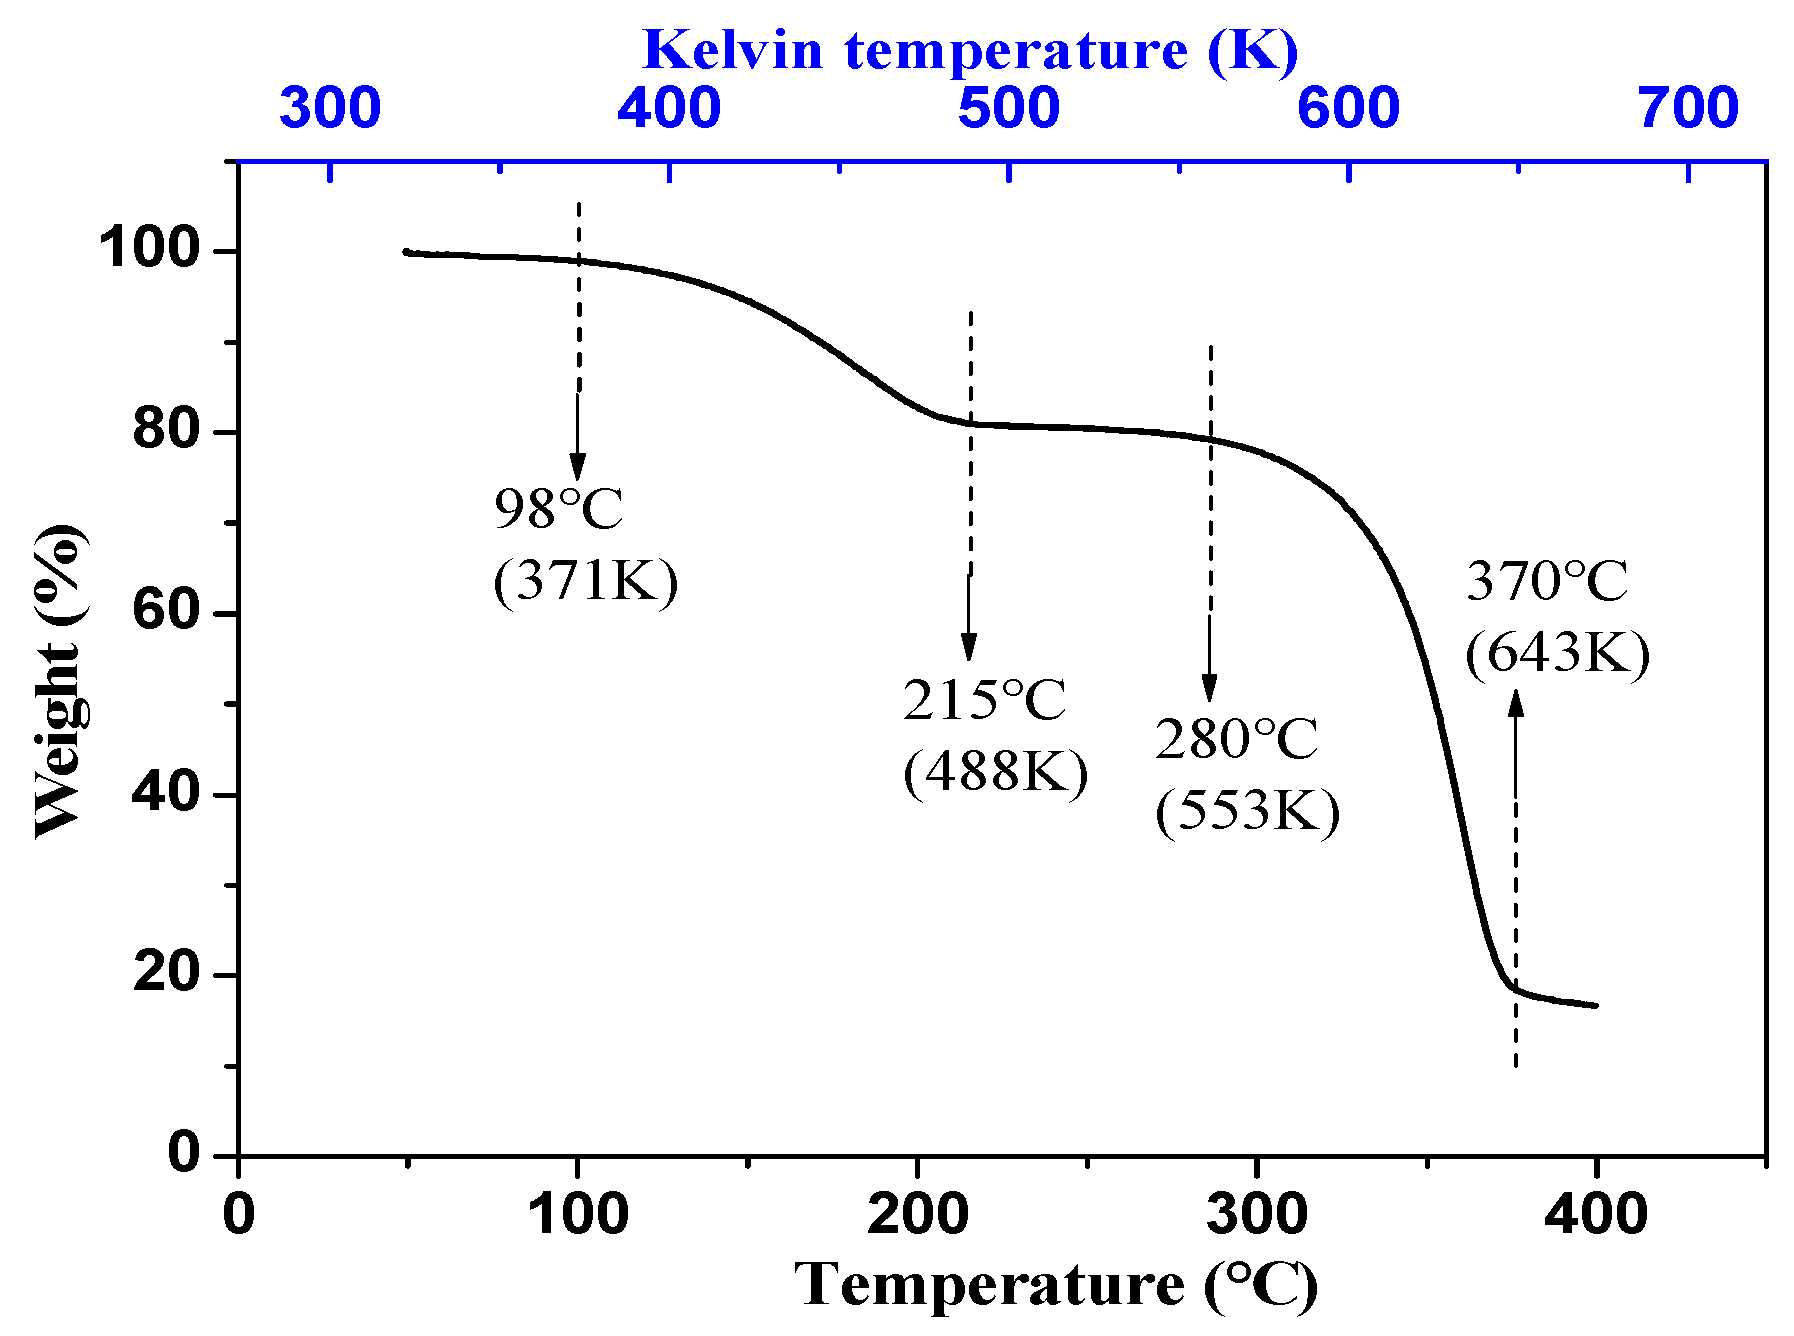
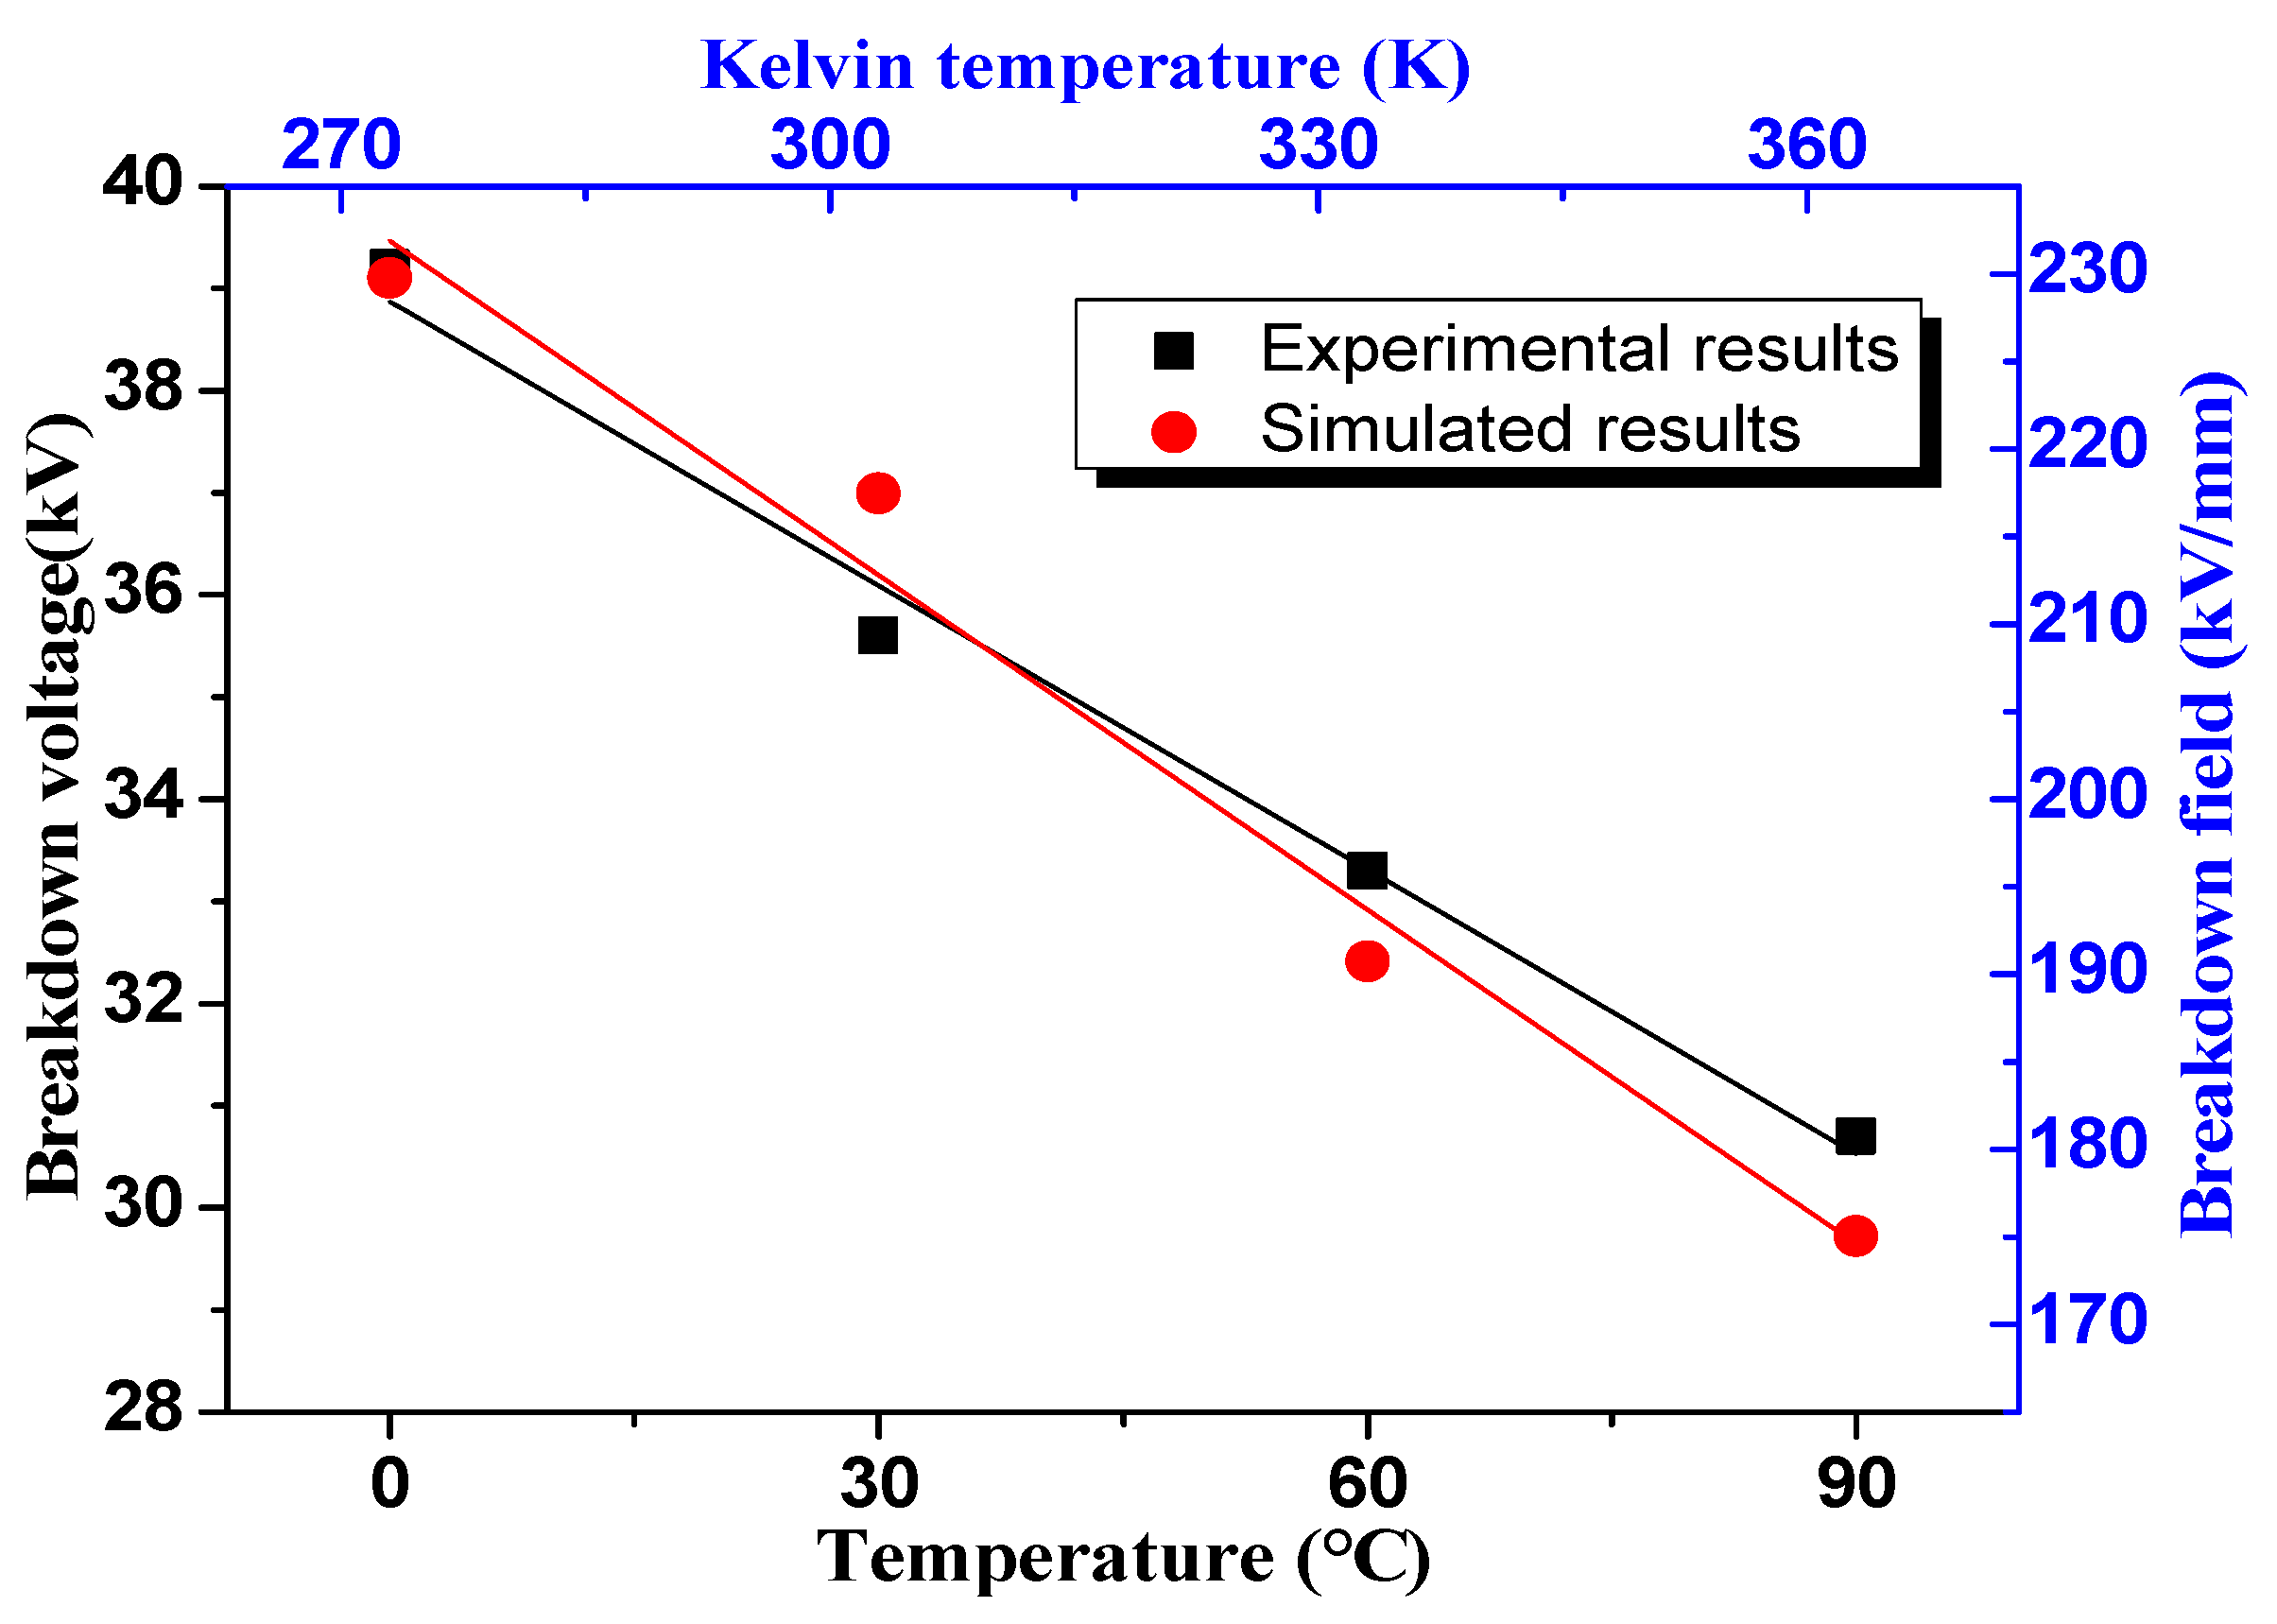
3.1. Breakdown Experiments under Different Temperatures and Thermal Gravimetric Test

The breakdown voltages at different temperatures showed a stochastic property; therefore, two-parameter Weibull distribution was utilized to present the breakdown probability versus applied voltage. The cumulative distribution function over the breakdown field was calculated, as well as the scale and shape parameters. Figure 2 illustrates breakdown voltages of oil-impregnated paper under different temperatures. It could be seen that the breakdown voltages at −20 °C and 0 °C were almost the same. Furthermore, if the temperature was higher than 0 °C, the breakdown voltage decreased with the increase of temperature. Once the temperature reached 120 °C, the breakdown voltage decreased more severely.
TG analysis of insulating paper was presented in Figure 3. The weight begun to decrease at 98 °C and first stopped decreasing at about 215 °C. This was because the oil contained in the sample had been totally volatilized, but the temperature was not high enough to cause decomposition of cellulose. When the temperature continued to increase, the weight of insulating paper started to decrease again at about 280 °C and it decreased rapidly. Above 370 °C, the weight hardly changed any more. This meant that the insulating paper absolutely decomposed.

3.2. Thermal Breakdown Simulation

According to the breakdown experiments and theory, the breakdown voltage of insulating polymers decreases with the increase of temperature, but the decline rate is different at different temperatures, as illustrated in Figure 4 [16]. The breakdown generally can be divided into three classes. When T < Tc1, electric breakdown occurs. The typical phenomenon is that the breakdown voltage is not affected by temperature in general, but sometimes it increases with the increase of temperature. When Tc1 < T < Tc2, thermal breakdown occurs, which is usually caused by steady or impulsive heating. This is most often seen in experiments. Once T > Tc2, electro-mechanical breakdown takes place, which results from polymer deformation due to the polymer softening, and electrostatic force between the electrodes.
Based on thermal breakdown theory, the heat equilibrium during thermal breakdown can be expressed as:
C v d T d t = σ ( E , T ) E 2 + ( κ ( T ) T )
where Cv is specific heat at constant volume, κ is thermal conductivity of the dielectric, σ is conductivity, T is temperature, E is electric field, t is time.
Hopping conductivity and Kelvin conductivity are frequently used to describe the conductivity of polymers. They are separately expressed as [17,18]:
J = J 0 exp ( u a k T ) exp ( e a E 2 k T )
σ = σ k exp ( a k T + b k E )
where ua is activation energy, a is hopping distance, J0, σk, ak and bk are constants, and k is Boltzmann constant. The thermal equilibrium Equation (1) was numerically solved by the Richardson algorithm [19].
According to the properties of oil-impregnated paper [20] and classic parameters for describing conductivity of polymers [17], parameters in Table 1 were used, and results of pure thermal breakdown simulation are shown in Figure 5. Whether hopping conductivity or Kelvin conductivity was adopted, simulated thermal breakdown voltage decreased with the increase of temperature. However, except those at 90 °C, simulation results were much larger than experimental results, and the result of Kelvin conductivity was larger than that of hopping conductivity at the same temperature.
Figure 6 exhibits the simulated variation of temperature within the oil-impregnated paper sample during thermal breakdown at 60 °C. The temperature increased slowly at first and then increased sharply immediately before breakdown happened, for both hopping and Kelvin conductivity. Specifically, when the growth of temperature reached 8 °C, the applied external voltage was very close to the thermal breakdown voltage. After that, a small rise of applied voltage would lead to the temperature and current rising sharply, and breakdown occurred.

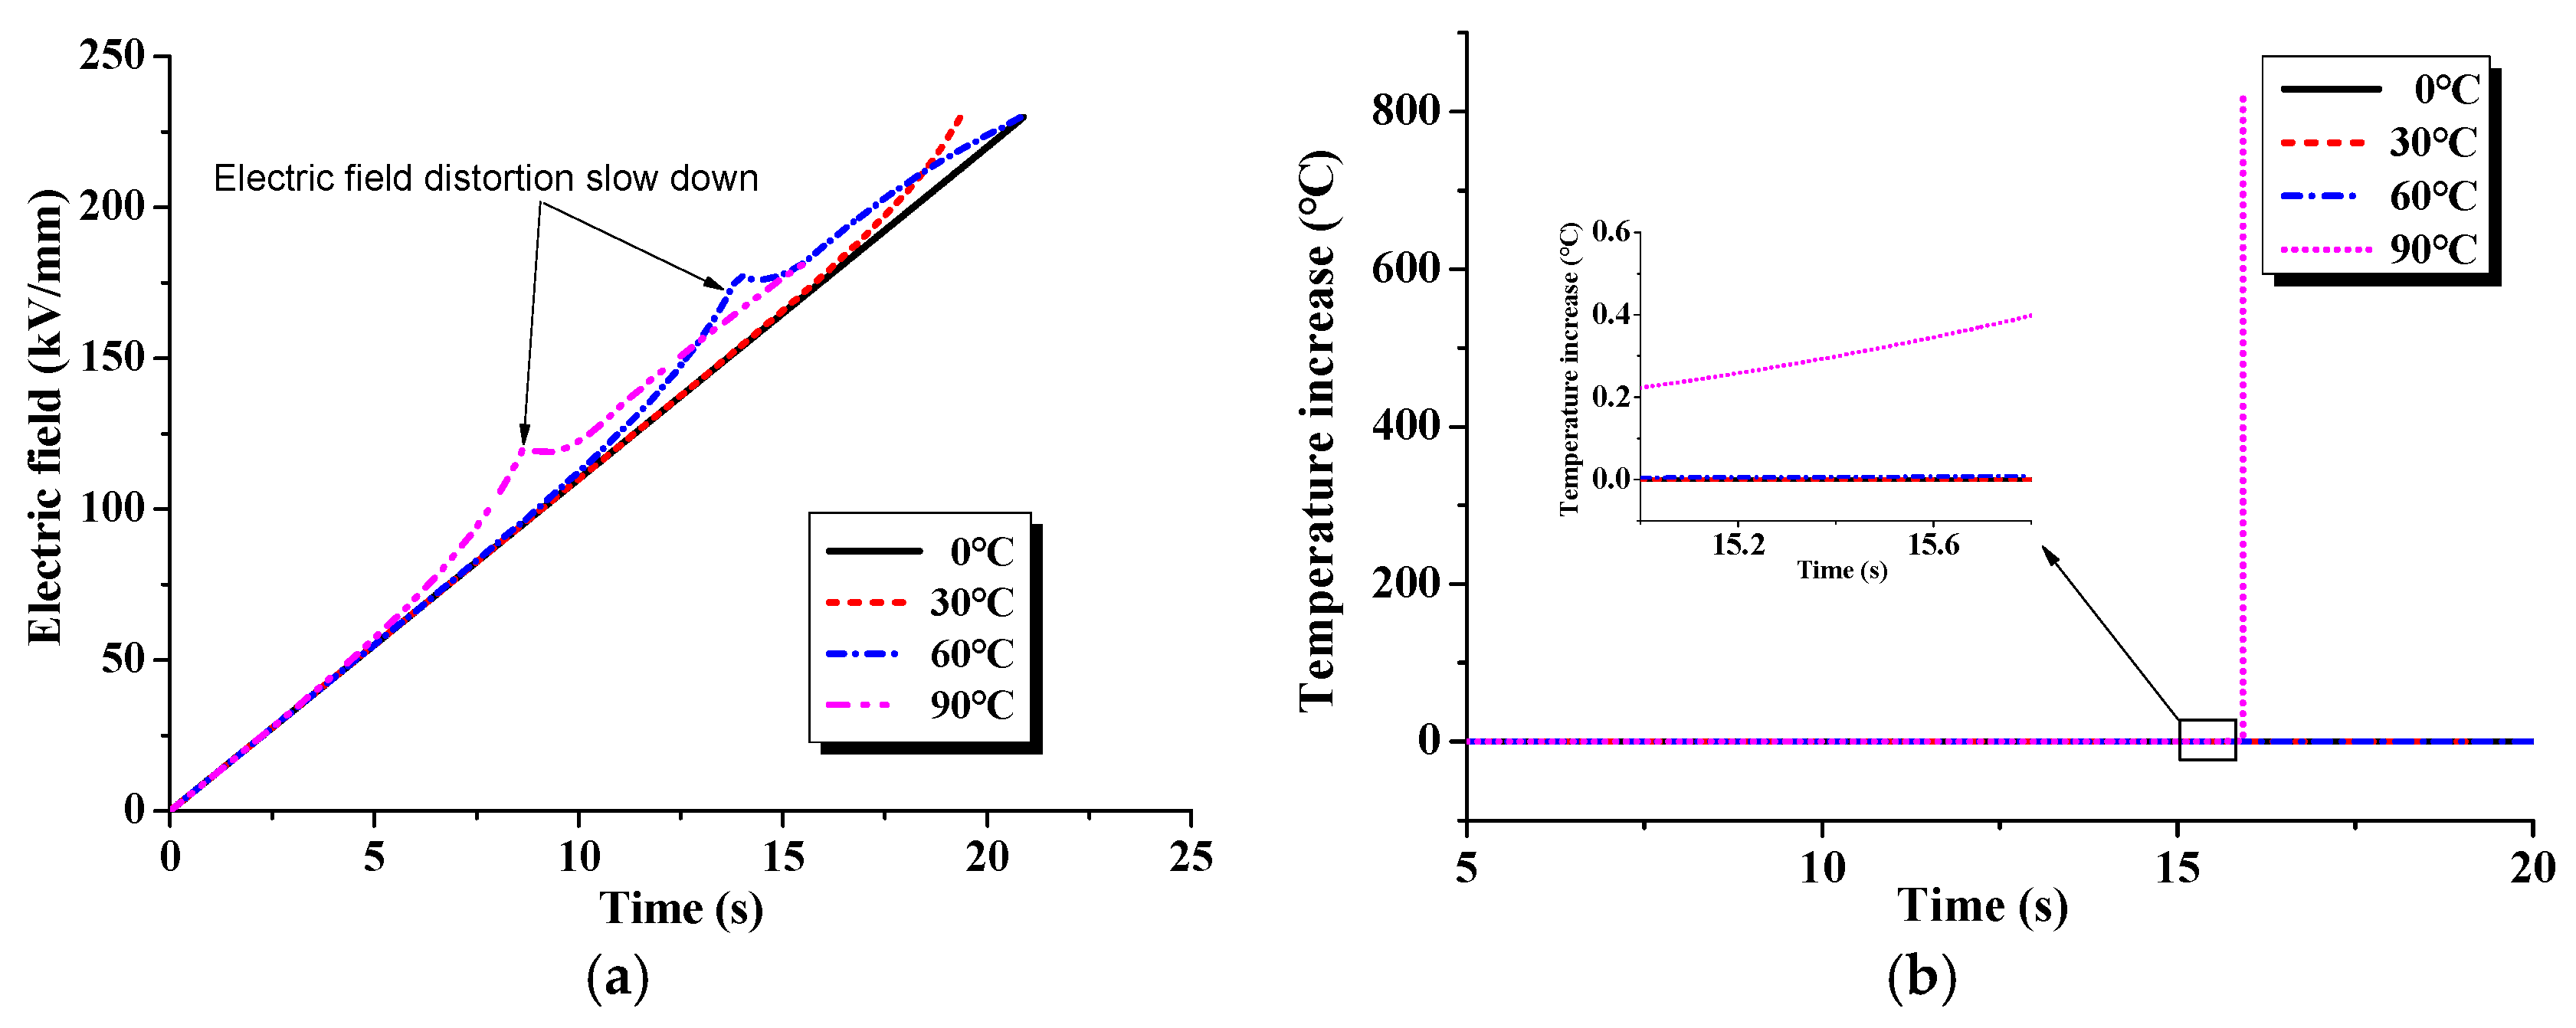
3.3. Electro-Thermal Breakdown Simulation

The bipolar charge transport model proposed by Roy [21] effectively describes space charge injection, movement and accumulation under an externally applied electric field. Based on the model, carrier movement and action within dielectrics can be expressed with Poisson, transport and convection–reaction equations, namely:
E ( x , t ) x = ρ ( x , t ) ε r ε 0
j ( x , t ) = e μ n E ( x , t )
n ( x , t ) t + j ( x , t ) x = S
where x denotes position along the thickness direction, ρ is charge density, j is current density, ε0 is the vacuum permittivity, εr is relative permittivity of the dielectric, e is electric charge, μ is mobility, n is carrier density, and S is the source term. Details of the model can be found in [21]. Although this model is usually used for charge transport simulations in polymers such as polyethylene, and as oil-impregnated paper is a kind of complex material, it can still apply to charge transport description of oil-impregnated paper [20].
Though it is different from polymers, classic parameters for polymers can still be chosen for oil-impregnated paper [20], and typical parameters for bipolar charge transport simulations in this electro-thermal breakdown model are listed in Table 2. Details of these symbols can be found in [22]. The Poisson Equation (4) was resolved by the boundary element method and the splitting method was used for solving the continuity Equation (6) [21].
With temperature- and electric field-dependent mobility being considered, results of the electro-thermal breakdown simulation are shown in Figure 7. On the condition that when temperature reached a critical value, breakdown happened, the simulated breakdown voltage decreased with the increase of temperature, but the decreases were larger than those of experimental results except that at 90 °C. However, based on the hypothesis that when the internal electric field or temperature reached a critical value, breakdown occurred, the simulated breakdown voltages were equal to those of the experimental results except that at 60 °C.
Furthermore, with negative differential mobility being considered, results of the electro-thermal breakdown simulation are presented in Figure 8. The simulated breakdown voltage decreased with the increase of temperature. What is more, the simulated results were very close to the experimental results.

4. Discussions

4.1.Thermal Breakdown Simulation

From Figure 2 and Figure 4, it could be concluded that the temperature-dependent breakdown of oil-impregnated paper between −20 °C and 120 °C agreed quite well with that of polymer breakdown theory. It can also be divided into three regions, and Tc1 ≈ 0 °C, Tc2 ≈ 90 °C. In particular, the breakdown of oil-impregnated paper between 0 °C and 90 °C was due to thermal or electro-thermal breakdown.
Temperature has little effect on the thermal conductivity of oil-impregnated paper insulation, so the influence of temperature on thermal conductivity can be neglected. Therefore, the variation of temperature within oil-impregnated paper could be calculated by using Equation (1) if temperature- and electric field-dependent conductivity were known, as expressed in Equations (2) and (3). According to the results in Figure 3, insulating paper began to decompose at 280 °C and completely decompose at 370 °C. Hence, we can assume that once the temperature reached 370 °C (denoted by Tb), thermal breakdown would occur, neglecting the dynamic process of breakdown. For simplicity, if the highest local temperature reached Tb, the whole oil-impregnated paper sample would be seen as having failed. Calculated breakdown voltages are shown in Figure 5 and temperature variation within the sample is shown in Figure 6. Because the heat generated by the current was hard to disperse, the temperature within the sample rose sharply and was much higher than the ambient temperature, which finally led to thermal breakdown.
Results in Figure 6 also show that when the temperature increment reached 8 °C, thermal breakdown was about to occur. This fits Murakami’s experimental observations. He had observed that the temperature increment before thermal breakdown is no higher than 8 °C [17]. Nevertheless, we still noticed differences between the calculated and experimental breakdown voltages, as well as differences between the results of Kelvin and hopping conductivity in Figure 5. The difference between hopping and Kelvin conductivity is exhibited in Figure 9. Hopping conductivity was mostly larger than Kelvin conductivity except that at 90 °C, so the thermal breakdown voltages of hopping conductivity were smaller than those of Kelvin conductivity. The simulation just considered the highest local temperature. This meant that the local conductivity within oil-impregnated paper should be larger than hopping conductivity, especially in a high electric field or temperature region. It is known that space charge can lead to electric field distortion, resulting in a local electric field being enhanced or weakened on the one hand, and impacting electrical properties, such as conductivity and breakdown on the other hand; therefore, it is necessary to consider the influence of space charge.

4.2. Electro-Thermal Breakdown Simulation

It was easy to obtain a combined simulation model by combining the thermal breakdown and bipolar charge transport models. Though constant mobility is often used in space charge transport, it cannot reflect the influence of temperature and electric fields. Thus, we consider temperature- and electric field-dependent mobility, as follows [18,21]:
μ = v 0 a E exp ( u a k T ) sinh ( e E a 2 k T )
where ν0 is phonon frequency, and it is 4.2 × 10¹⁴ Hz here. To accurately determine mobility, we measured the temperature-dependent conductivity of oil-impregnated paper with a 1-kV/mm electric field applied, as shown in Table 3. The temperature-dependent conductivity of oil-impregnated paper under low electric fields can be expressed as:
σ ( T ) = σ 0 exp ( u a k T )
where σ0 is a constant.
References [23,24] have pointed out that the activation energy of oil-impregnated paper is 0.8~0.9 eV. By data fitting, we obtained that ua = 0.84 eV, which was consistent with the literature. The calculated breakdown voltages are illustrated in Figure 7 (denoted by the temperature criterion). It could be seen that the calculated results were larger than the experimental results except that at 90 °C. This was because carrier injections from electrodes and carrier mobility were slow under lower temperatures. As a result, the current density was small, and consequently the heat generation was slow. Therefore, the calculated breakdown voltages were higher.
The breakdown process of oil-impregnated paper was very complex, involving thermal, electrical and mechanical factors [18,25]. According to Figure 2 and Figure 4, breakdown voltages at −20 °C and 0 °C were hardly influenced by temperature. It could be seen as electrical breakdown and the breakdown field Eb was about 230 kV/mm. Eb could be treated as an intrinsic feature of oil-impregnated paper; namely, once a local electric field within the sample reached Eb, breakdown happened. With the combination of the temperature criterion and electric field criterion, we obtained a combined electro-thermal criterion. The simulated breakdown voltages are presented in Figure 7 (denoted by electro-thermal criterion). The calculated breakdown voltages were very close to experimental results except the one at 60 °C.
Details of the simulation revealed that the temperature criterion took effect at 60 °C and 90 °C, while the electric field criterion took effect at 0 °C and 30 °C. This was because of the influence of temperature on the carrier injection and carrier mobility. According to Schottky’s injection law and Equation (7), under low temperatures, not only was the carrier injection rate slow, but also carrier mobility was slow, which made it easy to capture by traps [22,26]. The internal electric field was consequently distorted and reached the critical value. Under high temperatures, the carrier injection rate and mobility were both fast, so there were much more free carriers within the sample [22,26]. Then, the current density became large, and so was the heat generation. As a result, the temperature rose rapidly and reached the critical value. However, if the ambient temperature was 60 °C, then the carrier injection and mobility were neither high nor low, as were the electric field distortion and temperature increment. Therefore, the electric field distortion was slower than those at 0 °C and 30 °C, and the temperature increment was slower than that at 90 °C, as shown in Figure 10. A higher external voltage was needed so that the local electric field and temperature could reach the critical values. This is why the simulated result was higher than that of experimental result at 60 °C.
Negative differential mobility is a common phenomenon in semiconductors, such as the Gunn Effect. As regards dielectrics, Lewis predicted this phenomenon in hole transport modeling in polyethylene [27]; George observed it in the research of space charge packets in polyethylene, but neither researcher could explain it [28]. This phenomenon in oil-impregnated paper has not been reported so far; therefore, we suppose that it exists in oil-impregnated paper, but further research is required. For simplicity, it could be assumed to be controlled by activation energy, ua, if the electric field was higher than a critical value Eμ, ua = 1.1 eV; otherwise, ua = 0.84 eV. With this assumption and Eμ = 200 kV/mm, the simulated electro-thermal breakdown voltages are illustrated in Figure 8. These decreased with the increase of temperature and they were close to the experimental results.
Once temperature is over 113 °C, the secondary structure of cellulose changes, which leads to a rapid increment of conductivity [29]. So, it was no surprise that the breakdown voltage at 120 °C decreased much more.

5. Conclusions

The breakdown of oil-impregnated paper is a complicated process and it is important to propose a breakdown model. It has been proved that temperature and space charge have a great influence on the breakdown process. In this paper, temperature-dependent breakdown voltages of oil-impregnated paper were measured and an electro-thermal breakdown model was proposed. The following conclusions can be drawn:
In the range of −20~120 °C, the breakdown of oil-impregnated paper can be divided into three regions: electric, electro-thermal and thermal breakdown.
At the moment preceding thermal breakdown, the temperature within oil-impregnated paper rises sharply. When the temperature increment reaches 8 °C, the breakdown is about to take place and the external applied voltage is almost equal to the breakdown voltage; therefore, attention should be paid to a sharp rise of temperature in application.
Carrier mobility has a great effect on the breakdown process. When mobility is low, carriers are easy to capture, leading to electric field distortion. The local electric field in some regions is consequently enhanced. However, if the mobility is high, carriers are free to move and Joule heat is generated, resulting in local temperature increment. They both can finally induce breakdown.
With a combination of the bipolar carrier transport simulation model and the heat equilibrium equation, and temperature- and electric field-dependent mobility being considered, an electro-thermal breakdown model of oil-impregnated paper is thereby established. The simulation results are consistent with the experimental results, but further research on mobility property is required.

Acknowledgments

This study is supported by National Key R&D Program of China (2017YFB0902704), the Fundamental Research Funds for the Central Universities 2017MS009, State Key Laboratory of Power Grid Environmental Protection, and State Key Laboratory of Advanced Power Transmission Technology (GEIRI-SKL-2017-009). We are grateful for their support.

Author Contributions

Meng Huang and Yuanxiang Zhou conceived and designed the experiments; Zhongliu Zhou performed the experiments; Meng Huang and Bo Qi analyzed the data; Meng Huang wrote the paper.

Conflicts of Interest

The authors declare no conflict of interest.

References

  1. Li, Y.; Zhang, Q.; Wang, T.; Li, J.; Guo, C.; Ni, H. Degradation characteristics of oil-immersed pressboard samples induced by partial discharges under DC voltage. IEEE Trans. Dielectr. Electr. Insul. 2017, 24, 1110–1117. [Google Scholar] [CrossRef]
  2. Hikita, M.; Nagao, M.; Sawa, G.; Ieda, M. Dielectric breakdown and electrical conduction of poly (vinylidene-fluoride) in high temperature region. J. Phys. D Appl. Phys. 1980, 13, 661. [Google Scholar] [CrossRef]
  3. Hikita, M.; Sawa, G.; Ieda, M. Electrical breakdown and solid structure of poly(vinylidene-fluoride). J. Phys. D Appl. Phys. 1983, 16, L157. [Google Scholar] [CrossRef]
  4. Ieda, M.; Nagao, M.; Hikita, M. High-field conduction and breakdown in insulating polymers. Present situation and future prospects. IEEE Trans. Dielectr. Electr. Insul. 1994, 1, 934–945. [Google Scholar] [CrossRef]
  5. Wintle, H. Electrothermal breakdown: Analytic solutions for currents and fields. J. Appl. Phys. 1981, 52, 4181–4185. [Google Scholar] [CrossRef]
  6. Wei, Y.H.; Mu, H.B.; Deng, J.B.; Zhang, G.J. Effect of space charge on breakdown characteristics of aged oil-paper insulation under dc voltage. IEEE Trans. Dielectr. Electr. Insul. 2016, 23, 3143–3150. [Google Scholar] [CrossRef]
  7. Li, Y.; Zhang, Q.; Li, J.; Wang, T.; Dong, W.; Ni, H. Study on micro bridge impurities in oil-paper insulation at DC voltage: their generation, growth and interaction with partial discharge. IEEE Trans. Dielectr. Electr. Insul. 2016, 23, 2213–2222. [Google Scholar] [CrossRef]
  8. Keller, K.J. Formation and annulment of space charges glass and their influence on electric breakdown. Phys. Rev. 1952, 86, 804–805. [Google Scholar] [CrossRef]
  9. Dissado, L.A.; Mazzanti, G.; Montanari, G.C. The role of trapped space charges in the electrical aging of insulating materials. IEEE Trans. Dielectr. Electr. Insul. 1997, 4, 496–506. [Google Scholar] [CrossRef]
  10. Zheng, F.; Zhang, Y.; Xiao, C. Relationship between breakdown in polymer dielectrics and space charge. J. Mater. Sci. Eng. 2006, 24, 316–320. [Google Scholar]
  11. Liao, R.; Hu, E.; Yang, L.; Yuan, Y. Space charge behavior in paper insulation induced by copper sulfide in high-voltage direct current power transformers. Energies 2015, 8, 8110–8120. [Google Scholar] [CrossRef]
  12. Chen, G.; Zhao, J.; Li, S.; Zhong, L. Origin of thickness dependent dc electrical breakdown in dielectrics. Appl. Phys. Lett. 2012, 100, 222904. [Google Scholar] [CrossRef]
  13. Choi, D.H.; Randall, C.; Lanagan, M. Combined electronic and thermal breakdown models for polyethylene and polymer laminates. Mater. Lett. 2015, 141, 14–19. [Google Scholar] [CrossRef]
  14. Boughariou, F.; Chouikhi, S.; Kallel, A.; Belgaroui, E. A new theoretical formulation of coupling thermo-electric breakdown in LDPE film under dc high applied fields. J. Eur. Phys. Plus 2015, 130, 244–251. [Google Scholar] [CrossRef]
  15. Huang, M.; Zhou, Y.; Chen, W.; Sha, Y.; Jin, F. Influence of voltage reversal on space charge behavior in oil-paper insulation. IEEE Trans. Dielectr. Electr. Insul. 2014, 21, 331–339. [Google Scholar] [CrossRef]
  16. Diaham, S.; Zelmat, S.; Locatelli, M.L.; Dinculescu, S.; Decup, M.; Lebey, T. Dielectric Breakdown of Polyimide Films: Area, Thickness and Temperature Dependence. IEEE Trans. Dielectr. Electr. Insul. 2010, 17, 18–27. [Google Scholar] [CrossRef]
  17. Murakami, Y.; Hozumi, N.; Nagao, M. Surface Temperature Measurement and Analysis of Thermal Breakdown with Ethylene-vinyl Acetate Copolymer in Room-Temperature Region. Jpn. J. Appl. Phys. 2004, 43, 6184. [Google Scholar] [CrossRef]
  18. Dissado, L.A.; Fothergill, J.C. Electrical Degradation and Breakdown in Polymers; The Redwood Press: Wiltshire, UK, 1992; pp. 49–50. [Google Scholar]
  19. Jäger, W. Partial Differential Equations: Theory and Numerical Solution; Chapman & Hall/CRC: Boca Raton, FL, USA, 2000; pp. 132–147. [Google Scholar]
  20. Zhu, Q.; Wang, X.; Wu, K.; Cheng, Y.; Lv, Z.; Wang, H. Space Charge Distribution in Oil Impregnated Papers under Temperature Gradient. IEEE Trans. Dielectr. Electr. Insul. 2015, 22, 142–151. [Google Scholar] [CrossRef]
  21. Le Roy, S.; Segur, P.; Teyssedre, G.; Laurent, C. Description of bipolar charge transport in polyethylene using a fluid model with a constant mobility: Model prediction. J. Phys. D Appl. Phys. 2004, 37, 298–305. [Google Scholar] [CrossRef]
  22. Tian, J.; Zou, J.; Wang, Y.; Liu, J.; Yuan, J.; Zhou, Y. Simulation of bipolar charge transport with trapping and recombination in polymeric insulators using runge–kutta discontinuous galerkin method. J. Phys. D Appl. Phys. 2008, 41, 195416. [Google Scholar] [CrossRef]
  23. Zukowski, P.; Koltunowicz, T.N.; Kierczynski, K.; Subocz, J.; Szrot, M.; Gutten, M. Assessment of Water Content in an Impregnated Pressboard based on DC Conductivity Measurements. Theoretical Assumptions. IEEE Trans. Dielectr. Electr. Insul. 2014, 21, 1268–1275. [Google Scholar] [CrossRef]
  24. Setayeshmehr, A.; Fofana, I.; Eichler, C.; Akbari, A.; Borsi, H.; Gockenbach, E. Dielectric spectroscopic measurements on transformer oil-paper insulation under controlled laboratory conditions. IEEE Trans. Dielectr. Electr. Insul. 2008, 15, 1100–1111. [Google Scholar] [CrossRef]
  25. Wildman, R.A.; Gazonas, G.A. A dynamic electro-thermo-mechanical model of dielectric breakdown in solids using peridynamics. J. Mech. Mater. Struct. 2015, 10, 613–630. [Google Scholar] [CrossRef]
  26. Tian, J. Simulation of the Space Charge Transport in Insulators under High Electric Field. Doctoral Dissertation, Tsinghua University, Beijing, China, 2009. [Google Scholar]
  27. Jones, J.P.; Llewellyn, J.P.; Lewis, T.J. The contribution of field-induced morphological change to the electrical aging and breakdown of polyethylene. IEEE Trans. Dielectr. Electr. Insul. 2005, 12, 951–966. [Google Scholar] [CrossRef]
  28. Chen, G.; Zhao, J. Observation of negative differential mobility and charge packet in polyethylene. J. Phys. D Appl. Phys. 2011, 44, 21200121. [Google Scholar] [CrossRef]
  29. Takahashi, M.; Takenaka, H.; Wada, Y. Electrical conduction of cellulose under DC field. In Proceedings of the 3rd International Conference on Conduction and Breakdown in Solid Dielectrics, Trondheim, Norway, 3–6 July 1989; pp. 182–186. [Google Scholar]
Figure 1. Breakdown system for oil-impregnated paper under different temperatures.
Energies 10 02160 g001
Figure 2. Temperature-dependent breakdown voltage of oil-impregnated paper insulation. (a) Weibull distribution of breakdown voltages; (b) Temperature-dependent shape and scale parameters.
Energies 10 02160 g002aEnergies 10 02160 g002b
Figure 3. Thermal gravimetric analysis results of insulating paper.
Energies 10 02160 g003
Figure 4. Temperature-dependent breakdown of insulating polymers [16]. (I) T < Tc1, electric breakdown; (II) Tc1 < T < Tc2, thermal or electro-thermal breakdown; (III) T > Tc2, electro-mechanical breakdown.
Energies 10 02160 g004
Figure 5. Comparison of thermal breakdown simulations and breakdown experiments.
Energies 10 02160 g005
Figure 6. Simulated variation of temperature within the sample during thermal breakdown.
Energies 10 02160 g006
Figure 7. Comparison of electro-thermal breakdown simulations and breakdown experiments. Temperature- and electric field-dependent mobility was considered.
Energies 10 02160 g007
Figure 8. Comparison of electro-thermal breakdown simulations and breakdown experiments. Temperature- and electric field-dependent mobility was considered, and so was negative differential mobility.
Energies 10 02160 g008
Figure 9. Comparison of calculated hopping and Kelvin conductivity under different temperatures and electric fields.
Energies 10 02160 g009
Figure 10. Variations in the highest electric field and temperature before breakdown. (a) Variation in the highest electric field, (b) Variation in the highest temperature.
Energies 10 02160 g010
Table 1. Parameters for thermal breakdown simulation.
SymbolValueUnitSymbolValueUnit
a2.1nmCv2.5 × 106J/(m3·K)
ua1.1eVJ01.9 × 1013A/m2
κ0.25W/(m·K)
Table 2. Parameters for bipolar charge simulation.
SymbolMeaningValueUnit
Net0Electron trap density100C/m3
Nht0Hole trap density100C/m3
BeElectron trapping coefficient7 × 10−3s−1
BhHole trapping coefficient7 × 10−3s−1
Seμ,htRecombination coefficient4 × 10−3m−3 C−1 s−1
Set,hμRecombination coefficient4 × 10−3m−3 C−1 s−1
Set,htRecombination coefficient4 × 10−3m−3 C−1 s−1
ωeSchottky injection barier1.2eV
ωhSchottky injection barrier1.2eV
εrRelative permittivity4.4
Table 3. Temperature-dependent conductivity of oil-impregnated paper (measured at 1 kV/mm electric field).
Temperature T ( °C)40507090110
Conductivity σ(S/m)1.90 × 10−134.59 × 10−132.64 × 10−121.38 × 10−115.26 × 10⁻¹¹

