Effect on Vehicle Turbocharger Exhaust Gas Energy Utilization for the Performance of Centrifugal Compressors under Plateau Conditions

Abstract
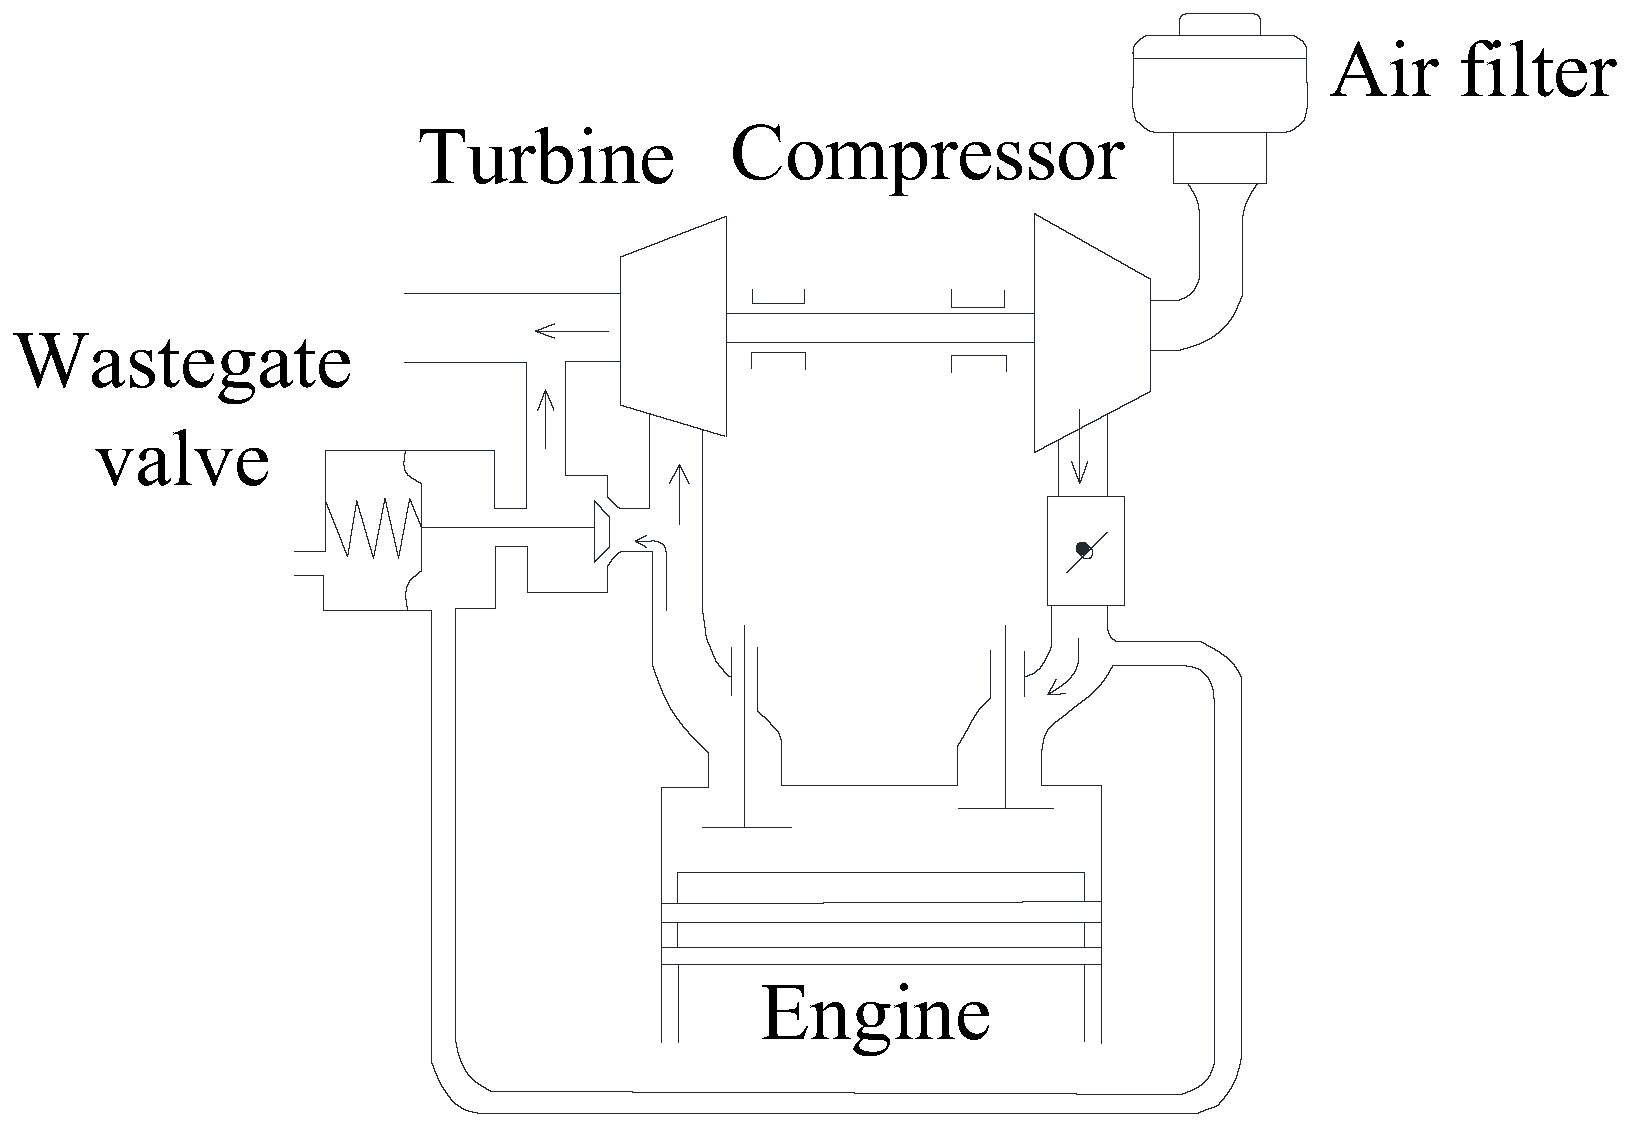
:1. Introduction
2. Compressor Performance Analysis
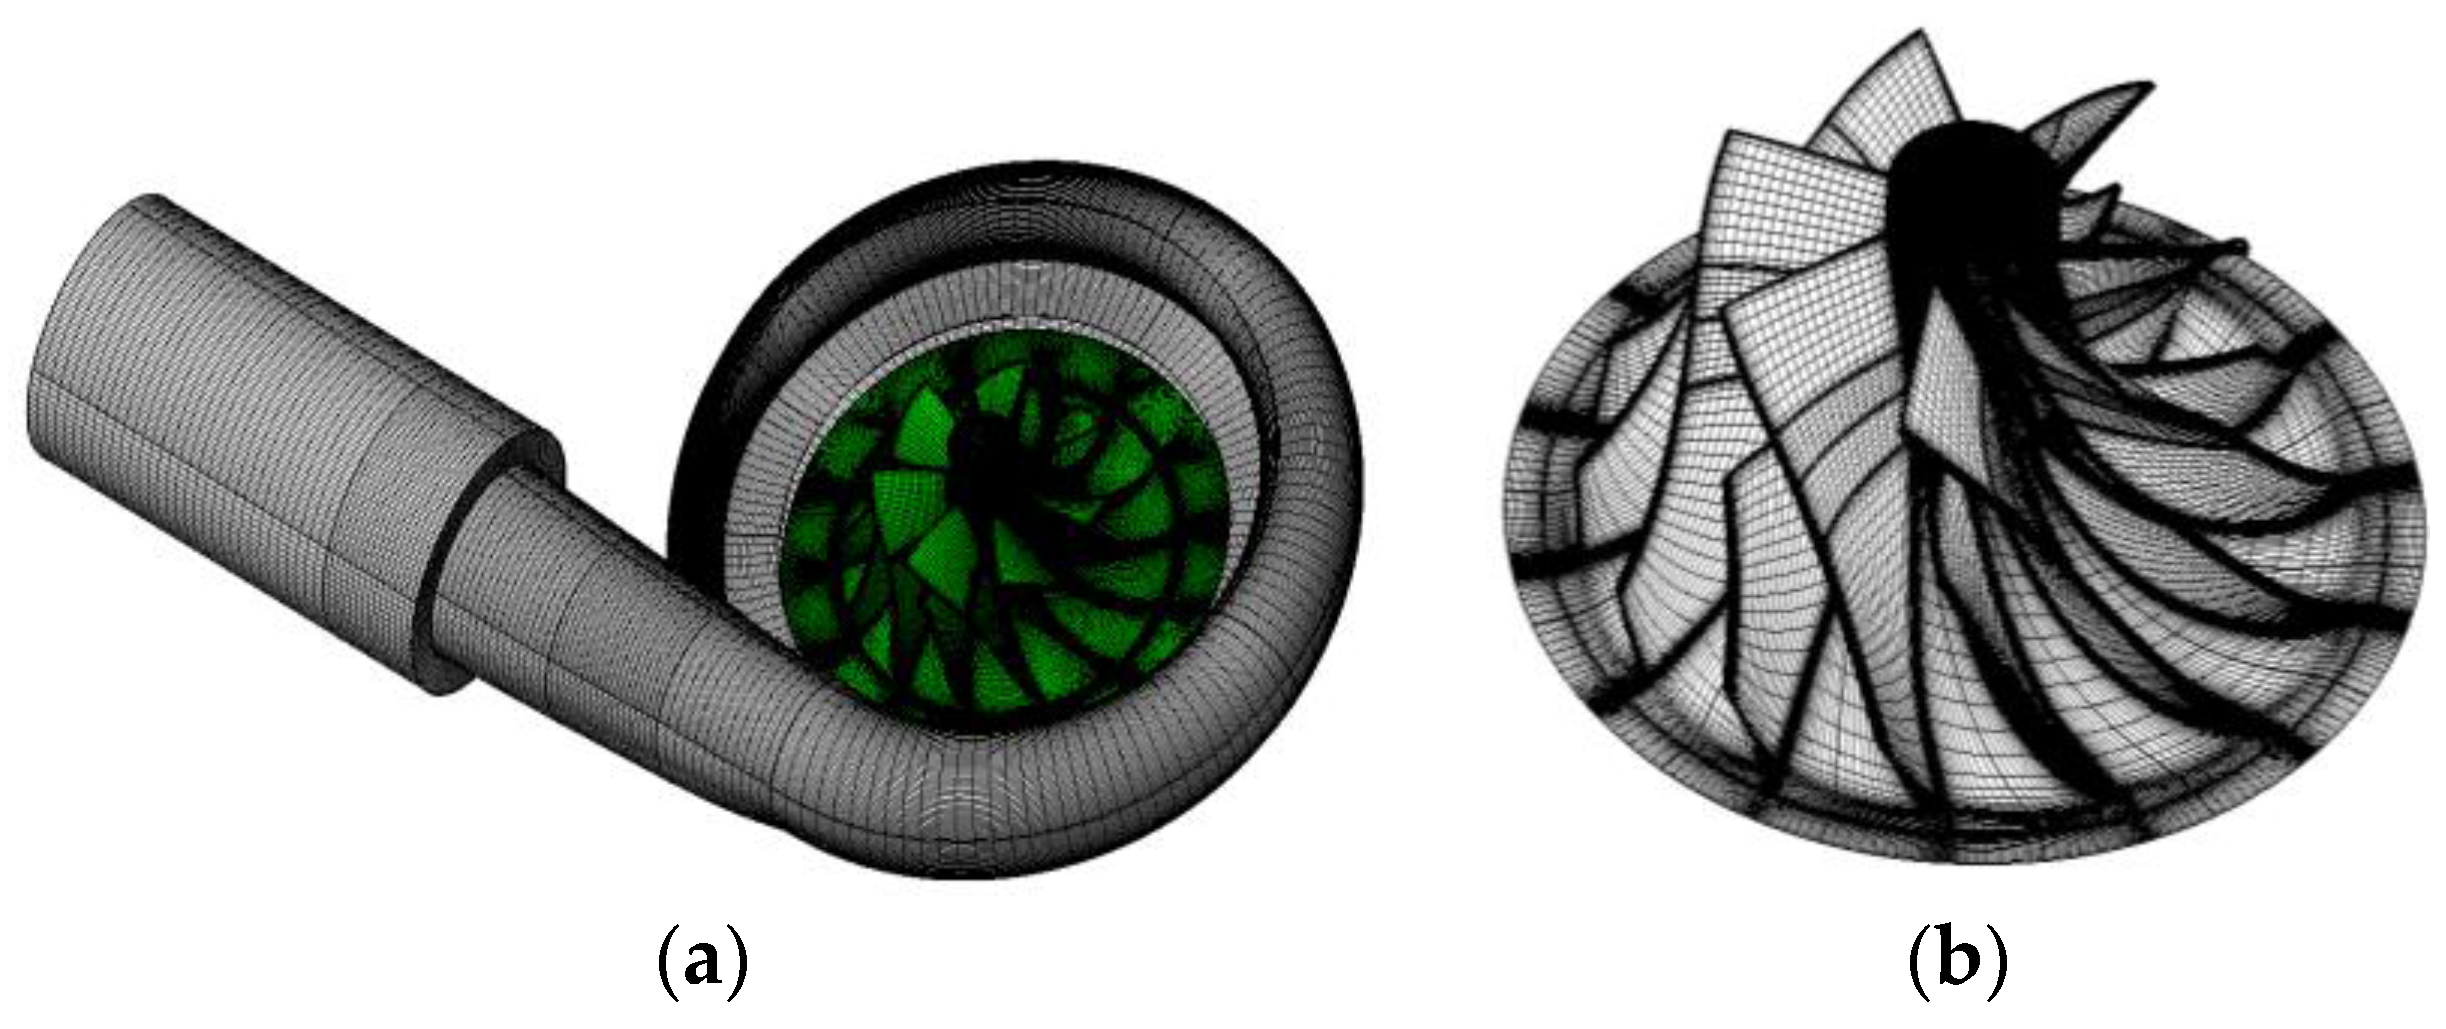
3. Numerical Calculation Method
4. Calculation Results Analysis
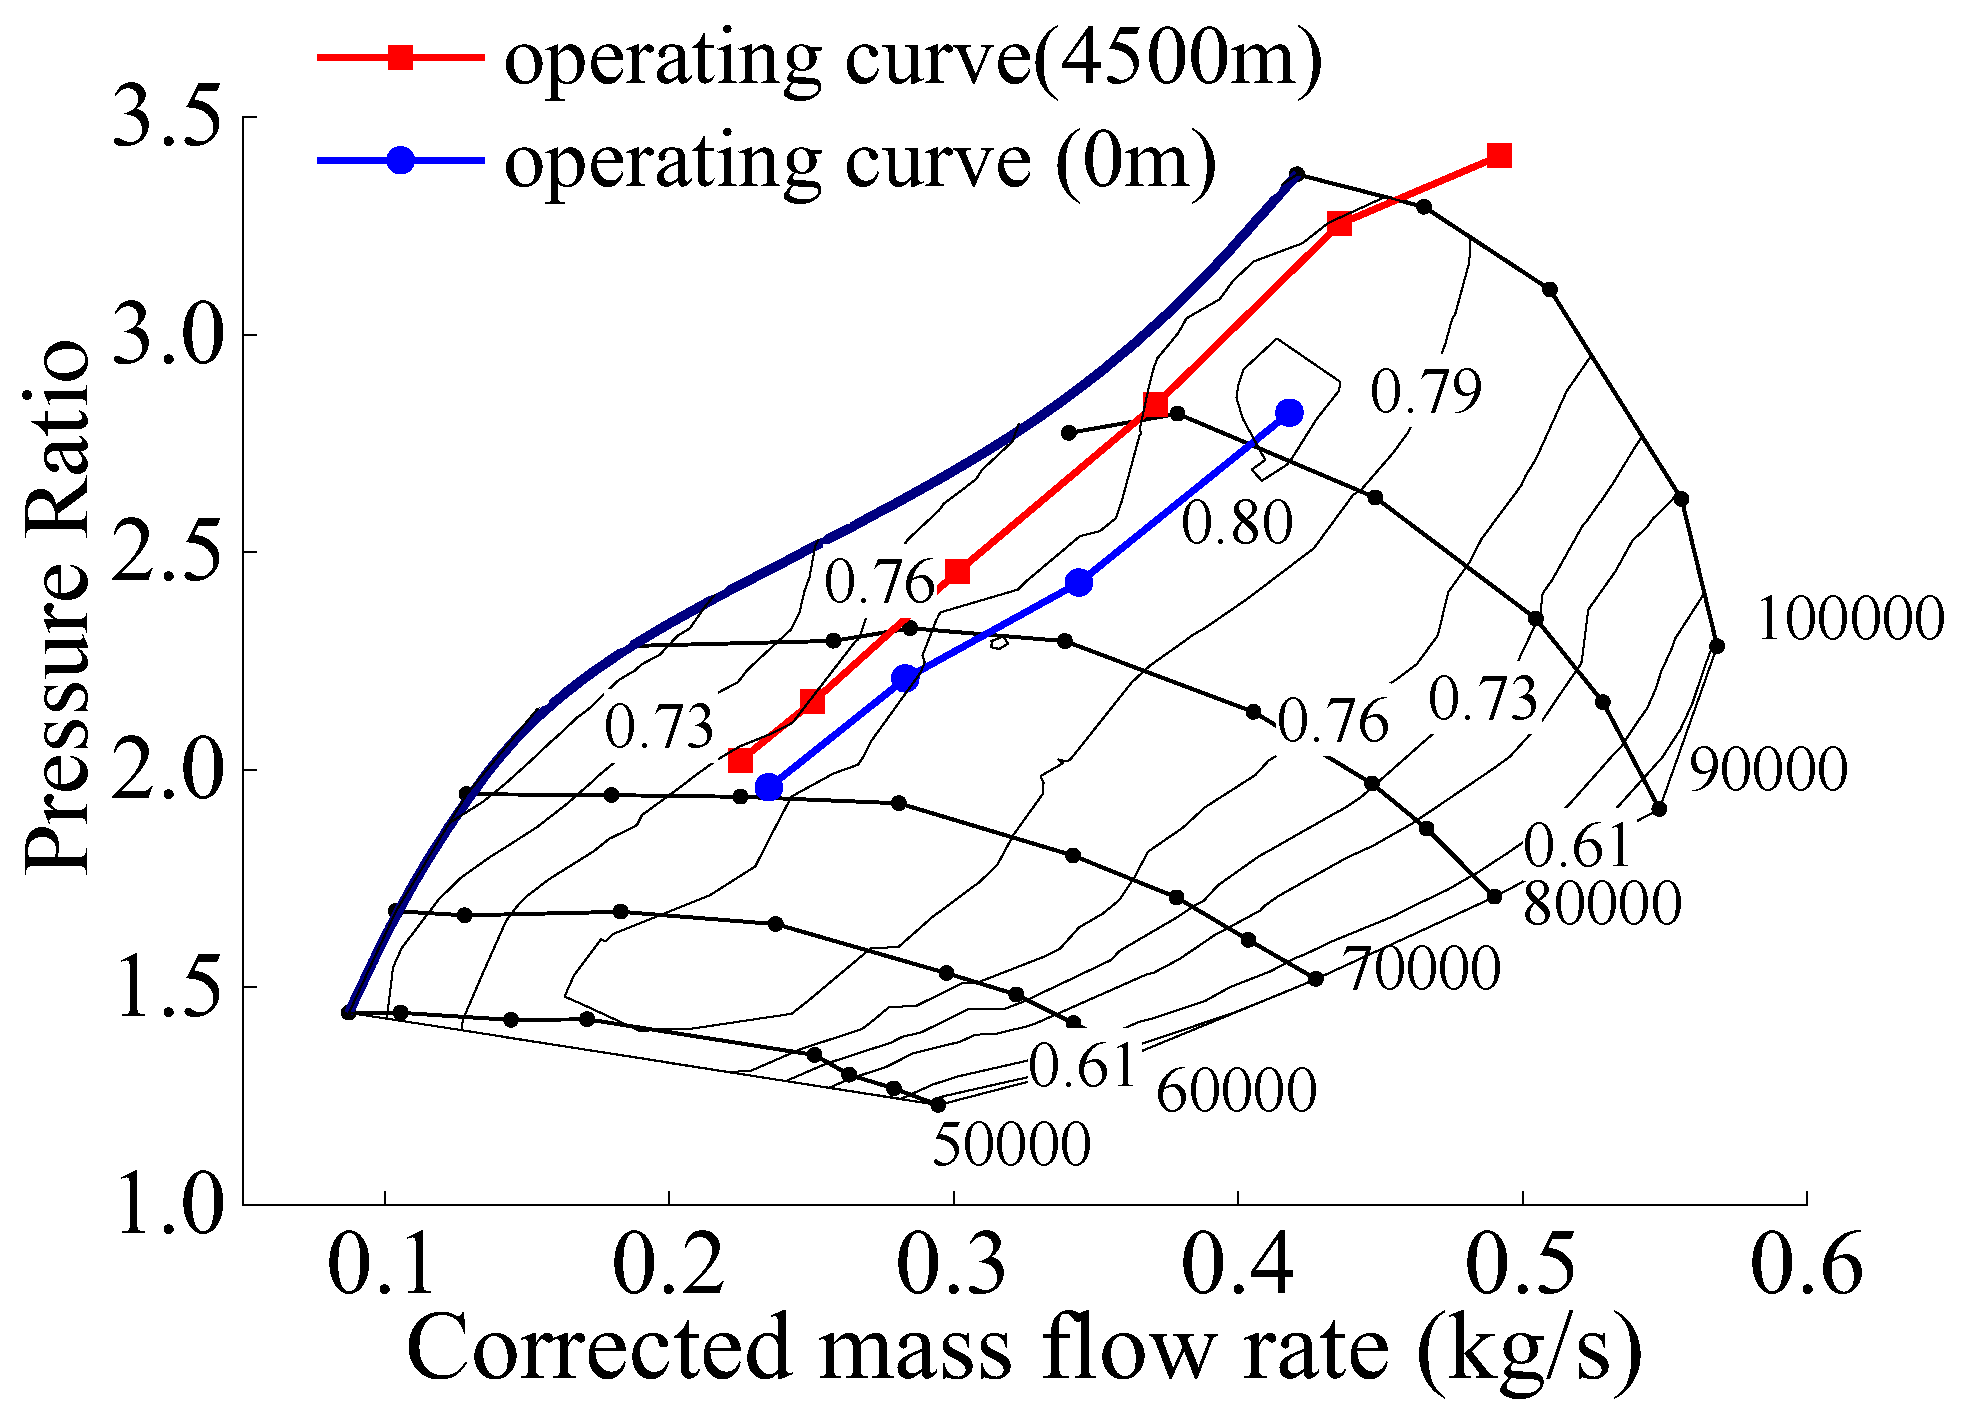
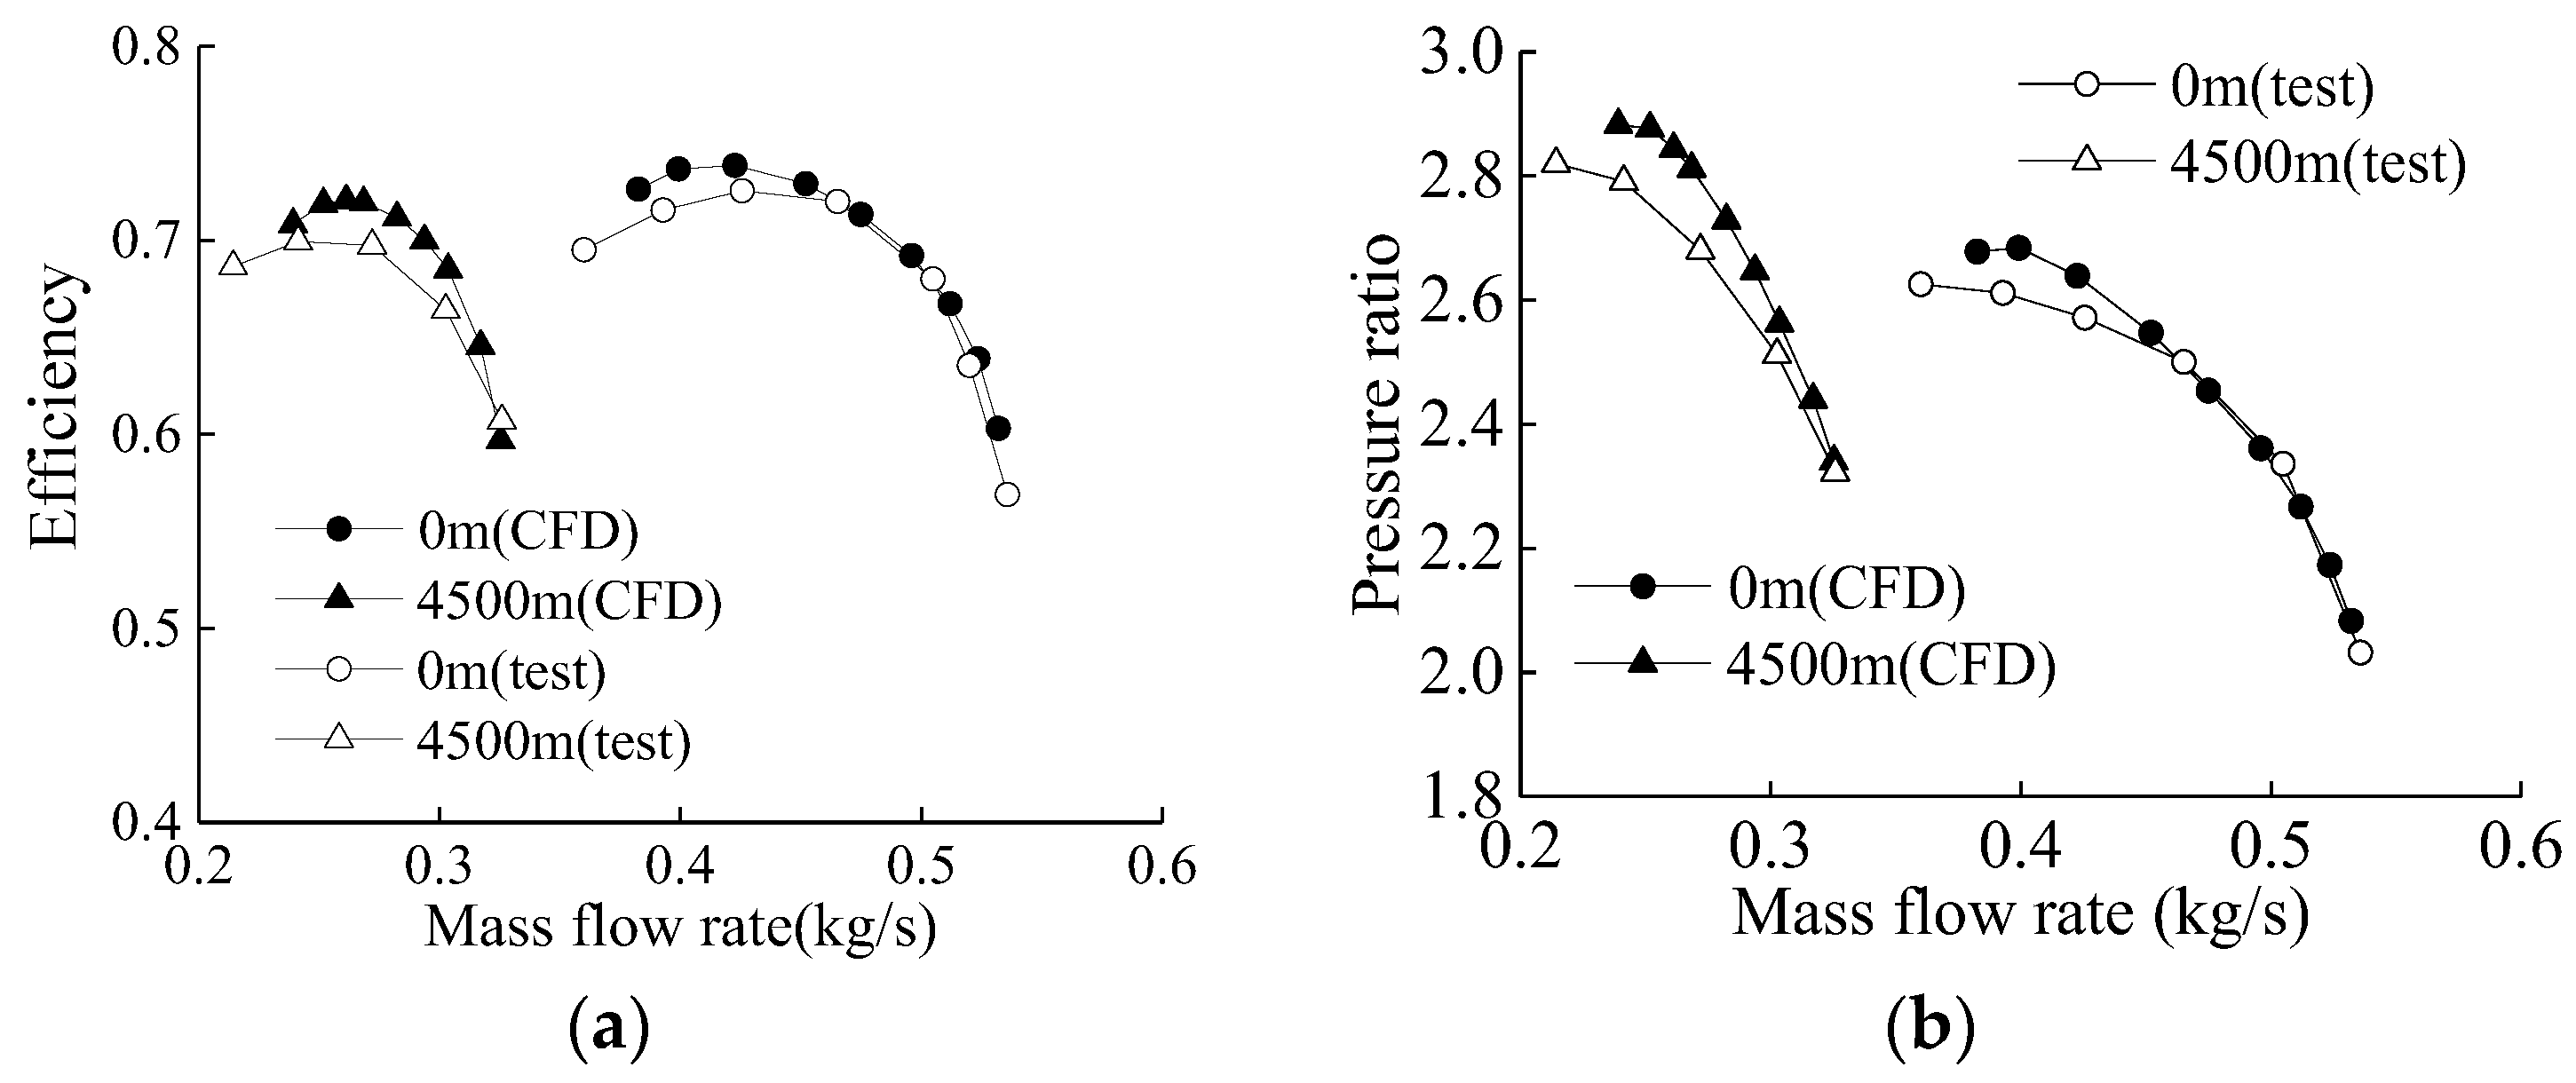
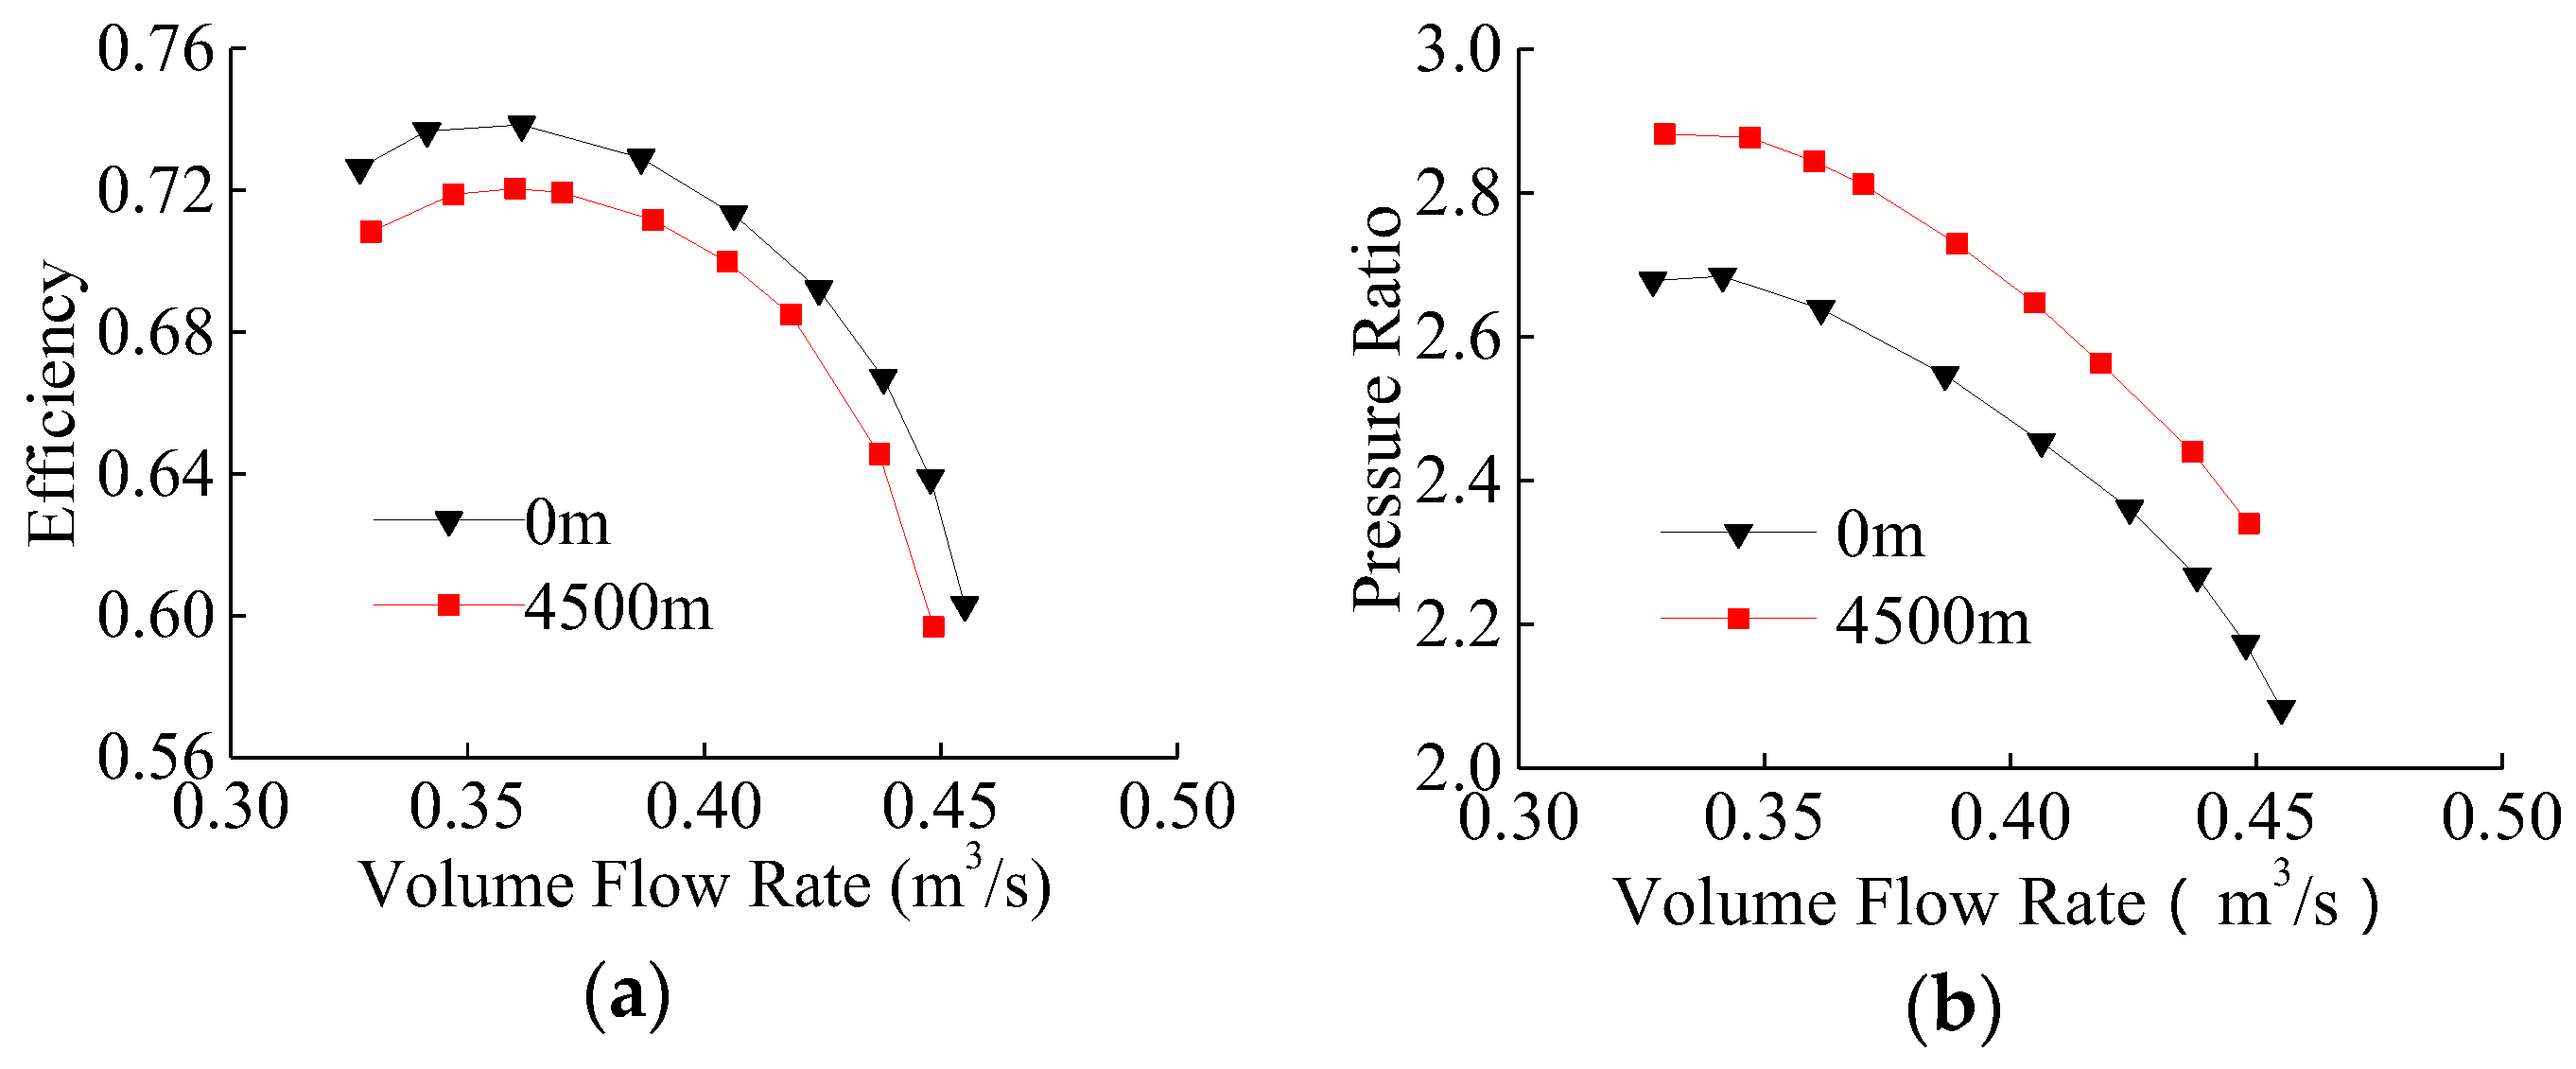
4.1. Compressor Performance Comparison
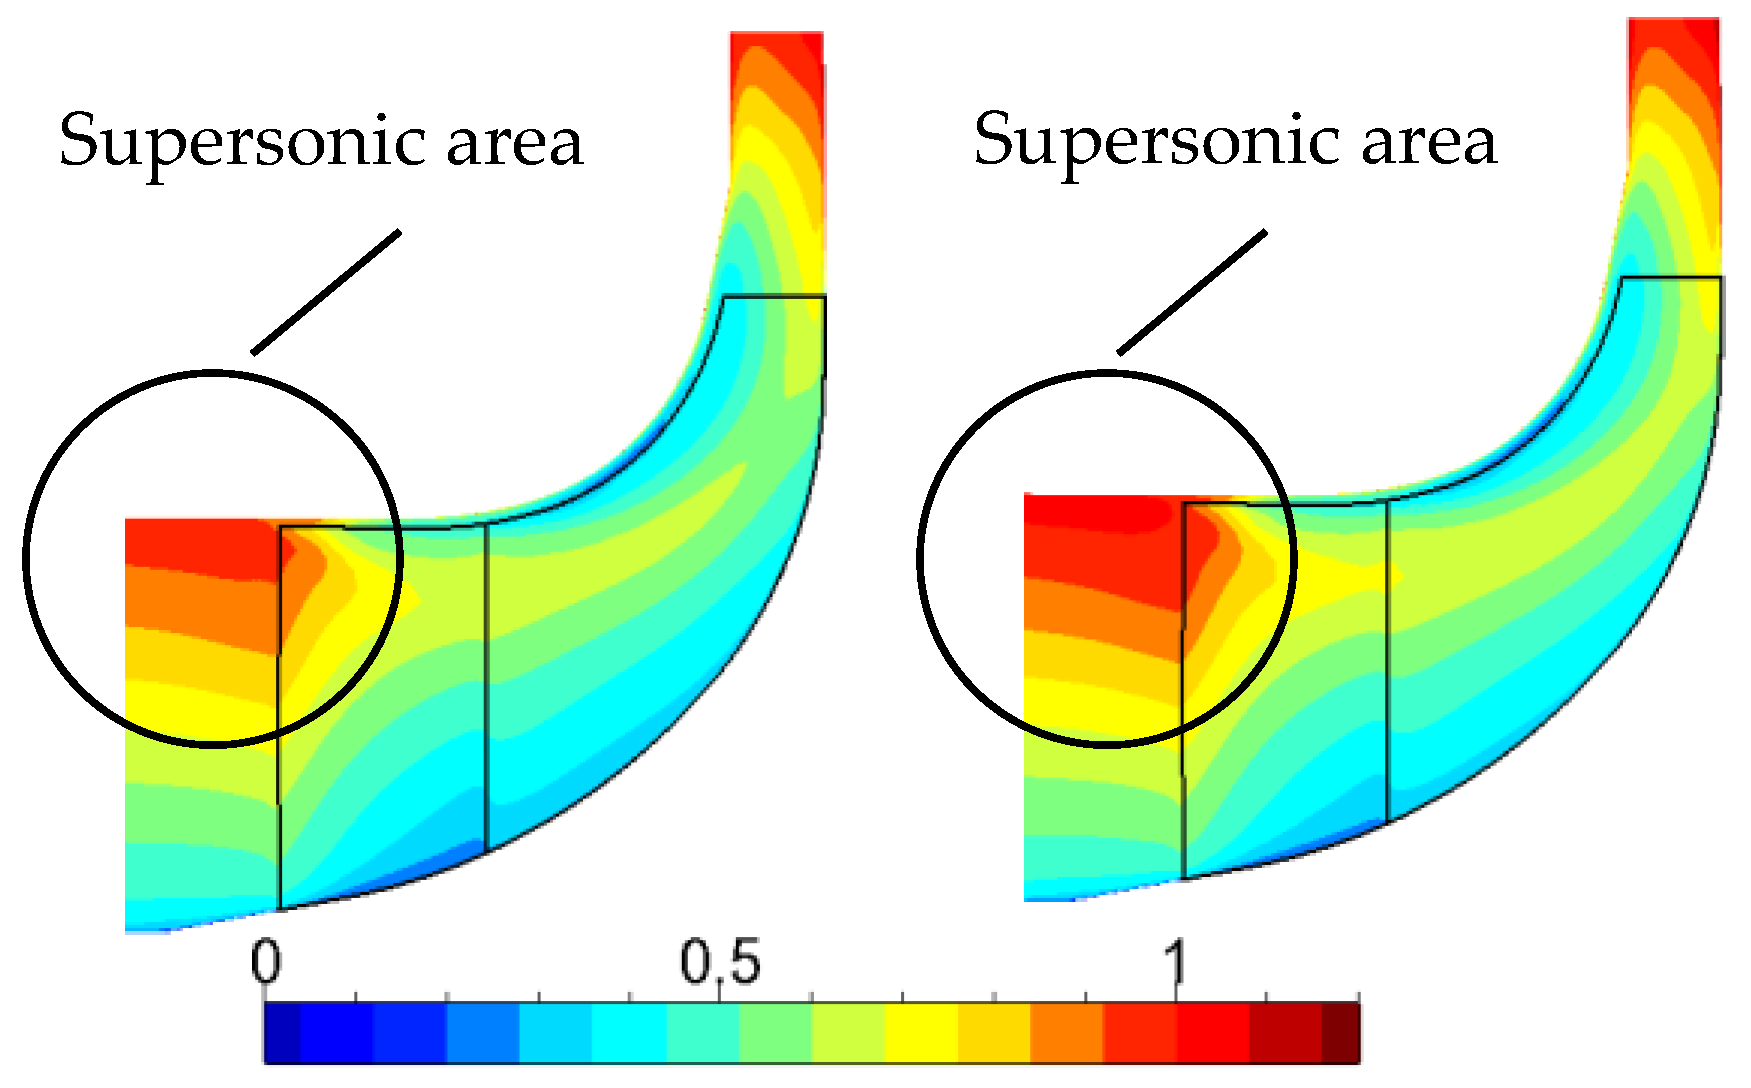
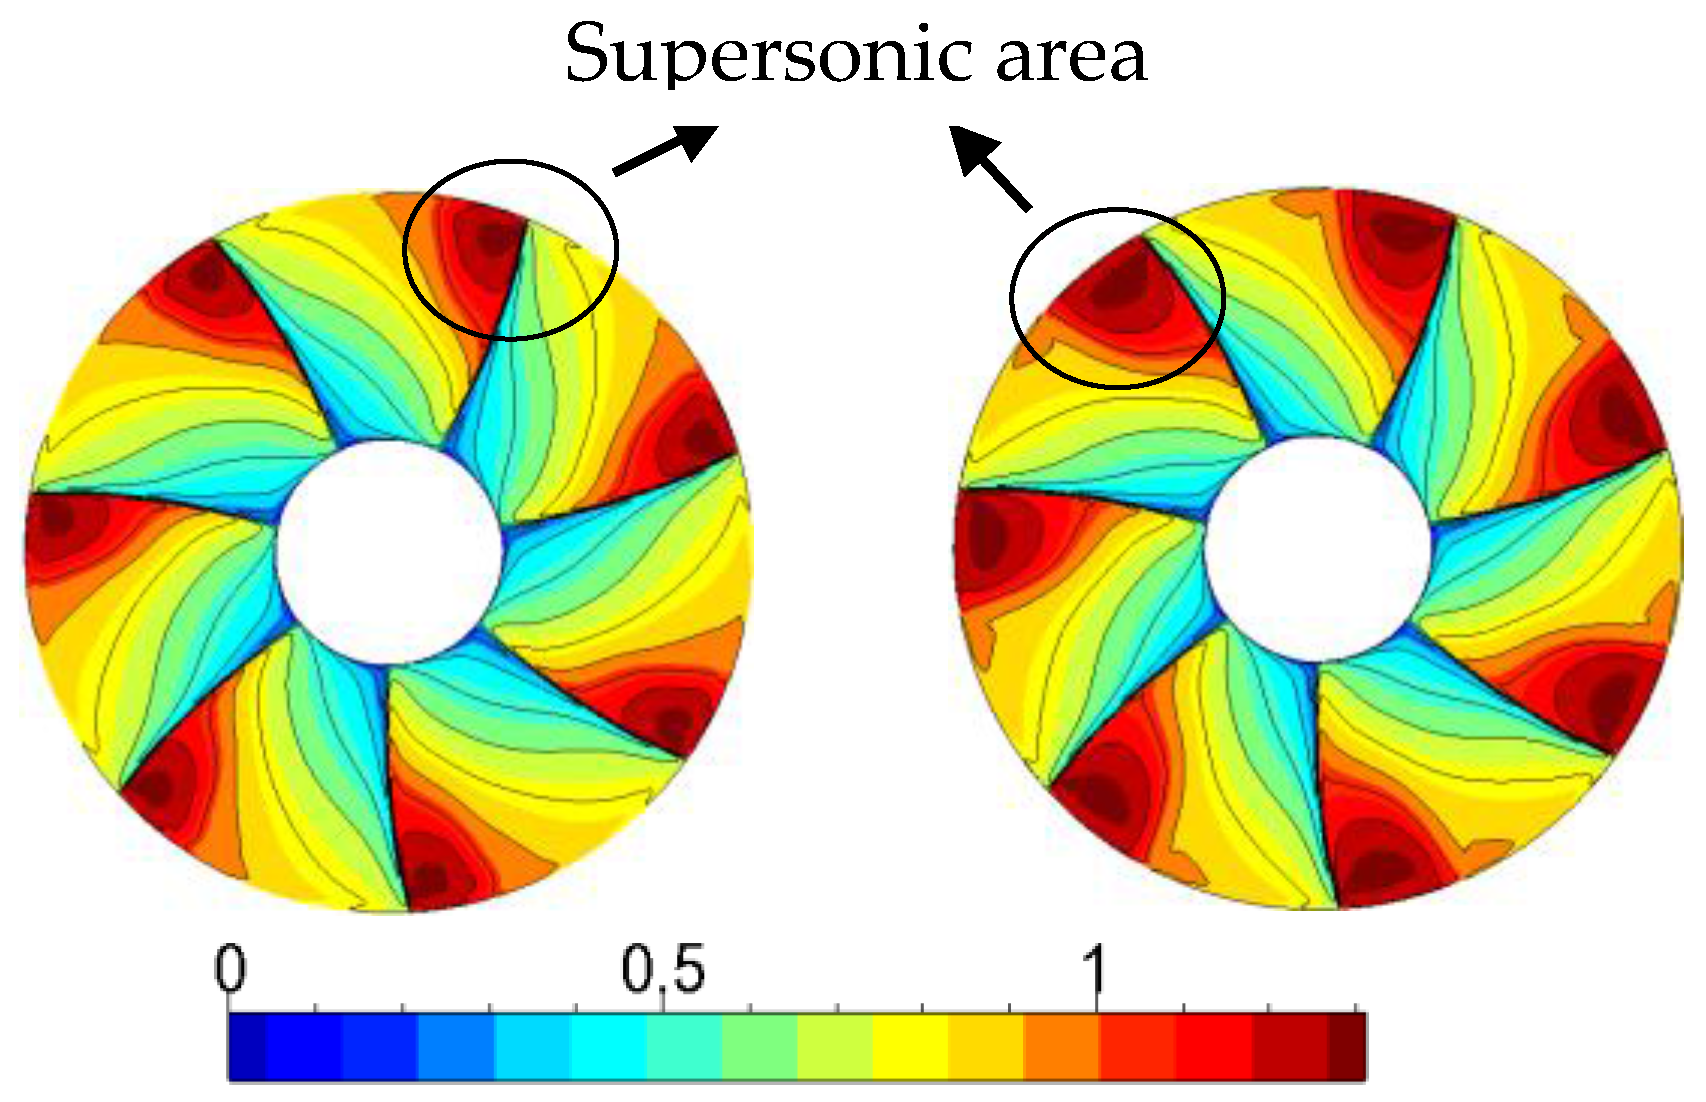
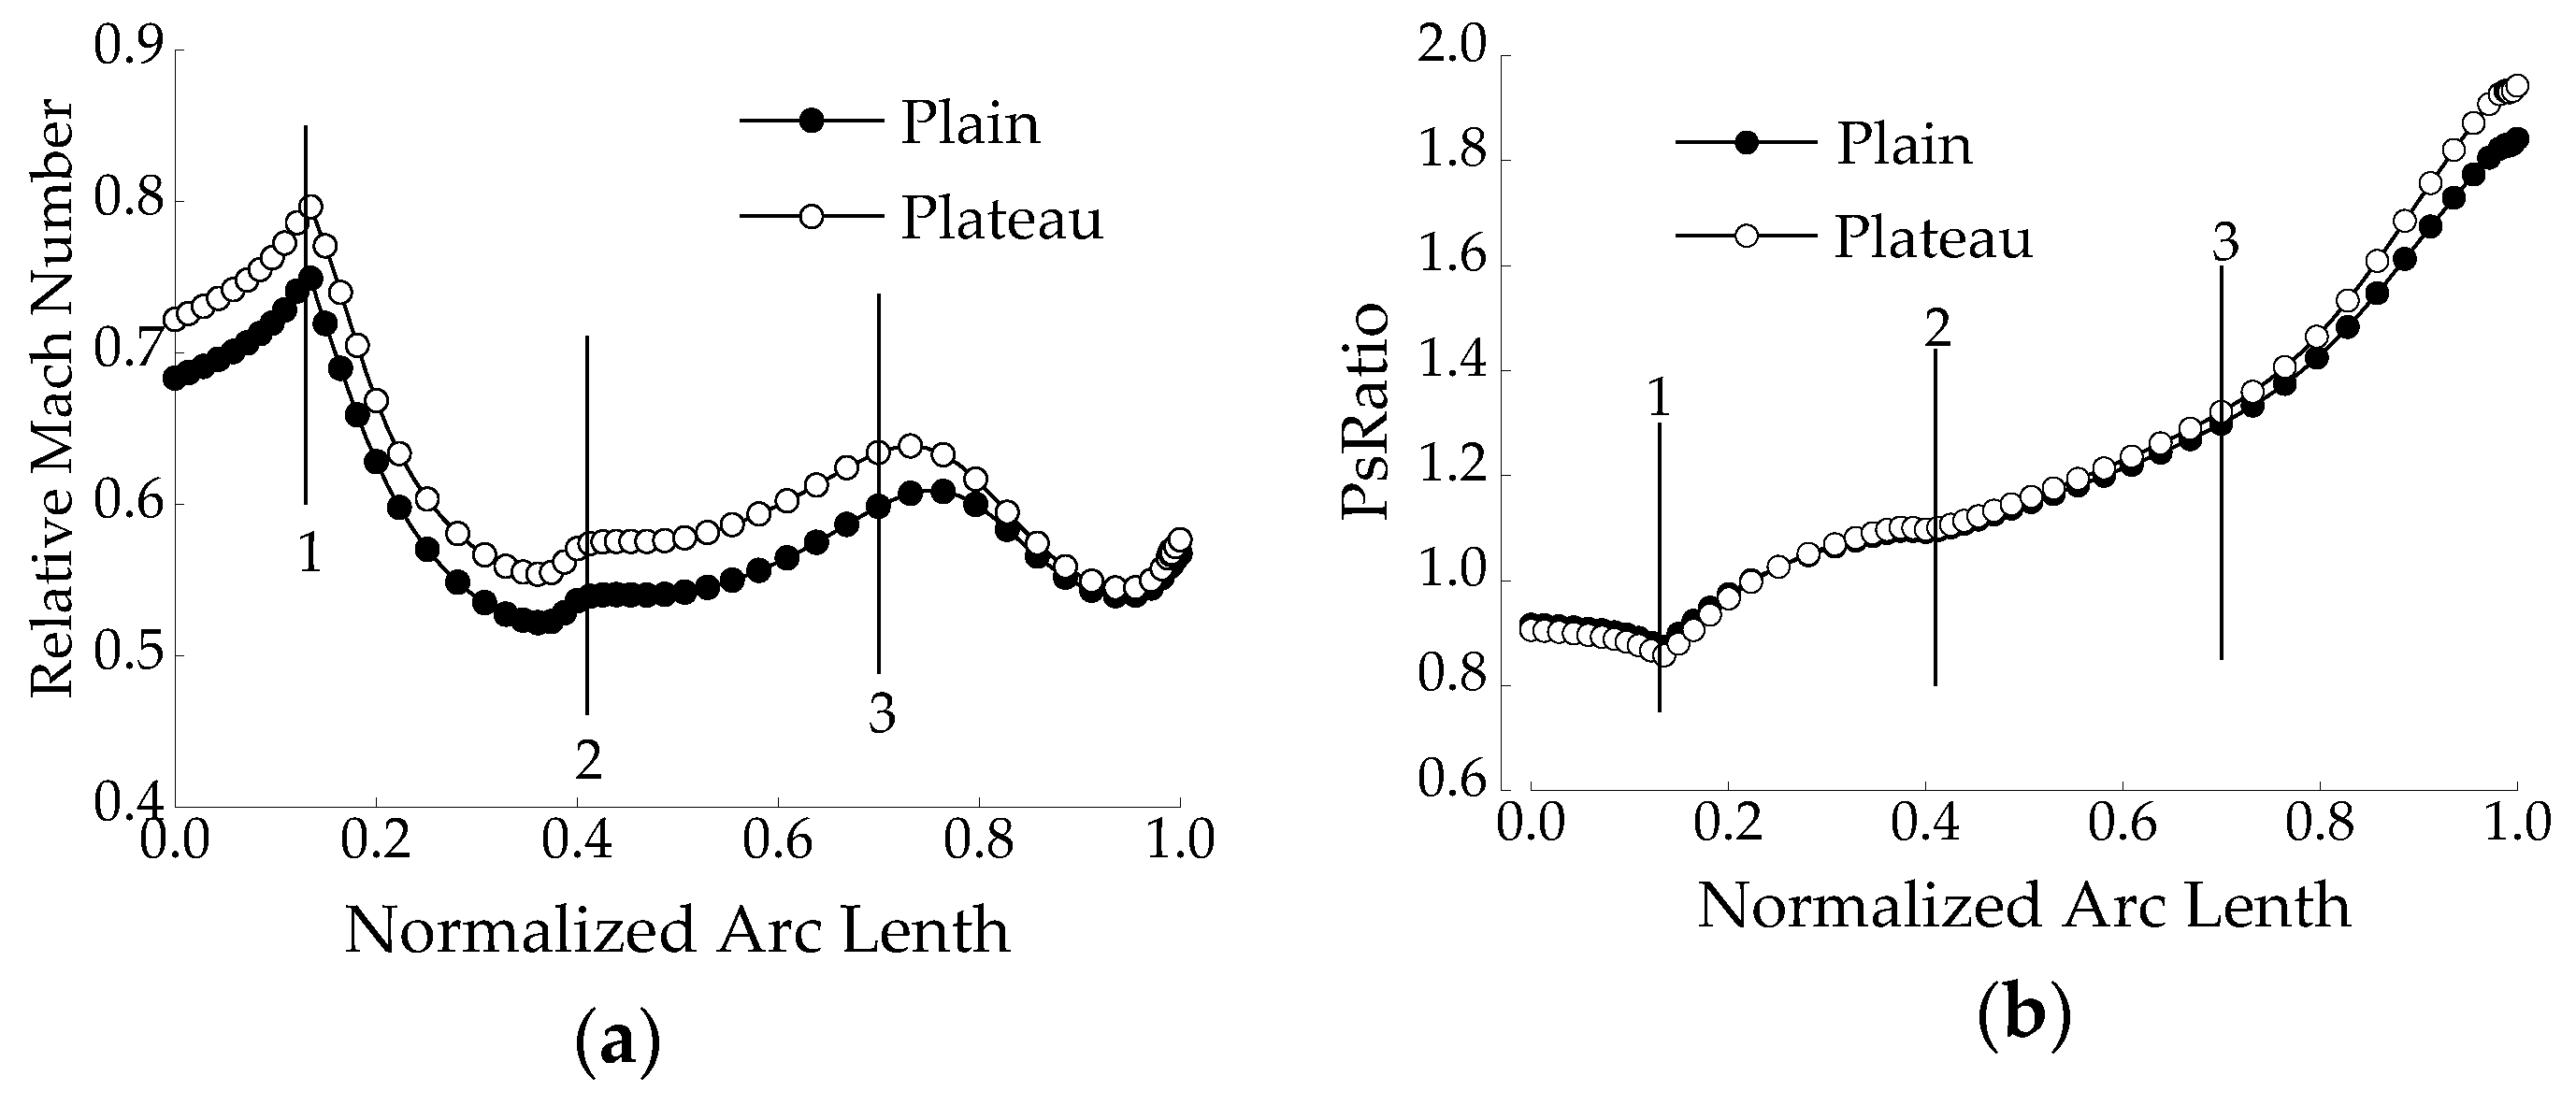
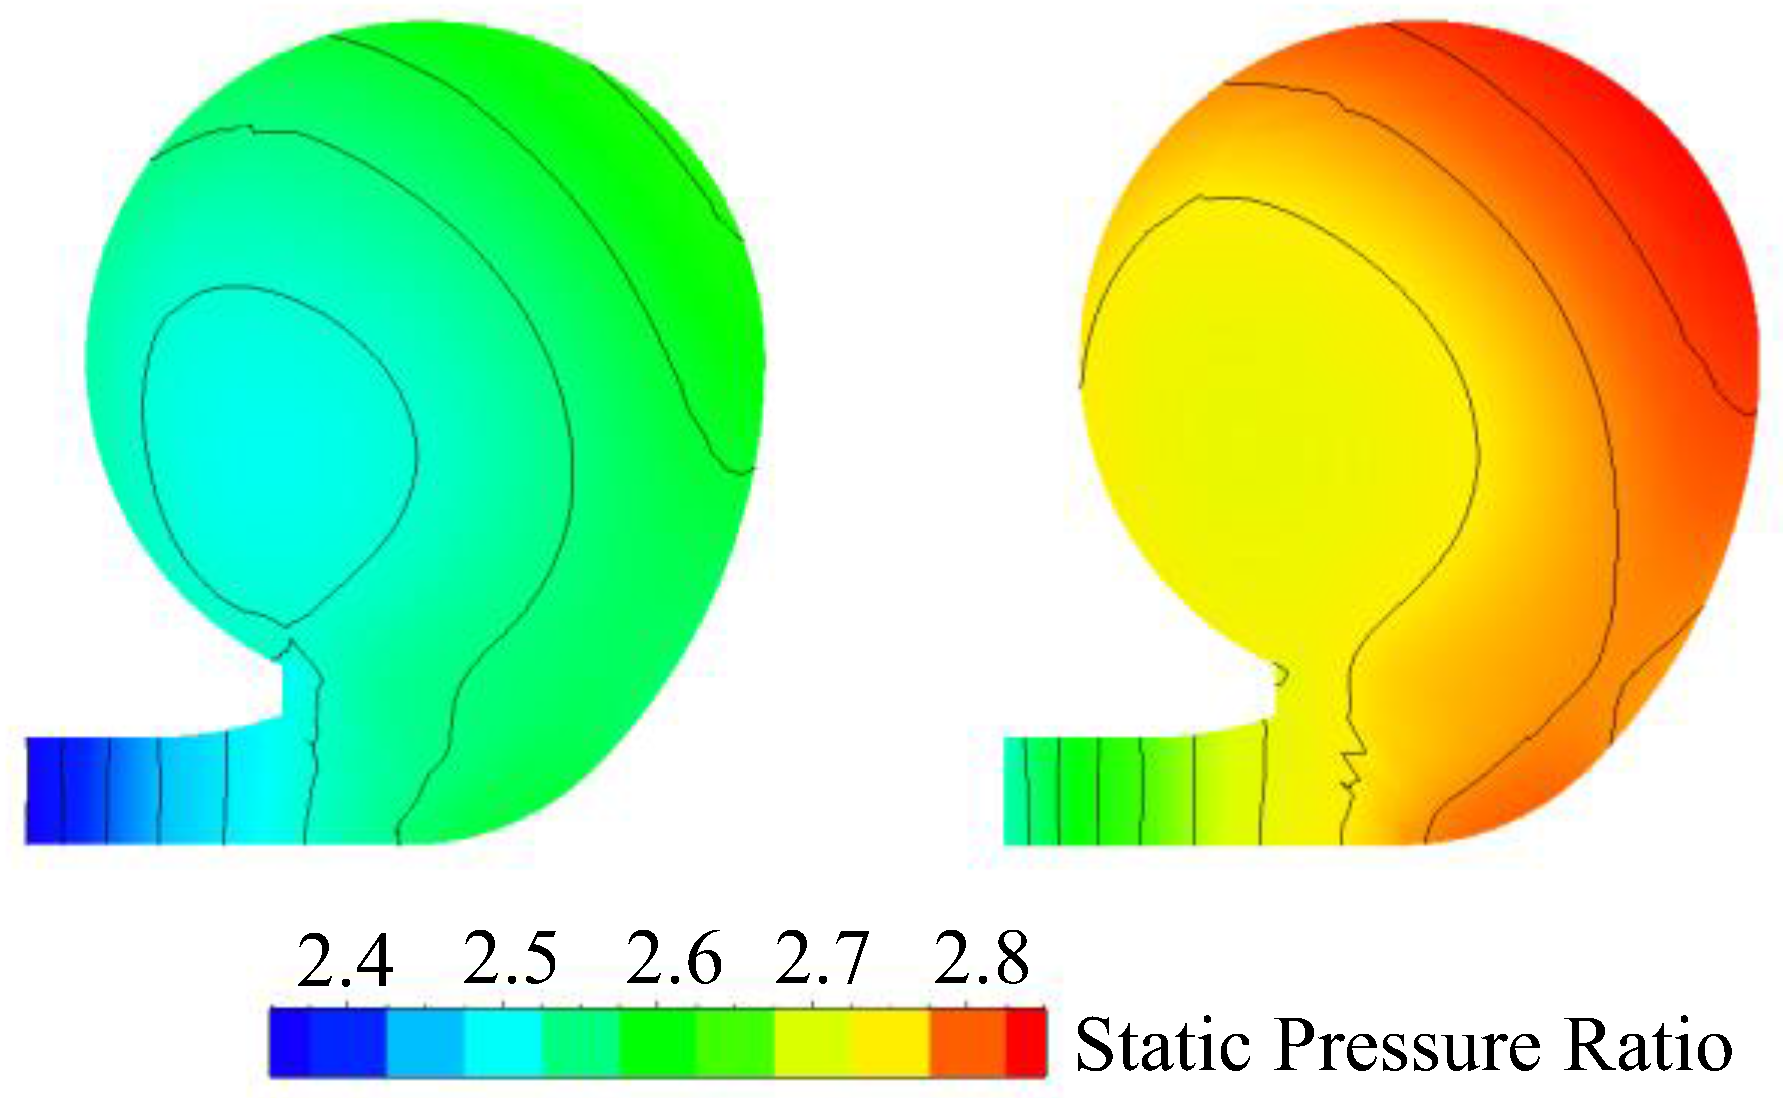
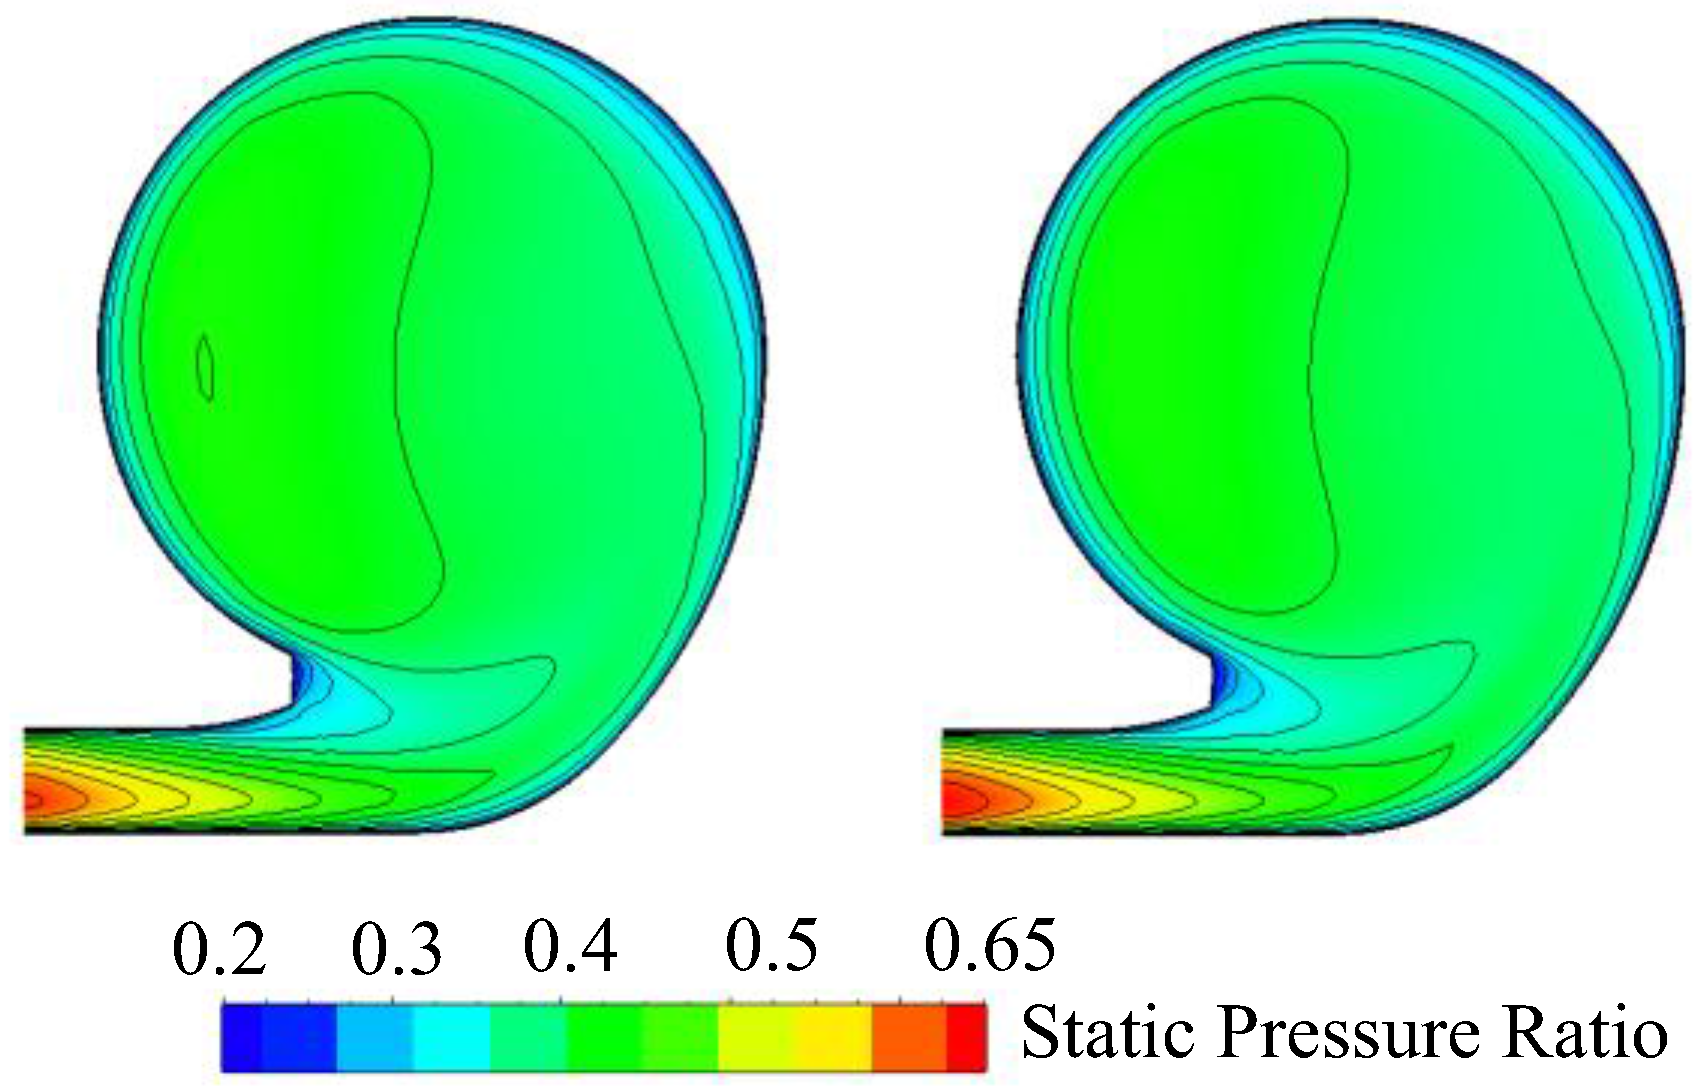
4.2. Internal Flow Analysis in the Compressor
4.3. Exergy Destruction and Flow Loss Analysis in the Impeller
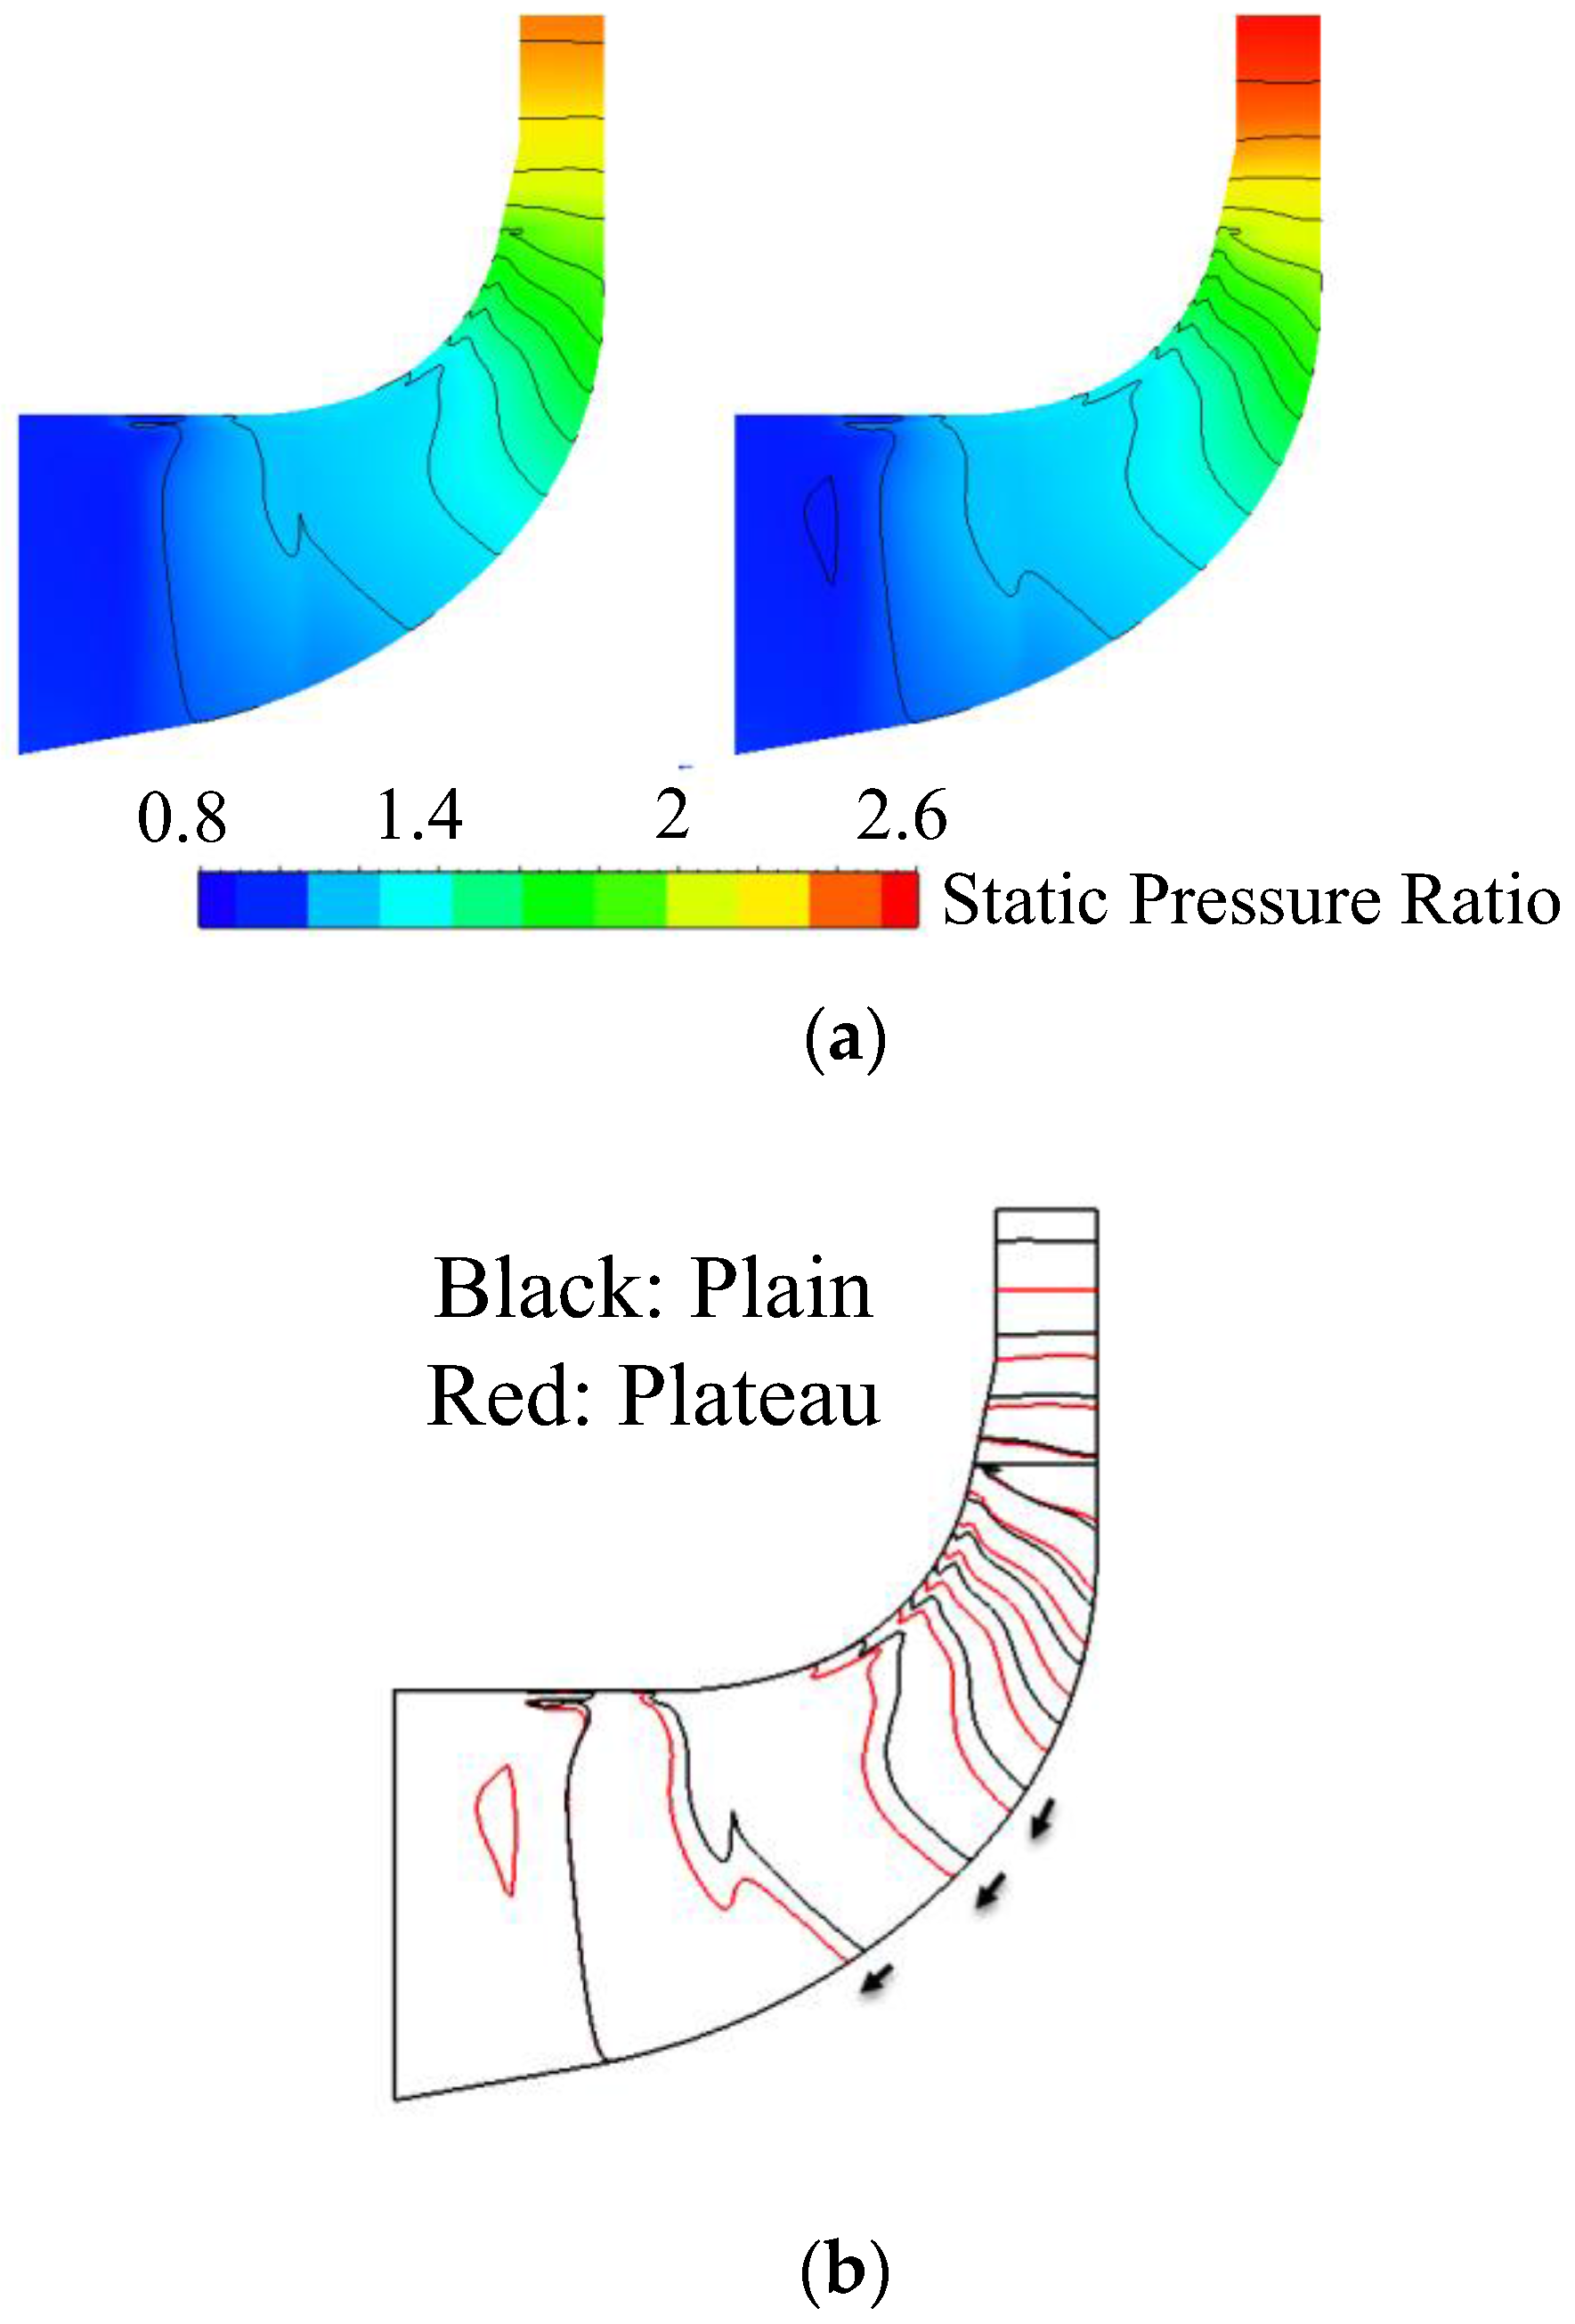
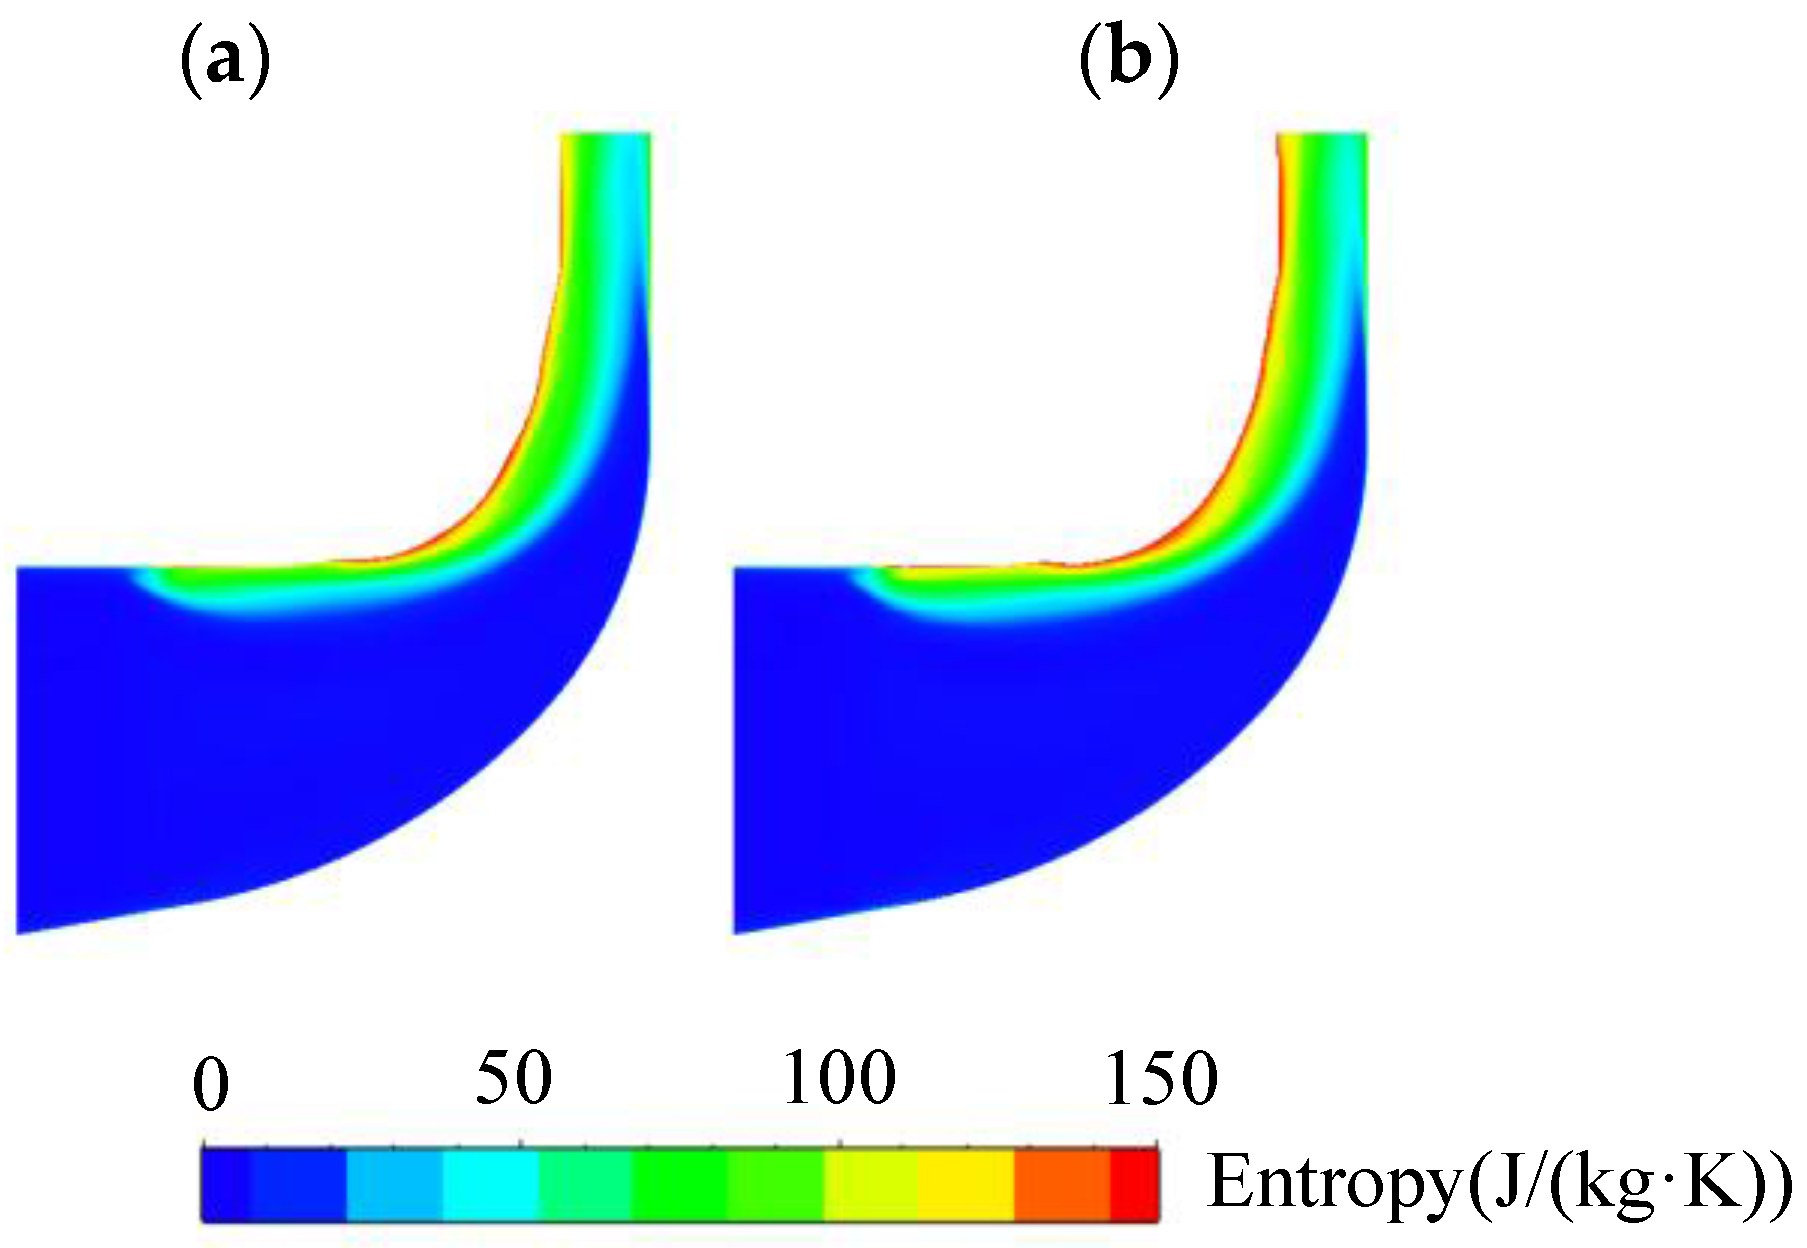
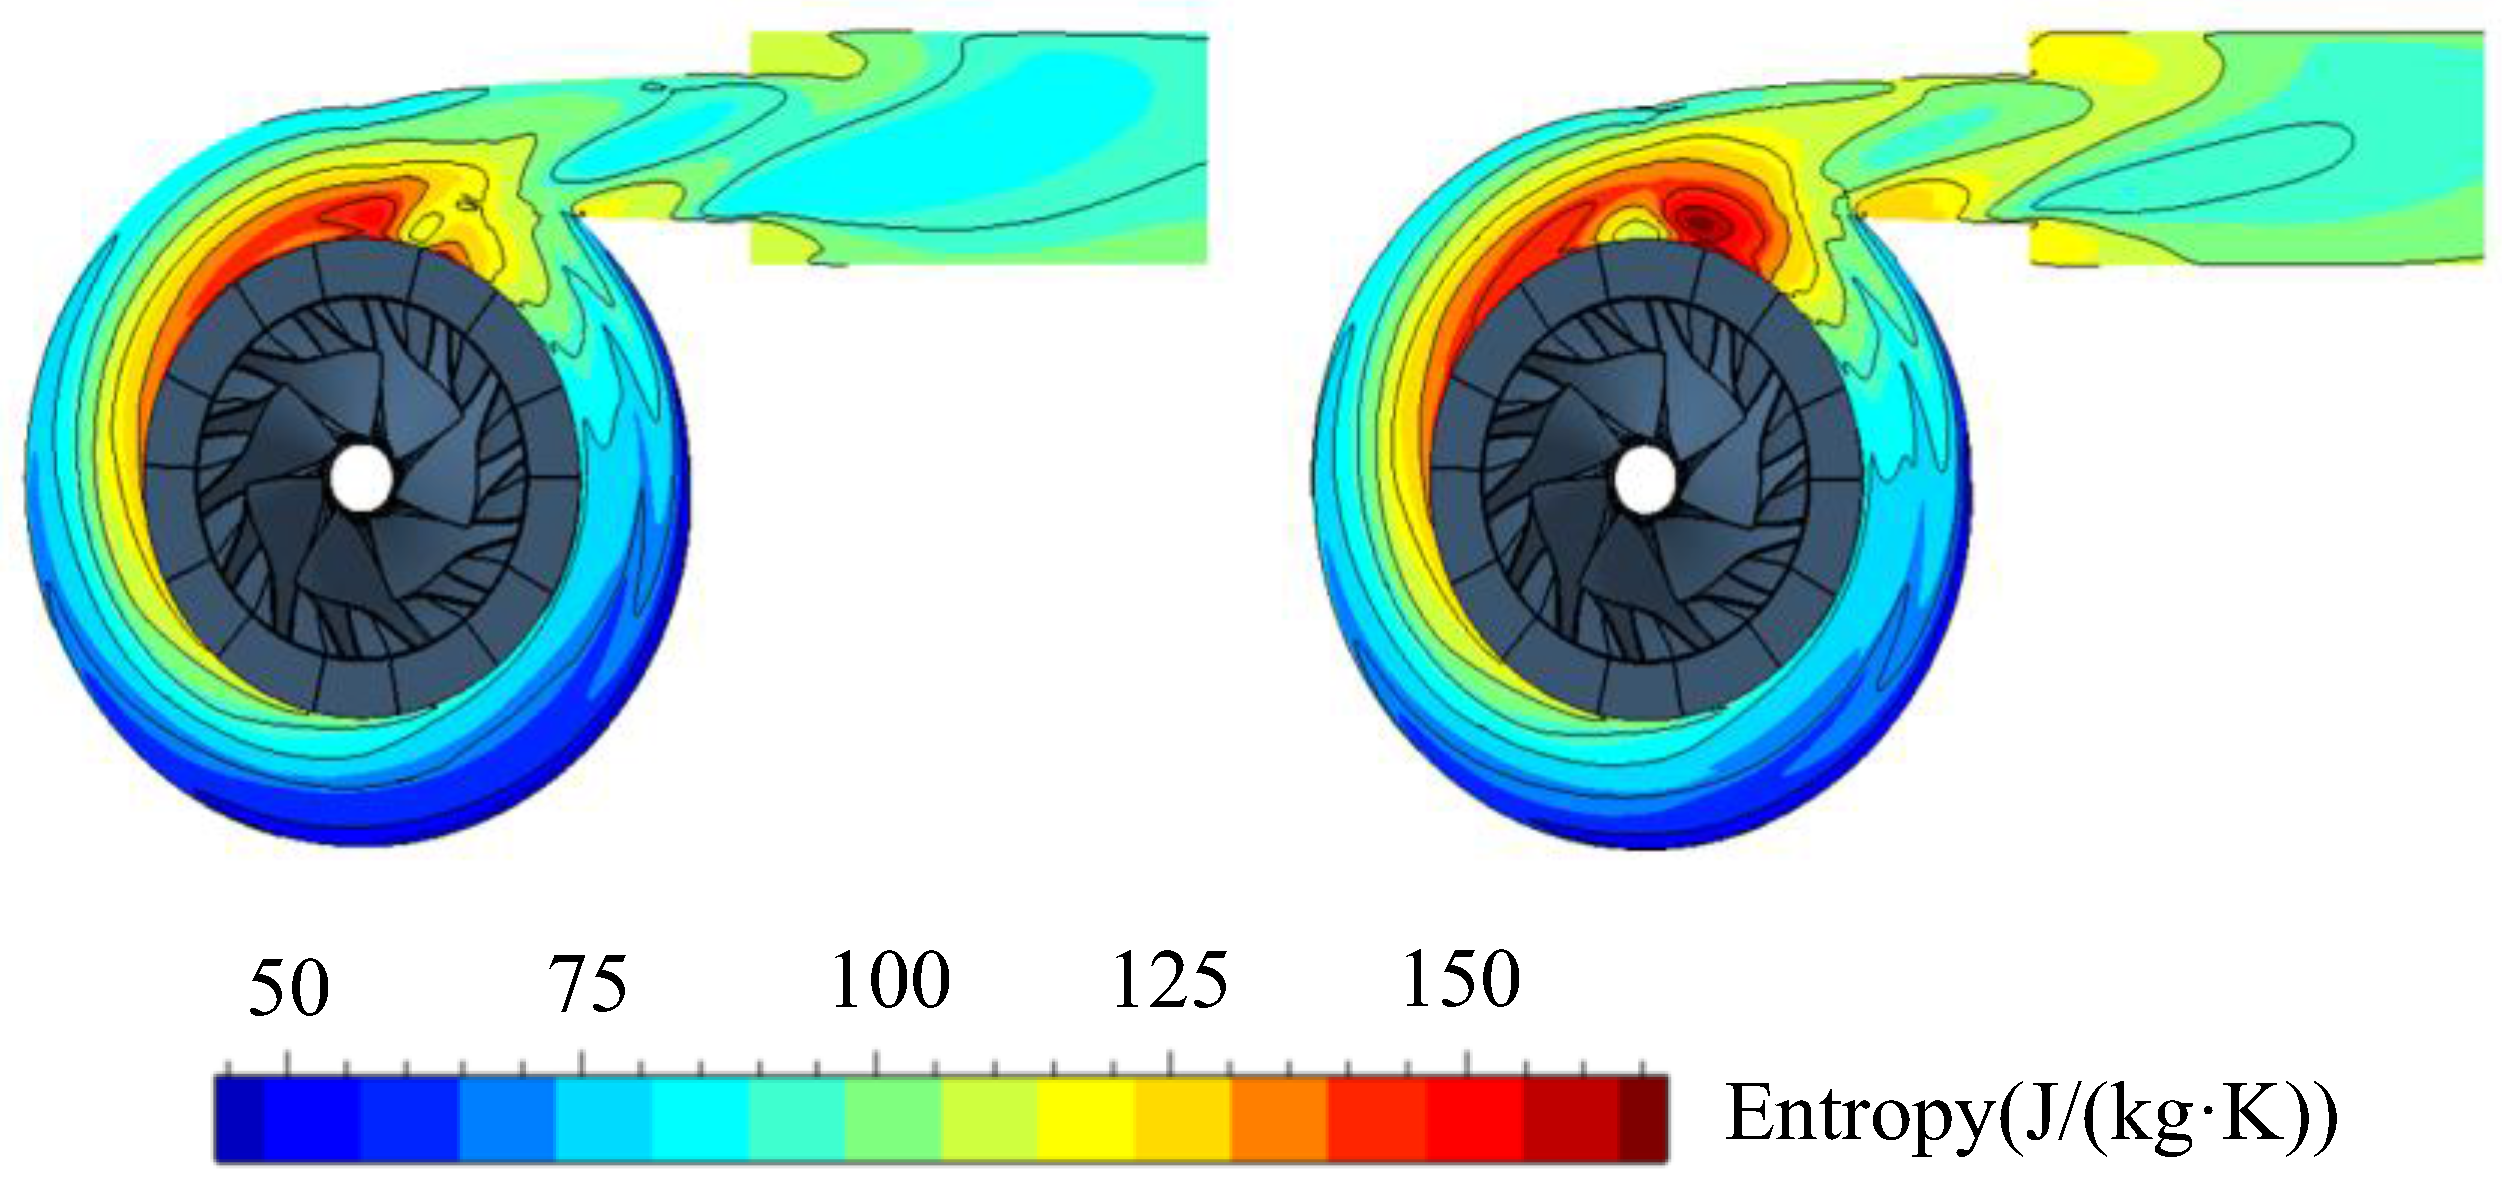
4.4. Loss Analysis of Impeller Downstream
5. Conclusions
- (1)
- The high altitude work environment has remarkable effects on exhaust gas energy utilization for a vehicle turbocharger. The compressor inlet conditions change with altitude, which influences turbocharger compressor pressure ratio and efficiency features. The results show that with the increase of altitude from 0 m to 4500 m, the peak efficiency of the compressor is reduced by 2.4%, while the peak pressure ratio is increased by 7%. With the increase of altitude, the Reynolds number decreases and air viscous force increases significantly, which causes the efficiency of the compressor to drop obviously.
- (2)
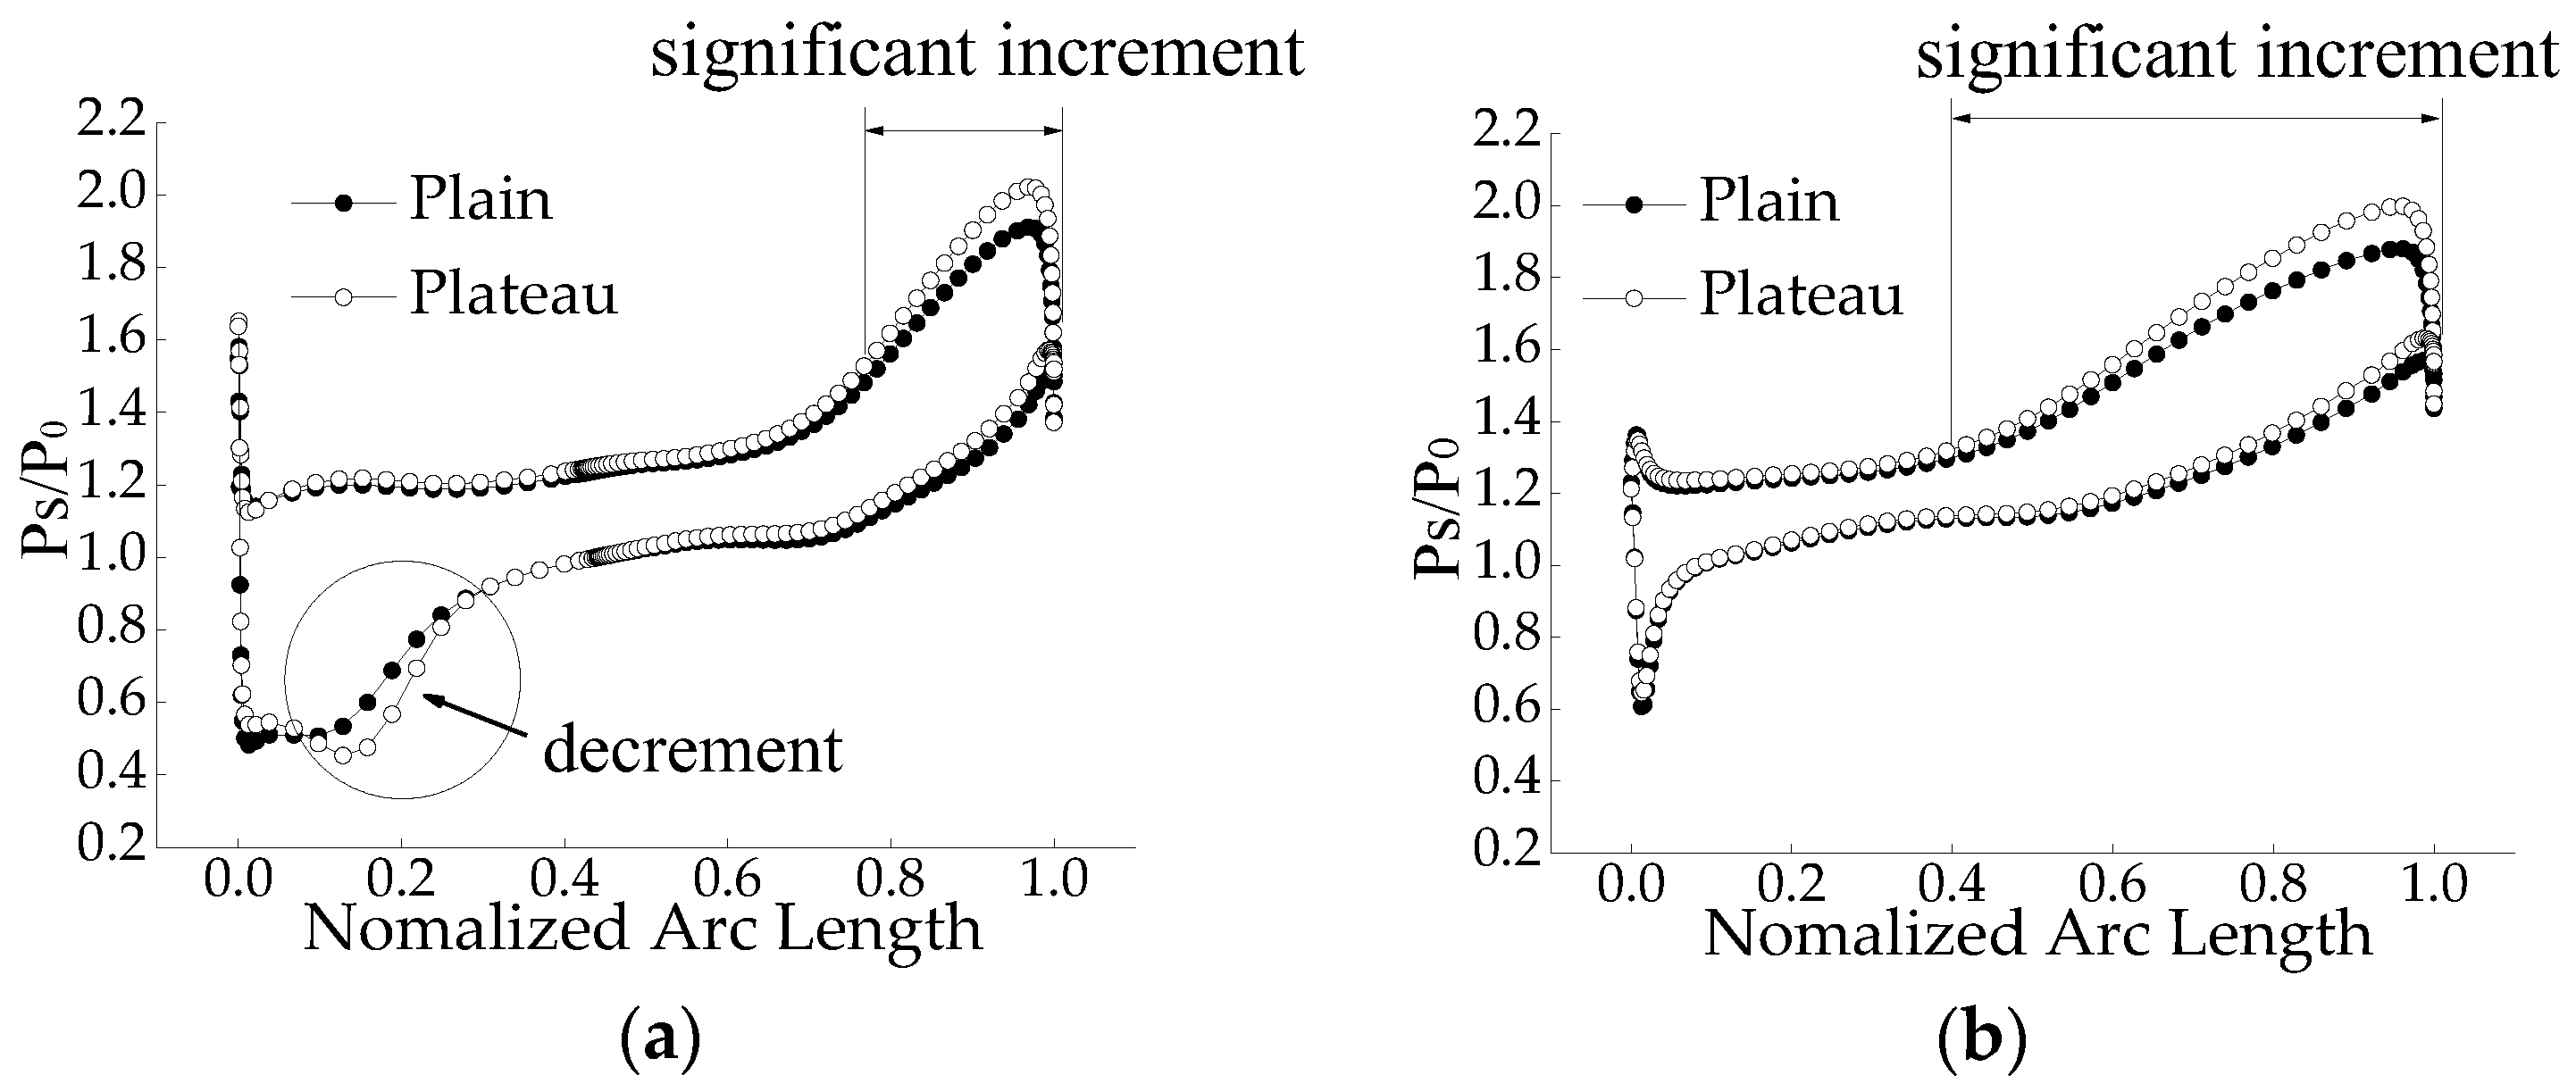
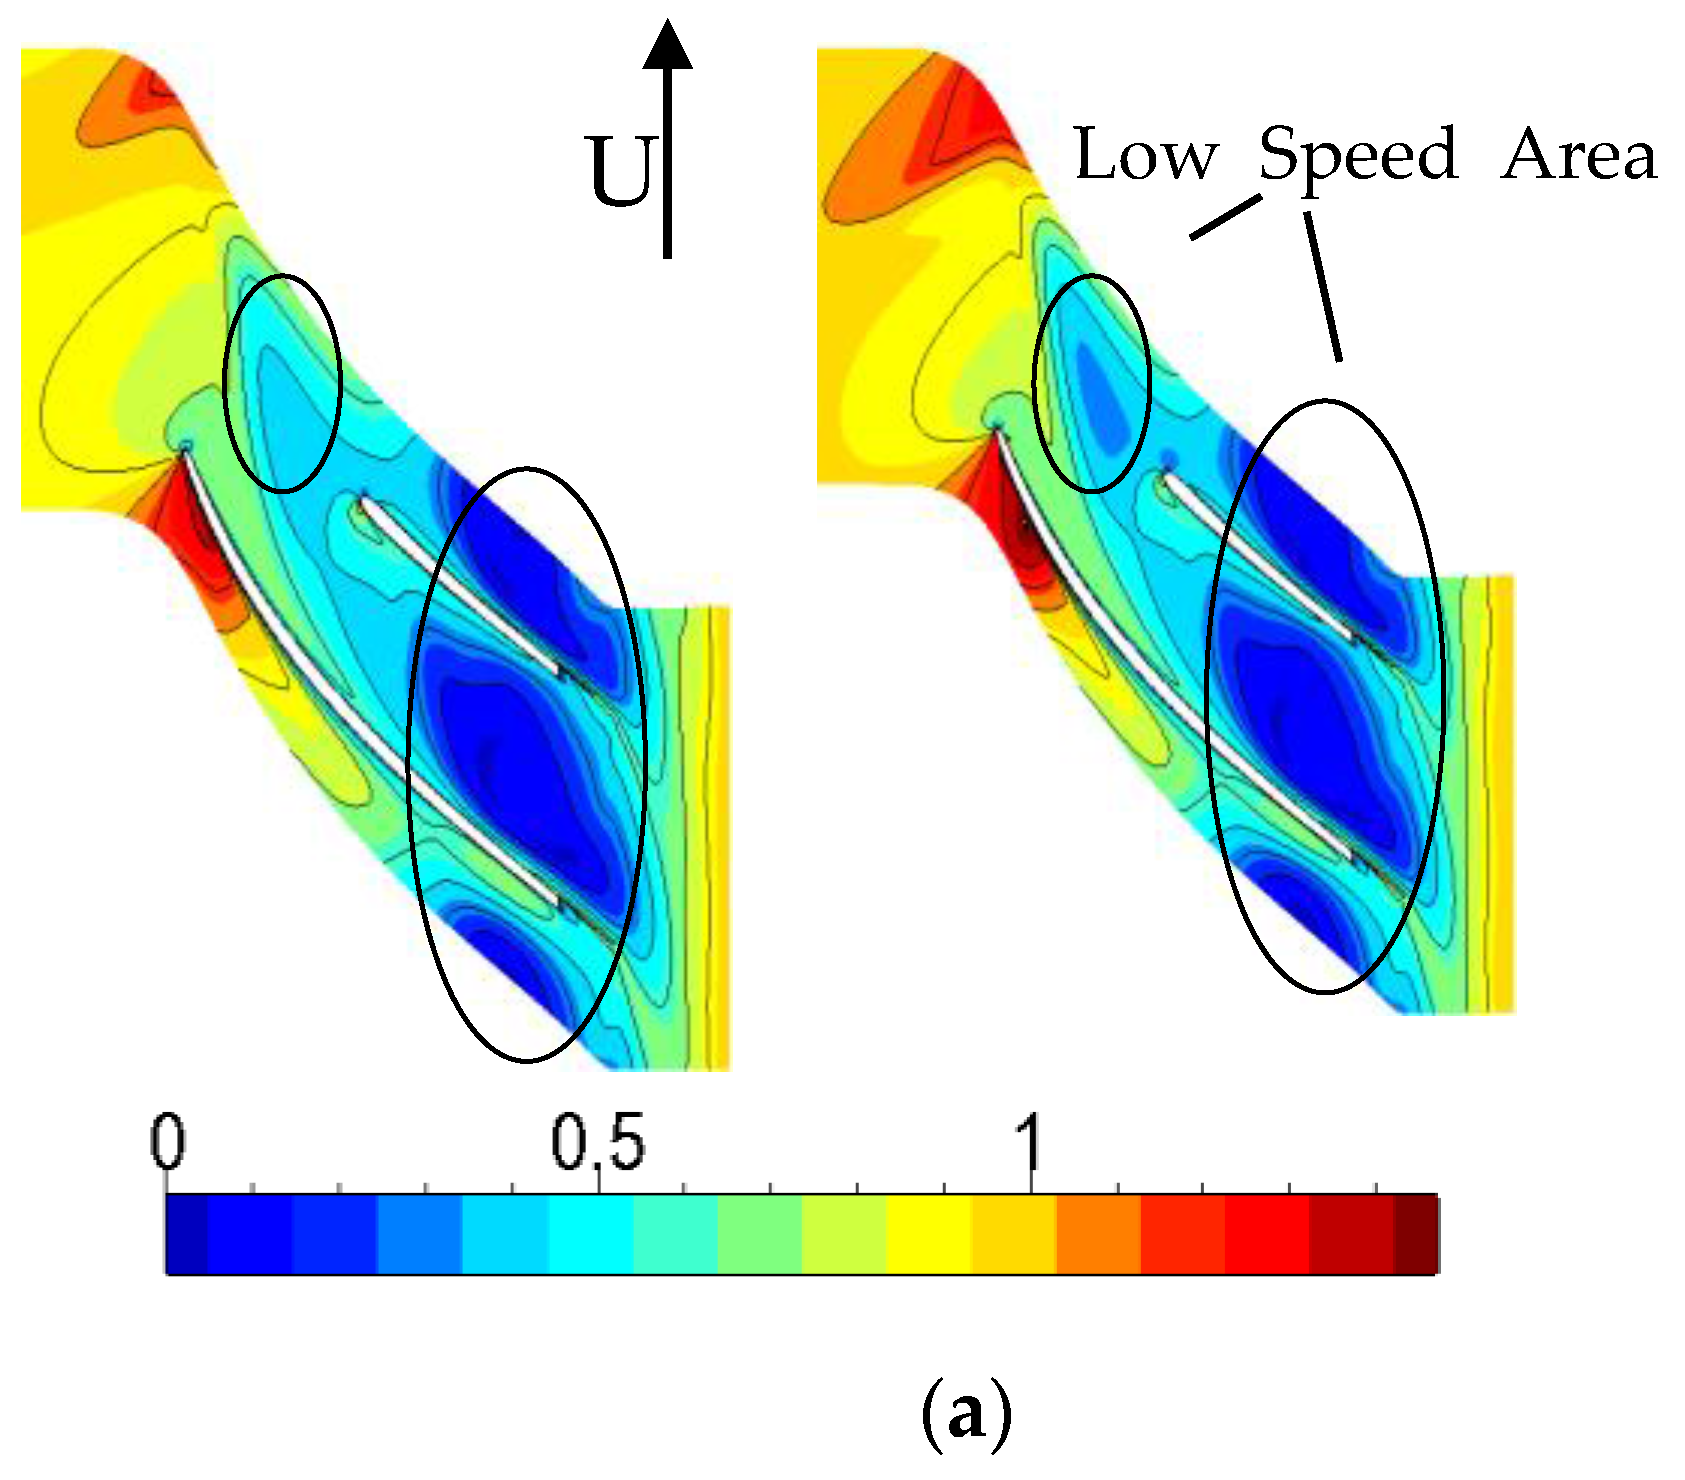
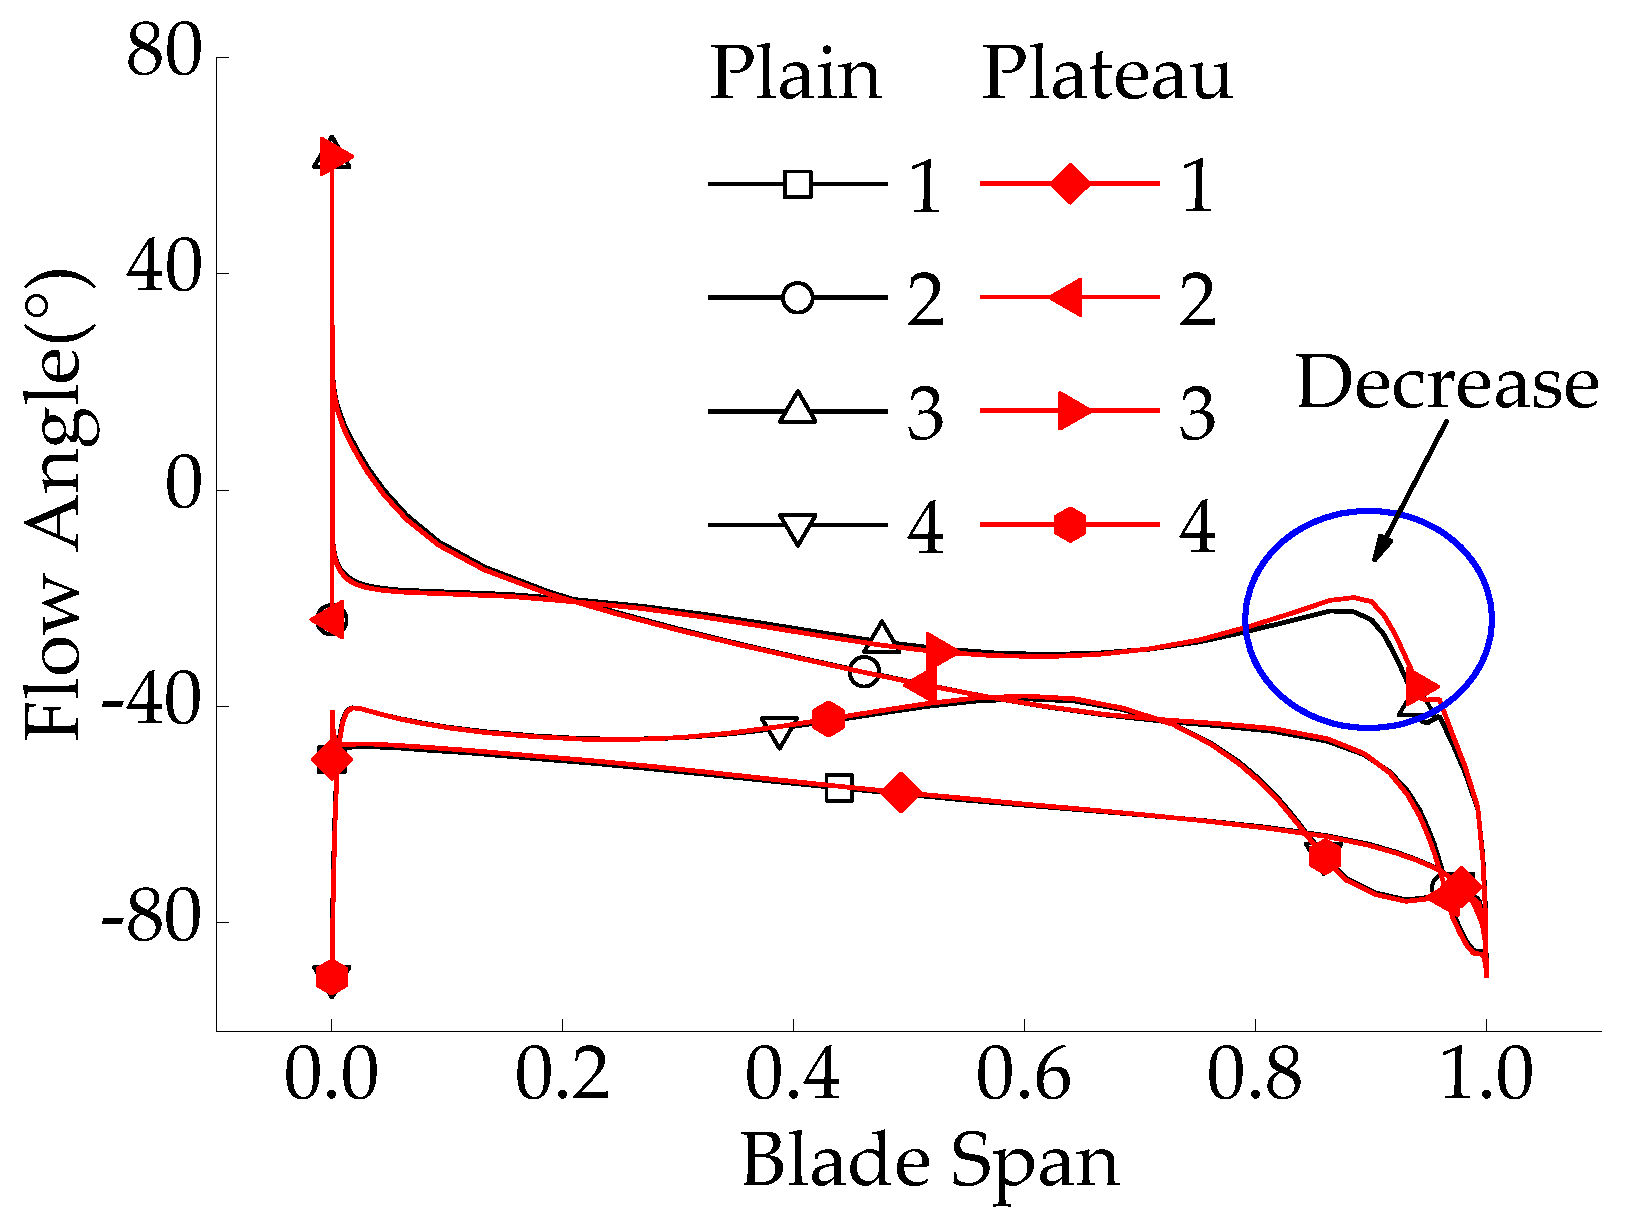
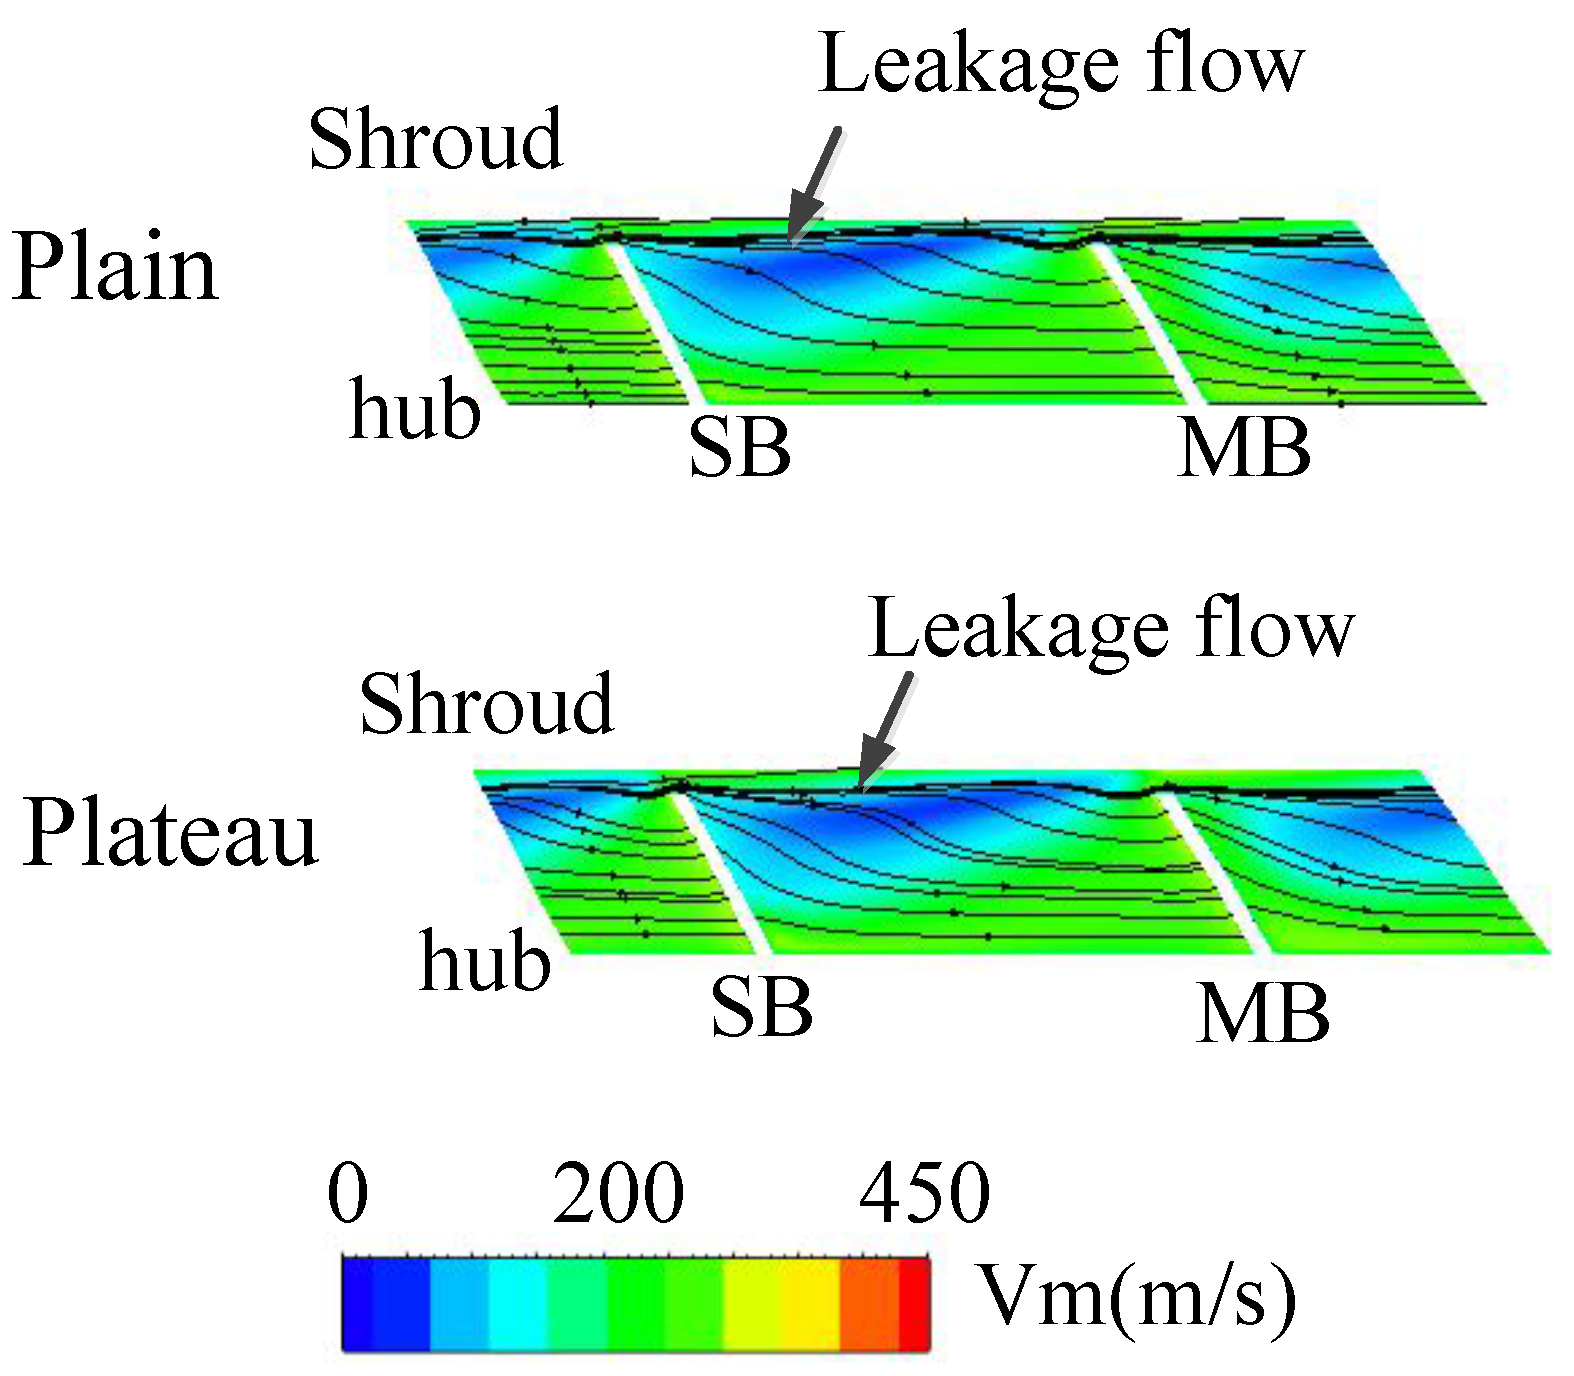
- From the detailed internal flow analysis in compressor, the main reasons for the low efficiency under the condition of the plateau environment include: the shock loss is increasing at the leading edge and the leakage flow loss is more intense at the downstream. The main blade load is more sensitive to the altitude, and it has obvious change at the downstream of the pressure side and upstream of the suction side.
- (3)
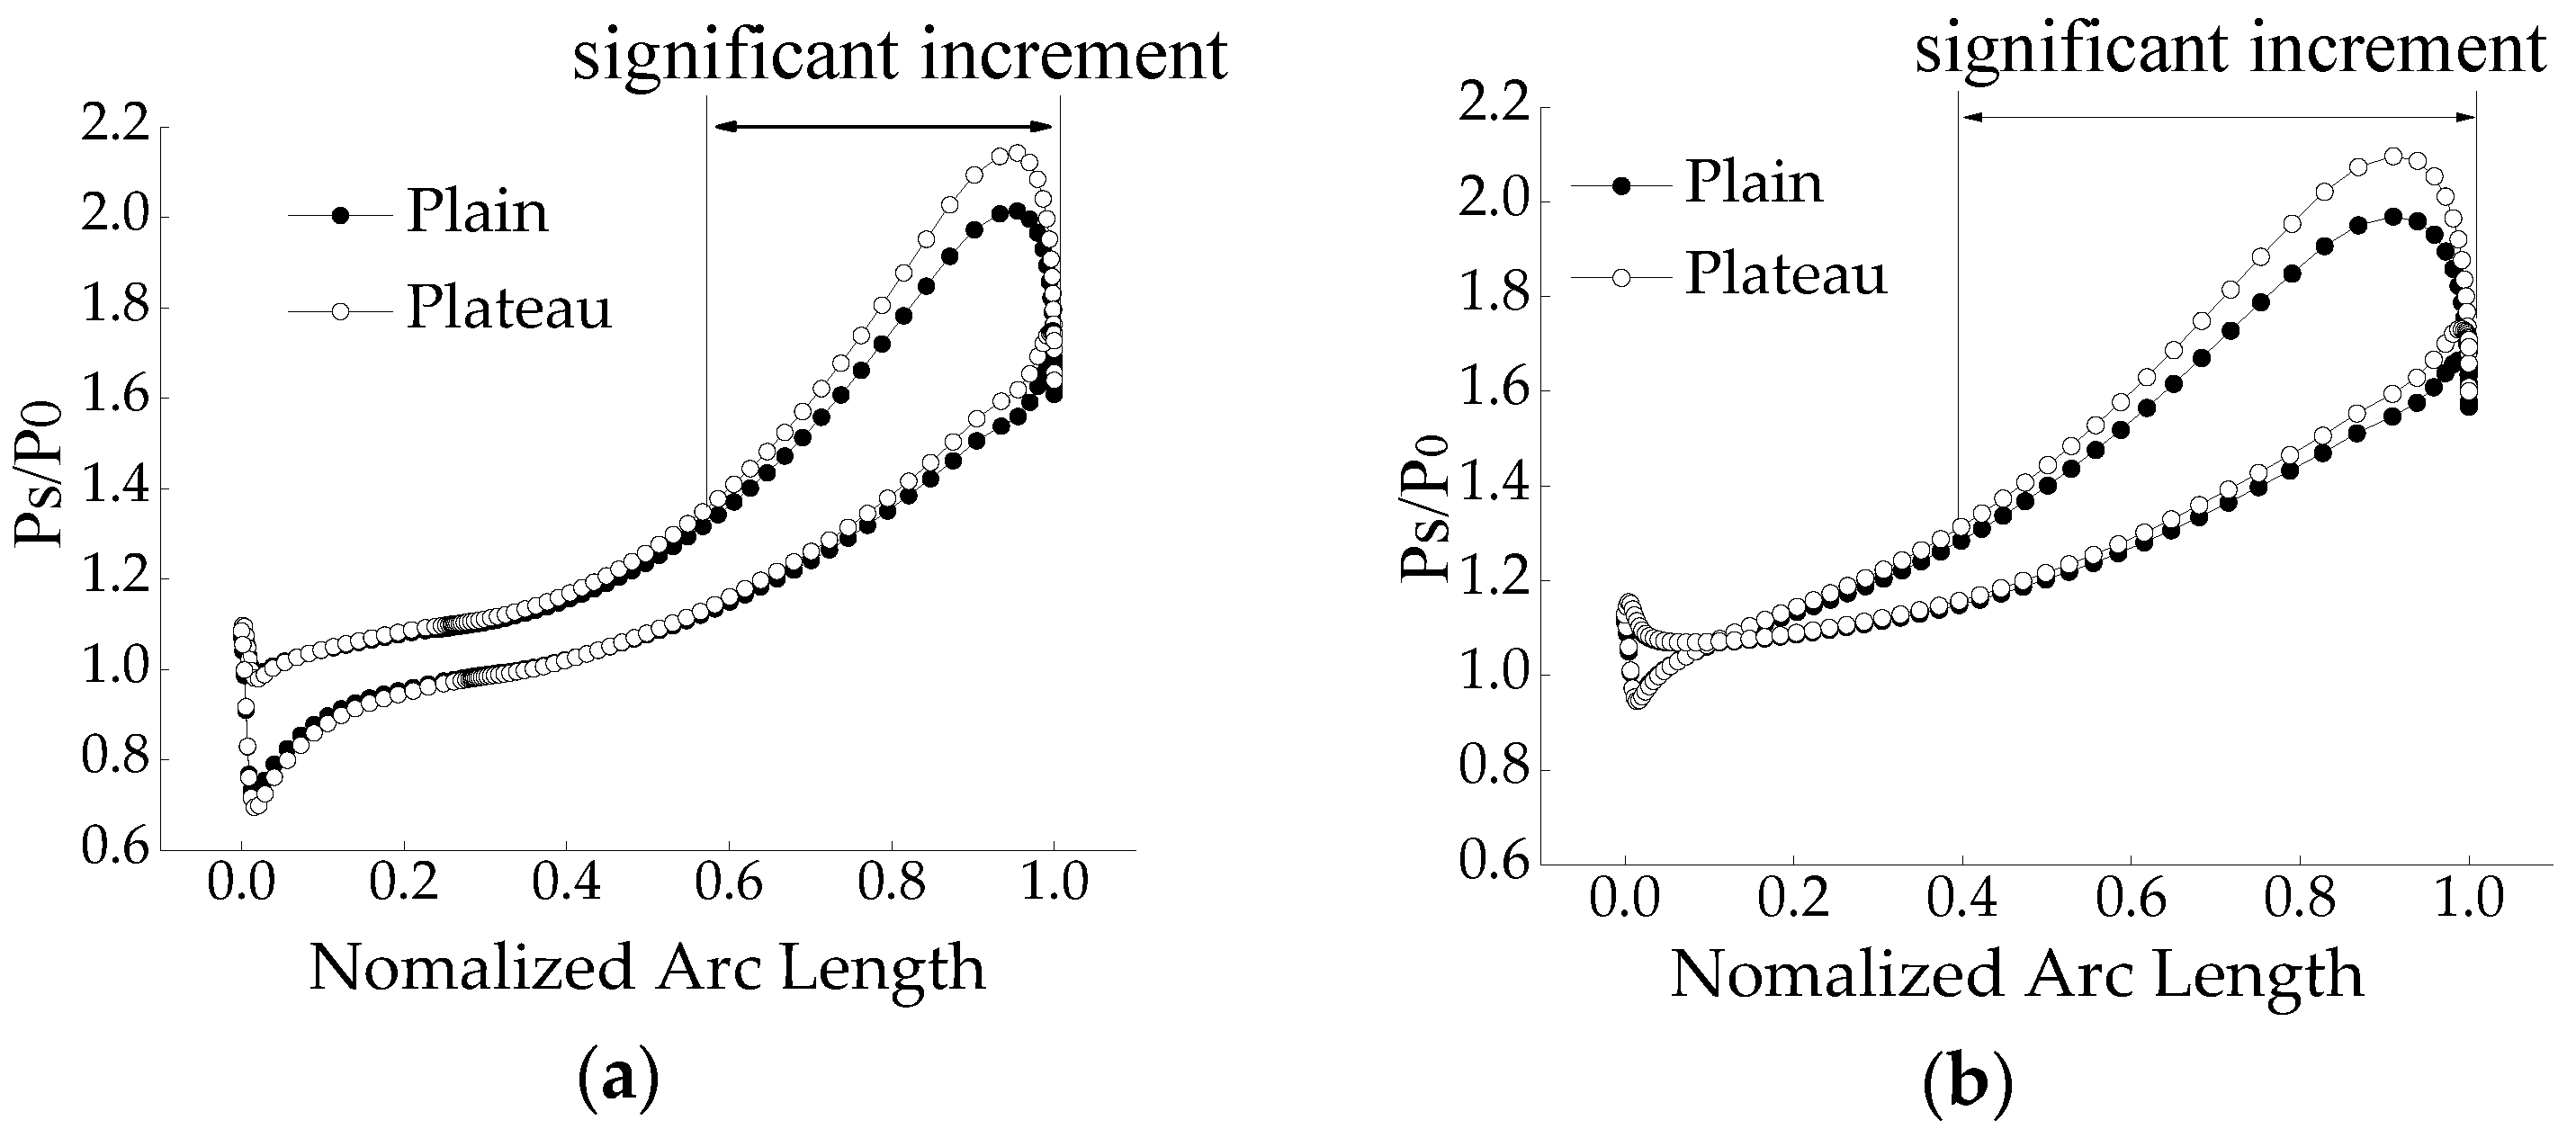
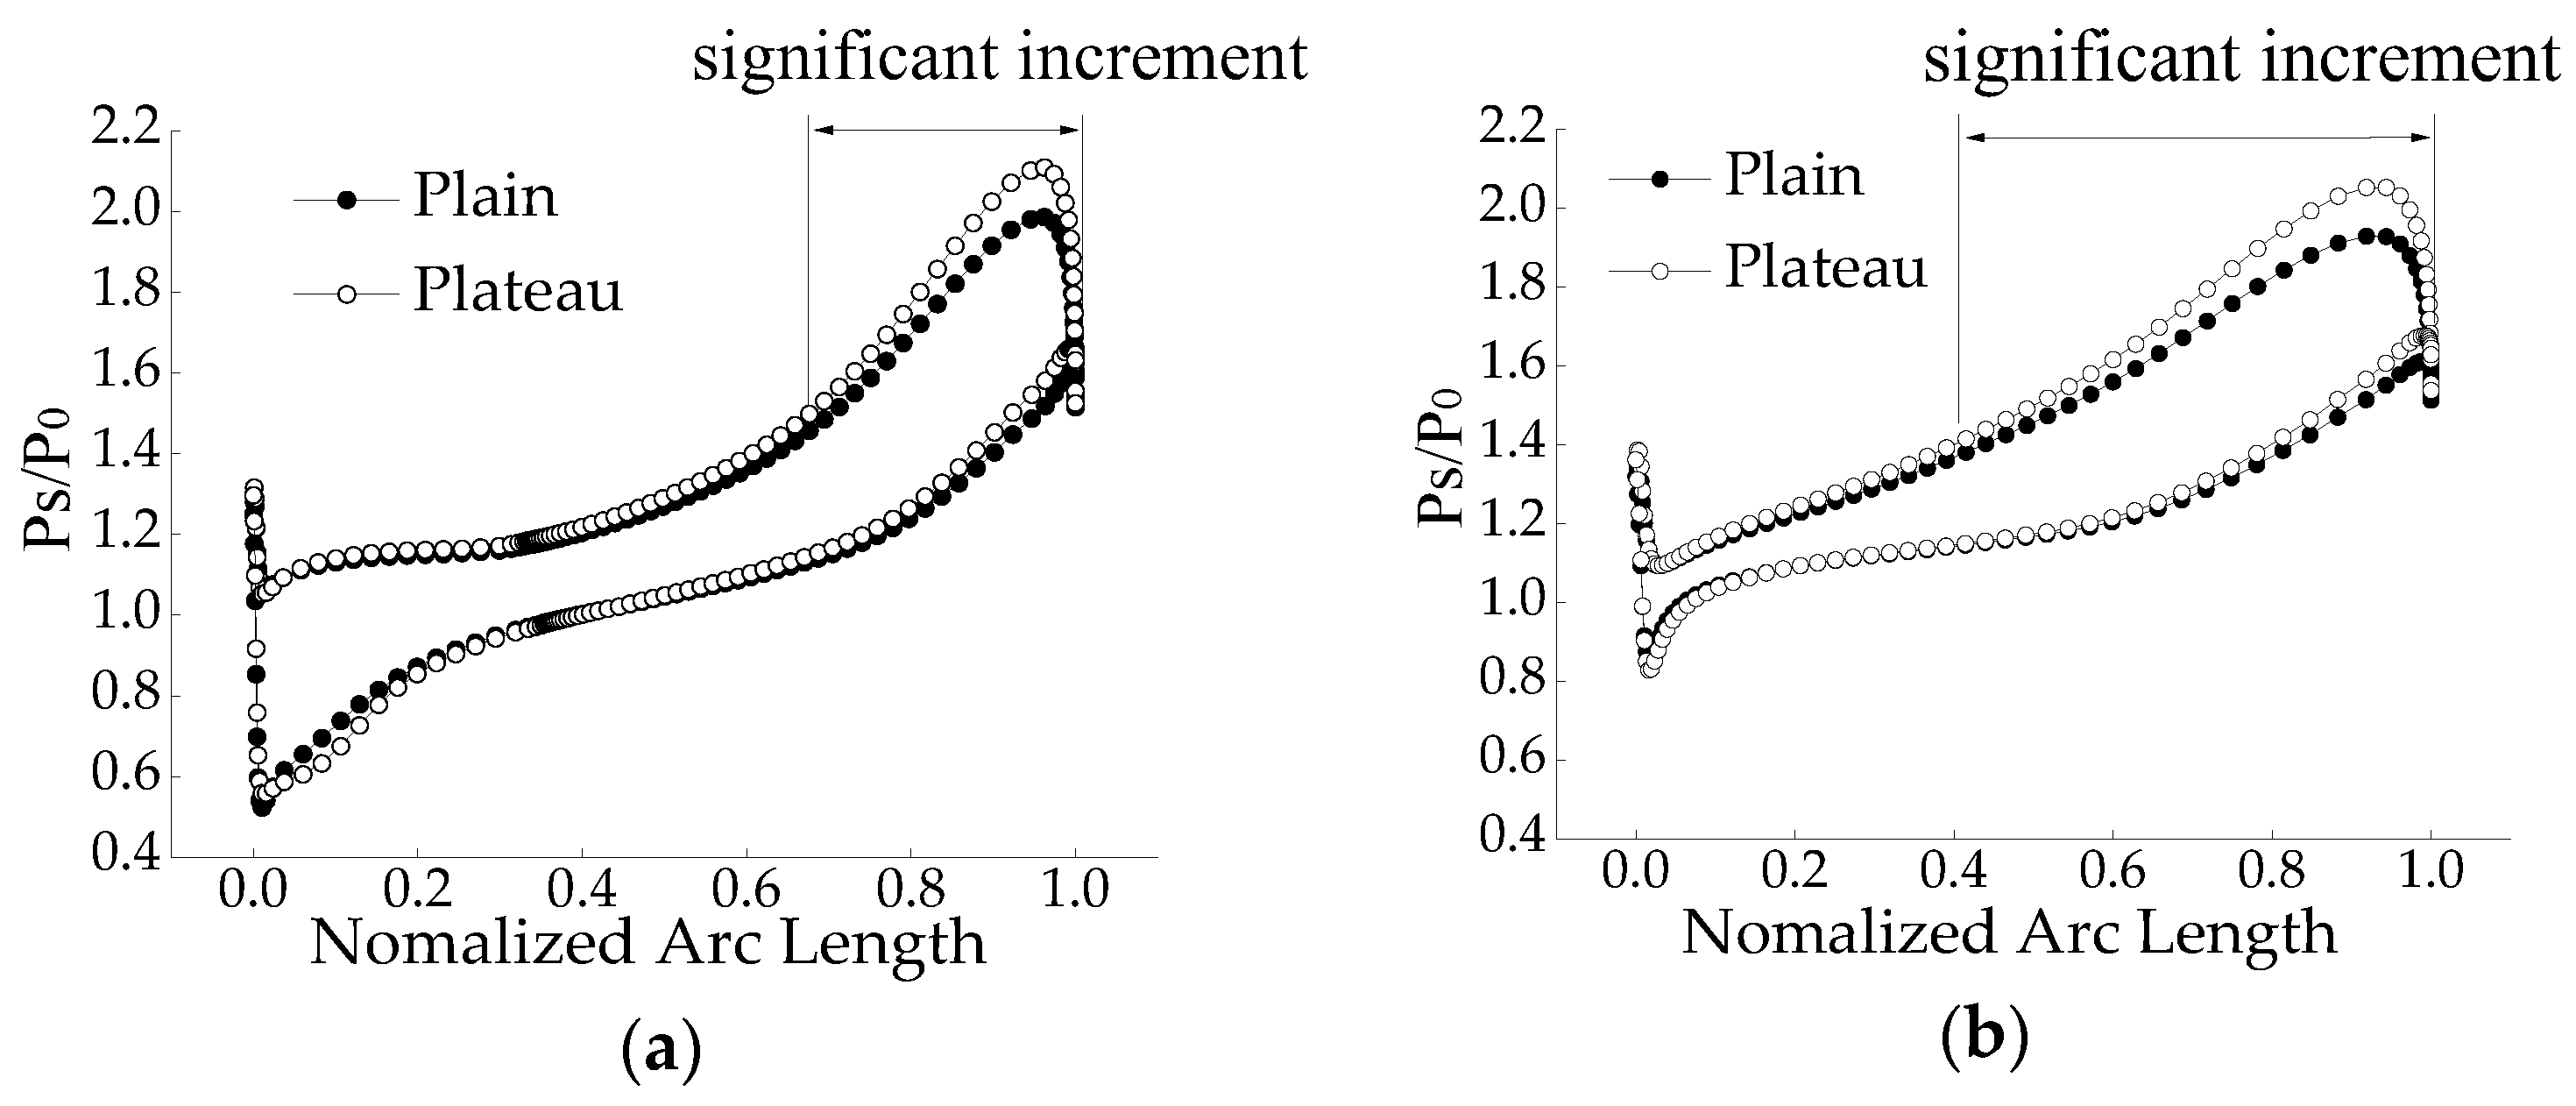
- The results show that, on the one hand, as the altitude increases, the compressor impeller static pressure gradient increases, the pressure contour lines will become dense, which can lead to higher pressure ratio at the impeller outlet, while on the other hand, blade loads all increase from 80% position of the main blade and 40% position of the splitter blade, which can contribute to the pressure ratio increment.
- (4)
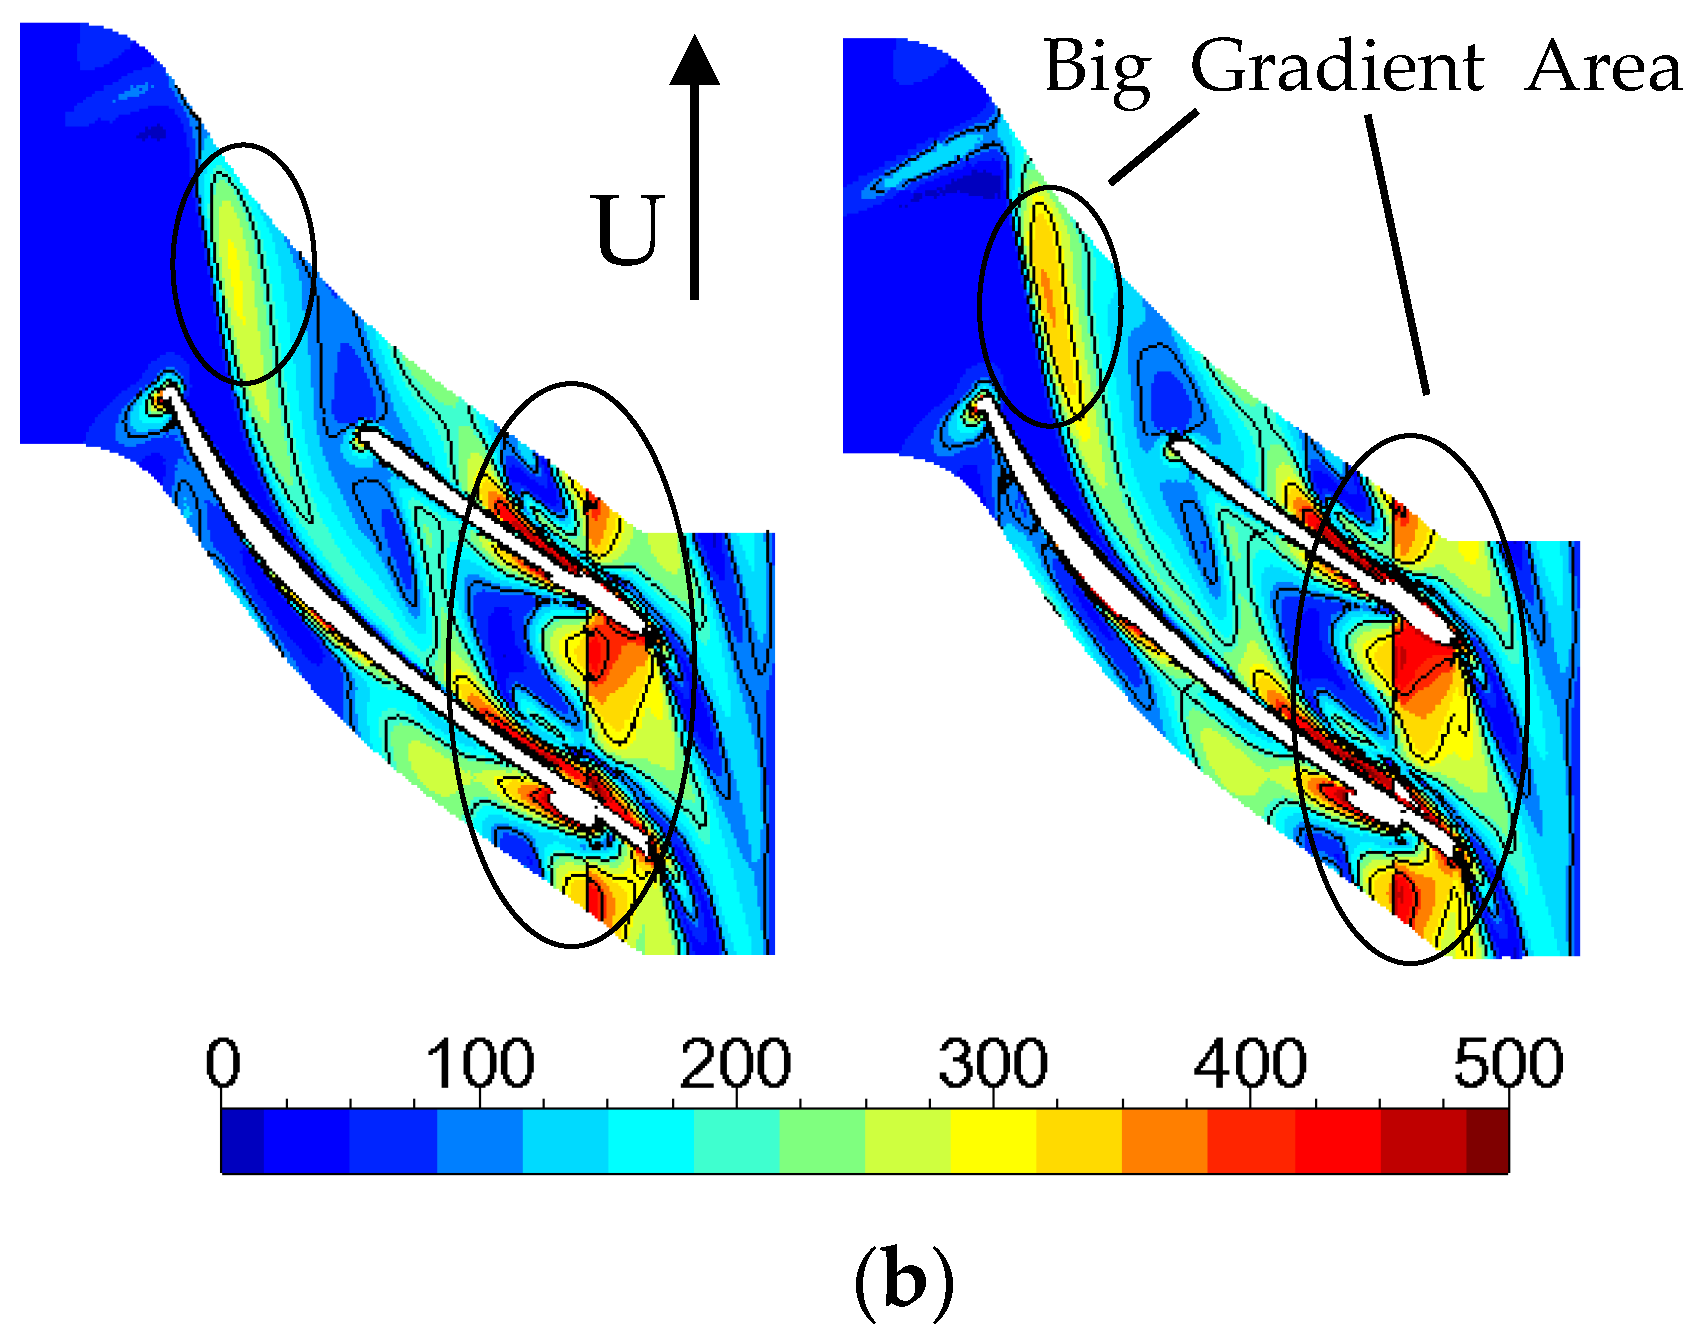
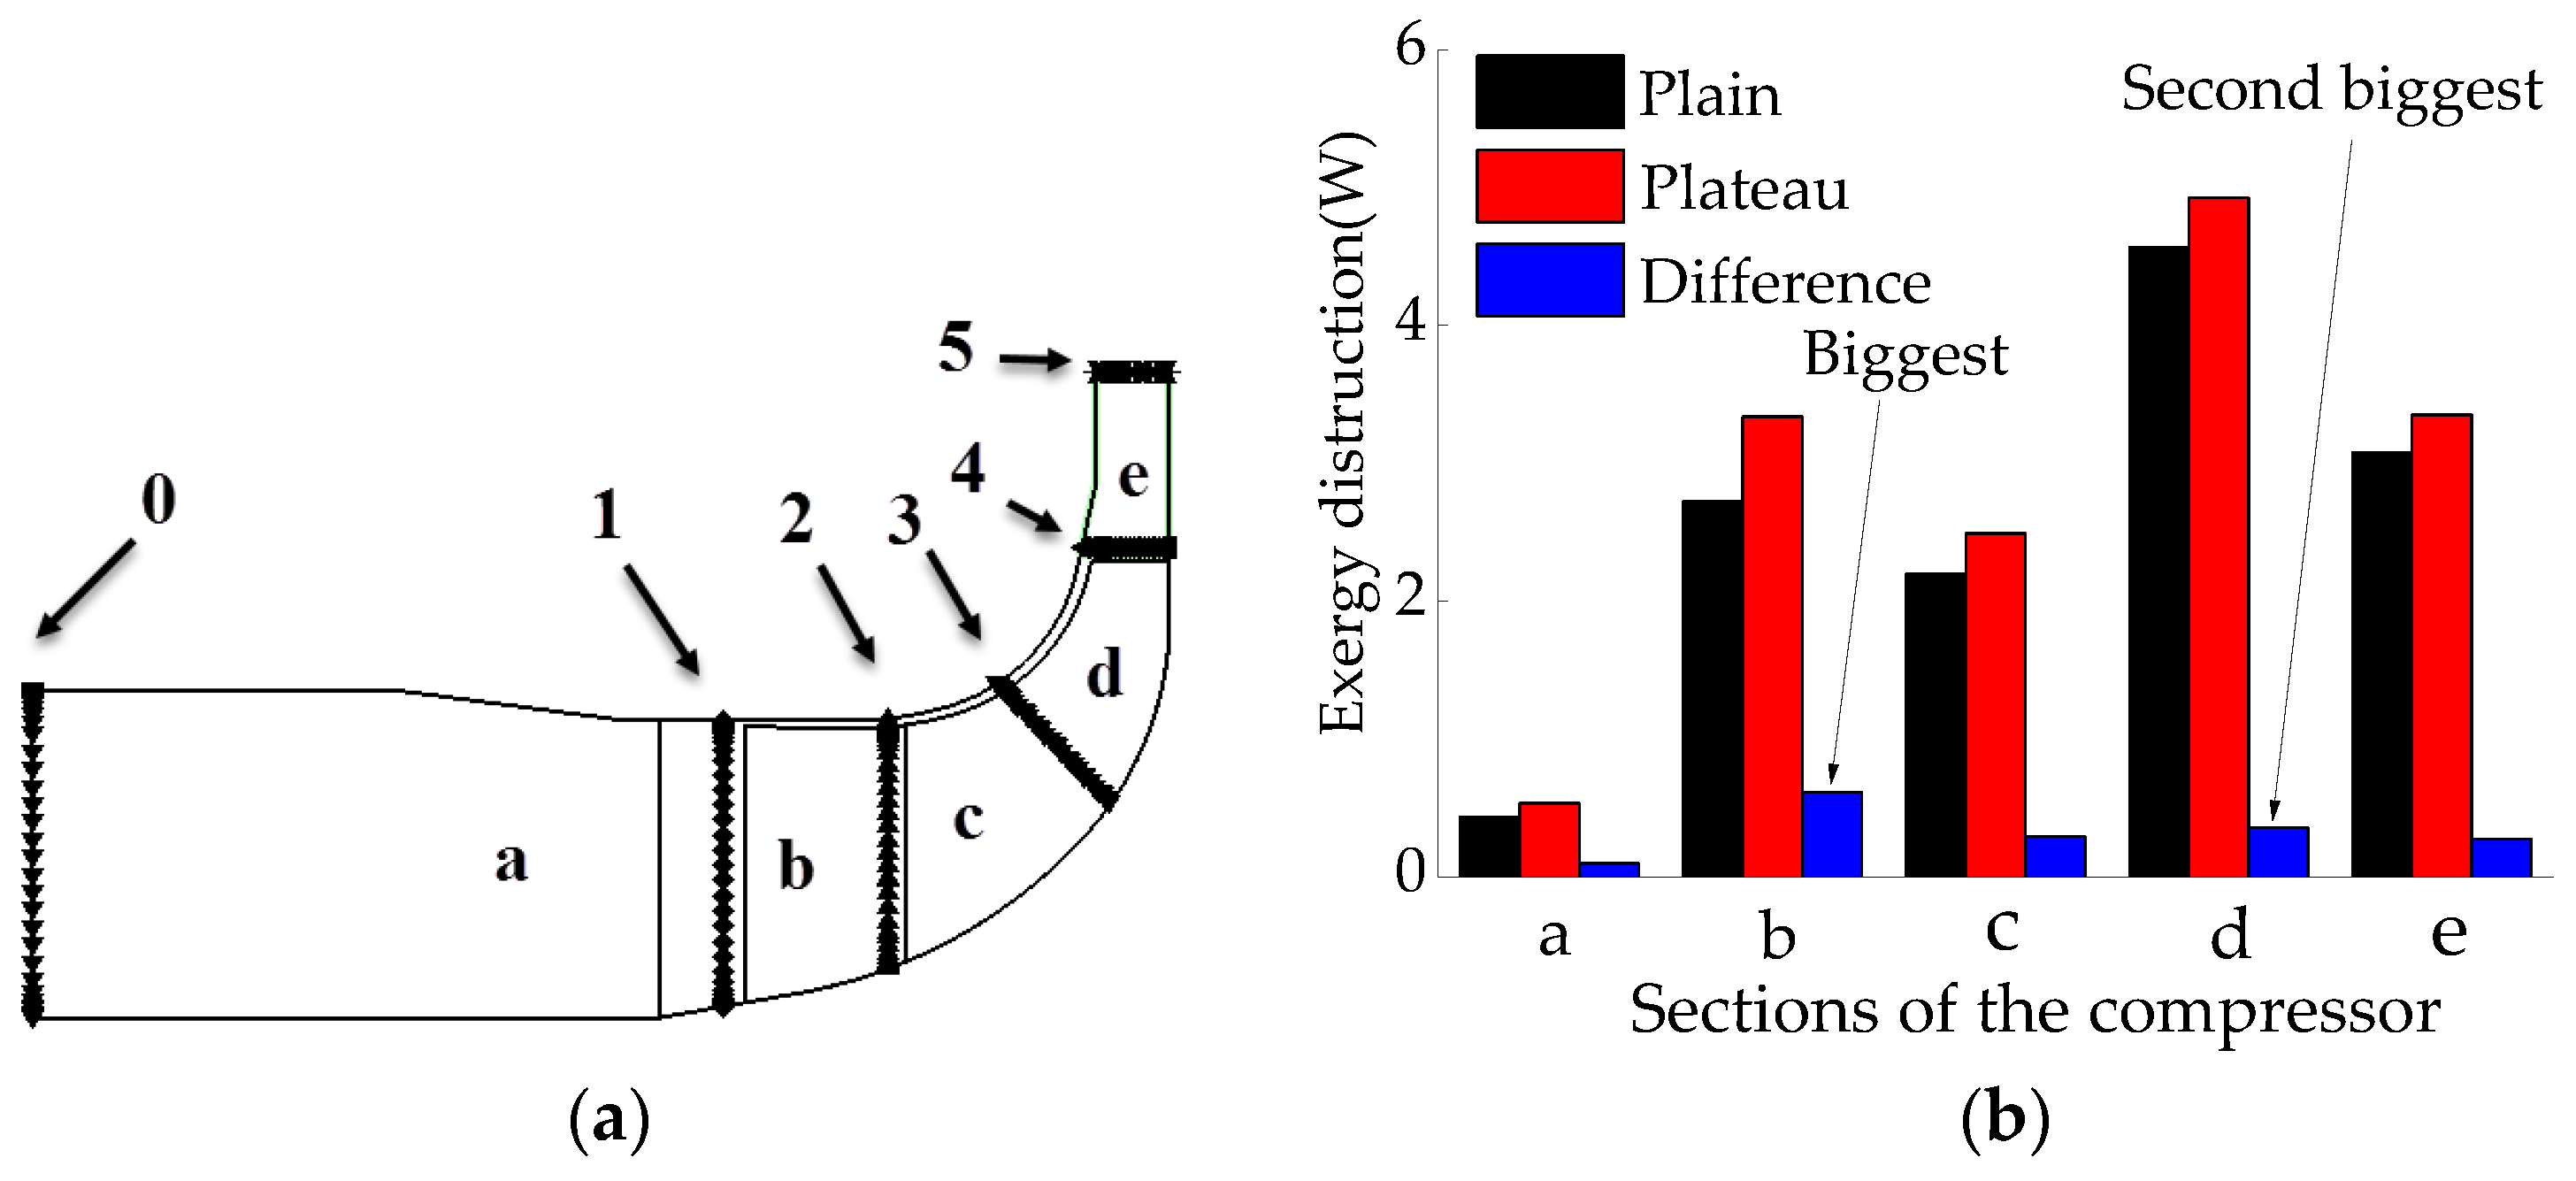
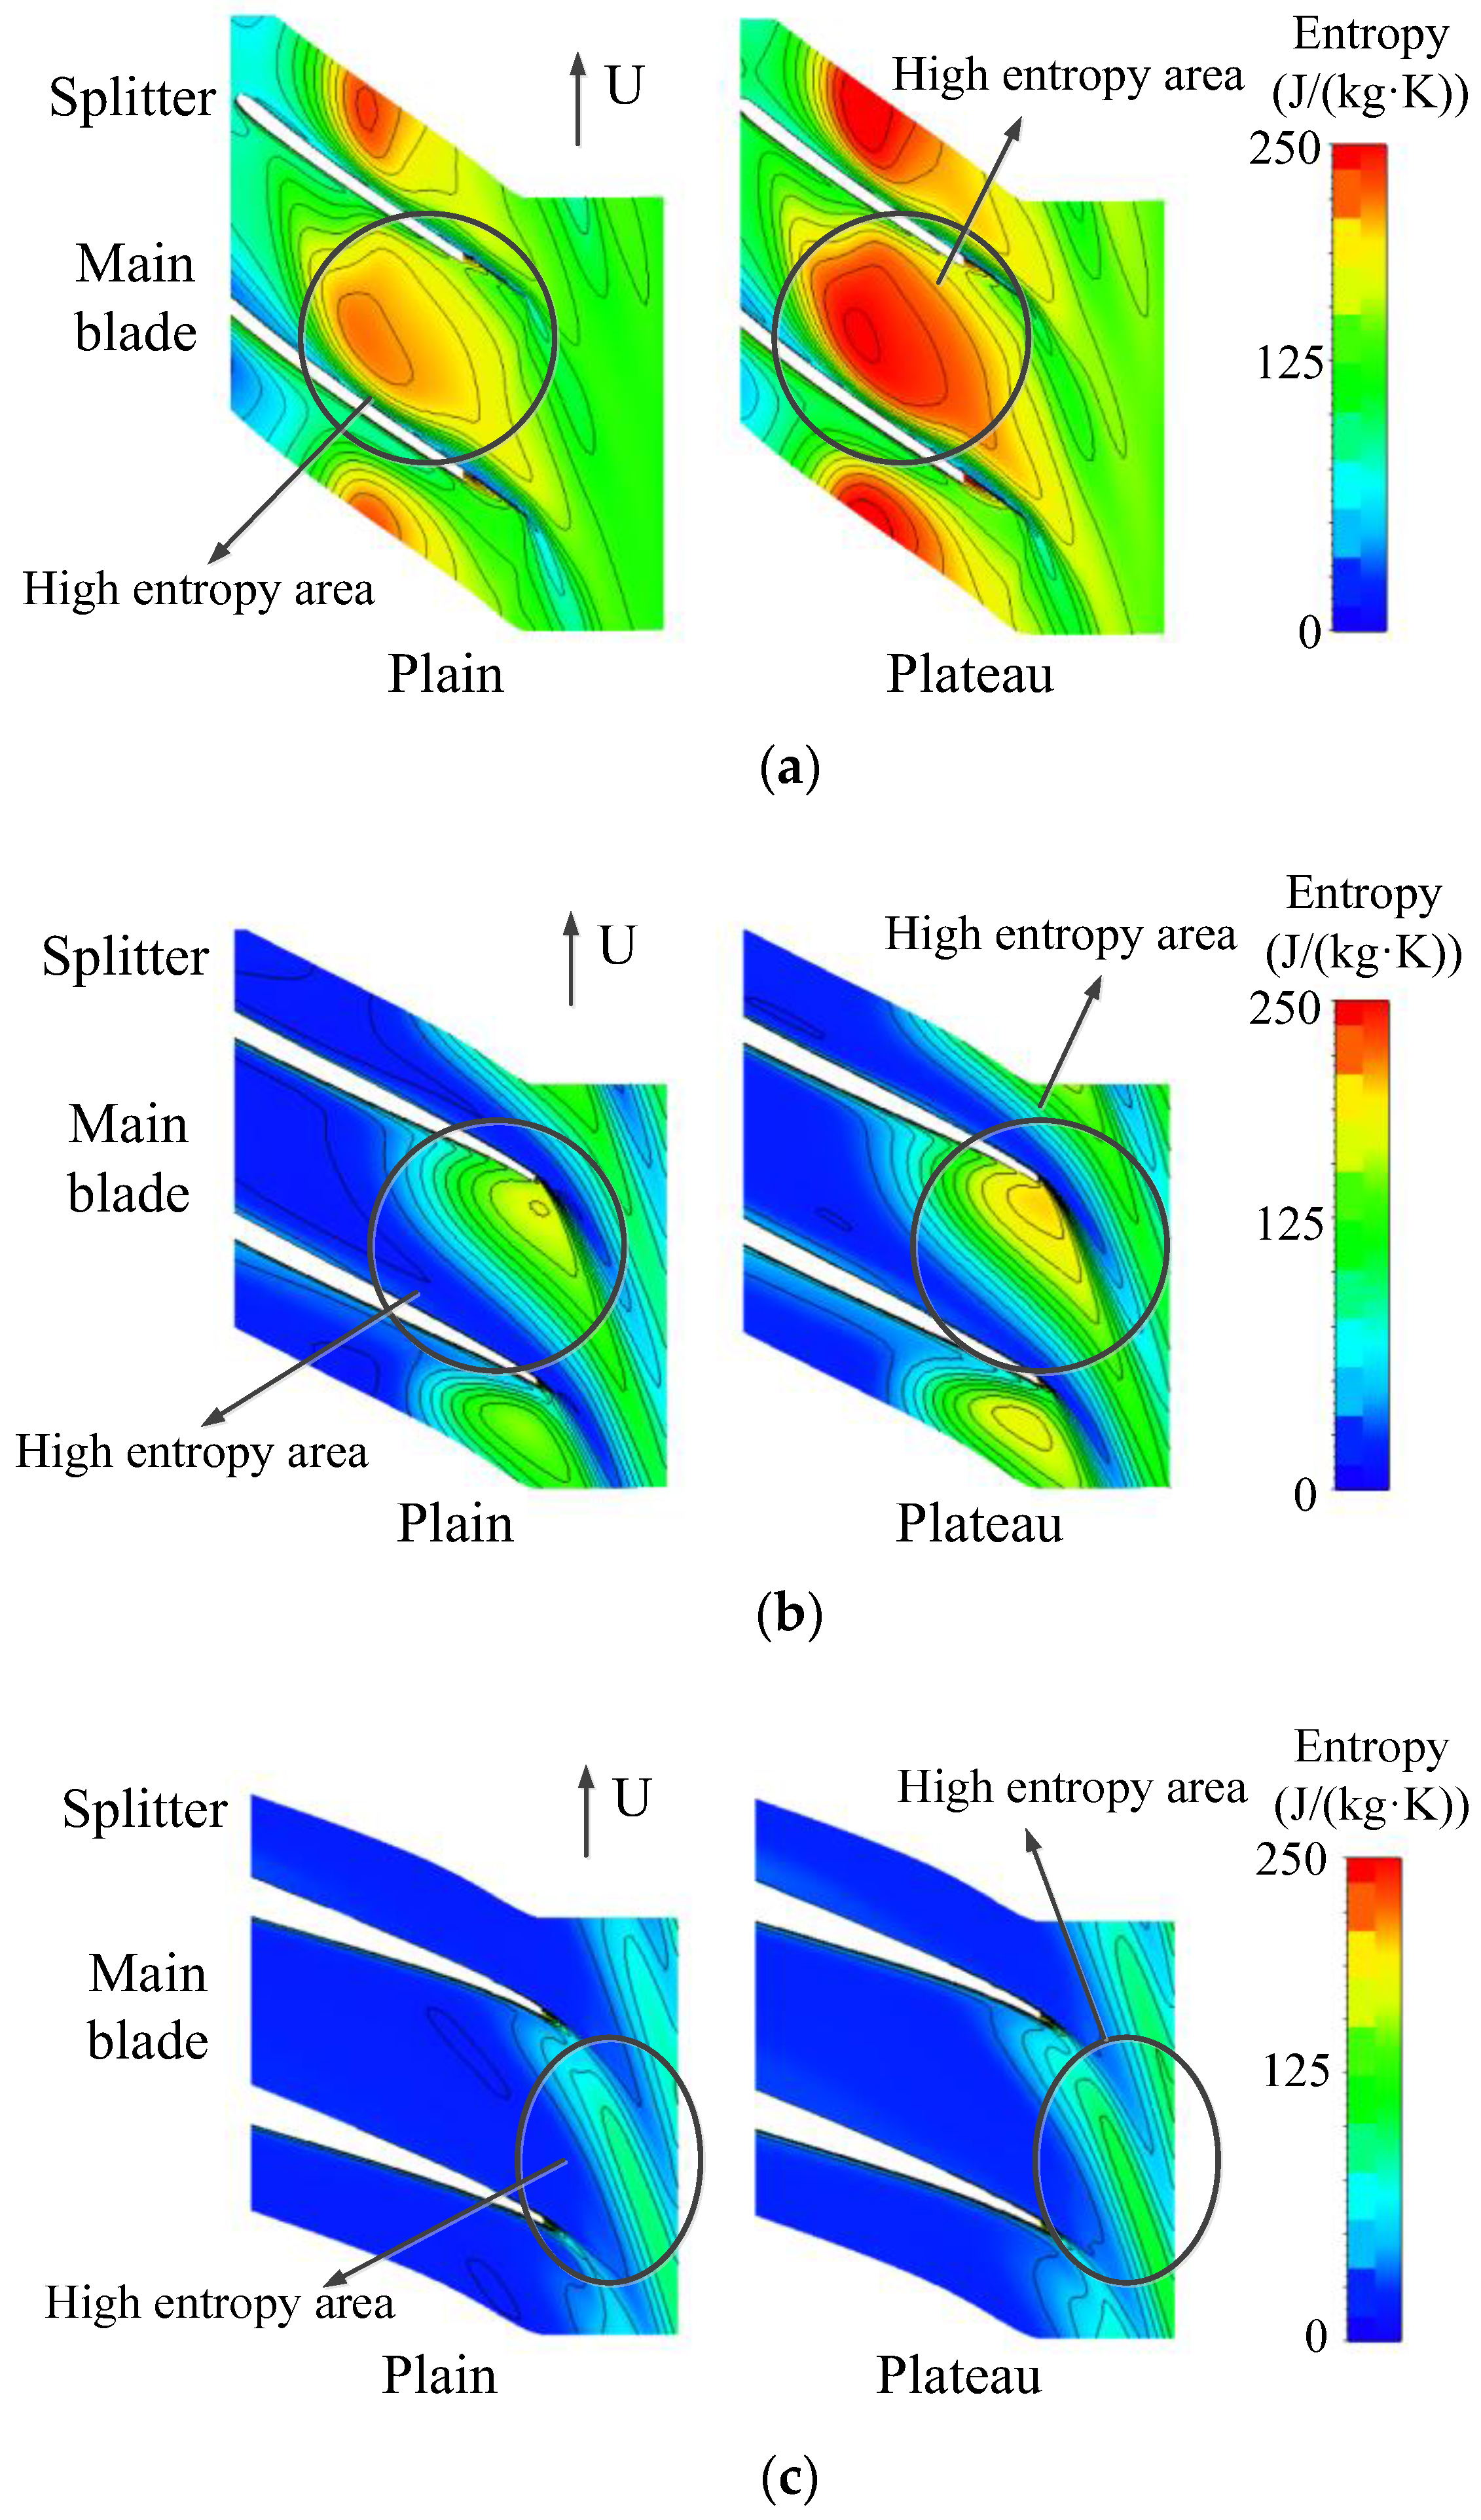
- The exergy destruction analysis shows that, with the increasing altitude, the leading edge of the impeller has the biggest exergy destruction difference, and the downstream of the compressor impeller passage has the second biggest exergy destruction difference, and more attention needs to be paid to these positions during compressor design.
- (5)
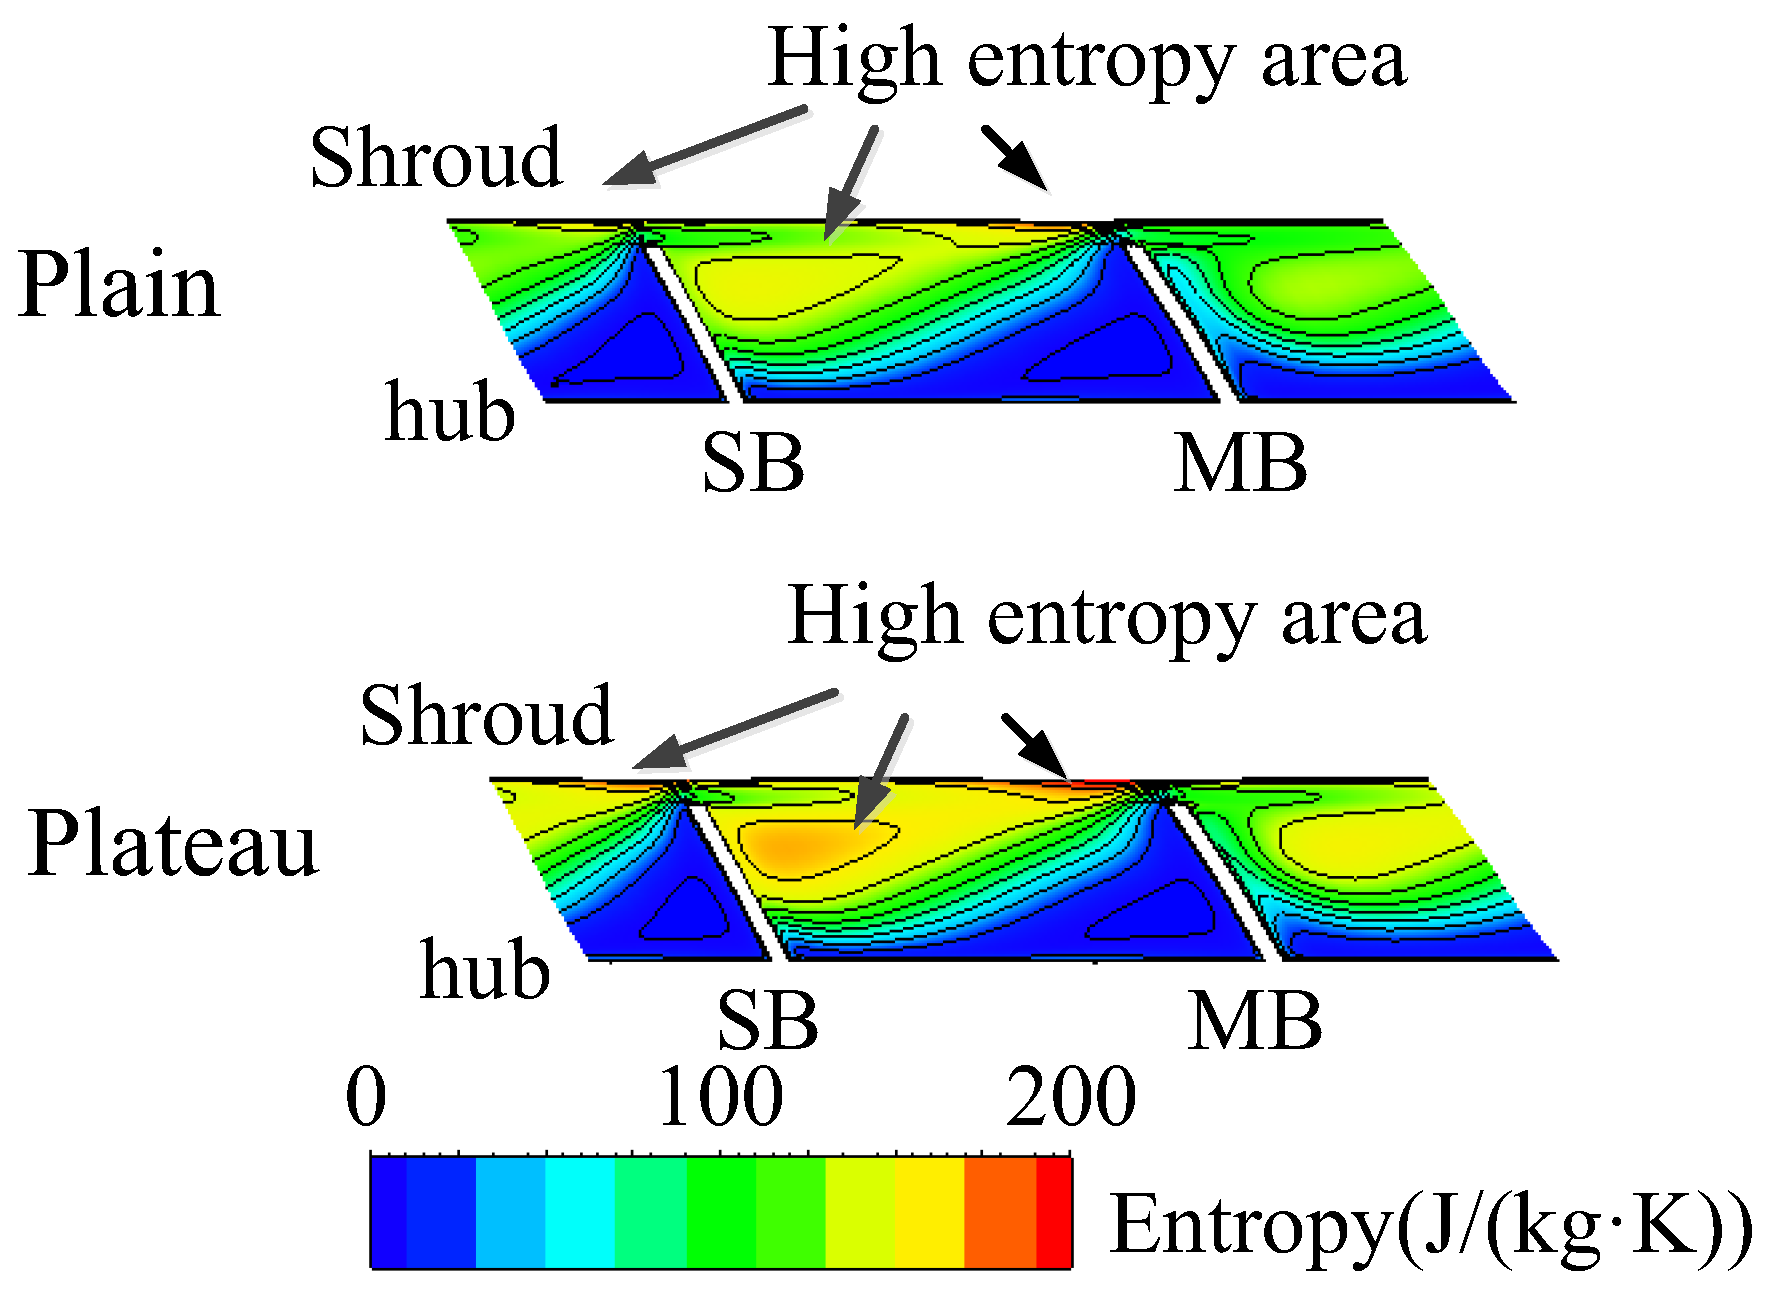
- In the downstream of the impeller, due to the decrease of Reynolds number, the boundary layer is thickened, and the flow loss in the diffuser and volute is intensified, especially the position near the volute tongue. The region where the entropy is over 150 J/(kg·K) expands significantly near the volute tongue. These positions need a detailed optimization design to decrease flow losses and to satisfy the plateau condition requirements.
Acknowledgments
Author Contributions
Conflicts of Interest
Nomenclatures
| Symbols | |
| πc | Compressor pressure ratio |
| ηc | Adiabatic efficiency |
| Corrected mass flow rate | |
| Corrected rotational speed | |
| Cp | Specific heat at constant pressure |
| K | Specific heat ratio |
| Pr | Prandtl number |
| Re | Reynolds number |
| Mc | Mass flow rate |
| nc | Actual speed of the compressor |
| T0 | Inlet Total temperature |
| P0 | Inlet Total pressure |
| P1 | Outlet Total pressure |
| μ | Dynamic viscosity coefficient |
| u2 | Peripheral speed |
| b2 | Impeller blade outlet width |
| ρ0 | Air density at the impeller inlet |
| R | Gas constant of air |
| WT | Output power of the turbine |
| me | Mass flow rate of gas |
| AFR | Air/Fuel Ratio |
| T03 | Turbine inlet temperature |
| T04 | Turbine outlet temperature |
| ηT | Efficiency of the turbine |
| ηTC | Efficiency of turbocharger |
| πT | Expansion ratio of the turbine |
| Cpe | Gas specific heat at constant pressure |
| Entropy of the airflow | |
| p | Static pressure |
| Entropy increases of the environment | |
| Exergy destruction |
References
- Saidur, R.; Rezaei, M.; Muzammil, W.K.; Hassan, M.H.; Paria, S.; Hasanuzzaman, M. Technologies to recover exhaust heat from internal combustion engines. Renew. Sustain. Energy Rev. 2012, 6, 5649–5659. [Google Scholar] [CrossRef]
- Kusztelan, A.; Yao, Y.F.; Marchant, D.R.; Wang, Y. A Review of Novel Turbocharger Concepts for Enhancements in Energy Efficiency. Int. J. Therm. Environ. Eng. 2011, 2, 75–82. [Google Scholar] [CrossRef]
- Mamat, A.M.I.; Romagnoli, A.; Martinez-Botas, R.F. Characterisation of a low pressure turbine for turbocompounding applications in a heavily downsized mild-hybrid gasoline engine. Energy 2014, 64, 3–16. [Google Scholar] [CrossRef]
- Zhao, R.; Zhuge, W.; Zhang, Y.; Yang, M.; Martinez-Botas, R.; Yin, Y. Study of two-stage turbine characteristic and its influence on turbo-compound engine performance. Energy Convers. Manag. 2015, 95, 414–423. [Google Scholar] [CrossRef]
- Zhao, M.; Xu, F.; Wei, M.S.; Tian, G.H.; Zhang, H. Simulation analysis of cooling methods of an on-board organic Rankine cycle exhaust heat recovery system. Int. J. Energy Res. 2017. [Google Scholar] [CrossRef]
- Zou, Y.; Liu, T.; Liu, D.; Sun, F. Reinforcement learning-based real-time energy management for a hybrid tracked vehicle. Appl. Energy 2016, 171, 372–382. [Google Scholar] [CrossRef]
- Xiong, R.; Yu, Q.; Wang, L.Y.; Lin, C. A novel method to obtain the open circuit voltage for the state of charge of lithium ion batteries in electric vehicles by using H infinity filter. Appl. Energy 2017, 207, 346–353. [Google Scholar] [CrossRef]
- Chen, C.; Xiong, R.; Shen, W. A lithium-ion battery-in-the-loop approach to test and validate multi-scale dual H infinity filters for state of charge and capacity estimation. IEEE Trans. Power Electron. 2018, 33, 332–342. [Google Scholar] [CrossRef]
- Xiong, R.; Zhang, Y.; He, H.; Zhou, X.; Pecht, M.G. A double-scale, particle-filtering, energy state prediction algorithm for lithium-ion batteries. IEEE Trans. Ind. Electron. 2018, 65, 1526–1538. [Google Scholar] [CrossRef]
- Xiong, R.; Tian, J.; Mu, H.; Wang, C. A systematic model-based degradation behavior recognition and health monitoring method for lithium-ion batteries. Appl. Energy 2017, 207, 372–383. [Google Scholar] [CrossRef]
- Li, W.X.; Gao, W.Y.; Yuan, Z.Y.; Xing, X.C.; Wang, Y.Y.; Xu, X.Y. Study on Adaptability of CA6110/125Z1A2 Turbocharged Diesel Engine in Qing Zang Plateau. Automob. Technol. 2001, 7, 5–12. [Google Scholar]
- Chen, F.; Wang, Y.F.; Chen, H.L.; Li, G.Z. Effects of Reynolds Number on Internal Flow Field of Centrifugal Compressor with the Volute. J. Propuls. Technol. 2013, 7, 911–917. [Google Scholar]
- Wiesner, F.J. A New Appraisal of Reynolds Number Effects on Centrifugal Compressor Performance. ASME J. Eng. Power 1979, 101, 384–396. [Google Scholar] [CrossRef]
- Strub, R.A.; Bonciani, L.; Borer, C.L.; Casey, M.V.; Cole, S.L. Influence of the Reynolds number on the performance of centrifugal compressors. ASME J. Turbomach. 1987, 109, 541–544. [Google Scholar] [CrossRef]
- Feng, Z.P.; Shen, Z.D.; Zhao, J.B. Performance Correction-transformation and Analysis of Plateau Vehicle Turbochager Centrifugal Compressors. Trans. CSICE 1992, 10, 129–134. [Google Scholar]
- Xu, B.; Bo, D.; Yao, H. Correction calculation for efficiency of the turbocharger of the plateau engine. Veh. Eng. 2009, 6, 7–10. [Google Scholar]
- Huo, L.; Liu, H.X. Numerical analysis of centrifugal compressor performance and flow at low Reynolds number. J. Air Power 2013, 28, 911–920. [Google Scholar]
- Sun, Z. Investigation on the Flow Features and Flowfield Structures of Centrifugal Compressor. Ph.D. Thesis, Institute of Engineering Thermophysics, Chinese Academy of Sciences, Beijing, China, 2011. [Google Scholar]
- Wu, G.; Zhang, H.; Wei, M.S. Numerical Calculation and Analysis of the Plateau Characteristics of Centrifugal Compressor. Veh. Power Technol. 2014, 4, 1–5. [Google Scholar]
- Hirsch, C.; Kang, S.; Pointet, G. A Numerically Supported Investigation of the 3D Flow in Centrifugal Impellers. Part II: Secondary Flow Structure. In Proceedings of the ASME Turbo Expo: Power for Land, Sea, and Air, Birmingham, UK, 10–13 June 1996. [Google Scholar]
- Johnson, M.W.; Moore, J. Secondary Flow Mixing Losses in a Centrifugal Impeller. ASME J. Eng. Power 1983, 105, 24–32. [Google Scholar] [CrossRef]
- Hirsch, C.; Kang, S.; Pointet, G. A Numerically Supported Investigation on the 3D Flow in Centrifugal Impellers. Part I: The Validation Base. In Proceedings of the ASME 1996 International Gas Turbine and Aeroengine Congress and Exhibition, Birmingham, UK, 10–13 June 1996. [Google Scholar]
- Kang, S.; Hirsch, C. Numerical Simulation and Theoretical Analysis of the 3D Viscous Flow in Centrifugal Impellers. J. TASK Q. 2001, 5, 433–458. [Google Scholar]
- Wang, R.G.; Zhou, M.; Zhao, Y.W.; Xia, Q.B.; Zeng, L.J. Research on flow instability mechanism of transonic compressor at low Reynolds number. J. Aerosp. Power 2009, 24, 414–419. [Google Scholar]
- Liang, D.W.; Qian, H.J. Experimental investigation of aerodynamic characteristics of porous plates and numerical simulation of boundary layer suction. Acta Aeronaut. Astronaut. Sin. 2002, 23, 512–516. [Google Scholar]
- Zhao, G.; Cai, Y.H.; Tu, Q.Y.; Wang, Z.X. Technological analysis for the turbofan engine of high altitude long endurance unmanned aerial vehicles. J. Propuls. Technol. 2009, 30, 154–158. [Google Scholar]
- Zhu, D.X. Turbocharging and Turbocharge, 1st ed.; China Machine Press: Beijing, China, 1992. [Google Scholar]
- Nicholas, C.B. Fundamentals of Turbocharging; Concepts ETI, Inc.: White River Junction, VT, USA, 2005. [Google Scholar]
- Xia, Q.B.; Wang, R.G.; Li, Y.; Guo, F.F. Investigation on flow instability of transonic compressor rotor and the effects of CGCT on stall margin at low Reynolds number. J. Propuls. Technol. 2010, 31, 340–344. [Google Scholar]
- Yunus, A.; Boles, M.A. Thermodynamics: An Engineering Approach; McGraw-Hill Series in Mechanical Engineering; McGraw-Hill Higher Education: Columbus, OH, USA, 2006; Volume 5. [Google Scholar]
- Guo, Q.; Zhu, X.C.; Du, Z.H.; Chen, H.; Zhao, Y. Three-dimensional numerical simulation for rotating stall inside high-speed centrifugal compressor. J. Propuls. Technol. 2007, 28, 373–377. [Google Scholar]
- Li, S.; Liu, C.; Hu, L.F.; Xing, W.D.; Yang, Z.H. Experimental Investigation on Centrifugal Compressor Performance Characteristics of Plateau Environment for Vehicle Turbocharger. J. Mech. Eng. 2016, 20, 151–158. [Google Scholar] [CrossRef]
- Zhou, G.M.; Liu, R.L.; Dong, S.R.; Xiang, X.U.; Liu, G. A review of research on diesel engine plateau environment adaptability. Veh. Eng. 2013, 207, 1–5. [Google Scholar]
- Zhao, Y.P. Review on Plateau Environment Adaptability of Diesel Engine. Ph.D. Thesis, Dalian University of Technology, Dalian, China, 2008. [Google Scholar]
- Wang, Y.; Lin, F.; Nie, C.; Engeda, A. Design and Performance Evaluation of a Very Low Flow Coefficient Centrifugal Compressor. Int. J. Rotat. Mach. 2013, 4. [Google Scholar] [CrossRef]
- Guidotti, E.; Toni, L.; Rubino, D.T.; Tapinassi, L.; Naldi, G.; Satish, K.; Prasad, S. Influence of Cavity Flows Modeling on Centrifugal Compressor Stages Performance Prediction Across Different Flow Coefficient Impellers. In Proceedings of the ASME Turbo Expo 2014: Turbine Technical Conference and Exposition, Düsseldorf, Germany, 16–20 June 2014. [Google Scholar]


| Altitude/m | Inlet Total Temperature/K | Inlet Total Pressure/kPa | Rotational Speed/rpm | Solid Wall |
|---|---|---|---|---|
| 0 | 298 | 100 | 90,000 | Adiabatic, no slip |
| 4500 | 269 | 56 | 90,000 | Adiabatic, no slip |
© 2017 by the authors. Licensee MDPI, Basel, Switzerland. This article is an open access article distributed under the terms and conditions of the Creative Commons Attribution (CC BY) license (http://creativecommons.org/licenses/by/4.0/).
Share and Cite
Zhang, H.; Zhang, H.; Wang, Z. Effect on Vehicle Turbocharger Exhaust Gas Energy Utilization for the Performance of Centrifugal Compressors under Plateau Conditions. Energies 2017, 10, 2121. https://doi.org/10.3390/en10122121
Zhang H, Zhang H, Wang Z. Effect on Vehicle Turbocharger Exhaust Gas Energy Utilization for the Performance of Centrifugal Compressors under Plateau Conditions. Energies. 2017; 10(12):2121. https://doi.org/10.3390/en10122121
Chicago/Turabian StyleZhang, Hong, Hang Zhang, and Zhuo Wang. 2017. "Effect on Vehicle Turbocharger Exhaust Gas Energy Utilization for the Performance of Centrifugal Compressors under Plateau Conditions" Energies 10, no. 12: 2121. https://doi.org/10.3390/en10122121