Article

Firm Performance of Saudi Manufacturers: Does the Management of Cash Conversion Cycle Components Matter?

by
Amel Kouaib
* and
Mohammed Ibrahim Bu Haya
Accounting Department, School of Business, King Faisal University, Al-Ahsa 31982, Saudi Arabia
*
Author to whom correspondence should be addressed.
J. Risk Financial Manag. 2024, 17(1), 16; https://doi.org/10.3390/jrfm17010016
Submission received: 28 November 2023 / Revised: 26 December 2023 / Accepted: 29 December 2023 / Published: 1 January 2024
(This article belongs to the Special Issue Business Performance)

Abstract

:
The purpose of this study is to examine the liquidity management of a corporation. It aims to examine how managing cash conversion cycle components affects corporate performance. A dataset of 88 firms listed on the Saudi Stock Exchange between 2018 and 2022 was analyzed using both pooled OLS and fixed effects regression models. A sample of 84 firms listed on the Saudi Stock Exchange for the period from 2018 to 2022 was used. Both the pooled OLS and the fixed effects regression models were used. This study’s key findings are: (1) there is a strong negative correlation between the time it takes to convert inventory into sales (inventory conversion period) and firm performance. If inventory does not sell quickly, profit tends to be lower. (2) Firm performance demonstrates a strong inverse relationship with the duration it takes for companies to collect cash from customers, commonly known as the accounts receivable collection period. A short accounts receivable collection period may become collectible and increase a business’s profitability and performance. (3) There is a highly significant negative link between the time taken to pay creditors (days payable outstanding) and firm performance. A short average payment period, indicated by a low payment period, suggests that the firm is promptly settling its bills and obligations without any delays.

1. Introduction

The cash conversion cycle (CCC) processes how efficiently a business’s managers are handling its working capital (Gitman 1974; Richards and Laughlin 1980; Jose et al. 1996; Deloof 2003; Enqvista et al. 2014). Therefore, this cycle must be highly valued and carefully controlled. Working capital is crucial for firm profitability. It is usually used to cover the costs of resources employed to maintain a business’s existence (operating costs). Excess working capital reveals operational inefficiency. A high working capital ratio indicates that the business is leaving many assets to sit idle, instead of investing those assets to grow and expand its activity.
The management of the CCC involves balancing three main components: inventory, accounts receivable, and accounts payable. This ensures efficient management of cash flow (Deloof 2003; Charitou et al. 2010). By reducing inventory levels to match customer demand, decreasing accounts receivable, and extending supplier credit terms (accounts payable), a company can enhance its cash cycle. This helps the company maintain solvency and increases opportunities for reinvesting profits (Wang 2002; Ebben and Johnson 2011). Hence, an optimized cash conversion cycle is a short one. This leads to maximizing profitability and corporate growth. A long or slow cycle indicates that the working capital is not tied up for long, and the business has greater liquidity. Even though many influences cause it, poor inventory management is the main factor. Hence, the cash cycle enables managers to have enhanced oversight of short-term investments, potentially impacting risk, profitability, and overall firm value (Peel et al. 2000; Ebben and Johnson 2011). Value is obtained from the future cash flows generated by the business. Then, the key goal of the financial manager is directly related to the cash generation ability of the company. To keep the business running, the cash cycle is essential to hold a positive cash flow.
Previous studies conducted regarding the effect of the cash conversion cycle on a firm’s performance in various manufacturing industries are found to be positive (Gill et al. 2010; Attari and Raza 2012; Lin and Lin 2021). Many scholars have come to understand that the cash conversion cycle does not have any impact on a company’s performance. The relationship between liquidity and corporate performance is somewhat unclear, although most researchers have discovered that the liquidity and profitability of a business are negatively correlated. In other words, the longer the cash conversion cycle, the lower the corporate performance. As a result, there is an opportunity to investigate the influence of the cash conversion cycle duration on the corporate performance of Saudi manufacturing companies that are listed on the Saudi Stock Exchange. To address this gap, this study extends the existent studies by using a larger and more recent sample of 84 manufacturing businesses listed on the Saudi Stock Exchange during the period from 2018 to 2022.
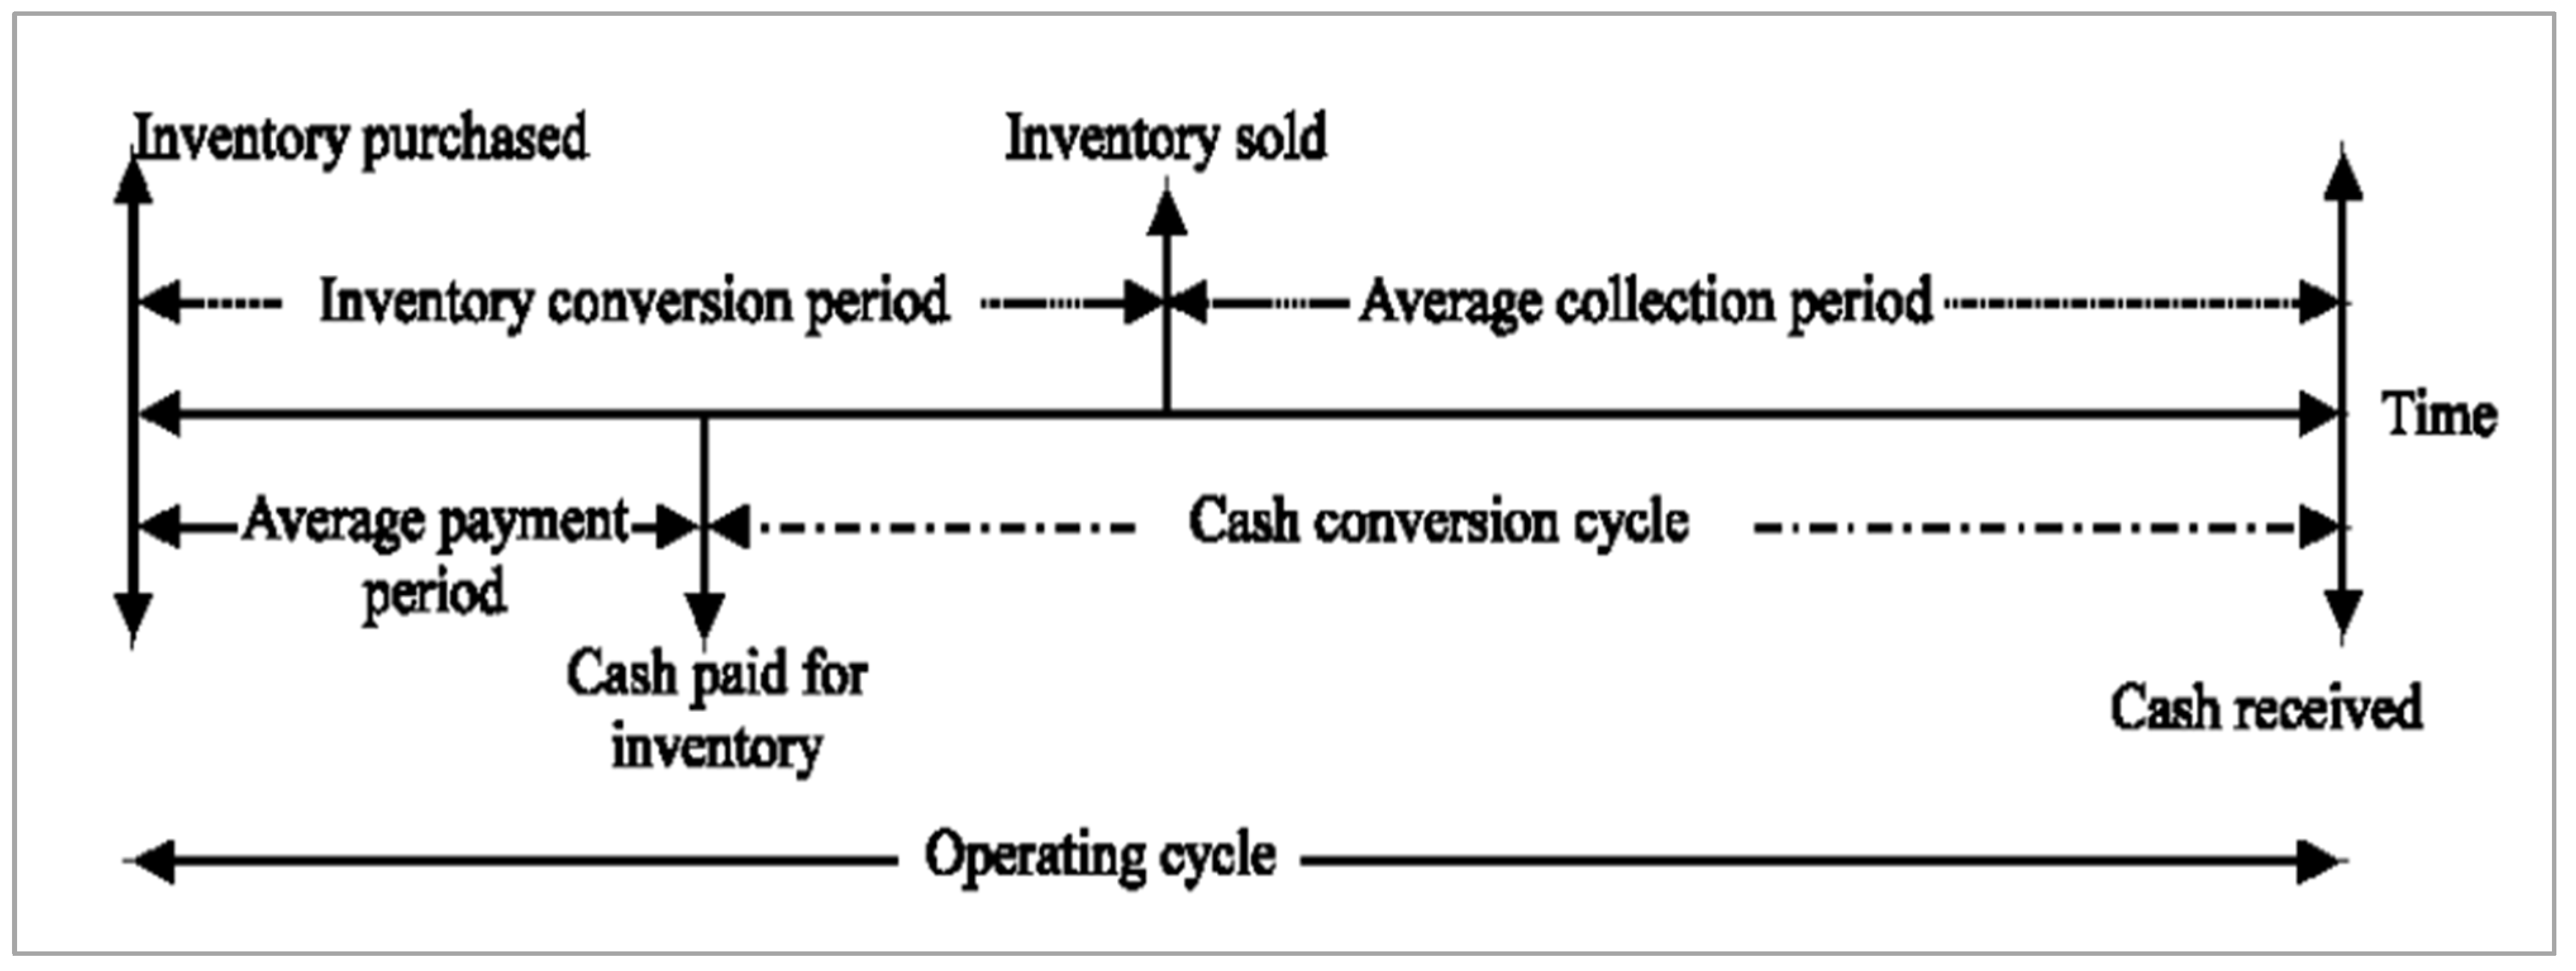
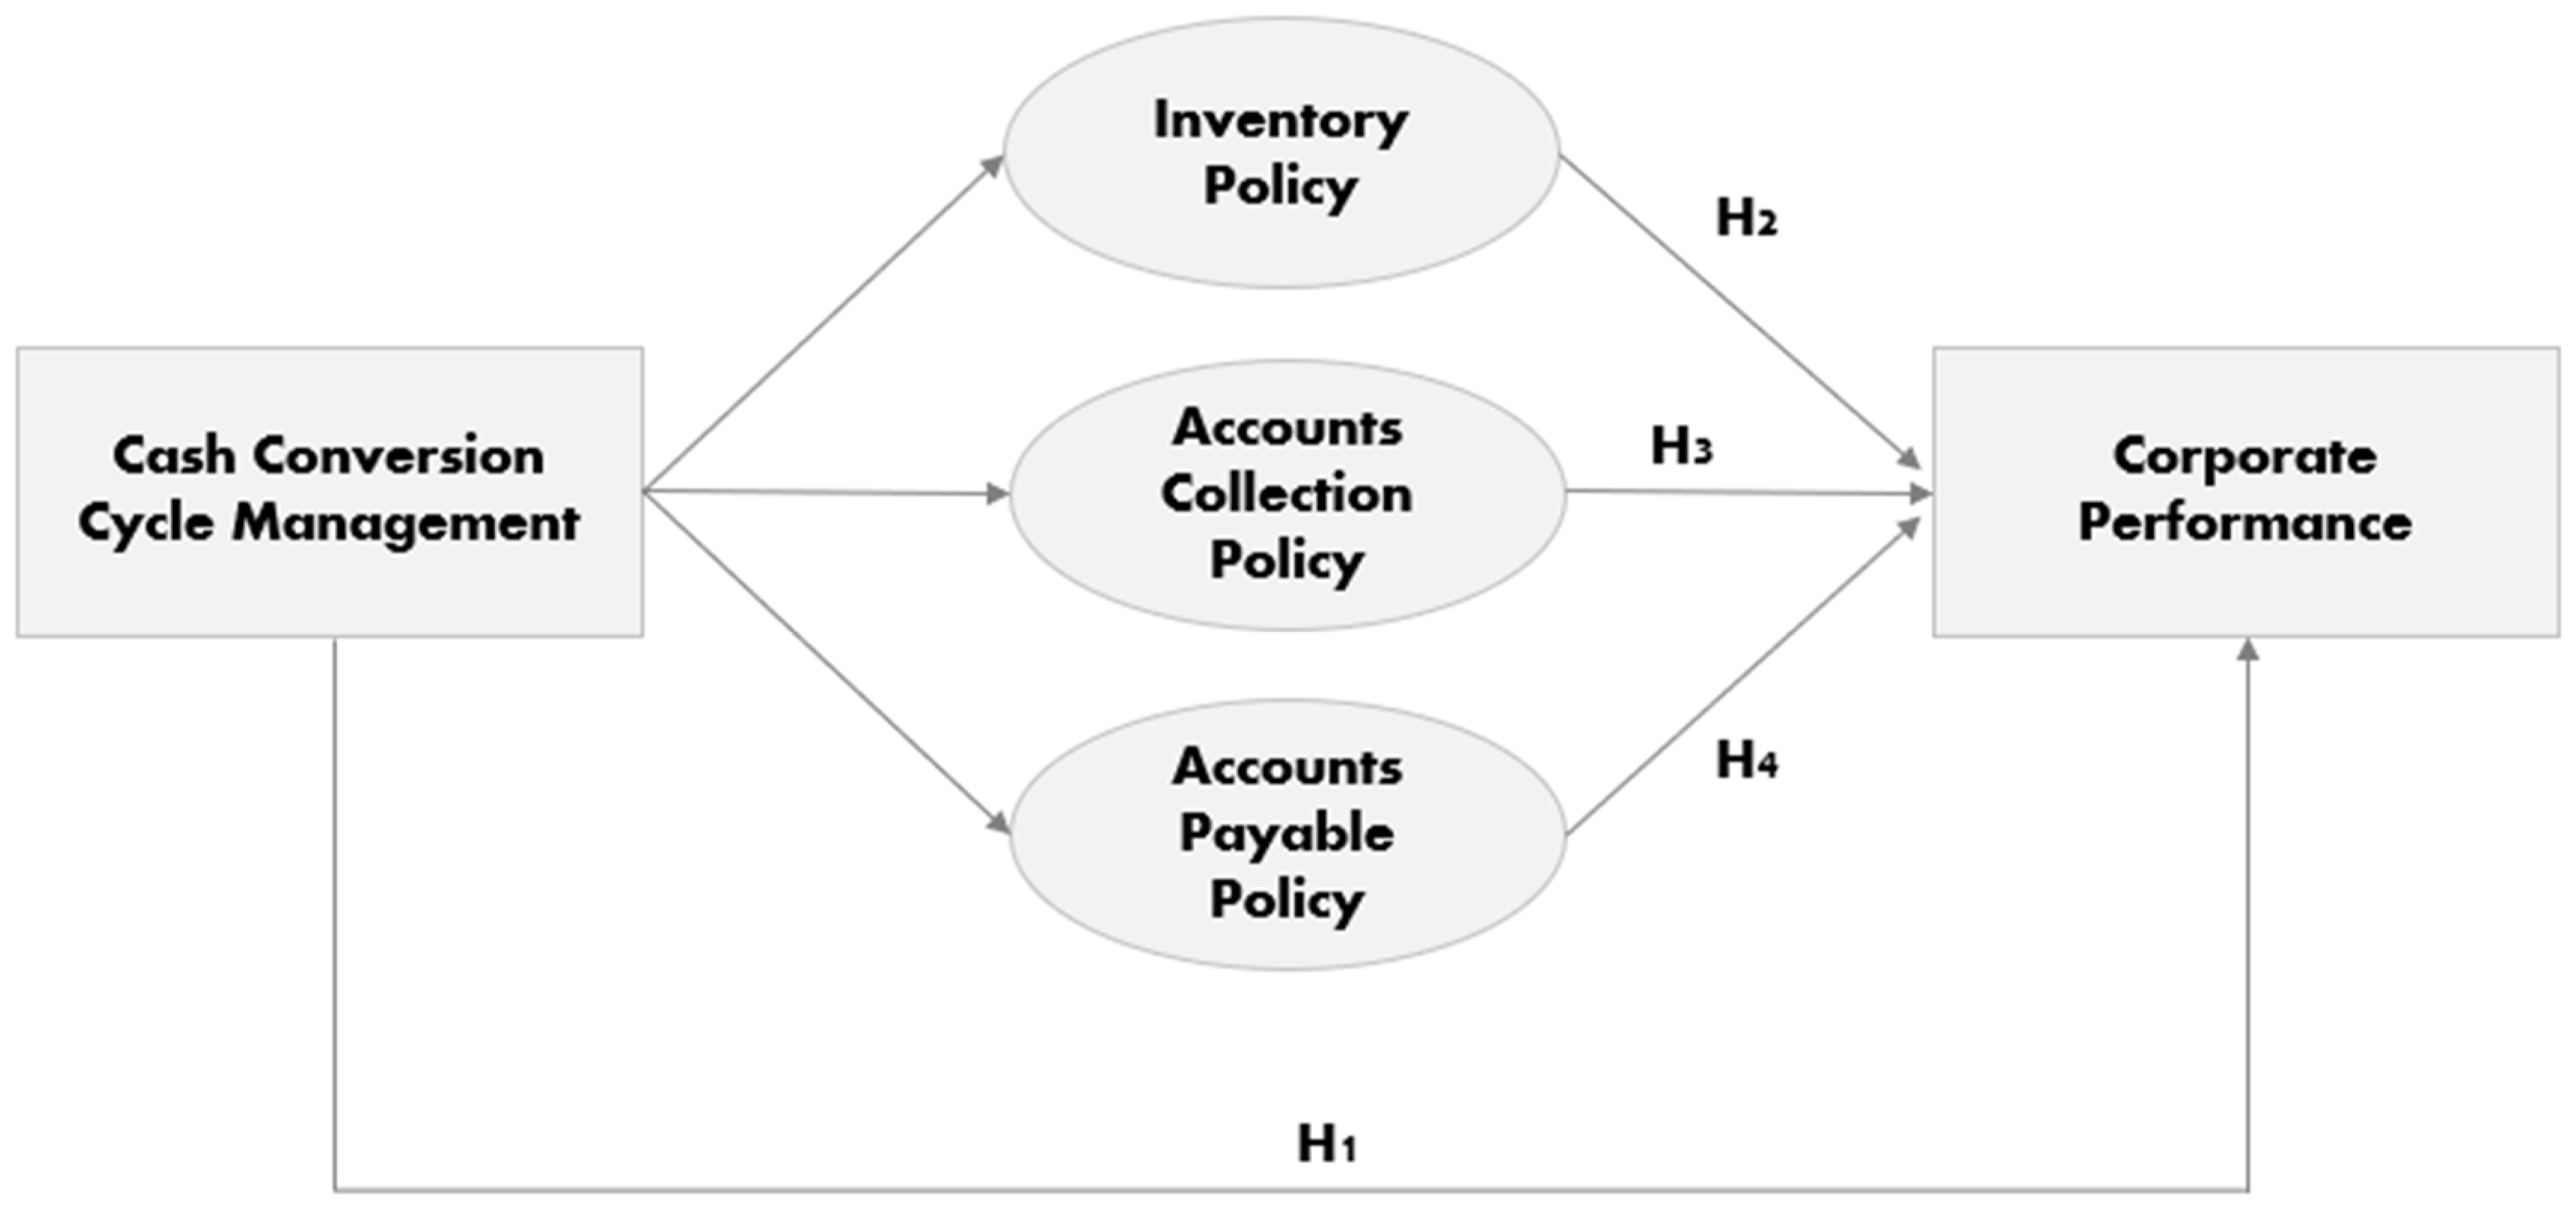
  • The primary goal of this study is to examine how the cash conversion cycle impacts the performance of manufacturing companies in Saudi Arabia. This overarching objective is further divided into four sub-objectives, which are delineated as follows:
  • To inspect the link between the aggregate cash conversion cycle and the firm’s performance.
  • To explore the link of the inventory policy with the firm’s performance.
  • To explore the link of the accounts receivable policy with the firm’s performance.
  • To consider the link of the accounts payable policy with the firm’s performance.
This study employed a quantitative research methodology utilizing multiple regression analysis to examine the formulated research hypotheses. To account for variations across companies, we incorporated the firm-specific fixed effect, following the fixed effects model approach. According to empirical findings, improving performance levels in Saudi indexed manufacturing companies can be achieved by reducing inventory conversion time, shortening the receivable collection period, and managing payments to creditors in a way that minimizes potential delays. This research is the first investigation into whether managing the cash conversion cycle plays a crucial role in determining the performance of Saudi manufacturing companies, especially in the context of the coronavirus pandemic. This study aims to enhance our understanding of the importance of liquidity management in the overall corporate performance of these companies. The findings could be valuable for management teams in identifying their responsibilities in effectively managing the cash cycle.
Due to the transition outlined in the Saudi Vision 2030, the Kingdom of Saudi Arabia (KSA) emerges as an ideal country for conducting this study. Instead of relying solely on oil, the KSA is now focusing on manufacturing as a key component of its economy. The recent decline in oil prices resulting from the COVID-19 pandemic has also prompted the KSA government to reevaluate the importance of non-oil and gas industries (Shaik 2021b). Consequently, the attention has shifted towards other sectors, with manufacturing ranking at the forefront.
The rest of this paper is structured as follows: Section 2 provides the literature review and the hypotheses development. Section 3 describes the sample selection and data collection. Section 4 displays the empirical outputs. Section 5 presents the conclusions.

2. Literature Review and Hypotheses Development

2.1. Cash Conversion Cycle Management and Firm Performance

Working capital management is very important in the field of corporate financial management. It implies the decisions on the amount and elements of current assets and the financing of these elements. Current assets are those assets transformed to cash within a short period of time. Furthermore, working capital management is of great importance due to its consequences on the firm’s profitability, risk level, and value (Smith 1980; Raheman and Nasr 2007; Demiraj et al. 2022). Figure 1 shows the different associations among the components of the working capital.
The management of working capital can significantly impact a company’s liquidity and performance, as stated by Deloof (2003). When a business prioritizes maximizing profitability, it often reduces the likelihood of maintaining sufficient liquidity. On the other hand, if a company primarily focuses on ensuring high liquidity, it may result in a lower overall performance potential for the firm. Traditionally, when a company wants to take bigger risks for potential high profits and losses, it typically reduces its working capital relative to its sales. Conversely, if the company aims to improve its liquidity, it increases its working capital. However, this approach may lead to a decrease in sales volume and ultimately profitability. Therefore, it is important for businesses to find a balance between liquidity and profitability, as stated by Vishnani and Shah (2007).
The cash conversion cycle is a great tool for evaluating how well a business manages its working capital (Gitman 1974; Richards and Laughlin 1980; Jose et al. 1996; Deloof 2003). The cash conversion cycle is a proxy that indicates the length of time, in days, that it takes for a business to transform resources into cash. Previous studies demonstrate that the three elements of the cash conversion cycle (inventory, accounts receivable, and accounts payable) can be managed in various ways to increase corporate performance and foster business growth (Mathuva 2010; Karim et al. 2023). A company can boost its sales by enforcing a favorable credit policy, ultimately leading to an expansion of the cash cycle. In this scenario, having a longer cash conversion cycle could potentially enhance overall performance. However, according to traditional beliefs, all else being equal, a longer cash conversion cycle typically has a negative impact on corporate performance (Deloof 2003; Smith 1980). We therefore formulate the following first hypothesis:
Hypothesis 1.
There is a significant link between cash conversion cycle management and Saudi corporate’s performance.

2.2. Inventory Management and Firm Performance

Inventories are the essential assets of the production process. They are a frequently used evaluation of industrial processes and performance level (Karim et al. 2018). The management of these inventories is a most important element of any supply chain (Wangari 2015). Therefore, inventories supervision is fundamental to prevent losses caused by stock shortages and excesses. In fact, the volume of inventory on-hand has a significant impact on the sales and, eventually, profitability (Eroglu and Hofer 2011; Gill et al. 2010; Koumanakos 2008). Inventory turnover is an effective sign of operational efficiency. It constitutes a proxy of how efficient the movement of goods along the manufacturing supply chain is and how fast they are sold (Kwak 2019).
Manufacturing businesses execute the manufacturing process from purchasing direct materials, and then transforming these materials into finished products to profit realization. Hence, there is a direct connection between efficient inventory management and profit (Ali et al. 2022). Such efficient management allows the business to hold an optimum level of inventory to fulfill orders on time and line up with the business’s targets. Reducing the order fulfillment cycle time decreases the cost of inventory, which realizes profits and positively influences customer satisfaction. A firm with efficient management of inventories faces long-term and robust growth prospects and a better-going concern situation.
The link between inventory control and firm performance has been subjected to numerous studies, both empirical and methodological. Koumanakos (2008) investigated the effect of inventory management on corporate performance. Using a sample of Greek industrial companies indexed between 2000 and 2002, the researcher obtained that the higher the level of inventories preserved by a firm, the lower its rate of returns. Muchaendepi et al. (2019) assessed the inventory control strategies used by manufacturing enterprises in Zimbabwe. The outputs determined that when the management uses the just-in-time method, it faces challenges in the supply chain. Mishra et al. (2021) investigated sustainable inventory management to attain green and sustainable supply chains. The findings exhibit a justifiable amount of profit. In a similar vein, Rodrigo et al. (2020) analyzed the influence of managing the inventories on financial performance of manufacturing firms in Sri Lanka for a period from 2014 to 2018. The outputs indicate that the inventory conversion period negatively affects the return on assets level, the cash flow from operations, and the market value added. Accordingly, the lower the time taken to transform inventories to sales, the higher the financial performance and vice versa. Furthermore, the findings suggest a non-significant link between inventory turnover and financial performance. Koumanakos (2008) conducted a study analyzing how inventory management influences the financial performance of companies in Greece. The findings indicate that the higher the level of inventories kept by the firm, the lower its return rate.
Regarding the KSA background, the growth and development of the manufacturing industry after the COVID-19 pandemic boosted the researchers to examine the link between corporate performance and some financial ratios. Rehman et al. (2014) and Khan and Khokhar (2015) studied the profitability of the indexed Saudi manufacturers from 2008 to 2012. Empirical results expose a significant link between the selected financial ratio and firm profitability proxied by the net profit margin. Hashed and Shaik (2022) explored the link between inventory management efficiency and financial performance of the Saudi listed firms from 2016 to 2020. The findings show that efficient inventory management positively and significantly affects firms’ financial growth, as proxied by the ROA. Moreover, they demonstrate a strong and meaningful correlation between the duration of inventory conversion and inventory turnover. These findings suggest that the management of inventory in Saudi companies is effective, and that efficient inventory management can have a positive impact on the overall performance of the firm. According to the findings of a recent study conducted by Alnaim and Kouaib (2023), it was concluded that there is a positive relationship between higher inventory turnover ratios and increased costs that can be minimized, resulting in enhanced profitability for manufacturing companies in Saudi Arabia.
Despite the significance of inventory control in the operations management and its capability to produce earnings, limited investigations have been directed on the effect of inventory management on corporate performance in the manufacturing-developed context such as the KSA (Rehman et al. 2014; Khan and Khokhar 2015; Hashed and Shaik 2022; Kouaib 2022; Alnaim and Kouaib 2023). Hence, it becomes valuable to study the outcome of inventory management on Saudi manufacturing firms’ performance. We therefore hypothesize accordingly:
Hypothesis 2.
There is a significant link between inventory management and Saudi corporate’s performance.

2.3. Accounts Receivable Management and Firm Performance

Accounts receivables are generated when a firm sells an account to raise its business sales. Receivables accounts management is often told by the lending practices and payment process of a business. Export receivables are the volume of activities fees that the customers are receiving (Jana 2018).
A higher accounts receivable balance could have harmful impacts. If a business has a lot of debtors, it will run out of money and can make short-term financial engagements that are not possible to meet. Accounts receivables are a significant factor in the firm value creation policy and are a crucial source of competitive advantage for the business. Thus, corporations need to carefully supervise their accounts collection policy so as not to position their liquidity status under extreme pressure and unfair competition (Niresh 2012). Proper management of the accounts receivable balance is important and effective, affecting economic output, and evaluating a company.
A high accounts receivable turnover signifies that the capital in accounts receivable will decrease. This capital can then be invested in gainful actions to increase the business’s wealth. Hence, the higher the rate of the accounts receivable turnover, the more likely the business will be profitable. This is supported by previous research findings (Mathuva 2010; Karim et al. 2023) and is in line with the pecking order theory, tending to use the adequate internal funds sources such as retained earnings. In this sense, Vahid et al. (2012) demonstrated that the increase in the collection period will lead towards the decline of firm profitability. Hence, we hypothesize accordingly:
Hypothesis 3.
There is a significant association between accounts receivable management and Saudi corporate’s performance.

2.4. Accounts Payable Management and Firm Performance

The payment period refers to the duration that a company takes to settle its bills and invoices with its trade creditors, such as suppliers, vendors, and financiers. This period is significant as it reflects the company’s operational efficiency and resource utilization through a turnover ratio calculation.
The duration of payment periods tends to differ according to the industry or size of the company, with larger companies typically having greater leverage in postponing payment deadlines. Companies with a high days payable outstanding (DPO) have the flexibility to postpone payments, allowing them to utilize their cash for short-term investments, improve their working capital, and increase their free cash flow. However, although higher DPO values are generally beneficial, they may not always be indicative of a healthy business. Instead, they could suggest a potential cash shortage and an inability to meet payment obligations. In this sense, Vahid et al. (2012) showed that the increase in the average payment period in days will lead towards the reduction in firm profitability. We therefore formulate the following hypothesis:
Hypothesis 4.
There is a significant association between accounts payable management and Saudi corporate’s performance.

3. Research Design and Methodology

3.1. Sample Selection and Model Specifications

This research investigates the connection between different components of the CCC and the performance of manufacturing firms in Saudi Arabia. We collected data on Saudi manufacturing companies listed on the Saudi Exchange from the Thomson Reuters Database and annual reports. We excluded firms from the financial sector, non-manufacturing companies, and firms with missing data. The final sample for analysis consists of 88 firms operating in the Saudi manufacturing sector from 2018 to 2022. These selected firms are categorized into five industry groups based on the global industry classification standard (GICS). Among these industry groups, the materials industry has the highest number of firm-year observations, totaling 230 observations, as shown in Table 1.
To test the developed hypotheses, we analyze two econometric regressions. Equation (1) is to test hypothesis (1) and Equation (2) is to test hypotheses through (2) to (4). To avoid the influence of outliers, we winsorize all continuous variables at the 1st and 99th percentiles. Kindly consult Appendix A to obtain information regarding the measurement of variables. Figure 2 describes the developed hypotheses.
R O A i t = α 0 + α 1 C C C i t + α 2 F S I Z E i t + α 3 D E B T i t + α 4 B S I Z E + α 5 B I G i t + α 6 C O V I D i t + F I R M S + Y E A R S
R O A i t = a 0 + a 1 I C P i t + a 2 A R C P + a 3 D P O i t + a 4 F S I Z E i t + a 5 D E B T i t + a 6 B S I Z E + a 7 B I G i t + a 8 C O V I D i t + F I R M S + Y E A R S
ROA is return on assets, CCC is cash conversion cycle, ICP is inventory conversion period, ARCP is accounts receivable collection period, DPO is days payable outstanding, FSIZE is firm size, DEBT is debt ratio, BSIZE is board size, BIG is Big4 auditor, COVID is coronavirus pandemic. FIRMS and YEARS are firms’ and years’ indicators. Please refer to Appendix A for variables’ measurement.

3.2. Variables Measurement

3.2.1. Dependent Variable: Firm Performance Measurement

Firm performance signifies the firm operating efficiency and its capability to produce earnings. The performance ratios used in the literature comprise return on assets, return on sales, return on investment, return on equity, earnings per share, return on capital employed, economic value added, cash return on capital invested, gross profit margin, and net profit margin (Louw et al. 2022; Alnaim and Kouaib 2023).
To proxy for firm performance in this current investigation, we refer to the measure return on assets (ROA), as in most previous studies (Kim 2005; Alnaim and Kouaib 2023). The ROA metric quantifies the effectiveness of a company’s management in utilizing their economic resources or assets listed on their balance sheet to generate profits (Kim 2005). This indicator is calculated by dividing the book value of net profit after tax by the total assets. A higher ROA value signifies that the manufacturer is achieving a favorable equilibrium in profit generation.

3.2.2. CCC Variables Measurement

The selection of variables on cash conversion cycle measurements is based on the review of the operations management literature (White et al. 1999; Gaur et al. 2005; Schonberger 2007; Shah and Shin 2007; Mathuva 2010; King and Lenox 2011; Eroglu and Hofer 2011; Gitman et al. 2015; Karim et al. 2023).
Firstly, the inventory policy is measured by the inventory conversion period (ICP). The ICP denotes the time taken to transform the inventory held by the company into sales (Gitman et al. 2015). The more quickly inventory is sold, the higher the resulting profit. Secondly, the firm’s collection policy can be evaluated through the average collection period of accounts receivable (ARCP). This measurement, as mentioned by Gitman et al. (2015), is useful for assessing credit and collection policies. It is also crucial for determining short-term liquidity, as it represents the average number of days it takes for a business to convert accounts receivable into cash. To compute ARCP, the average accounts receivable balance is divided by total sales, as stated by Brigham (1995). A longer collection period indicates a higher risk of uncollectible accounts receivable, which can negatively impact the company’s profitability. Thirdly, the days payable outstanding (DPO) represents the average duration in days that a company takes to settle its invoices and bills to trade creditors such as suppliers, vendors, and financiers. It is calculated by dividing the average accounts payable balance by the cost of goods sold. A low DPO suggests a shorter average payment period, indicating that the business is promptly paying off its debts. Conversely, an exceptionally low DPO indicates that the company is not fully utilizing the credit terms offered by its suppliers. On the other hand, a higher DPO value could be indicative of a cash shortage and the company’s inability to make timely payments. Finally, the aggregate cash conversion cycle (CCC) is a proxy that indicates the length of time, in days, that it takes for a business to transform resources into cash flows. Therefore, CCC can be defined as the combination of average collection period and inventory turnover, subtracted by the days of payables outstanding, as stated by Keown et al. (2003). A business that has a shorter CCC tends to be more efficient because it can convert its working capital into sales and profits more frequently throughout the year. On the other hand, a business with a longer CCC is likely to have a negative impact on its overall performance.

3.2.3. Control Variables

The research regressions control firm size, debt ratio, board of directors’ size, Big4 auditing services, and COVID-19 effects.
To begin with, we assess the size of the firm by examining the natural logarithm of total assets (FSIZE). Larger companies have the potential to benefit from economies of scale, which result in increased production volumes and reduced costs (Pfeffer and Salancik 1978). Additionally, we utilize the debt ratio (DEBT), which is determined by the ratio of total liabilities to total assets, as an indicator of the firm’s stability. A smaller debt ratio reflects the enhanced stability of the financial firm. Moreover, we regulate the size of the board of directors (BSIZE) by considering the total number of members on the board. Furthermore, we examine the impact of utilizing Big4 audit firms (BIG) to assess the influence of external auditing services. In our analysis, we examine the effect of the COVID-19 pandemic period on corporate profitability. To do so, we utilize an indicator variable that takes a value of 1 for firm-year observations during the pandemic period of 2020–2021 and 0 for all other observations (Shaik 2021a). The Wald tests indicate that the regression model (YEARS) should include the time-specific fixed effects. The acronym and definition of all the variables used in the analysis are provided in Appendix A.

4. Main Findings

4.1. Descriptive Statistics

Table 2 displays the summarization of data. In Panel A, you can find the average, median, standard deviation, kurtosis, skewness, minimum, and maximum values for continuous variables. Panel B shows the frequency of dichotomous variables (BIG and COVID). To remove outliers, all variables have been winsorized at the 1% and 99% levels. Additional details about the selected variables can be found in Appendix A.
The descriptive statistics reveal that the mean value of the ROA is 8.87%. Then, the Saudi manufacturing businesses create earnings about 8.9 percent from the assets held. CCC’s high value may be since the selected sample includes firms of all sizes and sectors and also may be due to differences in their ages (mean = 52.6971). The average inventory conversion period (ICP) for a manufacturing firm listed on the Saudi Stock Exchange is 103 days. Hence, the Saudi manufacturing companies need around 3 months and 10 days to convert materials into sales. The average collection period (ARCP) is 81. Therefore, the debtors hold onto sales for approximately 81 days, while the average payment period is around 60 days. This suggests that the companies in the sample make prompt payments. The average size of our sampled firms is 17, with a standard deviation of 2.1495. Additionally, the average debt is 1.5898, with a standard deviation of 3.6516. Panel B in Table 2 presents the frequencies of observations. During the COVID-19 period, 40 percent of firms fall into this category, and 57 percent of the analyzed observations are audited by at least one of the Big4 audit firms.

4.2. Multicollinearity Test

Table 3 provides an overview of the correlation coefficients. The upper triangle presents the Pearson correlation coefficients, while the lower triangle displays the Spearman correlation coefficients. These matrices are used to address potential issues related to multicollinearity. After analyzing the correlation structure of the data, we observed a strong correlation between ICP, ARCP, DPO, and CCC. This correlation is mechanistic, as the CCC involves managing three elements (inventory, accounts receivable, and accounts payable) while maintaining balance (Charitou et al. 2010). Overall, the matrices indicate that all other correlation coefficients are below 0.5 and above −0.5, suggesting that our conclusions are unbiased. Furthermore, we conducted a variance inflation factor (VIF) coefficients test. The VIF values for our variables are all below 2, indicating no significant correlation issues among the independent variables (Gujarati 2003).

4.3. Panel Tests

We acknowledge that certain elements of the CCC may be associated with factors that were not considered in the regression analysis due to unavailability of data. These factors could include economic conditions, the company’s cycles, monetary policies, industry-specific conditions, and growth opportunities. Moreover, it is worth noting that industry-specific and economic settings at the national level can have an impact on the effectiveness of inventory policies and overall company performance (Rodrigo et al. 2020). To address any potential biases resulting from omitted firm-specific factors that could influence CCC components and company performance, we employ a linear regression model with fixed effects. Additionally, the results from the Hausman test support the selection of a fixed effects model over a random effect model for our dataset. We utilized the modified Wald test to evaluate the presence of segment-wise heteroskedasticity and the Wooldridge test to examine autocorrelation in our panel dataset. Both tests indicated violations in our data, which means that our statistical inferences should be made using robust standard errors that account for both heteroskedasticity and autocorrelation issues.

4.4. Hypotheses Validation and Discussion

Table 4 summarizes the empirical findings obtained from using a multiple regression analysis (MRA) technique to evaluate the effect of the selected variables (CCC, ICP, ARCP, and DPO) on the level of ROA for Saudi indexed manufacturers.
In agreement with H1, Panel A from Table 4 denotes that there is a significant nexus between cash conversion cycle management and Saudi corporate’s performance. The coefficient on the CCC is negative and significant ( α 1 = 0.145 ) at the 5-percent level, implying that the variable is inversely related to firm performance. In other words, corporate performance of Saudi indexed companies inclines to rise with fewer days in the CCC. This infers that a firm with a shorter cycle is more likely to be performant than is a firm with a longer cycle. Hence, minimizing the firm’s days of the cash cycle may optimize firm performance. This finding provides support to hypothesis H1.
Panel B from Table 4 presents the results from estimating the second equation. In accordance with H2, the findings show a significant link between inventory management and Saudi corporate’s performance. The coefficient on ICP is negative ( a 1 = 0.211 ) and statistically significant at the 5-percent level. Hence, the period taken to transform inventories into sales affects the corporate performance of Saudi manufacturers. The faster the inventory is sold, the greater the profit that is earned. This provides support to hypothesis H2 and agrees with the findings of the recent studies of Shaik (2021b), Hashed and Shaik (2022), and Alnaim and Kouaib (2023) elaborated in the Saudi context. Alnaim and Kouaib (2023) tested the impact of the inventory turnover as a component of the liquidity cycle on the profitability level of Saudi manufacturing companies. They find a positive association between the inventory turnover ratio and profitability level. This result suggests that the Saudi manufacturing firms efficiently manage their inventories and can sell their products quickly, which positively impacts the profit earned. Regarding H3, the findings show that the coefficient on ARCP is negative ( a 2 = 0.035 ) and statistically significant at the 5-percent level. Therefore, firm collection policy has an important effect on firm performance level. This result indicates a strong and adverse relationship between the duration Saudi manufacturers spend on collecting cash from customers and their company’s performance. A longer duration for collecting payments implies that there is a risk that the accounts receivable may not be collected, potentially leading to a loss in profitability for the company. This provides support to hypothesis H3 and agrees with Deloof (2003), who emphasized the importance of businesses reducing the time it takes to collect receivables to improve performance. Finally, Panel B displays a strongly evident positive correlation between the average payment period, time taken to pay trade creditors, and the level of firm performance. The coefficient on DPO is significantly positive ( a 3 = 0.017 ) at the 10-percent level. Thus, a higher value of DPO may signal a cash shortfall and inability to pay, which negatively affects the firm performance level. This provides support to hypothesis H4 and agrees with the findings of the recent studies of Shaik (2021b).
In addition, some of the tested firm-specific characteristics are found to have a significant impact on firm performance. Both Panels A and B show that firm size (FSIZE) is positive and statistically significant at the 5-percent level. This output signifies that firm size positively affects corporate performance. The ROA–DEBT relationship is negative and statistically significant. A more favorable financial stability of a firm is indicated by a decreased debt ratio, which also suggests a higher level of performance. Additionally, the research findings revealed a positive correlation between the COVID-19 crisis and performance, with a particularly strong link between return on assets (ROA) and the pandemic. This indicates that the performance level of Saudi indexed manufacturers significantly increased during the COVID-19 pandemic period. Nevertheless, BSIZE and BIG exhibit non-significant connections with ROA.
A recent study, of Alnaim and Kouaib (2023), tested the impact of the inventory turnover as a component of the liquidity cycle on the profitability level using a set of data from indexed manufacturers. Our present research extends this study by using more components of the cash cycle and we find an inverse relationship between the CCC and firm performance. Put simply, Saudi indexed companies tend to perform better when they have a shorter CCC. This suggests that companies with shorter cash cycles are more likely to be successful compared to those with longer cycles. Therefore, optimizing firm performance can be achieved by reducing the number of days in the cash cycle. Compared to the similar studies conducted in the context of industrial firms in the KSA, Shaik (2021b) demonstrated that Saudi industrial firms have shorter periods in accounts receivable, accounts payable, and inventory, leading to firm profitability.

4.5. Robustness Checks and Further Analysis

We assess the robustness and the validity of our main findings by running some sensitivity tests.
First, we select the financial ratio of inventory turnover to proxy for the inventory management and we re-run Equation (1) as follows:
R O A i t = a 0 + a 1 I T R i t + a 2 A R C P + a 3 D P O i t + a 4 F S I Z E i t + a 5 D E B T i t + a 6 B S I Z E + a 7 B I G i t + a 8 C O V I D i t + F I R M S + Y E A R S
where ITR is the inventory turnover ratio computed by splitting the cost of goods sold over the average value of total inventory. A high ITR means that the inventory is quickly sold so the profit earned is higher. Untabulated results from estimating Equation (3) provide evidence that there is a significant link between inventory handling and Saudi corporate’s performance.
Second, we re-test models (1) and (2) using the earnings per share (EPS) to proxy for corporate performance as follows:
E P S i t = α 0 + α 1 C C C i t + α 2 F S I Z E i t + α 3 D E B T i t + α 4 B S I Z E + α 5 B I G i t + α 6 C O V I D i t + F I R M S + Y E A R S
E P S i t = a 0 + a 1 I C P i t + a 2 A R C P + a 3 D P O i t + a 4 F S I Z E i t + a 5 D E B T i t + a 6 B S I Z E + a 7 B I G i t + a 8 C O V I D i t + F I R M S + Y E A R S
where EPS is earnings per share determined by splitting the firm’s net income by the total number of outstanding shares. In this occurrence, we estimate Equations (4) and (5) and we obtain the same findings and the inferences remain unchanged (untabulated results).
Finally, 52% of the firm-year observations are from the materials industry group (230 out of 440 observations). Therefore, we re-run the estimation of the two research models after elimination of the material sector observations from the tested sample. The final tested sample contains, then, 210 firm-year observations. The untabulated findings demonstrate that the results remain unchanged and are not affected by the fact that so many companies are operating in sector materials.

5. Conclusions

The objective of this study was to investigate how cash conversion cycle management affects the overall performance of the manufacturing sector in Saudi Arabia. To achieve this, this study analyzed the correlation and regression between performance ratios (ROA and EPS) and various key working capital policy indicator ratios, thereby examining the impact of working capital policies on firm performance. Several prior studies have found consistent results, indicating that there is a negative relationship between the cash conversion cycle and firm performance, specifically measured by return on assets (ROA). Essentially, this suggests that improving performance for Saudi indexed manufacturers may involve reducing inventory conversion time, shortening the time it takes to collect receivables, and potentially delaying payments to creditors. These empirical findings support the idea that managing the cash conversion cycle effectively can lead to improved performance (Deloof 2003; Karim et al. 2023).
Limitations and future research directions: The present study is limited to a sample of Saudi indexed manufacturers in five industries regarding the available data. Further examinations could assess the generalizability of these conclusions to other countries, other industrial sectors, or separately for each industry. Moreover, this research relied solely on secondary sources, resulting in limited information. This implies that there could be numerous unexplored working capital factors not covered by this study. Consequently, it is recommended to conduct future research endeavors to uncover additional working capital variables that significantly influence corporate performance.
Findings implications: The present study’s discoveries have several important implications. First, they contribute to existing literature by utilizing an ROA model to examine a comprehensive sample across various sectors, both before, during, and after the COVID-19 pandemic. Its empirical evidence adds to the existing body of knowledge on the topics of corporate profitability and working capital management. Second, the results of this research can be useful for managers of the manufacturing firms in Saudi Arabia. They can efficiently manage working capital policy through reducing the cash conversion cycle period to improve firm performance and create additional value. Managers can make a positive value for the shareholders by decreasing the average collection period, inventory turnover in days, and the average payment period to a minimum level. Finally, the outputs can be used by auditors, debt holders, and other stakeholders to monitor and judge the efficiency of the corporate management and working capital.

Author Contributions

Conceptualization, A.K. and M.I.B.H.; methodology, A.K. and M.I.B.H.; software, A.K.; validation, A.K.; formal analysis, A.K. and M.I.B.H.; investigation, A.K. and M.I.B.H.; resources, A.K.; data curation, A.K.; writing—original draft preparation, A.K. and M.I.B.H.; writing—review and editing, A.K. and M.I.B.H.; visualization, A.K. and M.I.B.H.; supervision, A.K. and M.I.B.H.; project administration, A.K. and M.I.B.H.; funding acquisition, A.K. and M.I.B.H. All authors have read and agreed to the published version of the manuscript.

Funding

This work was supported by the Deanship of Scientific Research, Vice Presidency for Graduate Studies and Scientific Research, King Faisal University, Saudi Arabia [GRANT NO. 4713].

Data Availability Statement

Data are contained within the article.

Conflicts of Interest

The authors declare no conflicts of interest.

Appendix A

Table A1. Variables’ measurement.
VariableSymbolMeasureReferenceData Source
Return on assetsROABook value of net profit after tax/total assetsKim (2005)Datastream
Inventory conversion periodICP(Average inventory/cost of goods sold) × 365Gitman et al. (2015)Datastream
Accounts receivable collection periodARCP(Average receivables/sales) × 365Brigham (1995)Datastream
Days payable outstandingDPO(Average payables/cost of goods sold) × 365Brigham (1995)Datastream
Cash conversion cycleCCCCCC = ICP + ARCP − DPOKeown et al. (2003)Datastream
Firm sizeFSIZENatural logarithm of total assets.Fama and French (1995)Datastream
Debt ratioDEBTLong-term liabilities divided by lagged total assets. Datastream
Board sizeBSIZENumber of members in the board.Beiner et al. (2004) and Alves (2011)Datastream
Big4 auditorBIGIndicator that takes the value of 1 if the company is audited by at least one of the Big4 audit firm, and 0 otherwise. Annual reports
COVID-19COVIDIndicator that takes a value of 1 for the firm-year observations that fall in the coronavirus pandemic (2020–2021), and 0 otherwise. Authors

References

  1. Ali, Khurshid, Numaira Showkat, and Khaled Achraf Chisti. 2022. Impact of inventory management on operating profits: Evidence from India. Journal of Finance and Economics 10: 47–50. [Google Scholar] [CrossRef]
  2. Alnaim, Musab, and Amel Kouaib. 2023. Inventory turnover and firm profitability: A Saudi Arabian Investigation. Processes 11: 716. [Google Scholar] [CrossRef]
  3. Alves, Sandra Maria Geraldes. 2011. The effect of the board structure on earnings management: Evidence from Portugal. Journal of Financial Reporting and Accounting 9: 141–60. [Google Scholar] [CrossRef]
  4. Attari, Muneeb, and Kashif Raza. 2012. The optimal relationship of cash conversion cycle with firm size and profitability. International Journal of Academic Research in Business and Social Sciences 2: 189–203. [Google Scholar]
  5. Beiner, Stefan, Wolfgang Drobetz, Frank Schmid, and Heinz Zimmermann. 2004. Is board size an independent corporate governance mechanism? Kyklos 57: 327–56. [Google Scholar] [CrossRef]
  6. Brigham, Eugene. 1995. Fundamentals of Financial Management. Mason Ohio: The Dryden Press. [Google Scholar]
  7. Charitou, Melita Stephanou, Maria Elfani, and Petros Lois. 2010. The effect of working capital management on firm profitability: Empirical evidence from an emerging market. Journal of Business & Economics Research 8: 63–68. [Google Scholar] [CrossRef]
  8. Deloof, Marc. 2003. Does working capital management affect profitability of Belgian firms? Journal of Business Finance and Accounting 30: 573–88. [Google Scholar] [CrossRef]
  9. Demiraj, Rezart, Suzan Dsouza, and Mohammad Abiad. 2022. Working Capital Management Impact on Profitability: Pre-Pandemic and Pandemic Evidence from the European Automotive Industry. Risks 10: 236. [Google Scholar] [CrossRef]
  10. Ebben, Jay, and Alec Johnson. 2011. Cash conversion cycle management in small firms: Relationships with liquidity. Journal of Small Business & Entrepreneurship 24: 381–96. [Google Scholar] [CrossRef]
  11. Enqvista, Julius, Michael Graham, and Jussi Nikkinen. 2014. The impact of working capital management on firm profitability in different business cycles: Evidence from Finland. Research in International Business and Finance 32: 36–49. [Google Scholar] [CrossRef]
  12. Eroglu, Cuneyt, and Christian Hofer. 2011. Lean, leaner, too lean? The inventory–performance link revisited. Journal of Operations Management 29: 356–69. [Google Scholar] [CrossRef]
  13. Fama, Eugene, and Kenneth French. 1995. Size and book-to-market factors in earnings and returns. Journal of Finance 50: 131–55. [Google Scholar] [CrossRef]
  14. Gaur, Vishal, Marshall Fisher, and Ananth Raman. 2005. An econometric analysis of inventory turnover performance in retail services. Management Science 51: 181–94. [Google Scholar] [CrossRef]
  15. Gill, Amarjit, Nahum Biger, and Neil Arun Mathur. 2010. The relationship between working capital management and profitability: Evidence from the United States. Business and Economics Journal 10: 1–9. [Google Scholar]
  16. Gitman, Lawrence. 1974. Estimating corporate liquidity requirements: A simplified approach. The Financial Review 9: 79–88. [Google Scholar] [CrossRef]
  17. Gitman, Lawrence, Juchau Roger, and Flanagan Jack. 2015. Principles of Managerial Finance. Boston: Pearson Education International. [Google Scholar]
  18. Gujarati, Damodar. 2003. Basic Econometrics, 4th ed. New York: McGraw Hill. [Google Scholar]
  19. Hashed, Abdul Wahid Ahmed, and Abdul Rahman Shaik. 2022. The nexus between inventory management and firm performance: A Saudi Arabian perspective. Journal of Asian Finance Economics and Business 9: 297–302. [Google Scholar] [CrossRef]
  20. Jana, Debabrata. 2018. Impact of working capital management on profitability of the selected listed FMCG companies in India. International Research Journal of Business Studies 11: 21–30. [Google Scholar] [CrossRef]
  21. Jordan, Randolph Westerfield. 2003. Fundamentals of Corporate Finance, 6th ed. Boston: McGraw-Hill Companies. [Google Scholar]
  22. Jose, Manuel, Carol Lancaster, and Jerry Stevens. 1996. Corporate returns and cash conversion cycles. Journal of Economics and Finance 20: 33–46. [Google Scholar] [CrossRef]
  23. Karim, Norazira, Anuar Nawawi, and Ahmad Saiful Azlin Puteh Salin. 2018. Inventory management effectiveness of a manufacturing Company—Malaysian evidence. International Journal of Law and Management 60: 1163–78. [Google Scholar] [CrossRef]
  24. Karim, Rejaul, Md Abdullah Al Mamun, and Abu Sadeque Md. Kamruzzaman. 2023. Cash conversion cycle and financial performance: Evidence from manufacturing firms of Bangladesh. Asian Journal of Economics and Banking, ahead-of-print. [Google Scholar] [CrossRef]
  25. Keown, Arthur, John Martin, William Petty, and David Scott. 2003. Foundations of Finance: The Logic and Practice of Financial Management, 4th ed. London: Pearson Education. [Google Scholar]
  26. Khan, Mohammad Nauman, and Imran Khokhar. 2015. The effect of selected financial ratios on profitability: An empirical analysis of listed firms of cement sector in Saudi Arabia. Quarterly Journal of Econometrics Research 1: 1–12. [Google Scholar] [CrossRef]
  27. Kim, Yangmin. 2005. Board network characteristics and firm performance in Korea. Corporate Governance An International Review 13: 800–8. [Google Scholar] [CrossRef]
  28. King, Andrew, and Michael Lenox. 2011. Lean and green? An Empirical examination of the relationship between lean production and environmental performance. Production and Operations Management 10: 244–56. [Google Scholar] [CrossRef]
  29. Kouaib, Amel. 2022. Corporate sustainability disclosure and investment efficiency: The Saudi Arabian context. Sustainability 14: 13984. [Google Scholar] [CrossRef]
  30. Koumanakos, Dimitrios. 2008. The effect of inventory management on firm performance. International Journal of Productivity and Performance Management 57: 355–69. [Google Scholar] [CrossRef]
  31. Kwak, Jin Kyung. 2019. Analysis of inventory turnover as a performance measure in manufacturing industry. Processes 7: 760. [Google Scholar] [CrossRef]
  32. Lin, Qi, and Xi Lin. 2021. Cash conversion cycle and aggregate stock returns. Journal of Financial Markets 52: 100560. [Google Scholar] [CrossRef]
  33. Louw, Elmarie, John Hall, and Rudra Pradhan. 2022. The relationship between working capital management and profitability: Evidence from South African retail and construction firms. Global Business Review 23: 313–33. [Google Scholar] [CrossRef]
  34. Mathuva, David. 2010. The Influence of Working Capital Management Components on Corporate Profitability: A Survey on Kenyan Listed Firms. Research Journal of Business Management 4: 1–11. [Google Scholar] [CrossRef]
  35. Mishra, Umakanta, Jei-Zheng Wu, and Biswajit Sarkar. 2021. Optimum sustainable inventory management with backorder and deterioration under controllable carbon emissions. Journal of Cleaner Production 279. [Google Scholar] [CrossRef]
  36. Muchaendepi, Wiseman, Charles Mbohwa, T. Hamandishe, and James Kanyepe. 2019. Inventory management and performance of SMEs in the Manufacturing sector of Harare. Procedia Manufacturing 23: 454–61. [Google Scholar] [CrossRef]
  37. Niresh, Aloy. 2012. Working capital management & financial performance of manufacturing sector in Sri Lanka. European Journal of Business and Management 4: 23–30. [Google Scholar]
  38. Peel, Michael, Nicholas Wilson, and Carole Howorth. 2000. Late payment and credit management in the small firm sector: Some empirical evidence. International Small Business Journal 18: 17–37. [Google Scholar] [CrossRef]
  39. Pfeffer, Jeffrey, and Gerald Salancik. 1978. The External Control of Organizations: A Resource Dependence Perspective. New York: Harper and Row. [Google Scholar]
  40. Raheman, Abdul, and Mohamed Nasr. 2007. Working capital management and profitability-case of Pakistani firms. International Review of Business Research Papers 3: 279–300. [Google Scholar]
  41. Rehman, Mohammed Ziaur, Muhammad Nauman Khan, and Imran Khokhar. 2014. Select financial ratios as a determinant of profitability evidence from petrochemical industry in Saudi Arabia. European Journal of Business and Management 6: 187–96. [Google Scholar]
  42. Richards, Verlyn, and Eugene Laughlin. 1980. A cash conversion cycle approach to liquidity analysis. Financial Management 9: 32–38. [Google Scholar] [CrossRef]
  43. Rodrigo, W. L. M., Sakunika Rathnayake, and C. Pathirawasam. 2020. Effect of inventory management on financial performance of listed manufacturing companies in Sri Lanka. IAR Journal of Business Management 1: 383–89. [Google Scholar]
  44. Ross, Stephen, Randolph Westerfield, and Bradford Jordan. 2003. Fundamentals of Corporate Finance, 6th ed. New York: The McGraw-Hill Companies. [Google Scholar]
  45. Schonberger, Richard. 2007. Japanese production management: An evolution—With mixed success. Journal of Operations Management 25: 403–19. [Google Scholar] [CrossRef]
  46. Shah, Rachna, and Hojung Shin. 2007. Relationships among information technology, inventory, and profitability: An investigation of level invariance using sector level data. Journal of Operations Management 25: 768–84. [Google Scholar] [CrossRef]
  47. Shaik, Abdul Rahman. 2021a. COVID-19 pandemic and the reaction of Asian stock markets: Empirical evidence from Saudi Arabia. Journal of Asian Finance, Economics, and Business 8: 1–7. [Google Scholar] [CrossRef]
  48. Shaik, Abdul Rahman. 2021b. Components of working capital and profitability in Saudi Arabian companies. Investment Management and Financial Innovations 18: 52–62. [Google Scholar] [CrossRef] [PubMed]
  49. Smith, Keith. 1980. Profitability Versus Liquidity Tradeoffs in Working Capital Management, Readings on the Movement of Working Capital. New York: West Publishing Company, St. Paul. [Google Scholar]
  50. Vahid, Taghizadeh Khanqah, Ghanavati Elham, Akbari Khosroshahi Mohsen, and Ebrati Mohammadreza. 2012. Working capital management and corporate performance: Evidence from Iranian companies. Procedia—Social and Behavioral Sciences 62: 1313–18. [Google Scholar] [CrossRef]
  51. Vishnani, Sushma, and Bhupesh Kr Shah. 2007. Impact of working capital management policies on corporate performance—An empirical study. Global Business Review 8: 267–81. [Google Scholar] [CrossRef]
  52. Wang, Yung-Jang. 2002. Liquidity management, operating performance, and corporate value: Evidence from Japan and Taiwan. Journal of Multinational Financial Management 12: 159–69. [Google Scholar] [CrossRef]
  53. Wangari, Kamau Lucy. 2015. Influence of inventory management practices on organizational competitiveness: A case of Safaricom Kenya LTD. International Academic Journal of Procurement and Supply Chain Management 1: 72–98. [Google Scholar]
  54. White, Richard, John Pearson, and Jeffrey Wilson. 1999. JIT manufacturing survey of implementations in small and large U.S. manufacturers. Management Science 45: 1–55. [Google Scholar] [CrossRef]
Figure 1. Cash conversion cycle components (source: Ross et al. 2003; Jordan 2003).
Jrfm 17 00016 g001
Figure 2. The investigated research models.
Jrfm 17 00016 g002
Table 1. Sample distribution by industry group.
SectorIndustry GroupFirmsObs.%
1EnergyEnergy4205
2MaterialsMaterials Industry Group4623052
3IndustrialsCapital Goods168018
4Consumer DiscretionaryConsumer Durables and Apparel7358
5Consumer StaplesFood and Beverages157517
Total 88440100
Table 2. Descriptive summary.
MeanMedianSt. Dev.KurtosisSkewnessMinimumMaximum
Panel A. Summary statistics
ROA8.87168.97345.28912.55281.59900.051030.1357
CCC (days)52.697141.6284145.14923.18550.09428.4300110.3149
ICP (days)103.431374.9566142.749828.53794.82795.17281106.0606
ARCP (days)81.006935.196321.087882.99708.496229.0526150.9347
DPO (days)59.164160.000026.83831.9355−0.052410.0000104.0000
FSIZE17.127015.94732.1495−0.82420.501614.041120.5364
DEBT1.58980.53013.651619.13045.00470.114219.3150
BSIZE8.35709.00003.251412.06513.82294.000024.0000
Panel B. Frequencies statisticsObs. Freq (1)% Freq (0)%
BIG440 21549 22551
COVID440 17640 26460
ROA: return on assets, CCC: cash conversion cycle, ICP: inventory conversion period, ARCP: accounts receivable collection period, DPO: days payable outstanding, FSIZE: firm size, DEBT: debt ratio, BSIZE: board size, BIG: Big4 auditor, COVID: coronavirus pandemic. Please refer to Appendix A for variables’ measurement.
Table 3. Pearson and Spearman correlations matrices and variance inflation factors (VIFs) coefficients.
ROACCCICPARCPDPOFSIZEDEBTBSIZEVIF
ROA1.0000−0.1478 ***−0.0861 *−0.0687 *0.0709 *0.0795 **−0.0330 *0.0542-
CCC−0.2568 **1.00000.4673 **0.5981 **0.4042 ***0.12250.0120 *0.14751.50
ICP−0.1030 **0.4394 **1.0000−0.02650.0137 ***0.0012−0.00160.0309 ***1.15
ARCP−0.0084 **0.4977 **−0.04551.00000.01730.3050 ***−0.04270.0913 *1.66
DPO0.0813 *0.4113 ***0.1822 ***0.03841.0000−0.07680.2778 ***−0.04351.24
FSIZE0.0885 **0.28920.0058 *0.3050 ***−0.08091.0000−0.2196 ***0.3901 ***1.57
DEBT−0.0237 *0.0208−0.0042−0.0427 *0.0933 ***−0.0804 ***1.0000−0.0411 ***1.39
BSIZE0.03660.13100.1614 ***0.0862 *−0.03640.0640 ***−0.0455 ***1.00001.46
ROA: return on assets, CCC: cash conversion cycle, ICP: inventory conversion period, ARCP: accounts receivable collection period, DPO: days payable outstanding, FSIZE: firm size, DEBT: debt ratio, BSIZE: board size. *, **, *** next to a coefficient indicate a significance level of 10%, 5%, and 1%, respectively. To avoid the influence of outliers, we winsorize all continuous variables at the 1% and 99% levels. Please refer to Appendix A for variables’ definition and measurement.
Table 4. Estimation results.
Panel A
Equation (1)
Panel B
Equation (2)
Coef.TCoef.T
Constant−3.672 ***−2.94−3.2569 ***−2.56
CCC−0.145 **−2.39
ICP −0.211 **−2.15
ARCP −0.035 **−2.04
DPO 0.017 *1.70
FSIZE0.754 **1.950.772 **1.93
DEBT−0.268 *−1.69−0.270 *−1.70
BSIZE0.0590.420.0630.48
BIG0.1461.570.1501.55
COVID0.115 *1.720.127 *1.74
FIRMSIncluded Included
YEARSIncluded Included
Observations440 440
R-sq (%)7.587 7.619
Adjusted R-sq (%)7.302 7.496
F-stat55.841 *** 53.110 ***
Prob (F-stat)0.000 0.000
ROA: return on assets, CCC: cash conversion cycle, ICP: inventory conversion period, ARCP: accounts receivable collection period, DPO: days payable outstanding, FSIZE: firm size, DEBT: debt ratio, BSIZE: board size. BIG is Big4 audit firms. COVID is COVID-19 pandemic effects. FIRMS and YEARS are firms’ and years’ indicators. *, **, *** next to a coefficient indicate a significance level of 10%, 5%, and 1%, respectively. To mitigate the impact of outliers, we perform winsorization on all continuous variables at the 1st and 99th percentiles. For detailed information on variable definitions and measurements, please refer to Appendix A.
Disclaimer/Publisher’s Note: The statements, opinions and data contained in all publications are solely those of the individual author(s) and contributor(s) and not of MDPI and/or the editor(s). MDPI and/or the editor(s) disclaim responsibility for any injury to people or property resulting from any ideas, methods, instructions or products referred to in the content.

