1. Introduction
The uncertain evolution of new contributors is a crucial component of demographic risk in social insurance schemes. Under a pay-as-you-go system, workers’ contributions are used to pay the benefits of current pensioners; thus, an adequate number of new contributors is required to guarantee the financial sustainability in the long term. Under a fully funded system, new contributors affect the size of assets under management and, therefore, the scheme’s investment strategy. In both cases, when the scheme is subject to a risk-based capital requirement, new entrants can affect the amount of provisions for solvency margins and the redistribution of its burden among all members.
Public pension schemes are generally open to different professional groups to prevent financial unbalances due to a decline in a specific profession. Variations in the number of contributors are influenced mainly by changes in the age structure of the population. On the other hand, private pension schemes can choose to admit only a homogeneous class of people, for example, workers with a given qualification. If they do so, the demographic risk can be more relevant because changes in the job market can have a stronger influence on the number of contributors. In this perspective, the present study addresses the evaluation of new entrants into pension schemes with educational and/or professional entry requirements.
Among the literature on stochastic models for social insurance, there are relatively few studies on new entrants. A common assumption following
Dufresne (
1988) is that the population of active members is stationary, such that every contributor who retires is replaced by a new individual.
Bowers et al. (
1986) support a closer integration between the stochastic and deterministic approaches, also in relation to new entrants which they model through population dynamics with stochastic rates of change (see also
Iyer 2008,
2015).
Lee (
1993),
Lee and Tuljapurkar (
1994) and
Rosati (
1996) propose stochastic fertility models that can be used to assess future workers and, consequently, new contributors to national pension schemes.
De Dominicis et al. (
1991),
Janssen and Manca (
1997) and
Chang and Cheng (
2002) use semi-Markov models to describe the transition pattern of pension scheme members, including new entrants, on the basis of their work status.
Mandl and Mazurová (
1996) use stationary random sequences to model fluctuations in new entrants and investment returns.
Colombo and Haberman (
2005) analyze the optimal contribution strategies for minimizing the impact of stochastic new entrants on the imbalance between the expected and actual investment returns.
Menoncin (
2005) propose a model of asset allocation for a PAYG pension fund, where the total number of contributors follows a Brownian motion, subject to the same risk sources of asset prices.
Melis and Trudda (
2012) assume that the active population evolves exponentially according to an Ornstein–Uhlenbeck process.
He et al. (
2020) model new entrants’ average salary via a Brownian motion correlated to asset prices.
While these studies are widely applicable to the broad range of pension schemes, the literature lacks a stochastic model that specifically addresses the estimation of new entrants into professional pension funds, admitting only a homogeneous population of academically qualified individuals (such as physicians, lawyers, etc.). The present study aims to fill this gap by presenting a Markov chain model for estimating new entrants into professional orders and their related pension funds. The model considers the effects of trends in populations, education choices and the appeal of a profession. The intuition behind this is that, in the medium term, trends in academic education can anticipate changes in the job market and preferences for highly skilled professions. Similarly, in the long term, fertility trends can anticipate the number of future young adults, thus influencing the overall occupational structure of employment of the population. The proposed approach is inspired by the stage-classified demographic theory based on Markov chain, described by
Caswell (
2001, chp. 5) and originating in the work on population dynamics by
Lefkovitch (
1965), who departed from the traditional matrix model (
Leslie 1945) by considering stages instead of age classes of population. For a review of this theory, see also
Lebreton (
2005),
Caswell (
2009) and
Vindenes et al. (
2021). The main innovation of this paper is the adoption of success rates in academic and professional education, instead of biological rates typical of their use in ecological models.
The model has been validated by comparing its predictions with the observed data of new enrollments, between 2012 and 2021, into the Italian order of chartered accountants, known as CNDCEC
1. An extension of the model, considering stochastic interest rates, was applied to forecast the impact of new entrants on the demographic and financial dynamics of the related pension fund, known as CNPADC
2. The choice of analyzing this professional group derives from its propensity to publish data and statistics, which has fostered research (see, for example, the actuarial analyses by
Attias et al. 2020;
Fiori Maccioni 2011;
Melis and Trudda 2012,
2010). In both cases, separate calculations were carried out for women and men to contribute to the ongoing debate on gender issues in accounting (see
Haynes 2017).
The paper is organized as follows.
Section 2 presents the mathematical formalization of the model.
Section 3 presents its validation through backtesting over historical data on the Italian order of chartered accountants (CNDCEC).
Section 4 extends the model and applies it to the related professional pension fund (CNPADC). Finally, in
Section 5 conclusions are drawn.
2. The Model
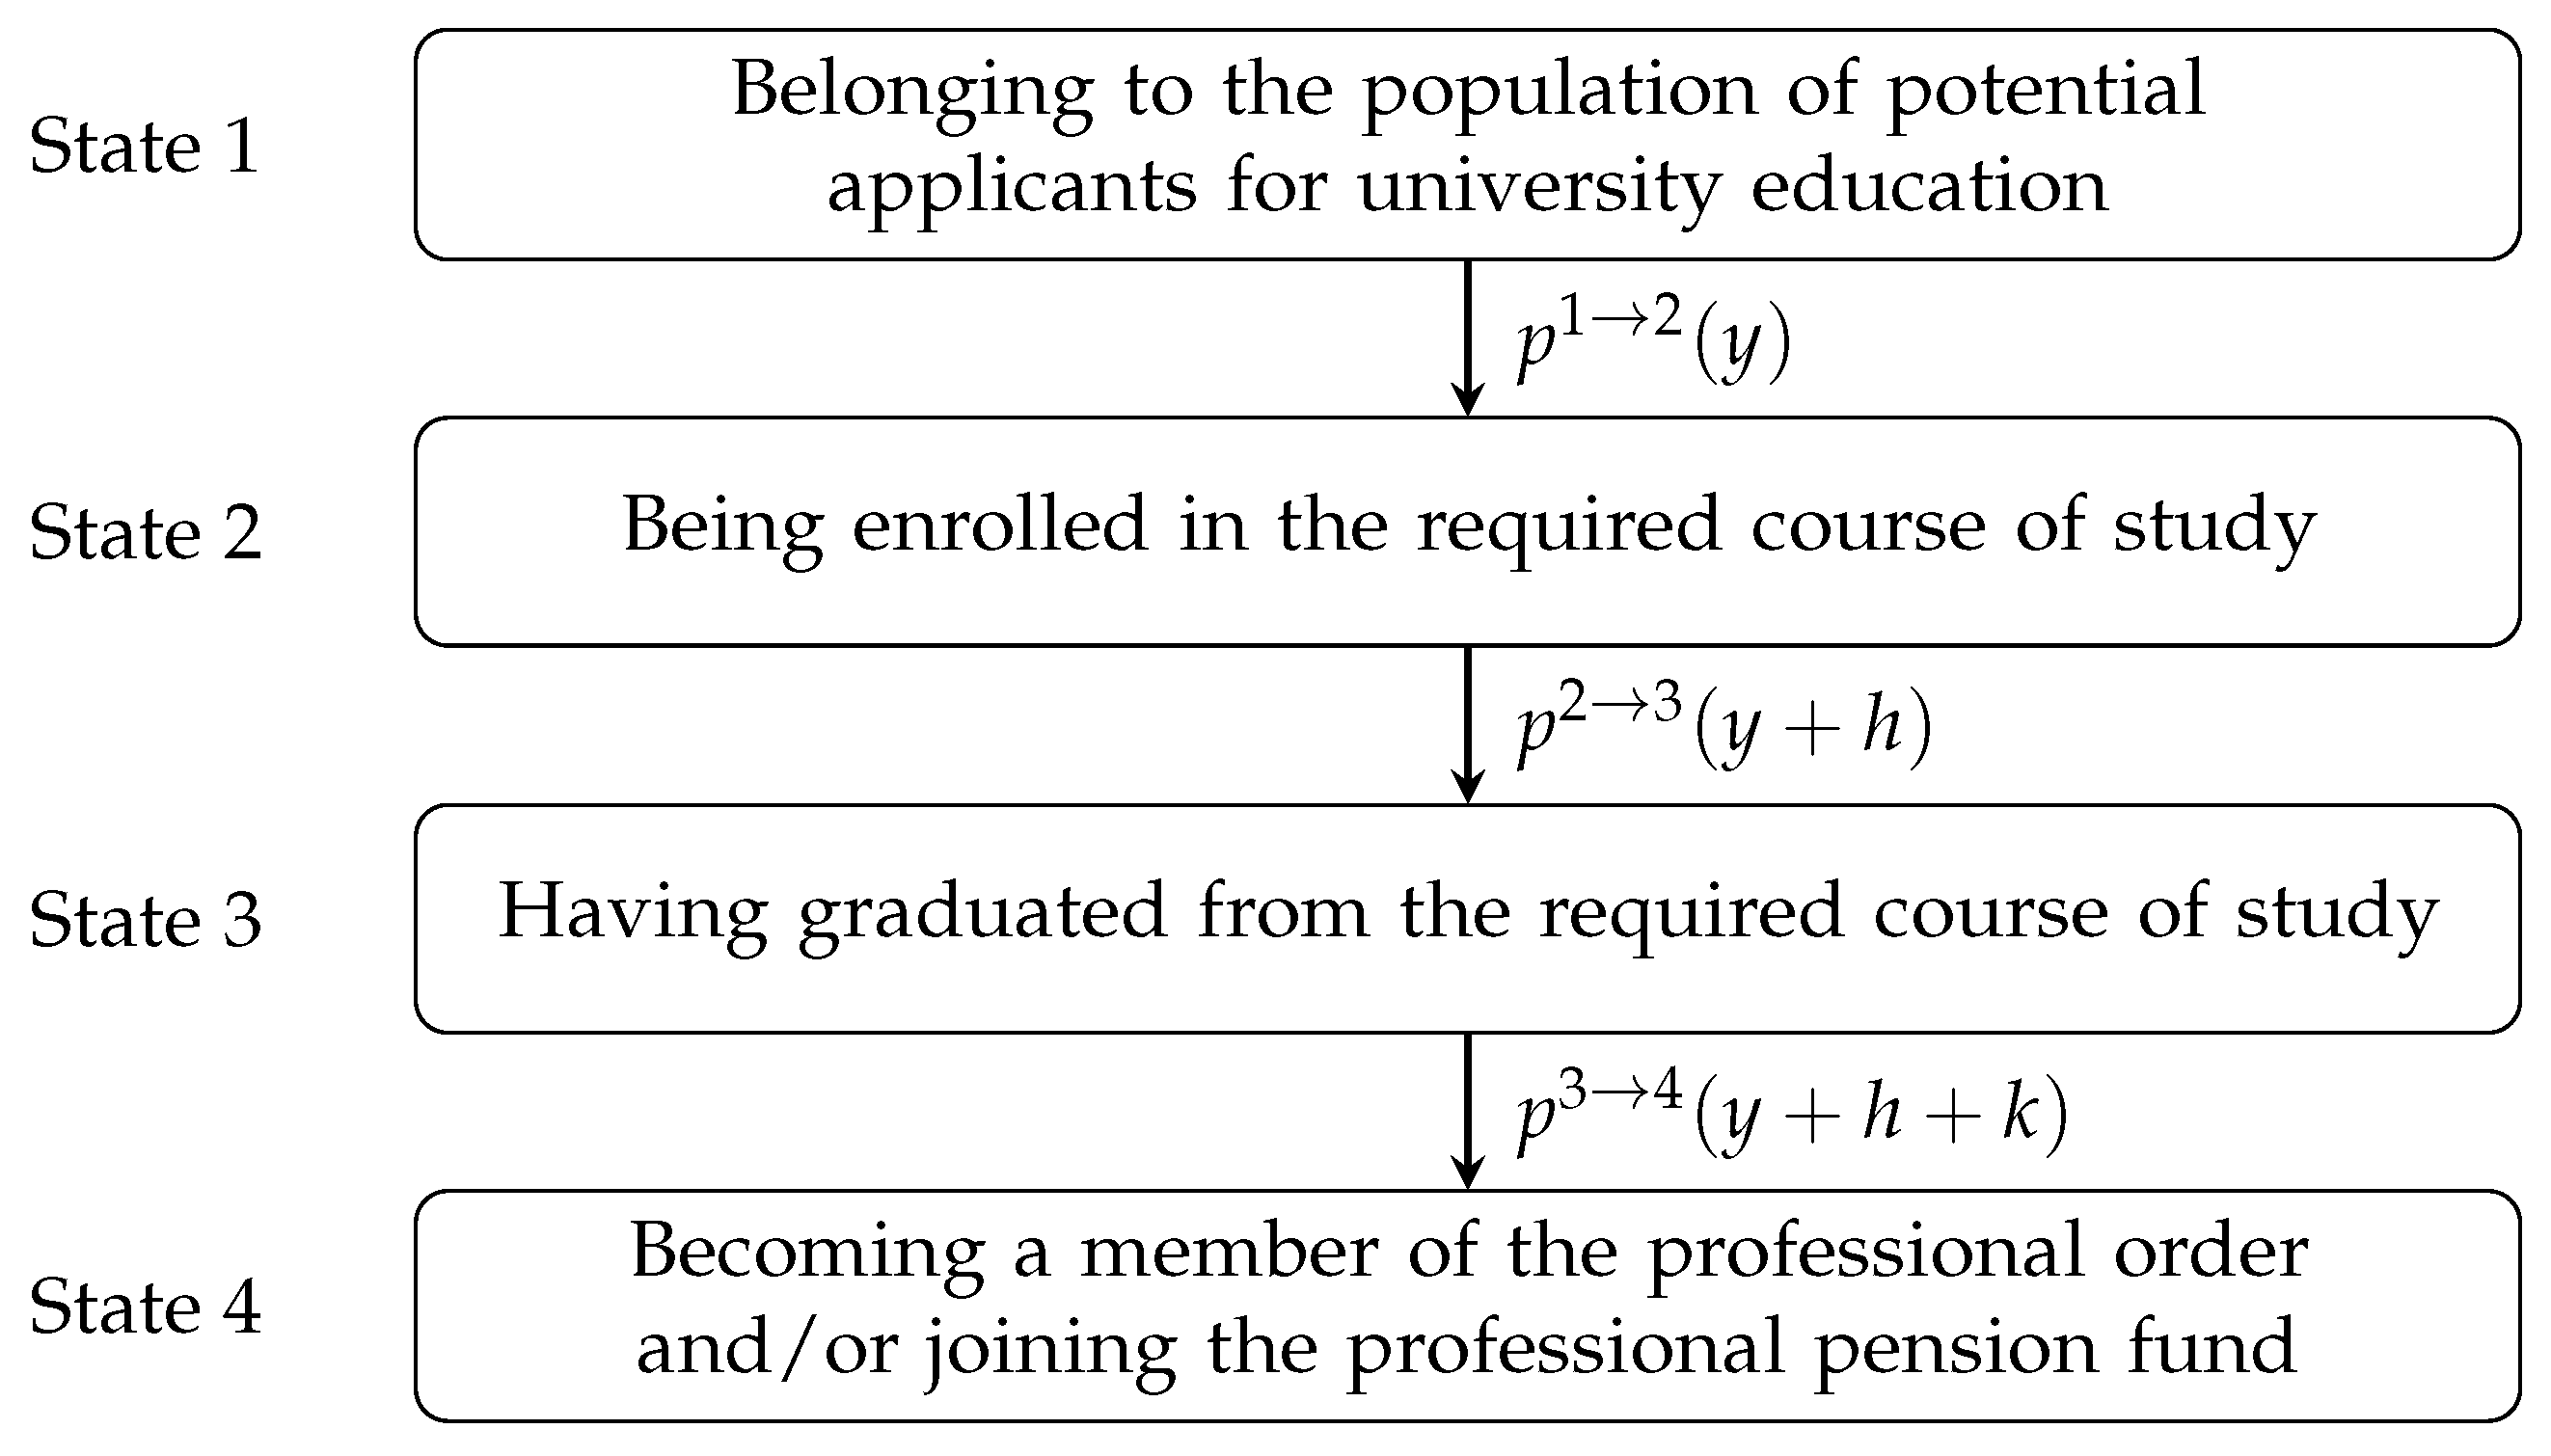
The dynamics of employment in a given professional group depend on different variables pertaining to trends in population, in educational choices and in the appeal of the profession. Accordingly, the population of new entrants into the group can be estimated in subsequent steps, outlined in
Table 1, by identifying progressively the populations of potential applicants for academic education; students who enroll and, subsequently, graduate in the prerequisite course for entering the profession; graduates who pursue the professional career and, consequently, join its pension fund.
The Markov chain in
Figure 1 models the stages that professionals have to leave behind for entering into their specific pension fund. The term
is the probability of transitioning from state
i to state
j during year
y.
The time periods h and k are deterministic parameters that represent the length for successfully completing, respectively, the course of study and the required training for entering the professional category (and, thus, joining its pension fund). They are treated deterministically, since it is assumed that they can be reliably estimated from the central tendency of the corresponding historical values.
Each potential future contributor can only be in one state at any given time and can move to a greater state exclusively after a fixed time interval—consisting of 0, h or k years—depending on the state itself.
The stochastic process
represents the number of new entrants into the professional order and/or its pension fund, of sex
s at time
y, defined as:
where
represents the number of potential applicants for university education at the beginning of year
y divided by sex while the terms
represent the transition probabilities of the Markov chain in
Figure 1. More precisely,
represents the probability that an individual belonging to
is enrolled, in year
y, as a first-year student in the prerequisite degree for entering the profession;
represents the probability that an individual, who was enrolled in year
as a first-year student holds in year
y the prerequisite degree;
represents the probability that an individual, who was enrolled in year
as a first-year student and who holds in year
the prerequisite degree, joins in year
y the professional order and/or its pension fund.
The population
of potential university applicants (that is, the starting population of the Markov chain) is modelled via the stochastic process:
where
is the expected value of the national resident population of sex
s and age
x at the beginning of year
y;
is the standard deviation of
;
m and
M are integer numbers indicating, respectively, the minimum and maximum age of the cohorts considered in the potential population;
is a standard normal variable.
The transition probabilities of the Markov chain are modelled via the stochastic process:
The term can be seen as the expected value of the transition probability from state i to j, while is its standard deviation. The term is a standard normal variable with distribution N∼(0,1).
By Equations (
2) and (
3), it is possible to estimate the number of new entrants into the professional pension fund as:
The model assumes that each standard normal variable
is dependent on its homologous variable of the opposite sex, with:
and:
where
is the correlation coefficient between
and
;
is the correlation coefficient between
and
;
and
are independent standard normal variables. On the other hand, for a given sex
s, no additional assumption has been made regarding the dependency of the variables
among themselves, which can be the object of further research should superior data become available.
3. Model Validation
The Markov chain model has been validated by comparing its predictions with the observed data of new enrollments into the Italian order of chartered accountants in the decade from 2012 to 2021. An additional baseline scenario, used to benchmark the model accuracy, has been calculated via the ordinary least squares (OLS) method.
This section is organized as follows.
Section 3.1 introduces the professional order and its entrance regulations.
Section 3.2 describes the parameter estimation of the Markov chain model and of the baseline scenario.
Section 3.3 presents the results of the simulations and discusses the ability of the model to reproduce the observed data.
3.1. The CNDCEC Professional Order
The Italian Order of Chartered Accountants and Accounting Experts, known as CNDCEC, was established in 2008 after the merger of the two pre-existing orders of chartered and public accountants, which represented this profession in Italy up until then.
3 Any qualified individual who wants to exercise the accounting profession in a liberal form should register with the CNDCEC and become its member. The steps for qualifying as a chartered accountant are, currently, the achievement of a master’s degree (
Laurea magistrale) in economics and business sciences, eighteen months of professional practicum (which can be partly performed while still attending university) and the passing of a state examination. The steps for qualifying as an accounting expert are the same, except for a bachelor’s degree (
Laurea triennale) instead of a master’s degree.
Table 2 shows the member total and the annual new enrollments of the CNDCEC since its foundation. Accounting experts have constituted, approximately, only one out of every twenty new members, the remaining being chartered accountants. Notably, the two groups must enroll into different pension funds: chartered accountants into the CNPADC (as described in
Section 4.1), and accounting experts into the CNPR
4.
3.2. Parameter Estimation
The parameters of the Markov chain model, used for simulating new enrollments into the CNDCEC in the decade from 2012 to 2021, are shown in
Table 3. The input data used for the parameter estimation were taken from the following sources. Data on Italian resident population were retrieved from the official portal of the Italian National Institute of Statistics.
5 Data on annual enrollments
6 and graduations
7 in the prerequisite degrees have been retrieved from the official portal of the Italian Ministry of University. Data on the CNDCEC annual new members, shown in
Table 2, were kindly provided by the Research Foundation of Italian Chartered Accountants.
The population of potential university applicants, , was assumed to be equal to the population of Italian residents aged 19 at the beginning of each year from 2003 to 2012, divided by sex. Since this data are already known at the beginning of the forecasting period, the standard deviation of the population (that is, the parameter ) was assumed to be equal to zero.
The parameters
,
and
were assumed to be equal to, respectively, the average, the standard deviation and the inter-sex correlation coefficient of the ratios between the annual enrollments in the prerequisite bachelor’s degrees and the population of Italian residents aged 19 at the beginning of each year. The period considered is from 2000 to 2011. Indeed, these bachelor’s degrees were implemented in the Italian universities only from the academic year 2000/01 by the reform introducing the so-called ‘3 + 2’ system.
8The parameter
h, representing the time for completing the academic studies, was assumed to be equal to seven years. This value is consistent with the average time-to-degree in economics and business studies for graduates in Italian universities, shown in
Figure 2, according to the annual surveys conducted between 2007 and 2021 by the inter-university consortium
AlmaLaurea (
2023).
9 Accordingly, the parameters
,
and
were assumed to be, respectively, the average, the standard deviation and the inter-sex correlation coefficient of the ratios between the annual graduations in the prerequisite master’s degrees in each year from 2007 to 2011 and the annual enrollments in the corresponding prerequisite bachelor’s degrees in the seventh preceding year (e.g., graduates in the calendar year 2007 were divided by first-year students in the academic year 2000/01).
The parameter k, representing the time for completing the professional training and qualification, was assumed to be three years, corresponding to the then-in-effect legal duration of the professional practicum. Accordingly, the parameters , and were assumed to be, respectively, the average, the standard deviation and the inter-sex correlation coefficient of the ratios between the annual enrollments into the CNDCEC in each year from 2008 to 2011 and the graduations in the prerequisite master’s degrees in the third preceding year.
The standard normal variables , , and were assumed to be dependent with their homologous variable of the opposite sex (with correlation coefficients , and , respectively) and independent between themselves.
In the baseline scenario, new enrollments into the professional order between 2012 and 2021 were estimated using ordinary least squares (OLS) regression on time series data of annual new entrants into the CNDCEC between 2008 and 2011 (see also
Table 2). The equations of the regression lines obtained are:
Following
Maccheroni and Nocito (
2017), the goodness of fit to the historical time series was assessed using as an index the root-mean-square deviation (RMSD) calculated as:
where
and
represent, respectively, the observed and predicted new entrants into the CNDCEC in year
y for a given sex
s. This index was normalized by the historical mean, to facilitate the comparative assessment of the various estimates. The resulting normalized root-mean-square deviation (NRMSD) was calculated as:
where
represents the mean of the observed values of new entrants into the CNDCEC between 2012 and 2021 for a given sex
s.
3.3. Results
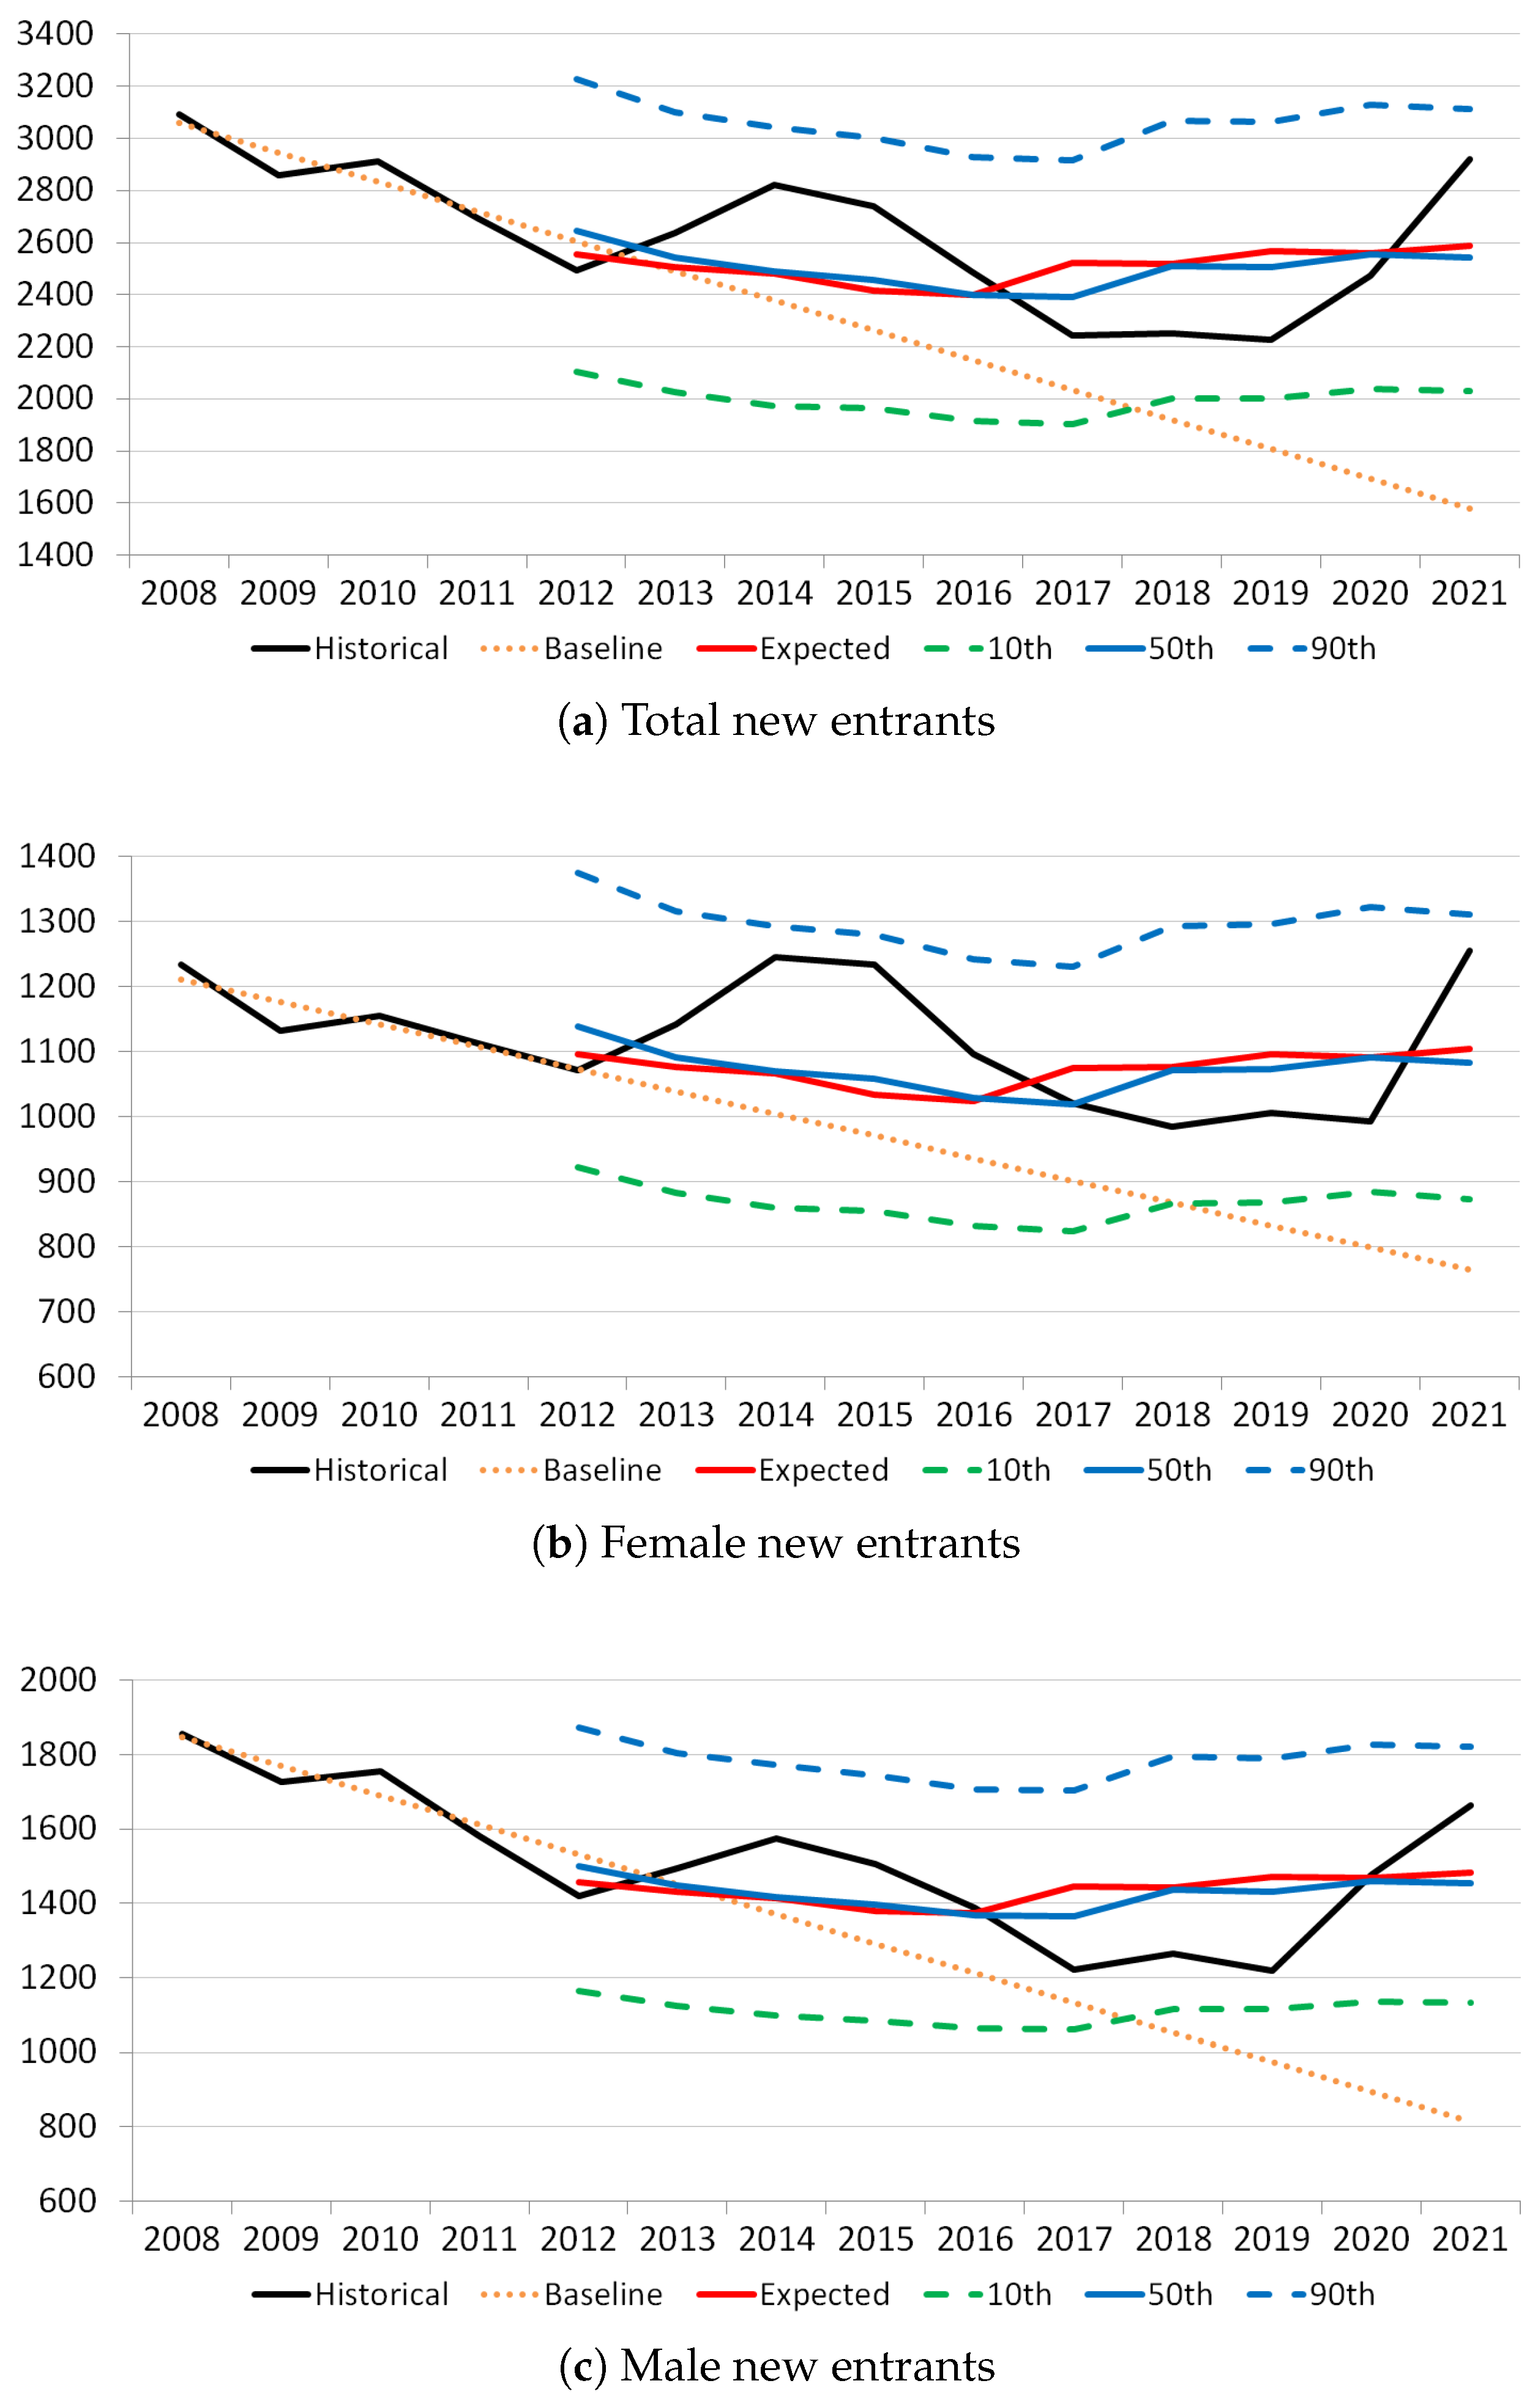
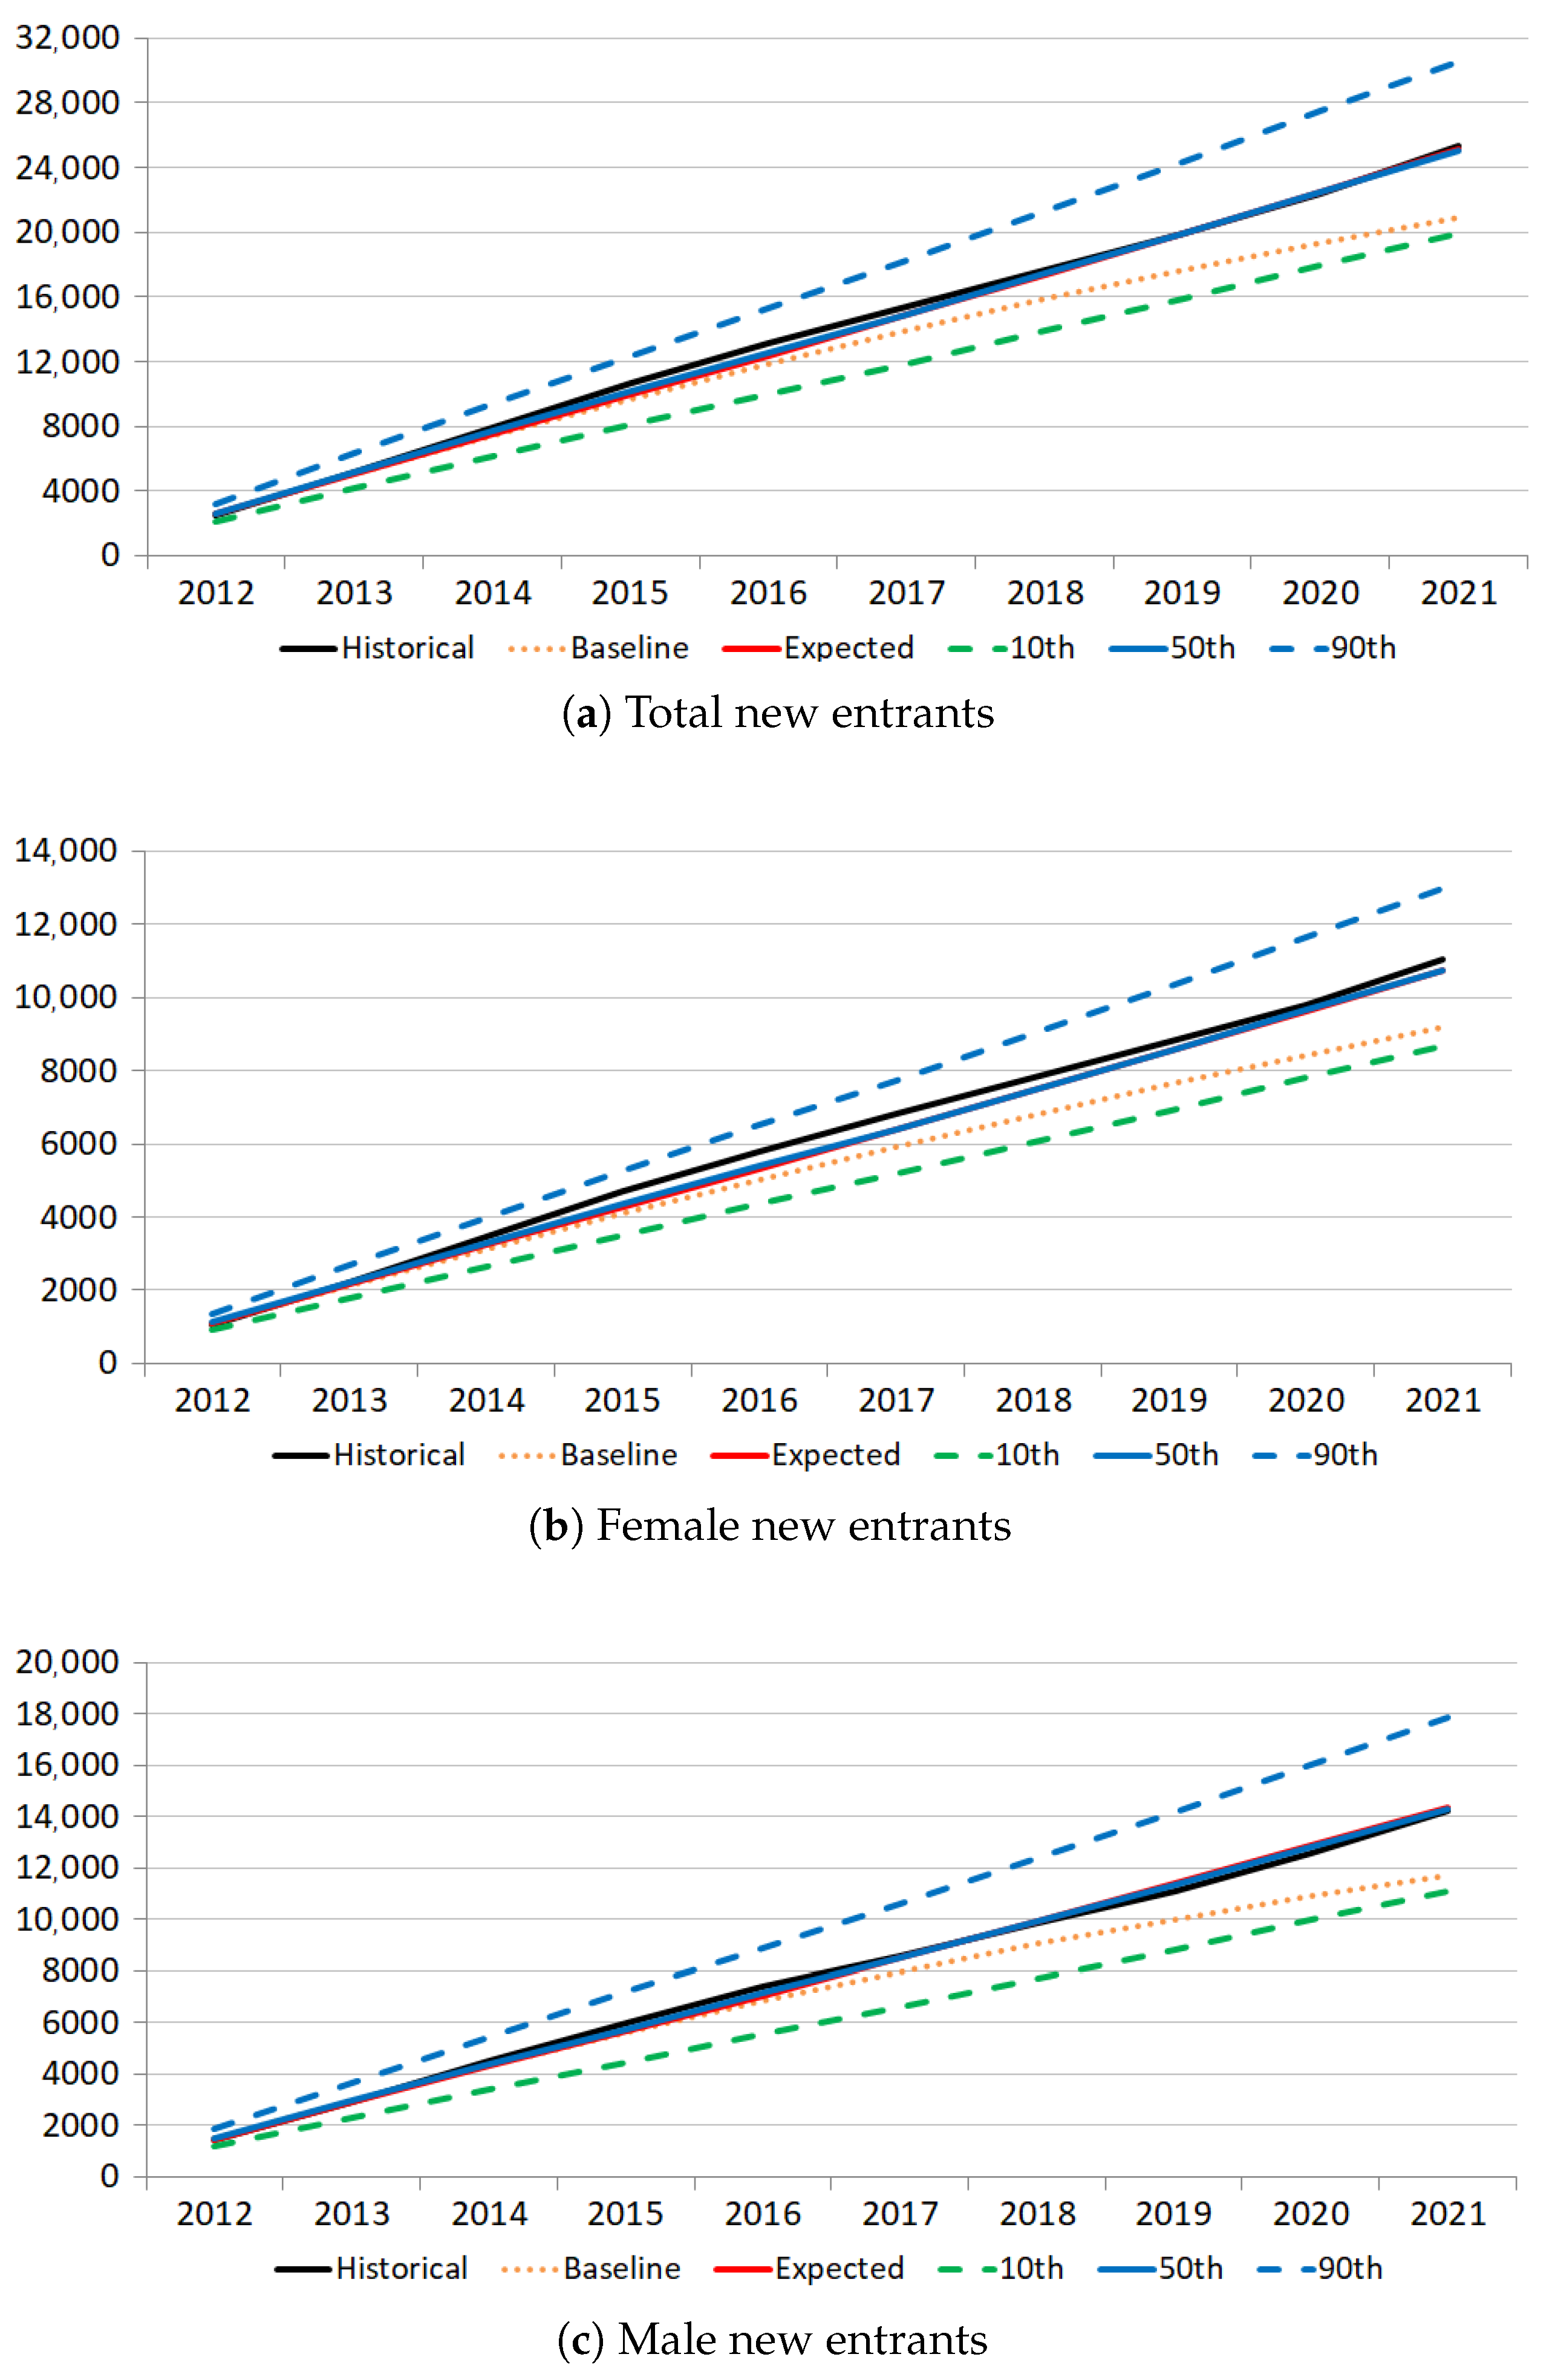
The observed historical data of new enrollments into the CNDCEC between 2012 and 2021, divided by sex, were compared to the model predictions and to the baseline scenario. Both the annual and cumulative values were compared and the results are presented, respectively, in
Figure 3 and
Figure 4.
The Markov chain model was used separately under stochastic and deterministic assumptions. In the stochastic case, new entrants were estimated via 20,000 Monte Carlo simulations based on Equations (
3)–(
6). In the deterministic case, new entrants—corresponding to the model expected values—were estimated via Equation (
4) under the assumption that all the dispersion parameters
of the random variables are to be zero. The descriptive statistics for both cases are shown in
Table 4. On the other hand, the baseline predictions, used for benchmarking purposes, were calculated by ordinary least squares according to Equations (
7)–(9).
The proposed model has proven to be highly accurate in replicating the observed cumulative data over the analyzed period (that is, the sum of new entrants from 2012 onwards). Namely, the cumulative expected and median values achieved an accuracy of up to 99% in predicting the cumulative historical data, while the accuracy of the baseline predictions is less than 80% (see
Figure 4). These results confirm the ability of the model to capture the demographic dynamics of new entrants in the medium-long term.
The model provided an adequate level of fit also on an annual basis, as suggested by the goodness-of-fit measures shown in
Table 5. For example, the normalized root-mean-squared deviation (NRMSD) between the predicted and observed total new entrants is, respectively, 9.98% and 9.25% for the expected and median values of the model, a more accurate measure than the 22.73% of the baseline scenario.
The historical data in
Figure 3 show a cyclic and counter-cyclic trend over the observation period. This peculiar behavior depends on the reform in the duration of the professional practicum, which has decreased from three years to eighteen months since 2013.
10 Thanks to this unexpected change, trainees who fulfilled the new requirement could anticipate their entrance into the professional order. As a result, the observed new entrants exceeded the annual model predictions between 2013 and 2015, while they fell below by a similar amount between 2017 and 2019. This fact can explain the higher accuracy of the model in predicting the cumulative (rather than the annual) historical values over the analyzed period.
The predictive accuracy of the model, despite the aforementioned reform of the professional practicum, does not seem to diminish significantly over time. This is particularly noteworthy since the last two years of the analyzed period were affected by the COVID-19 pandemic. On the other hand, starting from the third year of the forecast, the baseline projections exhibit a systematic underestimation of the historical data, which intensifies in 2020 and 2021 (that is, in the two pandemic years).
4. An Application to the CNPADC Fund
This section aims at extending the model to estimate the impact of the stochastic variable ‘new entrants’ on the future demographic and financial dynamics of the national pension fund of Italian chartered accountants, known as CNPADC.
The focus is on presenting the methodology, rather than on measuring precisely all the characteristics of the fund. Therefore, the fund’s regulations were simplified to improve clarity. Namely, new benefits are only awarded for old-age pensions (while disability pension and survivors’ pension are not considered, except for the pre-existing ones). Unless otherwise specified, data used in the calculations are taken or derived from the actuarial balance sheet by
Annibali (
2020), to which the interested reader is referred for further information on the CNPADC fund.
This section is organized as follows.
Section 4.1 presents the pension fund, its historical development and its main entrance regulations.
Section 4.2 presents the method used for mortality projections.
Section 4.3 deals with the estimation of new entrants via the Markov chain model.
Section 4.4 and
Section 4.5 describe the cohort-component method used for estimating the demographic evolution of contributors and pensioners.
Section 4.6 describes the method used for estimating the financial evolution of the fund, including the stochastic process used for modelling asset returns. Demographic and financial results are presented, respectively, in
Section 4.7 and
Section 4.8.
4.1. The CNPADC Pension Fund
The CNPADC was established in 1963 as a non-profit public law institution to ensure social security and welfare provisions to chartered accountants and their families.
11 Any chartered accountant who is a member of the Italian professional order and practices the profession must enroll and pay contributions to the fund. The fund initially provided retirement benefits under a funded defined-contribution model, but then in 1986 it shifted to a pay-as-you-go defined-benefit model.
12 In 1994, all pension funds of Italian professional orders, including the CNPADC, were privatized, thus becoming autonomous non-subsidized private institutions compliant with national regulations and supervised by the Italian ministries of Labour and Economy.
13 In 2004, to ensure its long-term financial sustainability, the fund adopted a notional defined-contribution model, which is still in place today.
The mandatory qualification requirements in Italy for becoming a chartered accountant have significantly changed over time. Until 1996, it was necessary to have a bachelor’s degree in economics and business sciences and to pass a qualifying examination. Then, a new requirement was introduced consisting of a three-year unpaid practicum in the employ of a senior chartered accountant.
14 Then, bachelor graduates rushed to become chartered accountants prior to its implementation, so as to take the qualifying examination without any additional requirements. As a result, the new enrollments to the CNPADC almost doubled in 1996 with respect to the previous year, and quadrupled with respect to 1992, while they fell abruptly in 1997 and 1998. This effect is evident in
Figure 5, which shows the distribution of new contributors to the fund by year of enrollment. Since 2008, the bachelor’s degree and the practicum are no longer sufficient for qualifying as a chartered accountant, but a master’s degree in economics and business sciences is additionally required (as well as passing the qualifying examination). Since 2013, the duration of the professional practicum was reduced from three years to eighteen months, as described in
Section 3.3.
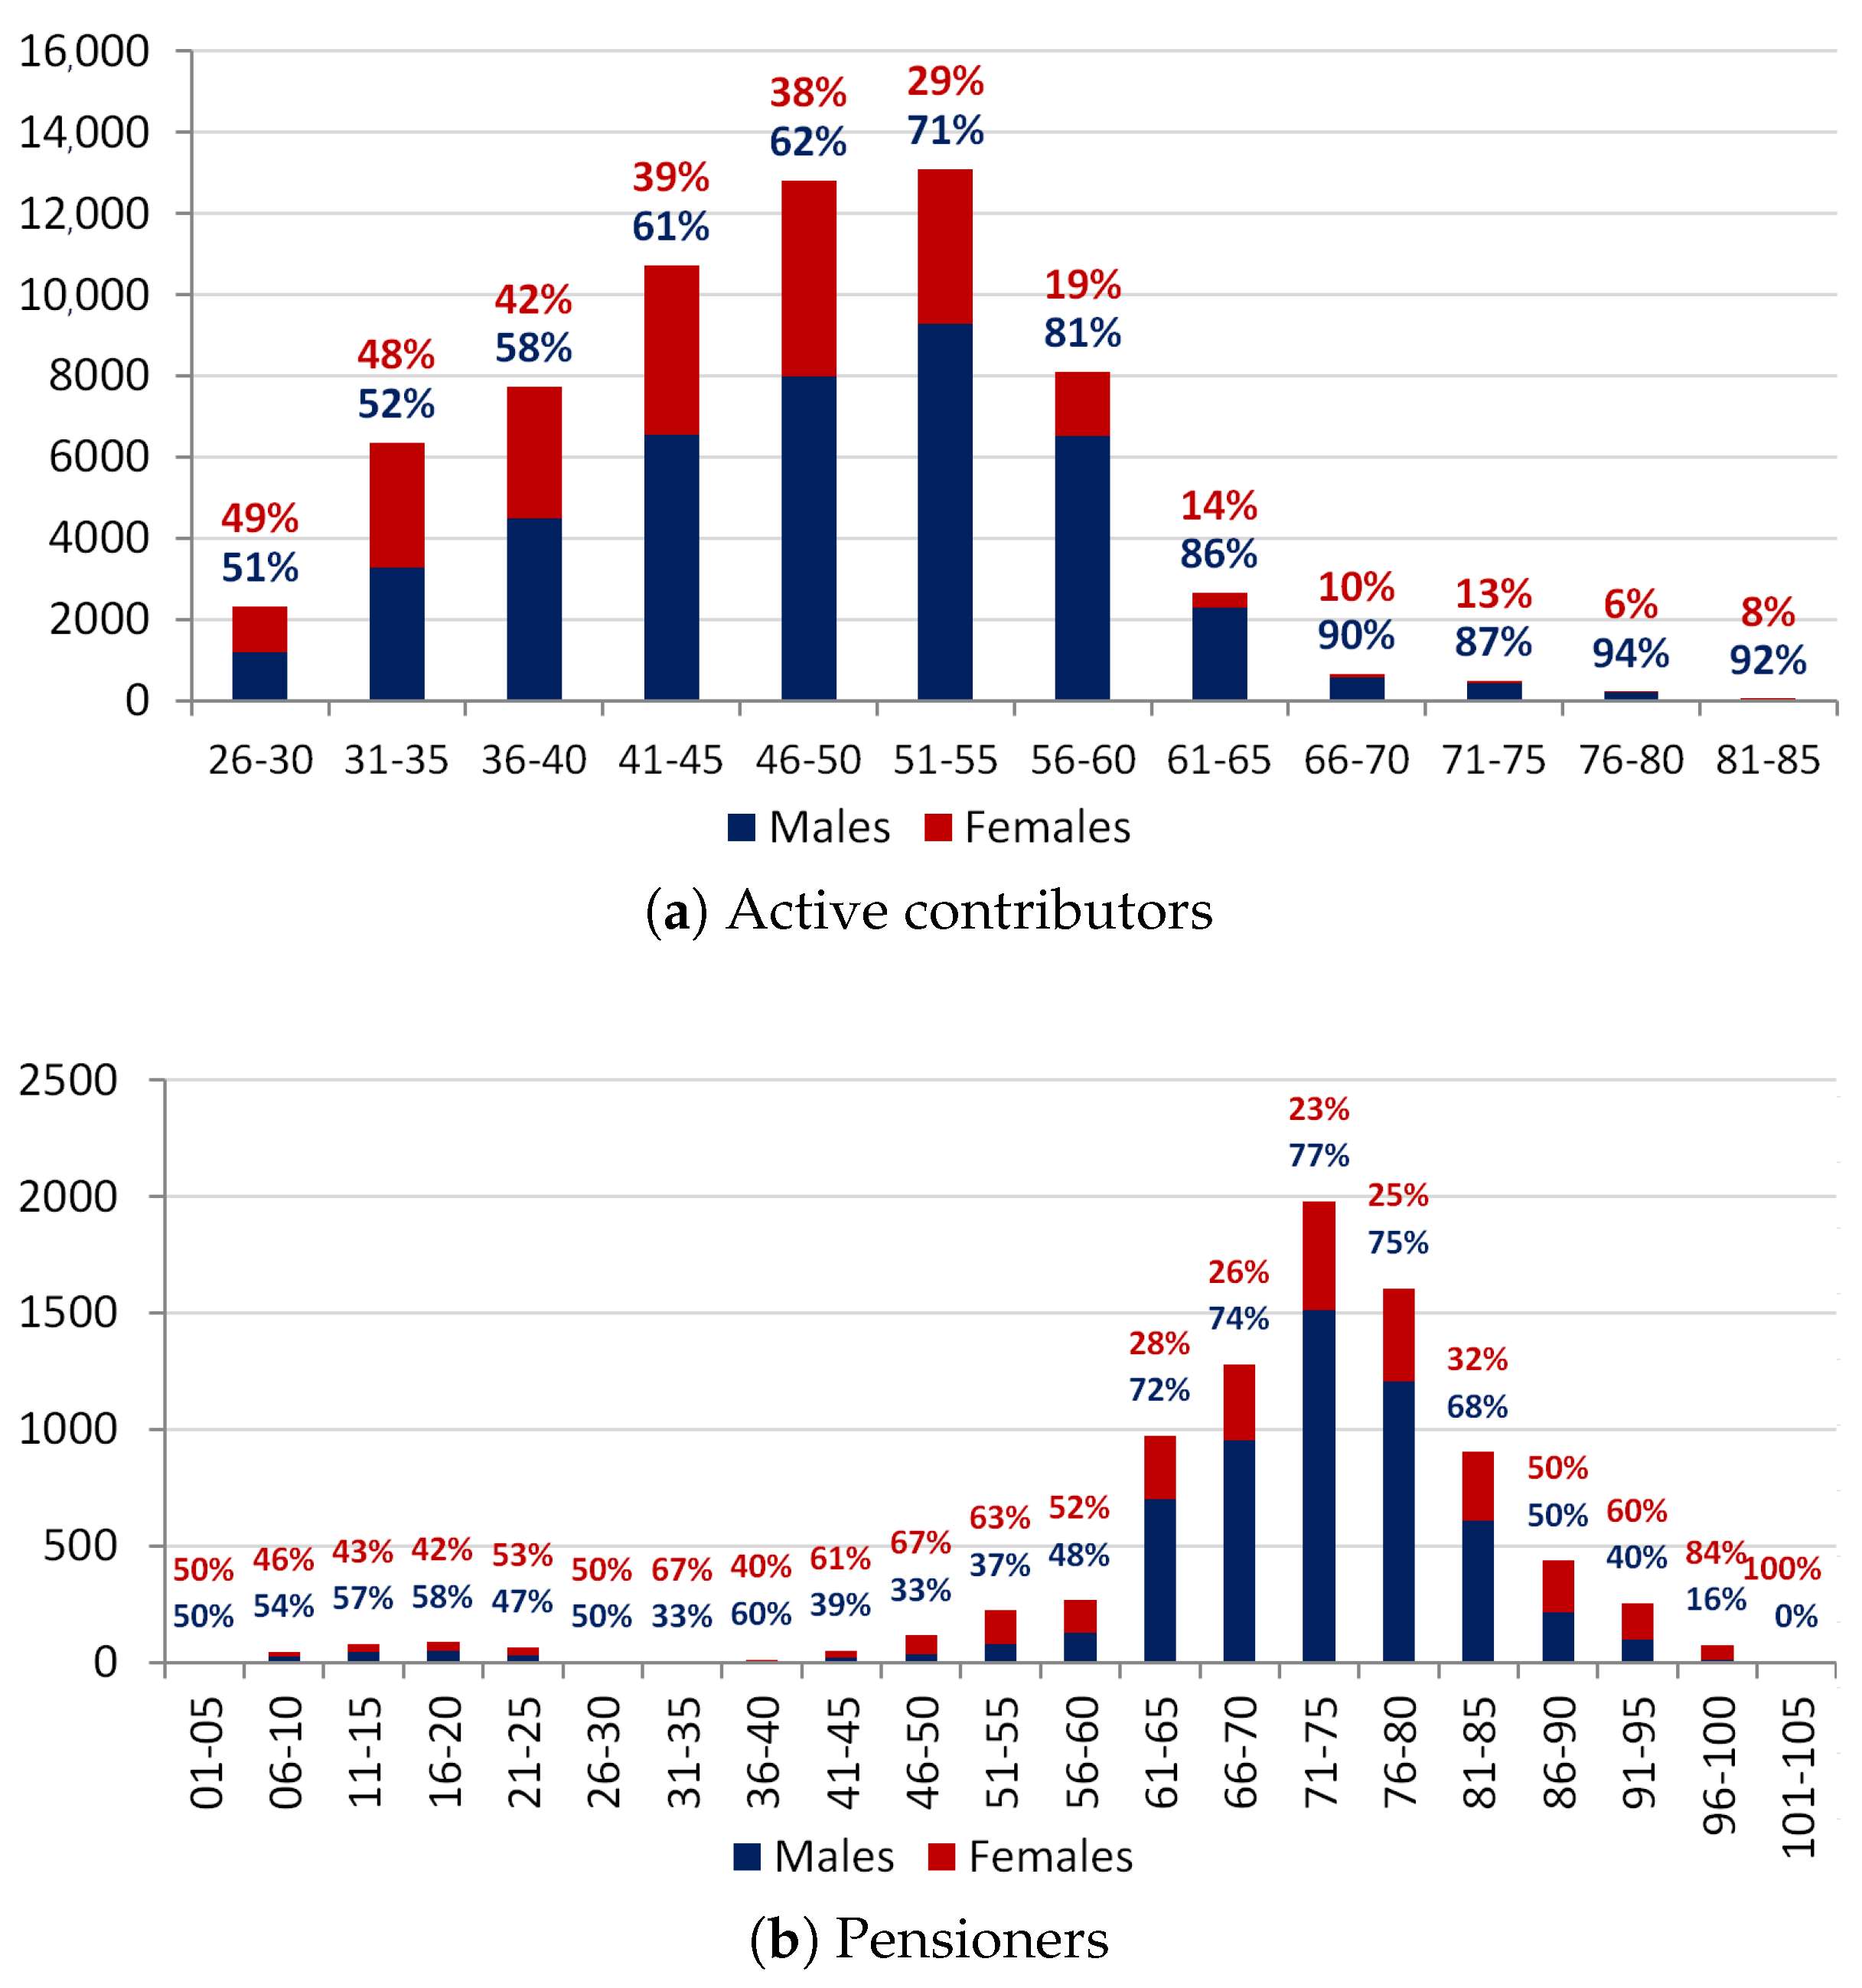
On 31 December 2019, the demographic composition of the fund consisted of 65,261 active contributors (42,874 males and 22,387 females) and 8491 pensioners (5759 males and 2732 females); their distribution by age is shown in
Figure 6. The biggest cohort of active members consisted of individuals aged 46–55 (thus born in the decade 1964–1973), who made up nearly 40% of active contributors (for comparison, those born in the previous decade made up 16.5%).
4.2. Mortality Assumptions
Experienced mortality, measured by annual life tables, can be affected by occasional and transitory effects. The most important in recent years was the outbreak of the COVID-19 pandemic. This effect is considered in the present study by analyzing past mortality trends through parabolic interpolation of death rates over a number of consecutive years.
Let
be the mortality rate in year
y for a cohort of sex
s and age
x. The adopted technique consists of interpolating a second-degree curve with a series of seven consecutive historical values:
and determining the numerical values of the parameters by the ordinary least squares method, given the abscissa values
,
,
, 0,
,
,
. More precisely, the technique consists of finding the scalars
a,
b and
c that solve the optimization problem:
The solution depends on the system of partial derivatives:
Recalling that there are seven terms, the above system becomes:
Let
be the central value
for
. Then, by solving the system, one obtains:
The above formula was used to estimate a ‘theoretical’ mortality table for the year 2018, by parabolic interpolation of the historical values between 2015 and 2021, thus including two years of the COVID-19 pandemic. The historical values of
were taken from the official mortality tables of the Italian population, published by the Italian National Institute of Statistics.
15 Indeed, following
Annibali (
2020), it was assumed that the accountant population has a behavior similar to the whole national population.
Projected mortality tables in the forecasting period were calculated as follows. For
, one obtains:
where
represents the rate of annual variation in mortality. This parameter was estimated based on the geometric average of the theoretical variation over a decade:
To smooth the distribution of
over the ages
x, the values obtained via the above equation were interpolated via parabolic arcs following the formulae described by
Marsili (
2001, pp. 13–14). Namely, for the ages from 5 to 91, the interpolated value
is calculated as:
The above interpolation formula is similar to that in Equation (
15) because it is obtained via an analogous technique. On the other hand, the parabolic interpolation formulae used for the ages from 1 to 4 are:
4.3. New Entrants
The Markov chain model was used to estimate the future new entrants into the CNPADC fund over the years 2020–2070, based on 20,000 Monte Carlo simulations.
Table 6 presents the parameters used in the simulations. The data sources used for the parameter estimation are the following. As described in
Section 3.2, data on Italian resident population were retrieved from the official portal of the Italian National Institute of Statistics, while data on annual enrollments and graduations in the prerequisite degrees were retrieved from the official portal of the Italian Ministry of University. Data on annual new members of the pension fund come from official publications by the
CNPADC (
2020,
2021).
The steps for qualifying as a chartered accountant are currently the achievement of a master’s degree (Laurea magistrale) in economics and/or business subjects, eighteen months of professional practicum and the passing of a qualifying examination. Chartered accountants must then enroll into the pension fund once they start practicing the profession. According to these steps, the parameters of the Markov chain were estimated as follows.
The population of potential university applicants,
, was assumed to be the population of Italian residents aged 19 at 1 January of each year from 2000 to 2020. For the years from 2021 onwards, the population was estimated according to Formulaes (
2) and (
5), with the following assumptions: age of potential university students
(and thus
); expected value of the population
equal to the official forecasting of Italian residents aged 19; standard deviation of the population
estimated under normality assumption by the percentile distribution of the official forecasting of the Italian residents aged 19, published by the Italian National Institute of Statistics (See note 15 above); correlation coefficient between the male and female population
.
The parameters , and were assumed to be, respectively, the average, the standard deviation and the inter-sex correlation coefficient of the ratios between annual enrollments in the prerequisite master’s degrees and the population of Italian residents aged 19 in the period 2000–2020.
The parameter
h, representing the time taken to complete the relevant academic studies, was assumed to be seven years, in accordance with data presented in
Section 3.2. Accordingly, the parameters
,
and
were assumed to be, respectively, the average, the standard deviation and the inter-sex correlation coefficient of the ratios between the annual graduations in the prerequisite master’s degrees in each year from 2007 to 2019 and the annual enrollments in the corresponding prerequisite bachelor’s degrees in the seventh preceding year (for example, graduates in the calendar year 2007 were divided by first-year students in the academic year 2000/01).
As in
Section 3.2, the parameter
k, representing the time taken to complete the professional training and qualification, was assumed to be three years. Accordingly, the parameters
,
and
were assumed to be, respectively, the average, the standard deviation and the inter-sex correlation coefficient of the ratios between the annual enrollments into the CNPADC fund in each year from 2017 to 2021 (see also
Figure 5), and the graduations in the prerequisite master’s degrees in the third preceding year.
The standard normal variables , , , and are assumed to be dependent on their homologous variable of the opposite sex (with correlation coefficients , , and , respectively) and independent of one another.
4.4. Evolution of Contributors
Let the stochastic process
represent the contributors alive on 31 December of year
y, of sex
s, age
x and working seniority
a. The starting population
consists of 65,261 active contributors on 31 December 2019 (42,874 males and 22,387 females; see also
Figure 6).
Contributors with exactly one year of working seniority (for whom
) corresponds to the annual new entrants into the pension fund:
where
represents the annual new entrants of sex
s in year
y, calculated according to Equation (
4) and
represents their age distribution. Following
Annibali (
2020), the following was assumed:
The CNPADC adopted the notional defined-contribution model in 2004. Then, the pre-reform contributors (with working seniority
) can retire with an old-age pension upon reaching the age and working seniority of, respectively,
and
. On the other hand, the post-reform contributors (with working seniority
) can retire upon reaching the age and working seniority of, respectively,
and
. Accordingly, the evolution of existing contributors at the beginning of the year (for whom
) was calculated as:
4.5. Evolution of Pensioners
Let the stochastic process
represent the pensioners alive on 31 December of year
y, of sex
s, age
x and working seniority
a, who have fulfilled the pension requirements in year
t. The starting population
consists of 8491 pensioners alive on 31 December 2019 (5759 males and 2732 females; see also
Figure 6); for this population it is assumed by convention that
at the beginning of the forecasting period.
The evolution of existing pensioners at the beginning of the year (for whom
) was calculated as:
where
is the probability of dying within one year from
y.
The fund switched from the defined-benefit to the defined-contribution model in 2004; thus, pre- and post-reform contributors have different pension requirements consisting of
and
, respectively (see also
Section 4.6.4). Accordingly, new pensioners in year
y, who fulfilled the requirements in the previous year and for whom
, were estimated as follows:
4.6. Financial Evolution
The net asset value of the fund at the end of each year
y was modelled with the following recursive equation:
where
,
,
and
represent, respectively, the rate of return, the administrative expenses, the collected contributions and the pension disbursement in the calendar year
y. The initial value of the fund on 31 December 2019 is
. Cash flows are assumed to take place at the end of the year.
4.6.1. Rate of Return
The rate of return is assumed to follow a Gaussian AR(1) process:
The errors are independently and identically distributed as a normal distribution with zero mean and constant variance .
The parameters of the AR(1) process were estimated with the standard linear regression model, using the average net annual returns of Italian closed pension funds in the period 2000–2020, published by the Italian supervisory commission
COVIP (
2021). Accordingly, it was assumed that
,
and
. The process is stationary since it results in
.
4.6.2. Administrative Expenses
The administrative expenses were estimated to be equal to their initial value in 2019, adjusted for the annual rate of inflation
:
where
and:
4.6.3. Contributions
Active members of the CNPADC should pay both an income-based and a revenue-based contribution. The first is called contributo soggettivo and funds the notional defined-contribution accounts of individuals. The second is called contributo integrativo; it has a solidarity function and does not influence the amount of the individual pension.
The total contributions collected each year by the fund are:
where
and
represent, respectively, the income-based and the revenue-based contributions paid in each year
y by the cohort of contributors
.
The income-based contributions are calculated as:
where
is the average nominal income of the cohort
in the year
y, and the parameter
is the average contribution rate choosen by CNPADC contributors (the minimum mandatory rate is 12% but contributors are allowed to pay more to increase their future pensions, see also
Annibali 2020, p. 54).
The income-based contributions were computed separately for each cohort and for each year since the introduction of the defined-contribution model in 2004, in order to assess the balance of notional individual accounts at the beginning and throughout the forecasting period.
The revenue-based contributions were calculated as:
where
is the average nominal revenue of the cohort
in the year
y, and
is the standard revenue-based contribution rate.
The nominal values of income and revenue correspond, respectively, to those of year 2019, adjusted to inflation:
and:
The inflation rates
for years 2020–2070 are indicated in formula (
31), while those for years 2005–2019 were assumed to be equal to the historical annual inflation rates in Italy published by the Italian National Institute of Statistics.
16 4.6.4. Pensions
The total pensions paid each year by the fund are:
where
is the pension paid in year
y to an individual of sex
s, age
x and seniority
a, who fulfilled the pension requirements in year
t, with:
The term
represents the initial pension calculated at retirement time
t (note that the first pension payment occurs at time
, since cash flows take place at the end of the year). It has two alternative methods of calculation, depending on whether the retiree enrolled after the notional defined-contribution reform in 2004. If so, the initial pension is calculated according to the defined-contribution method:
where
is the balance of the individual notional account at retirement, and
is the age-related conversion coefficient.
On the other hand, the accrued rights of pre-reform contributors were protected by providing them with retirement benefits computed according to the pro rata method. Accordingly, their pension consists of two shares calculated proportionally to the years of permanence under the defined-benefit and the defined-contribution models:
The first summand of the above equation corresponds to the defined-contribution component of the initial pension, calculated as in Formula (
39). The second summand corresponds to the defined-benefit component, which is 2% of the average annual income in the pre-reform years, for each year of pre-reform contribution (or, in equivalent terms, 2% of the total pre-reform income).
4.7. Demographic Results
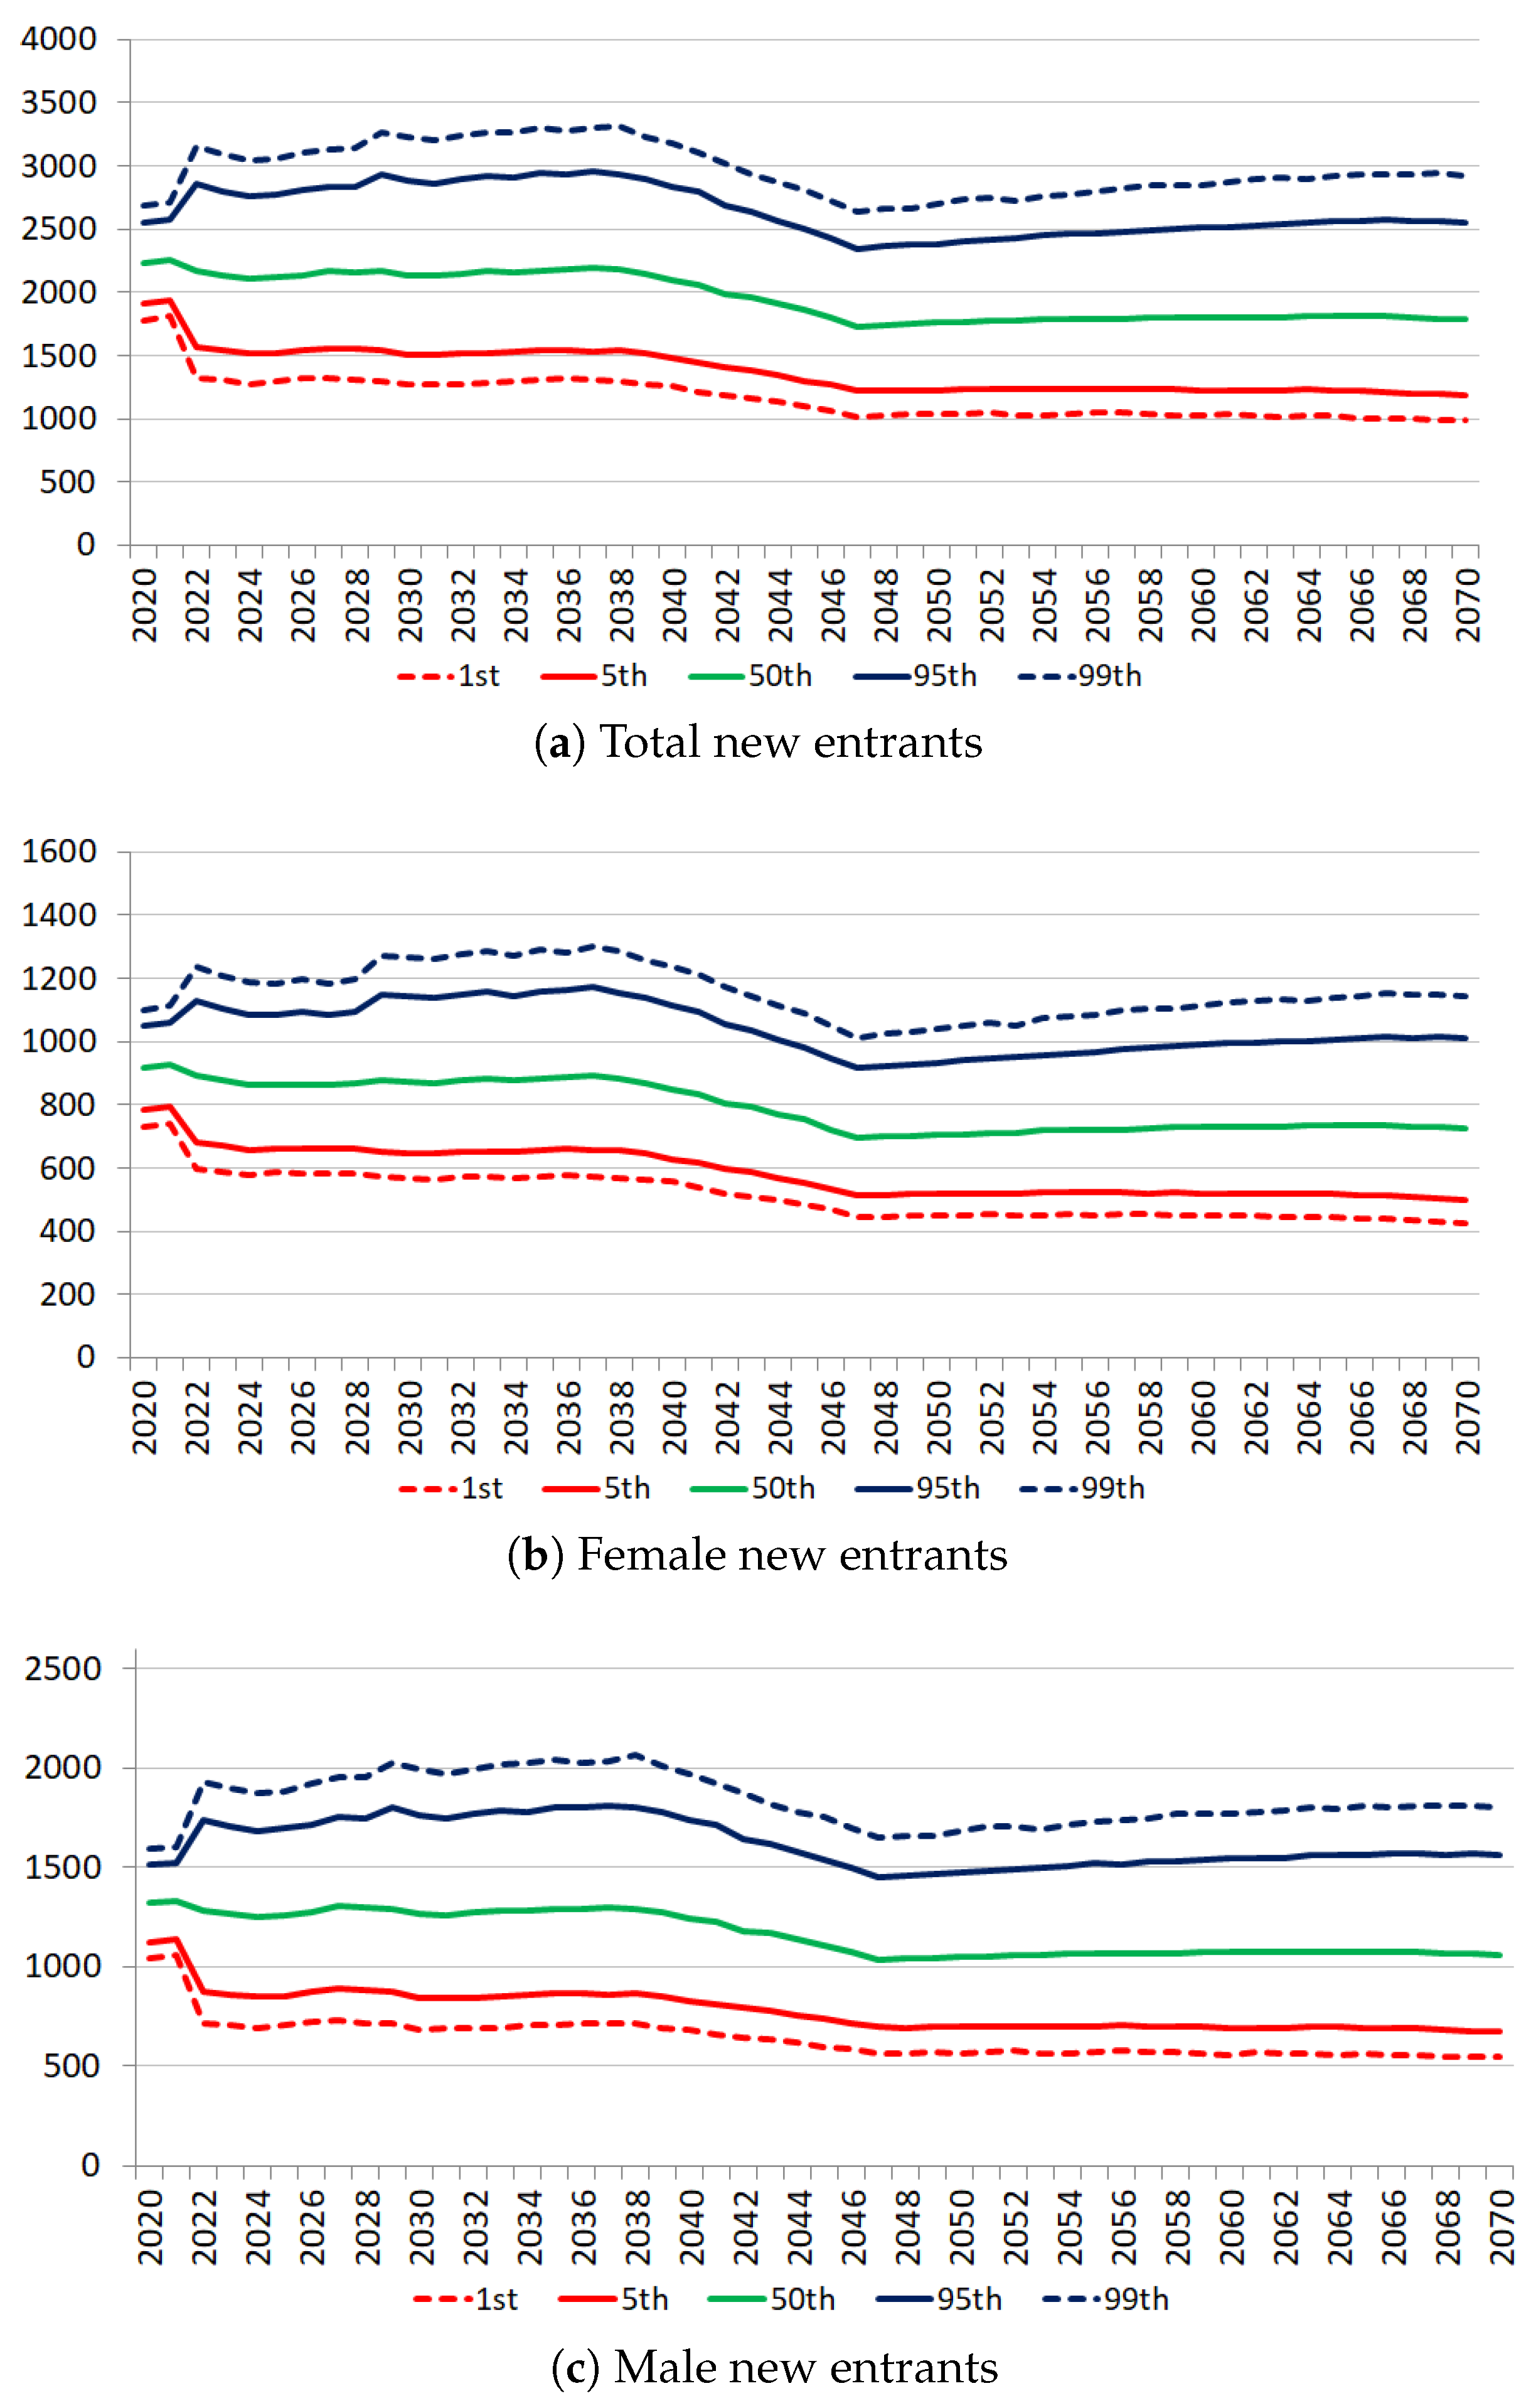
The demographic and financial dynamics of the CNPADC fund were estimated over the years 2020–2070 in a standard Monte Carlo experiment with 20,000 simulations. New entrants were estimated using the Markov chain model proposed in
Section 2 with the parameters shown in
Table 6.
Figure 7 shows the percentiles of their frequency distributions obtained in the experiment, while
Table 7 shows their corresponding expected values, calculated deterministically by setting to zero all the dispersion parameters
and
in Equation (
4).
The simulations reveal a constant trend in the number of annual new entrants in the period 2020–2037, followed by a gradual decrease of around 20% until year 2047, and by a slow recovery in the remaining horizon.
Females are estimated to be 40–41% of annual new entrants over the whole forecasting period. This value is lower than the share of females who joined annually the CNDCEC order since its foundation, which ranged between 40 and 46% (see
Table 2). The difference can be explained by a lower propensity of women to practice the profession in a liberal form compared to men. Indeed, chartered accountants working as employees must subscribe to the Italian national institute for social security (INPS), rather than to the CNPADC. This can be interpreted as a hint for the existence of a ‘glass ceiling’ in the Italian accounting profession, in line with studies on other countries (see
Cohen et al. 2020).
An alternative explanation can be that female new members of the CNDCEC are more likely than men to practice in a liberal form as ‘accounting experts’, thus joining the CNPR pension fund (as described in
Section 3.1). However, according to data from
Micocci (
2022, p. 13), this statement holds true only for those who joined the CNPR before the age of thirty, while the contrary holds for the other cohorts. However, the relatively small population involved is not enough to justify the lower-than-expected number of female new entrants into the CNPADC fund, thus supporting the first interpretation.
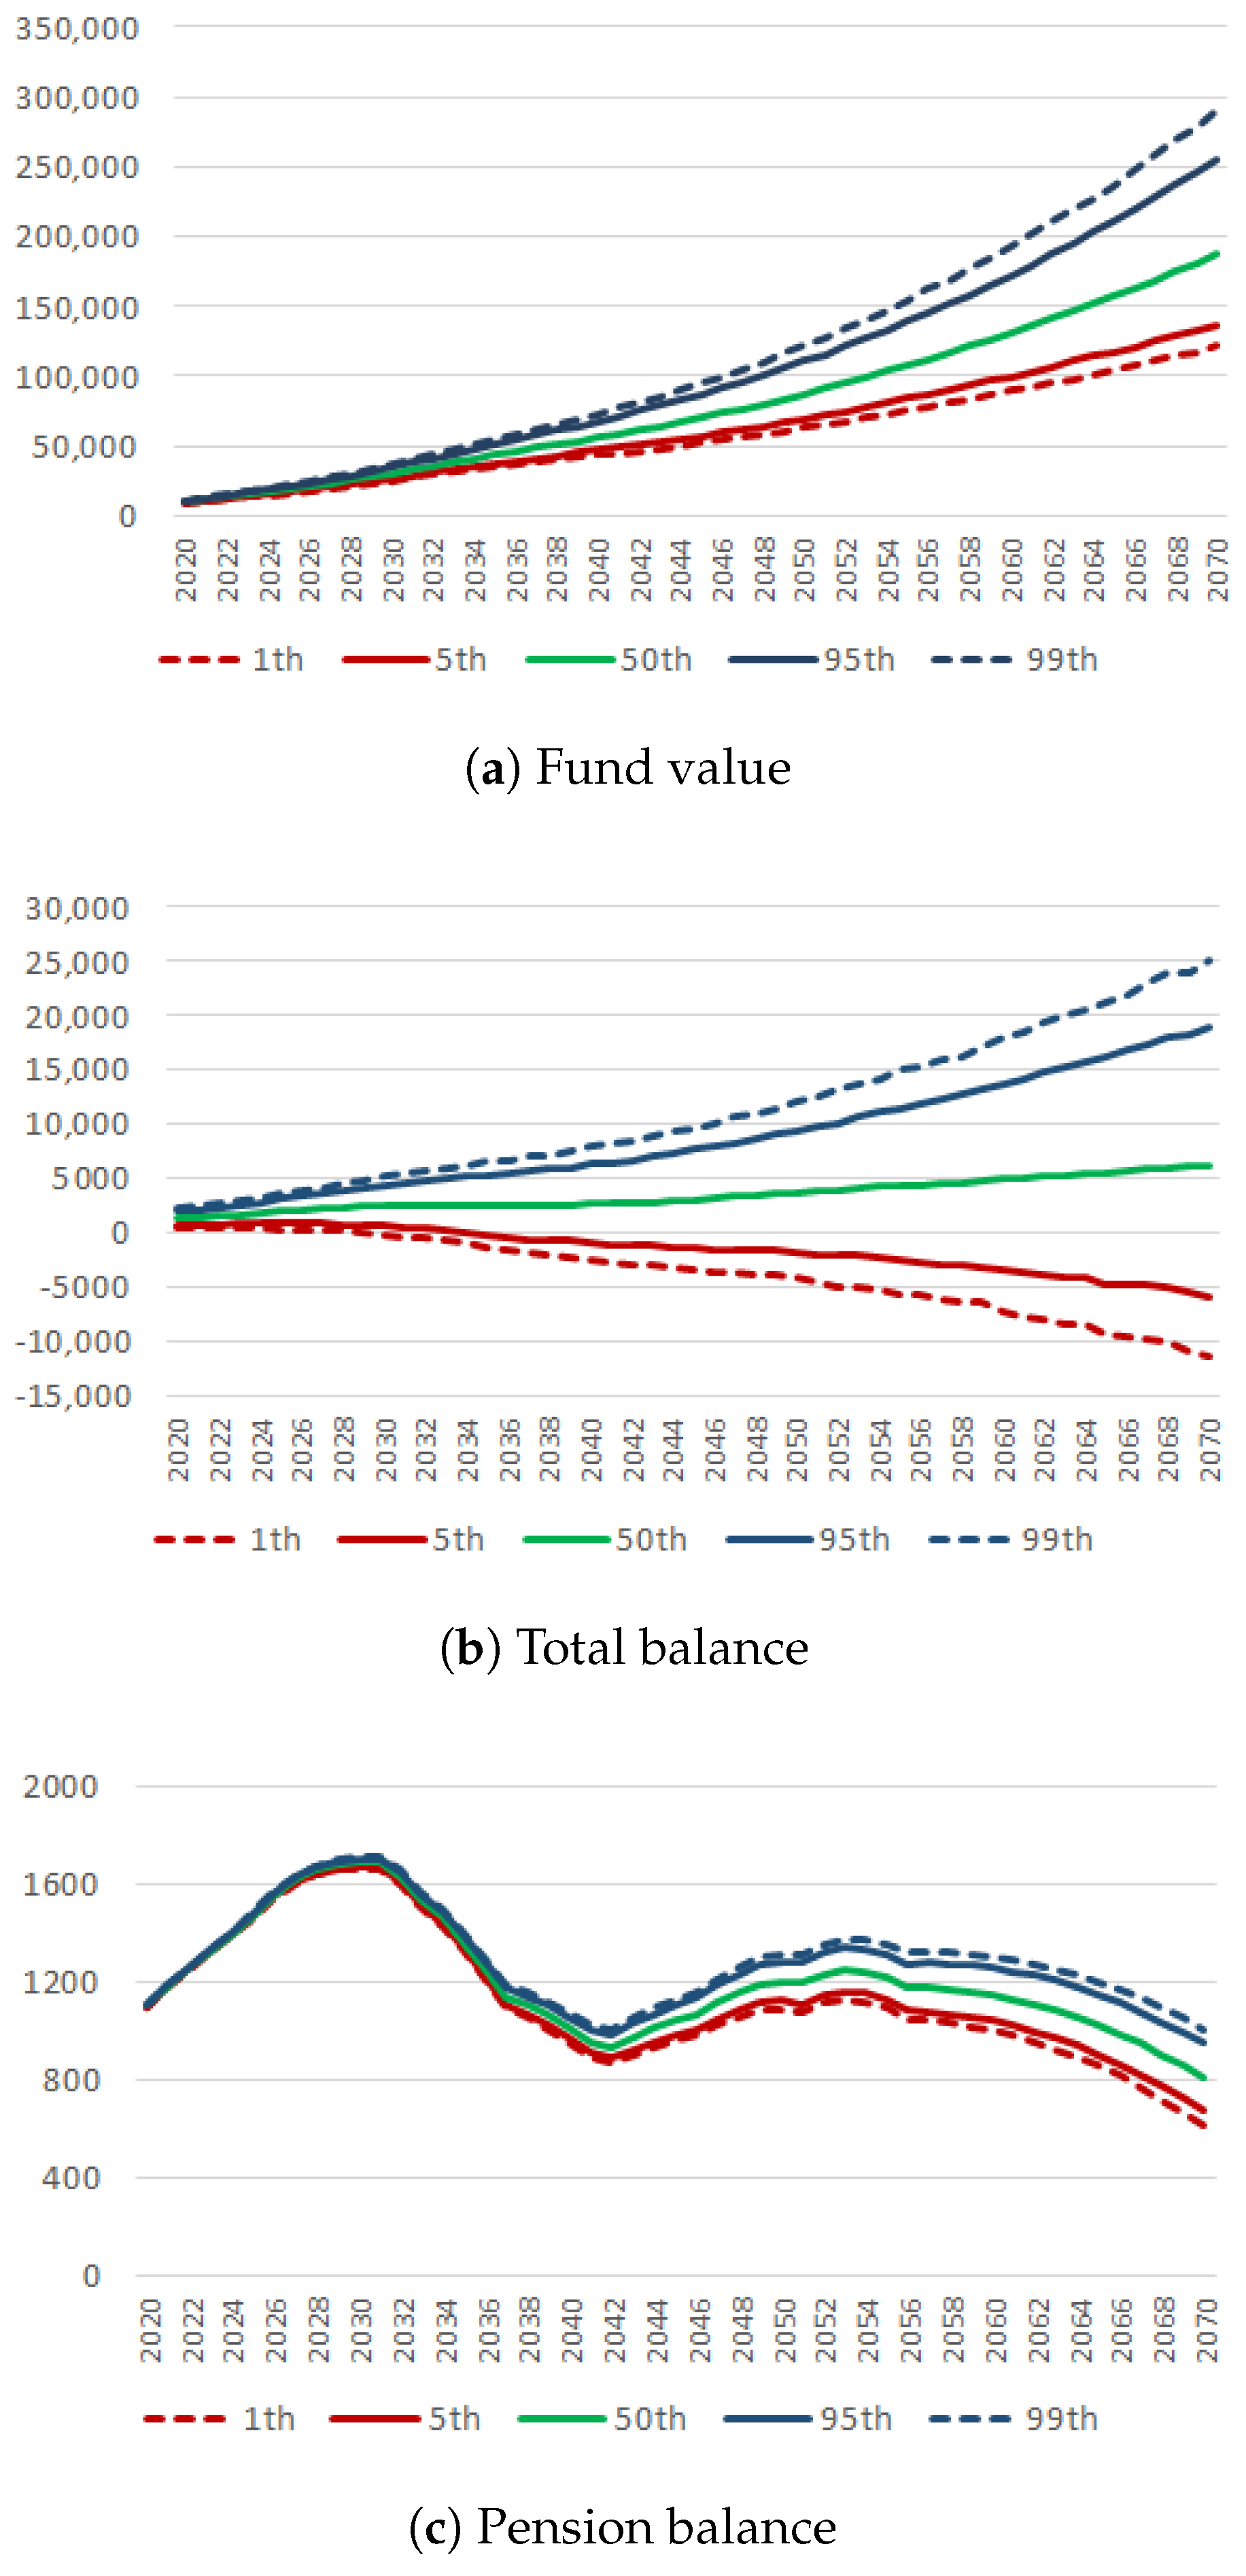
4.8. Financial Results
Figure 8 shows the percentiles of the frequency distributions of the fund value, the total balance and the pension balance, while
Table 8 summarizes the statistical properties of these distributions. The simulations reveal an upward trend of the fund value over the whole forecasting period, driven by a pension balance—the difference between total contributions received and total pensions paid—which is constantly positive with 99% confidence level.
The analysis of the pension balance reveals two insights. First, for any given year, its statistical dispersion is significantly lower than that of the total balance, as measured by their standard deviations and coefficients of variation. This result suggests, under the assumptions of the model, a higher exposition of the fund to the risk of investment returns rather than to the risk of new entrants.
The second insight is about the joint population dynamics of future new entrants and of pre-existing contributors. The pension balance tends to follow two cycles, clearly visible in
Figure 8. In the first, the balance tends to increase by about 53% between 2020 and 2030, and to decrease by about 45% up to 2042. The second cycle appears after 2042 and has qualitatively similar trends but of lesser magnitude. It can be inferred that the first increasing phase of the pension balance is largely driven by new entrants, while the following decreasing phase is due to a surge in retirements that occurs when the biggest cohorts of pre-existing contributors meet the pension requirements. This group consists of individuals born in the decade 1964–1973, creating the ‘demographic hump’ visible in
Figure 6.
5. Conclusions
This study contributes to the literature on stochastic models for new entrants in social insurance schemes by addressing the case of pension funds with professional entry requirements. The paper proposed a Markov chain model for estimating new entrants, with stochastic coefficients related to trends in population, educational choices and appeal of the profession. The topic addressed is relevant, since the uncertainty in new entrants can pose a risk to pension funds. This is especially true for those financed by a pay-as-you-go system, where contributions of current active members are used to pay benefits of pensioners. Thus, a lacking number of new entrants can lead to financial imbalances and threaten the long-term financial sustainability of the system.
The model was successfully validated through backtesting over historical data of new entrants into the Italian order of chartered accountants (known as CNDCEC). The results, presented in
Section 3.3, demonstrate the ability of the model to predict new entrants into a professional group, both in the short and in the long run. As shown in
Figure 4, the model reached an accuracy of up to 99% in predicting the cumulative value of observed new entrants into the CNDCEC between 2012 and 2021, compared to the accuracy of the baseline model (using OLS regression) of less than 80%. This result is particularly noteworthy because it was obtained despite significant unexpected events that occurred during this interval, namely, a reform of the professional practicum and the outbreak of the COVID-19 pandemic.
The paper also presents an application to the pension fund of Italian chartered accountants (known as CNPADC). The model was expanded to account for the demographic and financial evolution of the fund, under the additional assumption of stochastic returns. The estimates were made for the years 2020–2070 by Monte Carlo simulations, and the results are presented, respectively, in
Section 4.7 and
Section 4.8. Although the focus was on presenting the methodology, three noteworthy findings were observed. First, a comparative analysis revealed that the annual share of female new entrants into the CNPADC tended to be lower than that into the CNDCEC order. The proposed explanation was a lower propensity of female chartered accountants (with respect to males) to practice the profession in a liberal form. This may suggest the existence, within the Italian accounting profession, of a ‘glass ceiling’ effect already observed in other countries (see
Cohen et al. 2020). Second, under the assumptions of the model, the pension balance was significantly more clustered than the total balance, thus suggesting a higher exposition of the fund to the risk of investment returns rather than to the risk of new entrants. This conclusion is supported by the relative stability in the population of Italian chartered accountants, as measured via the proposed Markov chain model. Third and finally, the pension balance was found to follow a cyclic pattern in which the first increasing phase was driven by new entrants, while the following decreasing phase was due to to the retirement of the bulk of pre-existing contributors, born in the decade 1964–1973. These joint population dynamics and their financial impact on the fund were captured and properly quantified via the model.
The present study makes a significant contribution to the existing literature by providing a new method for actuaries to assess future new entrants into professional pension funds. The traditional methods are mostly based on either heuristic assumptions (for example, a constant population structure), regression techniques or rate of growth of population. This paper brings a different approach inspired by the stage-classified demographic theory based on Markov chain, typical of ecological and population studies, with the innovation of replacing its traditional biological rates with success rates in academic and professional education. The proposed method permits to investigate, more effectively than its traditional alternatives, the structural connections between demographic, socio-economic and regulatory variables affecting the employment dynamics of professional groups. Although the primary purpose of the model is for actuarial valuations, it can also be used to support policy analysis of employment and labour participation. Its main shortcoming is that it requires relatively long time series of a different nature: national population, educational statistics and professional enrollments. This amount of data may be unavailable for various professions or countries. Future developments of this research will aim at the joint stochastic modelling of new entrants, investment returns and future mortality rates, thus adding longevity risk to the topics addressed in this paper.


