Article

The Effects of Climate Change to Weather-Related Environmental Hazards: Interlinkages of Economic Factors and Climate Risk

Laboratory of Operations Research, Department of Economics, University of Thessaly, 38333 Volos, Greece
*
Author to whom correspondence should be addressed.
J. Risk Financial Manag. 2023, 16(5), 264; https://doi.org/10.3390/jrfm16050264
Submission received: 9 March 2023 / Revised: 20 April 2023 / Accepted: 25 April 2023 / Published: 5 May 2023
(This article belongs to the Special Issue Macroeconomic Modelling)

Abstract

:
Climate change has become an increasingly intense global phenomenon in recent years. A great number of researchers support the idea that climate change is strongly connected to some environmental hazards, and specifically, those correlated to extreme weather events. Following the Paris Agreement, and due to the increased concern regarding climate change impacts, several indices have been established. The Climate Change Performance Index (CCPI) includes 59 countries and the EU, which cumulatively emit 92% of global greenhouse gases (GHGs), while the Global Climate Risk Index (CRI) analyzes to what extend countries have been affected by impacts of weather-related loss events. Both indices provide annual scores to each country and rank them based on those scores indicating the existing environmental situation. Our main purpose is to examine whether there is an interconnection between those two indices as well as testify whether economic growth is a great contributor to country’s environmental performance and as a result to climate risk. Using a sample of the reported countries for the year 2019, the latest reported year for both indices, and following a cross-sectional econometric analysis, we provide evidence regarding the connection of CCPI and CRI by using graphs, mapping visualization and econometric estimations in order to draw lines between indices. Moreover, we examine the interlinkages, and we estimate the influence caused by socio-economic factors and emissions levels per country. We provide evidence regarding the high-ranked and low-ranked countries and how they perform not only to an environmental base, but also to an economic base. Regarding the major finding, based on our analysis, no proven causality between CRI and CCPI was observed. Economic growth appears to have a significant impact on CRI but not on the CCPI, for the year 2019, while population density has an impact on both indices. Regarding greenhouse gas emissions, the econometric estimations provide evidence of significance for CRI but not for CCPI. An in-depth understanding of the current situation as well as of the factors affecting the climate conditions will give us the needed elements in order to minimize the adverse impact, if not improve the current situation. It is well known and stated that climate action should be taken so that we bequeath a safer and more sustainable planet to the next generations.
JEL Classification:
O11; O40; Q20; Q30; Q43; Q54

1. Introduction

Over the last years, it was observed that extreme weather-related environmental hazards appeared to rise continuously, worsening the current encumbered environmental situation while exposing more and more people to risk. A majority of researchers emphasize the fact that greenhouse gas (GHG) emissions are one of the main components of climate change. At the same time, the phenomenon of climate change appears to have a connection with the sea surface temperature anomaly as well as extreme weather events and environmental hazards. The global phenomenon of climate change has become increasingly intense in recent years due to the accumulation of pollution and the associated environmental degradation. The effects of this phenomenon are now felt across the globe throughout the years. Other researchers connect climate change with other macroeconomic and environmental factors.
The purpose of this paper is to initially describe two of the most known climate indices, the Climate Risk Index (CRI) and the Climate Change Performance Index (CCPI), by briefly describing the meaning of the reported scores. Based on our knowledge, there is no published work yet that examines the possible causality of these two indices, as well as whether these indices are affected by socio-economic factors. We hope that such an attempt will provide evidence that will help us understand the interlinkages between the indices, the society and the economy. Based on this evidence, we can, therefore, propose actions that need to be taken in order to possibly improve the current situation of environment.
Regarding the structure of the paper, in Section 2, we report the existing relevant literature analyzing and providing information regarding the Climate Change Performance and Climate Risk Indices. Section 3 presents the proposed methodology used in order to scientifically validate a number of established hypotheses. Moving forward, Section 4 displays the empirical findings with different graphs and the results of the various econometric specifications, while Section 5 concludes by highlighting the main outcomes and hypotheses decision, also providing possible further research on the topic examined.

2. Literature Review

Climate change is a phenomenon that raises a lot of attention in the last decades by researchers focusing both on its causes and impacts (Vieira et al. 2022; Mikhaylov et al. 2020; Bruhwiler et al. 2021; Shalini et al. 2021; Kron et al. 2019; Zheng et al. 2019; Cloy 2018; Chang and Hu 2019; Elum and Momodu 2017; Zakarya et al. 2015; Chang et al. 2018; de Castro Camioto et al. 2016; Tu et al. 2016; Chen et al. 2015; Belke et al. 2011; Niu et al. 2011; Pao and Tsai 2010; Tsai 2010; Neves and Lean 2010; Karvonen et al. 2010; Ramanathan and Feng 2009; Chapman 2007; Manish et al. 2006; Mirza 2003; Karl and Trenberth 2003). Nowadays, more and more concern has been raised due to the possible connection established between climate change and environmental hazards. Mikhaylov et al. (2020) underlined that climate change is mainly an anthropogenic consequence because the human activity and behavior has significantly forced this change to occur. They consider greenhouse gas (GHG) emissions created by the production processes and human activities as one of the greatest factors causing climate change. Not only environmental factors, such as emissions, but also macroeconomic variables may worsen climate change including population growth, deforestation, globalization, economic development, economic growth, production and consumption of industrial goods, energy consumption and demand and Foreign Direct Investment (FDI) (Mikhaylov et al. 2020; Zheng et al. 2019; Cloy 2018; Chang and Hu 2019; Zakarya et al. 2015; Chang et al. 2018; de Castro Camioto et al. 2016; Tu et al. 2016; Chen et al. 2015; Belke et al. 2011; Niu et al. 2011; Manish et al. 2006).
In an attempt to analyze the impacts of greenhouse gas emissions (GHG), scientists such as Mikhaylov et al. (2020), Manish et al. (2006) and Bruhwiler et al. (2021) provide information regarding three of the main components of GHG emissions. More specifically, the three main GHG emissions are carbon dioxide (CO2), methane (CH4) and nitrous oxide (N2O), with CO2 being the major greenhouse gas (GHG) emission responsible for climate change. As it is underlined by Manish et al. (2006), the major industrial sector that causes almost 75% of CO2 globally is the energy sector.
Based on the available information and published literature, it is well known that a great impact of the increased greenhouse gases (GHGs) is the alteration of the global surface temperature. More specifically, greenhouse gas (GHG) emissions lead to an unexpected warming of the globe’s surface as well as the atmosphere, creating the known phenomenon of “global warming”. As Ramanathan and Feng (2009) underline, this phenomenon, which has been observed for many years, is related to the extended risk humans are facing, which has recently been correlated to extreme weather events. Some of the most common meteorological hazards they list are rainfall, glaciers’ sea ice retreat and the change in sea level as well as other observed events. The impacts of global warming are proven to severely affect humans’ lives. Interestingly, there are chained effects connected to global warming. The increased temperature leads to the polar ice melting, causing the rise of the sea level. This phenomenon may have flooding areas close to the coast, in which agricultural production may be threatened, as an outcome. Any threat on the agricultural procedure may have an immediate impact to the economic growth, especially when these areas are agricultural and fishing focused regions (Mikhaylov et al. 2020). Regarding fishery, the rise of sea temperature may lead to increased risk for the aquatic animals and severe outcomes to region’s biodiversity in general (Karvonen et al. 2010).
Thus, if we tend to assume that humans are not influenced by any severe condition that threatens the flora and fauna, we should think twice, not only due to the fact that flora and fauna appear to hold a significant proportion of globe’s economy, but also, epidemiologically speaking, increased water temperature is proven to be connected to the rise of parasitic diseases (Karvonen et al. 2010; Walther et al. 2002; Stott et al. 2000). Following the key finding of Eckstein et al. (2021), who published the “Climate Risk Index” report, it is important to mention that the mean annual temperatures have increased by at least 1.5 times the observed global average of 0.65 °C over the past five decades, and extreme rainfall events have increased in frequency, emphasizing the already described situation of global warming.
Consequently, climate change is strongly connected to some environmental hazards, and specifically, those correlated to extreme weather events. Following the Paris Agreement, and due to the increased concern regarding climate change impacts, several indices were established. Many researchers have emphasized that, during recent decades, specific events have been observed. More specifically, Elum and Momodu (2017) underline the fact that human activities have led to an increased number of greenhouse gas (GHG) emissions released in the atmosphere, increasing the challenges from the climate change perspective. At the same time, Kron et al. (2019) shed light to the increased trend of weather-related events and the consequences observed after the occurrence of those events. Here comes the importance of environmental indices and more specifically climate indices. Eckstein et al. (2021), in their report, provided evidence that people around the globe are facing the reality of climate change and the increased volatility of extreme weather events. Shockingly, in a period of two decades (2000–2019), over 475,000 people lost their lives worldwide, and a 2.56 trillion USD economic loss was reported as a direct result of more than 11,000 extreme weather events. The occurrence and intensity of weather-related disasters have increased in recent years all over the world, as mentioned by Kron et al. (2019).
Based on the authors’ opinion, it is crucial to create and examine global environmental indices and, in this case, climate indices in order to observe the evolution of the existing situation around the world. Two interesting freely available indices are the “Climate Change Performance Index—CCPI” and “Climate Risk Index—CRI”. In order to include these two indices in our analysis, it is crucial to understand the purpose and the components of these valuable instruments. Eckstein et al. (2021) published the latest report of the Climate Risk Index. This report, published in 2021, is named the “Global Climate Risk Index 2021”, and as they underline, it includes the latest available data for 2019. This important index uses weather- and disaster-related variables in order to compute scores and ranks of countries, providing information on the level to which countries and regions have been affected by the impacts of climate-related extreme weather events (storms, floods, heatwaves etc.). It is important to mention that countries highly affected by these events receive lower scores on the Climate Risk Index, and as a result, they are placed at a lower position in the ranking. Thus, there is a negative relationship between CRI score and the risk that countries are exposed to. As the CRI score increases, the risk a country is facing decreases. Countries at the lower ranking positions are those that are more vulnerable to risk and received the lower scores. Mozambique (CRI score equals to 2.67), Zimbabwe (CRI score equals to 6.17) and the Bahamas (CRI score equals to 6.50) were the countries most affected by the impacts of extreme weather events in 2019. It is stated that developing countries tend to be more affected by and vulnerable to extreme weather events (Mirza 2003), a statement that is also raised in Halkos and Zisiadou (2019).
Following the same concept, Burck et al. (2022) published the latest report of the Climate Change Performance Index. This report, published in 2020, is named the “Climate Change Performance Index 2021”, and as underlined, it includes the latest available data for 2019. The countries included in this index are responsible for the creation and emission of 92% of the total amount of greenhouse gases (GHGs) globally. The index uses four components in order to calculate and provide the final score and rank per country. These components are four environmental variables (greenhouse gas emissions, renewable energy, energy use, and climate policy), indicating that the index takes into consideration both the traditional methods of energy production that create GHG emissions and the environmental friendly alternative methods of energy production, or the renewable energy sources. It is important to note that there is a positive relationship between CCPI score and the performance of countries recorded. As the CCPI score increases, the country has a better overall climate change performance. Countries at the lower ranking positions are those that are more vulnerable to climate change and thus received lower scores.
As proposed by various researchers (among others, Mikhaylov et al. 2020; Meynkhard 2019, 2020; Lopatin 2019; Huang et al. 2016; Manish et al. 2006), a great solution regarding global warming and climate change is to minimize the volatility of the observed temperature. Knowing that this increased temperature is mainly caused by GHG emissions, a main outcome of fossil fuels use in energy generation, it is crucial to understand that the main aim for a sustainable and prosperous future is to reduce GHG emissions by turning to “cleaner” solutions, which are environmentally sustainable and efficient regarding the energy production, such as renewable energy sources (Halkos and Zisiadou 2023; Bruhwiler et al. 2021; Mikhaylov et al. 2020; Lisin 2020; Li 2017; Huang et al. 2016; Levin 2012; Pao and Tsai 2010; Tsai 2010; Neves and Lean 2010; Albergel et al. 2010; Allen et al. 2009; Gregory et al. 2009; Matthews et al. 2009).

3. Methodology

The methodology that will be used in our analysis contains econometrics approaches and diagnostic testing that will provide evidence regarding the relationships between the dependent and independent variables and ensure that all OLS assumptions are valid. Moreover, mapping visualizations will illustrate the areas where high concentrations of emissions are observed. Similarly, charts regarding the comparison of CCPI scores and CRI scores as well as the sea surface anomaly temperatures over the years will be included in our analysis.

3.1. Hypotheses

Our main purpose is to examine and provide evidence regarding the possible linkage between the Climate Change Performance Index (CCPI) and Climate Risk Index (CRI) and the relationship, if any, with important macroeconomic and environmental variables. The initial step of our analysis is to establish the under-consideration hypotheses, which will be answered using the econometric specifications.
H1: 
There is a connection between the Climate Change Performance Index and Climate Risk Index.
H2: 
Economic growth can affect the Climate Change Performance Index.
H3: 
Economic growth can affect the Climate Risk Index.
H4: 
Population can affect the Climate Change Performance Index.
H5: 
Population can affect the Climate Risk Index.
H6: 
Greenhouse gas emissions worsen the Climate Change Performance Index.
H7: 
Greenhouse gas emissions decrease the Climate Risk Index.
H8: 
Use of renewable energy can positively influence the Climate Change Performance Index.
H9: 
PM2.5 can adversely affect the Climate Change Performance Index.
The first hypothesis is established in an attempt to examine whether there is a proven linkage between the two indices connected to the climate’s current situation. This linkage will be explored relying on causality testing as well as econometric model specifications. Regarding the second and third hypotheses, we will observe if the independent variable of economic growth is significantly affecting the values of the Climate Change Performance Index and the Climate Risk Index. Another macroeconomic factor that will be examined is the population density and growth of each country by modelling its possible impact on the dependent variables (Hypotheses 4 and 5). As it is assumed, climate change is significantly connected to economic and population growth (Mikhaylov et al. 2020; Cloy 2018; Chen et al. 2015). We are expecting to find a positive statistically significant relation between population variables and the CCPI and CRI. Based on previous researchers, and as it has already been described in the previous section, greenhouse gas (GHG) emissions are one of the main factors that cause climate change. For this reason, by examining Hypotheses 6 and 7, the authors assume that the two dependent variables (CCPI and CRI) will be significantly determined by greenhouse gas (GHG) emissions. Following the statement of Elum and Momodu (2017) that renewable energy forms may help us mitigate climate change, we will include a renewable energy consumption variable as a determinant, expecting to receive a positive statistically significant impact on the dependent variables (Hypothesis 8). Another environmental factor that may affect our dependent variables is assumed to be the PM2.5 variables, which are connected to air pollution (Hypothesis 9).

3.2. Data Selection and Variables

Our main aim in this paper is to examine the behavior and the determinants of two Climate Indices, the Climate Change Performance Index (CCPI) and the Climate Risk Index (CRI). Using cross-sectional data, we have the CCPI and CRI as dependent variables in our two model specifications. It is crucial, though, to mention that we are aiming to examine a possible causality between these two variables, so each dependent variable of one model specification will also be included as an independent variable to the other model specification.
The model specifications to be estimated are the following:
M o d e l   1 :   C R I i = β 0 + β 1 C C P I + i = 2 7 β i X i + i = 8 11 β i Z i + u i
M o d e l   2 :   C C P I i = γ 0 + γ 1 C R I + i = 2 7 γ i X i + i = 8 11 γ i Z i + v i
where CRI stands for the Climate Risk Index for the year 20191 for the available countries, CCPI stands for the Climate Change Performance Index for the year 20192 for the available countries, Xi includes all macroeconomic variables of our model specifications and Zi includes all environmental variables of our model specifications for the year 2019. Regarding the macroeconomic variables included in our estimations, we use the GDP per capita, GDP growth, population density, population growth, access to electricity and the poverty ratio, whose data were retrieved by World Bank database for the year 2019,3 while the environmental variables used are greenhouse gases (kt), PM2.5 Mean Annual Exposure, PM2.5 % of population exposed to levels exceeding the WHO guideline, renewable energy consumption, whose data were retrieved by the World Bank database for the year 2019.4 It is important to mention that we use year 2019 as the year of our analysis due to the fact that the latest CRI reported calculations were published for year 2019.
The two examined environmental indices, CRI and CCPI, are both connected to climate change, its causes and its impacts, and we aim to investigate whether there is any evidence indicating a possible influence of one index to the other. The causality, if any, of these indices will be examined using a Granger Causality test. This will be followed by model specifications with CRI and CCPI both as dependent and explanatory variables in exploring the magnitude of influence and their statistical significance.

4. Empirical Results and Discussion

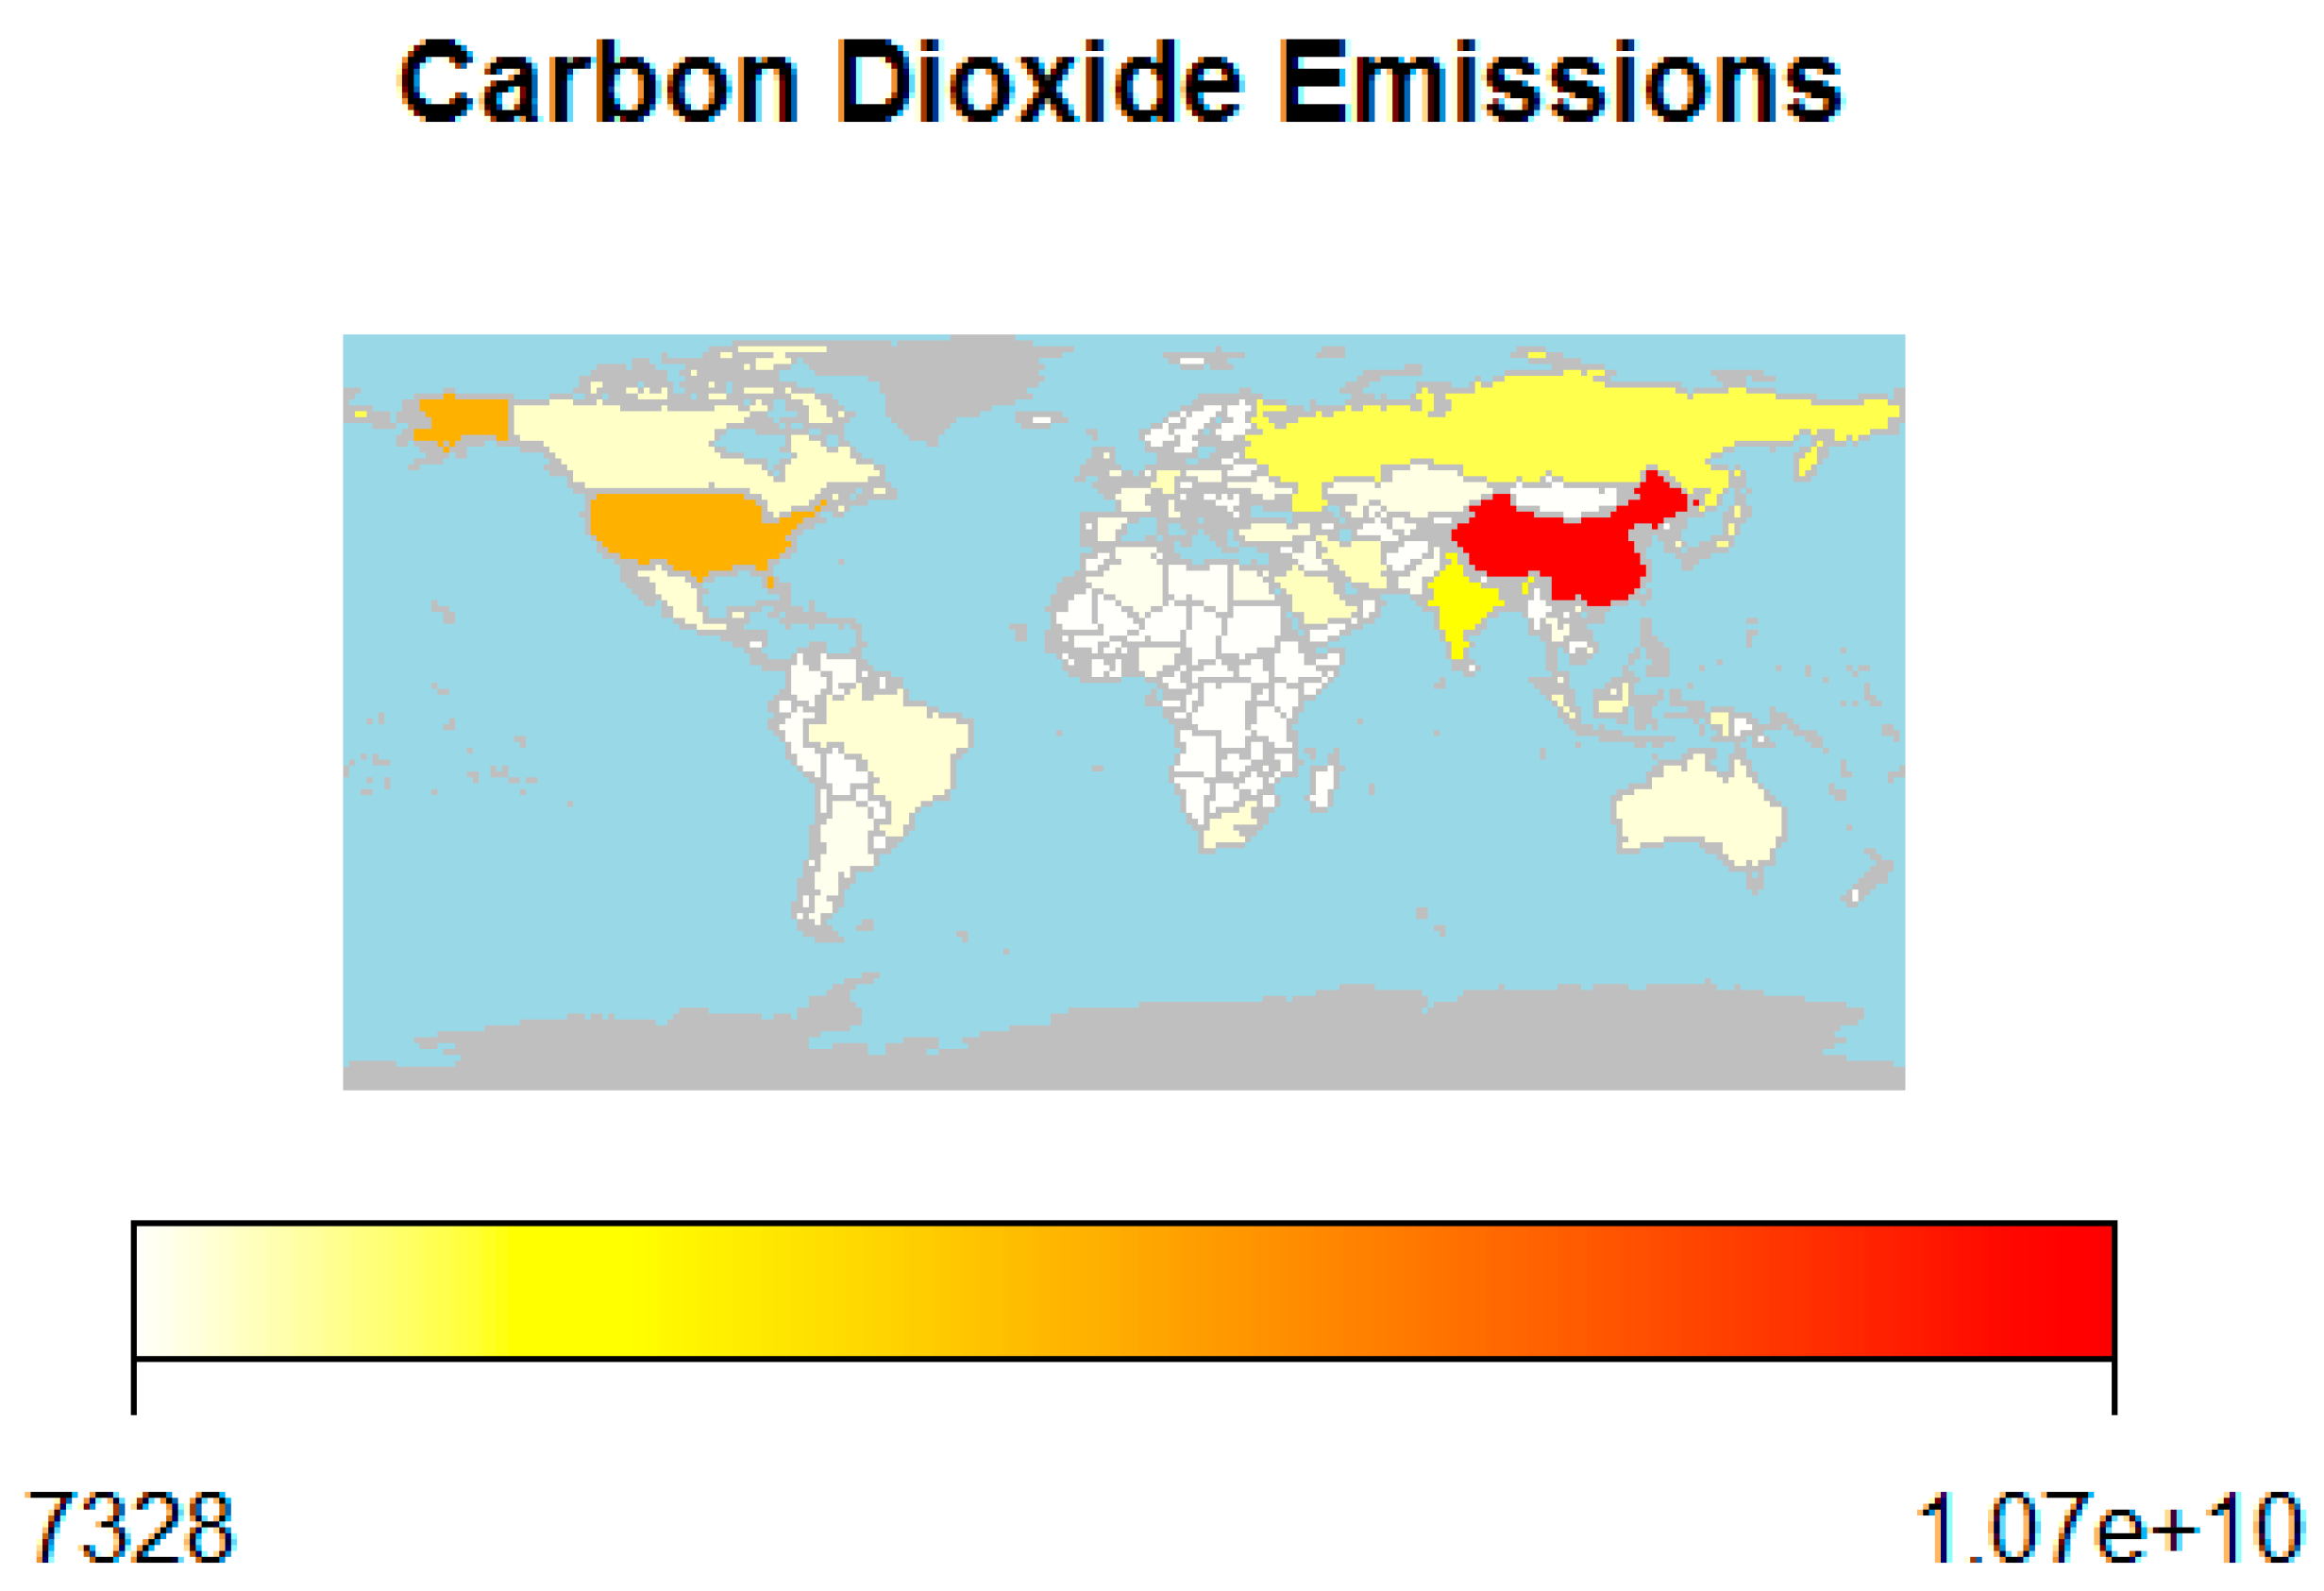
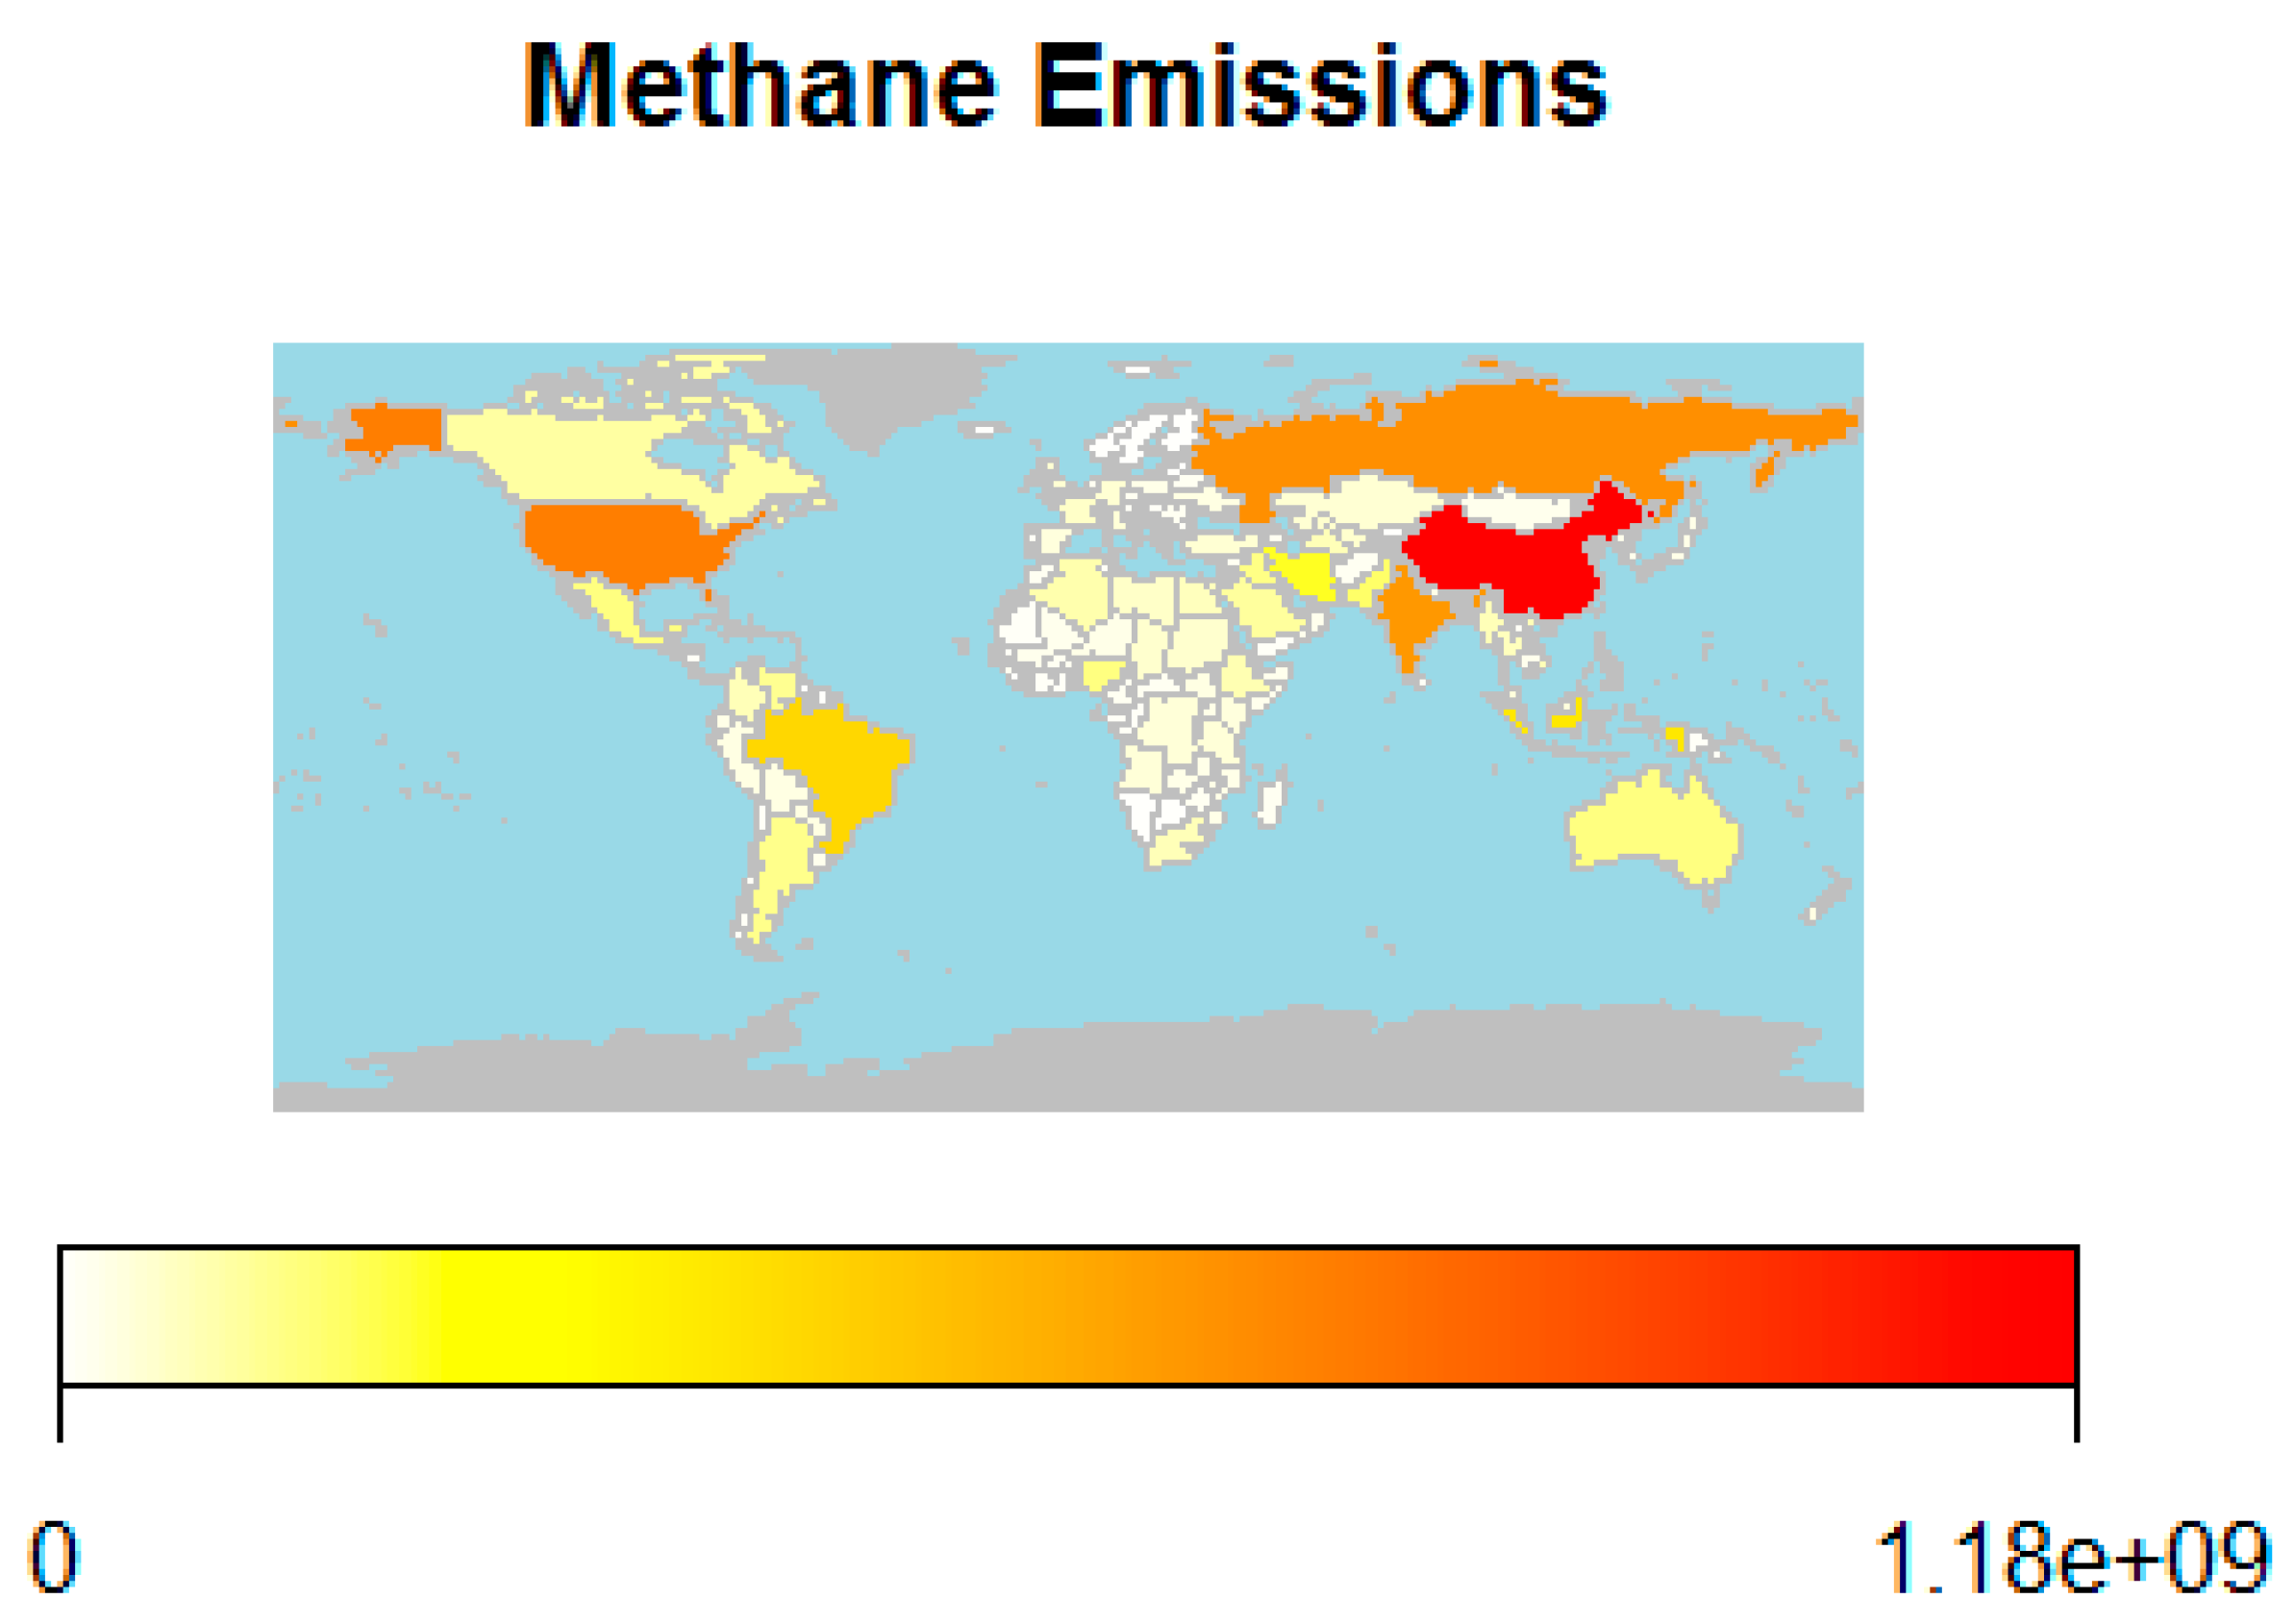
4.1. Mapping Visualization

In an attempt to identify the areas where high concentrations of emissions are observed, we created world maps of three types of emissions, using routines in R5 created by the authors. The three emission types included in our mapping approach are carbon dioxide (CO2), methane (CH4) and nitrous oxide (N2O), with those three emissions being the main components of greenhouse gas (GHG) emissions. The data used in order to create our maps were retrieved by the World Bank Database.6
Figure 1 illustrates the carbon dioxide emissions’ (CO2, kt) distribution worldwide for the year 2019. We once again used 2019 as a reference, due to the fact that we want to have comparable results with those of the CRI and CCPI modeling. As can be observed, China, the USA, India, the Russian Federation and Japan are among the countries with the highest CO2 emissions for 2019. More specifically, China recorded 10,707,219.7 kt of CO2; the USA recorded 4,817,720.21 kt of CO2; and India, the Russian Federation and Japan reported 2,456,300.05 kt, 1,703,589.97 kt and 1,081,569.95 kt of CO2, respectively. We would like to underline that 2 out of the 5 first countries (the USA and Japan) are OECD members, while China, India and the Russian Federation are not OECD members, indicating that both developed and developing countries are facing high levels of CO2 emissions. However, knowing that CO2 emissions are the major greenhouse gas (Manish et al. 2006) responsible for climate change, and at the same time recalling Mizra’s statement that developing countries are more vulnerable to extreme weather events, based on our results, we may draw some attention to specific countries regarding their future prospects.
Following the same procedure, we created the world map of methane (CH4), whose data were retrieved by the World Bank, and they are in CO2 equivalent. Figure 2 illustrates the methane emissions’ (CH4, kt) distribution worldwide for the year 2019. As can be observed, China, the USA, the Russian Federation, India and Brazil are among the countries with the highest CH4 emissions for 2019. More specifically, China recorded 1,176,140.01 kt of CH4; the USA recorded 744,510.01 kt of CH4; and the Russian Federation, India and Brazil reported 684,299.988 kt, 656,650.024 kt and 431,070.007 kt of CH4, respectively. It is important to mention that Japan is not included in the highest CH4 emitters.
Similarly, we created the nitrous oxide emissions map, knowing that N2O is the third main component of greenhouse gases (GHGs). Figure 3 illustrates the nitrous oxide emissions’ (N2O, kt) distribution worldwide for the year 2019. As it is observed, China, USA, India, Brazil and Indonesia are among the countries with the highest N2O emissions for 2019. More specifically, China recorded 1,552,060 kt of N2O; the USA recorded 264,950 kt of N2O; and India, Brazil and Indonesia reported 260,170 kt, 182,050 kt and 98,090 kt of N2O, respectively.

4.2. Sea Surface Temperature Anomaly

Following the statement raised by Karvonen et al. (2010) and Ramanathan and Feng (2009), we illustrated the evolution of sea surface temperature anomaly. As can be observed in Figure 4, there is a continuous rise of the sea surface temperature over a period of 31 years (1992–2022). Although there are some years with a decrease on that anomaly, such as 1996, where the sea surface anomaly decreased from 0.44 to 0.32, it is observed that there is an existing tendency to an upward trend. Over the last 31 years, Figure 4 illustrates that 2016 and 2020 were the years with the highest sea surface temperature anomaly, reporting values of 1.0125 and 1.0158, respectively. Karvonen et al. (2010) underlined the increase of global warming and sea surface temperature indicating the associated risk for aquatic life as well as the incidence of parasitic diseases. Based on this evidence and the expected negative influence that such a phenomenon will have on society, it is crucial to take the possible impacts of such temperature anomalies carefully into consideration.

4.3. Index Comparison over Time

Before we proceed in estimating the proposed econometric model specification presented in Section 3.2, we would like to provide initial knowledge of the evolution of the main two indices that we discuss on this paper. For this purpose, we present two figures (Figure A1 and Figure A2) that compare the CRI and CCPI scores for 2019 with other periods in the following Section 4.3.1 and Section 4.3.2, respectively.

4.3.1. Climate Risk Index Comparison over Time

Figure A1 in Appendix B illustrates the comparison of the CRI scores for 2019 and the average CRI scores for a 20-year period (2000–2019), as was presented in the latest CRI report. Following the multilateral agreements regarding environmental issues, we expect to observe that the values of 2019 will exceed the average values of the 20-year period. As illustrated in Figure A1, in 2019, not all countries exceeded the mean value of CRI score of the 20-year period. The countries that follow an increasing trend of CRI score, and as a result face less risk, are Algeria, Belgium, Bulgaria, the Czech Republic, France, Germany, Hungary, Italy, Latvia, the Netherlands, Poland, Portugal, Romania, the Russian Federation, Slovenia, Switzerland, Thailand and the United Kingdom. The rest of the countries recorded CRI scores lower than the reported mean values.

4.3.2. Climate Change Performance Index Comparison over Time

Similar to Section 4.3.1, we analyze the evolution of the CCPI scores. However, in this case, we do not compare them with the mean value of a specific period, as in the CRI case, but we compare the year 2019 with year 2022. From all countries included in the analysis, we observed that 20 countries, in 2022, reported CCPI scores higher than those reported in 2019. More specifically, the countries accomplishing higher CCPI scores over the 3-year period (2019–2022) are Algeria, Australia, Austria, Bulgaria, Cyprus, Denmark, Egypt, Estonia, Germany, Greece, India, Indonesia, Ireland, Japan, Luxembourg, the Netherlands, New Zealand, Norway, Portugal and Slovenia. These results emphasize the fact that some countries following the environmental rules, agreements and establishments report great values and, as a result, better climate change performance over the years. Additionally, we can observe that only five countries report both greater values of CRI and CCPI scores over the years. These five countries are Algeria, Bulgaria, Germany, Portugal and Slovenia. As a further research proposal, we highlight the need for the examination and illustration of the evolution of environmental indices, starting with the Climate Risk Index and Climate Change Performance Index.

4.4. Causality Testing

Moving forward to the econometric analysis, we aim to examine the possible causality between the Climate Change Performance Index and Climate Risk Index. For this reason, the Granger Causality test was performed on our collected data. The null hypotheses of the test indicate that the CCPI does not cause the CRI and, similarly, the CRI does not cause the CCPI. Based on the results presented in Table 1, regarding the hypothesis that the CCPI does not cause the CRI, we observe that the P-value of the test is greater compared to all significance levels, so we do not reject the null hypothesis and, therefore, it is proven that the CCPI does not cause the CRI. Similarly, regarding the hypothesis that the CRI does not cause the CCPI, we observe that the P-value of the test is greater compared to all levels of significance and, thus, we do not reject the null hypothesis proving that the CRI does not cause the CCPI.
Concluding, based on the analysis presented above and the specific datasets used by the authors, we can confirm that, for Hypothesis 1, there is no proven connection between the Climate Change Performance Index and Climate Risk Index.

4.5. Cross-Sectional Analysis

Moving forward, in an attempt to examine the hypotheses under consideration, our analysis proceeds with the use of econometric model specifications and various diagnostics. More specifically, the two models described in Section 3.2 will be estimated using cross-sectional analysis, examining multiple sampled countries for a given year (2019). All related diagnostic tests will be conducted in order to secure the accuracy of all estimated outcomes.

4.5.1. Climate Risk Index

Our first attempt was to determine the variables that affect the Climate Risk Index. Using the specification of Model 1, as described in Section 3.2, we conducted cross-sectional OLS estimations, and we received the results provided in Table A1 (see Appendix A). The first column of Table A1 indicates all variables used in each model specification, the second column provides the results of the initial estimation of Model 1 (hereafter Model 1a) and the third column provides the results of the final estimation of Model 1 (hereafter Model 1b), which were specified based on diagnostic tests and econometric criteria. For each estimation, we provide the calculated value of the estimator, the t-statistics of each estimator (values in parentheses) and the P-values of each estimator (values in brackets). The second part of the table includes all diagnostic tests needed when using cross-sectional analysis.
As we can observe, the initial model (Model 1a) appears to have only 3 statistically significant estimators (at some levels of significance) out of the 11 included variables. More specifically, economic growth, population density and greenhouse gas (GHG) emissions are observed to be statistically significant at the 90% and 95% level of significance but not at the 99% level of significance. Regarding diagnostic testing, as can be seen in Table A1, Model 1a does not suffer from heteroskedasticity due to the fact that all diagnostic tests (White, Breusch–Pagan–Godfrey, Glejser, Harvey) provide probability values greater than α (for α = 0.10, α = 0.05 and α = 0.01), leading us not to reject the null hypothesis, and indicating that Model 1a does not have heteroskedasticity problems. Examining for the Autoregressive under Condition of Heteroskedasticity effect (ARCH effect), we can state that the ARCH LM test of Model 1a received a probability value equal to 0.1765, greater than any usual α; thus, we do not reject the null hypothesis and the estimated model does not have any ARCH effect. Another diagnostic test we used is the Ramsey RESET test for specification errors, which gave a probability value equal to 0.9911. Once again, we do not reject the null hypothesis and the estimated specification does not suffer from specification errors. Last but not least, the authors used the Variance Inflation Factor (VIF) to examine for any possible multicollinearity. All values provided were much lower than 10, indicating that we do not have multicollinearity in Model 1a.
After examining all possible issues that a cross-sectional estimation may demonstrate, we should eliminate the statistically insignificant variables to receive the final estimation. For this attempt, we use the Akaike Information Criterion (AIC) and Schwarz Criterion (SC). Model 1b provides the final estimation, which includes only the statistically significant variables and the better AIC an SC values. Based on our estimations, only four variables appear to be statistically significant at the final approach of Model 1. More specifically, the GDP growth appears to be statistically significant at all levels of significance and has a positive effect on the dependent variable. With an increase of 0.01 of GDP growth, the Climate Risk Index will increase by 0.07246. It is important to mention, once again, that countries recording lower CRI scores appear to be riskier. In other words, the increased CRI score places each country in a safer position. That being said, the increase of GDP growth increases the final CRI score, ceteris paribus, leading to less climate risk for each country of examination. Based on this evidence, we observe that Hypothesis 3 is valid.
Similarly, we examined the population density variable in an attempt to test the validity of Hypothesis 5. As it is displayed (see Table A1, Appendix A) in Model 1b, the population density is statistically significant at 90% level of significance, leading to the validation of Hypothesis 5 that population can affect the Climate Risk Index. Moreover, we can emphasize the fact that the coefficient of estimation has a negative sign, meaning that, if population density increased by 1 unit, then the final CRI score would decrease by 0.02696, which basically increases the risk of a country. In other words, the densely populated countries are proven to be risker, regarding the Climate Risk Index, due to the fact that the increase of population density leads to the decrease of the CRI score, placing the countries in lower performance ranks.
Following the same analysis, we examined Hypothesis 7. Model 1b indicates that greenhouse gas (GHG) emissions are statistically significant at all levels of significance and negatively affect the CRI score. As it is observed, with an increase of 100 units (kt) in greenhouse gases (GHGs), the CRI score will decrease by 0.000644, which basically increases the risk of a country. In other words, countries that record higher levels of GHG emissions are proven to be risker, regarding the Climate Risk Index. To sum up, Hypothesis 7 is validated. Before moving to CCPI analysis, it is important to discuss the last variable that appears to be statistically significant in our analysis. The variable “access to electricity” is statistically significant at all levels of significance and positively affects the CRI scores, indicating that countries with access to electricity, or more specifically, countries where the majority of citizens have access to electricity, record higher CRI scores and as a result are proven to be less risky with respect to the Climate Risk Index.

4.5.2. Climate Change Performance Index

Our first attempt was to determine the variables that affect the Climate Change Performance Index. Using the specification of Model 2, as it was described in Section 3.2, we conducted cross-sectional OLS estimations, and we received the results provided in Table A2 (see Appendix A). The first column of Table A2 indicates all variables used in each model specification, the second column provides the results of the initial estimation of Model 2 (hereafter Model 2a) and the third column provides the results of the final estimation of Model 2 (hereafter Model 2b) which was specified based on diagnostic tests and econometric criteria. For each estimation, we provide the calculated value of the estimator, the t-statistics of each estimator (values in parentheses) and the P-values of each estimator (values in brackets). The second half of the table includes all diagnostic test needed when using cross-sectional analysis.
As can be observed, the initial model (Model 2a) appears to have only 2 statistically significant estimators (at some levels of significance) out of the 11 included variables. More specifically, population density is observed to be statistically significant at 10% and 5% level of significance, and renewable energy consumption is observed to be statistically significant at all levels of significance. Regarding the diagnostic testing, as can be seen based on Table A2, Model 2a does not suffer from heteroskedasticity due to the fact that all diagnostic tests (White, Breusch–Pagan–Godfrey, Glejser, Harvey) provide probability values greater than the usual levels of α (α = 0.10, α = 0.05 and α = 0.01), leading us not to reject the null hypothesis and indicating that Model 2a does not have heteroskedasticity issues. Examining for the Autoregressive under Condition of Heteroskedasticity effect (ARCH effect), we can state that the ARCH LM test of Model 2a has a probability value equal to 0.9763, much greater than any α; thus, we do not reject the null hypothesis, and the estimated model does not have any ARCH effect. Similarly, the Ramsey RESET test for specification errors gave a probability value equal to 0.6489. Once again, we do not reject the null hypothesis, and the estimated regression does not suffer from specification errors. Finally, in the Variance Inflation Factor (VIF), all values provided were much lower than 10, indicating that we do not have multicollinearity issues in Model 2a.
To proceed to the proposed estimated model specification, we eliminated the statistically insignificant variables. Relying on the Akaike Information Criterion (AIC) and Schwarz Criterion (SC), Model 2b provides the final estimation including only four statistically significant variables. More specifically, the population density appears to be statistically significant at all levels of significance and have a positive effect on the dependent variable. In an increase of 1 unit of population density, the Climate Change Performance Index will be increase by 0.013127. It is important to mention, once again, that countries recording higher CCPI scores appear to have a better climate change performancecompared to the countries placed on the lower ranks of the index. That being said, the increase in population density increases the final CCPI score, ceteris paribus, leading to better climate change performance for each country examined. Based on this evidence, we observe that Hypothesis 4 is validated.
Similarly, we examined the renewable energy consumption variable in an attempt to confirm Hypothesis 8. As it is displayed (see Table A2, Appendix A) in Model 2b, renewable energy consumption is statistically significant at all levels of significance, leading to the validation of Hypothesis 8 that the use of renewable energy can positively influence the Climate Change Performance Index. More specifically, if the renewable energy consumption increases by 1 unit, the CCPI score will be increased by 0.441216, ceteris paribus, leading to a better performance of each country analyzed. It is important to mention that this result was expected due to the fact that one of the four components of the CCPI score is the renewable energy use.
Other significant variables included in our analysis are the access to electricity and the poverty ratio. Based on results displayed on Table A2 (see Appendix A), the access to electricity positively affects the CCPI score, and if the variable increases by 1 unit, then the CCPI score will be increased by 0.402132, ceteris paribus. Similarly, the poverty ratio is statistically significant only at the 90% level of significance, and it is positively affecting the CCPI score by 0.209132 per 1 unit increase, ceteris paribus.
Considering Hypothesis 2, Model 2b indicates that GDP growth is statistically insignificant at all levels of significance, leading us to the conclusion that Hypothesis 2 is not validated. That is, based on the datasets used, GDP growth seems not to affect the CCPI score of each included country. The decision taken regarding Hypothesis 6, which examines whether greenhouse gas (GHG) emissions can worsen the CCPI score, is interesting. Based on our analysis, the GHG emissions variable appears to be statistically insignificant at all levels of significance without validating Hypothesis 6,allowing us to underline that greenhouse gases (GHGs) do not have an impact on the CCPI score. However, it is crucial to mention, once again, that the GHG emissions variable is one of the main components of the CCPI score calculations, and the rejection of this hypothesis raises a lot of concern for further examination.
Finally, examining Hypothesis 9, in which we consider whether PM2.5 exposure can adversely affect the CCPI score, once again, it is observed that PM2.5 variables (both the PM2.5 mean annual exposure and PM2.5 % of population exposed to levels exceeding WHO guidelines) appear to be statistically insignificant, leading us not to validate Hypothesis 9. This implies that, based on the data included in our analysis, PM2.5 exposure does not influence the CCPI score and the general climate change performance of the countries included.
What is important to mention is the fact that, in order to have a better understanding and a more accurate model specification to reach a general conclusion, it would be meaningful to include more periods in our analysis and use more advance econometric methods, such as the panel data analysis, in an attempt to include time dimensions in our analysis alongside the cross-sectional analysis.

5. Conclusions

The purpose of our paper was to initially describe two of the most known climate indices, the Climate Risk Index (CRI) and the Climate Change Performance Index (CCPI) by briefly describing the meaning of the reported scores. Our aim was to examine the connection of Climate Change Performance Index and Climate Risk Index through econometric specifications and diagnostic testing. After reviewing the literature regarding climate change, global warming, greenhouse gas emissions and economic factors that may affect the extreme weather-related events and disasters, we established nine (9) under-examination hypotheses and we used freely available data, both economic and environmental, in order to conclude whether the assumptions can be scientifically proved.
Based on our analysis and findings, we concluded that there is no proven relationship between Climate Change Performance Index and Climate Risk Index for the period analyzed. However, it would be useful to examine, in further research, a greater time span and with the use of dynamic panel data to take into consideration both dimensions (time and country). Regarding the economic aspects that may affect the indices, we investigated the effect of economic growth on both the CCPI and CRI. As has already been described, the hypothesis regarding economic growth and CCPI was not validated, showing that there is no significant effect of economic growth to the Climate Change Performance Index of 2019, which is in great contrast with many researcher outcomes (Mikhaylov et al. 2020; Zheng et al. 2019; Cloy 2018; Chang and Hu 2019; Zakarya et al. 2015; Chang et al. 2018; de Castro Camioto et al. 2016; Tu et al. 2016; Chen et al. 2015; Belke et al. 2011; Niu et al. 2011; Manish et al. 2006). Contrary to this result, the hypothesis regarding economic growth and the CRI was validated, indicating that there is a statistically significant positive relationship between economic growth and the CRI. We should underline once more that, the lower the CRI score, the greater the risk a country is facing; thus, an increase in the economic growth leads to an increase of the CRI score and minimizes the extreme weather-related risks a country is facing.
Similarly, the hypotheses regarding population density and its impact on the CCPI and CRI were validated in both cases, proving that there is a statistically significant connection between the population density of a region and the risk it faces, as well as its performance regarding energy use and emissions. What is an interesting finding is the one related to Hypotheses 6 and 7 regarding the greenhouse gas (GHG) emissions. Although it is clearly stated in the CCPI report that one of the four components of the index is the greenhouse gas emissions, this variable appears to be statistically insignificant in Model 2 of our analysis, meaning that it is not proven to affect the CCPI, contrary to the statement of Mikhaylov et al. (2020). On the other hand, greenhouse gases (GHGs) are statistically significant in Model 1; thus, there is a significant connection between greenhouse gases (GHGs) and the CRI. We propose that this finding, regarding the not-proven relationship between greenhouse gases (GHGs) and the CCPI, needs further research including a greater time span so as to take into consideration the cumulative nature of the environment.
Moving forward, the hypothesis testing the relationship of use of renewable energy and the CCPI is validated, as was expected, since renewable energy is another component of the index. Contrary to the greenhouse gases (GHGs), the case of renewable energy was proven to be significant, following the suggestions of a great number of researchers (Halkos and Zisiadou 2023; Bruhwiler et al. 2021; Mikhaylov et al. 2020; Lisin 2020; Li 2017; Huang et al. 2016; Levin 2012; Pao and Tsai 2010; Tsai 2010; Elum and Momodu 2017; Albergel et al. 2010; Allen et al. 2009; Gregory et al. 2009; Matthews et al. 2009), giving us the hope that the scores of the index will be improved if we change the way we produce the energy we demand. As is obvious, the indices examined in this paper are connected to the Sustainable Development Goals (SDGs) introduced by the United Nations. More specifically, four SDGs could be attached to this analysis including Goal 7 “Affordable and Clean Energy”, possibly referring to renewable energy sources, and Goal 11 “Sustainable cities and communities”, which aims to reduce greenhouse gas emissions. Moreover, Goal 12 “Responsible consumption and production” could be correlated to both the overconsumption and production of energy over the latest years, as well as Goal 13 “Climate action”, a goal that should be taken into consideration for a fruitful and prosperous future that we can bequeath to the next generations. Last but not least is the hypothesis regarding another environmental variable, PM2.5 exposure and its possible effect on the CCPI. The hypothesis is validated based on the data and the period we used in our analysis; however, we propose further research regarding environmental variables.
Regarding the limitations of the current research, as well as its possible extension, we would like to mention that, first of all, we noticed a time lag in the index reports. In other words, the latest reported indices refer to the year 2019 (three years prior to our analysis). This element introduces obstacles regarding the examination of the recent situation observed. A most immediate report of the indices could have given us the opportunity to include the existing conditions; however, we understand that the collection of the data needed for each index and the conduction of the reported scores demand significant time. Another limitation that we would like to mention is that fact that the CCPI includes only 59 countries, which of course, as we mentioned, produce the 92% of the global greenhouse gas emissions. In our opinion, it would be useful as well as interesting to have more countries, if not all, included in the index. This element would have given us a more comprehensive understanding of the global condition.
To conclude, climate change is a well-known environmental phenomenon of our era, which not only has effects on the environmental, but also on economics (production and consumption) and human health. Taking into consideration all events of the last decade, such as extreme weather-related hazards, natural hazards, technological hazards, the current pandemic and the energy crisis, we understand that there is an emergency regarding the future of the globe. Measures need to be taken in order to turn to more sustainable sources of energy, both for self-sufficiency and as an action to mitigate climate change. The reduction of greenhouse gases (GHGs) and the adaptation of eco-friendly and sustainable techniques of energy production may eventually help the globe tackle the threats of climate change and bequeath a more prosperous future to the next generations.

Author Contributions

Conceptualization, G.H. and A.Z.; methodology, G.H. and A.Z.; software, G.H. and A.Z.; validation, G.H. and A.Z.; formal analysis, G.H. and A.Z.; investigation, G.H. and A.Z.; resources, G.H. and A.Z.; data curation, G.H. and A.Z.; writing—original draft presentation, G.H. and A.Z.; writing—review and editing, G.H. and A.Z.; visualization, G.H. and A.Z.; supervision, G.H., project administration, G.H., funding acquisition, G.H. All authors have read and agreed to the published version of the manuscript.

Funding

The research received no external funding.

Data Availability Statement

Data available on: CRI data retrieved by Global Climate Risk Index Report: https://reliefweb.int/report/world/global-climate-risk-index-2021 (accessed on 12 November 2022). CCPI data retrieved by Climate Change Performance Index Report: https://ccpi.org (accessed on 12 November 2022). World Bank Database: https://databank.worldbank.org/reports.aspx?source=2&series=NY.GDP.PCAP.CD&country= (accessed on 15 November 2022).

Conflicts of Interest

The authors declare no conflict of interest.

Appendix A

Table A1. Climate Risk Index Model Estimations and Diagnostics.7
Explanatory VariablesMODEL 1aMODEL 1b
Constant −172.419
(−0.8158)
[0.4206]
CCPI 20190.790548
(1.547723)
[0.1315]
GDP per capita0.000101
(0.521093)
[0.6059]
GDP growth5.150745
(2.223919)
[0.0333]
7.246164
(3.924154)
[0.0003]
Population Density−0.05403
(−2.59398)
[0.0142]
−0.02696
(−1.9467)
[0.0572]
Population Growth7.681571
(1.23921)
[0.2243]
Greenhouse Gases (kt)−4.68 × 10⁻⁶
(−2.15511)
[0.0388]
−6.44 × 10⁻⁶
(−3.56221)
[0.0008]
PM2.5 Mean Annual Exposure−0.21807
(−0.76672)
[0.4489]
PM2.5 % population exposed to levels
exceeding WHO guideline
0.047364
(0.278458)
[0.7825]
Renewable Energy Consumption−0.38238
(−0.88729)
[0.3815]
Access to Electricity2.099157
(1.013409)
[0.3185]
0.618877
(11.29171)
[0.0000]
Poverty Ratio−0.37217
(−0.74004)
[0.4647]
R2 Adjusted0.2355060.307223
Akaike Information Criterion9.3399819.17019
Schwarz Criterion9.8265789.317522
White test6.521023
[0.8364]
0.474757
[0.9759]
B–P–G test6.202796
[0.8595]
0.65843
[0.9564]
Harvey test0.698917
[0.7300]
0.684987
[0.6058]
Glejser test6.987718
[0.8001]
1.840904
[0.7650]
ARCH (LM) test1.827094
[0.1765]
0.024335
[0.8760]
Ramsey RESET test0.000126
[0.9911]
3.533802
[0.6661]
VIFNoneNone
Table A2. Climate Change Performance Index Model Estimations and Diagnostics.8
Explanatory VariablesMODEL 2aMODEL 2b
Constant −4.82342
(−0.06767)
[0.9465]
CRI 20198.81 × 10−2
(1.547723)
[0.1315]
GDP per capita4.08 × 10−5
(0.634641)
[0.5302]
GDP growth−0.82773
(−1.01218)
[0.3190]
Population Density0.018654
(2.702526)
[0.0109]
0.013127
(2.792242)
[0.0080]
Population Growth−2.16 × 100
(−1.03791)
[0.3071]
Greenhouse Gases (kt)1.19 × 10⁻⁷
(0.152974)
[0.8794]
PM2.5 Mean Annual Exposure0.102454
(1.088949)
[0.2843]
PM2.5 % population exposed to
levels exceeding WHO guideline
0.028289
(0.499542)
[0.6208]
Renewable Energy Consumption0.444271
(3.623036)
[0.001]
0.441216
(5.200124)
[0.0000]
Access to Electricity0.352995
(0.504493)
[0.6174]
0.402132
(13.91733)
[0.0000]
Poverty Ratio0.221154
(1.342491)
[0.1889]
0.209132
(1.866772)
[0.0693]
R2 adjusted0.3809030.421804
Akaike Information Criterion7.1456856.936843
Schwarz Criterion7.6322827.099042
White test4.356389
[0.9583]
1.362016
[0.8508]
B–P–G test7.064146
[0.7939]
2.056374
[0.7254]
Harvey test1.385019
[0.2273]
0.627164
[0.6460]
Glejser test9.398123
[0.5852]
2.542984
[0.6370]
ARCH (LM) test0.000883
[0.9763]
0.002315
[0.9616]
Ramsey RESET test0.211436
[0.6489]
0.000512
[0.9821]
VIFNoneNone

Appendix B

Figure A1. Comparison of CRI 2019 and Average CRI 2000–2019. Conducted by the authors.
Jrfm 16 00264 g0a1
Figure A2. Comparison between CCPI 2019 and CCPI 2022. Conducted by the authors.
Jrfm 16 00264 g0a2

Notes

1
CRI Data retrieved by Global Climate Risk Index Report: https://reliefweb.int/report/world/global-climate-risk-index-2021 (accessed on 12 November 2022).
2
CCPI Data retrieved by Climate Change Performance Index Report: https://ccpi.org (accessed on 12 November 2022).
3
4
See note 3 above.
5
R routine available on request.
6
See note 3 above.
7
We are familiar that the pairs of variables we have included in the model specification (GDP/capita and GDP growth, population density and population growth, PM2.5 Mean annual exposure and PM2.5 % of population exposed to levels exceeding WHO guideline) appear to be relevant, however, their contribution differs and their correlation coefficients, in all three cases, are low. More specifically, the correation coefficient of GDP/capita and GDP growth equals to −0.092344, the correlation coefficient of population density and population growth equals to +0.397079 and the correlation coefficient of PM2.5 Mean annual exposure and PM2.5 % of population exposed to levels exceeding WHO guideline equals to +0.425152.
8
Please see note 7.

References

  1. Albergel, Clement, Jean Christophe Calvet, Anne Laure Gibelin, Sebastien Lafont, Jean Louis Roujean, and Cecile Berne. 2010. Observed and modelled ecosystem respiration and gross primary production of a grassland in southwestern France. Biogeosciences 7: 1657–68. [Google Scholar] [CrossRef]
  2. Allen, Matthew R., Dave J. Frame, Chris Huntingford, Curtis Dinneen Jones, Jason A. Lowe, Malte Meinshausen, and Nicolai Meinshausen. 2009. Warming caused by cumulative carbon emissions towards the trillionth tonne. Nature 458: 1163–66. [Google Scholar] [CrossRef] [PubMed]
  3. Belke, Ansgar, Frauke Dobnik, and Christian Dreger. 2011. Energy consumption and economic growth: New insights into the cointegration relationship. Energy Economics 33: 782–89. [Google Scholar] [CrossRef]
  4. Bruhwiler, Lori, Sourish Basu, James H. Butler, Abhishek Chatterjee, Ed Dlugokencky, Melissa A. Kenney, Allison McComiskey, Stephen A. Montzka, and Diane Stanitski. 2021. Observations of greenhouse gases as climate indicators. Climatic Change 165: 12. [Google Scholar] [CrossRef]
  5. Burck, Jan, Thea Uhlich, Christoph Bals, Niklas Höhne, and Leonardo Nascimento. 2022. Climate Change Performance Index Results: Monitoring Climate Mitigation Efforts of 59 Countries plus the EU—Covering 92% of the Global Greenhouse Gas Emissions, Germanwatch. Available online: https://img.saurenergy.com/2022/11/ccpi-2023-results-3.pdf (accessed on 12 November 2022).
  6. Chang, Ming Chung, and Jin Li Hu. 2019. A long-term meta-frontier analysis of energy and emission efficiencies between G7 and BRICS. Energy Efficiency 12: 879–93. [Google Scholar] [CrossRef]
  7. Chang, Ming Chung, Jin Li Hu, and Heng Chu Chang. 2018. Resource efficiency and productivity changes in the G7 and BRICS nations. Polish Journal of Environmental Studies 27: 2463–74. [Google Scholar] [CrossRef]
  8. Chapman, Lee. 2007. Transport and climate change: A review. Journal of Transport Geography 15: 354–67. [Google Scholar] [CrossRef]
  9. Chen, Zhi, Guirui Yu, Xainjin Zhu, Qiufeng Wang, Shuli Niu, and Zhongmin Hu. 2015. Covariation between gross primary production and ecosystem respiration across space and the underlying mechanisms: A global synthesis. Agricultural and Forest Meteorology 203: 180–90. [Google Scholar] [CrossRef]
  10. Cloy, Joanna M. 2018. Greenhouse gas sources and sinks. Encyclopedia of the Anthropocene 2: 391–400. [Google Scholar]
  11. de Castro Camioto, Flavia, Herick Fernando Moralles, Enzo Barberio Mariano, and Daisy Aparesida do Nascimento Rebelatto. 2016. Energy efficiency analysis of G7 and BRICS considering total-factor structure. Journal of Cleaner Production 122: 67–77. [Google Scholar]
  12. Eckstein, David, Vera Künzel, Laura Schäfer, and Maik Winges. 2021. Global Climate Risk Index 2021 Who Suffers Most from Extreme Weather Events? Weather-Related Loss Events in 2019 and 2000–2019, Germanwatch. Available online: https://reliefweb.int/report/world/global-climate-risk-index-2021 (accessed on 12 November 2022).
  13. Elum, Zelda Anne, and Abiodun Suleiman Momodu. 2017. Climate change mitigation and renewable energy for sustainable development in Nigeria: A discourse approach. Renewable and Sustainable Energy Reviews 76: 72–80. [Google Scholar] [CrossRef]
  14. Gregory, Jonathan M., Curtis Dinneen Jones, Patricia Cadule, and Pierre Friedlingstein. 2009. Quantifying carbon cycle feedbacks. The Journal of Climate 22: 5232–50. [Google Scholar] [CrossRef]
  15. Halkos, George, and Argyro Zisiadou. 2019. Examining the natural environmental hazards over the last century. Economics of Disasters and Climate Change 3: 119–50. [Google Scholar] [CrossRef]
  16. Halkos, George, and Argyro Zisiadou. 2023. Energy Crisis Risk Mitigation through Nuclear Power and RES as Alternative Solutions towards Self-Sufficiency. Journal of Risk and Financial Management 16: 45. [Google Scholar] [CrossRef]
  17. Huang, Shihping Keving, Lopin Kuo, and Kuei Lan Chou. 2016. The applicability of marginal abatement cost approach: A comprehensive review. Journal of Cleaner Production 127: 59–71. [Google Scholar] [CrossRef]
  18. Karl, Thomas R., and Kevin E. Trenberth. 2003. Modern global climate change. Science 302: 1719–23. [Google Scholar] [CrossRef]
  19. Karvonen, Anssi, Paivi Rintamäki, Jukka Jokela, and E. Tellervo Valtonen. 2010. Increasing water temperature and disease risks in aquatic systems: Climate change increases the risk of some, but not all, diseases. International Journal for Parasitology 40: 1483–88. [Google Scholar] [CrossRef] [PubMed]
  20. Kron, Wolfgang, Petra Löw, and Zbigniew W. Kundzewicz. 2019. Changes in risk of extreme weather events in Europe. Environmental Science & Policy 100: 74–83. [Google Scholar]
  21. Levin, Ingeborg. 2012. Earth science: The balance of the carbon budget. Nature 488: 35–36. [Google Scholar] [CrossRef]
  22. Li, Hai Yang. 2017. On China’s carbon emission reduction after the Paris Climate Conference. Modern Business 11: 163–64. [Google Scholar]
  23. Lisin, Anton. 2020. Biofuel Energy in the Post-oil Era. International Journal of Energy Economics and Policy 10: 194–99. [Google Scholar] [CrossRef]
  24. Lopatin, Evgeniy. 2019. Assessment of Russian banking system performance and sustainability. Banks and Bank Systems 14: 202–11. [Google Scholar] [CrossRef]
  25. Manish, Shaurya, Indu R. Pillai, and Rangan Banerjee. 2006. Sustainability analysis of renewables for climate change mitigation. Energy for Sustainable Development 10: 25–36. [Google Scholar] [CrossRef]
  26. Matthews, H. Damon, Nathan P. Gillett, Peter A. Stott, and Kirsten Zickfeld. 2009. The proportionality of global warming to cumulative carbon emissions. Nature 459: 829–32. [Google Scholar] [CrossRef]
  27. Meynkhard, Artur. 2019. Fair market value of bitcoin: Halving effect. Investment Management and Financial Innovations 16: 72–85. [Google Scholar] [CrossRef]
  28. Meynkhard, Artur. 2020. Priorities of Russian Energy Policy in Russian-Chinese Relations. International Journal of Energy Economics and Policy 10: 65–71. [Google Scholar] [CrossRef]
  29. Mikhaylov, Alexey, Nikita Moiseev, Kirill Aleshin, and Thomas Burkhardt. 2020. Global climate change and greenhouse effect. Entrepreneurship and Sustainability Issues 7: 2897. [Google Scholar] [CrossRef] [PubMed]
  30. Mirza, M. Monirul Qader. 2003. Climate change and extreme weather events: Can developing countries adapt? Climate Policy 3: 233–48. [Google Scholar] [CrossRef]
  31. Neves, Anna Rita, and Vitor Leal. 2010. Energy sustainability indicators for local energy planning: Review of current practices and derivation of a new framework. Renewable and Sustainable Energy Reviews 14: 2723–35. [Google Scholar] [CrossRef]
  32. Niu, Shuwen, Yongxia Ding, Yunzhu Niu, Yixin Li, and Guanghua Luo. 2011. Economic growth, energy conservation and emissions reduction: A comparative analysis based on panel data for 8 Asian-Pacific countries. Energy Policy 39: 2121–31. [Google Scholar] [CrossRef]
  33. Pao, Hsiao Tien, and Chung Ming Tsai. 2010. CO2 emissions, energy consumption and economic growth in BRIC countries. Energy Policy 38: 7850–60. [Google Scholar] [CrossRef]
  34. Ramanathan, Veerabhadran, and Yan Feng. 2009. Air pollution, greenhouse gases and climate change: Global and regional perspectives. Atmospheric Environment 43: 37–50. [Google Scholar] [CrossRef]
  35. Shalini, Sathyanarayanan, Kandasamy Palanivelu, Anup Ramachandran, and Vijaya Raghavan. 2021. Biochar from biomass waste as a renewable carbon material for climate change mitigation in reducing greenhouse gas emissions—A review. Biomass Conversion and Biorefinery 11: 2247–67. [Google Scholar] [CrossRef]
  36. Stott, Peter A., Simon F. B. Tett, Gareth S. Jones, Matthew R. Allen, John F. B. Mitchell, and Gary J. Jenkins. 2000. External control of 20th century temperature by natural and anthropogenic forcings. Science 290: 2133–36. [Google Scholar] [CrossRef]
  37. Tsai, Wen Tien. 2010. Energy sustainability from analysis of sustainable development indicators: A case study in Taiwan. Renewable and Sustainable Energy Reviews 14: 2131–38. [Google Scholar] [CrossRef]
  38. Tu, Chia Jung, Ming Chung Chang, and Chiang Ping Chen. 2016. Progressive time-weighted dynamic energy efficiency, energy decoupling rate, and decarbonization: An empirical study on G7 and BRICS. Sustainability 8: 928. [Google Scholar] [CrossRef]
  39. Vieira, Leticia Canal, Mariolina Longo, and Matteo Mura. 2022. From carbon dependence to renewables: The European oil majors’ strategies to face climate change. Business Strategy and the Environment, 1–12. [Google Scholar]
  40. Walther, Gian Reto, Eric Post, Peter Convey, Annette Menzel, Camille Parmesan, Trevor J. C. Beebee, Jean Marc Fromentin, Ove Hoegh-Guldberg, and Franz Bairlein. 2002. Ecological responses to recent climate change. Nature 416: 389–95. [Google Scholar] [CrossRef]
  41. Zakarya, Ghouali Yassine, Belmokaddem Mostefa, Sahraoui Mohammed Abbes, and Guellil Mohammed Seghir. 2015. Factors affecting CO2 emissions in the BRICS countries: A panel data analysis. Procedia Economics and Finance 26: 114–25. [Google Scholar] [CrossRef]
  42. Zheng, Xiaosong, Dalia Streimikiene, Tomas Balezentis, Abbas Mardani, Fausto Cavallaro, and Huchang Liao. 2019. A review of greenhouse gas emission profiles, dynamics, and climate change mitigation efforts across the key climate change players. Journal of Cleaner Production 234: 1113–33. [Google Scholar] [CrossRef]
Figure 1. Carbon Dioxide Emissions (CO2)—Year 2019. Conducted by the authors.
Jrfm 16 00264 g001
Figure 2. Methane Emissions (CH4- kt CO2 equivalent)—Year 2019. Conducted by the authors.
Jrfm 16 00264 g002
Figure 3. Nitrous Oxide Emissions (N2O- kt CO2 equivalent)—Year 2019. Conducted by the authors.
Jrfm 16 00264 g003
Figure 4. Sea Surface Temperature Anomaly (1992–2022). Conducted by the authors.
Jrfm 16 00264 g004
Table 1. Granger Causality Test.
Pairwise Granger Causality Tests
Null Hypothesis:nF-StatisticProb.
CCPI 2019 does not Granger Cause CRI 2019530.207850.6504
CRI 2019 does not Granger Cause CCPI 20190.729130.3972
Disclaimer/Publisher’s Note: The statements, opinions and data contained in all publications are solely those of the individual author(s) and contributor(s) and not of MDPI and/or the editor(s). MDPI and/or the editor(s) disclaim responsibility for any injury to people or property resulting from any ideas, methods, instructions or products referred to in the content.

