Article

Impact of Financial Inclusion on India’s Economic Development under the Moderating Effect of Internet Subscribers

1
Symbiosis Institute of Business Management, Symbiosis International (Deemed University), Pune 412115, India
2
GL Bajaj Institute of Technology and Management, Greater Noida 201306, India
3
Symbiosis School of Banking and Finance, Symbiosis International (Deemed University), Pune 412115, India
*
Author to whom correspondence should be addressed.
J. Risk Financial Manag. 2023, 16(5), 262; https://doi.org/10.3390/jrfm16050262
Submission received: 6 March 2023 / Revised: 17 April 2023 / Accepted: 28 April 2023 / Published: 3 May 2023
(This article belongs to the Special Issue Financial Markets, Financial Volatility and Beyond (Volume II))

Abstract

:
Financial inclusion is an emerging economic growth paradigm, especially in developing economies like India. It is an essential barometer for the all-encompassing growth of a country and its economy. However, there is still a debate regarding the effect of Financial Inclusion (FI) on achieving sustainable development. This study aims to determine if FI helps achieve Sustainable Development Growth (SDG) in India and if internet subscribers significantly influence the connection between FI and SDG. Secondary data from 16 states and one UT in India have been collected for 2017–2019. Therefore, the sample data is recent and covers a large country span. The data source is NITI Aayog and PMFBY (“Pradhan Mantri Fasal Bhima Yojana”) reports. The findings of this research are that FI has a positively significant relationship with sustainable development goals (SDG) in India. However, when the internet subscribers are high, the FI’s positive association with SDG gets reduced. PMFBY and SDG have been used for the first time, along with internet subscribers as moderators. The outcome has direct policy implications for improving the nation’s financial inclusion and economic growth.

1. Introduction

Financial inclusion is a multifaceted and dynamic system that can be comprehensively described as the access and availability of the formal financial system to all sections of society. It includes members of lower socioeconomic classes and less privileged spheres of society (Rastogi and Ragabiruntha 2018). According to Aggarwal (2014), FI provides financial services at a reasonable cost to various low-income and disadvantaged segments of society. For the holistic development of an economy, we need an economic system that is inclusive so that it can lead to the uplifting of under or less-privileged members of society (Sharma and Changkakati 2022). It is considered an evaluative measurement of the growth and prosperity of a society. It is one of the fundamentals of policy-making in many developing countries, including India (Dikshit and Pandey 2021). Pandey et al. (2022) have also drawn attention to how social and financial exclusion is strongly related to economic growth.
Han and Melecky (2013) in their research, remark that FI will bring further excellent stability in terms of finance, leading to a robust economy. Globally, governments are putting greater emphasis on FI to enhance economic growth. However, developing nations can emphasize inclusivity so that poverty can be minimized and the standard of living can be increased (CGAP 2011). In the work of King and Levine (1993), FI is one of the strategies for nations’ economic growth and development. There are multiple inherent merits in FI as it efficiently allocates productive resources and hence causes a decrease in costs.
A sustainable development goal is a blueprint for achieving a more sustainable future. It addresses many concerns: for example, inequality, health, climate action, and peace. It is broadly categorized into seventeen goals adopted in 2015 and needs to be achieved by 2030 (Dikshit and Pandey 2021). Ozili (2018) states that FI has received greater attention from policy formulators and scholars as it contributes towards achieving the United Nations SDG. The first SDG emphasizes reducing poverty, arguing that if a country’s financial institutions are inclusive, the impoverished section will be better positioned to achieve its economic aspirations. It will empower and support establishing a new enterprise, increasing their children’s cognitive and non-cognitive development. The second SDG is zero hunger. It is established that financially included farmers are better positioned to invest in providing higher yields and better food security. Financially included farmers are in an excellent position to become insured and defend their assets from external shocks (Asongu and De Moor 2015; SDG 2022).
Furthermore, technological advancement in a country cannot be ignored in augmenting sustainable development. In this direction, information and communication technologies (ICT) is an enabling technology that can drive radical change to address the concerns like inequality. ICT is sometimes the only medium for marginalized groups to be brought into the mainstream for better livelihood. ICT is helping in providing services in almost all dimensions, like health, education, and finance, to improve the standard of life.
By extending financial products and services, marginalized groups need to be integrated into the mainstream to provide them with a better position. PMFBY is one of the governments of India’s initiatives in this regard. It is a crop insurance program that protects agriculture from agrarian financial losses brought on by unpredictability, such as crop failure and loss. By protecting against crop loss, maintaining farmers’ incomes, encouraging them to adopt cutting-edge agricultural practices, and ensuring the flow of agricultural credit, PMFBY aims to promote sustainable production. This situation will support the expansion of the agricultural sector, promote crop diversification, and—most importantly—protect farmers from production risk (Rai 2019).
Extensive studies exist to investigate the impact of FI on the sustainable development of the economy. However, no study has taken the dependent variable as Pradhan Mantri Fasal Bima Yojana (PMFBY). This study has also taken internet subscribers as moderators to examine the influence they exert on the relationship between FI and sustainable economic growth. These variables and moderators have remained unexplored in the existing literature. A broader spectrum of data is taken to cover most of the states in India. The quantitative analysis uses the panel data to get a comprehensive understanding, which was a limitation of earlier research (Kandpal 2020; Pandey et al. 2022; Rastogi et al. 2021; Rastogi and Ragabiruntha 2018; Soumen and Sujit 2021).
Owing to the increasing importance of technological advancements in financial services delivery and sustainable growth, this study aims to determine if FI helps achieve sustainable development growth in India and if internet subscribers significantly influence the connection between FI and SDG. Our analysis considers Pradhan Mantri Fasal Bima Yojana as a proxy for FI to measure sustainable growth in the Indian economy. The sustainable development goal is a dependent variable. The research uses the panel data regression model technique, which reflects both cross-sectional and time attributes to deliver unbiased results. The input data for the research is acquired from multiple sources like NITI Aayog and PMFBY reports. The study period is from 2017 to 2019, and a data set is taken from 16 states and one Union territory to cover a broader spectrum to achieve common insight. The data is taken from the scheme’s launch until the pre-pandemic level to make the result robust and reliable. Empirical analysis has been completed to arrive at the result. The novelty of this research paper lies in its focus on the variables such as Pradhan Mantri Fasal Bima Yojana (PMFBY) and SDG to study economic growth through FI and considering internet subscribers as a moderator. The internet subscriber as moderator is not used in the existing literature in such studies. From the above discussion, we believe the current study contributes to the literature by providing novel evidence on the connection between FI, SDG, and digitalization.
The empirical finding of this research work has practical implications for the policy decisions of the legislators. Understanding the construct is crucial to advance financial inclusiveness, spreading uses of internet subscribers, and attainment of SDG, especially in India and emerging economies. It will help design inclusive financial services for a particular segment of users. We need more government initiatives to bring a broader population segment into the financial system. Penetration of financial products to the last mile will go a long way towards sustainable development of the economy.
The article’s remaining sections are organized as follows. Section 2 reviews the literature on FI and how it relates to goals for sustainable development. Section 3 describes the data, source, and research methodology adopted in the research. Section 4 presents the results derived from the research, analysis, and its robustness. Section 5 comprises a comprehensive discussion of the research findings and related works. Finally, Section 6 concludes the study along with limitations and future scope.

2. Review of Literature

Han and Melecky (2013) have defined FI as the individual and business in society having access to beneficial and affordable financial services and products. They meet the needs of transactions, payments, savings, credit, and insurance responsibly and sustainably. FI is the measure of a segment that uses financial services, or they have a bank account. It considers access and use of essential financial services at affordable rates and transparency (Boateng 2017; Rastogi et al. 2021). Financial exclusion directly leads to poverty, while FI supports a nation in its path of progress. It ensures convenient access of ordinary people to financial resources.

2.1. Financial Inclusion in India

FI now has a far-reaching global significance, particularly in emerging nations. By integrating more people into the formal financial system, emerging economies hope to increase economic growth and reduce poverty. FI has been developed as a new theory of poverty-eradicating economic growth. According to Alam Iqbal and Sami’s (2017) research, India’s economic crisis has long been caused by a lack of appropriate, inexpensive, and readily available financial services. An efficient, inclusive financial system is required to flourish and grow the nation’s economy. India must travel a long distance to achieve success in FI. Agarwal and Panda (2018) elaborate that the degree of FI varies between Indian states. When compared to high-income states, low-income states have lower FI. On a broad scale, it can be said that over time, different Indian states have experienced an increase in the degree of FI that promotes growth. The majority of Indian states fall under the category of medium inclusion. Hence, there is still room for development and inclusion. The work also highlights that income level is imperative to enhance FI (Raichoudhury 2020).
The Indian government has prioritized the FI initiative as the majority of the nation’s rural population is outside the purview of inclusion. The government is running many initiatives, including the Kisan Credit Card, Pradhan Mantri Mudra Yojana, Pradhan Mantri Jan Dhan Yojana, and Pradhan Mantri Fasal Bima Yojana (Soumen and Sujit 2021). Sujlana and Kiran’s 2018 analysis states that FI is in the progressive stage in India, but still, some efforts are in the nascent stage.

2.2. Government Policy for Financial Inclusion—PMFBY

Agriculture is a major occupation in India: it is the leading employment provider for the agrarian population. It also provides a significant contribution to the national gross domestic product. A considerable population relies on agriculture for their employment. Weather fluctuations cause adverse effects on a broad spectrum of agriculture outputs. Farming in India is always discussed along with the rural distress and agriculture crisis. The farmers are in a continuous state of the existential condition of stress. This situation remains a priority topic at the national policy and public debate level. The high rate of rural suicide shows the structural deficiencies in the system. To overcome these structural shortcomings, the Indian government and private insurance companies introduced PMFBY in 2016. It provides a cushion to farmers against crop failure. In such a scenario, agriculture insurance has contributed as an effective tool to counter farmers’ risk (Singh and Agrawal 2020; Tiwari et al. 2020; Van de Meerendonk 2020).
Pradhan Mantri Fasal Bima Yojana is an approach towards FI aimed at bringing insurance of crops to the farmers. It increases the participation of financially marginalized societies to bring about economic growth. The purpose behind implementing PMFBY is to ensure security to farmers, enhance transparency, provide availability of real-time data, and authentic assessment of yield loss. Following its implementation, the PMFBY has achieved 41 % coverage of farmers (Rai 2019).

2.3. Financial Inclusion and Sustainable Growth

FI is regarded as an essential cornerstone of economic growth. It states that a significant positive relationship exists between a nation’s level of inclusion and its growth rate and human development (Kim et al. 2017). Van et al. (2021) provide international evidence and advocate that FI improves economic growth. Similarly, Sethi and Acharya (2018) find a positive effect of FI on economic growth at the cross-country level. India needs to provide banking services in rural areas to spur economic development. The nation’s financial divide can be bridged with the use of technology. India’s government, Reserve Bank, and citizens may work together to increase FI to a higher degree (Sujlana and Kiran 2018). Singh and Ghosh (2021) also provide evidence of FI’s positive impact on India’s economic growth.
Sharma and Changkakati (2022) highlighted the relationship between FI and SDG based on three dimensions access, usage, and quality. According to the study, accomplishing SDGs is significantly impacted by all three FI dimensions. Although FI is crucial, it serves as a means—not an end—to numerous microeconomic objectives. According to the study’s findings, an inclusive financial system is necessary for the development and growth of the impoverished. In order to profit from an inclusive approach, financial products and services must be accessible, usable, and of high quality.

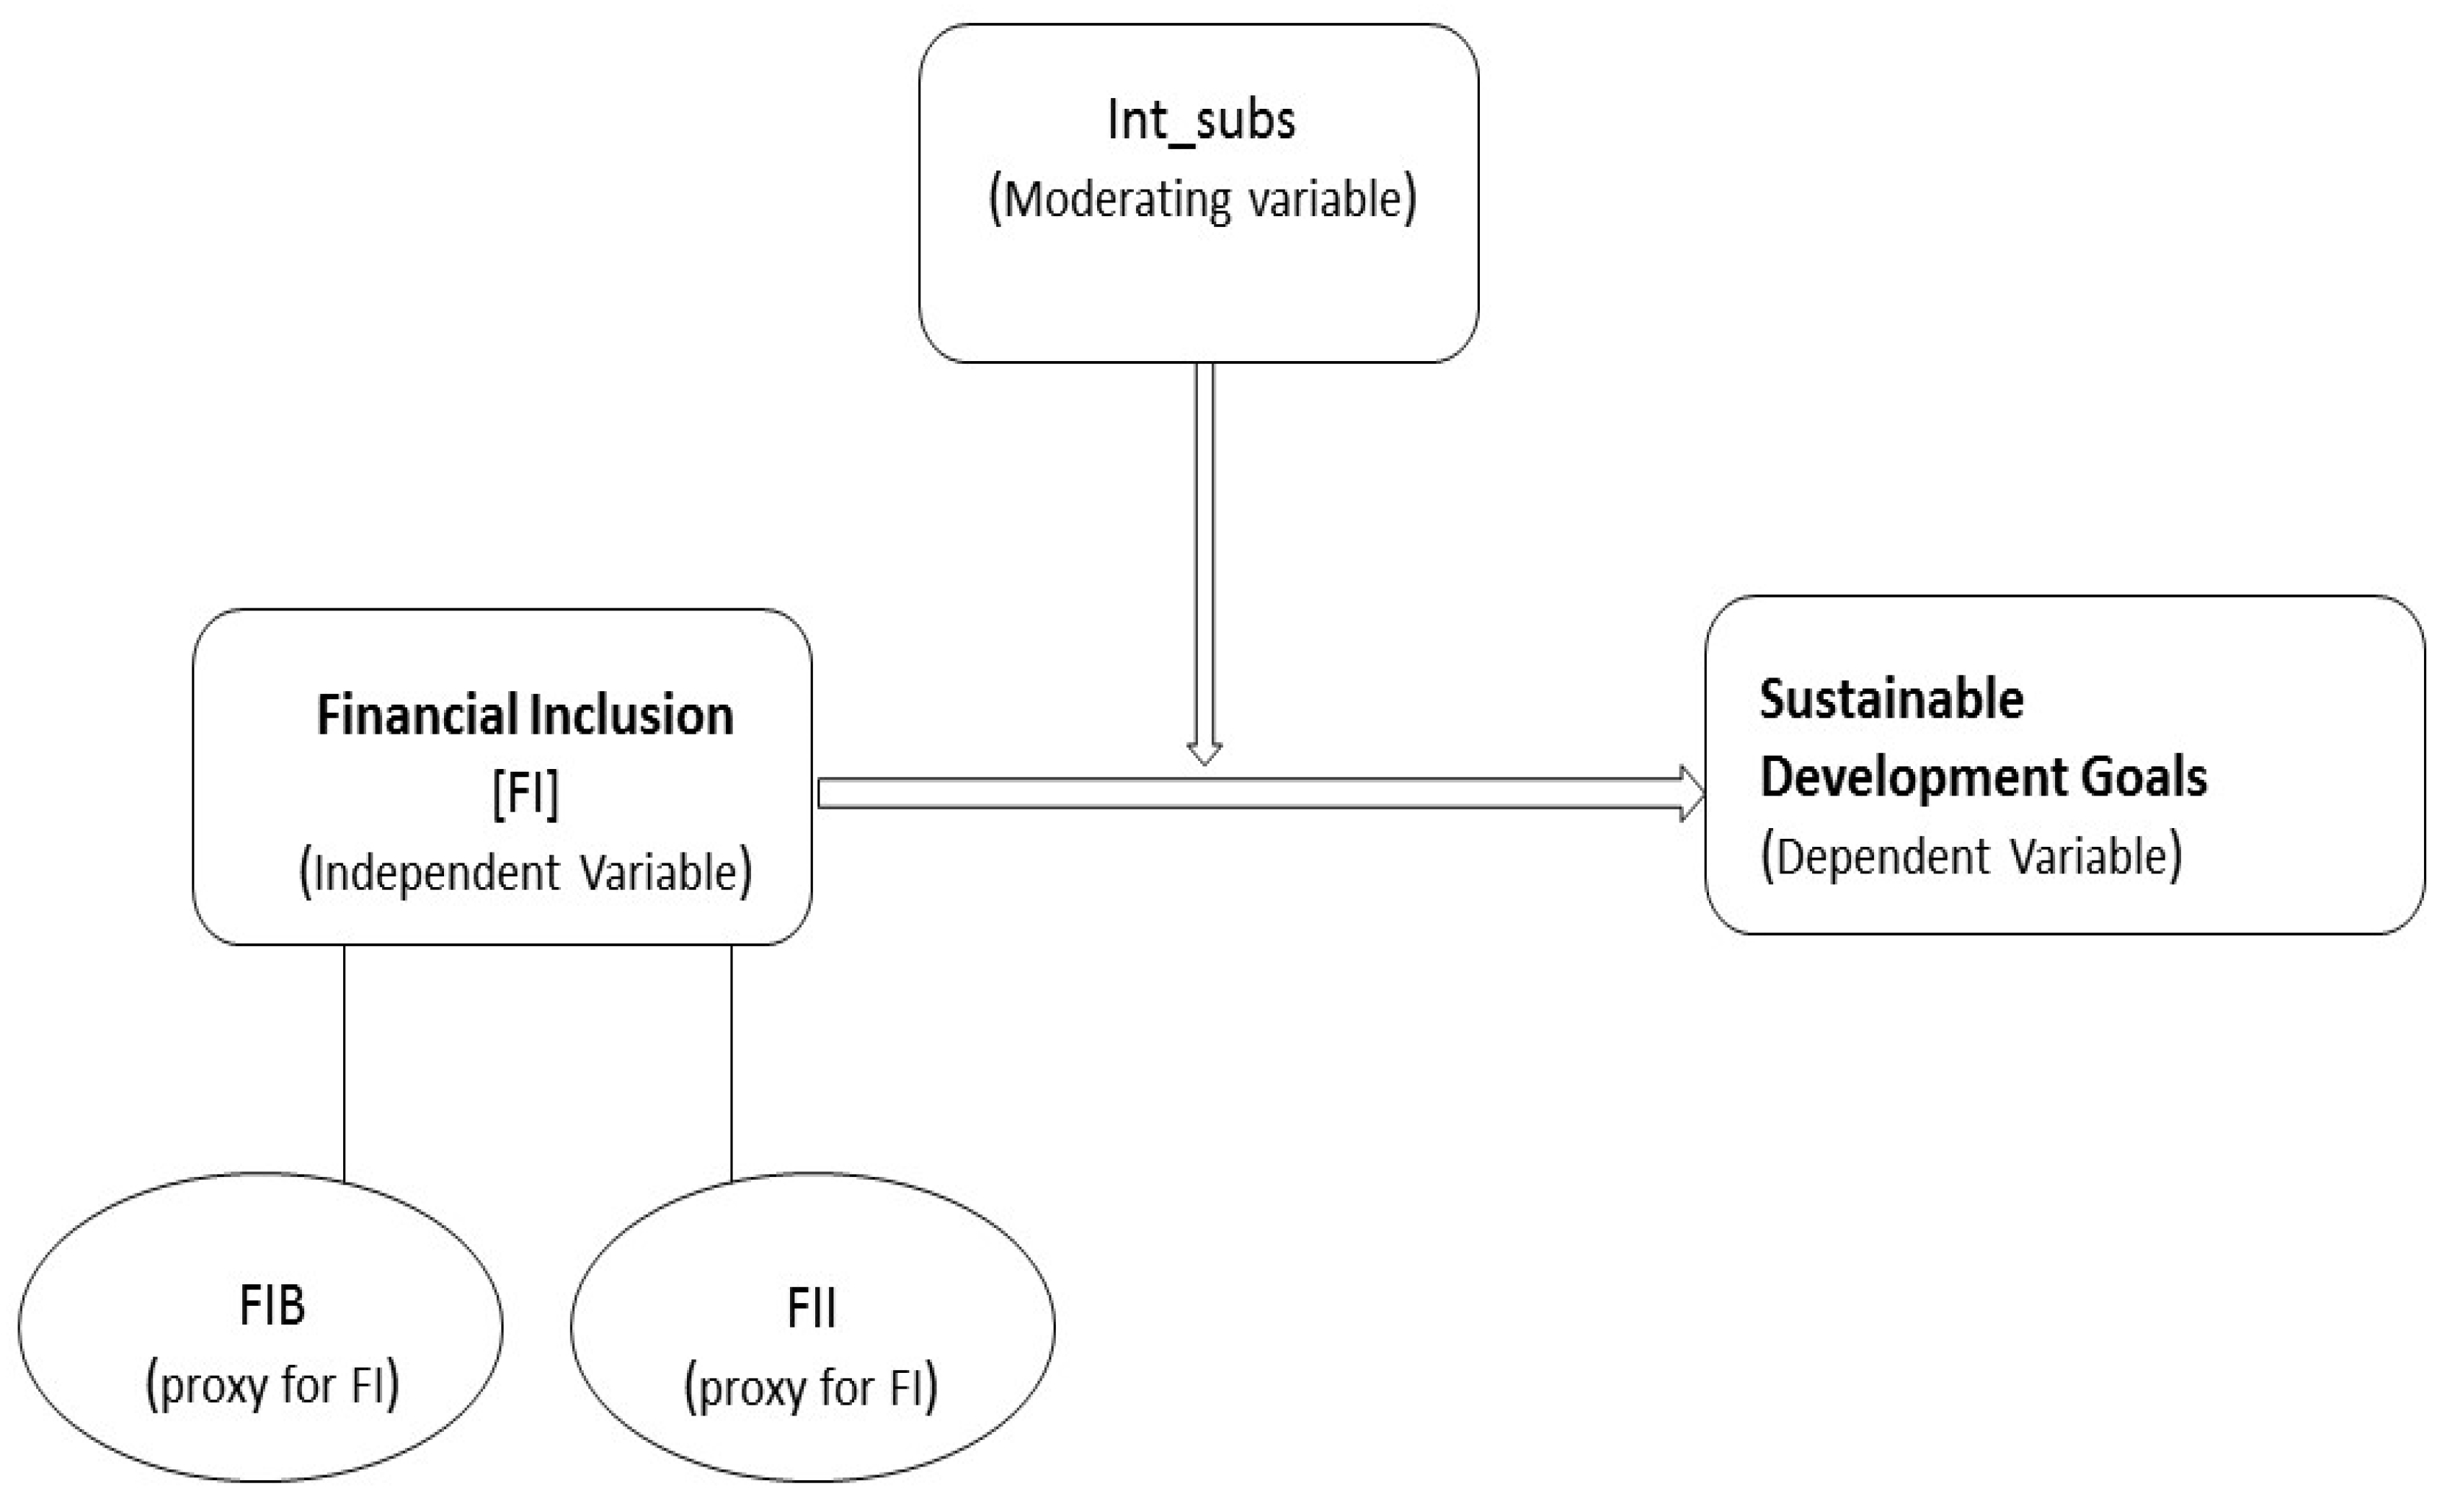
2.4. Theoretical Framework and Hypotheses Development

2.4.1. FI’s Impact on Sustainable Growth

The financial system’s policy has changed in the last few years. Financial inclusion has become the focus rather than financial development (Park and Mercado 2015). Due to this reality, several empirical studies on the impact of financial inclusion on economic growth have been extensively explored. The developed economy has received the more significant share of empirical research, leaving developing economies with sparse literature in this area. Financial inclusion in developing economies is still in its infancy (Park and Mercado 2015; Johnson and Arnold 2012; Gautam et al. 2022). Due to conflicting findings in the research, it is still debatable whether financial inclusion has a positive effect on fostering economic growth. Most individual and cross-sectional empirical investigations confirm a beneficial effect, but a few studies refute this assertion.
Empirical research on financial inclusion has not received much attention, even though policymakers in various countries prioritize the impact of financial inclusion on the development of the economy. Thus, there have not been many studies in this area. However, some studies that have been looked at suggested that financial inclusion has a beneficial impact on the economy’s ability to grow, indicating that it is an engine for doing so. For instance, Andrianaivo and Kpodar (2012), Inoue and Hamori (2016), Rasheed et al. (2016), Kim (2016), Kim et al. (2017), and Pradhan et al. (2014) advocate that FI is beneficial for economic growth. Their findings indicate that financial inclusion is essential for developing a sound and organized financial system, which accelerates economic growth.
Many empirical pieces of research support that financial inclusion is favorable for accelerating economic growth, yet this assumption may not always hold. It is said that there are barriers to ensuring a meaningful impact of finance on growth, including a weak financial system, unsuitable policies, and subpar financial instruments. According to Barajas et al. (2012), there is not always a direct correlation between financial inclusion and systemic economic growth. In this regard, a small number of studies have validated the link’s harmful effects rather than its beneficial ones. For instance, Pearce (2011) suggested that production and efficiency have increased significantly. However, the financial system is incapable of reaching most of the population, including the poor, women, and other disadvantaged groups. Despite contrasting opinions on FI and the economic growth nexus, most support the positive connection between FI and economic growth. Thus, we assume the following hypothesis:
Hypothesis H1.
Financial Inclusion in India improves Sustainable development goals.

2.4.2. Internet Subscribers and FI

Studies examining the mediating impact of financial inclusions on growth have not been thoroughly examined. However, the few studies that were conducted showed that some mediating terms, such as cell phone penetration and gender dimension financial inclusions’ development promoting routes, do exist. For instance, Andrianaivo and Kpodar (2012) found that the mediating term between financial inclusion and mobile penetration is significantly and positively correlated with the pace of economic growth (Andrianaivo and Kpodar 2012; Gautam et al. 2022). Swamy (2014) provided the same conclusion regarding the impact of gender on growth rate. These two findings significantly influenced the growth effect through these routes.
Mobile banking services are rising in India as customers download and use mobile banking apps. Internet connectivity is crucial to accessing mobile banking services. Multiple internet-based services, like transfer of funds, card payments, EMI payments, service requests, balance inquiries, complaint registration, insurance policy, and many more services, can be accessed. It is found that digitally active customers tend to hold more extensive product holdings (D’Souza 2018).
The impact of information and communication technology adoption on FI is covered in numerous research studies. However, the effects of internet subscribers on the link between FI and the SDG have not received enough attention in the research. The conceptual model in Figure 1 presents the research design of the present study with the following hypotheses framed for investigation.
Hypothesis H2.
Internet subscribers significantly influence the connection between Financial Inclusion and Sustainable Development Goals.

3. Data and Research Methodology

3.1. Data

This paper uses three years (2017–2019 including both) data from 16 states and one UT in India. The study’s motive for data procurement is to involve most regions in India to have common insight for the whole country. Hence, the sample data covers a large country span as per the availability of recent and authentic data. A recent timespan is taken due to several policy reforms in recent times by the current government and to have sufficient observations for a reliable analysis. The data is procured from several sources, including NITI Aayog and PMFBY (“Pradhan Mantri Fasal Bhima Yojana”) report. Detail on the variables is noted in Table 1.

3.2. Methodology

The panel data regression models (PDRMs) are adopted to do data analysis for hypothesis testing as of their benefits described by Baltagi and Baltagi (2008) and Hsiao (2007). The panel has a cross-section of 16 states and one UT with a three-year timespan (2017–2019). Hence, the PDRMs are good fit models for the purpose. It has the advantage of reflecting both cross-sectional and time attributes to deliver unbiased results (Baltagi and Baltagi 2008; Hsiao 2007; Gautam et al. 2022). Moreover, the endogeneity issues in such models are significantly less, and biasedness through reverse causality does not exist (Baltagi and Baltagi 2008; Hsiao 2007; Gautam et al. 2022). Dynamic PDRMs are widely used in economic growth studies (Piper 2014). The dynamic PDRMs are found to be suitable for the current study. The dynamic PDRMs are also beneficial for observing contemporaneous and long-term insights by extracting the lag effects of the dependent variable (Baltagi and Baltagi 2008; Kyereboah-Coleman 2008). In India, there might be heteroscedasticity and autocorrelation between and within individuals or regions (16 states and one UT). Thus, this study applies the dynamic (Generalized Method of Moments [GMM]). The dynamic (GMM) models are also a better choice as they can better deal with endogeneity problems, if any. Four models are developed based on the following specifications:
SDG_Indit = β0SDG_Indit(−1) + β1lnFIBit + β2lnAr_Insit + β3lnGr_Prit + uit
SDG_Indit = β0SDG_Indit(−1) + β1lnFIIit + β2lnAr_Insit + β3lnGr_Prit + uit
SDG_Indit = β0SDG_Indit(−1) + β1lnFIBit + β2lnInt_subsit + β3i_lnFIB_lnInt_subsit + β4lnAr_Insit + β5lnGr_Prit + uit
SDG_Indit = β0SDG_Indit(−1) + β1lnFIIit + β2lnInt_subsit + β3i_lnFII_lnInt_subsit + β4lnAr_Insit + β5lnGr_Prit + uit
The dependent variable is SDG_Ind for sustainable growth. ‘lnFIB’ and ‘lnFII’ are the two proxies of FI and are taken as base explanatory variables in base models (Models 1 and 2). SDG_Indit(−1) is the lag 1 value of the dependent variable ‘SDG’. ‘lnInt_subs’ is the independent variable as moderator. ‘i_lnFIB_lnInt_subs’ (=lnFIBXlnInt_subs) and ‘i_lnFII_lnInt_subs’ (=lnFIIXlnInt_subs) are the two interaction terms respectively in Model 3 and 4. ‘lnInt_subs’, ‘lnFIB’, and ‘lnFII’ are the components of interaction model, where ‘lnInt_subs’ is the moderator representing internet subscribers (digitalization) and ‘lnFIB’ and ‘lnFII’ are the main explanatory variables representing FI. Prefix ‘ln’ in these variables indicates the natural log values of the variable. The log transformation is used to have an appropriate fit model (Baltagi and Baltagi 2008). The variables ‘lnAr_Ins’ and ‘lnGr_Pr’ are restricted as control variables because they might influence sustainable growth in India. Hence, control variables help in ensuring the internal validity of the main exogenous variables. ‘uit’ (uit = µit + vit) is the error term which includes regular-error (vit) and individual-effects (µit).

4. Result of the Study

4.1. Results of Descriptive Statistics and Correlation Matrix

As mentioned in Table 2, the mean of 64.05% for SDG_Ind is considerably towards Max (75). Hence, on average, SDG in India is satisfactory to an extent. A similar status is observed for all states as SD is low. ‘lnFIB’ and ‘lnFII’ have mean values of 1.571513 and 2.789169, respectively. However, these averages are pretty closer to Min. This situation implies that FI is not at a sufficient level in India. However, states vary considerably due to large SD: ‘lnInt_subs’ is 3.983403 on average (a minute towards Max). Hence, internet subscription in India is moderate, with low variation between states. ‘lnAr_Ins’ and ‘lnGr_Pr’ have averages of 2.191722 and 5.714827, respectively. ‘lnAr_Ins’ towards Min. This situation indicates that insured area and premium, on average, are substantially low in India. However, ‘lnGr_Pr’ has a mean towards Max, indicating that the average gross premium is substantially high.
The correlation (pairwise) given in Table 3 shows several pairs, e.g., ‘lnFIB’ and ‘lnFII’, and the pairs having interaction terms have correlation coefficient values more significant than 0.800. Such pairs have multicollinearity issues. Therefore, these pairs are not taken together in the model. Moreover, pairing interaction terms with their components can have multicollinearity. Such multicollinearity is termed structural multicollinearity, which is permissible in regression (Baltagi and Baltagi 2008).

4.2. Analysis and Results

The dynamic PDRMs are undertaken for regression analysis. The Sargan test in each model confirms no overidentification biases because it exhibits insignificant values, which cannot reject the null of no overidentification (Baltagi and Baltagi 2008; Kyereboah-Coleman 2008). The Arellano–Bond (AR) test rejects the autocorrelation issue at lag 1 due to having significant p-values. Therefore, the models are consistent for the analysis (Baltagi and Baltagi 2008; Kyereboah-Coleman 2008).
Table 4 shows that lag 1 of the dependent variable SDG_Ind is significant (at 5% significance) in two models (Models 3 and 4). Both models exhibit positive coefficients (i.e., 0.116 and 0.168, respectively). The previous SDG positively impacts the current SDG. ‘lnFIB’ and ‘lnFII’ in Model 1 and 2, respectively, have positively significant coefficients (3.209 and 0.741, respectively). It implies that FI increases SDG in India. In contrast, both interaction terms ‘i_ lnFIB_lnInt_subs’ (in Model 3) and ‘i_lnFII_lnInt_subs’ (in Model 4) have negative and significant coefficients (−0.213 and −0.531, respectively). It means that when internet subscribers (lnint_subs) are high, the positive effect of FI (lnFIB and lnFII) on SDG decreases. When internet subscribers are low, FI (lnFIB and lnFII) ’s positive effect on SDG increases (see Figure 2 and Figure 3). Following Gautam et al. (2022) the interaction graphs in Figure 2 and Figure 3 are given for a clear understanding of FI and SDG connection under the moderation of internet subscribers (digitalization). Control variables ‘lnAr_Ins’ and ‘lnGr_Pr’ are significant in all models. However, ‘lnAr_Ins’ exhibits negative coefficients and ‘lnGr_Pr’ exhibits positive coefficients for SDG. Similar results are found in the static model as mentioned in the Appendix A.

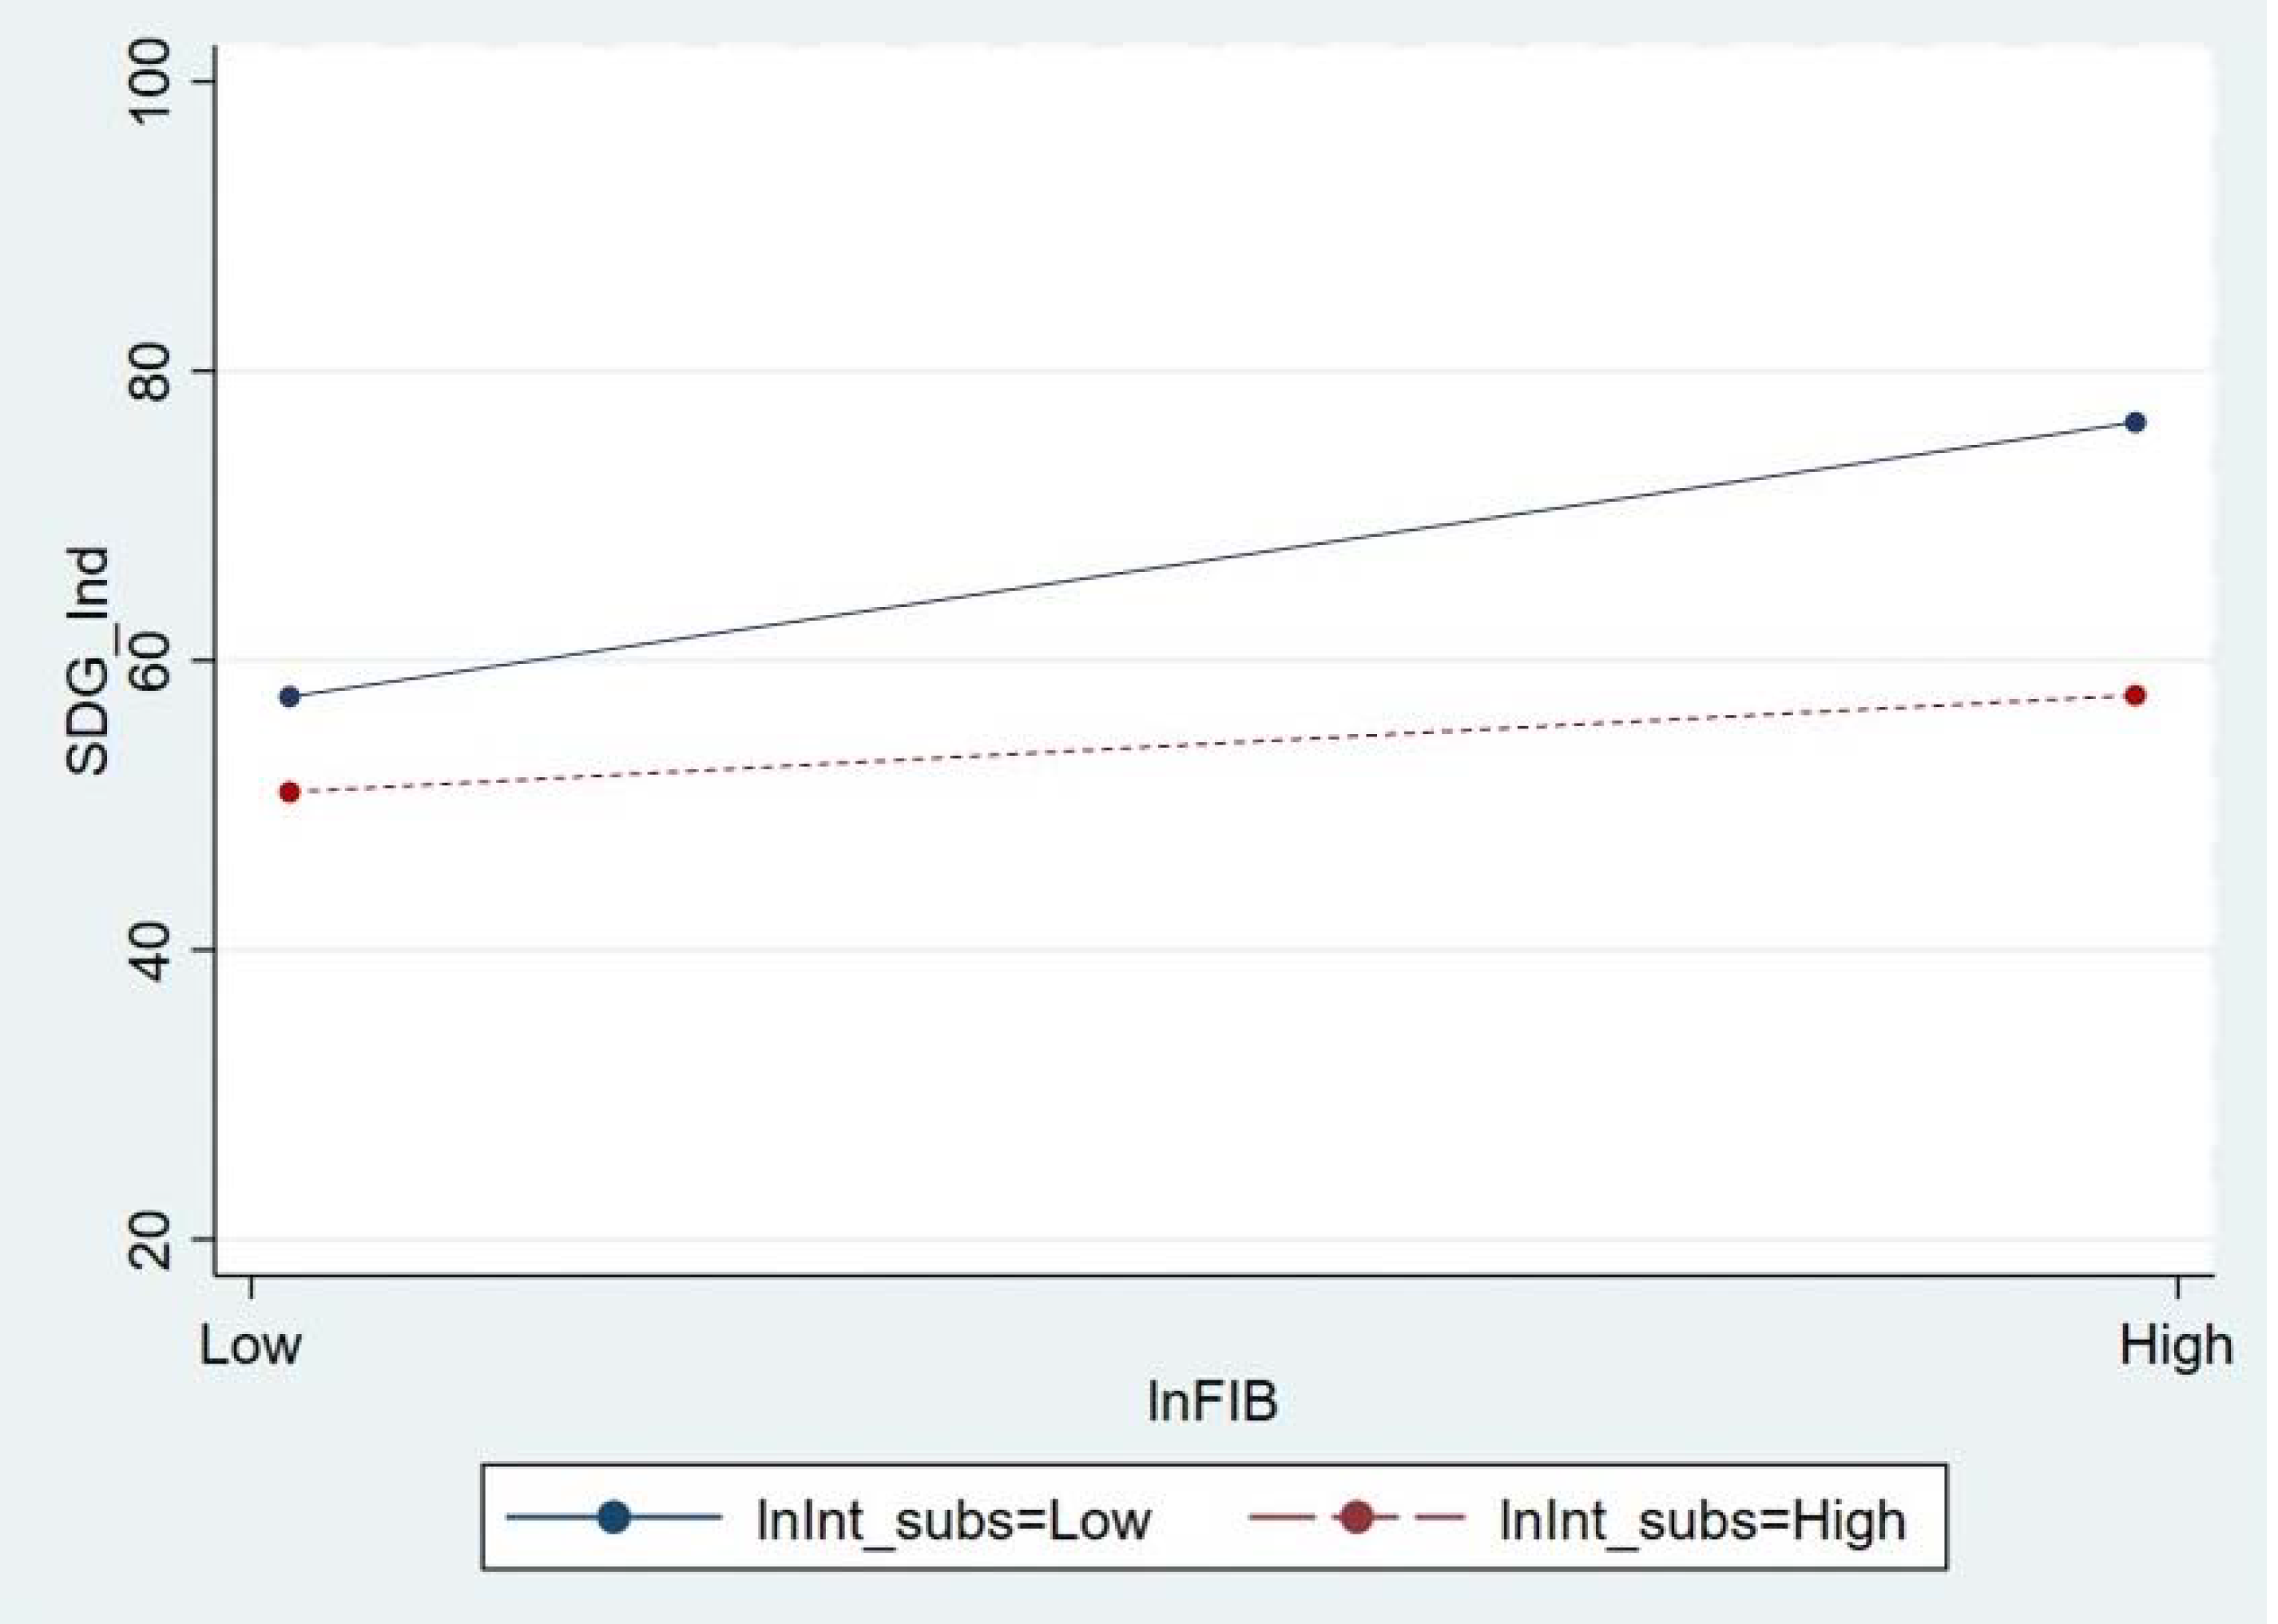
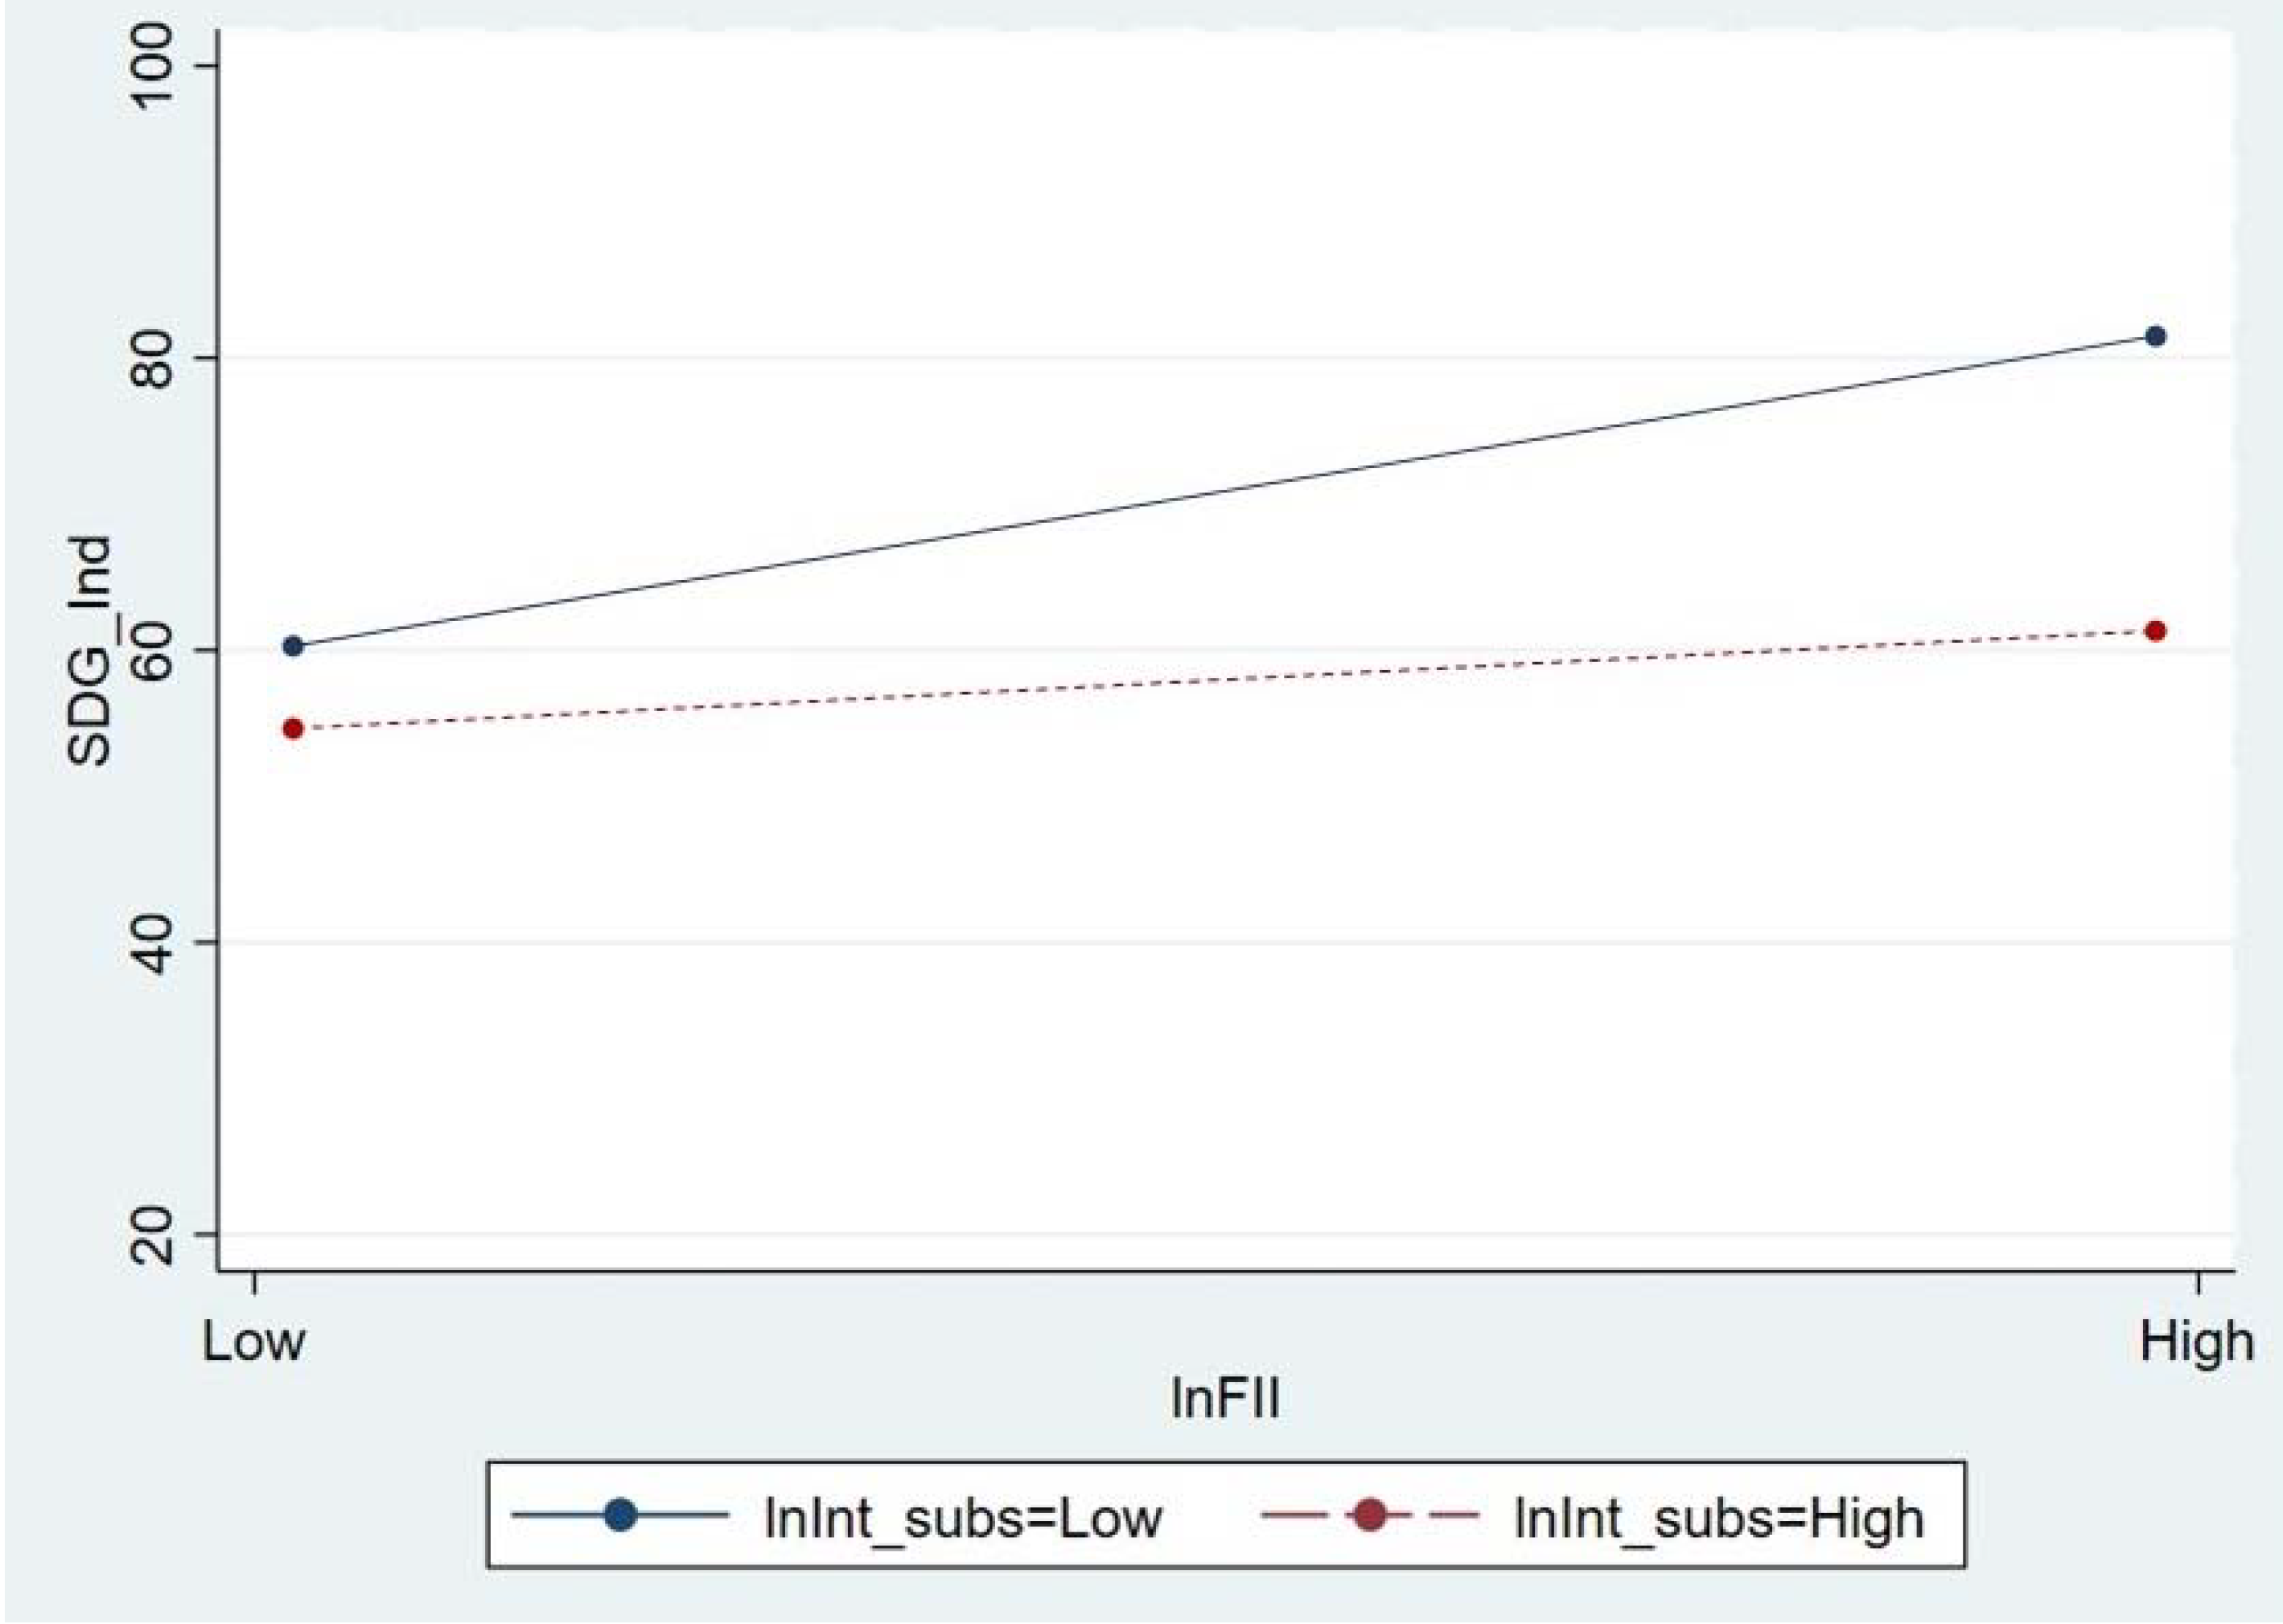
4.3. Marginal Effect of FI on SDG in Models 3 and 4

Equations (5) and (6) are derived from Equations (3) and (4) (mentioned in Section 3.2) to observe the marginal effect (Onukwugha et al. 2015; Busenbark et al. 2022) of FI on SDG. Equations (5) and (6)) are derived by taking the first derivative of SDG in Equations (3) and (4) concerning ‘lnFIB’ and ‘lnFII’, respectively (Onukwugha et al. 2015; Busenbark et al. 2022). The derived equations are given below:
SDG_Indit = β1 + β3lnInt_subsit
SDG_Indit = 1.745 + (−0.213)*lnInt_subsit
Where β1 = 1.745, and β3 = −0.213
When lnInt_subsit = 1
Then    SDG_Indit = 1.532
When lnInt_subsit = 2
Then    SDG_Indit = 1.319
When lnInt_subsit = 3
Then    SDG_Indit = 1.106
SDG_Indit = β1 + β3lnInt_subsit
SDG_Indit = 2.807 + (−0.531)*lnInt_subsit
Where β3 = 2.807 and β4 = −0.531
When lnInt_subsit = 1
Then    SDG_Indit = 2.276
When lnInt_subsit = 2
Then    SDG_Indit = 1.745
When lnInt_subsit = 3
Then    SDG_Indit = 1.214
It is evident from the above calculations that with one unit change in FI (‘lnFIB’ and ‘lnFII’), there is a 1.532 and 2.276 unit change in SDG, respectively, at lnInt_subs in Equations (5) and (6). It is observed that the marginal effect of FI on SDG is no longer equal to the estimated β1 (in Equations (5) and (6)). This is why the FI influences the SDG through interaction terms involving the moderator lnInt_subs (Internet subscribers). It can also be observed that the marginal effect of change in FI is still independent of the value of the FI proxies. It depends on the value of lnInt_subs. Hence, it validates the interaction effect observed through Models 3 and 4 (Onukwugha et al. 2015; Busenbark et al. 2022). It should also be observed that as the value of ‘lnInt_subs’ increases, the FI’s effects on SDG is reduced.

4.4. Endogeneity and Robustness

Confirming the absence of endogeneity is essential for the current models otherwise. They may result in biased outcomes due to reverse causality (Baltagi and Baltagi 2008; Gautam et al. 2022). The Durbin–Chi-square and Wu–Hausman tests are deployed to check whether the explanatory variables are exogenous for the dependent variable in the current models (Baltagi and Baltagi 2008; Gautam et al. 2022). Both tests come out with insignificant values at 5% significance. This situation confirms that the concerned variables are exogenous. Hence, the models are a good fit. All the concerned variables are exogenous; therefore, applying the GMM framework uses these exogenous variables as instrument variables (Baltagi and Baltagi 2008). The results are depicted in Table 5.
Additionally, the assurance of robust results is essential for any study. The current paper uses multiple models to ensure the robustness of the result (Baltagi and Baltagi 2008; Gautam et al. 2022). It is noticed that FI significantly impacts SDG in almost all the models. This result implies that the results are robust.

5. Discussion

The results indicate that the first hypothesis is not rejected and is consistent with the previous research. The causal relation is positively significant. The first two models use the farmer application beneficiary and farmers application insured under the PMFBY. Both of them show a positive association with the SDGs. The results are consistent with the studies carried out by other researchers (Chatterjee 2017; Pandey et al. 2022; Rai 2019; Siddiqui and Siddiqui 2020; Inoue and Hamori 2016; Rasheed et al. 2016; Kim 2016; Kim et al. 2017; Pradhan et al. 2014).
The empirical result shows a strong dependence of the sustainable economic development of India on FI. In order words, improvement in FI will lead to better economic growth and development of the nation. The insight into the constructs of the present model is crucial for promoting financial inclusiveness, especially in emerging economies like India. The Government of India already launches multiple FI programs. RBI provides continuous support and guidance and motivates the banks to pursue a higher level of FI by the banks. Surprisingly, it is also observed that there is a negative linkage between the previous SDG and the current SDG. This situation might have happened due to the exhaustion of the available resources responsible for the SDG in India. In addition, it is also possible due to political and administrative reasons, which prioritize the focus from SDG to other more important objectives of the country’s development.
The second hypothesis significantly influences the internet subscriber and impacts the connection between FI and SDG. However, the moderator of internet subscribers shows a significant negative relation with the effect of FI on SDGs. It means that when the internet subscribers increased, the FI leading to Sustainable development growth decreased. Previous research concluded that mobile penetration, information and communication technology, and Telecom positively affect the nation’s growth (Ghosh 2016; Pradhan and Sahoo 2021; Rai 2019; Siddiqui and Siddiqui 2020; Andrianaivo and Kpodar 2012; Gautam et al. 2022). Therefore, there is inconsistency with the previous results. The negative influence of internet subscribers on the association of FI and SDG is surprising. This situation might be due to the lack of digital literacy, which hinders the proper utilization of digital platforms. This situation can give a new perspective in policy making towards economic assimilation and technological advancement.
Further efforts need to be taken to encourage FI. We should work towards including a broader population base that was excluded until now. This study makes a rich contribution by depicting the positive effect of FI on sustainable growth. Other emerging economies can take insight into development through FI.
The research has specific policy implications which need to be considered. There is a need to intensify the FI policy and program nationwide, especially to capture the remote area and excluded population base. The last mile should also be included and provide the financial services to achieve better and sustainable economic growth. Hence the penetration of FI products in the marginalized section will go a long way toward economic growth in India. The government’s payments and other financial services should transition to digital means. The activities like subsidy payments, cash transfer schemes, and salary payments under employment schemes should become progressively digital to ensure the take-up of digital financial services and encourage FI. The government should also judiciously use its revenue and not spend thoughtlessly to increase internet subscribers for better FI. Increasing digital infrastructure can not be fruitful unless it is not utilized correctly. Thus, a focus on digital literacy is needed to utilize financial services on digital platforms properly. Therefore, policymakers should also look for strategies to enhance digital literacy. These findings contribute to the existing literature and show a change in the factors leading to FI. It also attempts to deepen the understanding of essential elements which are decisive to increasing inclusion of financial nature. It highlights new trends in factors influencing inclusion. The authors believe this study is novel as no earlier study has looked for the mediating role of internet subscribers as digitalization for the association of FI and sustainable growth.
The research fills the gaps in previous research by covering most of the nation and using quantitative data sources to arrive at empirical results (Kandpal 2020). Agarwal and Panda (2018) show that the use of mobile and telephones shows an increasing trend across states, with the difference between states having been reduced. Still, the states with lower income are lagging compared with high-income states. Compared to the past, most people now can access phones and subscribe to the internet. The increase in investment in the internet has reached saturation and negatively influenced the link between FI and SDG.

6. Conclusions

The present research tries to determine the effect of FI in achieving sustainable development growth in India and the impact of internet subscribers on the relationship between FI and SDGs. The result expresses that financial inclusion has a significant positive effect on the SDGs. However, the moderator internet subscriber negatively impacts the relationship shared between FI and SDGs. The marginal effect of FI on SDGs is also observed, indicating the negative role of internet subscribers in the relationship between FI and SDGs. These results have substantial policy implications. There is a need to increase the levels of financial inclusion in the country to push economic growth. However, increasing internet subscribers may not necessarily increase the financial inclusion levels leading to economic growth. Therefore, instead of only focusing on internet services available to subscribers, there should be a focus on educating subscribers to avail financial services on the digital platform. Therefore, the government should not irrationally spend on expanding the internet and not focus on other rational factors leading to sustainable growth. Instead, they should focus on enhancing digital literacy among the population. This will motivate citizens to use the internet for financial purposes with the help of campaigns, schemes, and direct benefit transfers.
The present study significantly contributes to the literature on FI, SDG, and digitalization through its novel evidence. No current study looks for the moderating role of internet subscribers for the FI and economic growth nexus. Hence, the current study is a novel attempt in this direction.
The present study has a limitation of its scope only under the boundaries of India. Hence, the research can be taken to a higher level by augmenting the scale of the study. The data can be collected for pan India to get a better perspective. Also, a state-wise analysis can be conducted to look into state-specific dimensions. The sample period is only three years due to the unavailability of data. However, we have taken enough observations to carry out a consistent analysis. Thus, as per the data availability, this study can be furthered with more states and the period in future studies. This research can be carried forward in other developing countries, and the reliability of the study can be tested. The government can consider the research outcome to improve policy decisions and boost FI and economic growth. Moreover, this will help in the optimal utilization of scarce resources for better achievement of FI.

Author Contributions

Conceptualization, S.R. and J.K.; methodology, V.T.; software, R.S.G.; validation, R.S.G., V.M.B. and J.K.; formal analysis, A.P., V.T.; investigation, N.P.; resources, A.P.; data curation, R.S.G.; writing—original draft preparation, A.P., R.S.G. and V.T.; writing—review and editing, J.K. and V.M.B.; visualization, S.R.; supervision, S.R.; project administration, N.P. All authors have read and agreed to the published version of the manuscript.

Funding

This research received no external funding.

Data Availability Statement

NITI Aayog and PMFBY (“Pradhan Mantri Fasal Bhima Yojana”) report.

Conflicts of Interest

The authors declare no conflict of interest.

Appendix A. Additional Discussion of Validity of Methodology and the Results’ Consistency

Table 2 in Section 4.1. demonstrates a glimpse of the descriptive statistics of the variables. A detailed description of descriptive statistics is given in the same section. Table 5 in Section 4.4 presents the results of the endogeneity issue. No significant endogeneity issue is found as of insignificant p-values exhibited by main explanatory variables.
Table A1 demonstrates the regression results. The Hausman test showing insignificant p-values for each model confirms the validity of random effect models. The robust estimates are reflected in the table due to the presence of heteroscedasticity or autocorrelation. The Wald test and the Wooldridge test, respectively, examine heteroscedasticity and autocorrelation (Wooldridge 2015). Here again, ‘lnFIB’ is found to be significant and positive at 10% significance in Models 1, 3, and 4. This means FI is beneficial for SDG in India. Both interaction terms ‘i_lnFIB_lnInt_subs’ (in Model 3) and ‘i_lnFII_lnInt_subs’ (in Model 4) have negative and significant coefficients (−1.038 and −0.001, respectively). It means that internet subscribers significantly but negatively influence the connection of FI and SDG. Moreover, it also implies that when internet subscribers are higher, the positive impact of FI becomes reduced on SDG and vice-versa. The similarity of results again confirms that the results are robust and consistent. It also ensures that the methodology we applied earlier is correct
Table A1. Regression Result (Static Model-Random Effect).
DV: SDG_IndBase Model 1
(Robust)
Base Model 2
(Robust)
Interaction Model 3
(Robust)
Interaction Model 4
(Robust)
Coef.SE.Coef.SE.Coef.SE.Coef.SE.
lnFIB2.476 **1.0970.4650.9125.036 ***2.7810.3950.629
lnFII
lnInt_subs 11.847 ***2.42112.237 ***2.198
i_lnFIB_lnInt_subs −1.038 ***0.587
i_lnFII_InInt_subs −0.001 *0.000
lnAr_Ins−8.779 ***.353−9.027 ***0.714−4.553 ***1.135−4.372 ***1.242
lnGr_Pr5.991 ***1.4478.162 ***0.0773.331 ***0.7253.787 ***0.629
Cons43.356 ***7.43032.089 ***1.8285.6509.0630.7365.748
Hausman Test2.70 (0.4410)0.65 (0.8855)4.50 (0.4800)4.75 (0.4474)
Wald test for Heteroscedasticity 11.62 (0.6546)3.70 (0.2956)14.23 *** (0.0026)22.70 *** (0.0000)
Wooldridge Autocorrelation Test 2 AR (1)61.560 *** (0.0159)147.335 *** (0.0067)288.030 *** (0.0035)154.182 *** (0.0064)
Note: 1 Wald test of heteroscedasticity has the null of no heteroscedasticity. 2 Wooldridge test of autocorrelation in the panel has the null of no autocorrelation (with 1 lag). Robust estimates are estimated due to significant Heteroscedasticity and Autocorrelation. DV is SDG (). The stars *, **, and *** represent 10, 5, and 1 percent significance levels.

References

  1. Agarwal, Tanushree, and Prasant Kumar Panda. 2018. Pattern of Digital Divide and Convergence in Access to ICT Facilities among the Indian States. Journal of Infrastructure Development 10: 37–51. [Google Scholar] [CrossRef]
  2. Aggarwal, Richa. 2014. Financial Inclusion in India: Challenges and Opportunities. International Journal of Research (IJR) 1: 557–67. [Google Scholar]
  3. Alam Iqbal, Badar, and Shaista Sami. 2017. Role of banks in financial inclusion in India. Contaduria y Administracion 62: 644–56. [Google Scholar] [CrossRef]
  4. Andrianaivo, Mihasonirina, and Kangni Kpodar. 2012. Mobile phones, financial inclusion, and growth. Review of Economics and Institutions 3: 30. [Google Scholar] [CrossRef]
  5. Asongu, Simplice A., and Lieven De Moor. 2015. Recent Advances in Finance for Inclusive Development: A Survey. Available online: https://econpapers.repec.org/paper/abhwpaper/15_2f005.htm (accessed on 12 March 2015).
  6. Baltagi, Badi Hani, and Badi H. Baltagi. 2008. Econometric Analysis of Panel Data. Chichester: John Wiley & Sons, vol. 4. [Google Scholar]
  7. Barajas, Adolfo, Ralph Chami, Christian Ebeke, and Sampawende J.-A. Tapsoba. 2012. Workers’ Remittances: An Overlooked Channel of International Business Cycle Transmission? Washington, DC: International Monetary Fund. [Google Scholar]
  8. Boateng, Kwadwo. 2017. Financial Inclusion for Economic Growth-An Overview of Some Financial Inclusion Policies in India. Available online: www.kaavpublications.org (accessed on 6 February 2017).
  9. Busenbark, John R., Scott D. Graffin, Robert J. Campbell, and Eric Young Lee. 2022. A marginal effects approach to interpreting main effects and moderation. Organizational Research Methods 25: 147–69. [Google Scholar] [CrossRef]
  10. Chatterjee, Amrita. 2017. Financial Inclusion, Information and Communication Technology Diffusion and Economic Growth: A Panel Data Analysis. Paper presented at the XXVIIth Annual Conference on Contemporary Issues in Development Economics, Kolkata, India, December 21–22; Available online: https://www.researchgate.net/publication/323218542_Financial_Inclusion_Information_and_Communication_Technology_Diffusion_and_Economic_Growth_A_Panel_Data_Analysis (accessed on 8 March 2020).
  11. Consultative Group to Assist the Poor—CGAP. 2011. Global Standard-Setting Bodies and Financial Inclusion for the Poor-Toward Proportionate Standards and Guidance. White Paper. Washington, DC: Global Partnership for Financial Inclusion. [Google Scholar]
  12. D’souza, Renita. 2018. Examining Mobile Banking as a Tool for FI in India. ORF Issue Brief 265: 1–12. [Google Scholar]
  13. Dikshit, Smita, and A. C. Pandey. 2021. Role of financial inclusion in realizing sustainable development goals (SDGs). International Journal of Research in Finance and Management 4: 35–39. [Google Scholar] [CrossRef]
  14. Gautam, Rahul Singh, Shailesh Rastogi, Aashi Rawal, Venkata Mrudula Bhimavarapu, Jagjeevan Kanoujiya, and Samaksh Rastogi. 2022. Financial Technology and Its Impact on Digital Literacy in India: Using Poverty as a Moderating Variable. Journal of Risk and Financial Management 15: 311. [Google Scholar] [CrossRef]
  15. Ghosh, Saibal. 2016. Does mobile telephony spur growth? Evidence from Indian states. Telecommunications Policy 40: 1020–31. [Google Scholar] [CrossRef]
  16. Han, Rui, and Martin Melecky. 2013. Financial Inclusion for Stability: Access to Bank Deposits and the Deposit Growth during the Global Financial Crisis Financial Inclusion for Financial Stability. MPRA. Available online: https://mpra.ub.uni-muenchen.de/48339/ (accessed on 16 July 2013).
  17. Hsiao, Cheng. 2007. Panel data analysis—Advantages and challenges. Test 16: 1–22. [Google Scholar] [CrossRef]
  18. Inoue, Takeshi, and Shigeyuki Hamori. 2016. Financial access and economic growth: Evidence from Sub-Saharan Africa. Emerging Markets Finance and Trade 52: 743–53. [Google Scholar] [CrossRef]
  19. Johnson, Susan, and Steven Arnold. 2012. Inclusive financial markets: Is transformation under way in Kenya? Development Policy Review 30: 719–48. [Google Scholar] [CrossRef]
  20. Kandpal, Vinay. 2020. Reaching sustainable development goals: Bringing financial inclusion to reality in India. Journal of Public Affairs 20: e2277. [Google Scholar] [CrossRef]
  21. Kim, Jong-Hee. 2016. A study on the effect of financial inclusion on the relationship between income inequality and economic growth. Emerging Markets Finance and Trade 52: 498–512. [Google Scholar] [CrossRef]
  22. Kim, Minjin, Hanah Zoo, Heejin Lee, and Juhee Kang. 2017. Mobile, Financial Inclusion and Development: A Critical Review of Academic Literature. Available online: https://aisel.aisnet.org/globdev2017/4/ (accessed on 21 October 2022).
  23. King, Robert, and Ross Levine. 1993. Finance and Growth: Schumpeter Might Be Right. The Quarterly Journal of Economics 108: 717–37. [Google Scholar] [CrossRef]
  24. Kyereboah-Coleman, Anthony. 2008. Corporate governance and firm performance in Africa: A dynamic panel data analysis. Studies in Economics and Econometrics 32: 1–24. [Google Scholar] [CrossRef]
  25. Lamba, Vibha. 2021. Descriptive Analysis of Pradhan Mantri Fasal Bima Yojana (Pmfby) From the Year 2016–2020. International Journal of Mechanical Engineering 3: 3971–80. Available online: https://kalaharijournals.com/resources/DEC_593.pdf (accessed on 21 October 2022).
  26. NITI Aayog. 2020. SDG India Index & Dashboard 2019–20. Available online: http://14.139.60.153/handle/123456789/13652 (accessed on 2 November 2019).
  27. Onukwugha, Eberechukwu, Jason Bergtold, and Rahul Jain. 2015. A primer on marginal effects—Part I: Theory and formulae. Pharmacoeconomics 33: 25–30. [Google Scholar] [CrossRef]
  28. Ozili, Peterson K. 2018. Impact of digital finance on financial inclusion and stability. Borsa Istanbul Review 18: 329–40. [Google Scholar] [CrossRef]
  29. Pandey, Amit, Ravi Kiran, and Rakesh Kumar Sharma. 2022. Investigating the Impact of Financial Inclusion Drivers, Financial Literacy and Financial Initiatives in Fostering Sustainable Growth in North India. Sustainability 14: 11061. [Google Scholar] [CrossRef]
  30. Park, Cyn-Young, and Rogelio Mercado. 2015. Financial Inclusion, Poverty, and Income Inequality in Developing Asia. Asian Development Bank Economics Working Paper Series; Mandaluyong: ADB, p. 426. [Google Scholar]
  31. Pearce, Douglas. 2011. Financial Inclusion in the Middle East and North Africa: Analysis and Roadmap Recommendations. World Bank Policy Research Working Paper. Washington, DC: World Bank, p. 5610. [Google Scholar]
  32. Piper, Alan T. 2014. The Benefits, Challenges and Insights of a Dynamic Panel Assessment of Life Satisfaction. Available online: https://mpra.ub.uni-muenchen.de/59556/ (accessed on 2 January 2014).
  33. PMFBY—Crop Insurance. n.d. Pradhan Mantri Fasal Bima Yojana—Crop Insurance. Available online: https://pmfby.gov.in/stateWiseDataPage (accessed on 26 September 2022).
  34. Pradhan, Rudra P., and Pragyan P. Sahoo. 2021. Are there links between financial inclusion, mobile telephony, and economic growth? Evidence from Indian states. Applied Economics Letters 28: 310–14. [Google Scholar] [CrossRef]
  35. Pradhan, Rudra P., Mak B. Arvin, Neville R. Norman, and John H. Hall. 2014. The dynamics of banking sector and stock market maturity and the performance of Asian economies: Time series evidence. Journal of Economic and Administrative Sciences 30: 16–44. [Google Scholar] [CrossRef]
  36. Rai, Ruchbah. 2019. Pradhan Mantri Fasal Bima Yojana: An Assessment of India’s Crop Insurance Scheme. ORF Issue Brief 296: 1–16. [Google Scholar]
  37. Raichoudhury, Ayushi. 2020. Major Determinants of Financial Inclusion: State-Level Evidences from India. Vision 24: 151–59. [Google Scholar] [CrossRef]
  38. Rasheed, Balach, Siong-Hook Law, Lee Chin, and Muzafar Shah Habibullah. 2016. The role of financial inclusion in financial development: International evidence. Abasyn University Journal of Social Sciences 9: 330–48. [Google Scholar]
  39. Rastogi, Shailesh, and E. Ragabiruntha. 2018. Financial inclusion and socioeconomic development: Gaps and solution. International Journal of Social Economics 45: 1122–40. [Google Scholar] [CrossRef]
  40. Rastogi, Shailesh, Arpita Sharma, Chetan Panse, and Venkata Mrudula Bhimavarapu. 2021. Unified Payment Interface (UPI): A digital innovation and its impact on financial inclusion and economic development. Universal Journal of Accounting and Finance 9: 518–30. [Google Scholar] [CrossRef]
  41. SDG. 2022. THE 17 GOALS Sustainable Development. Available online: https://sdgs.un.org/goals (accessed on 11 October 2022).
  42. Sethi, Dinabandhu, and Debashis Acharya. 2018. Financial inclusion and economic growth linkage: Some cross country evidence. Journal of Financial Economic Policy 10: 369–85. [Google Scholar] [CrossRef]
  43. Sharma, Upasana, and Banajit Changkakati. 2022. Dimensions of global financial inclusion and their impact on the achievement of the United Nations Development Goals. Borsa Istanbul Review 22: 1238–50. [Google Scholar] [CrossRef]
  44. Siddiqui, Taufeeque A., and Kashif I. Siddiqui. 2020. FinTech in India: An analysis on impact of telecommunication on financial inclusion. Strategic Change 29: 321–30. [Google Scholar] [CrossRef]
  45. Singh, Pankaj, and Gaurav Agrawal. 2020. Development, present status and performance analysis of agriculture insurance schemes in India: Review of evidence. International Journal of Social Economics 47: 461–81. [Google Scholar] [CrossRef]
  46. Singh, Vinay Kumar, and Sajal Ghosh. 2021. Financial inclusion and economic growth in India amid demonetization: A case study based on panel cointegration and causality. Economic Analysis and Policy 71: 674–93. [Google Scholar] [CrossRef]
  47. Soumen, Sarkar, and Kumar Paul Sujit. 2021. A Study on the Significant Approaches towards Financial Inclusion in India. The Journal of Oriental Research Madras, 73–87. [Google Scholar]
  48. Sujlana, Paramjit, and Chhavi Kiran. 2018. A Study on Status of Financial Inclusion in India. International Journal of Management Studies 5: 96. [Google Scholar] [CrossRef]
  49. Swamy, Vighneswara. 2014. Financial Inclusion, Gender Dimension, and Economic Impact on Poor Households. World Development 56: 1–15. [Google Scholar] [CrossRef]
  50. Telecom Regulatory Authority of India. 2022. Performance Indicators Reports | Telecom Regulatory Authority of India; August 7, Telecom Regulatory Authority of India. Available online: https://www.trai.gov.in/release-publication/reports/performance-indicators-reports (accessed on 11 October 2022).
  51. Tiwari, Rajesh, Khem Chand, and Bimal Anjum. 2020. Crop Insurance in India: A Review of Pradhan Mantri Fasal Bima Yojana (PMFBY). FIIB Business Review 9: 249–55. [Google Scholar] [CrossRef]
  52. Van de Meerendonk, Tim. 2020. Claiming crisis: Narratives of tension and insurance in rural India. Contemporary South Asia 28: 362–73. [Google Scholar] [CrossRef] [PubMed]
  53. Van, Loan Thi-Hong, Anh The Vo, Nhan Thien Nguyen, and Duc Hong Vo. 2021. Financial inclusion and economic growth: An international evidence. Emerging Markets Finance and Trade 57: 239–63. [Google Scholar] [CrossRef]
  54. Wooldridge, Jeffrey M. 2015. Introductory Econometrics: A Modern Approach. Boston: Cengage Learning. [Google Scholar]
Figure 1. Conceptual Model.
Jrfm 16 00262 g001
Figure 2. Interaction Graph. Source: Using STATA 15, the graph was produced. The long-dashed line in the graph represents the high-level influence, whereas the solid line depicts the moderating variable’s low-level impact.
Jrfm 16 00262 g002
Figure 3. Interaction Graph. Source: STATA 15 was utilized to construct the graph. The graph’s long-dashed line represents the moderating variable’s high-level impact, while the solid line depicts its low-level influence.
Jrfm 16 00262 g003
Table 1. Variable Definition.
SNVariableTypeDefinitionCitations
1SDG_IndDVThe SDG India Index aims to present a comprehensive picture of the nation’s social, economic, and environmental situation and its States and UTs.NITI Aayog (2020).
2lnFIBIVFarmers Application Benefited comes under PMFBY (in lakh) and is used as a proxy of FI. PMFBY is concerned with crop insurance for farmers in India. The natural log value is utilized.PMFBY—Crop Insurance (n.d.); Lamba (2021).
3lnFIIIVFarmers Application Insured comes under PMFBY (in lakh) and is used as a proxy of FI. The natural log value is utilized.PMFBY—Crop Insurance (n.d.); Lamba (2021).
4lnInt_subsIVThe total number of internet subscribers per 100 in India has been taken from TRAI, and this variable is used as a proxy of digitalization. The natural log value is utilized.Performance Indicators Reports, Telecom Regulatory Authority of India (2022, August 7).
5lnAr_InsCVUnder PMFBY, Area Insured (lakh hectares) is used as a control variable in this study. The natural log value is utilized.PMFBY—Crop Insurance (n.d.); Lamba (2021).
6lnGr_PrCVUnder PMFBY, Gross Premium (INR in crore) is used as a control variable in this study. The natural log value is utilized.PMFBY—Crop Insurance (n.d.); Lamba (2021).
Note: DV is a proxy of Sustainable Development Goals (SDGs), and IV represents financial inclusion.
Table 2. Results of Descriptive Statistics.
VariablesMeanSDMinMax
SDG_Ind64.058826.8334825075
lnFIB1.5715131.841450−3.8167134.476143
lnFII2.7891691.613935−0.5923974.999527
lnInt_subs3.9834030.3150293.2300144.487737
lnAr_Ins2.1917221.856352−0.9888614.862151
lnGr_Pr5.7148272.82956308.756804
Note: Mean, SD, Min, and Max are mean value, standard deviation, minimum and maximum, respectively.
Table 3. Results of the Correlation Matrix.
VariableslnFIBlnFIIlnInt_subsi_lnFIB_lnInt_subsi_lnFII_InInt_subslnAr_InslnGr_Pr
lnFIB1.0000
lnFII0.9116 *1.0000
lnInt_subs0.1568−0.11291.0000
i_lnFIB_lnInt_subs0.9957 *0.9015 *0.19841.0000
i_lnFII_InInt_subs0.9246 *0.9898 *0.00330.9258 *1.0000
lnAr_Ins0.6563 *0.7039 *−0.15230.6395 *0.6812 *1.0000
lnGr_Pr0.7173 *0.7342 *0.08380.7318 *0.7653 *0.7674 *1.0000
Note: * represents a significant correlation coefficient at 0.05.
Table 4. Regression Result (Dynamic Model).
DV: SDG_IndModel 1
(Base_Model 1)
Model 2
(Base_Model 2)
Model 3
(Interaction_Model 1)
Model 4
(Interaction_Model 2)
Coeff.SE.Coeff.SE.Coeff.SE.Coeff.SE.
SDG_Ind log 1−0.0850.0960.0410.1710.116 *0.0450.168 ***0.050
lnFIB3.209 ***0.754 1.745 *0.971
lnFII 0.741 *0.567 2.8072.005
lnInt_subs 12.993 *1.49115.878 ***1.564
i_lnFIB_lnInt_subs −0.213 *0.200
i_lnFII_InInt_subs −0.531 *0.412
lnAr_Ins−8.037 ***1.212−9.535 ***2.541−5.630 ***1.151−5.897 ***1.465
lnGr_Pr4.412 ***0.7138.302 ***2.5354.627 ***0.9005.241 ***1.243
Cons.56.032 ***7.61028.60021.515−12.6327.060 *−31.466 ***12.007
Sargan Test34.5127 (0.1845)31.50035 (0.2953)26.17405 (0.4536)25.28593 (0.5028)
AR (1)−0.68492 * (0.0934)−1.4732 ** (0.0407)−1.3898 * (0.0646)−1.4432 ** (0.0490)
AR (2)−1.0764 (0.2818)−1.1104 (0.2668)−1.0864 (0.2773)−1.0817 (0.2794)
Note: The Sargan test is the test of over-identification issues under the GMM framework. The null hypothesis of the Sargan test is that there is no over-identification problem in the dynamic panel data model. The Arellano–Bond test used in the analysis is for serial autocorrelation in the first differenced error terms of order 1. One star * mark on the coefficient values presents a 10 percent significance level, two stars ** mark on the coefficient values presents a 5 percent significance level and three stars *** mark on the coefficient values presents a 1 percent significance level. Values in parenthesis () are p-values.
Table 5. Endogeneity.
SDG India Index: SDG_ind
lnFIBlnFIIi_lnFIB_lnInt_subsi_lnFII_lnInt_subs
Durbin Chi-20.1330110.3949870.430160.144275
(0.7153)(0.5297)(0.5119)(0.7041)
Wu-Hausman Test0.1113370.3355550.3345860.112219
(0.7414)(0.5674)(0.5686)(0.7405)
Note: The value in () is the p-value. SDG signifies endogenous variable.
Disclaimer/Publisher’s Note: The statements, opinions and data contained in all publications are solely those of the individual author(s) and contributor(s) and not of MDPI and/or the editor(s). MDPI and/or the editor(s) disclaim responsibility for any injury to people or property resulting from any ideas, methods, instructions or products referred to in the content.

