Article

Term Premia in Norwegian Interest Rate Swaps

1
Department of International Business, Faculty of Economics and Management, Norwegian University of Science and Technology (NTNU), 6001 Ålesund, Norway
2
Department of Industrial Economics and Technology Management, Faculty of Economics and Management, Norwegian University of Science and Technology (NTNU), 7034 Trondheim, Norway
3
Sparebank 1 Markets, 7004 Trondheim, Norway
*
Author to whom correspondence should be addressed.
J. Risk Financial Manag. 2023, 16(3), 188; https://doi.org/10.3390/jrfm16030188
Submission received: 14 January 2023 / Revised: 1 March 2023 / Accepted: 7 March 2023 / Published: 10 March 2023

Abstract

:
Fundamentally, the term premium in long-term nominal yields is compensation to investors for bearing interest rate risk. There is substantial evidence of sizable and time-varying term premia. As opposed to yields, term premia are not directly observable. In this paper, we estimate term premia in Norwegian interest rate swaps from a set of dynamic term structure models, covering the period from 2001/04 until 2022/06. In line with international studies, we find evidence of declining term premia over the sample period. Furthermore, our estimates indicate that term premia have been close to zero, as well as negative in periods, during the last decade of global extraordinary monetary policy measures. We find that the recent rise in Norwegian interest rate swaps is partly caused by increases in term premia. From a practitioner’s perspective, our term premia estimates can be utilized as part of applied management of both investment and debt portfolios.
JEL Classification:
C58; E4; G15; G120

1. Introduction

The Norwegian Interbank Offered Rate (Nibor) has long been the most important interest rate in Norwegian capital markets. Nibor reflects the cost of uncollateralized interbank loans and is the by far the most frequently applied reference rate for deposits, commercial paper and bonds.1 Nibor is considered by many as the most appropriate proxy for the risk-free rate in Norwegian Krone (NOK), due to limited liquidity in Norwegian Government Bonds.
The primary financial instruments for hedging Nibor risk are interest rate swaps (IRS). In IRS, fixed interest payments are exchanged for floating—the latter determined by Nibor—over a preagreed period. The fixed interest swap rate y t ( n ) on an n-maturity swap at time t can be decomposed into two components: one reflecting expectations of Nibor and the other term premia;2
y t ( n ) = 1 n Q y t ( 1 ) + y t + 1 ( 1 ) + + y t + n 1 ( 1 ) + T P y t ( n ) ,
where Q denotes the risk-neutral expectation and T P y t ( n ) is the term premium.3
Our main contribution is implementing a set of dynamic term structure models on NOK interest rate swap data, enabling us to estimate unobservable term premia for different maturities of the swaps. As far as we know, our dataset has not previously been explored for this purpose. Interestingly, we find that term premia on Norwegian interest rate swaps have declined in line with comparable international term premia over the time period of April 2001 through June 2022. Although Norway is one of the few European countries with its own floating currency and the ability to run an independent monetary policy, Norwegian interest rates and term premia are still closely correlated with international interest rate movements. We further find that the impact of the zero lower bound is of minor importance for our study, and that although small sample bias is present in our dataset, bias correction does not produce plausible results. From the perspective of decision makers, our findings have important practical implications. We find that term premia have been close to zero, and in periods negative, during the last decade, coinciding with global extraordinary monetary policy measures. We find that the recent rise in yields due to increasing inflation and related uncertainty with respect to future levels of inflation and economic growth has triggered corresponding increases in term premia. As a consequence, numerical estimates of term premia in Norwegian interest rate swaps are becoming increasingly important for managers of both investment and debt portfolios.4
Numerical estimates of IRS term premia are relevant for a diverse set of stakeholders. Most notably, term premia estimates constitute important portfolio management information for capital market participants. Fixed-income investors use term premia estimates for asset allocation and portfolio construction purposes, as term premia estimates represent expected excess returns over Nibor. For fixed-rate payers—both financial, corporate and sovereign—term premia represent excess funding cost over the short-term rate. Hence, fixed-rate payers interpret the term premium as the cost of hedging Nibor risk. As such, the term premia estimates derived in this paper have significant practical relevance for both lenders and borrowers. Furthermore, policy makers need to judge the impact of monetary policy actions, such as policy rate changes or quantitative easing (QE) programs. In the context of macroeconomic implications, it is crucial to understand whether changes in long-term yields are caused by changes in term premia or altered short-rate expectations, respectively.
Rudebusch et al. (2006); Wright (2011) and d’Amico et al. (2018) find that term premia are driven by the inherent uncertainty of macroeconomic variables, such as real growth and inflation. Complementary to this risk-based approach, D’Amico et al. (2014) and Moessner (2018) document the impact on term premia from asset purchase programs employed by central banks. Furthermore, Hui et al. (2017) propose a convenience yield component in interest rates as an explanation for variation in term premia. Hence, it is plausible that yield term premia fundamentally reflect both risk premia required by risk-averse investors to carry risk related to the future path of short-term interest rates as well as factors unrelated to risk aversion.
This paper contributes to the literature by providing numerical estimates of term premia in Norwegian interest rate swap rates from a representative set of dynamic term structure models. Our sample covers the period from 2001/04 through 2022/06, during which Norges Bank (the central bank of Norway) exercised monetary policy under a mandated fixed inflation target. Particular attention is given to the effect of the lower bound on term premium estimates. Furthermore, we analyze potential impacts of small sample bias and measurement errors. We discuss results in light of monetary policy actions, business cycles and financial market events. To our knowledge, this is the first paper to analyze Norwegian swap rates over this time period and to use this set of models. The NOK IRS results presented in this paper are interesting in their own right. Norway is one of only a few European countries with its own currency and thus the ability to run autonomous monetary policy, which potentially results in different IRS term premium levels and dynamics. Furthermore, the significance of Norwegian capital markets has grown over the last decade. The Norwegian high-yield bond market is among the most active in Europe, and the Oslo Stock Exchange has proved to attract significant interest from both investors and growth-type issuers during the COVID-19 period. Hence, the role of the Norwegian capital markets as a catalyst in the global green transition has recently become clear.
The rest of this paper is organized as follows. In Section 2, we give an overview of the empirical literature on term premia. In Section 3.1, we describe the dataset. In Section 3.2, we describe the econometric framework and estimation strategy applied in the study. In Section 4, we present term premia estimates and discuss the results. Section 5 concludes and proposes ideas for further research.

2. Literature Review

Most empirical research on term premia in yields has been conducted using data from government bond markets. Ang and Piazzesi (2003); Bauer and Rudebusch (2016); Campbell and Shiller (1988); Cochrane and Piazzesi (2005); Diebold and Li (2006); Fama and Bliss (1987); Joslin et al. (2011); Wu and Xia (2016) and many others analyze U.S. Treasuries. Cohen et al. (2018); McCoy (2019); Moessner (2018) utilize data from the Euro area, whereas de los Rios and Shamloo (2017); Malik and Meldrum (2016) present results for the U.K. Jennison (2017), Callaghan (2019) and Aydin and Ozel (2019) estimate term premia from affine term structure models using data from Australia, New Zealand and Turkey, respectively. The consolidated findings in the literature analyzing U.S. Treasuries indicate that term premia went through a minor cycle from 1961 to the early 1980s, peaking at about 2% in 1970. In the early 1980s, the term premia rose quickly to levels of up to 4% and then settled into a range around 2% from the mid-1980s to the early 2000s. Since then, term premia has trended lower and entered subzero levels in 2020. However, there have been several marked cycles against the trend, most notably peaks in 2007 and 2018. Results from other jurisdictions broadly conform to U.S. estimates and indicate that term premia are highly correlated across countries. This is indeed confirmed in international studies (Berardi and Plazzi 2022; Byrne et al. 2019; Dahlquist and Hasseltoft 2013; Mönch 2019; Wright 2011).
The literature analyzing term premia in interest rate swaps is less comprehensive. Liu et al. (2006) and Brooks et al. (2015) analyze the informational content of the Libor term structure relative to government bond yields, whereas Filipović and Trolle (2013) and Gallitschke et al. (2017) analyze the related Libor-OIS spread.5 Jotikasthira et al. (2015) analyze a broad dataset of swap rates and find that world inflation and the U.S. yield level together explain over two-thirds of the covariance of global IRS, and that these effects operate largely through the term premium channel.
Academic research analyzing NOK yields is scarce. Sekkel (2011) and Wright (2011) use Norwegian data as part of their international comparative studies of term premia in government bonds. Wright (2011) reports declining Norwegian government bond (NGB) term premia over the sample period and explains this by the introduction of inflation targeting and increased independence of Norges Bank. NGB term premia are not explicitly estimated by Sekkel (2011) but can be inferred from his analysis of excess return predictability. Gräb and Kostka (2018) report risk premia in interest rates with maturities below one year for G10 currencies, among them NOK. More recently, de Lange et al. (2022) provide updated term premia estimates for NGB yields. This paper fills a gap in the literature by reporting term premia estimates for Norwegian interest rates swaps.

3. Materials and Methods
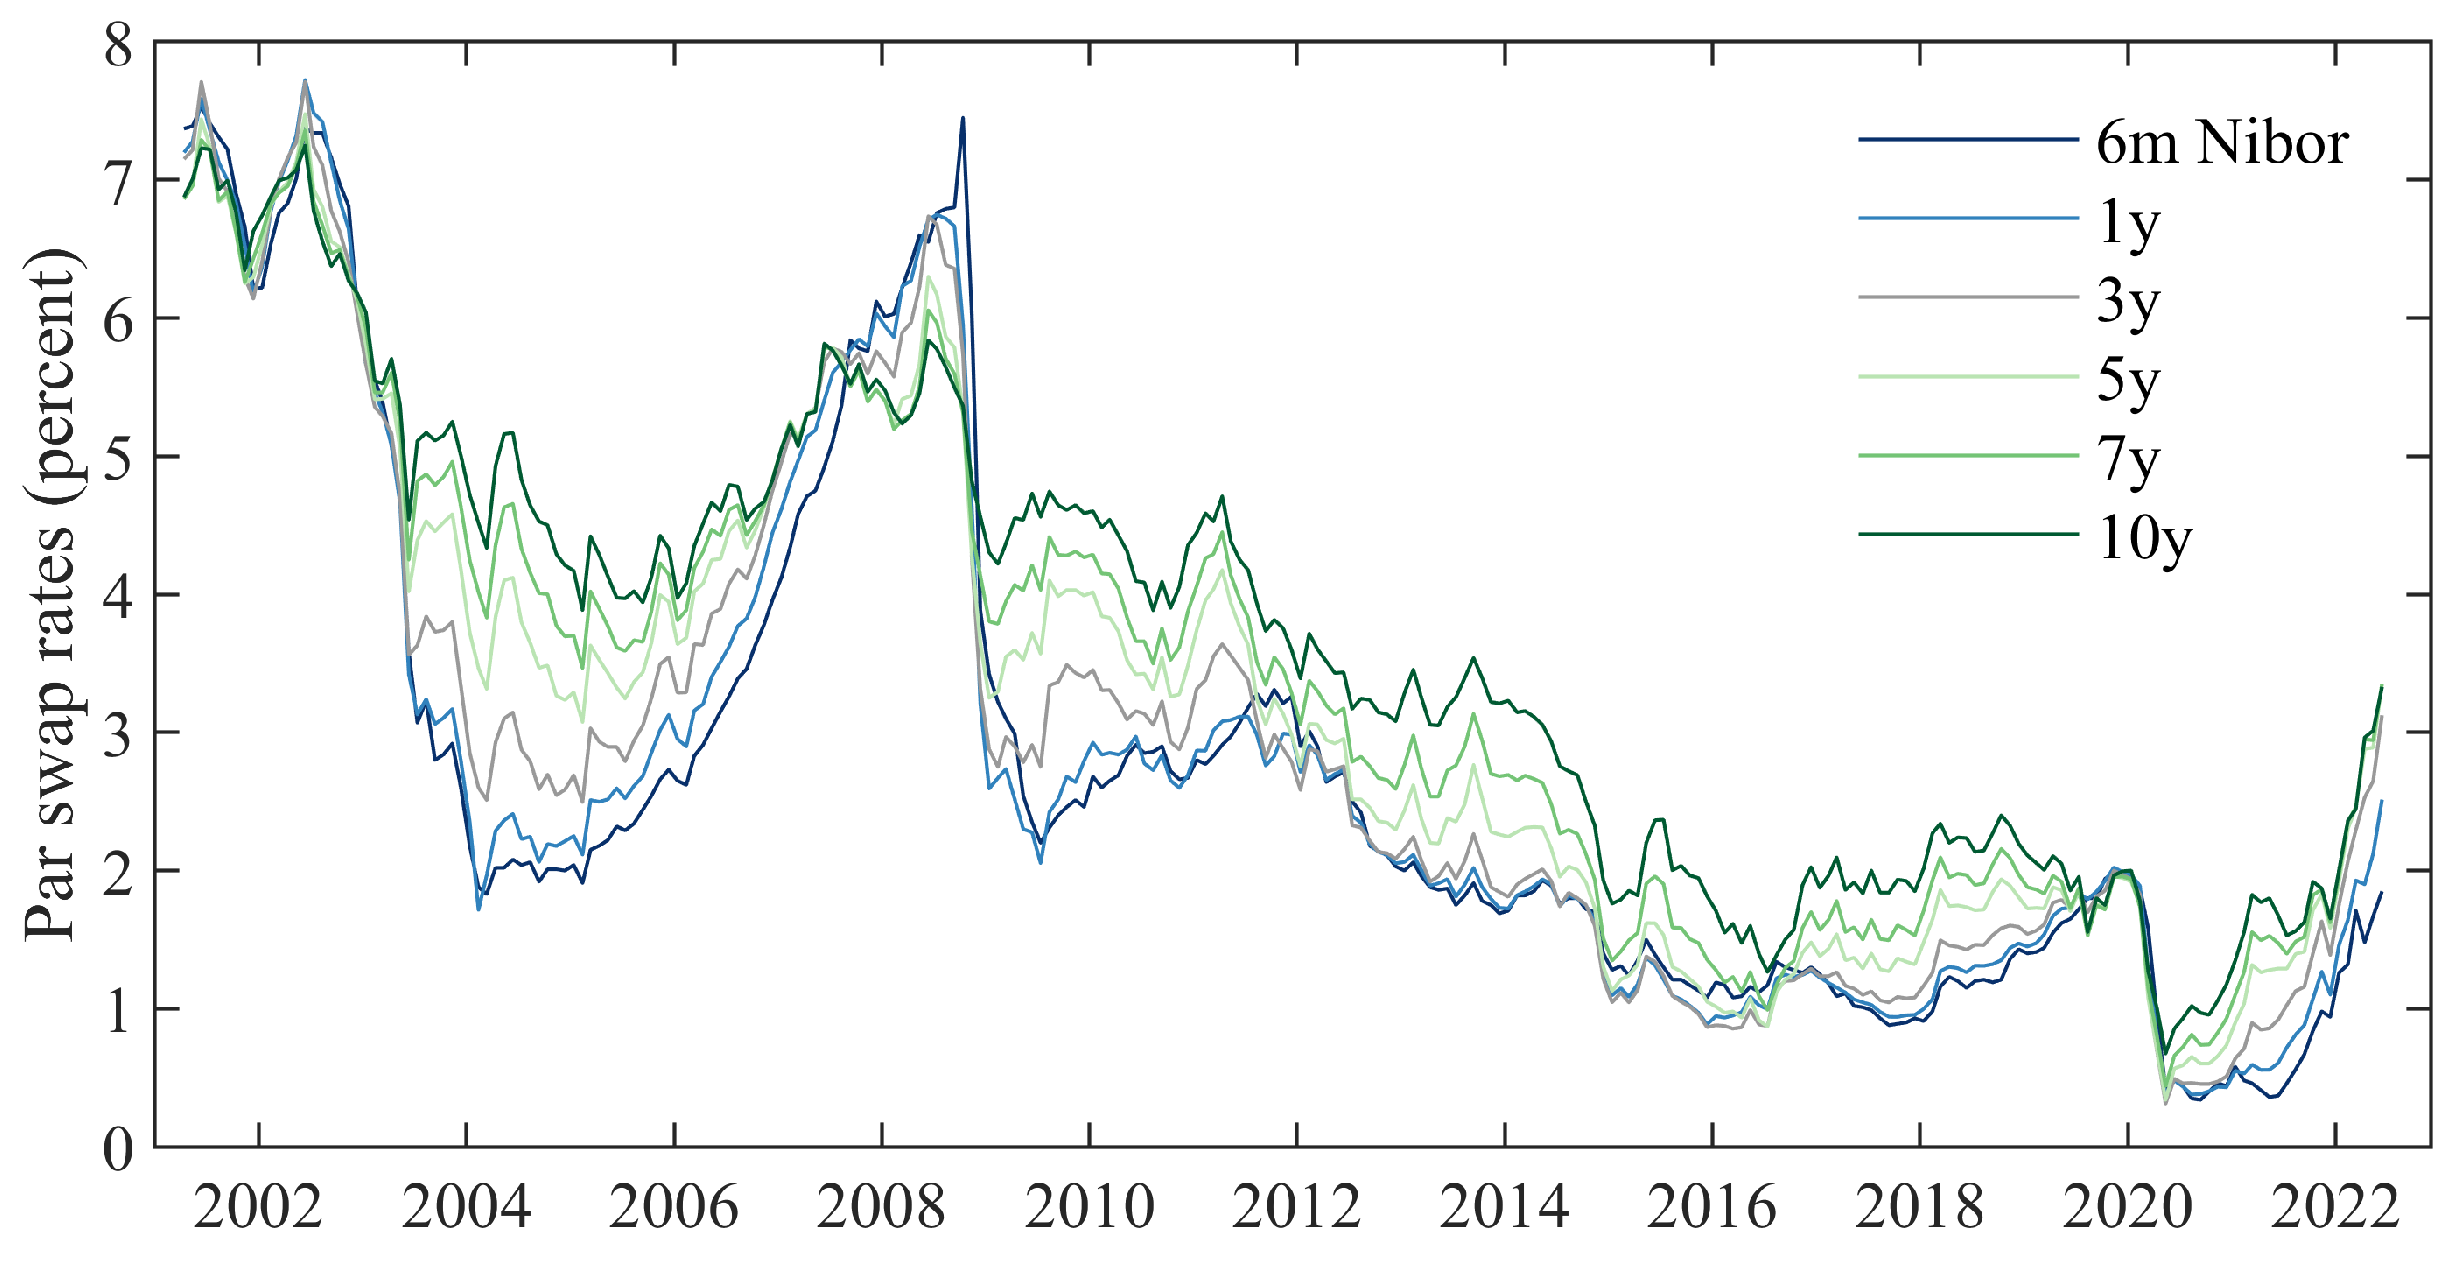
3.1. Data

We base our empirical analysis on NOK interest rate swap data retrieved from Bloomberg. The market makers in NOK IRS contribute their bid and offer rates for maturities ranging from 1 year through 10 years.6 From these contributions, Bloomberg constructs representative end-of-day midmarket swap curves. Interest rate swaps denominated in NOK can be referenced to either the 3-month or the 6-month Nibor rate. We analyze the 6-month swaps, as this is the standard convention quoted in the interbank market. Our sample period covers April 2001 through June 2022 and consists of monthly observations.
On 29 March 2001, the government assigned a new operational mandate for the implementation of monetary policy to Norges Bank. From this date, the central bank has set the policy rate with an objective of maintaining low and stable inflation—defined as an explicit inflation target. To avoid possible structural breaks related to this formal change in monetary policy, we start our sample in April 2001.
As is evident from Figure 1, NOK swap rates have generally declined since the beginning of the century. This is in line with the development of global yields. Bernanke (2013) assigns this long-run decline in yields to cyclical factors, including the slow pace of economic recovery, modest inflation rates and accommodative monetary policy. Bauer and Rudebusch (2020) point to falling expectations of long-run inflation, real yields and related uncertainty. Berardi and Plazzi (2022) find that short-rate expectations have steadily declined over the last two decades. Following the outbreak of COVID-19, Norges Bank set the monetary policy rate to zero, which caused a rapid decline in swap rates across the maturity spectrum. More recently, increasing inflation and the risk of stagflation have led interest rate swap rates to drift upwards.
Although yields of different maturities tend to move in the same direction, the slope of the NOK IRS yield curve has varied over time. The yield curve is typically upward sloping, but the slope has been negative at some occasions, such as during the global financial turbulence in 2008. These dynamics are consistent with an interpretation of the yield curve slope as a recession indicator (Harvey 1986; Kumar et al. 2021).
We estimate zero-coupon yields by bootstrapping the interest rate swap rates displayed in Figure 1. Table 1 displays descriptive statistics for the zero-coupon yields applied in this study and reveals some commonly observed stylized facts. Short-term rates are on average lower than long-term rates. Furthermore, short-term yields are more volatile and less persistent than long-term yields.

3.2. Methodology

While constant maturity swap rates are directly observable in the market, risk premia and expectations of future short rates are latent variables. The decomposition of yields into short-rate expectations and term premia requires application of econometric models. Since the seminal contributions of Duffie and Kan (1996), Dai and Singleton (2000) and Duffee (2002), parsimonious dynamic term structure models (DTSM) have been the preferred econometric framework to estimate term premia. This class of models was originally developed for default-free rates. Short-term interbank lending rates, such as Libor and Nibor, contain liquidity and credit premia (Filipović and Trolle 2013; Gallitschke et al. 2017). Still, due to interbank clearing and collateral requirements, IRS contracts are considered to be close to default-free. Hence, while fixing rates include credit, funding and other risks, the standard swap contracts that are based on them do not themselves necessarily contain prices in credit or liquidity risk (Bianchetti and Morini 2013; Collin-Dufresne and Solnik 2001; Hunzinger and Labuschagne 2015). Consequently, we rely on a set of DTSMs to compute term premia estimates in this study.
More specifically, we use models proposed by Joslin et al. (2011) and Adrian et al. (2013), henceforth referred to as JSZ and ACM. In addition, we estimate the BR model proposed by Bauer and Rudebusch (2016). ACM and JSZ have gained popularity, partly because they developed estimation procedures that resolve the maximum-likelihood-related problems associated with traditional affine models.7 The BR addresses some of the theoretical shortcomings of JSZ, serves as an appropriate complement model for the purpose of this paper and alleviates the model dependency of term premium associated with term premia estimates (Cohen et al. 2018).
As is common in the literature, see, for instance, Wright (2011), pp. 1520–21, we compute the the term premium as the difference between the physical and risk-neutral expectation of the short rate.
Section 3.2.1 gives a brief introduction to affine term structure models (ATSM). In Section 3.2.2, we introduce the models applied. In Section 3.2.3, we describe our estimation of the different models and, more specifically, the corresponding term premia estimates.

3.2.1. Affine Term Structure Models

Let P t ( n ) denote the price at time t of an n-period zero-coupon bond; let y t ( n ) = l o g ( P t ( n ) ) / n denote its yield; let M t + 1 be the nominal pricing kernel; and let Π be the vector of cash flows. The price of the bond must be P t ( n ) = E t ( Π j = 1 n M t + j ) . ATSMs produces solutions for P t ( n ) and can be used to decompose yields into short-rate expectations and term premia.
Gaussian affine term structure models (GATSM) have been widely favored by academics, central bankers and practitioners due to their analytical tractability. The first discrete-time GATSM appears in a seminal contribution by Ang and Piazzesi (2003). One theoretical shortcoming of GATSMs is their ability to produce substantial probabilities of negative future short rates and, consequently, produce inaccurate forecasts of short rates and term premia when the short rate is bounded from below. Prior to the global financial crisis, this was not considered a significant issue given the historical level of interest rates. Subsequently, short rates across the globe have declined towards zero and, in some currencies, also below zero.
Shadow-rate term structure models (SRTSMs) address the lack of an appropriate non-negativity restriction in GATSMs and account for the substantial asymmetry in the distribution of future short rates during periods of near-zero policy rates. SRTSMs are based on the shadow-rate concept introduced in Black (1995). Black interpreted observed interest rates as call options having zero strike on shadow rates, which can take any real number as value. Shadow-rate models are closely similar to their Gaussian counterparts, except that the affine short-rate equation is replaced by a shadow-rate specification: r t = m a x ( s t , r m i n ) . Hence, the distribution of the short-rate r t is truncated from the shadow-rate distribution s t and bounded by r m i n . Black (1995) argued that investors always have the option to hold physical currency and assumed a zero lower bound (ZLB) on the short rate. In reality, there are storage costs and constraints related to holding physical currency, and subzero interest rates are observed in several currencies, not only for short-term interest rates but also for longer maturities.8 The lower-bound restriction can be relaxed and need not be set to zero. In addition to accounting for the zero lower bound, a key advantage of shadow-rate models is that away from the ZLB they behave exactly as the corresponding Gaussian models. Furthermore, the probability of a zero future short rate is nonzero in shadow-rate models. This enables this class of models to represent the stickiness property of ZLB interest rates, which results from the highly asymmetric distribution around the expected short-rate path at the ZLB.

3.2.2. Econometric Framework

The JSZ, ACM and BR have some common features, which we outline in the following.
The risk factors X t are stationary and follow mean-reverting processes. The vector of K risk factors follows a first-order Gaussian vector autoregression (VAR):
X t + 1 = μ + ϕ X t + Σ ϵ t + 1 ,
where ϵ t + 1 ( 0 , I N ) , and Σ is lower triangular. The risk factors X t are a set of K demeaned and normalized principal components of yields. The short-term interest rate r t , is a function of the risk factors. For the Gaussian models, to which ACM and JSZ belong, the short-rate equation is
r t = δ 0 + δ 1 X t
In the BR, the short-rate Equation (3) is replaced by a shadow-rate specification:
r t = m a x ( s t , r m i n ) , s t = δ 0 + δ 1 X t .
The shadow short rate in the BR, s t , is modeled as affine Gaussian, as is the short rate in ACM and JSZ. Equation (4) ensures that the short rate and all other model-implied interest rates cannot go below r m i n .
The models assume that the stochastic discount factor M t that prices all assets under the absence of arbitrage exists and is of the essentially affine form Duffee (2002):
log ( M t + 1 ) = r t + 1 2 λ t λ t + λ t ϵ t + 1 ,
where the K-dimensional vector of risk prices λ t is affine in the risk factors
λ t = λ 0 + λ 1 X t .
As a consequence of these assumptions, the price P t ( n ) at time t of an n-period zero-coupon bond is an exponentially affine function of the risk factors:
P t n = exp A n , + B n X t ,
with loadings A n = A n μ , ϕ , δ 0 , δ 1 , Σ , λ 0 and B n = B n ϕ , δ 1 , λ 1 that follow the recursions
A n + 1 = δ 0 + A n + ( μ Σ λ 0 ) B n + 1 2 B n Σ Σ B n
B n + 1 = ( ϕ Σ λ 1 ) B n δ 1 ,
with starting values A 0 = 0 and B 0 = 0 . The recursions in (8) and (9) are the standard linear difference equations for affine term structure models with homoskedastic shocks (Dai and Singleton 2003).9
The bond prices in (7)–(9) are the same as if agents were risk-neutral ( λ 0 = λ 1 = 0 ), but the risk factors followed an alternative law of motion:
X t + 1 = μ Q + ϕ Q X t + Σ ϵ t + 1 Q ,
where
μ Q = μ Σ λ 0 , ϕ Q = ϕ Σ λ 1 .
Equations (3) and (10) are known as the physical and risk-neutral representations of the law of motion for the risk factors, respectively.10 Equation (10) reflects the Expectations Hypothesis (EH), which states that bond yields are expected values of future short rates. Under this hypothesis, the data-generating probability measure differs from the risk-neutral probability measure, whereas under the less realistic Local Expectations Hypothesis (LEH), which is not assumed here, the two probability measures coincide.

3.2.3. Estimation Strategy

Our NOK IRS premia estimates are based on monthly zero-coupon yields (see Section 3.1 for further details).
Common to JSZ, ACM and BR is that the risk factors X t are K demeaned and normalized principal components of yields.11 ACM uses K = 5 , whereas JSZ and BR use K = 3 . Thus, we begin the estimation procedure by performing a principal component analysis (PCA) of zero-coupon yields. We then proceed by estimating each model as described in the following sections. Finally, term premia are computed as the difference between the physical and risk-neutral short-rate expectations for the different models.
ACM: Adrian et al. (2013) derive an expression for continuously compounded arbitrage-free excess holding period returns r x t + 1 ( n 1 ) . The log excess holding return of a bond maturing in n periods is defined as
r x t + 1 ( n 1 ) = ln P t + 1 n 1 ln P t n r t .
To estimate our ACM model, we follow the three-step series of linear regressions proposed by Adrian et al. (2013). The first step is to estimate Equation (2) via OLS, which decomposes X t into a predictable component and an estimate of the innovation. The second step is a time series regression, where excess returns are regressed on a constant, lagged pricing factors and the estimated shock components collected from the first step. In the third step, the price of risk parameters λ 0 and λ 1 are estimated via cross-sectional regression.
JSZ: Joslin et al. (2011) develop a novel canonical no-arbitrage Gaussian DTSM in which the risk factors can be any observable linear combinations of yields.12 We use the first three principal components as risk factors in our JSZ specification. Joslin et al. (2011) propose a two-step procedure, in which physical and risk-neutral parameters can be estimated separately. Since the physical parameters in (2) follow an unconstrained vector autoregressive form, they can be consistently estimated by ordinary least squares in step 1. Joslin et al. (2011) propose an algorithm to estimate the risk-neutral parameters in (11) by maximum likelihood in step 2.
BR: The shadow-rate DTSM proposed by Bauer and Rudebusch (2016) is closely related to Joslin et al. (2011), except that the affine short-rate Equation (2) is replaced by the shadow-rate specification in Equation (4). We set r m i n = 0 , as originally proposed by Black (1995). Furthermore, although the policy rate was set equal to zero by Norges Bank for the first time in 2020, the rate is yet to be set below zero.
Equation (4) introduces nonlinearity into the BR model. A shadow-rate model does not lead to closed-form solutions for bond prices so that the need arises for approximate solution methods. When estimating our BR model, we adapt the fast and accurate method proposed by Priebsch (2013) for discrete time, in combination with the extended Kalman filter.

4. Results and Discussion

Our model estimations provide a tight fit to actual swap rates. Root Mean Squared Errors (RMSE), reported in Table 2, are in line with the empirical literature.13

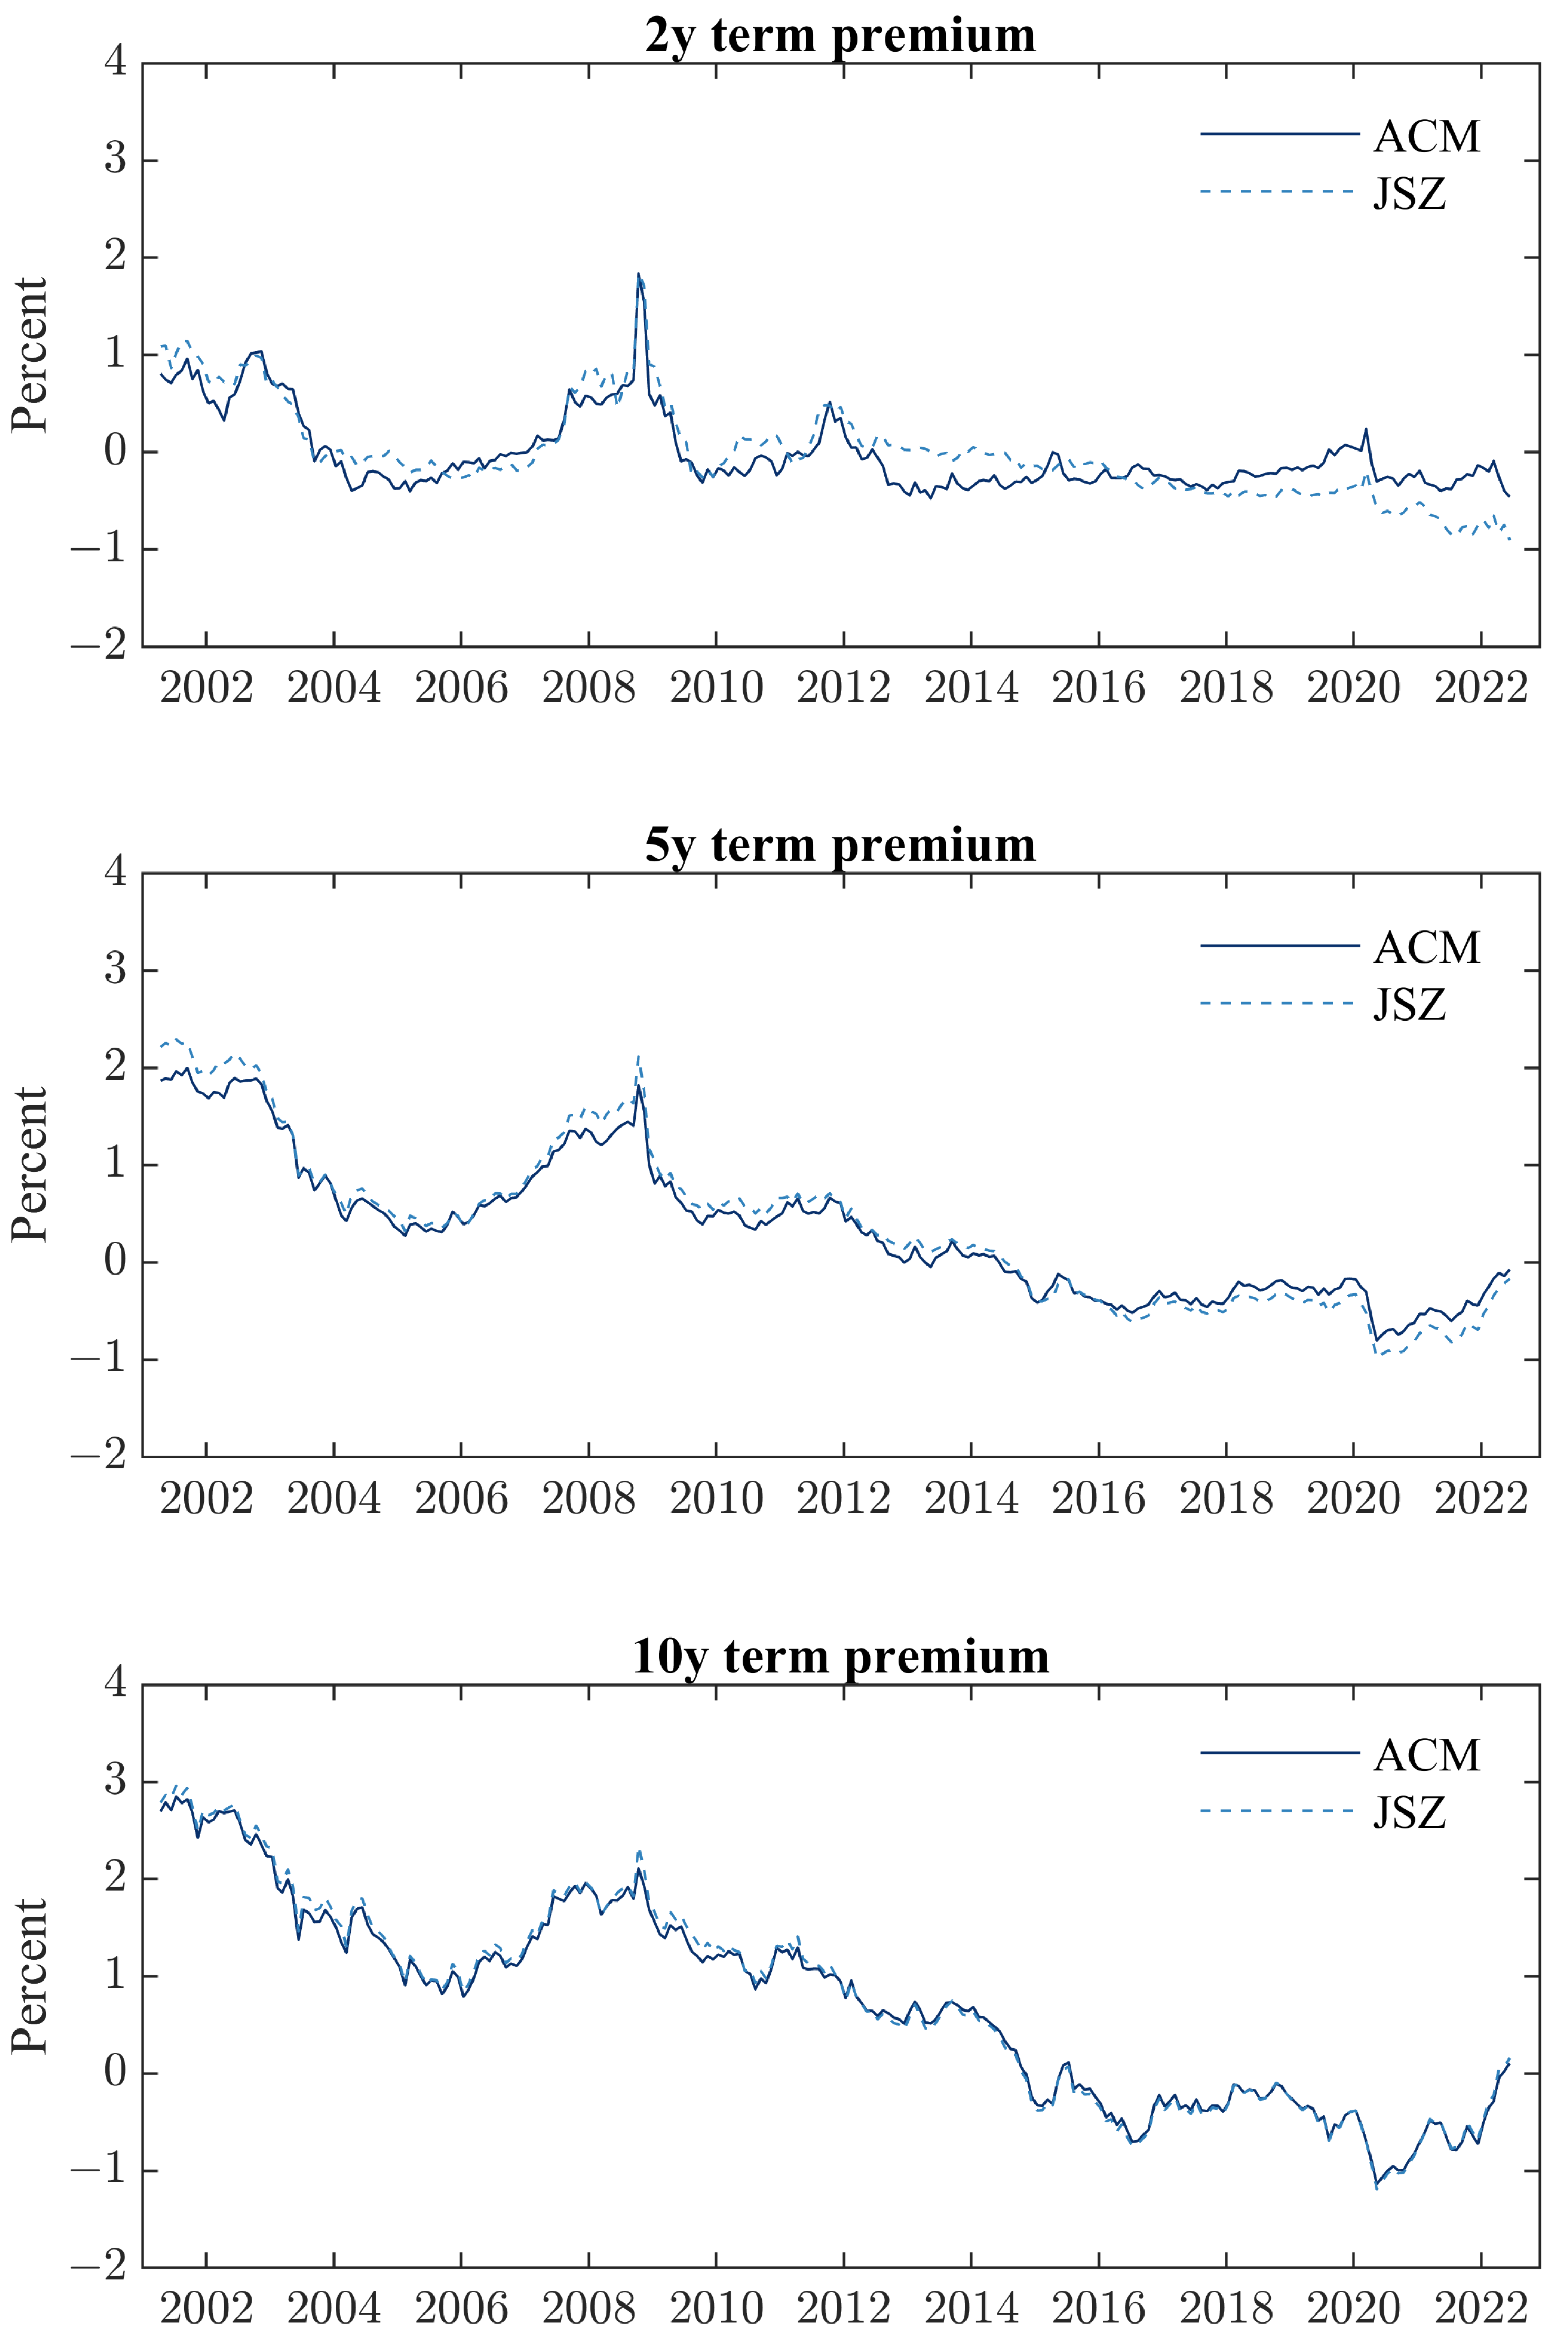
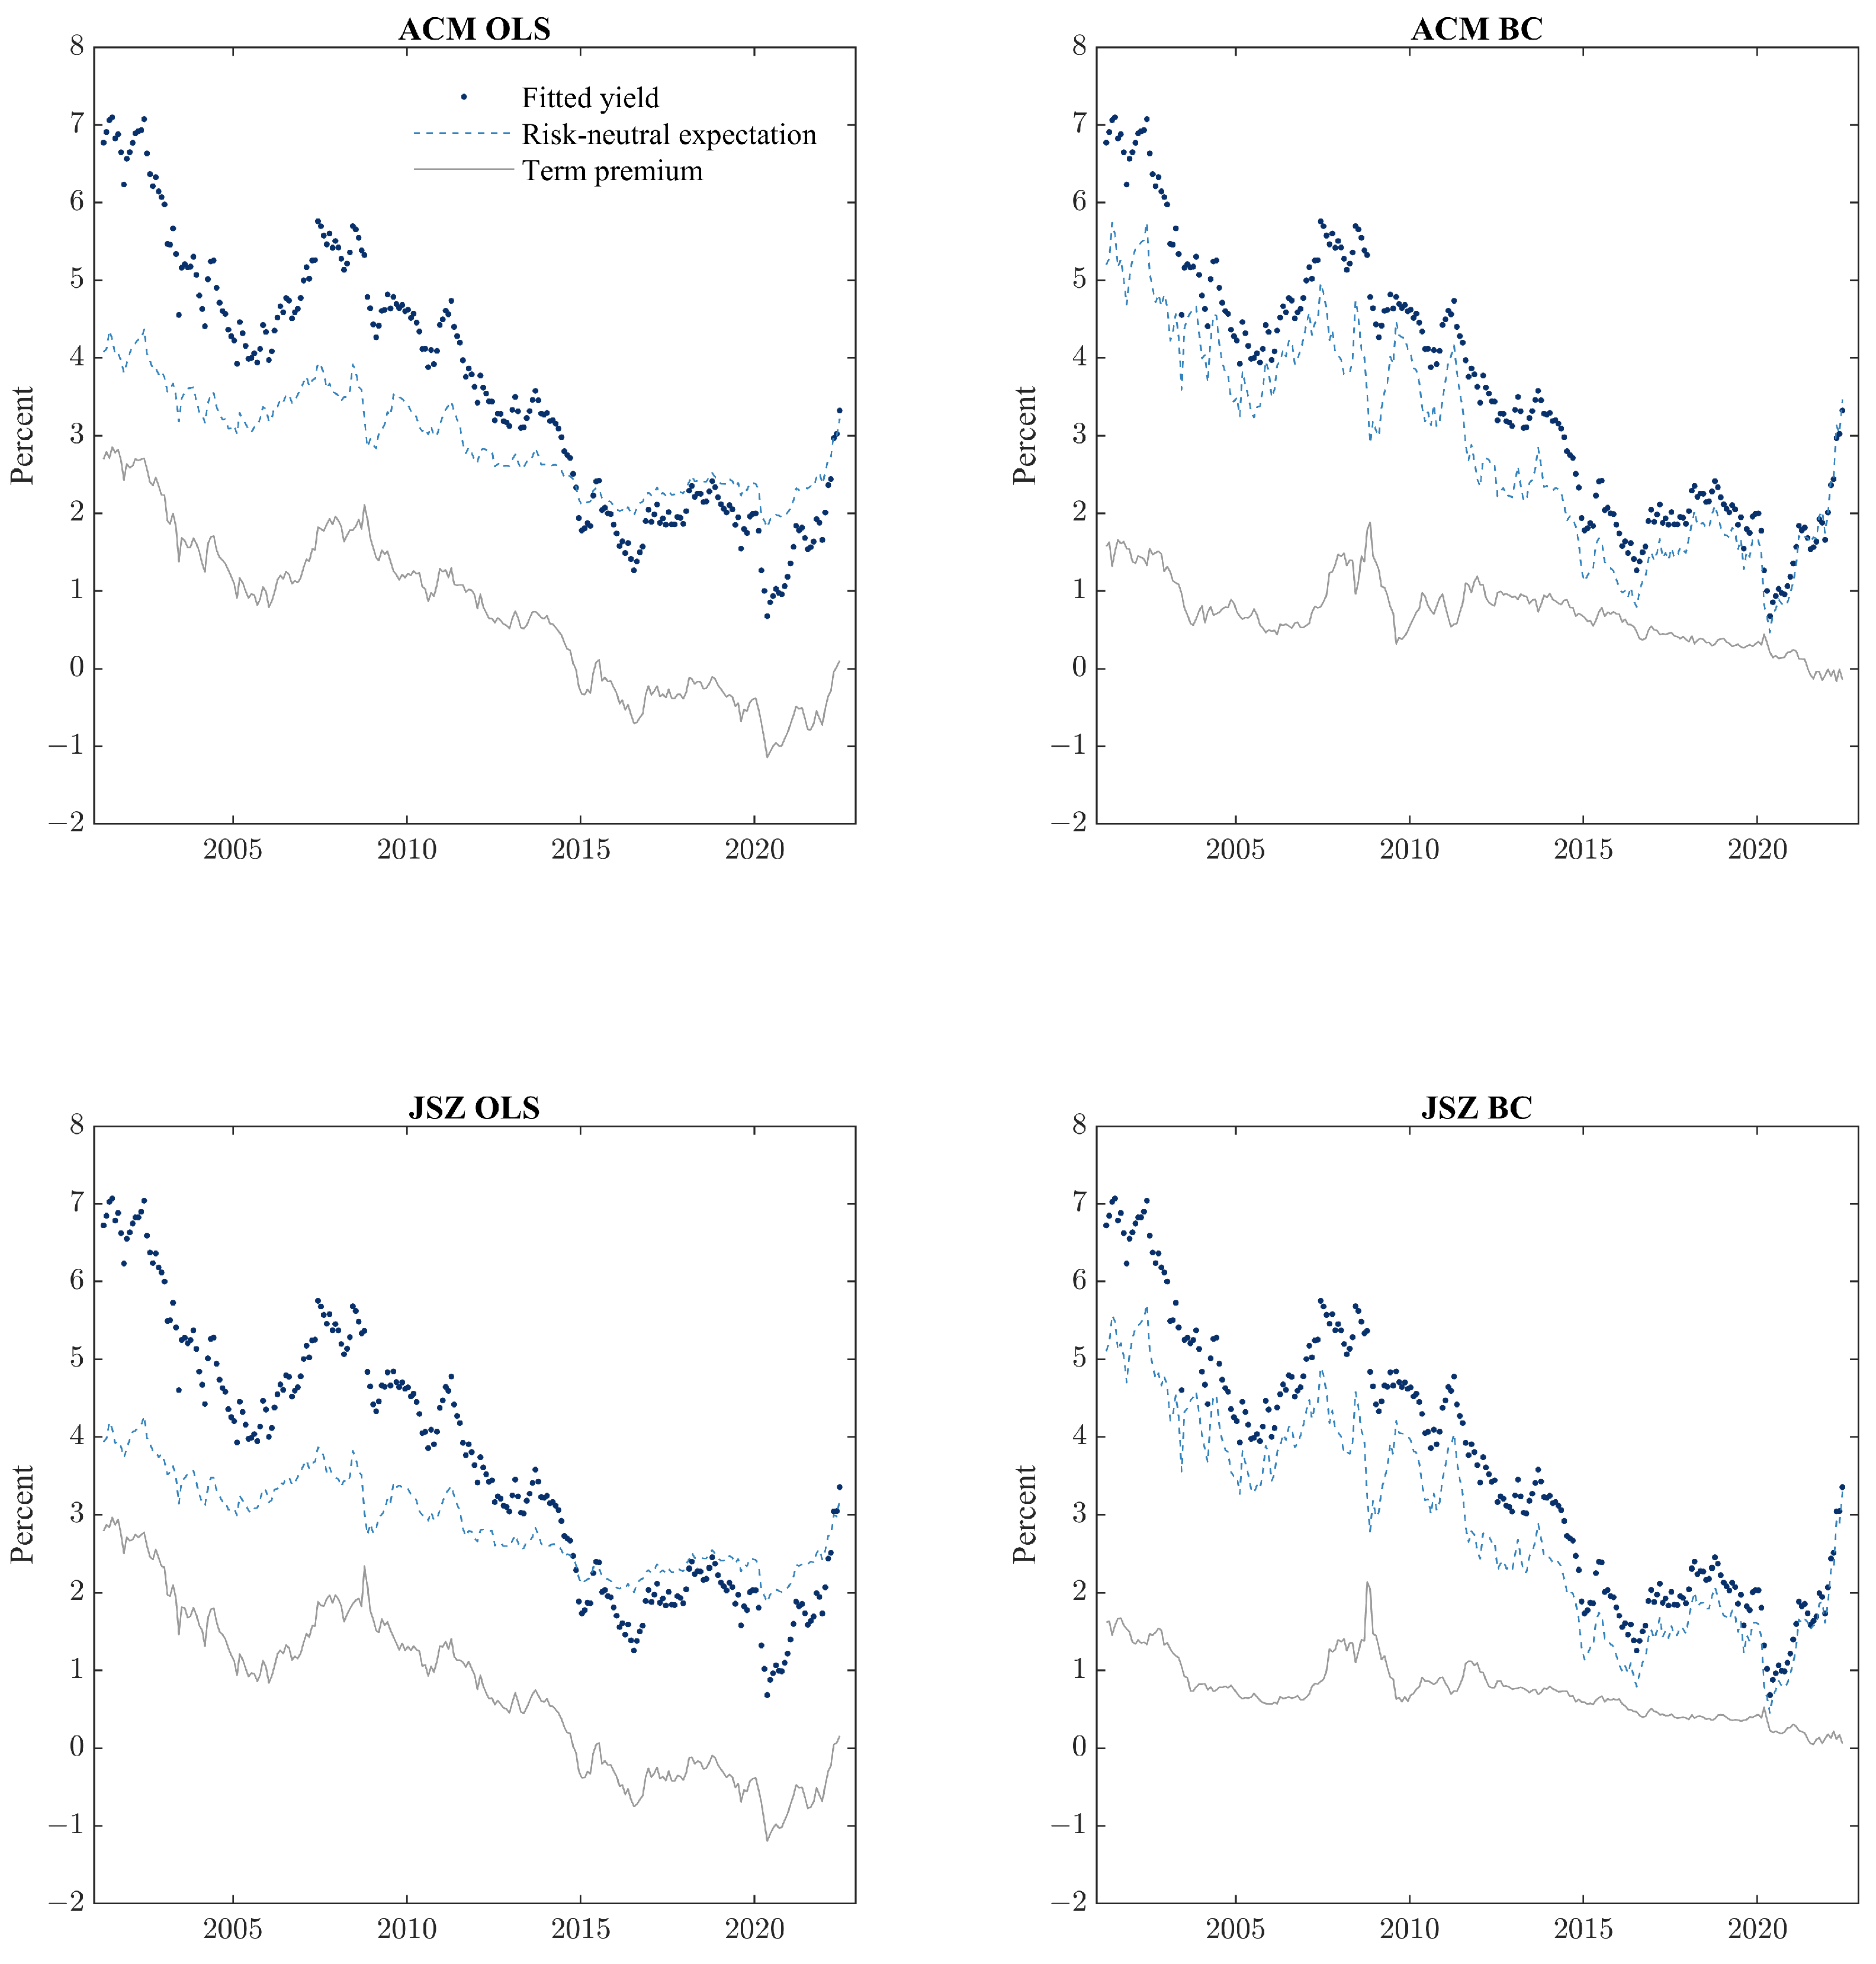
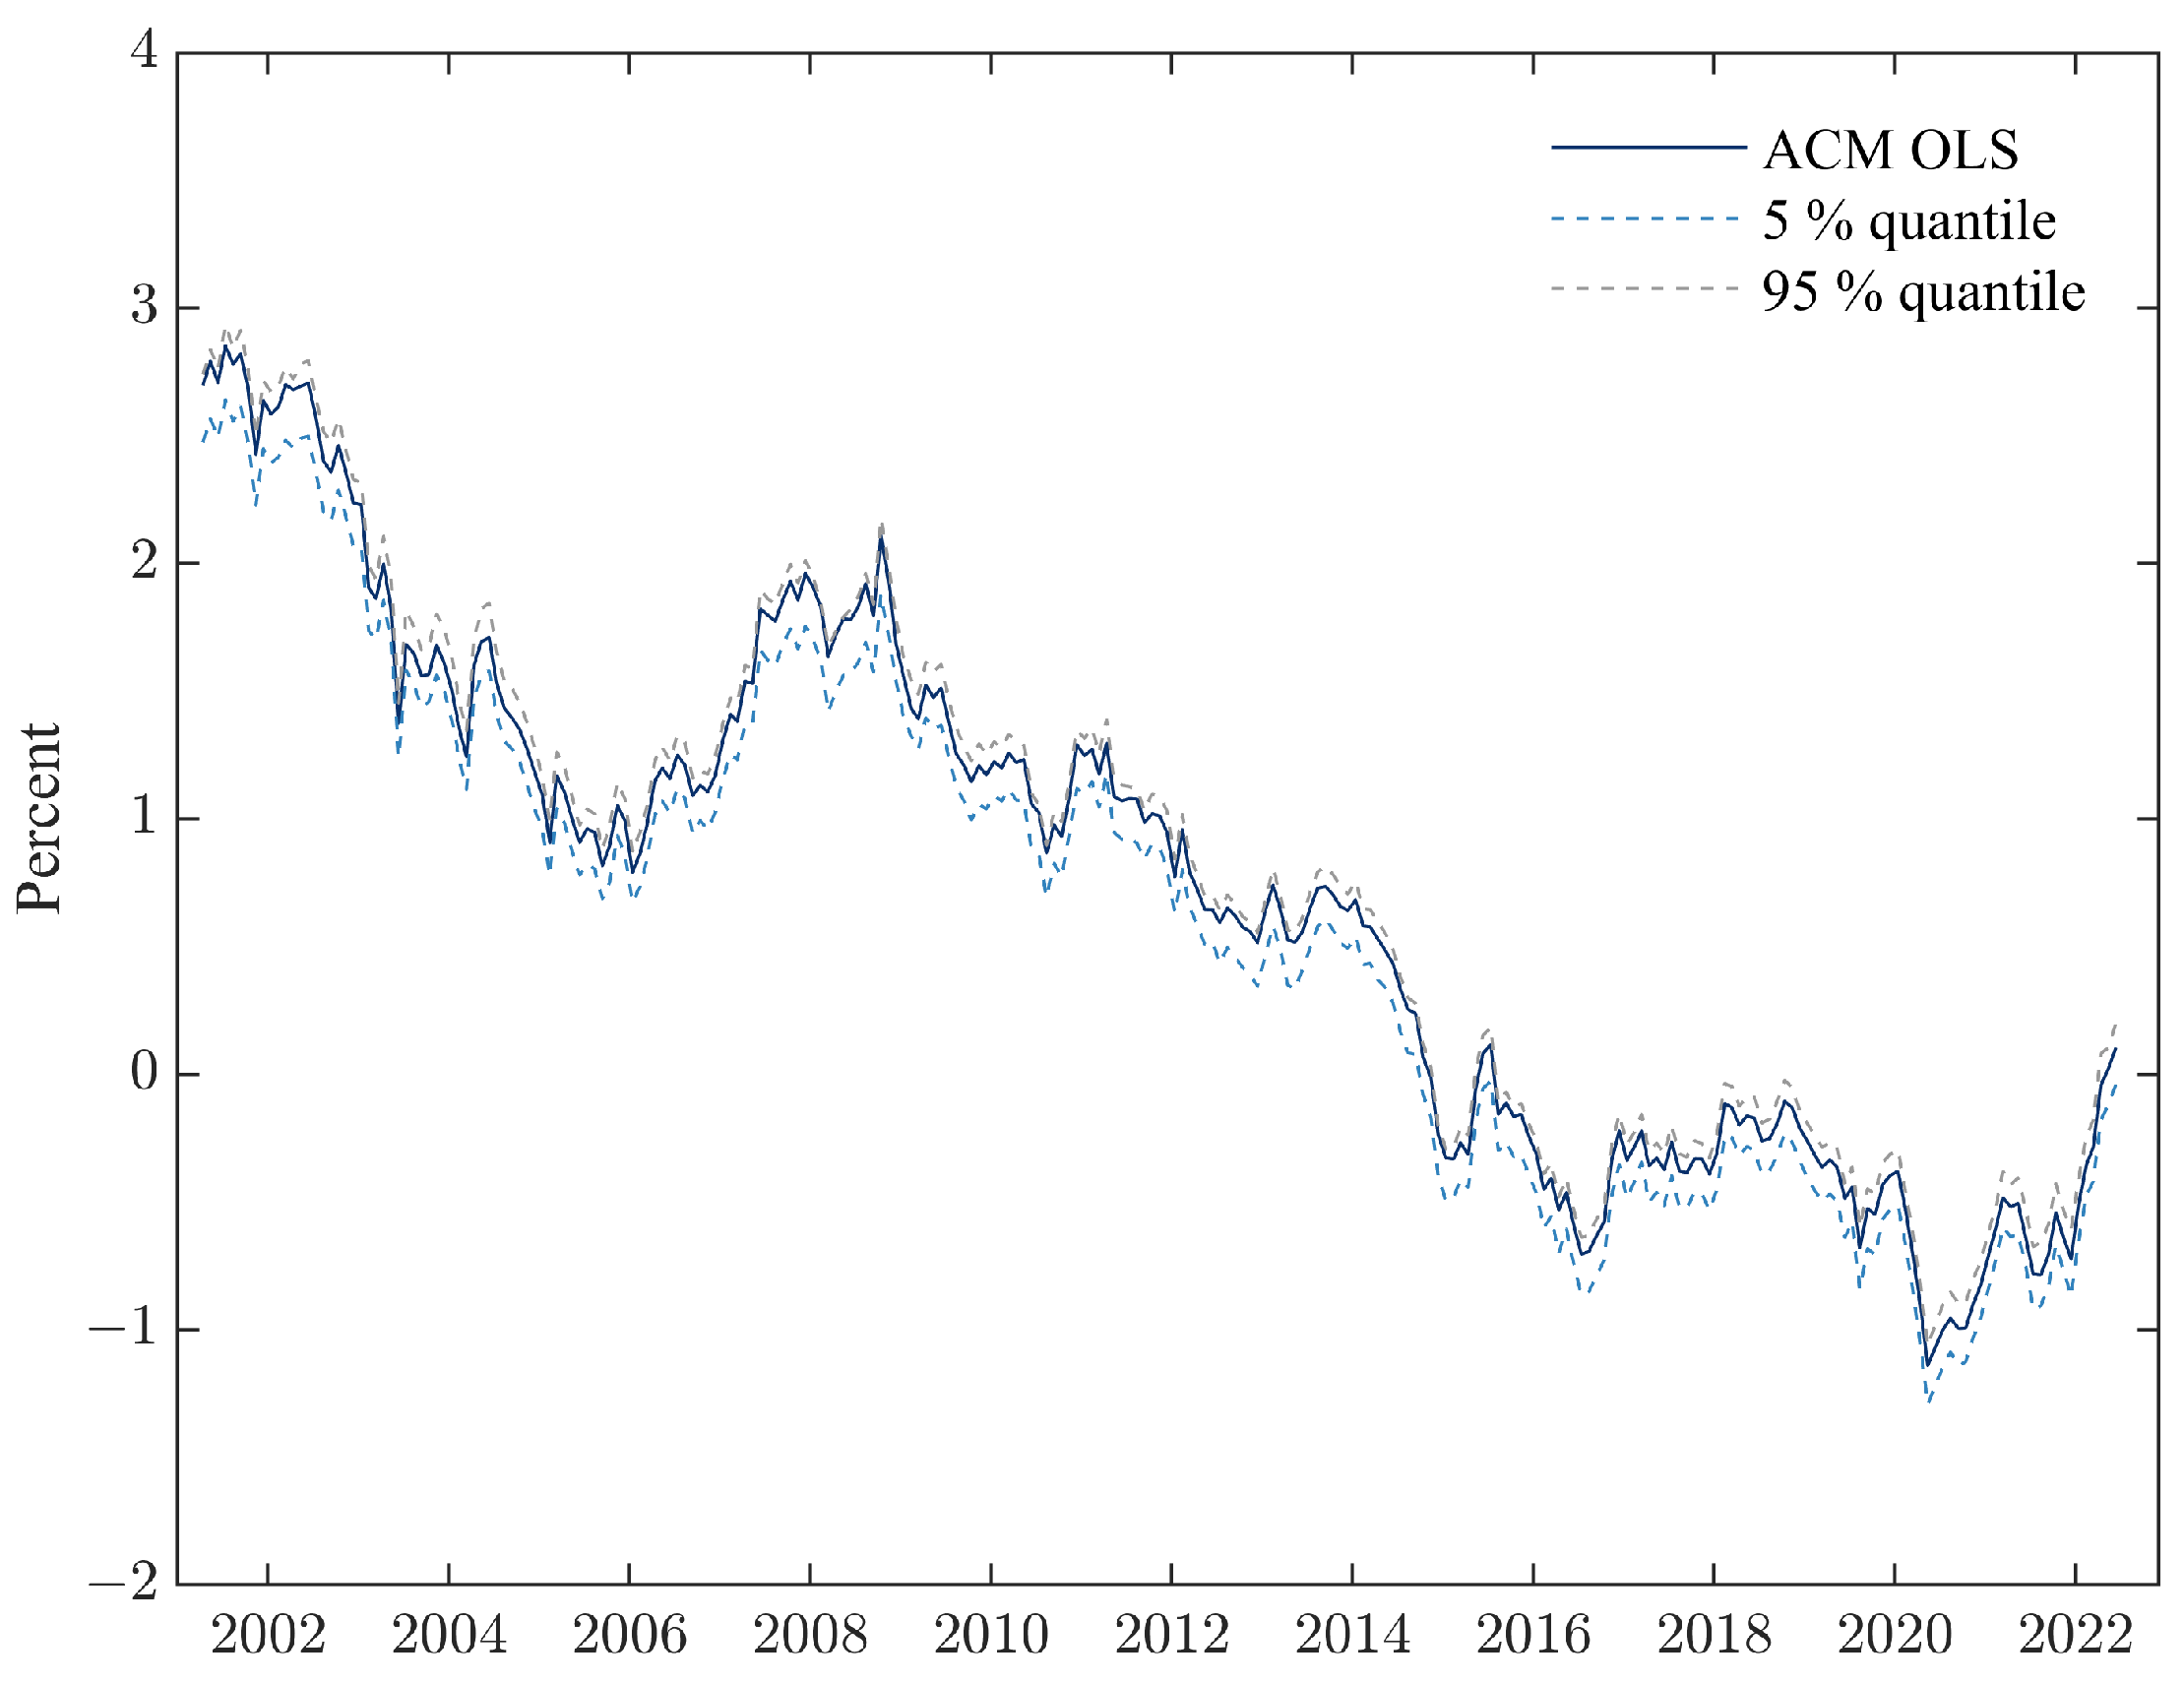
4.1. Term Premium Estimates

As experienced by most other developed countries, NOK interest rate swap rates declined over the sample period. Figure 2 shows that the model set agrees on a substantial decline in term premia across the maturity spectrum.
Declining NOK IRS term premia is consistent with the literature. According to Wright (2011), term premia in government bond yields have declined internationally since the 1990s, especially in countries that reduced inflation uncertainty by making substantial changes in their monetary policy frameworks. This might well be a plausible explanation for a decline in NOK IRS term premia, since inflation has generally been low and stable following Norges Bank adaption of the inflation targeting regime in the early 2000s. Based on international interest rate swap data, Jotikasthira et al. (2015) find that world inflation and the U.S. yield level together explain over two-thirds of the covariance of global yields, and that these effects operate largely through the term premium channel. In light of these findings, and the fact that Norway is a small, open economy likely to be impacted by international risk factors, a decline in term premia appears to be reasonable.
From Figure 2, it is evident that the behavior of short-term term premia differs from that of long-term term premia. The 2 y term premium has been relatively stable and close to zero. A notable exception is during the GFC, where the 2 y term premium temporarily spiked. As the crisis emerged, liquidity in interbank funding markets dried up due to significant increase in margin calls and lack of transparency with respect to the distribution of risk exposure among major investment banks. Simultaneously, federal authorities reinforced long-term support of the global banking system. In light of this, the increase in short-term premia can be interpreted as a liquidity risk premium. Long-term term premia were less impacted, as market participants took comfort in official statements of financial system support.
Trends and rapid changes in term premia can be related to important economic events, both global and domestic. Like Jotikasthira et al. (2015), Dahlquist and Hasseltoft (2013) note the importance of U.S. interest rate risk and global business cycles in driving global yields, with increasing correlations between international bond risk premia over time. From the beginning of the century and up until the GFC, the Norwegian economy experienced strong growth and rising asset prices—which is consistent with a decline in long-term term premia. The GFC, commencing late 2007, induced uncertainty about future growth prospects and higher term premia. Following the GFC, a number of major central banks undertook unconventional monetary policy initiatives, such as large-scale asset purchase programs. Through this channel, the term premium is likely to fall for securities purchased within these programs, and second-order effects might include falling term premia in other markets, such as interest rate swaps. NOK IRS term premia estimates surged following the Euro area sovereign debt crisis in 2012 and the 2013 taper tantrum14, which is consistent with declining global risk appetite as the outlook for U.S. monetary policy became less certain. In 2014, interest rates started to fall both in EUR and NOK, largely due to the market’s anticipation of the ECB’s asset-buying Public Sector Purchase Program (PSPP) and its subsequent implementation (from early 2015). This is a plausible explanation for the sharp decline in estimated NOK IRS term premia during 2014. The sharp increase in November 2016 coincides with a broad-based sell off in fixed-income assets globally following the U.S. election. As foreign debt issuers and global banks are active participants in the NOK IRS market, such changes in global market sentiments are likely to impact NOK swap rates. From 2018 to 2020, market volatility has been low across most asset classes, consistent with stable NOK IRS term premia. Following the COVID-19 outbreak in March 2020, central banks across the globe took extraordinary monetary policy measures, among them Norges Bank, which set the policy rate to zero. This led to an immediate drop in term premia to subzero levels. Since then, the real economy has recovered faster than initially feared by the market, leading to a gradual reversal of term premia. More recently, high and unanticipated global inflation has emerged as a threat to economic growth. Prospects for future inflation are uncertain, and measurement errors appear to be present. Uncertainty concerning future growth and inflation has previously been documented as drivers of term premia (d’Amico et al. 2018; Rudebusch et al. 2006; Wright 2011) and are plausible explanations of the sharp increase in term premia estimates towards the end of the sample.
The term premium can be interpreted as a risk premium required by risk-averse investors to carry risk related to the future path of short-term interest rates. Post 2015, the model set shows negative NOK IRS term premia estimates that might appear puzzling if viewed from the perspective of a risk-averse investor. However, with consideration also given to other effects influencing the term premium, such as large-scale asset purchases (D’Amico et al. 2014; Moessner 2018) and global spillover effects (Byrne et al. 2019; Dahlquist and Hasseltoft 2013; Jotikasthira et al. 2015; Mönch 2019), negative term premia in NOK IRS are entirely plausible.
Figure 3 compares our ACM estimates of the 10 y NOK IRS term premium with estimates of the U.S. Treasuries 10 y term premium, as reported by the Federal Reserve Bank of New York. Although the series are not directly comparable for different reasons, most notably since interest rate swaps are derivatives and Treasury bonds are funding instruments, the comparison still serves as a means to consider the reasonability of our NOK IRS estimates. The series display similar trends, albeit the U.S. term premia are more volatile. The linear correlation is 0.84, indicating the presence of common underlying risk factors. In levels, estimates generally agree across the sample. The correlation between U.S. term premia and the Bank of America Merrill Lynch MOVE Index, a measure of bond market implied volatility frequently interpreted as a proxy for macro uncertainty, is well-known. The NGB term premium displays a similar pattern. The correlations of MOVE vs. NOK IRS and U.S. estimates are 0.67 and 0.67, respectively. These results of correlated term premia are in line with findings specific for term premia in yields (Jotikasthira et al. 2015; Wright 2011) and for asset risk premia in general (Bollerslev et al. 2018).

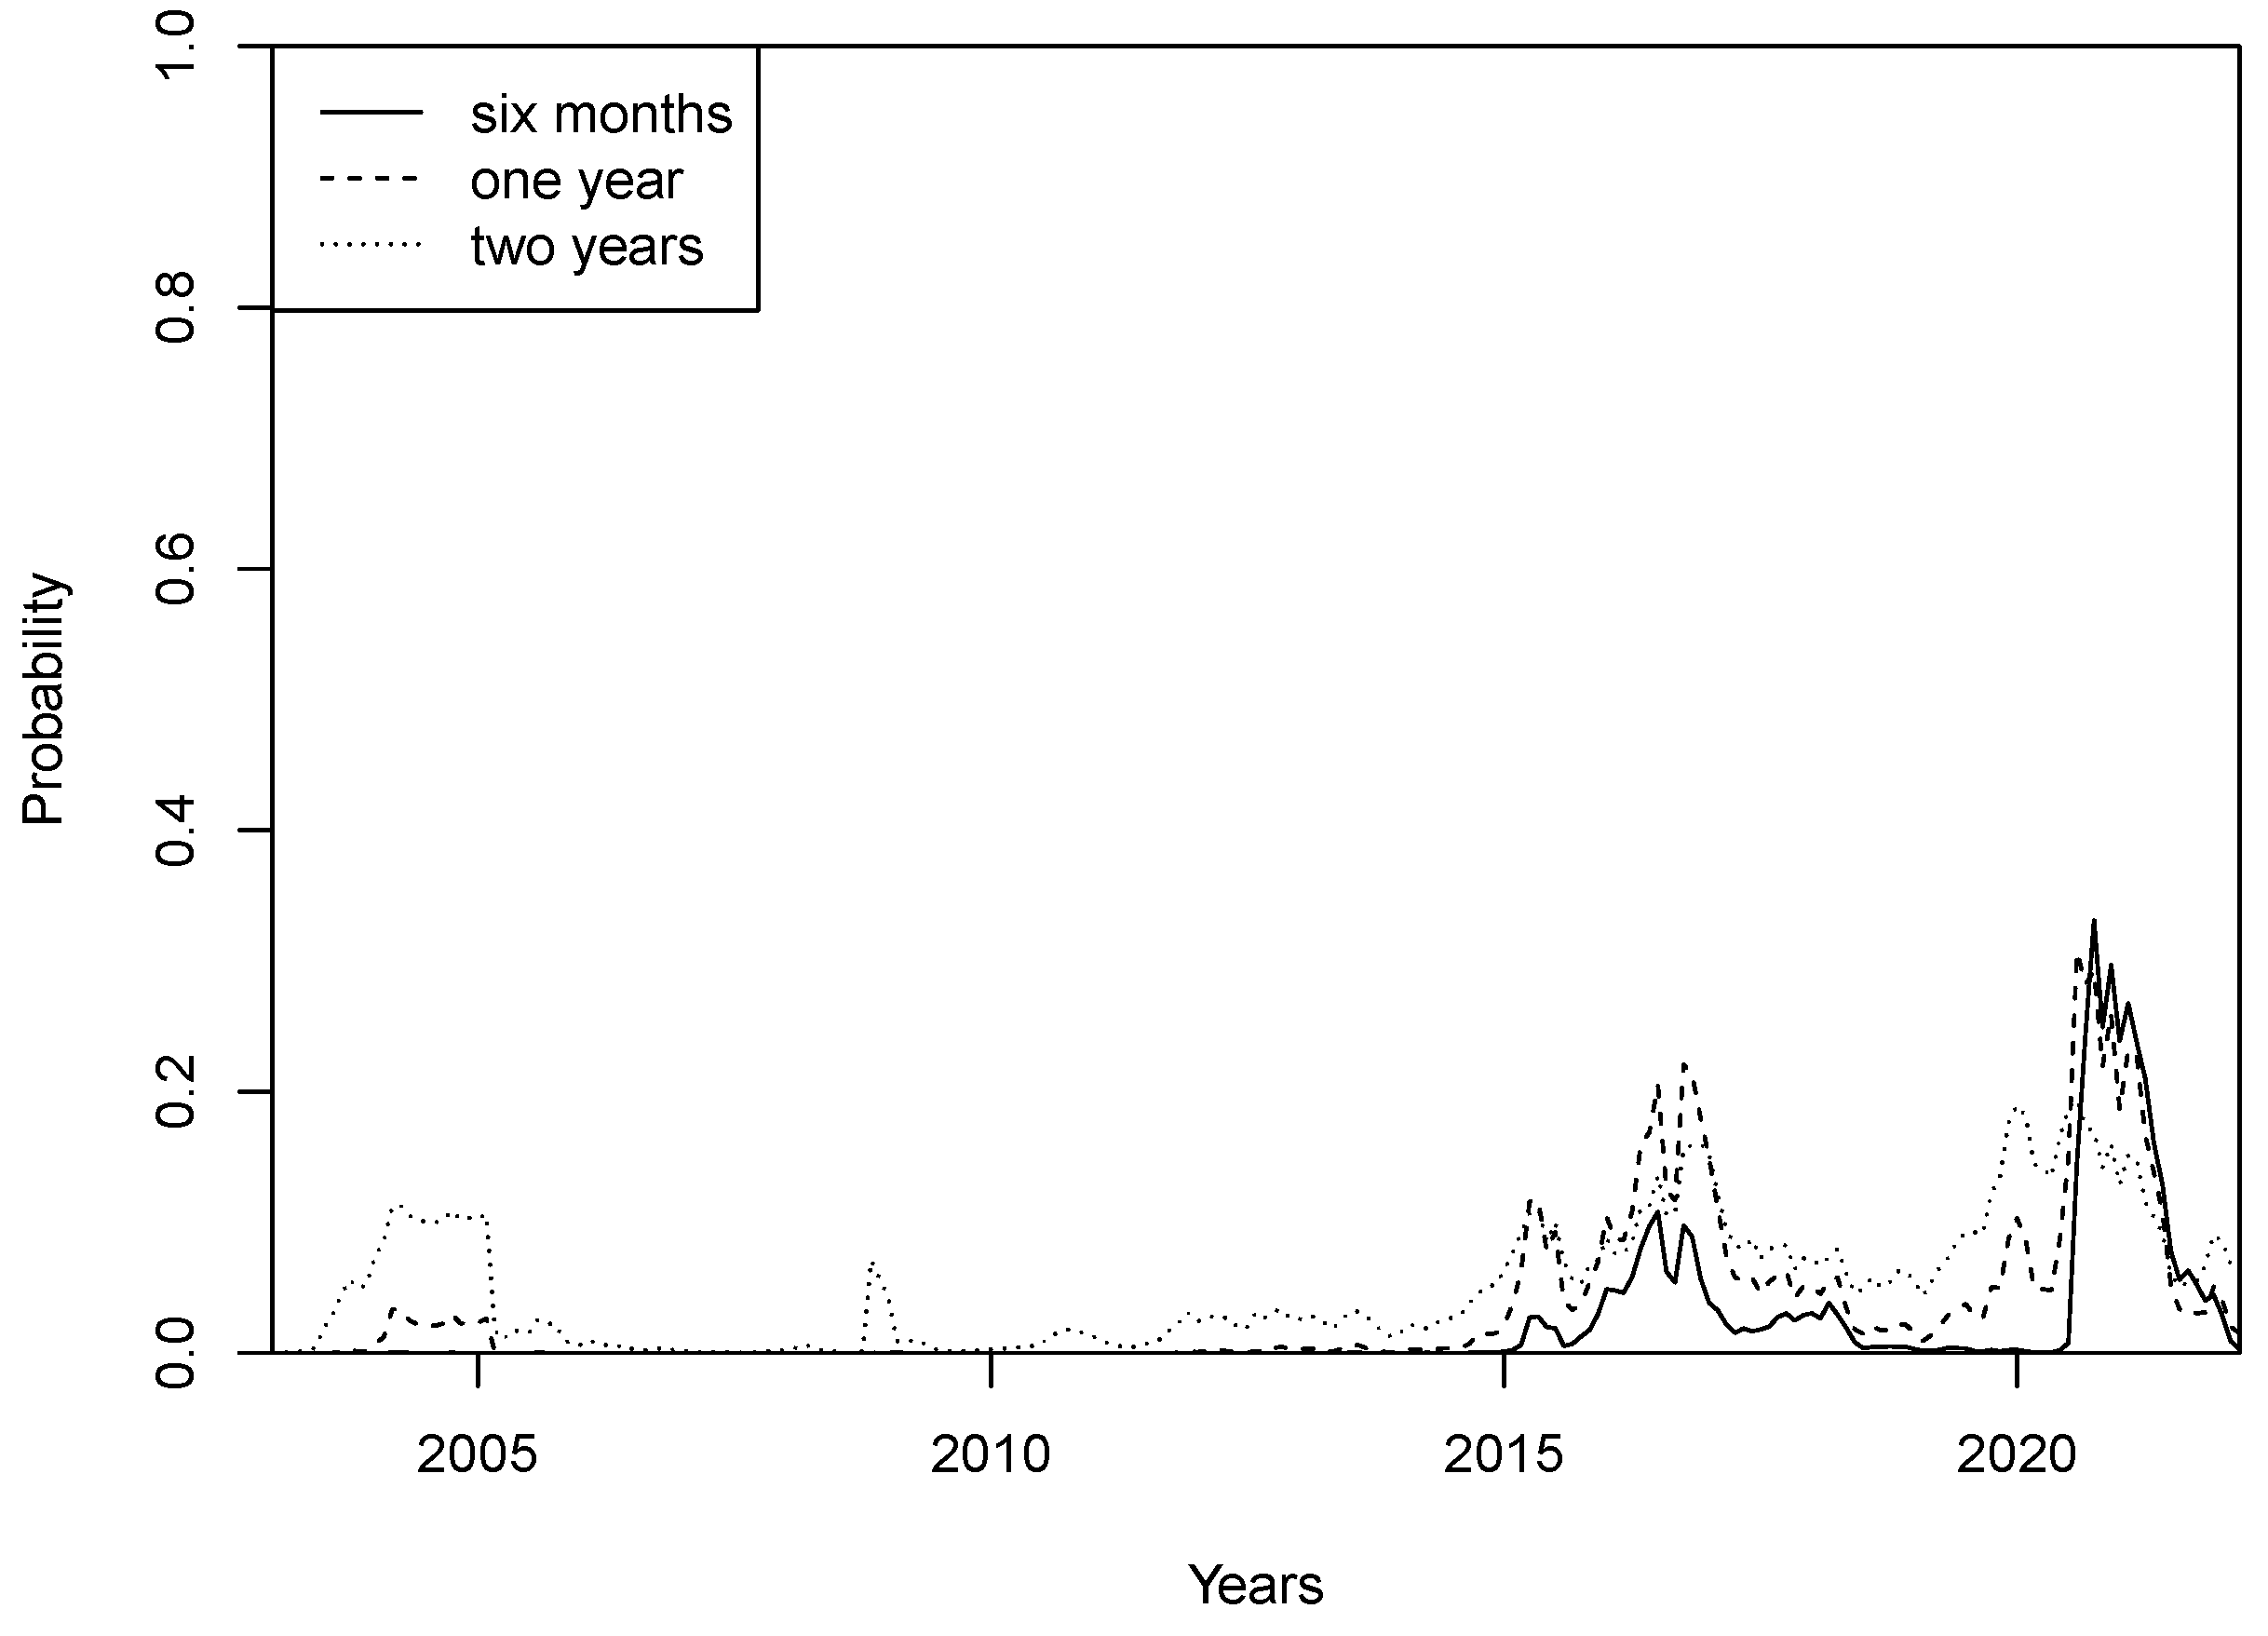
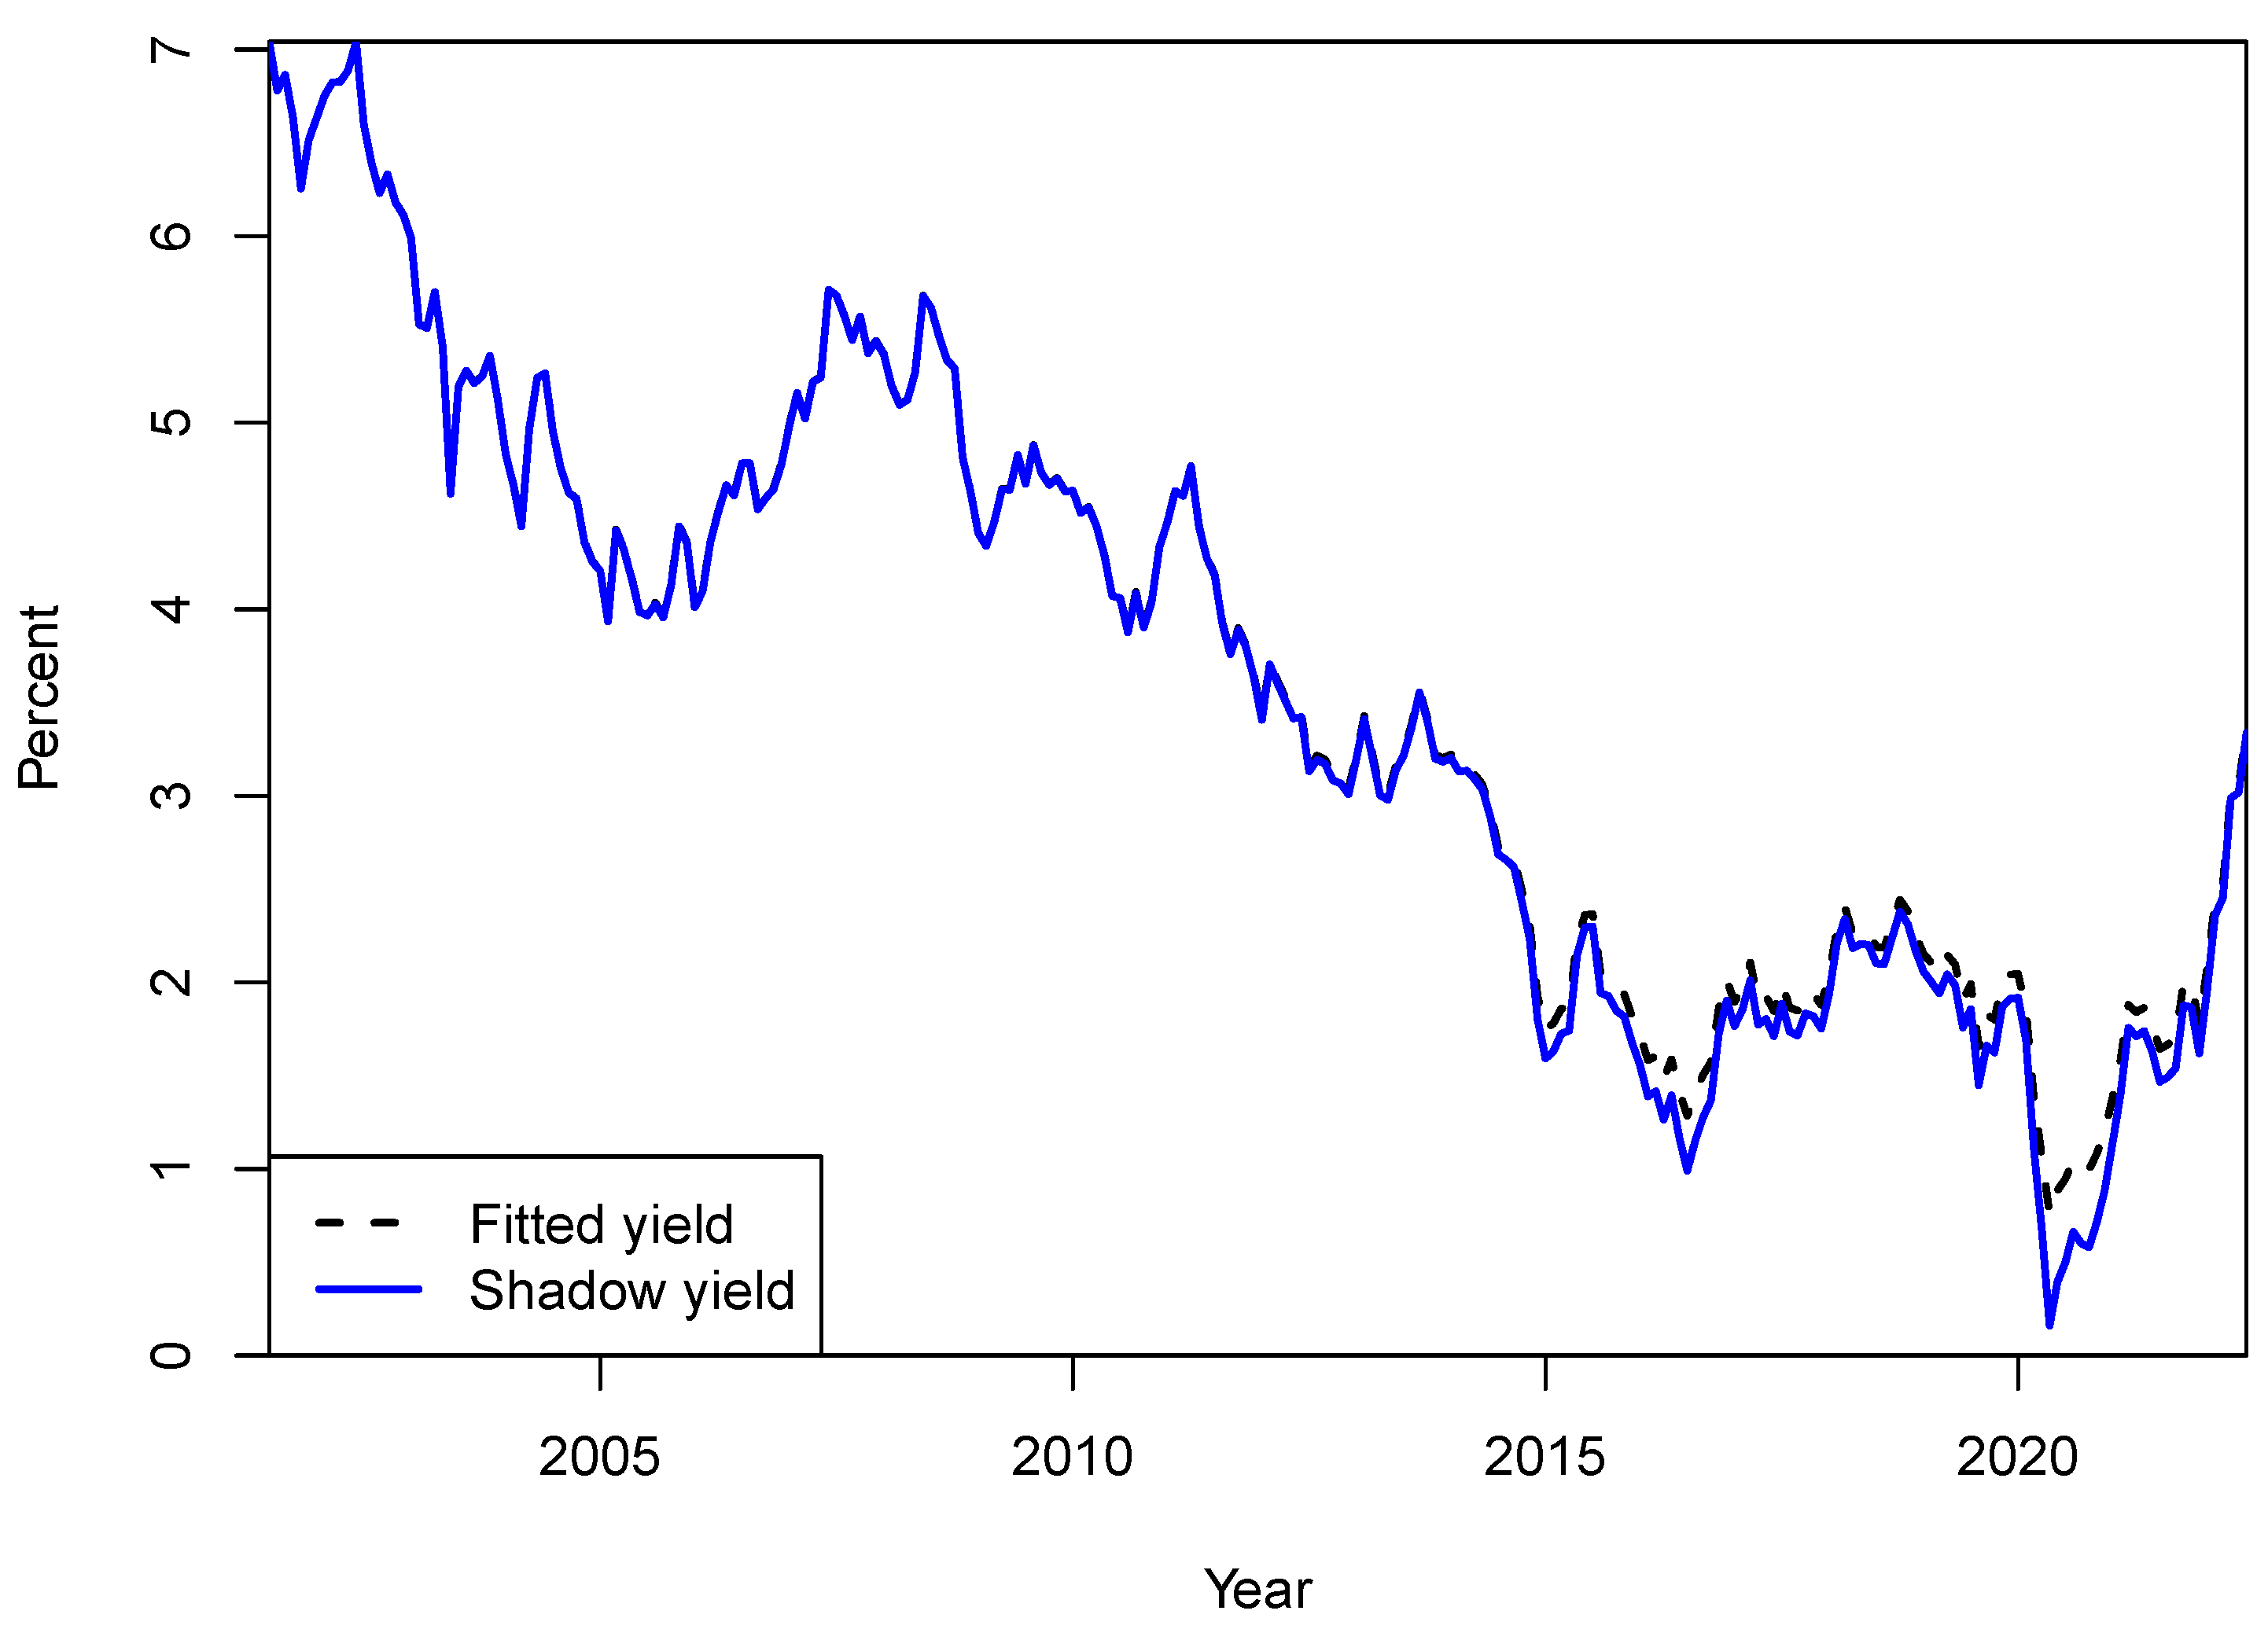
4.2. Impact of the Zero Lower Bound

Gaussian DTSM are not well-suited to represent the dynamics of recent near-zero interest rates, since they do not recognize that in the real world, with currency available as an alternative asset, interest rates are bounded at some level not too far from zero. Shadow-rate DTSMs, on the other hand, respect this lower bound. To assess the relevance of shadow-rate models for term premia, we compare estimates from the Gaussian JSZ with those of the BR—the latter being the ZLB version of the former.
Figure 4 displays the difference in term premium estimates from the JSZ and BR. For all practical purposes, the models produce close to identical term premium estimates. The only exception is a relatively short time period following the COVID-19 outbreak, but even then the difference is of single-digit magnitude.
To analyze the impact of the lower bound in further detail, we compute the model-implied probabilities of negative future short rates in the JSZ. Figure 5 displays these probabilities at 6-month, 1-year and 2-year horizons.
Another approach is to compare fitted yields to estimated shadow yields from the BR. Figure 6 displays fitted yields and shadow yields.
Until 2015, the ZLB does not seem to have been binding in the NGB market, with probabilities of negative future rates close to zero and shadow yields not far from fitted rates. The only subperiod in the sample where BR produces different yield curve dynamics compared with JSZ is a relatively short period subsequent to the COVID-19 outbreak in March 2020. Norges Bank lowered the policy rate to zero, leading to a spike in the difference between fitted yields and shadow yields—referred to as the ZLB wedge. Towards the end of the sample, long-term yields increase—predominantly due to risk of higher inflation—and the ZLB wedge reverts back to pre-COVID-19 levels. In the interim 2015-2020 period, the lower bound seems to have been effective to some extent. However, the ZLB wedge varied in the range of 20 to 40 basis points, which most likely is not sufficient to significantly impact term premia.
So far, we fixed the lower bound of the short rate at zero. The family of ZLB-models—to which BR belongs—are highly sensitive to model specification (Krippner 2015). To investigate the robustness of our term premium estimates, we estimate the BR varying the lower bound from 0 to 25 basis points. Figure 7 shows that shadow-rate estimates are virtually unchanged, apart from the post-COVID-19 period. Even during this period of relatively short duration, the differences in shadow rates are of limited magnitude.
We conclude that the ZLB is of minor importance for the purpose of this study, which is to estimate term premia—as opposed to yields. This is in line with earlier results found by Guimaraes (2014), Malik and Meldrum (2016) and de Lange et al. (2022).

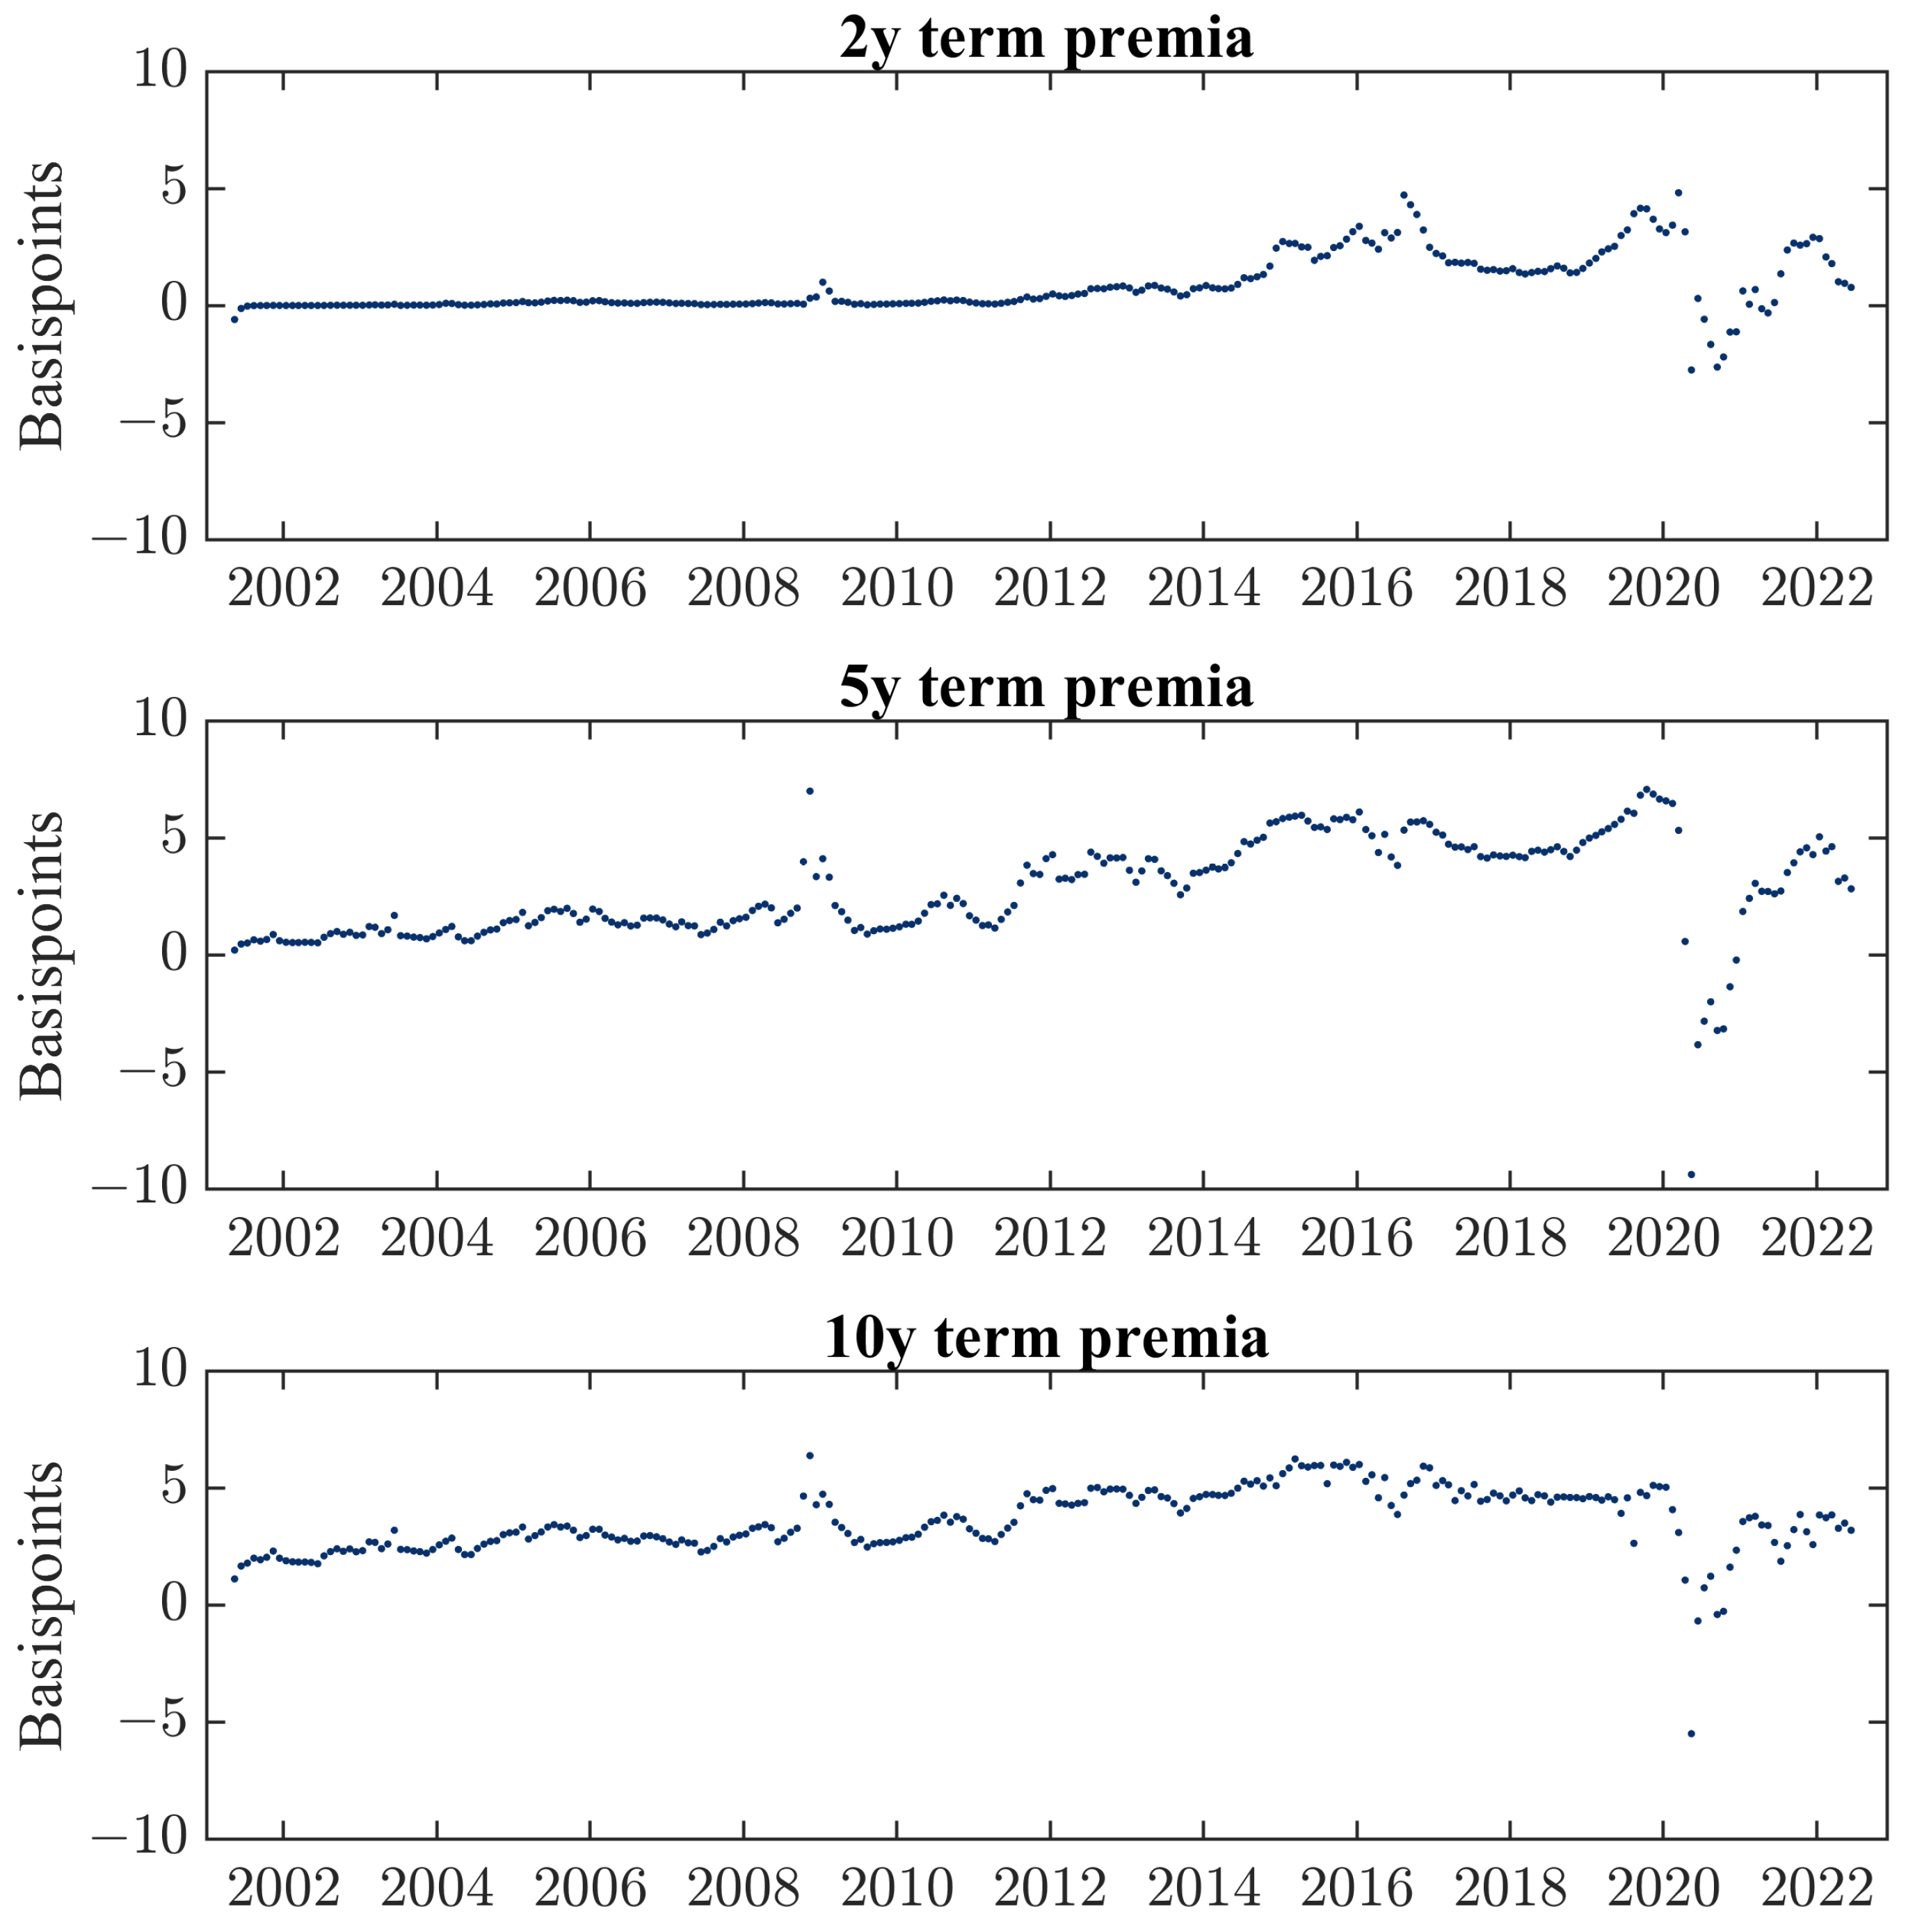
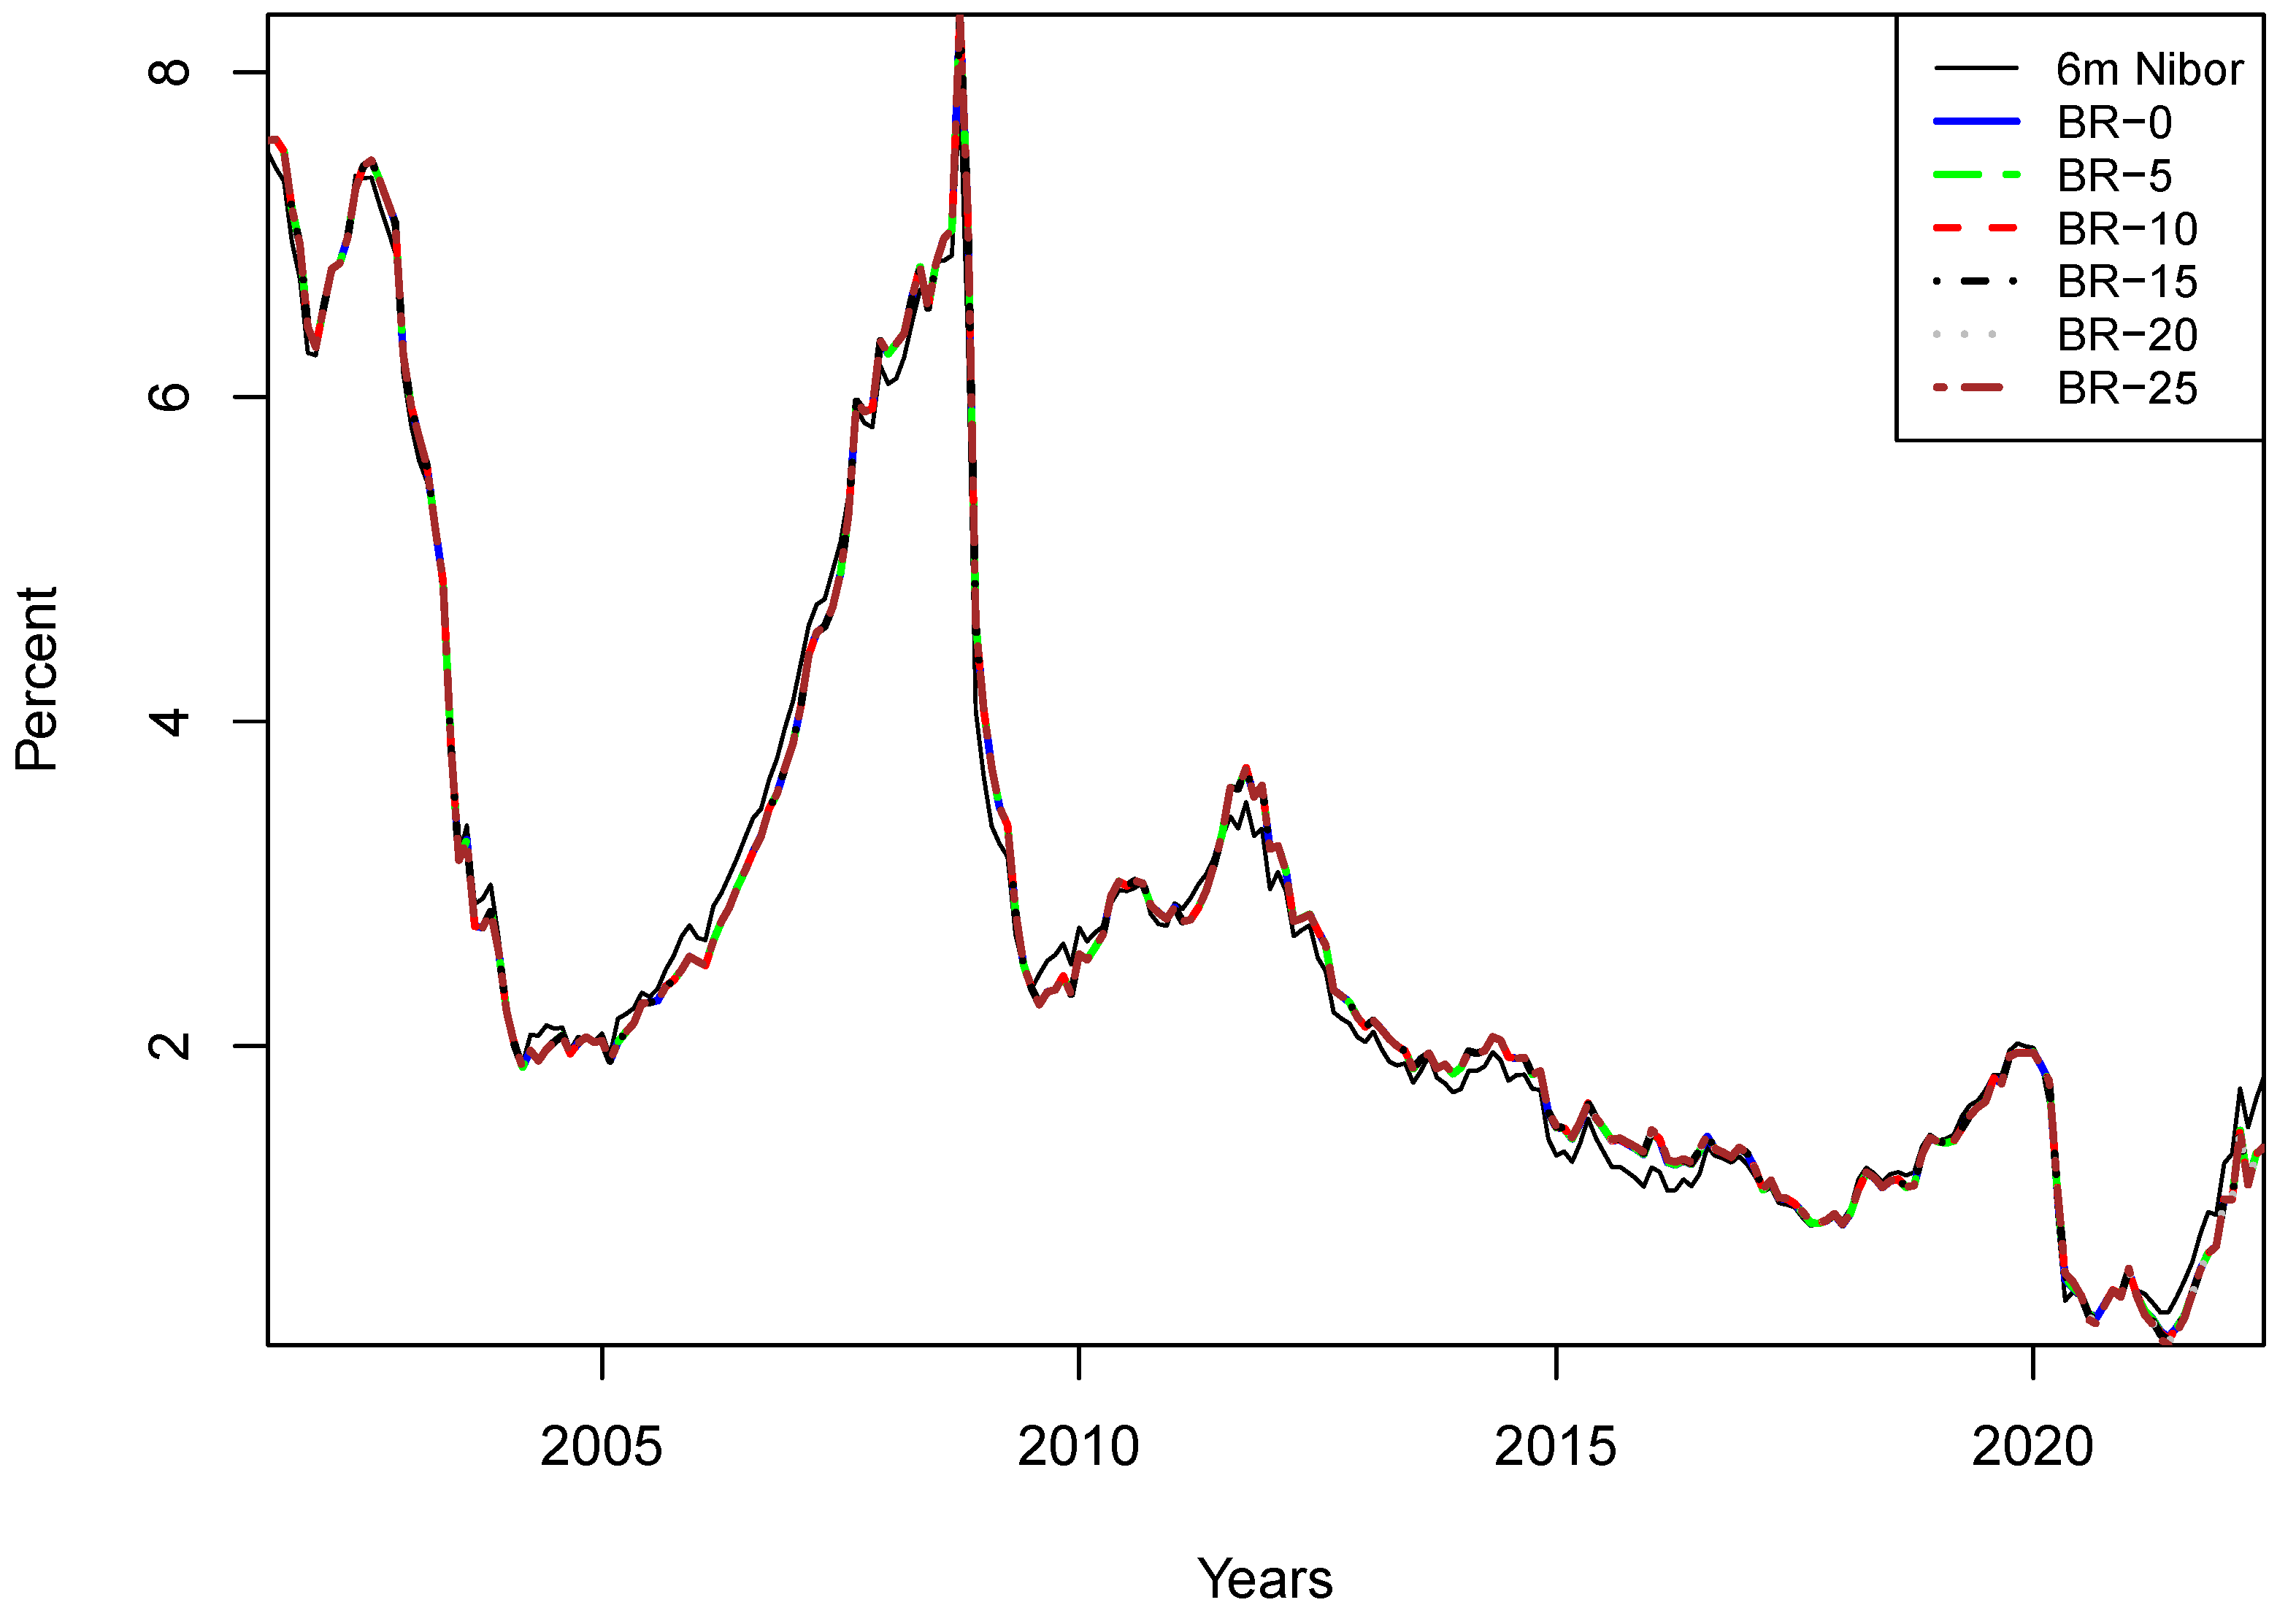
4.3. Impact of Small Sample Bias

Yields of different maturities tend to be highly correlated, and the speed of mean reversion is relatively slow. Furthermore, yields display cyclical behavior, and the number of cycles in a sample is typically low. As first pointed out by Bauer et al. (2012), the combination of persistence in yields and limited sample sizes is liable to introduce small-sample parameter bias when estimating the vector autoregressions on which DTSMs are based. To account for this, we implement the analytical bias correction proposed by Pope (1990) and Kilian (1998). The procedure involves adapting the stepwise estimation approach by replacing the OLS parameter estimates of the autoregressive system in the first step by bias-corrected estimates. The remaining steps of the estimation procedure can then be carried out to recover the parameters determining the cross-sectional fit of the models.
Figure 8 displays the decomposition of the 10 y zero-coupon yield into term premia and risk-neutral expectations from the two models. Consistent with the literature, the bias-corrected results (right panel) display more variability in risk-neutral rates and, consequently, more stable term premium estimates. It is interesting that bias-corrected term premium appear to be close to stationary around 1%. Implicitly, bias correction attributes most of the decline in the 10 y swap rate from 7% towards 0 over the sample period to lowered short-rate expectations and less to changes in term premia. Furthermore, the variability of the term premium is relatively modest. This is somewhat surprising, especially in light of the global macroeconomic events spanned by the sample period. GFC, the Euro area sovereign and banking crises, as well as the COVID-19 pandemic, have created significant macroeconomic and financial uncertainty. In particular, it is puzzling that term premia estimates from the bias-corrected models do not respond to the recent major changes in global inflation regimes. Fundamentally, the term premium can be interpreted as a risk premium related to future economic conditions, and bias-corrected estimates show little sensitivity to such factors.
Wright (2014) argues that term premium point estimates with and without a bias correction lie within OLS confidence intervals and, furthermore, claims that bias correcting is liable to overcorrect with respect to the true data-generating process and thus lead to less plausible term premium and risk-neutral yield point estimates compared with making no correction. Malik and Meldrum (2016) and Guimaraes (2014) support this view.
The sample size of our study is comparable to that of Joslin et al. (2011) and Adrian et al. (2013). In light of the downward trend in yields, we find it likely that small-sample bias is present and might impact our NOK IRS term premium estimates. However, our overall impression is that bias correction does not produce plausible results.

4.4. Impact of Measurement Error

The size and depth of the NOK interest rate swap market is limited compared with the major G7 markets. This might cause arbitrary inaccuracies in swap curve recordings and constitutes a source of estimation uncertainty. To assess the potential impact on term premia estimates from such measurement errors, we conduct a simulation study. First, we add random noise to each of the points on the swap curve. The noise components are cross-sectionally uncorrelated and normally distributed with expected value equal to zero and standard deviation of five basis points. Second, we bootstrap zero-coupon yields from the simulated par curves in the first step. Third, we re-estimate term premia using zero-coupon yields from step two. We run one thousand simulations to produce confidence intervals for the term premia estimates. Figure 9 displays 5% and 95% quantiles for 10 y NOK IRS term premia from the ACM model.15
The simulations in Figure 9 show that measurement error constitutes a source of uncertainty in the estimation procedure that has potential to distort term premia estimates and thus deserves scrutiny. However, the variability appears to be limited, and we consider the validity of the results in this study to be intact.

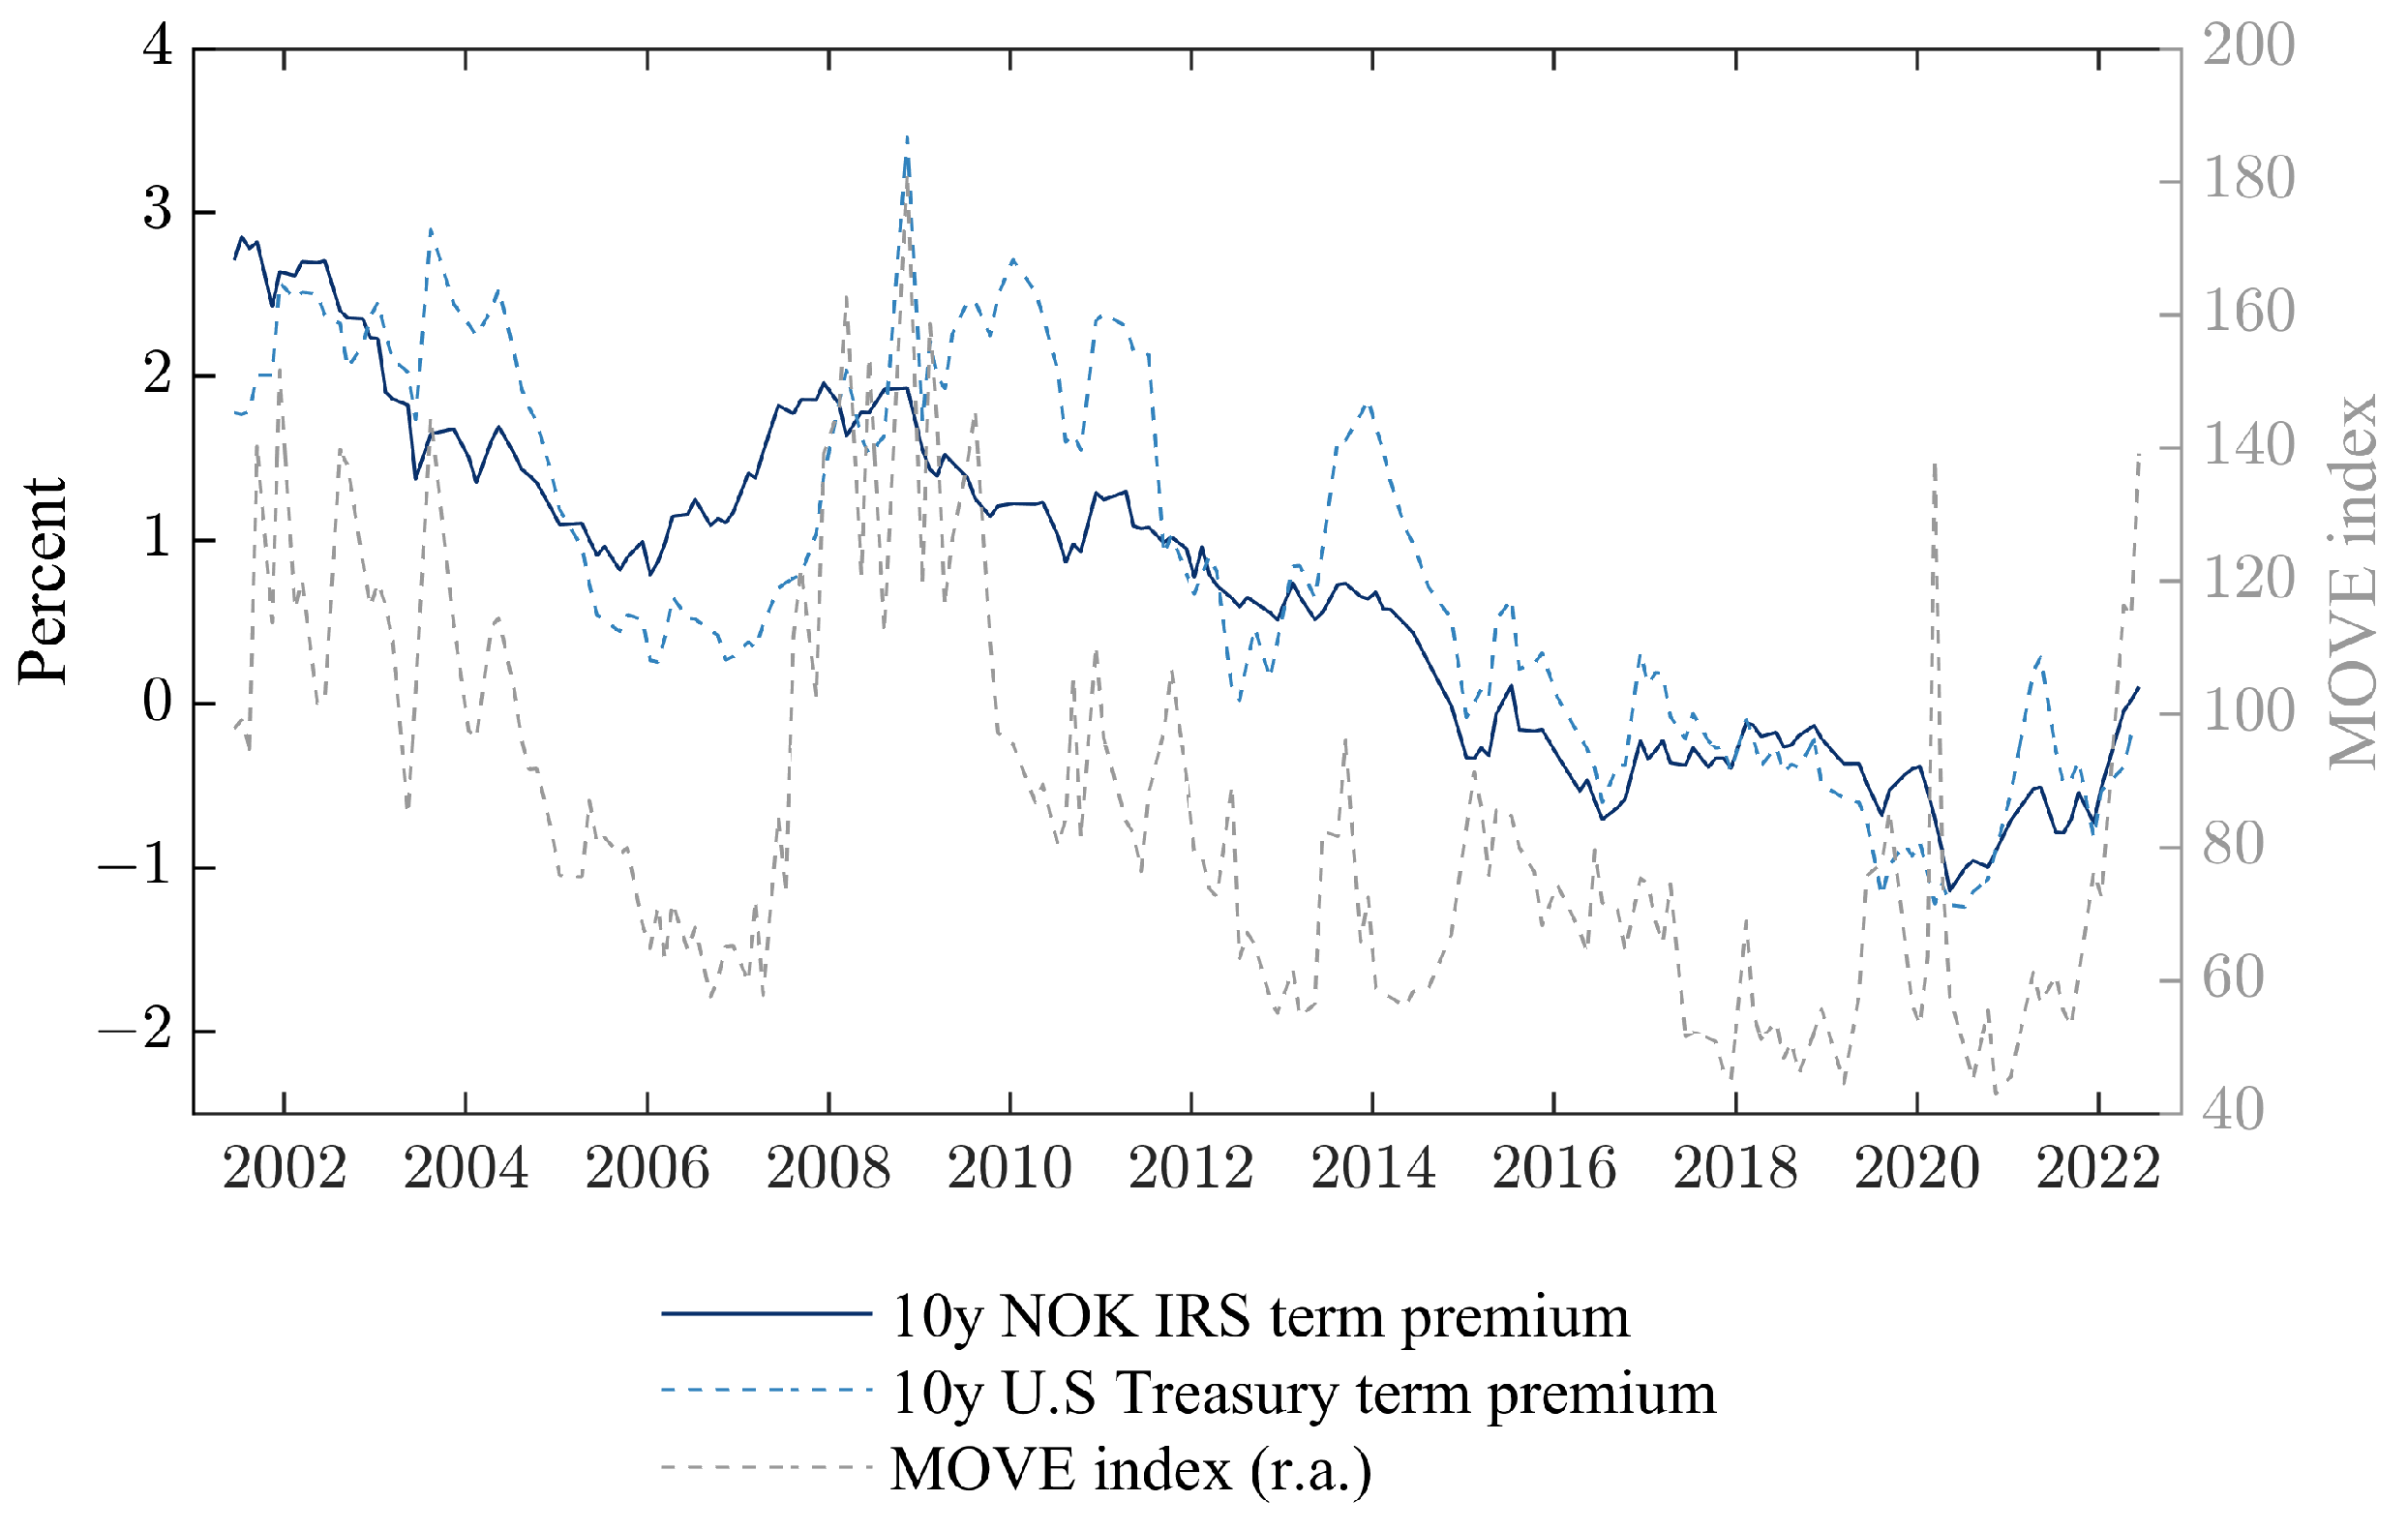
4.5. Correlation of Term Premia Estimates to Fundamental Risk Factors

The term premium in yields is essentially a risk premium. Bollerslev et al. (2018) report the presence of global risk factors interpreted as common determinants of risk premia across asset classes. Analogously, a reasonable a priori expectation is that term premia estimates should display positive codependency with factors reflecting market uncertainty and investor risk perception. To investigate this, we compute linear correlations of our term premia estimates with global risk factors, represented by the economic uncertainty (EU) and risk aversion (RA) indices proposed by Bekaert et al. (2019) and the Bank of America Merrill Lynch MOVE index of interest rate volatility. In addition, we include the implied volatility of Oslo Stock Exchange Index Options (OBX IV) to represent NOK idiosyncratic risk. Table 3 reports statistically significant positive associations with term premia estimates, which are supportive of our overall term premia estimates.

5. Conclusions

Commencing with the 2007 financial crisis, and during the subsequent period of financial turmoil, the relative importance of Norwegian capital markets in a European context has grown. Most prominently, the Norwegian high-yield bond market is among the most active in Europe and has proved an important source of funding for the energy sector. Similarly, the Oslo Stock Exchange has proved to attract significant interest from both investors and growth-type issuers during the COVID-19 period. Thus, Norwegian capital markets are playing an important role in the global green transition.
Understanding the dynamics of risk premia in Norwegian interest rates is important for a broad set of domestic and global stakeholders. In this paper, we present estimates of term premia in Norwegian interest rate swaps. We obtain estimates using well-established dynamic term structure models covering the period from 2001/04 to 2022/06. Particular attention is given to impacts on term premia from a lower bound on yields, to small-sample bias and to measurement errors. We find evidence of declining term premia over the sample period, which resembles international findings. Furthermore, the trend and variation in term premium estimates coincide with global macroeconomic events.
This study can be extended in several directions. Including macrovariables to test the spanning hypothesis could shed additional light on the determinants of term premia. Furthermore, given the status of the Norwegian economy as a small, open economy with significant exposure to global commodity markets, spill-over analysis from global yields might reveal determinants specific to NOK IRS term premia. Similarly, fundamental analysis to explain movements in term premia from factors of specific relevance to Norway as a major exporter of various commodities would contribute further to the understanding of the dynamics of Norwegian interest rate swap rates. We leave this for future research.

Author Contributions

Conceptualization, P.E.d.L., M.R., K.S. and S.W.; methodology, M.R.; software, M.R.; data curation, M.R.; writing—original draft, M.R.; writing—review and editing, P.E.d.L., K.S. and S.W. All authors have read and agreed to the published version of the manuscript.

Funding

This research received no external funding.

Data Availability Statement

The authors are not in a position to distribute the data.

Acknowledgments

We are thankful to three anonymous referees, as well as the editor Shuangzhe Liu, whose insightful comments helped us significantly improve the paper. Furthermore, Risstad and Semmen are grateful to colleagues at Sparebank 1 Markets for comments on a previous version of the paper.

Conflicts of Interest

The authors declare no conflict of interest.

Abbreviations

The following abbreviations are used in this manuscript:
ACMThe dynamic term structure model proposed by Adrian et al. (2013)
BRThe dynamic term structure model proposed by Bauer and Rudebusch (2016)
JSZThe dynamic term structure model proposed by Joslin et al. (2011)
NOKNorwegian Krone
IRSInterest Rate Swap

Notes

1
More recently, the Norwegian Overnight Weighted Average (NOWA) rate has been proposed as an alternative to Nibor, following international reference rate reforms. So far, NOWA transaction volumes have been limited and market participants are reluctant to adopt NOWA. Furthermore, Nibor has been assessed and recognized by the European Commission as a critical benchmark. Hence, we expect Nibor to remain the primary benchmark rate in Norwegian Krone in the foreseeable future.
2
Strictly speaking, yields contain an additional convexity term—which relates to Jensen’s inequality; see Rebonato (2018). However, unless yield volatility is very high or for very long maturities, the convexity effect is typically small. In line with the literature, we ignore it for the purpose of this paper.
3
Risk neutral in this context refers to yields that would exist under the pure expectation hypothesis. That is, yields with a market price of interest rate risk equal to zero and thus no term premium.
4
To enhance the practical application of research presented in this paper, we maintain updated NOK IRS term premia estimates https://github.com/MortenRisstad/NOKIRSTP here. (6 March 2023).
5
Libor: London Interbank Offered Rate. OIS: Overnight Index Swap.
6
Maturities beyond 10 years are also quoted but significantly less liquid, and the related quotes are consequently less reliable.
7
See, for instance, Hevia and Sola (2018).
8
For instance, in Germany, short-term bond yields have been negative since mid-2014. Similarly, long-term yields were below zero from early 2019 until the end of 2021.
9
The difference equations for ACM contain one additional minor component compared with JSZ and BR. This is due to the ACM assumption of serially uncorrelated excess return pricing errors, as opposed to serially uncorrelated yield pricing errors (see Section 2.4 of Adrian et al. (2013)).
10
See Van Dijk et al. (2018) for a thorough discussion of joint modeling of risk factors in the physical ( P ) and risk-neutral ( Q ) measures.
11
PCA has, since the seminal contribution of Ang and Piazzesi (2003), been the primary building blocks of modern term structure models. See Oprea (2022) for a recent application.
12
A canonical Gaussian DTSM is one that is maximally flexible in its parameterization of both the physical and risk-neutral distributions of X t , subject only to normalizations that ensure econometric identification.
13
See, for instance, Adrian et al. (2013); Bauer and Rudebusch (2016); Diebold and Li (2006); Malik and Meldrum (2016) and Jennison (2017), who report comparable fitting errors.
14
Comments from Fed officials led the market to expect an imminent removal of monetary accommodation.
15
Simulation results for other maturities and DTSMs are available from the corresponding author upon request.

References

  1. Adrian, Tobias, Richard K. Crump, and Emanuel Moench. 2013. Pricing the term structure with linear regressions. Journal of Financial Economics 110: 110–38. [Google Scholar] [CrossRef] [Green Version]
  2. Ang, Andrew, and Monika Piazzesi. 2003. A no-arbitrage vector autoregression of term structure dynamics with macroeconomic and latent variables. Journal of Monetary Economics 50: 745–87. [Google Scholar] [CrossRef]
  3. Aydin, Halil İbrahim, and Ozgur Ozel. 2019. Term Premium in Turkish Lira Interest Rates. Ankara: Central Bank of the Republic of Turkey. [Google Scholar]
  4. Bauer, Michael D., and Glenn D. Rudebusch. 2016. Monetary policy expectations at the zero lower bound. Journal of Money, Credit and Banking 48: 1439–65. [Google Scholar] [CrossRef] [Green Version]
  5. Bauer, Michael D., and Glenn D. Rudebusch. 2020. Interest rates under falling stars. American Economic Review 110: 1316–54. [Google Scholar] [CrossRef]
  6. Bauer, Michael D., Glenn D. Rudebusch, and Jing Cynthia Wu. 2012. Correcting estimation bias in dynamic term structure models. Journal of Business & Economic Statistics 30: 454–67. [Google Scholar]
  7. Bekaert, Geert, Eric C. Engstrom, and Nancy R. Xu. 2019. The time variation in risk appetite and uncertainty (no. w25673). Management Science 68: 3975–4004. [Google Scholar] [CrossRef]
  8. Berardi, Andrea, and Alberto Plazzi. 2022. Dissecting the yield curve: The international evidence. Journal of Banking & Finance 134: 106286. [Google Scholar]
  9. Bernanke, Ben. 2013. Long-Term Interest Rates: A Speech at the Annual Monetary/Macroeconomics Conference; Technical Report. Washington, DC: Board of Governors of the Federal Reserve System (US).
  10. Bianchetti, Marco, and Massimo Morini. 2013. Interest Rate Modelling after the Financial Crisis. Edited by Massimo Morini and Marco Bianchetti. London: Risk Books, Incisive Media, vol. 11. [Google Scholar]
  11. Black, Fischer. 1995. Interest rates as options. The Journal of Finance 50: 1371–76. [Google Scholar] [CrossRef]
  12. Bollerslev, Tim, Benjamin Hood, John Huss, and Lasse Heje Pedersen. 2018. Risk everywhere: Modeling and managing volatility. The Review of Financial Studies 31: 2729–73. [Google Scholar] [CrossRef]
  13. Brooks, Robert, Brandon N. Cline, and Walter Enders. 2015. A comparison of the information in the libor and cmt term structures of interest rates. Journal of Banking & Finance 54: 239–53. [Google Scholar]
  14. Byrne, Joseph P., Shuo Cao, and Dimitris Korobilis. 2019. Decomposing global yield curve co-movement. Journal of Banking & Finance 106: 500–13. [Google Scholar]
  15. Callaghan, Michael. 2019. Expectations and the Term Premium in New Zealand Long-Term Interest Rates. Reserve Bank of New Zealand Analytical Note, AN2019/02. Wellington: Reserve Bank of New Zealand. [Google Scholar]
  16. Campbell, John Y., and Robert J. Shiller. 1988. The dividend-price ratio and expectations of future dividends and discount factors. The Review of Financial Studies 1: 195–228. [Google Scholar] [CrossRef] [Green Version]
  17. Cochrane, John H., and Monika Piazzesi. 2005. Bond risk premia. American Economic Review 95: 138–60. [Google Scholar] [CrossRef]
  18. Cohen, Benjamin H., Peter Hördahl, and Fan Dora Xia. 2018. Term premia: Models and some stylised facts. BIS Quarterly Review September 1: 79–90. [Google Scholar]
  19. Collin-Dufresne, Pierre, and Bruno Solnik. 2001. On the term structure of default premia in the swap and libor markets. The Journal of Finance 56: 1095–15. [Google Scholar] [CrossRef]
  20. Dahlquist, Magnus, and Henrik Hasseltoft. 2013. International bond risk premia. Journal of International Economics 90: 17–32. [Google Scholar] [CrossRef] [Green Version]
  21. Dai, Qiang, and Kenneth J. Singleton. 2000. Specification analysis of affine term structure models. The Journal of Finance 55: 1943–78. [Google Scholar] [CrossRef] [Green Version]
  22. Dai, Qiang, and Kenneth Singleton. 2003. Term structure dynamics in theory and reality. The Review of Financial Studies 16: 631–78. [Google Scholar] [CrossRef]
  23. D’Amico, Stefania, Canlin Li, J. Sears, and M. Cahill. 2014. The Term-Premium Effect of the Federal Reserve’s Asset Purchase Announcements. Technical Report. Chicago: Federal Reserve Bank of Chicago. [Google Scholar]
  24. d’Amico, Stefania, Don H. Kim, and Min Wei. 2018. Tips from TIPS: The informational content of Treasury Inflation-Protected Security prices. Journal of Financial and Quantitative Analysis 53: 395–436. [Google Scholar] [CrossRef] [Green Version]
  25. de Lange, Petter Eilif, Morten Risstad, and Sjur Westgaard. 2022. Term Premia in Norwegian Government Bond Yields. Beta 36: 1–21. [Google Scholar] [CrossRef]
  26. de los Rios, Antonio Diez, and Maral Shamloo. 2017. Quantitative Easing and Long-Term Yields in Small Open Economies. Paris: International Monetary Fund. [Google Scholar]
  27. Diebold, Francis X., and Canlin Li. 2006. Forecasting the term structure of government bond yields. Journal of Econometrics 130: 337–64. [Google Scholar] [CrossRef] [Green Version]
  28. Duffee, Gregory R. 2002. Term premia and interest rate forecasts in affine models. The Journal of Finance 57: 405–43. [Google Scholar] [CrossRef] [Green Version]
  29. Duffie, Darrell, and Rui Kan. 1996. A yield-factor model of interest rates. Mathematical Finance 6: 379–406. [Google Scholar] [CrossRef] [Green Version]
  30. Fama, Eugene F., and Robert R. Bliss. 1987. The information in long-maturity forward rates. The American Economic Review 77: 680–92. [Google Scholar]
  31. Filipović, Damir, and Anders B. Trolle. 2013. The term structure of interbank risk. Journal of Financial Economics 109: 707–33. [Google Scholar] [CrossRef] [Green Version]
  32. Gallitschke, Janek, Stefanie Seifried, and Frank Thomas Seifried. 2017. Interbank interest rates: Funding liquidity risk and xibor basis spreads. Journal of Banking & Finance 78: 142–52. [Google Scholar]
  33. Gräb, Johannes, and Thomas Kostka. 2018. Predicting Risk Premia in Short-Term Interest Rates and Exchange Rates. ECB Working Paper Series No 2131; Frankfurt: European Central Bank. [Google Scholar]
  34. Guimarães, Rodrigo. 2014. Expectations, Risk Premia and Information Spanning in Dynamic Term Structure Model Estimation. Technical Report. London: Bank of England. [Google Scholar]
  35. Harvey, Campbell R. 1986. Recovering Expectations of Consumption Growth from an Equilibrium Model of the Term Structure of Interest Rates. Ph.D. thesis, University of Chicago, Graduate School of Business, Chicago, IL, USA. [Google Scholar]
  36. Hevia, Constantino, and Martin Sola. 2018. Bond risk premia and restrictions on risk prices. Journal of Risk and Financial Management 11: 60. [Google Scholar] [CrossRef] [Green Version]
  37. Hui, Cho-Hoi, Chi-Fai Lo, and Chin-To Fung. 2017. Dynamics of Market Anomalies and Measurement Errors of Risk-Free Interest Rates. HKIMR Working Paper. Hong Kong: Hong Kong Institute for Monetary Research. [Google Scholar]
  38. Hunzinger, Chadd B., and Coenraad C. A. Labuschagne. 2015. Pricing a collateralized derivative trade with a funding value adjustment. Journal of Risk and Financial Management 8: 17–42. [Google Scholar] [CrossRef] [Green Version]
  39. Jennison, Fraser. 2017. Estimation of the Term Premium within Australian Treasury Bonds; Working Paper. Canberra: Australian Office of Financial Management, pp. 18–83.
  40. Joslin, Scott, Kenneth J. Singleton, and Haoxiang Zhu. 2011. A new perspective on Gaussian dynamic term structure models. The Review of Financial Studies 24: 926–70. [Google Scholar] [CrossRef]
  41. Jotikasthira, Chotibhak, Anh Le, and Christian Lundblad. 2015. Why do term structures in different currencies co-move? Journal of Financial Economics 115: 18–83. [Google Scholar] [CrossRef]
  42. Kilian, Lutz. 1998. Small-sample confidence intervals for impulse response functions. Review of Economics and Statistics 80: 218–30. [Google Scholar] [CrossRef]
  43. Krippner, Leo. 2015. Zero Lower Bound Term Structure Modeling: A Practitioner’s Guide. Berlin: Springer. [Google Scholar]
  44. Kumar, Ronald Ravinesh, Peter Josef Stauvermann, and Hang Thi Thu Vu. 2021. The relationship between yield curve and economic activity: An analysis of g7 countries. Journal of Risk and Financial Management 14: 62. [Google Scholar] [CrossRef]
  45. Liu, Jun, Francis A. Longstaff, and Ravit E. Mandell. 2006. The market price of risk in interest rate swaps: The roles of default and liquidity risks. The Journal of Business 79: 2337–59. [Google Scholar] [CrossRef] [Green Version]
  46. Malik, Sheheryar, and Andrew Meldrum. 2016. Evaluating the robustness of UK term structure decompositions using linear regression methods. Journal of Banking & Finance 67: 85–102. [Google Scholar]
  47. McCoy, Eric. 2019. A Calibration of the Term Premia to the Euro Area. Technical Report. Brussels: Directorate General Economic and Financial Affairs (DG ECFIN). [Google Scholar]
  48. Moessner, Richhild. 2018. Effects of asset purchases and financial stability measures on term premia in the Euro area. Applied Economics 50: 4617–31. [Google Scholar] [CrossRef]
  49. Mönch, Emanuel. 2019. The term structures of global yields. BIS Papers 102: 3–15. [Google Scholar]
  50. Oprea, Andreea. 2022. The use of principal component analysis (pca) in building yield curve scenarios and identifying relative-value trading opportunities on the romanian government bond market. Journal of Risk and Financial Management 15: 247. [Google Scholar] [CrossRef]
  51. Pope, Alun Lloyd. 1990. Biases of estimators in multivariate non-gaussian autoregressions. Journal of Time Series Analysis 11: 249–58. [Google Scholar] [CrossRef]
  52. Priebsch, Marcel. 2013. Computing arbitrage-free yields in multi-factor Gaussian shadow-rate term structure models. FEDS Working Paper 63: 1–35. [Google Scholar]
  53. Rebonato, Riccardo. 2018. Bond Pricing and Yield Curve Modeling: A Structural Approach. Cambridge: Cambridge University Press. [Google Scholar]
  54. Rudebusch, Glenn D., Brian P. Sack, and Eric T. Swanson. 2006. Macroeconomic implications of changes in the term premium. FRB of San Francisco Working Paper 89: 241–69. [Google Scholar]
  55. Sekkel, Rodrigo. 2011. International evidence on bond risk premia. Journal of Banking & Finance 35: 174–81. [Google Scholar]
  56. Van Dijk, Marcel T. P., Cornelis S. L. De Graaf, and Cornelis W. Oosterlee. 2018. Between P and Q : The P Q measure for pricing in asset liability management. Journal of Risk and Financial Management 11: 67. [Google Scholar] [CrossRef] [Green Version]
  57. Wright, Jonathan H. 2011. Term premia and inflation uncertainty: Empirical evidence from an international panel dataset. American Economic Review 101: 4514–34. [Google Scholar] [CrossRef] [Green Version]
  58. Wright, Jonathan H. 2014. Term premia and inflation uncertainty: Empirical evidence from an international panel dataset: Reply. American Economic Review 104: 138–41. [Google Scholar] [CrossRef]
  59. Wu, Jing Cynthia, and Fan Dora Xia. 2016. Measuring the macroeconomic impact of monetary policy at the zero lower bound. Journal of Money, Credit and Banking 48: 253–91. [Google Scholar] [CrossRef]
Figure 1. NOK interest rate swap rates vs. 6 m Nibor, retrieved from Bloomberg. Sample period: 2001/04 to 2022/06.
Jrfm 16 00188 g001
Figure 2. Term premia estimates.
Jrfm 16 00188 g002
Figure 3. ACM 10 y term premia (left axis) vs. MOVE (right axis). NOK IRS estimates by the authors, U.S. estimates as reported by the Federal Reserve Bank of New York and MOVE Index retrieved from Bloomberg. Sample period: 2001/04 to 2022/06.
Jrfm 16 00188 g003
Figure 4. Impact on term premia estimates from ZLB. Comparison of term premia estimates from BR and JSZ. Negative numbers imply higher term premia estimates from BR relative to JSZ. Sample period: 2001/04 to 2022/06.
Jrfm 16 00188 g004
Figure 5. Probability of negative rates. JSZ-implied real-world P probabilities of negative future short-term interest rates at horizons of 6 months, 1 year, and 2 years. Sample period: 2001/04 to 2022/06.
Jrfm 16 00188 g005
Figure 6. ZLB wedge (10 y IRS). The fitted 10-year BR yield and the corresponding shadow yield. The ZLB wedge is the difference between the two. Sample period: 2001/04 to 2022/06.
Jrfm 16 00188 g006
Figure 7. Sensitivity of shadow rates to lower bound. Shadow short rates implied by the BR and the 6 m NIBOR rate. Each panel shows estimated shadow short rates for the lower bound r m i n varying from 0 to 25 basis points. Sample period: 2001/04 to 2022/06.
Jrfm 16 00188 g007
Figure 8. Impact of bias correction on 10 y term premia estimates. The effect of bias correction following Pope (1990) (BC—right panel) on the decomposition of yields into term premia and risk-neutral expectations, compared with OLS estimation (OLS—left panel). Sample period: 2001/04 to 2022/06.
Jrfm 16 00188 g008
Figure 9. Simulated confidence band for the 10 y term premia using the ACM model. Sample period: 2001/04 to 2022/06.
Jrfm 16 00188 g009
Table 1. Descriptive statistics of zero-coupon yields.
TenorMeanStd. devMinMax ρ 1 m  1 ρ 1 y  2
6m2.791.940.347.870.980.60
1y2.761.870.367.580.980.62
2y2.921.820.317.570.980.68
3y3.051.770.317.430.980.73
5y3.271.700.387.240.980.77
7y3.461.660.507.140.980.79
10y3.651.620.687.080.990.80
1 ρ1m: autocorrelations at 1 month lags. 2 ρ1y: autocorrelations at 1 year lags.
Table 2. Model fit (RMSE).
Model1y2y3y5y7y10y
ACM2.791.940.347.870.980.6
JSZ2.761.870.367.580.980.62
Table 3. Correlation of term premia estimates to fundamental risk factors.
TenorModelEURAMOVEOBX IV
2yACM0.590.560.670.75
JSZ0.600.470.630.66
5yACM0.330.270.630.60
JSZ0.330.260.620.59
10yACM0.290.220.580.54
JSZ0.290.240.590.56
EU: Index of economic uncertainty (Bekaert et al. 2019). RA: Index of risk aversion (Bekaert et al. 2019). MOVE: Index of bond market implied volatility, reported by Bank of America Merrill Lynch. OBX IV: At-the-money implied volatility of 1-month Oslo Stock Exchange Index Options. All correlation coefficients are statistically significant (ρ > 0) at 1% confidence level.
Disclaimer/Publisher’s Note: The statements, opinions and data contained in all publications are solely those of the individual author(s) and contributor(s) and not of MDPI and/or the editor(s). MDPI and/or the editor(s) disclaim responsibility for any injury to people or property resulting from any ideas, methods, instructions or products referred to in the content.

