1. Introduction
Small- and mid-size enterprises (SMEs) are the engines of the European economy. According to the statistics, SMEs are creating nine out of ten businesses, stimulating innovation worldwide, especially in the European Union. Considering this, we need to consider that these types of companies are vital for competition in work and among employees.
The European community is trying to offer these companies all the conditions and possibilities to improve their capacities and reach their maximum potential, rising to the optimal global level (
Imamuddin 2021). Considering that we are dealing with small- and mid-size enterprises, it goes without saying that their size differs depending on specific criteria such as the number of employees, shares capital, etc. According to
Crehan (
2022) SMEs must be differentiated in the economic field to benefit from the European Union’s support. Therefore, SMEs must overcome all barriers such as lack of knowledge, technical problems, or negative influences from the market in which it operates.
Over the years, the countries of Central and Eastern Europe have undergone political, social, and economic transformations. Even if the economy of these companies is still developing, it is to be appreciated that they are trying to keep up with market laws (
Gandía and Huguet 2018).
Since 2000, there has been a growing need to harmonize and simplify financial reporting for SMEs globally. The International Accounting Standards Board (IASB) has begun developing an appropriate standard for SMEs to meet this need. With the help of a working group specially formed to achieve this standard and the entity’s constant concerning opinions, the IASB published the International Financial Reporting Standard for small and mid-size Enterprises—IFRS for SMEs.
The needs of users of the company’s financial results always come first when implementing these processes (
Martyniuk and Martyniuk 2020). Applying the complete set of IFRS to small- and mid-size enterprises might be much since the proportion of it needs to be lowered for small firms. Implementing the IFRS requirements for SMEs is substantially reduced compared to implementing the complete set of IFRS since not all information provided by the rules is appropriate for the user’s needs.
However, a careful analysis of accounting and reporting requirements and other qualitative criteria is required before adopting this standard (
Ernst & Young 2009).
IFRS for SMEs is an essential path toward the worldwide intersection of financial reporting practices for SMEs (
European Federation of Accountants and Auditors 2009). Applying this standard would reduce the differences between international accounting practices and open new opportunities for SMEs, such as increasing the quality and analogy of financial statements but also the possibility of attracting new investors (
Martyniuk 2020).
Among SMEs’ primary users of the financial reports are the managers and owners, who are mainly interested in tax information and those on the company’s availability. This is why accountants should determine the most relevant accounting regulations for the company for which they prepare financial reporting so that the information they send to managers is not limited to those contained in the administrative reporting required by the state (
Buculescu and Velicescu 2014).
The importance of a qualitative reporting process is observed in developing a financial accounting structure as suitable as possible for the company and a regulatory framework by the legislation in force. Although the process of qualitative financial reporting is quite recognized by researchers and is, at the same time, a current problem of enterprises, this aspect becomes essential in the case of financial disasters. According to
IASB (
2018), a high-quality financial reporting structure provides valuable information to stakeholders, especially in decision-making.
In this phase, the audit process intervenes, being an activity of reviewing the financial information and playing an essential part in supporting the credibility and authenticity of the financial information. According to the empirical evidence conducted by
Huguet and Gandía (
2016) regarding the importance of an auditor, it is assumed that audited information has a higher quality than unaudited one.
The audit is a professional examination of the financial statements of an organization, or, better said, the material is taken from the audit report, and following it, the audit opinion will be expressed, which must be responsible, independent, and related to a criterion such as (norm, standard) of quality. According to
Demirović et al. (
2021), the auditor should take all the steps to collect the necessary information, analyze it, and form the necessary conclusions to be convinced that the information from the financial statements is presented precisely. The authors mentions that this action creates the “bridge”—the link—between the people who prepare the financial statements and the users of the accounting information.
The audit report should bring a “reasonable assurance” that the financial statements provided by the entity do not contain significant distortions arising from fraud or various errors. An auditor cannot obtain “absolute assurance” because certain factors limit the latter’s ability to provide “absolute assurance”.
Each audit engagement is a challenge for the entity providing such services in the audit process, as every engagement can be unique. In planning the work of an audit mission, one of the auditor’s main objectives is to identify risks. Risk assessment is a necessary condition in the planning step of an audit. The reason why auditors perform risk assessment procedures is to achieve a better understanding of the entity and its environment, including the entity’s controls.
According to a case study conducted by
Potdar (
2019), while performing an audit risk assessment process, it is important to consider a few steps in order to achieve high-quality development.
To find out the company’s environment and to assess it;
To find out the company’s propensity to fraud risk;
To find out what are the company’s internal control processes and assess it;
To conduct a comprehensive assessment of all collected information and assessed risks;
To design miscellaneous testing procedures that address the overall risk of material misstatement.
Identifying and estimating the risks of material inaccuracy, whether due to error or fraud, at the level of the financial statements and related claims helps in the design of further assurance procedures (
Ruban and Haţegan 2022).
The risk assessment process is used to determine quantitative and qualitative risk assessments. Quantitative aspects can be considered as attributes that can exist in quantity. Quantitative quantities can be compared in terms of “more,” “less,” or “equal” or by specifying numerical values related to units of measurement.
Qualitative aspects are the commonly observed properties that cannot be measured with numerical results. How a company treats its citizens is perhaps the most obvious qualitative aspect of a government entity. While it is hard to measure anything qualitatively, most people can judge behavior based on how they feel treated.
Based on a case study by
Joyce (
2015), assessing risks and developing responses involves four phases.
- 1.
“Risk assessment at the financial statement level” phase.
At this stage, it is critical to identify the risks across the financial statements that could affect the various statements while assessing the risks of material misstatement. Based on the results, the auditor must formulate and document an overall response.
- 2.
The “Development of Overall Audit Strategy” phase.
The audit strategy should include identifying and assessing the business characteristics that define its scope and project reporting objectives. Important factors determine the focus of the audit and the resources required to conduct it.
- 3.
“Risk Assessment at Relevant Statement Level” phase.
“Statement level” is the level at which the statement is completely correct. For example, management tells auditors that the financial statements show a correct valuation of inventory—management formally “certifies” that statement to be correct—hence what we call the “declaration level.”
- 4.
“Develop the detailed audit plan” phase.
The final stage will indicate how, when, and to what extent future assessment processes will address risk assessments (assessment programs). This part of the process links risk assessment and response at the assertion level. It is imperative for an auditor to identify the management’s position towards the risk of fraud because, based on the management’s views, he can form an overall opinion on the situations in which he finds himself. It is no secret that there have been many cases where a company’s management has altered financial statements through fraudulent reporting, so everyone is a suspect until proven otherwise. Additionally, the management of an organization can exert pressure on other employees at a lower hierarchical level, aiming to impress certain shareholders and turning them into accomplices of fraud. Top management may make great efforts to manage earnings to mislead users of the financial statements, thereby changing their perception of the entity’s performance.
A small business audit plan should not be viewed as time-consuming, but more specific companies do not necessarily mean more accessible audits. Reducing the number and experience of experts involved in the review can bring many advantages and efficiencies to the review process. A good understanding of relevant auditing standards and experience in exercising appropriate professional judgment is essential to the effectiveness of small business audits. However, many studies have proven the existence of different indicators to measure the quality of the audit risk assessment process, such as auditor’s change, audit fees or auditor’s opinion.
Diem (
2016) states the exam evaluation process is highly complex. With no direct way to measure audit quality, audit users are forced to use the various metrics above.
In 2019, Crucean and Haţegan created a qualitative case study based on which they discovered the elements that impact the quality of audit services. The results show that quality audits are influenced by the auditor’s professional training, field experience and development skills, fair assignment of tasks across the audit team, time spent on audit work, etc. To better understand the analyzed indicators of this research, we considered it relevant to detail them.
The objective of the article is to study the impact of six accounting quality risk indicators in audit risk assessment from SME audit reports in EU countries, comparing the findings with the analysis of the same indicators at Central and Eastern European countries (CEECs) level. The qualitative research methodology addressed in this paper consists of a descriptive study of the risks in the audit reports, emphasizing their types and connection with the company’s characteristics. The study is based on a sample of 443 SMEs listed on the European stock market and included in the Audit Analytics database, an online platform with information from the company’s financial statements and audit reports.
The structure of the paper is as follows: in the next section, the research methodology and the sample will be described; in
Section 3, the results and discussions will be presented; the last section includes the conclusions, limits, and future research.
2. Research Methodology
According to the research method, this paper presents a qualitative descriptive study of the accounting quality and risk matrix (AQRM) indicators identified during the audit process of small- and medium-sized companies in Europe. Audit Analytics creates the AQRM to facilitate the identification of accounting, auditing, and governance red flags for public companies. The information provided by this database was also used in another previous research (
Deaconu et al. 2021). The case study focuses on observing the evolution of the indicators, their type, and the link between the identified indices and their specific characteristics to establish the impact on the audit risk assessment.
“The Auditor Ratification—Significant Vote Against” index is the first accounting quality risk indicator. This indicator represents whether the company’s shareholders voted against the company’s auditor’s certification in significant numbers. The indicator is notable if the against vote is higher than five per cent. To the same extent, the indicator is considered significant if the against vote is higher than fifty per cent, “Audit Opinion - Going Concerned” is the second indicator, indicating if the company’s audit opinion was expressed with substantial doubt about the company’s ability to continue as a going concern. The third indicator (Audit Opinion- Change in Engagement Partner) suggests that there is a possibility of a change in the Engagement Partner (from the Form AP data) within the same audit firm.
The Auditor Change indicator shows a recently disclosed change in the audit process. The indicator is considered significant when the number of issues reaches number 2 and critical when the number of issues is 3. Another indicator found in the audit reports of the analyzed companies is the “Audit Fees- Significant Change” index, which indicates whether there have been significant changes in the number of audit fees. In
Table 1, we can observe how the changes are analyzed and considered.
According to the table above, companies can be divided into three categories: accelerated file, large, accelerated filer, and non-accelerated filer. A large, accelerated filer is a specific category of companies with significantly shorter deadlines to file their financial reports.
According to the
U.S. Securities and Exchange Commission (
2020), a company that falls into the first category must obtain at least a USD 75 million IPO on the issuer’s last business day, but the recently completed second quarter IPO should be less than his USD 700 million.
Similarly, to be classified as a Massive Accelerated Filer, a company must have an IPO of at least USD 700 million on the last business day of the issuer’s most recently completed second fiscal quarter. By exclusion, non-accelerated filers represent the companies not included in the other two categories.
While analyzing the indicator presented above, some exceptions need to be taken into consideration, and the following situations are excluded:
- ➢
Acquisitions in the last two years where the acquisition value exceeds 20% of the company’s market capitalization.
- ➢
Companies that have gone public within the last two years.
- ➢
All auditors changed in the last two years.
These exceptions narrow the extracted database, thus imposing some limits from a quantitative point of view regarding the case study created.
According to
Audit Analytics (
2022) explanations legend, the “Audit Fees-High Outlier” indicates if a company’s audit fees are an outlier on the high end compared to a peer group (grouped by industry and market cap). Logic compares fees relative to assets and revenues using a statistical box-and-fencing approach. It only applies to the audit opinion firm.
Finally, the last indicator, Audit Fees-Significant Non-Audit Fees, indicates if a company’s non-audit fees (excluding audit-related) are more than 25% of their total fees = 1 (it is considered notable), or more than 50% = 2 (it is considered significant).
Considering the nature of this case study, we decided to select the sample from the database provided by Audit Analytics, an online platform consisting of published information extracted from the company’s financial statements or, in this case, from the audit reports.
By the time of creating this sample, we considered some criteria to be relevant; therefore, they were imposed. First, we considered the company’s revenue value to follow the legislation imposed on small- and mid-sized enterprises. Usually, the maximum ceiling at which a company can still be regarded as small is 10 million EUR and 50 million EUR for the companies that still qualify as medium-sized. Until recently, the platform only offered information from the companies listed on the US stock exchange, so the numerical values were expressed in dollars, making market research more difficult. According to the latest changes made on the platform, this also provides information from the companies listed on the European stock exchange; hence, we were able to set the numerical values in euros, thus making it easier to set the criteria for the selected sample.
To present relevance in the present study, we selected only companies with less than fifty million euros in revenues. Another criterion for creating the sample was between 2010 and 2022, selecting only companies from European countries. Therefore, following the imposed criteria, we have obtained a sample of 443 small- and mid-sized companies. The geographical structure of the sample is shown in
Table 2.
For the enterprises included in the sample were established 2343 red flags regarding accounting quality risk indicators, of which 9.64% belong to CEECs, for 2010–2020. During the analysis were identified 1607 audit reports issued by the auditors. The table above shows that the United Kingdom has the most significant number of small- and medium-sized enterprises (215 companies). Moreover, it is also the country where the most accounting quality risk flags have been identified (922 flags), representing 39.35% of the total AQRM flags. At the same time, it is essential to mention that France is the second most significant country in terms of the high number of identified flags, namely 466 AQRM, followed by Spain with 120 red flags.
Observing the sample, we notice that many companies have headquarters in all Central and Eastern European countries except Slovenia. Considering only the CEE countries, we realize that for the small- and mid-sized enterprises from Poland, the auditors have identified the most annual reports (54 reports) with the highest number of identified accounting quality risk indicators (85 AQRM) for the period 2010–2021.
At the opposite pole, we find Romania and Croatia, each in the sample with only one company listed on the European stock exchange. Both presented, during relatively four consecutive years, four flags that indicate the possibility of irregularities regarding the risk of the quality of the audit process.
3. Results and Discussions
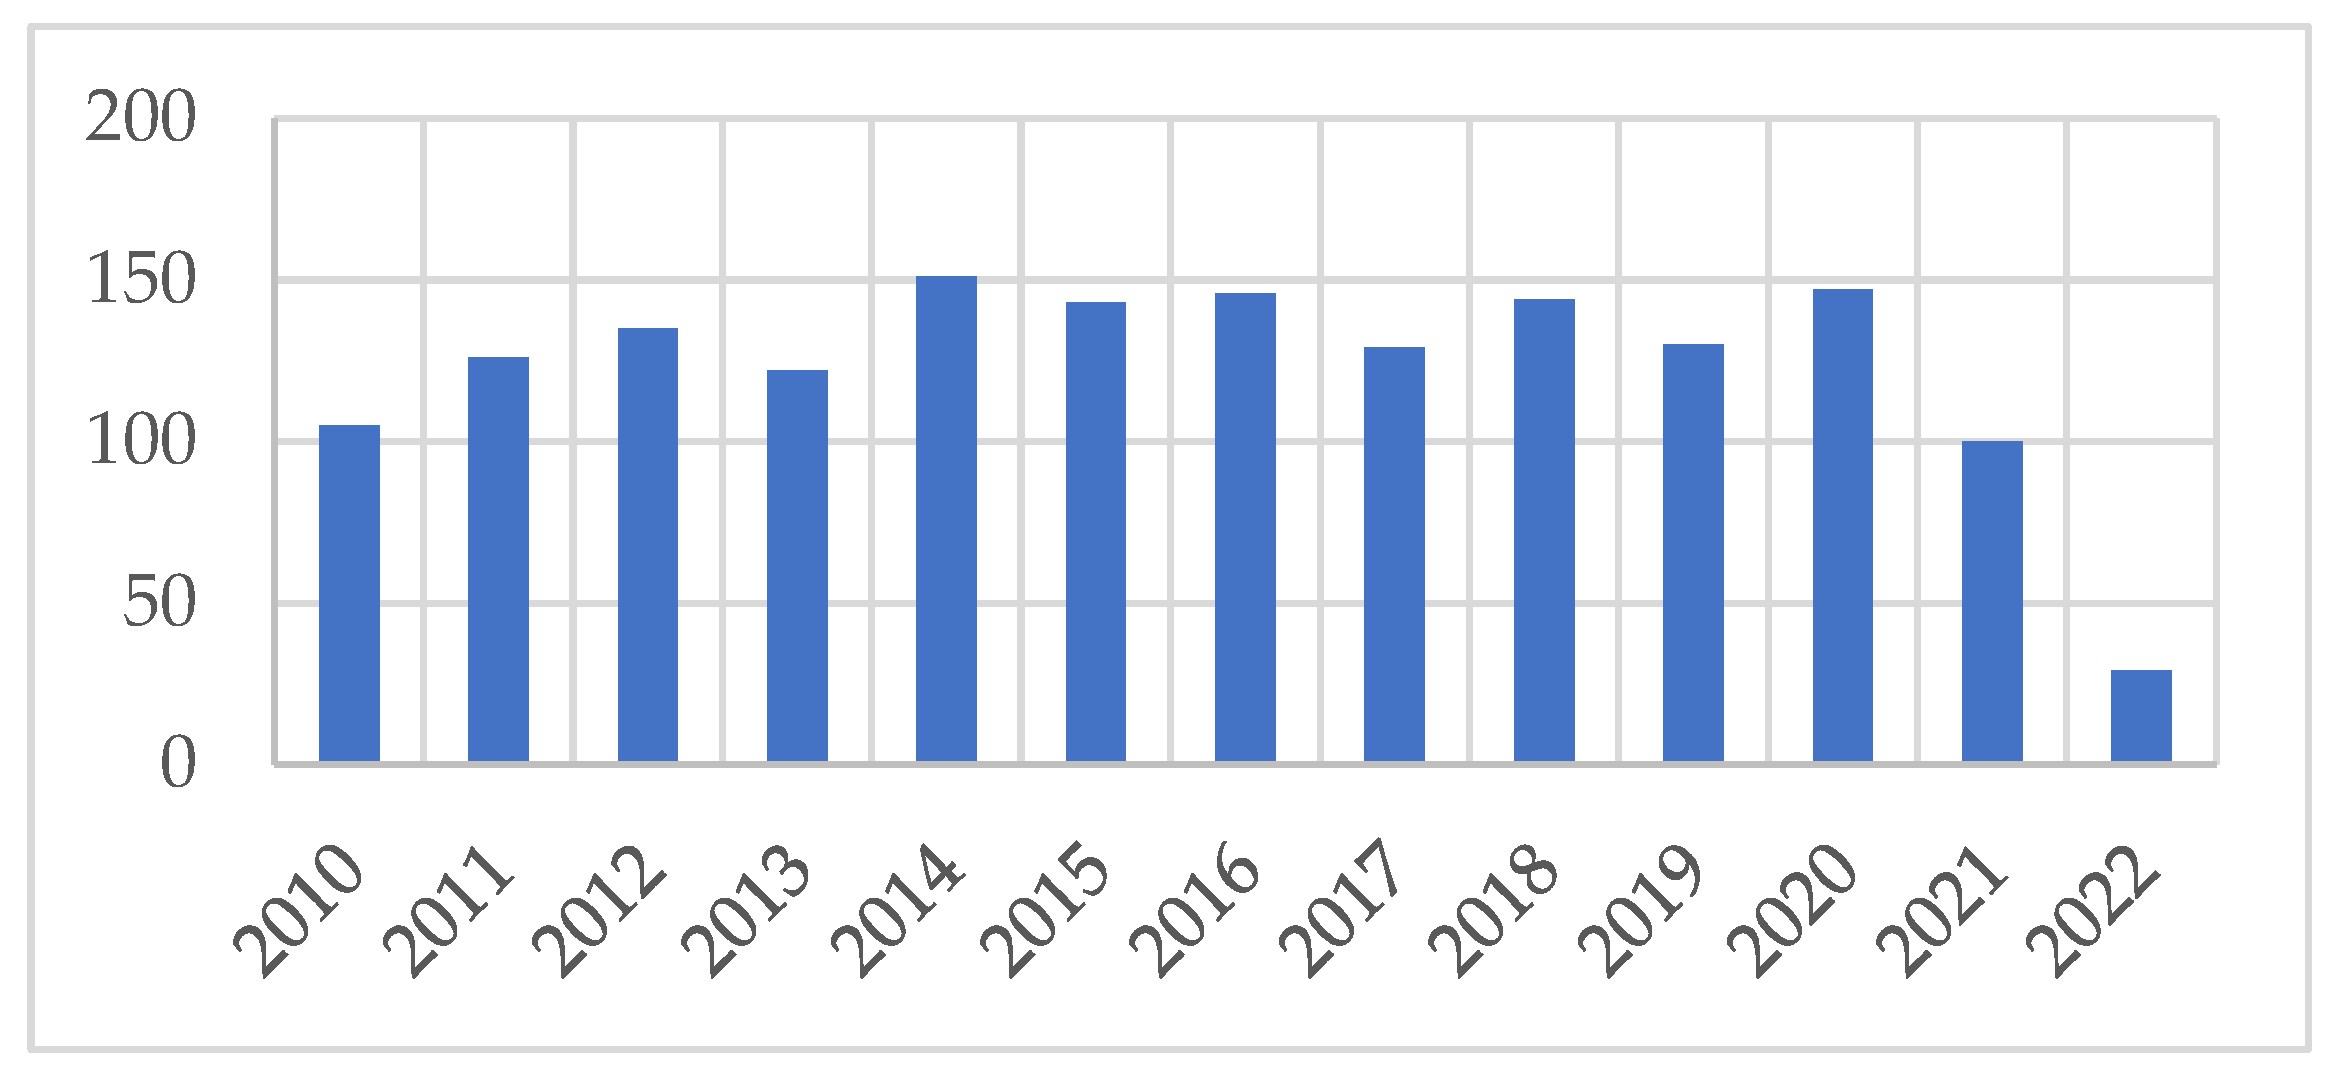
Following the sample presented above, we analyzed the frequency of the accounting quality risk indicators identified in the audit reports of European countries and CEE countries. The evolution of the number of reports that generated flags are presented in
Figure 1.
Figure 1 shows that the evolution of the number of reports was relatively constant; most reports were in 2014, after which a slight decrease was recorded.
The detailed performed analysis of indicator frequency is represented in
Table 3 below.
Table 3 shows that the average frequency of identified qualitative accounting risk indicators in the audit reports was 35%, almost a fourth of the possible irregularities found in the information.
The “Audit Opinion–Not Unqualified” indicator represents the lowest percentage for companies in Europe (1%), while for companies in Eastern and Central Europe (8%).
This fact may be a little concerning, given that this type of audit opinion is issued assuming that the financial statements are free from material misstatement and is the most common type of auditor’s opinion. An unqualified is equivalent to an impeccable report and indicates that the auditor is satisfied with the company’s financial reporting. This is the type of opinion most companies expect from independent auditors, assuring the company’s investors that the financial information they receive is accurate and fairly presented. Therefore, the low identified percentage of this indicator puts pressure on the audit risk assessment process.
Another critical indicator we can observe in this analysis is the “Audit Fees–Significant Non-Audit Fees”, being identified for the companies from the Central and Eastern part of Europe as 14%, while for the rest of the countries in a higher proportion, namely 35%. This indicator ranks as the European country’s most identified accounting quality risk index. In contrast, for the CEECs, this indicator ranks only fourth in terms of importance, which means that in a series of data numbers, the frequency distribution of the first digit was not uniform but negatively exponential.
According to
Audit Analytics (
2022), to address concerns that auditors who provide non-auditing services may compromise their independence, the SEC has created audit fee categories that registrants must disclose: audit fees, audit-related fees, taxes, and all other fees. All categories combined, excluding exam fees, are considered “non-examination fees.”
The last indicator that registered a significant percentage is the “Audit Fees–Significant Change” index, the most significant accounting quality indicator found for the CEECs. This indicator represents 24% of the total identified flags for European companies. In contrast, the indicator exceeds 30% of the identified signals for Eastern and Central European countries.
According to
Ridzky and Fitriany (
2022), one of the factors that influences the quality of risk assessment is the auditor’s fee paid by the client. Audit fees are determined through negotiations between the audit firm and the client. As a result, audit fees can be set lower or higher than normal. Considering our case study, this indicator could impact future risk assessment processes and create new perspectives on the topic.
What is very interesting is the fact that this indicator and the “Audit Fees–High Outlier” indicator were highlighted in the audit reports of all companies in Eastern and Central Europe for the reported period.
The severity of the flags is presented in
Table 4.
Table 4 shows that 70% of the flags were of notable severity (noted with 1), and only 4.6% were critical (noted with 3). This fact shows that European companies have low audit risks, which can lead to the idea that they have solid governance.
To have an overview, we considered it relevant to observe the areas of activity for the identified accounting quality risk indicators. The primary industries the companies activate are set out in
Table 5 by Standard Industrial Classification (SIC) code (
SICCODE.com 2023).
Table 5 shows that the companies with the field of activity directed in finance insurance and real estate represent 32% of the reports of the CEECs on which the financial auditors identified AQRM flags. At the same time, we realize that with the European small- and mid-sized companies it is represented by a higher percentage (43%) with 1017 AQRM flags, which indicates an alarm signal regarding the gaps in these sectors, sometimes the tendency to circumvent the regulations and the need to improve the process of carrying out the activity.
Let us think about the numerous financial scandals which have taken place and the situations where insurance or real estate construction companies failed to fulfill their services to clients due to the lack of cash flow or the problematic situations in which they were. We realize that these figures are as authentic as possible, and if the analysis were carried out on several continents, it would increase.
The second essential category represents the manufacturing sector 20–29 (pharmaceutical and chemical products). According to the performed analysis, 18% of the European companies from this activity area presented risk assessment in the audit process. To the same extent, the companies from Central and Eastern Europe in this sector did not have a high percentage of accounting quality risk indicators, thus ranking in fifth place with a rate of 10% (the number of flags being 23). However, these percentages are significant because most identified flags were found during 2019–2021, when the world faced the COVID-19 pandemic, a time when the population put its beliefs in scientific research and pharmaceutical companies; some were serious, while others just built to make a profit. Therefore, we can understand the appearance of the “red flags” in the quality of the audit process of enterprises.
In the second tagged sector from CEECs, we notice that 20% of activities are included in the group of services 70–79 (business and government establishments, hotels, and other lodging places; business repair and amusement services; engineering, educational institutions; membership organizations, and other miscellaneous services). While for the organizations from the rest of the countries, this sector represented only 8% of the activity area in which the companies presented audit reports with a high evaluation risk. Through this analysis, we concluded that the group services 80–89 (computer programming services, data processing) did not significantly impact the carried-out research since the identified percentage at the European level was small (6%).
Moreover, we did not identify any qualitative accounting risk indicators for the companies in CEECs. The construction and mining services area represents the activity that registered the lowest number of accounting quality risk indicators for enterprises from the European continent (5%) and organizations from the center and east side of the continent (2%). In this sector of activity, companies from Lithuania and Slovakia carry out their business, thus resulting in four reports with a high risk on the quality of the audit assessment process and automatically creating the audit report.
According to the results, we realize that some activities are more affected by the accounting quality risks than others, depending on how national regulations are managed, risk management perspectives and companies’ ethical cultures, but also depending on the country’s cultural influences.
Smaller and mid-size companies should focus on regulations, developing technology and compliance (
Escaloni and Mareque 2021). Decreased financial controls, increased related party transactions, and reduced ability to close books (provisions and the accuracy of provisions) can be subject to convoluted tax requirements. An experienced professional involved in the audit process can bring advantages and efficiencies to the audit process. The pressure on testing costs for SMEs should ease. Many smaller clients are willing to pay for audits that add value and provide proper business advice. Changing markets and new services requires significant investments in skills and technology, moving away from traditional practice models and developing new working methods.
4. Conclusions
The lack of transparency or opacity and, therefore, the uncertainty of regulatory policy has a negative impact on SMEs, creating additional costs for them due to the fewer resources and skills to deal with these factors.
Transparent, fair rules, access to information on the procedures required to enter the domestic and export market, and free competition are primarily for the benefit of SMEs. The law aims to promote the sustainable development of small- and mid-size enterprises by improving the legal framework and the economic environment in which they are created and operated. The law aims to ensure and increase the competitiveness and performance of micro, small and medium enterprises and to facilitate the prompt adjustment to economic and technological changes.
According to the results of this study, we realize that “Audit Fees–Significant Change” and “Audit Fees-Significant Non-Audit Fees” were the most identified indicators for both European enterprises and CEECs. This fact indicates that the auditors have paid particular attention to the possibility of detecting risk assessment in the changes regarding audit and non-audit fees, as the two indicators point to this.
At the same time, we realize that the fields of activity found in Manufacturing Groups 70–79 and Services and areas of finance, insurance, and real estate represented the most risks in which external and internal factors affected the quality of the audit risk assessment process. The object of this paper was to highlight the leading accounting quality risk indicators found by the auditors in the audit reports and how this may affect the company’s value. The study’s results showed an average trend of 15–16 reported situations per year, with a substantial increase over the last years for CEECs.
The main conclusion from the study is that the uncertainties reported by the auditors depend more on the company’s field of activity and how it is managed; therefore, the SME sector should be coordinated according to the accounting regulations regarding the principles and the content of the financial reports.
Castillo-Merino et al. (
2020) and
Porcuna-Enguix et al. (
2021) have conducted similar studies analyzing the relationship between non-audit services and audit quality using several indicators to measure the quality of the audit process. According to their results, some future non-audit fees might compromise the independence of auditors and, therefore, the audit quality. When the audit process is conducted correctly, the audit risk assessment should lower the audit risk to an average level.
Considering the fast evolution of risks that may affect the audit reports of a small company and the fact that this topic has yet to be thoroughly researched, we find it relevant.
Through this study, we have proven that there is an essential connection between the identified accounting quality risk indicators and the audit reports issued by the specialized organizations. For successful performance, small companies must emphasize identifying risks that can impact financial institutions. This accomplishment can be achieved by identifying qualitative or performance indicators such as those we identified in this article. By emphasizing this aspect, the audit assessment risk can decrease substantially.
The contribution of this article consists of a systematic analysis of the audit risk matrix completing the existing literature, which is why the field can be discussed more widely. Since all the information was extracted from only one database (Audit Analytics), this paper faced a series of limitations such as the small number of identified companies and the lack of financial information from Central and Eastern European companies; therefore, there is enough space for future research using other viable and prestigious database platforms. It is no secret that companies from the eastern part of Europe still face the compliance and imposition of accounting rules and the corresponding auditor regulations. This situation limits researchers in this area of expertise, but we can also see it as an advantage since the area needs to be thoroughly researched.
Analyzing the results of this research, we concluded that although this topic has been studied in various financial fields, it has never been presented in this way before and if we consider the development of new risks, we can say that this article can only begin a series of research in this area, considering the numerous possibilities for future studies.
The main limitation of the paper can be an opportunity for the possible future research directions, these being the expansion of the sample over a significant number of companies, and why not even use a database whose information includes companies listed on the US Stock Exchange. At the same time, we can consider developing a bibliometric analysis of the topic. Therefore, creating a qualitative statistical analysis for an econometric model analyzing the factors that influence the content of financial documents might be the next step of this research.


