
Do Aid for Trade Flows Affect Technology Licensing in Recipient Countries?

Abstract
:1. Introduction
2. Literature Review and Theoretical Discussion
2.1. Advantages of Technology Licensing
2.2. A Literature Review on the Effect of Trade Costs on Innovation
3. Empirical Analysis
3.1. Model Specification
3.1.1. Effect of the Country’s Size
3.1.2. Effects of Adverse Environmental and External Economic and Financial Shocks
3.1.3. Effect of Human Capital
3.1.4. Effect of Financial Development
3.1.5. Effect of the Quality of Institutions and Governance
3.2. Data Analysis
3.3. Econometric Approach
4. Interpretation of Results
5. Additional Analysis
6. Conclusions
Funding
Data Availability Statement
Acknowledgments
Conflicts of Interest
Appendix A. Definition and Source of Variables
| Variables | Definition | Source |
| RLFP | This is the ‘transformed’ indicator of the royalties and license fee payments made by a developing country (in a given year) for the use of the owner’s intellectual property under agreed terms. The initial indicator of royalties and license fee payments made was expressed in current US dollars. We have deflated it with the GDP deflator (constant 2015 US dollars) and obtained an indicator denoted “RLFP1”. However, it appears that the latter contains many zeros and has a highly skewed distribution. Therefore, we have transformed it as follows so as to obtain the indicator “RLFP”: RLFP . | The author’s calculation is based on data extracted from the World Development Indicators (WDI). |
| AfTTOT, AfTINFRA, AfTPROD, AfTPOL | “AfTINFRA” is the real gross disbursement of Aid for Trade allocated to the buildup of economic infrastructure. “AfTPROD” is the real gross disbursement of Aid for Trade for building productive capacities. “AfTPOL” is the real gross disbursement of Aid allocated for trade policies and regulations. “AfTTOT” is the total real gross disbursements of total Aid for Trade. It is the sum of the three components of the official development aid described above. All four AfT variables are expressed as constant prices in the 2019 US Dollar. | The author’s calculation are based on data extracted from the OECD statistical database on development, in particular the OECD/DAC-CRS (Organization for Economic Cooperation and Development/Donor Assistance Committee)-Credit Reporting System (CRS). Aid for Trade data covers the following three main categories (the CRS Codes are in brackets): Aid for Trade for Economic Infrastructure (“AfTINFRA”), which includes transport and storage (210), communications (220), and energy generation and supply (230); Aid for Trade for Building Productive Capacity (“AfTPROD”), which includes banking and financial services (240), business and other services (250), agriculture (311), forestry (312), fishing (313), industry (321), mineral resources and mining (322), and tourism (332); and Aid for Trade Policy and Regulations (“AfTPOL”), which includes trade policy and regulations and trade-related adjustment (331); |
| TRCOST | This is an indicator of the average comprehensive (overall) trade costs. The average overall trade costs (including both tariff and nontariff costs) have been calculated for a given country in a given year as the average of the bilateral overall trade costs on goods across all trading partners of this country. Data on bilateral overall trade costs has been computed by Arvis et al. (2012, 2016) following the approach proposed by Novy (2013). Arvis et al. (2012, 2016) have built on the definition of trade costs by Anderson and van Wincoop (2004) and considered bilateral comprehensive trade costs as all costs involved in trading goods (agricultural and manufactured goods) internationally with another partner (i.e., bilaterally) relative to those involved in trading goods domestically (i.e., intranationally). Hence, the bilateral comprehensive trade costs indicator captures trade costs in their wider sense, including not only tariffs and international transport costs but also other trade cost components discussed in Anderson and van Wincoop (2004), such as direct and indirect costs associated with differences in languages and currencies, as well as cumbersome import or export procedures. Higher values of the indicator of average overall trade costs indicate higher overall trade costs. | Author’s computation using the ESCAP-World Bank Trade Cost Database. Accessible online at: https://www.unescap.org/resources/escap-world-bank-trade-cost-database (accessed on 1 December 2021). Detailed information on the methodology used to compute the bilateral comprehensive trade costs could be found in Arvis et al. (2012, 2016), as well as in the short explanatory note accessible online at: https://www.unescap.org/sites/default/d8files/Trade%20Cost%20Database%20-%20User%20note.pdf (accessed on 1 December 2021). |
| TARIFF | This is an indicator of average tariff costs. It is the tariff component of the average overall trade cost. We have computed it for a given country in a given year as the average of the bilateral comprehensive tariff costs across all trading partners of this country. Data on the bilateral tariff costs indicator has been computed by Arvis et al. (2012, 2016). As the bilateral tariff costs indicator is (like the comprehensive trade costs) bi-directional in nature (i.e., it includes trade costs to and from a pair of countries), Arvis et al. (2012) have measured it as the geometric average of the tariffs imposed by the two partner countries on each other’s imports (of agricultural and manufactured goods). Higher values of the indicator of average tariff costs show an increase in average tariff costs. | Author’s computation using the ESCAP-World Bank Trade Cost Database. Detailed information on the methodology used to compute the bilateral tariff costs could be found in Arvis et al. (2012, 2016), as well as in the short explanatory note accessible online at: https://www.unescap.org/sites/default/d8files/Trade%20Cost%20Database%20-%20User%20note.pdf (accessed on 1 December 2021). |
| NONTARIFF | This is an indicator of average nontariff costs. It represents the second component (i.e., the nontariff component) of the comprehensive trade costs. This is an indicator of comprehensive trade costs, excluding tariff costs. We have computed it for a given country in a given year as the average of the bilateral comprehensive nontariff costs (i.e., the comprehensive trade costs, excluding the tariff costs) across all trading partners of this country. Data on the bilateral nontariff costs indicator has been computed by Arvis et al. (2012, 2016), following Anderson and van Wincoop (2004). Comprehensive trade costs, excluding tariffs, encompass all additional costs other than tariff costs involved in trading goods (agricultural and manufactured goods) bilaterally rather than domestically. Higher values of the indicator of average nontariff costs reflect a rise in nontariff costs. Detailed information on the methodology used to compute the bilateral nontariff costs could be found in Arvis et al. (2012, 2016), as well as in the short explanatory note accessible online at: https://www.unescap.org/sites/default/d8files/Trade%20Cost%20Database%20-%20User%20note.pdf (accessed on 1 December 2021). | Author’s computation using the ESCAP-World Bank Trade Cost Database. Detailed information on the methodology used to compute the bilateral nontariff costs could be found in Arvis et al. (2012, 2016), as well as in the short explanatory note accessible online at: https://www.unescap.org/sites/default/d8files/Trade%20Cost%20Database%20-%20User%20note.pdf (accessed on 1 December 2021). |
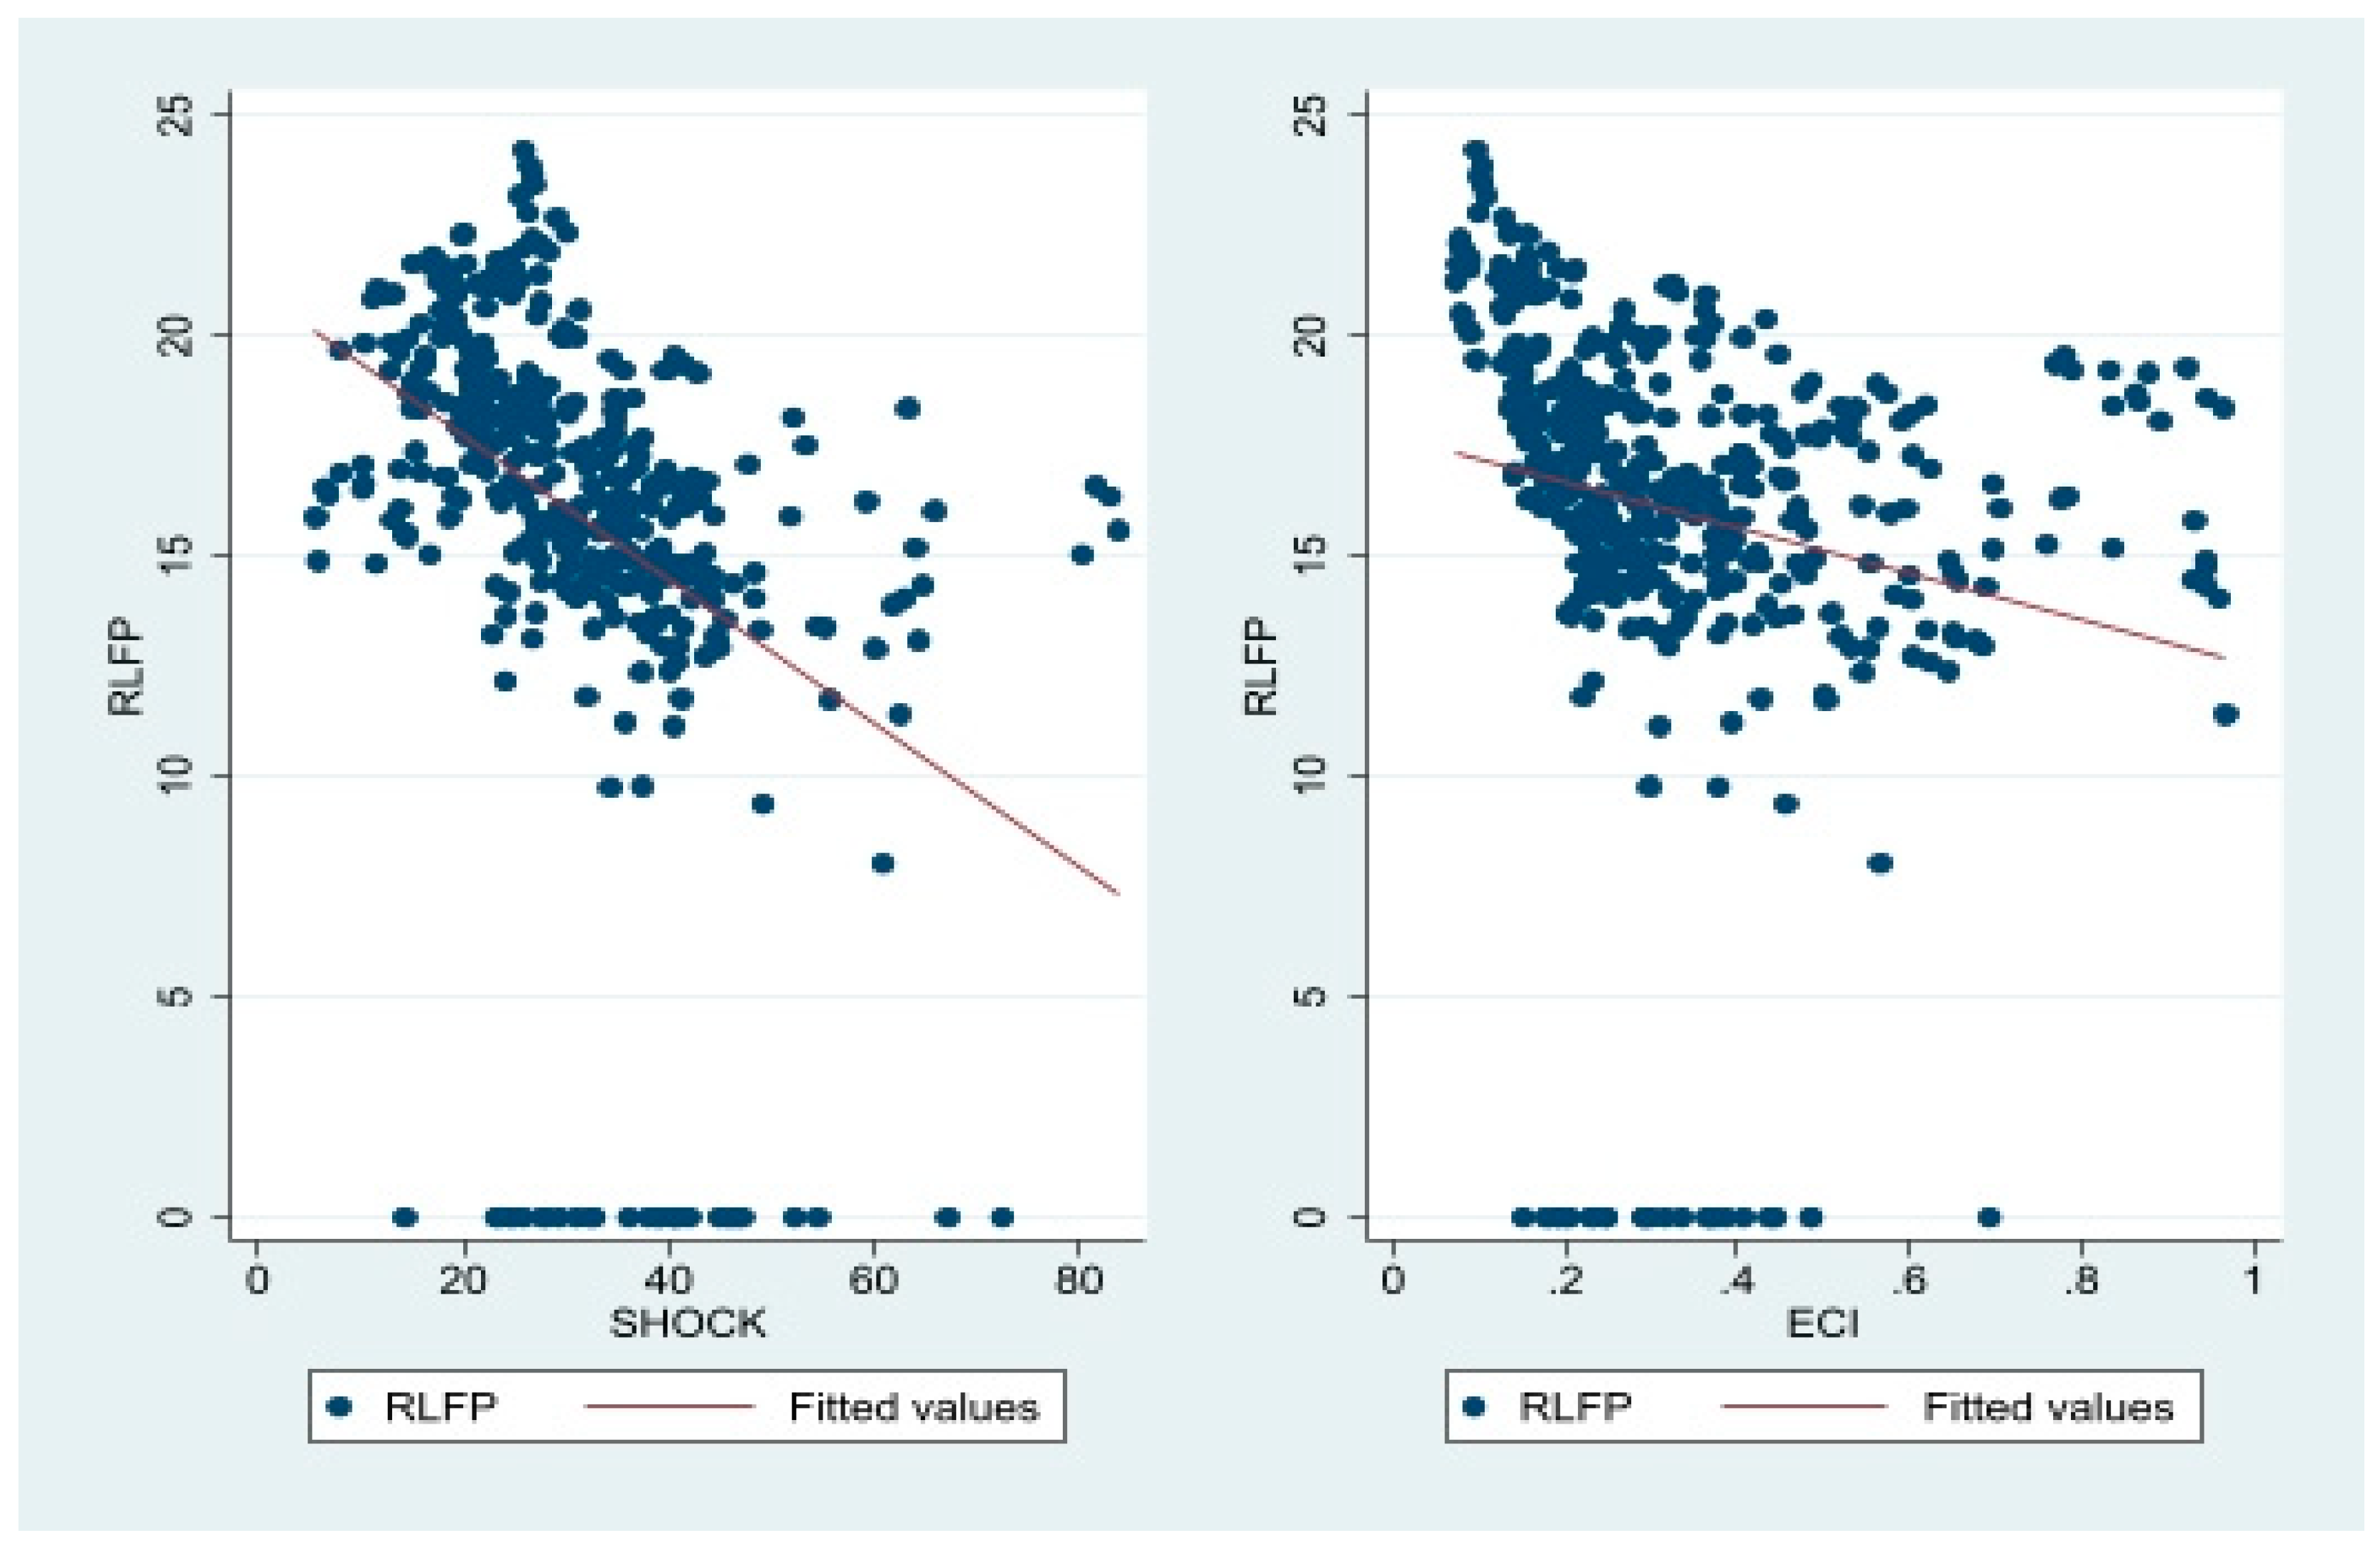
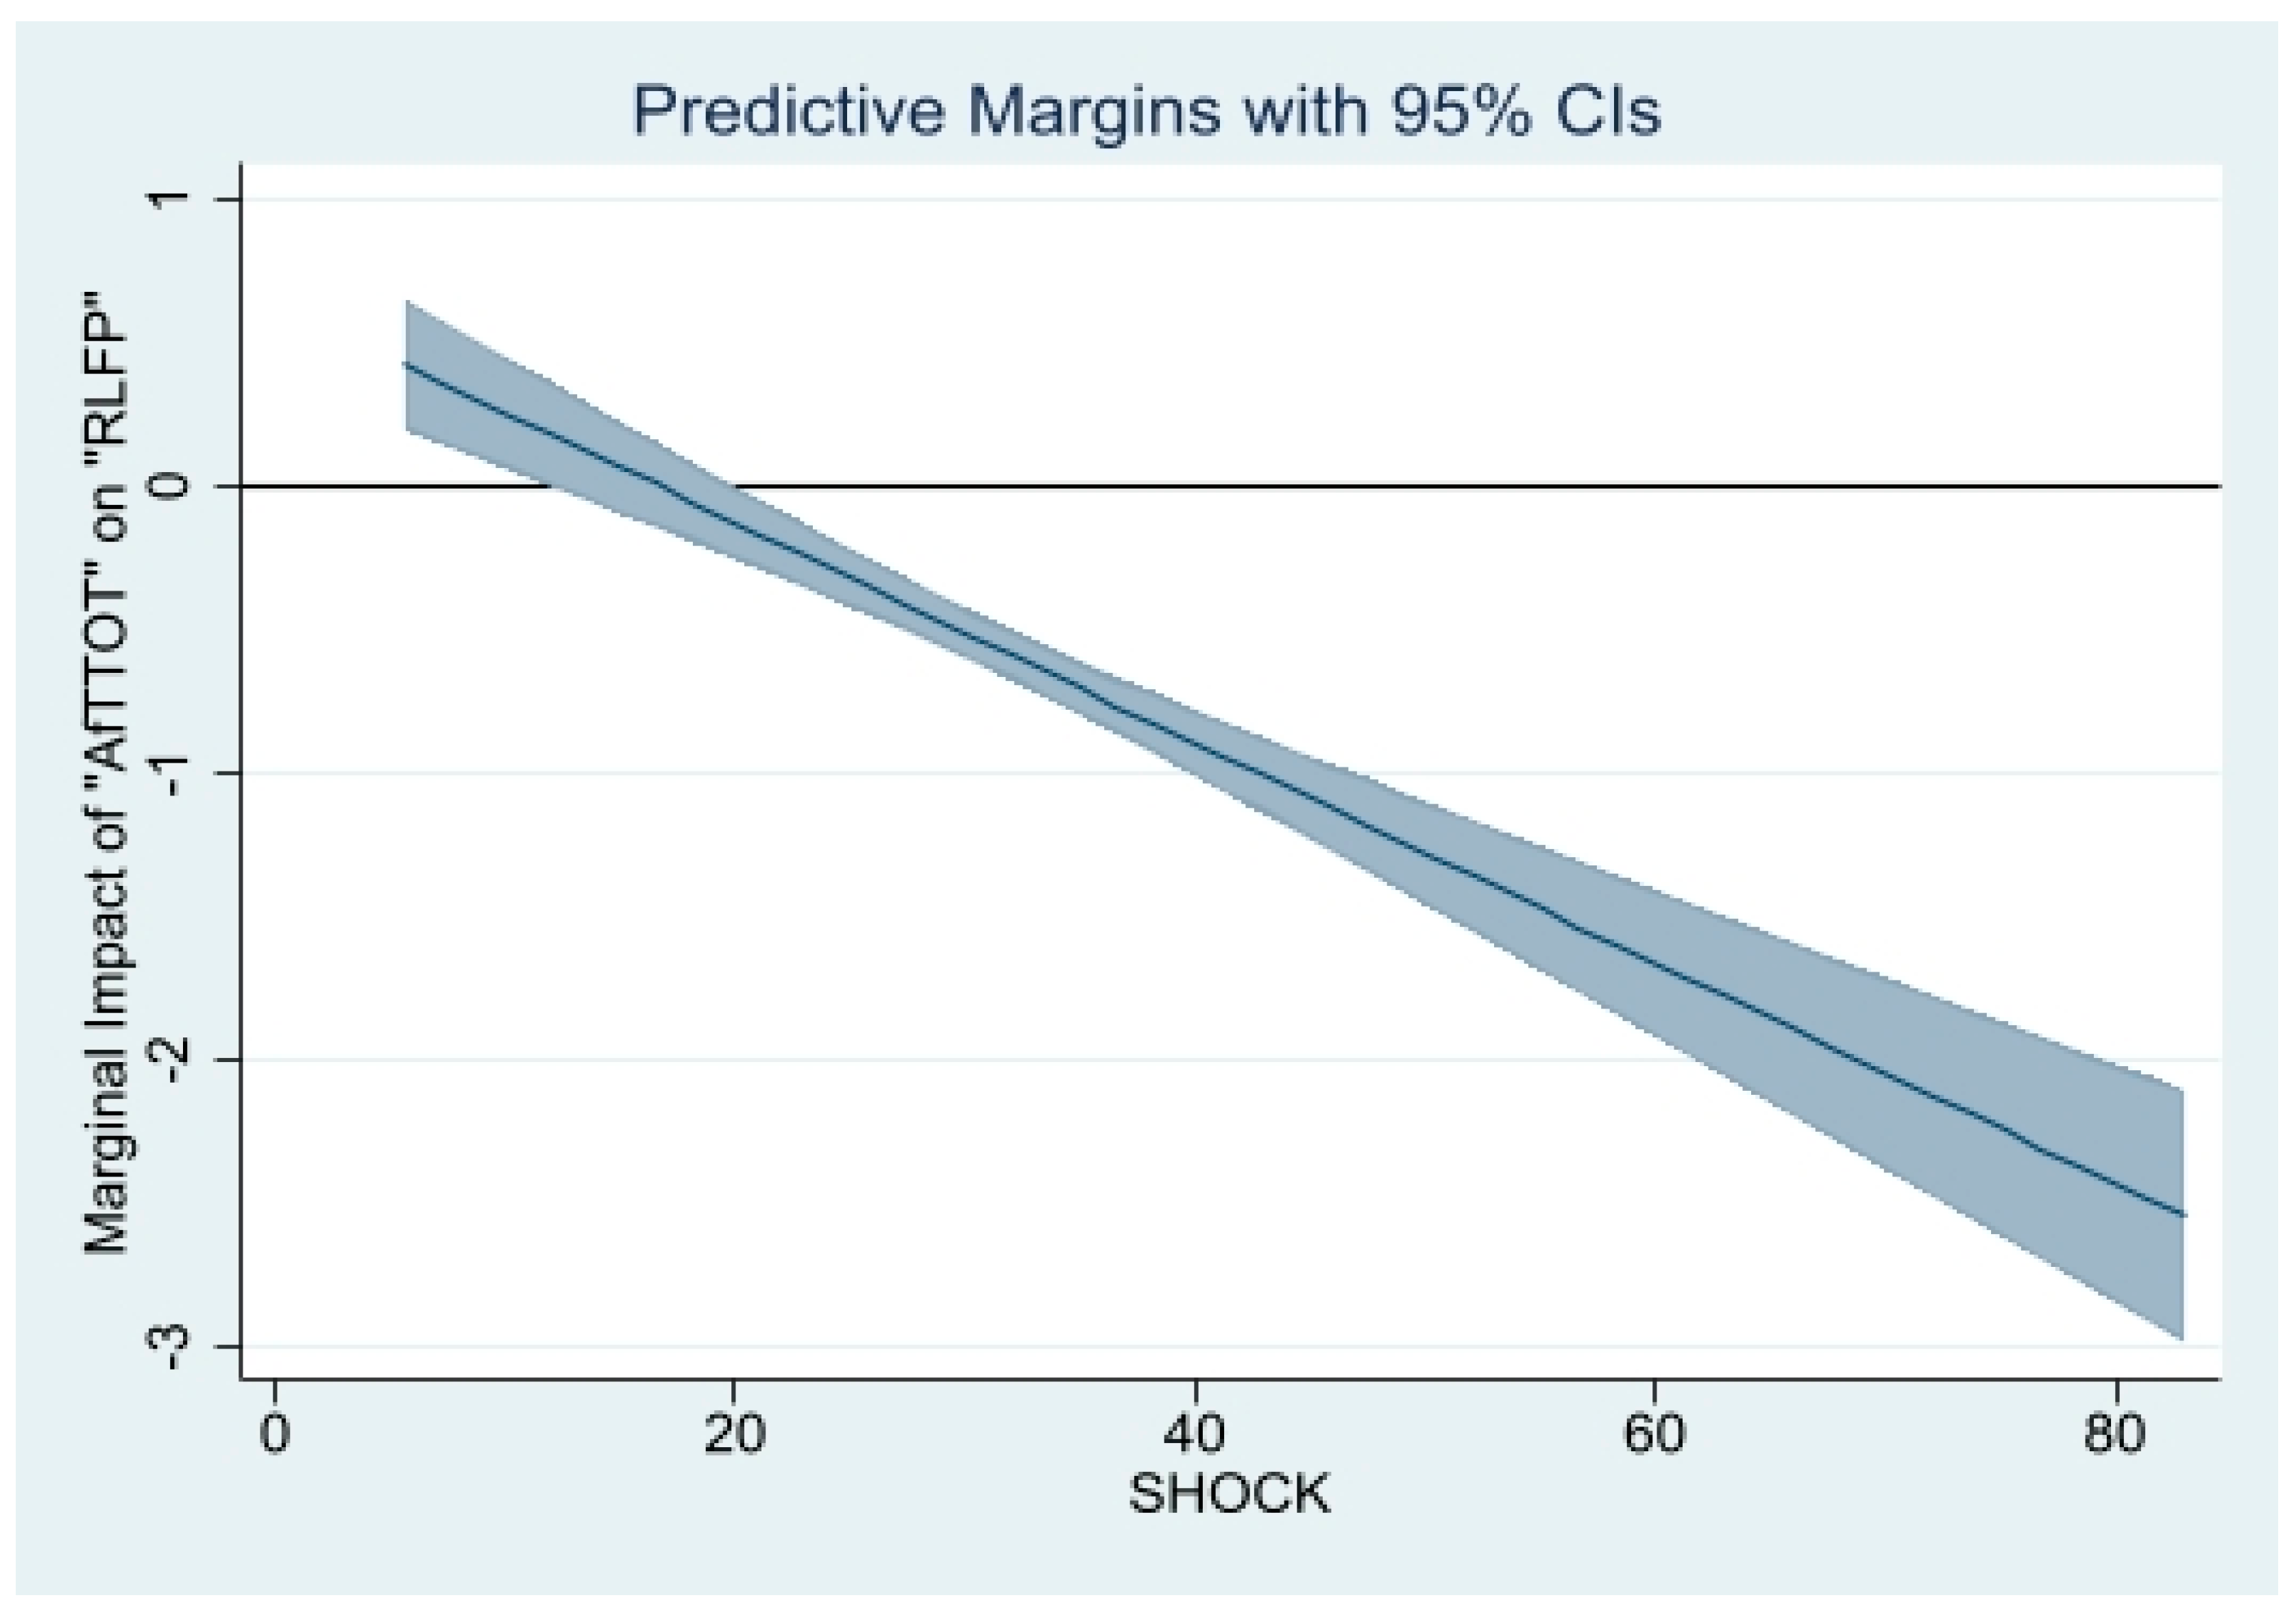
| SHOCK | This is an indicator of the intensity of environmental and exogenous economic and financial shocks. This indicator has been computed as the weighted average of three components, namely the agricultural production instability, the export instability, and the victims of natural disasters. This indicator of the intensity of shocks is one of the two components of the economic vulnerability index set up at the United Nations by the Committee for Development Policy (CDP) and used by the latter as one of the criteria for identifying LDCs. It has been computed on a retrospective basis for 145 developing countries (including 48 LDC) by the “Fondation pour les Etudes et Recherches sur le Developpement International” (FERDI). The values of the indicator “SHOCK” range from 0 to 100. For further details on the computation of the EVI, see, for example (Feindouno and Goujon (2016). | Data on EVI are extracted from the database of the Fondation pour les Etudes et Recherches sur le Developpement International (FERDI)—see online at: https://ferdi.fr/donnees/un-indicateur-de-vulnerabilite-economique-EVI-retrospectif (accessed on 1 December 2021). |
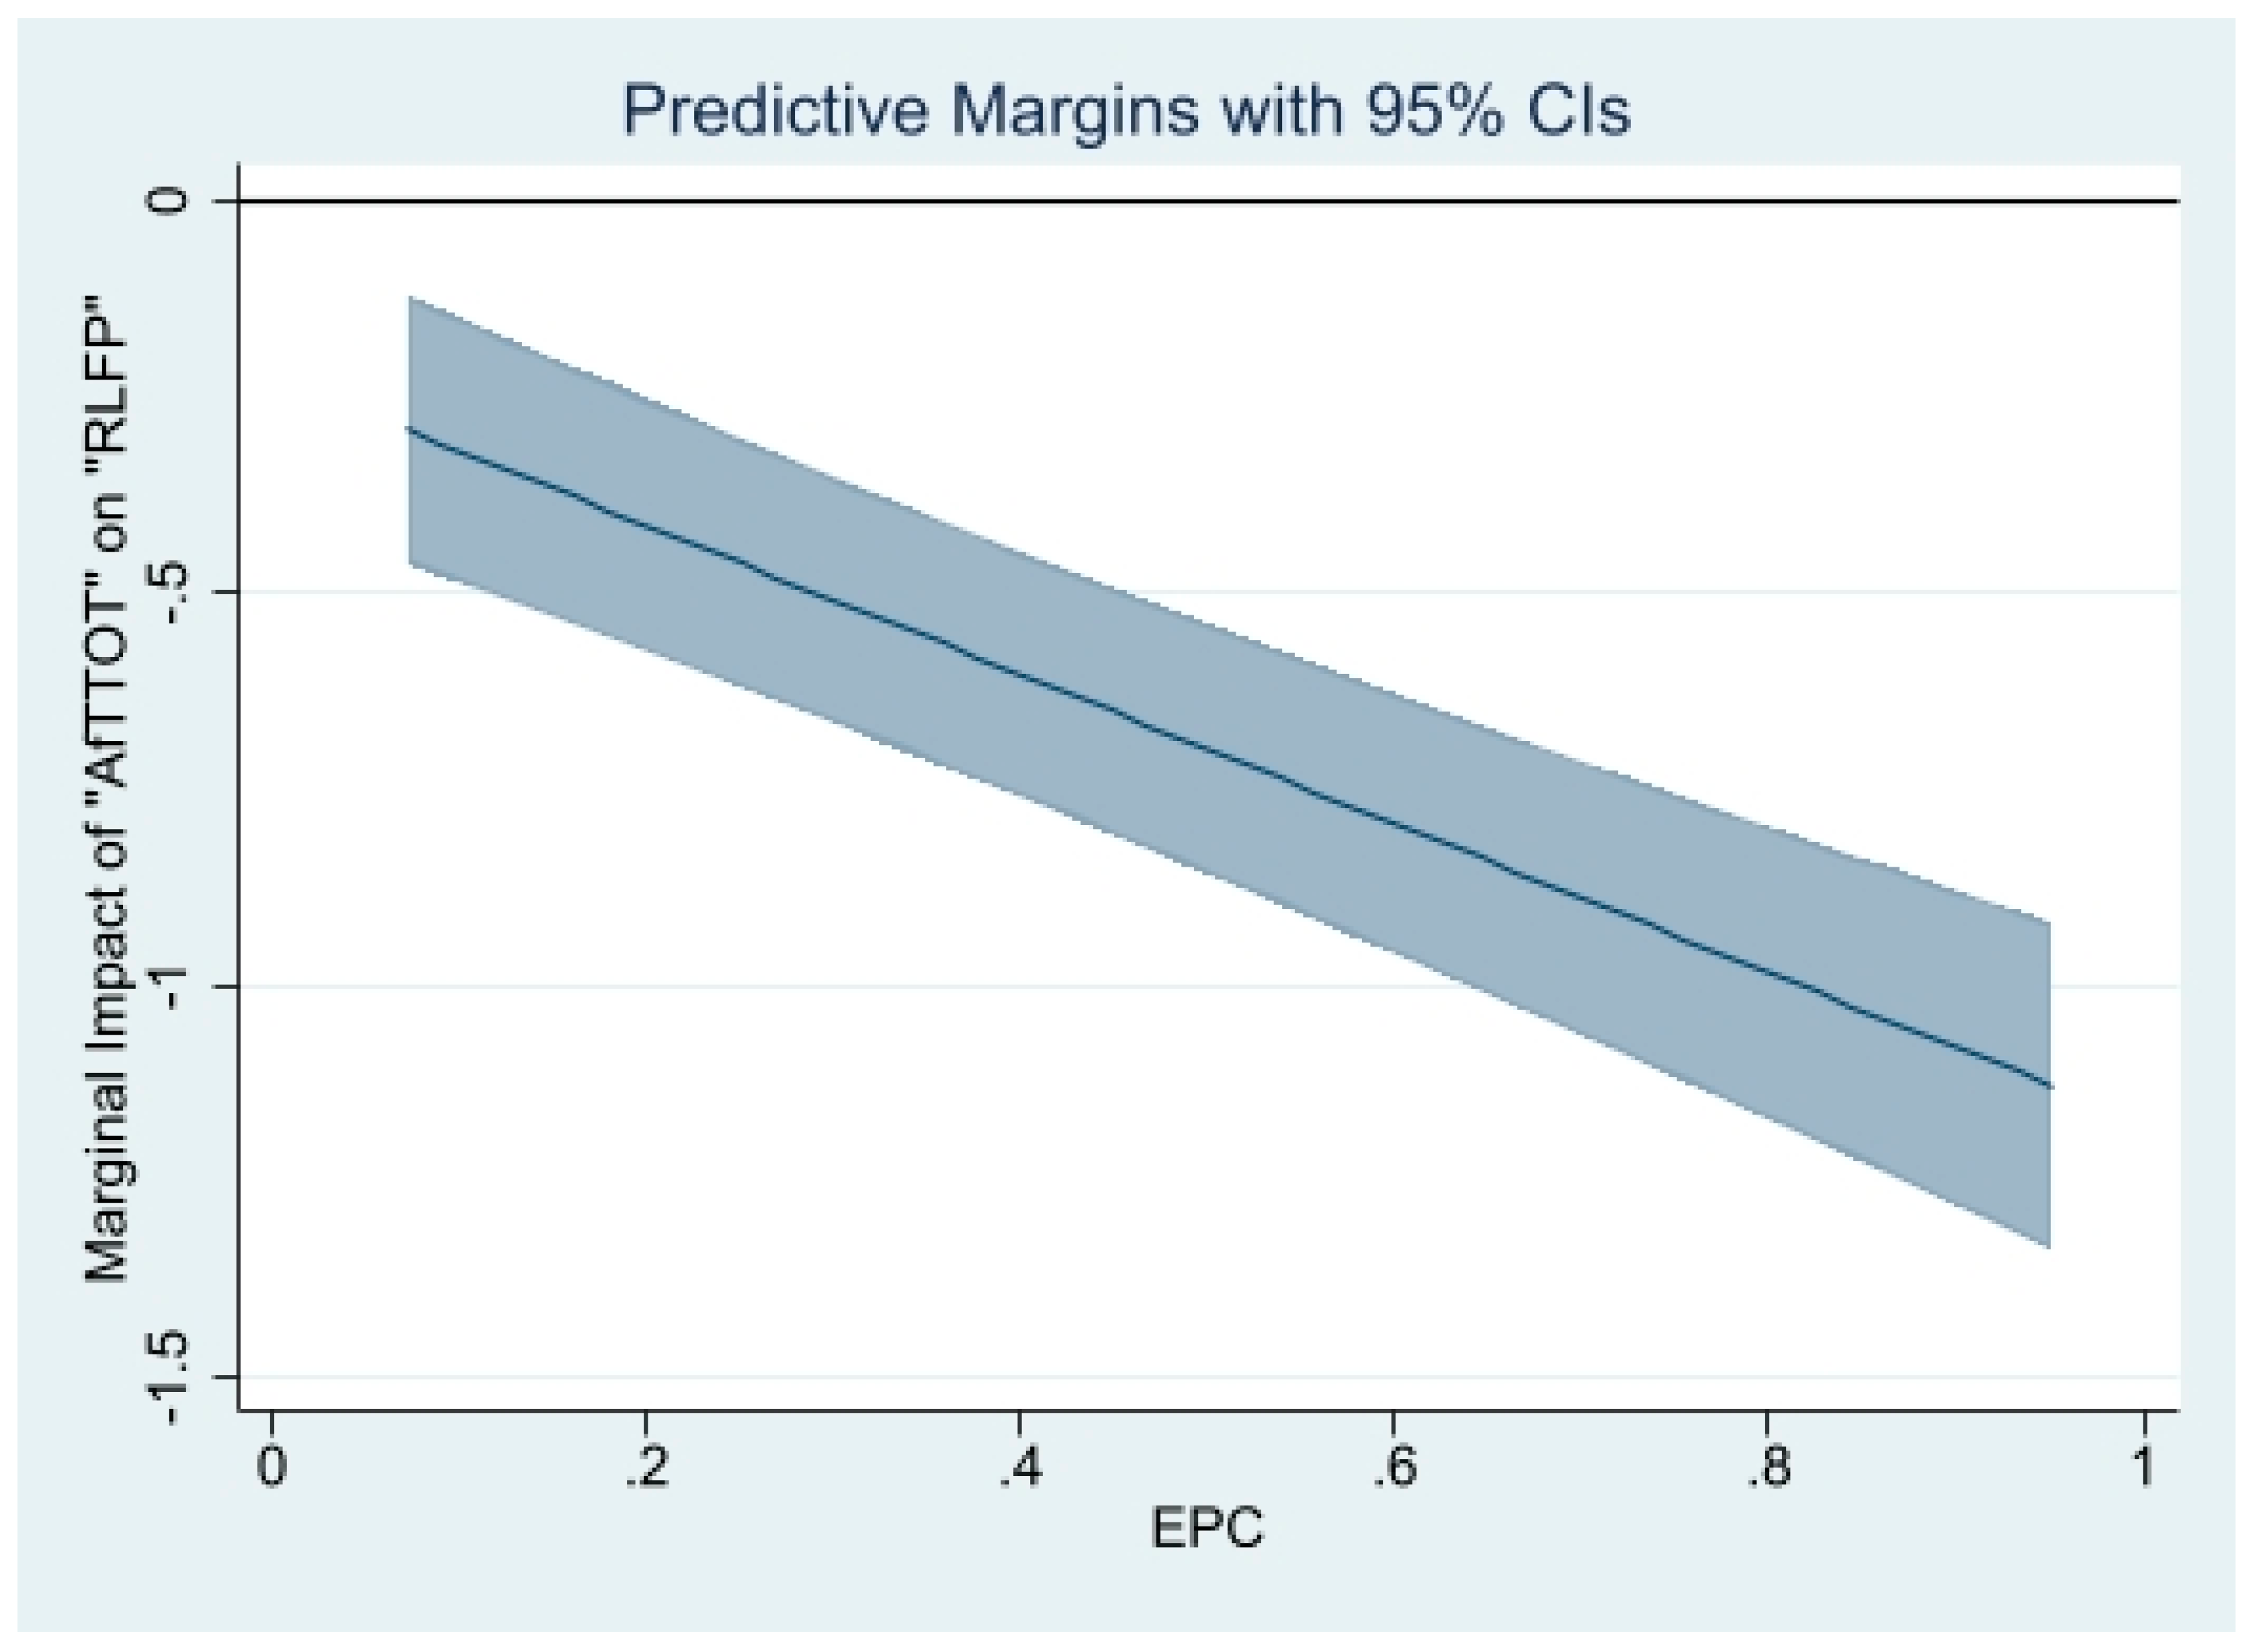
| EPC | This is the export product concentration Index. It is calculated using the Herfindahl-Hirschmann Index, and its values are normalized so that they range between 0 and 1. An index value closer to 1 indicates a country’s exports are highly concentrated on a few products. On the contrary, values closer to 0 reflect that exports are more homogeneously distributed among a series of products. | United Nations Conference on Trade and Development (UNCTAD) Database. See online: http://unctadstat.unctad.org/wds/TableViewer/tableView.aspx?ReportId=120 (accessed on 1 December 2021). |
| GDPC | Real per capita Gross Domestic Product (constant 2015 US$). | WDI |
| HUM | This is an indicator of human capital. It is measured by the number of years of schooling and returns to education. | Penn World Tables PWT 10.0 (see Feenstra et al. 2015). |
| POP | Total Population | WDI |
| FD | This is a proxy for financial development and is measured by the share (%) of domestic credit to the private sector by banks in GDP. | WDI |
| INST | This is the variable capturing the institutional quality. It has been computed by extracting the first principal component (based on factor analysis) of the following six indicators of governance: These indicators are, respectively: political stability and absence of violence/terrorism; regulatory quality; rule of law; government effectiveness; voice and accountability; and corruption. Higher values of the index “INST” are associated with better governance and institutional quality, while lower values reflect worse governance and institutional quality. | Data on the components of “INST” variables has been extracted from World Bank Governance Indicators developed by Kaufmann et al. (2010) and updated recently. See online at: https://info.worldbank.org/governance/wgi/ (accessed on 1 December 2021). |
Appendix B. Descriptive Statistics on Variables Used in the Analysis
| Variable | Observations | Mean | Standard Deviation | Minimum | Maximum |
| RLFP1 | 333 | 672,000,000 | 2,740,000,000 | 0 | 32,900,000,000 |
| AfTTOT | 333 | 282,000,000 | 430,000,000 | 1,927,895 | 3,670,000,000 |
| AfTINFRA | 333 | 168,000,000 | 291,000,000 | 95113.670 | 3,170,000,000 |
| AfTIPROD | 333 | 109,000,000 | 171,000,000 | 47382.330 | 1,840,000,000 |
| AfTPOL | 332 | 4,885,616 | 12,000,000 | 4979 | 165,000,000 |
| TRCOST | 331 | 321.425 | 57.576 | 172.718 | 473.515 |
| TARIFF | 324 | 1.096 | 0.020 | 1.047 | 1.176 |
| NONTARIFF | 323 | 279.786 | 54.427 | 149.745 | 433.378 |
| SHOCK | 333 | 29.781 | 11.875 | 5.653 | 82.998 |
| ECI | 333 | 0.326 | 0.194 | 0.073 | 0.968 |
| GDPC | 333 | 4142.975 | 3559.740 | 282.240 | 16,031.540 |
| HUM | 333 | 2.239 | 0.529 | 1.147 | 3.571 |
| FD | 333 | 39.677 | 32.053 | 3.685 | 159.366 |
| INST | 333 | −0.942 | 1.275 | −3.982 | 2.987 |
Appendix C. List of Countries Used in the Full Sample
| Full Sample | ||
| Algeria | Guatemala | Nicaragua |
| Angola | Guyana | Niger |
| Argentina | Honduras | Nigeria |
| Armenia | India | Pakistan |
| Bangladesh | Indonesia | Panama |
| Belize | Iraq | Paraguay |
| Benin | Jamaica | Peru |
| Bolivia | Jordan | Philippines |
| Botswana | Kazakhstan | Rwanda |
| Brazil | Kenya | Senegal |
| Burkina Faso | Kyrgyz Republic | Sierra Leone |
| Burundi | Lao PDR | South Africa |
| Cambodia | Lesotho | Sri Lanka |
| Cameroon | Madagascar | Sudan |
| Chile | Malawi | Syrian Arab Republic |
| China | Malaysia | Tajikistan |
| Colombia | Maldives | Tanzania |
| Congo, Dem. Rep. | Mali | Thailand |
| Costa Rica | Mauritania | Togo |
| Cote d’Ivoire | Mauritius | Tunisia |
| Dominican Republic | Mexico | Turkey |
| Ecuador | Mongolia | Uganda |
| Egypt, Arab Rep. | Morocco | Uruguay |
| El Salvador | Mozambique | Zambia |
| Eswatini | Myanmar | Zimbabwe |
| Fiji | Namibia | |
| 1 | Licensing may occur within firms, among joint ventures, or between unrelated firms (e.g., Hoekman and Javorcik 2006). |
| 2 | See Benziane et al. (2022) for a literature review on the matter. |
| 3 | See Appendix A for a detailed description of the coverage of each of these categories of development aid. |
| 4 | See the literature survey provided by Benziane et al. (2022). |
| 5 | See a recent literature survey by Akcigit and Melitz (2021). |
| 6 | Nevertheless, studies such as those of Eaton and Kortum (2001) have shown that trade barriers exert no significant effect on innovation. In fact, in their baseline model, the effect of a larger market size is counteracted by the increased competition with technologies embedded in imports, so that there is ultimately no effect of lower barriers to trade on innovation. |
| 7 | Spending on technology was measured by the author in various ways, for example, as spending on technology per worker and spending on technology over sales. |
| 8 | Bloom et al. (2013) gave the example of a shoe company that faces an unexpected low-cost import competition. The workers of this firm might be trapped because they have human capital specific to this firm, which will be lost if they move to other firms. Moreover, it could be costly to uproot and sell the physical capital. Thus, further to the fall in the price of one of the goods produced by the firm (due to the import competition, which is an adverse trade shock for the firm), the opportunity cost falls for the inputs that are trapped within the firm. As a result, the firm will innovate more, not because the value of a newly designed good has increased but because the opportunity cost of the inputs used to design and produce new goods has fallen. |
| 9 | The author has further found that the reduction in production costs by firms that install more advanced capital-intensive technologies leads to a reallocation of production shares toward exporters, with the consequence of amplifying the initial reallocation effects put forth by Melitz (2003), thereby further increasing aggregate industry productivity. |
| 10 | Many of these studies have performed a firm-level analysis. Other theoretical works, such as Yang and Maskus (2001b), have considered the relationship between IPRs and technology licensing. They have shown that stronger IPRs increase the licensor’s share of rents and reduce the costs of licensing contracts. Gallini (1984) has shown that an incumbent firm may license its production technology to reduce the incentives of a potential entrant (i.e., the firm’s rival) to develop its own, possibly better, technology. |
| 11 | A similar exercise has been performed by Park and Lippoldt (2008), who, in examining the economic implications of IPRs in developing countries, have considered the effect of IPR protection on technology licensing in the services sector, i.e., the royalties pertain to the importation of technological services, measured by the license fees and royalties paid for the use of foreign intangible assets (like intellectual property and know-how). |
| 12 | See, for example, the literature review by Miklian and Hoelscher (2021). |
| 13 | This indicator is described later in the analysis as well as in Appendix A. |
| 14 | This endogeneity problem stems from the correlation between the lagged dependent variable and countries’ unobserved time-invariant-specific effects in the error term. |
| 15 | The indicators of tariff costs and non-tariff costs are described in Appendix A. |
| 16 | It is worth recalling here that we hypothesized that the effect of AfT flows on technology licensing works through the channel of trade costs. |
| 17 | We notice that over the last sub-period of the dataset (i.e., 2017–2019), 37.66 percent of countries had tariff costs lower than 1.09. |
| 18 | In the full sample, over the last sub-period (i.e., 2017–2019), only China had nontariff costs lower than 156.25. For this country, the value of nontariff costs in 2017–2019 amounted to 149.74. |
| 19 | In the full sample, over the last sub-period (i.e., 2017–2019), eight countries experienced nontariff costs ranging between 156.25 and 215. These countries (with their values of nontariff costs in brackets) are as follows (in ascending order): Panama (166.43); India (170.24); Turkey (171.18); Malaysia (173.95); Thailand (181.92); South Africa (185.05); Egypt, the Arab Republic (199.27), and Brazil (202.75). |
| 20 | We notice that over the last sub-period of the dataset (i.e., 2017–2019), 83.12 percent of countries had nontariff costs higher than 215. |
| 21 | The values of the indicator “SHOCK” in Appendix B range between 5.65 and 83 (see Appendix B). |
References
- Aarstad, Jarle, and Olav Andreas Kvitastein. 2021. An unexpected external shock and enterprises’ innovation performance. Applied Economics Letters 28: 1245–48. [Google Scholar] [CrossRef]
- Aguiar, Mark, and Gita Gopinath. 2007. Emerging Markets Business Cycles: The Cycle is the Trend. Journal of Political Economy 115: 11–69. [Google Scholar] [CrossRef]
- Akcigit, Ufuk, and Marc Melitz. 2021. International Trade and Innovation. NBER Working Paper 29611. Cambridge, MA: National Bureau of Economic Research. Available online: http://www.nber.org/papers/w29611 (accessed on 29 November 2021).
- Anand, Bharat. N., and Tarun Khanna. 2000. The structure of licensing contracts. The Journal of Industrial Economics 48: 103–35. [Google Scholar] [CrossRef]
- Anderson, James E., and Eric van Wincoop. 2004. Trade Costs. Journal of Economic Literature 42: 691–751. [Google Scholar] [CrossRef]
- Archibugi, Daniele, Andrea Filippetti, and Marion Frenz. 2013. Economic Crisis and Innovation: Is Destruction Prevailing over Accumulation? Research Policy 42: 303–14. [Google Scholar] [CrossRef]
- Arellano, Manuel, and Stephen Bond. 1991. Some tests of specification for panel data: Monte Carlo evidence and an application to employment equations. Review of Economic Studies 58: 277–97. [Google Scholar] [CrossRef]
- Aristizabal-Ramirez, Maria, Maria Camila Botero-Franco, and Gustavo Canavire-Bacarreza. 2017. Does Financial Development Promote Innovation in Developing Economies? An Empirical Analysis. Review of Development Economics 21: 475–96. [Google Scholar] [CrossRef]
- Arvis, Jean-François, Duval Duval, Ben Shepherd, and Chorthip Utoktham. 2012. Trade Costs in the Developing World: 1995–2010. ARTNeT Working Papers, No. 121/December 2012 (AWP No. 121). Bangkok: Asia-Pacific Research and Training Network on Trade, ESCAP. [Google Scholar]
- Arvis, Jean-François, Duval Duval, Ben Shepherd, Chorthip Utoktham, and Anasuya Raj. 2016. Trade Costs in the Developing World: 1996–2010. World Trade Review 15: 451–74. [Google Scholar] [CrossRef]
- Atkeson, Andrew, and Ariel Tomás Burstein. 2010. Innovation, firm dynamics, and international trade. Journal of Political Economy 118: 433–84. [Google Scholar] [CrossRef]
- Autor, David, David Dorn, Gordon H. Hanson, Gary Pisano, and Pian Shu. 2016. Foreign Competition and Domestic Innovation: Evidence from US Patents. American Economic Review: Insights 2: 357–74. [Google Scholar] [CrossRef]
- Bahar, Dany, and Hillel Rapoport. 2018. Migration, Knowledge Diffusion and the Comparative Advantage of Nations. Economic Journal 128: F273–F305. [Google Scholar] [CrossRef]
- Barrot, Luis-Diego, César Calderón, and Luis Servén. 2018. Openness, specialization, and the external vulnerability of developing countries. Journal of Development Economics 134: 310–28. [Google Scholar] [CrossRef]
- Bas, Maria, and Vanessa Strauss-Kahn. 2015. Input-trade liberalization, export prices and quality upgrading. Journal of International Economics 95: 250–62. [Google Scholar] [CrossRef]
- Benziane, Yakoub, Siong Hook Law, Anitha Rosland, and Muhammad Daaniyall Abd Rahman. 2022. Aid for trade initiative 16 years on: Lessons learnt from the empirical literature and recommendations for future directions. Journal of International Trade Law and Policy 21: 79–104. [Google Scholar] [CrossRef]
- Beverelli, Cosimo, Simon Neumueller, and Robert Teh. 2015. Export Diversification Effects of the WTO Trade Facilitation Agreement. World Development 76: 293–310. [Google Scholar] [CrossRef]
- Bloom, Nicholas, Paul Romer, Stephen J. Terry, and John Van Reenen. 2013. A Trapped-Factors Model of Innovation. American Economic Review: Papers & Proceedings 103: 208–13. [Google Scholar]
- Blundell, Richard, and Stephen Bond. 1998. Initial conditions and moment restrictions in dynamic panel data models. Journal of Econometrics 87: 115–43. [Google Scholar] [CrossRef]
- Bond, Stephen. 2002. Dynamic panel data models: A guide to micro data methods and practice. Portuguese Economic Journal 1: 141–62. [Google Scholar] [CrossRef]
- Bond, Stephen, Anke Hoeffler, and Jonathan Temple. 2001. GMM Estimation of Empirical Growth Models. CEPR Paper DP3048. London, UK: Centre for Economic Policy Research. [Google Scholar]
- Branstetter, Lee G., Raymond Fisman, and C. Fritz Foley. 2006. Do Stronger Intellectual Property Rights Increase International Technology Transfer? Empirical Evidence from U.S. Firm-Level Panel Data. Quarterly Journal of Economics 121: 321–49. [Google Scholar]
- Brown, James R., Gustav Martinsson, and Bruce C. Petersen. 2012. Do Financing Constraints Matter for R&D? European Economic Review 56: 1512–29. [Google Scholar]
- Buera, Francisco J., and Ezra Oberfield. 2019. The Global Diffusion of Ideas. Econometrica 88: 83–114. [Google Scholar] [CrossRef]
- Busse, Matthias, Ruth Hoekstra, and Jens Königer. 2012. The impact of aid for trade facilitation on the costs of trading. Kyklos 65: 143–63. [Google Scholar] [CrossRef]
- Bustos, Paula. 2011. Trade Liberalization, Exports, and Technology Upgrading: Evidence on the Impact of MERCOSUR on Argentinian Firms. American Economic Review 101: 304–40. [Google Scholar] [CrossRef]
- Bye, Brita, and Taran Fæhn. 2022. The role of human capital in structural change and growth in an open economy: Innovative and absorptive capacity effects. The World Economy 45: 1021–49. [Google Scholar] [CrossRef]
- Cai, Jie, Nan Li, and Ana Maria Santacreu. 2022. Knowledge Diffusion, Trade, and Innovation across Countries and Sectors. American Economic Journal: Macroeconomics 14: 104–45. [Google Scholar] [CrossRef]
- Calì, Massimiliano, and Dirk Willem Te Velde. 2011. Does Aid for Trade Really Improve Trade Performance? World Development 39: 725–40. [Google Scholar] [CrossRef]
- Canares, Michael P. 2011. In violence as in peace: Violent conflict and rural entrepreneurship in the Philippines. Journal of Small Business & Entrepreneurship 24: 253–64. [Google Scholar]
- Cariolle, Joël, Michaël Goujon, and Patrick Guillaumont. 2016. Has Structural Economic Vulnerability Decreased in Least Developed Countries? Lessons Drawn from Retrospective Indices. The Journal of Development Studies 52: 591–606. [Google Scholar] [CrossRef]
- Chang, Ray-Yun, Hong Hwang, and Cheng-Hau Peng. 2013. Technology Licensing, R&D and Welfare. Economics Letters 118: 396–99. [Google Scholar]
- Chen, Natalie, and Luciana Juvenal. 2022. Markups, quality, and trade costs. Journal of International Economics 137: 103627. [Google Scholar] [CrossRef]
- Chen, Wei-Chih. 2013. The Extensive and Intensive Margins of Exports: The Role of Innovation. The World Economy 36: 607–35. [Google Scholar] [CrossRef]
- Choi, Jay Pil. 2002. A Dynamic Analysis of Licensing: The “Boomerang” Effect and Grant-Back Clauses. International Economic Review 43: 803–29. [Google Scholar] [CrossRef]
- Cirera, Xavier, Anabel Marin, and Ricardo Markwald. 2015. Explaining export diversification through firm innovation decisions: The case of Brazil. Research Policy 44: 1962–73. [Google Scholar] [CrossRef]
- Coelli, Federica, Andreas Moxnes, and Karen Helene Ulltveit-Moe. 2022. Better, Faster, Stronger: Global Innovation and Trade Liberalization. The Review of Economics and Statistics 104: 205–16. [Google Scholar] [CrossRef]
- Colombo, Stefano. 2020. Does licensing promote innovation? Economics of Innovation and New Technology 29: 206–21. [Google Scholar] [CrossRef]
- Comin, Diego, and Bart Hobijn. 2010. An Exploration of Technology Diffusion. American Economic Review 100: 2031–59. [Google Scholar] [CrossRef]
- Comin, Diego, and Martí Mestieri. 2018. If Technology Has Arrived Everywhere, Why Has Income Diverged? American Economic Journal: Macroeconomics 10: 137–78. [Google Scholar] [CrossRef]
- Conti, Raffaele, Alfonso Gambardella, and Elena Novelli. 2013. Research on Markets for Inventions and Implications for R&D Allocation Strategies. Academy of Management Annals 7: 715–72. [Google Scholar]
- Contractor, Farok J. 1990. Contractual and cooperative forms of international business: Towards a unified theory of modal choice. Management International Review 30: 31–54. [Google Scholar]
- Cowling, Marc, Weixi Liu, and Ning Zhang. 2018. Did firm age, experience, and access to finance count? SME performance after the global financial crisis. Journal of Evolutionary Economics 28: 77–100. [Google Scholar] [CrossRef]
- Crescenzi, Riccardo, and Andrés Rodríguez-Pose. 2009. Systems of innovation and regional growth in the EU: Endogenous vs. external innovative activities and socio-economic conditions. In Growth and Innovation of Competitive Regions. Edited by Riccardo Crescenzi and Andrés Rodríguez-Pose. Berlin and Heidelberg: Springer, pp. 167–91. [Google Scholar]
- D’Ingiullo, Dario, and Valentina Evangelista. 2020. Institutional quality and innovation performance: Evidence from Italy. Regional Studies 54: 1724–36. [Google Scholar] [CrossRef]
- Dabla-Norris, Era, Erasmus K. Kersting, and Geneviève Verdier. 2012. Firm Productivity, Innovation, and Financial Development. Southern Economic Journal 79: 422–49. [Google Scholar] [CrossRef]
- Damijan, Jože, and Črt Kostevc. 2015. Learning from trade through innovation. Oxford Bulletin of Economics and Statistics 77: 408–36. [Google Scholar] [CrossRef]
- Deininger, Klaus. 2003. Causes and consequences of civil strife: Micro-level evidence from Uganda. Oxford Economic Papers 55: 579–606. [Google Scholar] [CrossRef]
- Desmet, Klaus, and Stephen L. Parente. 2010. Bigger Is Better: Market Size, Demand Elasticity, and Innovation. International Economic Review 51: 319–33. [Google Scholar] [CrossRef]
- Donges, Alexander, Jean-Marie Meier, and Rui C. Silva. 2022. The Impact of Institutions on Innovation. Management Science 69: 1951–74. [Google Scholar] [CrossRef]
- Dornbusch, Rudiger, Stanley Fischer, and Paul A. Samuelson. 1977. Comparative Advantage, Trade, and Payments in a Ricardian Model with a Continuum of Goods. American Economic Review 67: 823–39. [Google Scholar]
- Driscoll, John C., and Aart C. Kraay. 1998. Consistent Covariance Matrix Estimation with Spatially Dependent Panel Data. Review of Economics and Statistics 80: 549–60. [Google Scholar] [CrossRef]
- Eaton, Jonathan, and Samuel Kortum. 2001. Technology, Trade, and Growth: A Unified Framework. European Economic Review 45: 742–55. [Google Scholar] [CrossRef]
- Eisenhardt, Kathleen M., and Jeffrey A. Martin. 2000. Dynamic capabilities: What are they? Strategic Management Journal 21: 1105–21. [Google Scholar] [CrossRef]
- Feenstra, Robert C., Robert Inklaar, and Marcel P. Timmer. 2015. The Next Generation of the Penn World Table. American Economic Review 105: 3150–82. [Google Scholar] [CrossRef]
- Feindouno, Sosso, and Michaël Goujon. 2016. The Retrospective Economic Vulnerability Index, 2015 Update. Working Paper No. 147. Clermont-Ferrand: Fondation pour les Etudes et Recherches sur le Developpement InternationaL (FERDI). [Google Scholar]
- Fons-Rosen, Christian, Sebnem Kalemli-Ozcan, Bent E. Sorensen, Carolina Villegas-Sanchez, and Vadym Volosovych. 2018. Foreign Investment and Domestic Productivity: Identifying Knowledge Spillovers and Competition Effects. NBER Working Paper 23643. Cambridge, MA: NBER. [Google Scholar]
- Foster, Andrew D., and Mark R. Rosenzweig. 2010. Microeconomics of Technology Adoption. Annual Review of Economics 2: 395–424. [Google Scholar] [CrossRef] [PubMed]
- Gallini, Nancy T. 1984. Deterrence through market sharing: A strategic incentive for licensing. American Economic Review 74: 931–41. [Google Scholar]
- Gallini, Nancy, and Ralph Winter. 1985. Licensing in the Theory of Innovation. The RAND Journal of Economics 16: 237–52. [Google Scholar] [CrossRef]
- Gentile, Elisabetta. 2017. Intellectual Property Rights and Foreign Technology Licensing in Developing Countries: An Empirical Investigation. ADB Economics Working Paper Series No. 515. Manila: Asian Development Bank. [Google Scholar]
- Gnangnon, Sèna Kimm. 2018. Aid for trade and trade policy in recipient countries. The International Trade Journal 32: 439–64. [Google Scholar] [CrossRef]
- Gnangnon, Sèna Kimm. 2019a. Aid for trade and export diversification in recipient-countries. The World Economy 42: 396–418. [Google Scholar] [CrossRef]
- Gnangnon, Sèna Kimm. 2019b. Does the Impact of Aid for Trade on Export Product Diversification depend on Structural economic policies in Recipient-Countries? Economic Issues 24: 59–87. [Google Scholar]
- Gnangnon, Sèna Kimm. 2021a. Aid for Trade and Import Product Diversification: To What Extent Does Export Product Diversification Matter? Economic Issues 26: 1–43. [Google Scholar]
- Gnangnon, Sèna Kimm. 2021b. Effect of Productive Capacities on Economic Complexity: Do Aid for Trade Flows Matter? Journal of Economic Integration 36: 626–88. [Google Scholar] [CrossRef]
- Gnangnon, Sèna Kimm. 2022. Duration of the membership in the World Trade Organization, Structural Economic Vulnerability and Trade Costs. Research Square. Preprint. [Google Scholar] [CrossRef]
- Gorodnichenko, Yuriy, Jan Svejnar, and Katherine Terrell. 2010. Globalization and innovation in emerging markets. American Economic Journal: Macroeconomics 2: 194–226. [Google Scholar] [CrossRef]
- Greenhalgh, Christine. 1990. Innovation and trade performance in the United Kingdom. Economic Journal 100: 105–18. [Google Scholar] [CrossRef]
- Grossman, Gene M., and Elhanan Helpman. 1991. Trade, Knowledge Spillovers, and Growth. European Economic Review 35: 517–26. [Google Scholar] [CrossRef]
- Harrison, Ann, and Andrés Rodriguez-Clare. 2009. Trade, Foreign Investment, and Industrial Policy for Developing Countries. Working Paper 15261. Cambridge, MA: NBER. [Google Scholar]
- Helble, Matthias C., Catherine L. Mann, and John S. Wilson. 2012. Aid-for-trade facilitation. Review of World Economics 148: 357–76. [Google Scholar] [CrossRef]
- Hoekman, Bernard, and Alessandro Nicita. 2010. Assessing the Doha round: Market access, transactions costs and aid for trade facilitation. Journal of International Trade & Economic Development 19: 65–80. [Google Scholar]
- Hoekman, Bernard, and Beata Smarzynska Javorcik. 2006. Lessons from Empirical Research on International Technology Diffusion through Trade and Foreign Direct Investment. In Global Integration and Technology Transfer. Edited by Bernard Hoekman and Beata Smarzynska Javorcik. New York: Copublication of Palgrave Macmillan and the World Bank, chap. 1. [Google Scholar]
- Hufbauer, Gary. 1970. The Impact of National Characteristics and Technology on the Commodity Composition of Trade in Manufactured Goods. Available online: http://www.nber.org/chapters/c3381 (accessed on 10 September 2011).
- Hühne, Philipp, Birgit Meyer, and Peter Nunnenkamp. 2014. Who Benefits from Aid for Trade? Comparing the Effects on Recipient versus Donor Exports. Journal of Development Studies 50: 1275–88. [Google Scholar] [CrossRef]
- Iacovone, Leonardo. 2012. The better you are the stronger it makes you: Evidence on the asymmetric impact of liberalization. Journal of Development Economics 99: 474–85. [Google Scholar] [CrossRef]
- Impullitti, Giammario, and Omar Licandro. 2018. Trade, Firm Selection and Innovation: The Competition Channel. The Economic Journal 128: 189–229. [Google Scholar] [CrossRef]
- Javorcik, Beata Smarzynska. 2004. Does Foreign Direct Investment Increase the Productivity of Domestic Firms? In Search of Spillovers through Backward Linkages. American Economic Review 94: 605–27. [Google Scholar] [CrossRef]
- Jensen, Richard, and Marie Thursby. 2001. Proofs and prototypes for sale: The licensing of university inventions. American Economic Review 91: 240–59. [Google Scholar] [CrossRef]
- Kanwar, Sunil. 2012. Intellectual Property Protection and Technology Licensing: The Case of Developing Countries. The Journal of Law & Economics 55: 539–64. [Google Scholar]
- Katila, Riitta, and Gautam Ahuja. 2002. Something old, something new: A longitudinal study of search behavior and new product introduction. The Academy of Management Journal 45: 1183–94. [Google Scholar] [CrossRef]
- Kaufmann, Daniel, Aart Kraay, and Massimo Mastruzzi. 2010. The Worldwide Governance Indicators Methodology and Analytical Issues. World Bank Policy Research No. 5430 (WPS5430). Washington, DC: The World Bank. [Google Scholar]
- Kim, Youngjun. 2004. Market structure and technology licensing: Evidence from US manufacturing. Applied Economics Letters 11: 631–37. [Google Scholar] [CrossRef]
- Kim, YoungJun, and Nicholas S. Vonortas. 2006. Determinants of technology licensing: The case of licensors. Managerial and Decision Economics 27: 235–49. [Google Scholar] [CrossRef]
- Kim, Young Jun, and George Clarke. 2013. Determinants of inter-firm technology licensing in the EU. Applied Economics 45: 651–61. [Google Scholar] [CrossRef]
- Kim, Yu Ri. 2019. Does aid for trade diversify the export structure of recipient countries? The World Economy 42: 2684–722. [Google Scholar] [CrossRef]
- Klueter, Thomas, L. Felipe Monteiro, and Denise R. Dunlap. 2017. Standard vs. partnership-embedded licensing: Attention and the relationship between licensing and product innovations. Research Policy 46: 1629–43. [Google Scholar] [CrossRef]
- Krugman, Paul. 1979. A Model of Innovation, Technology Transfer, and the World Distribution of Income. Journal of International Economics 9: 369–82. [Google Scholar]
- Lee, Neil, Hiba Sameen, and Marc Cowling. 2015. Access to Finance for Innovative SMEs since the Financial Crisis. Research Policy 44: 370–80. [Google Scholar] [CrossRef]
- Leone, Maria Isabella, and Toke Reichstein. 2012. Licensing-in fosters rapid invention! the effect of the grant-back clause and technological unfamiliarity. Strategic Management Journal 33: 965–85. [Google Scholar] [CrossRef]
- Lind, Nelson, and Natalia Ramondo. 2018. Trade with Correlation. NBER Working Paper 24380. Cambridge, MA: NBER. [Google Scholar]
- Long, Ngo V., Horst Raff, and Frank Stähler. 2011. Innovation and trade with heterogeneous firms. Journal of International Economics 84: 149–59. [Google Scholar] [CrossRef]
- Ly-My, Dung, Hyun-Hoon Lee, and Donghyun Park. 2021. Does aid for trade promote import diversification? The World Economy 44: 1740–69. [Google Scholar] [CrossRef]
- Markman, Gideon D., Peter T. Gianiodis, Phillip H. Phan, and David B. Balkin. 2005. Innovation speed: Transferring university technology to market. Research Policy 34: 1058–75. [Google Scholar] [CrossRef]
- Mau, Karsten. 2016. Export diversification and income differences reconsidered: The extensive product margin in theory and application. Review of World Economics 152: 351–81. [Google Scholar] [CrossRef]
- Mazzi, Caio Torres, and Neil Foster-McGregor. 2021. Imported intermediates, technological capabilities and exports: Evidence from Brazilian firm-level data. Research Policy 50: 104141. [Google Scholar] [CrossRef]
- Melitz, Mark J. 2003. The Impact of Trade on Intra-Industry Allocations and Aggregate Productivity. Econometrica 71: 1695–725. [Google Scholar] [CrossRef]
- Miklian, Jason, and Kristian Hoelscher. 2021. SMEs and exogenous shocks: A conceptual literature review and forward research agenda. International Small Business Journal: Researching Entrepreneurship 40: 178–204. [Google Scholar] [CrossRef]
- Moreira, Solon, Arjan Markus, and Keld Laursen. 2018. Knowledge diversity and coordination: The effect of intrafirm inventor task networks on absorption speed. Strategic Management Journal 39: 2517–46. [Google Scholar] [CrossRef]
- Moreira, Solon, Goretti Cabaleiro, and Toke Reichstein. 2019. Licensing decision: A rent dissipation lens applied to product market competition, openness to external knowledge and exogenous sunk costs. Industrial and Corporate Change 28: 773–92. [Google Scholar] [CrossRef]
- Moreira, Solon, Thomas Maximilian Klueter, and Stefano Tasselli. 2020. Competition, Technology Licensing-in, and Innovation. Organization Science 31: 797–1051. [Google Scholar] [CrossRef]
- Mowery, David, E. Joanne Oxley, and Brian S. Silverman. 1996. Strategic alliances and interfirm knowledge transfer. Strategic Management Journal 17: 77–92. [Google Scholar] [CrossRef]
- Mukherjee, Arijit, and Soma Mukherjee. 2013. Technology Licensing and Innovation. Economics Letters 120: 499–502. [Google Scholar] [CrossRef]
- Naudé, Wim, Philip Verwimp, and Tilman Brück. 2013. Business and the Barrel of a Gun: Understanding Entrepreneurship and Violent Conflict in Developing Countries. UNU-WIDER Policy Brief 4. Helsinki: UNU-WIDER. [Google Scholar]
- Navas, Antonio. 2015. Trade liberalisation and innovation under sector heterogeneity. Regional Science and Urban Economics 50: 42–62. [Google Scholar] [CrossRef]
- Nickell, Stephen. 1981. Biases in Dynamic Models with Fixed Effects. Econometrica 49: 1417–26. [Google Scholar] [CrossRef]
- North, Douglass C. 1991. Institutions. Journal of Economic Perspectives 5: 97–112. [Google Scholar] [CrossRef]
- Novy, Dennis. 2013. Gravity Redux: Measuring International Trade Costs with Panel Data. Economic Inquiry 51: 101–21. [Google Scholar] [CrossRef]
- OECD/WTO. 2011. Aid for Trade at a Glance 2011: Showing Results. Geneva: WTO. Paris: OECD Publishing. [Google Scholar] [CrossRef]
- OECD/WTO. 2015. Aid for Trade at a Glance 2015: Reducing Trade Costs for Inclusive, Sustainable Growth. Geneva: WTO. Paris: OECD Publishing. [Google Scholar] [CrossRef]
- Pack, Howard, and Kamal Saggi. 1997. Inflows of Foreign Technology and Indigenous Technological Development. Review of Development Economics 1: 81–98. [Google Scholar] [CrossRef]
- Pan, Qisheng. 2011. Economic losses from a hypothetical hurricane event in the Houston-Galveston area. Natural Hazards Review 12: 146–55. [Google Scholar] [CrossRef]
- Park, Walter, and Douglas Lippoldt. 2008. Technology Transfer and the Economic Implications of the Strengthening of Intellectual Property Rights in Developing Countries. OECD Trade Policy Papers, No. 62. Paris: OECD Publishing. [Google Scholar]
- Parteka, Aleksandra. 2020. What drives cross-country differences in export variety? A bilateral panel approach. Economic Modelling 92: 48–56. [Google Scholar] [CrossRef]
- Perla, Jesse, Christopher Tonetti, and Michael E. Waugh. 2021. Equilibrium Technology Diffusion, Trade, and Growth. American Economic Review 111: 73–128. [Google Scholar] [CrossRef]
- Regolo, Julie. 2013. Export diversification: How much does the choice of the trading partner matter? Journal of International Economics 91: 329–42. [Google Scholar] [CrossRef]
- Rivera-Batiz, Luis A., and Paul M. Romer. 1991. Economic Integration and Endogenous Growth. Quarterly Journal of Economics 106: 531–55. [Google Scholar] [CrossRef]
- Romer, Paul M. 1990. Endogenous technological change. Journal of Political Economy 98: S71–S102. [Google Scholar] [CrossRef]
- Roodman, David M. 2009. A note on the theme of too many instruments. Oxford Bulletin of Economic and Statistics 71: 135–58. [Google Scholar] [CrossRef]
- Sampson, Thomas. 2016. Dynamic selection: An idea flows theory of entry, trade, and growth. Quarterly Journal of Economics 131: 315–80. [Google Scholar] [CrossRef]
- Santacreu, Ana Maria. 2015. Innovation, Diffusion, and Trade: Theory and Measurement. Journal of Monetary Economics 75: 1–20. [Google Scholar] [CrossRef]
- Shu, Pian, and Claudia Steinwender. 2019. The Impact of Trade Liberalization on Firm Productivity and Innovation. Innovation Policy and the Economy 19: 39–68. [Google Scholar] [CrossRef]
- Stoyanov, Andrey. 2013. A model of trade liberalization and technology adoption with heterogeneous firms. The Journal of International Trade & Economic Development 22: 895–923. [Google Scholar]
- Sydnor, Sandra, Linda Niehm L, Maria Marshall, and Holly Schrank. 2017. Analysis of post-disaster damage and disruptive impacts on the operating status of small businesses after Hurricane Katrina. Natural Hazards 85: 1637–63. [Google Scholar] [CrossRef]
- Tadesse, Bedassa, Bichaka Fayissa, and Elias Shukralla. 2021. Infrastructure, Trade Costs, and Aid for Trade: The Imperatives for African Economies. Journal of African Development 22: 38–77. [Google Scholar] [CrossRef]
- Tadesse, Bedassa, Elias Shukralla, and Bichaka Fayissa. 2017. Are bilateral and multilateral aid-for-trade complementary? The World Economy 40: 2125–52. [Google Scholar] [CrossRef]
- Tadesse, Bedassa, Elias Shukralla, and Bichaka Fayissa. 2019. Institutional quality and the effectiveness of aid for trade. Applied Economics 51: 4233–54. [Google Scholar] [CrossRef]
- Trinugroho, Irwan, Siong Hook Law, Weng Chang Lee, Jamal Wiwoho, and Bruno S. Sergi. 2021. Effect of financial development on innovation: Roles of market institutions. Economic Modelling 103: 105598. [Google Scholar] [CrossRef]
- Van Reenen, John. 2022. 2 Innovation and Human Capital Policy. In Innovation and Public Policy. Chicago: University of Chicago Press, pp. 61–84. [Google Scholar] [CrossRef]
- Vijil, Mariana, and Laurent Wagner. 2012. Does Aid for Trade Enhance Export Performance? Investigating on the Infrastructure Channel. The World Economy 35: 838–68. [Google Scholar] [CrossRef]
- Weldemicael, Ermias. 2014. Technology, Trade Costs and Export Sophistication. The World Economy 37: 14–41. [Google Scholar] [CrossRef]
- WTO. 2021. World Trade Report 2021: Economic Resilience and Trade. Geneva: WTO. [Google Scholar]
- Yang, Guifang, and Keith E. Maskus. 2001a. Intellectual Property Rights and Licensing: An Econometric Investigation. Weltwirtschafliches Archiv 137: 58–79. [Google Scholar] [CrossRef]
- Yang, Guifang, and Keith E. Maskus. 2001b. Intellectual property rights, licensing, and innovation in an endogenous product-cycle model. Journal of International Economics 53: 169–87. [Google Scholar] [CrossRef]
- Yeaple, Stephen Ross. 2005. A simple model of firm heterogeneity, international trade, and wages. Journal of International Economics 65: 1–20. [Google Scholar] [CrossRef]
- Zhao, Hongxin, and Hongyu Li. 1997. R&D and export: An empirical analysis of Chinese manufacturing firms. Journal of High Technology Management Research 8: 89–105. [Google Scholar]
- Ziedonis, Rosemarie Ham. 2004. Don’t fence me in: Fragmented markets for technology and the patent acquisition strategies of firms. Management Science 50: 804–20. [Google Scholar] [CrossRef]
- Zuniga, Maria Pluvia, and Dominique Guellec. 2009. Who Licenses out Patents and Why? Lessons from a Business Survey. OECD Science, Technology and Industry Working Papers 2009/05. Paris: OECD Publishing. [Google Scholar]


| POLS | FE | Two-Step System GMM | |
|---|---|---|---|
| Variables | RLFP | RLFP | RLFP |
| (1) | (2) | (3) | |
| RLFPt−1 | 0.268 *** | 0.0598 *** | 0.171 *** |
| (0.0292) | (0.0205) | (0.0134) | |
| Log(AfTTOT) | −0.173 *** | −0.0610 * | −0.234 *** |
| (0.0278) | (0.0364) | (0.0610) | |
| Log(GDPC) | 0.774 *** | −0.307 | 0.922 *** |
| (0.0268) | (0.483) | (0.156) | |
| SHOCK | −0.00818 | 0.00327 | −0.0195 *** |
| (0.00798) | (0.0133) | (0.00512) | |
| HUM | 0.114 | −0.146 | 0.355 |
| (0.187) | (0.247) | (0.223) | |
| FD | 0.00930 *** | 0.0117 *** | 0.00943 *** |
| (0.000814) | (0.00160) | (0.00321) | |
| INST | 0.135 | −0.255 *** | 0.293 *** |
| (0.105) | (0.0526) | (0.0915) | |
| DUMOUT | −10.80 *** | −10.98 *** | −10.11 *** |
| (1.254) | (0.865) | (0.349) | |
| Log(POP) | 0.799 *** | 4.985 *** | 0.765 *** |
| (0.0556) | (0.817) | (0.0677) | |
| Observations—Countries | 333–77 | 333–77 | 333–77 |
| R-squared | 0.911 | ||
| Within R-squared | 0.7688 | ||
| AR1 (p-Value) | 0.0346 | ||
| AR2 (p-Value) | 0.7971 | ||
| AR3 (p-Value) | 0.2959 | ||
| OID (p-Value) | 0.3576 |
| Variables | RLFP | RLFP | RLFP | RLFP |
|---|---|---|---|---|
| (1) | (2) | (3) | (4) | |
| RLFPt−1 | 0.181 *** | 0.163 *** | 0.148 *** | 0.145 *** |
| (0.0127) | (0.0107) | (0.00828) | (0.00622) | |
| Log(AfTTOT) | −0.271 *** | 3.079 *** | 0.393 *** | 3.969 *** |
| (0.0416) | (0.575) | (0.151) | (0.679) | |
| [Log(AfTTOT)]*[Log(TRCOST)] | −0.581 *** | |||
| (0.103) | ||||
| [Log(AfTTOT)]*[Log(TARIFF)] | −5.562 *** | |||
| (1.475) | ||||
| [Log(AfTTOT)]*[Log(NONTARIFF)] | −0.757 *** | |||
| (0.120) | ||||
| Log(TRCOST) | 0.973 ** | 11.87 *** | ||
| (0.422) | (1.801) | |||
| Log(TARIFF) | 118.9 *** | |||
| (25.94) | ||||
| Log(NONTARIFF) | 13.95 *** | |||
| (2.160) | ||||
| Log(GDPC) | 0.548 *** | 0.820 *** | 0.624 *** | 0.994 *** |
| (0.121) | (0.0963) | (0.0674) | (0.0573) | |
| SHOCK | −0.0245 *** | −0.0184 *** | 0.00610 | −0.00726 ** |
| (0.00520) | (0.00362) | (0.00440) | (0.00317) | |
| HUM | 0.510 *** | 0.230 ** | 0.673 *** | 0.447 *** |
| (0.160) | (0.0967) | (0.120) | (0.0764) | |
| FD | 0.0163 *** | 0.0145 *** | 0.00636 *** | 0.0101 *** |
| (0.00271) | (0.00230) | (0.00151) | (0.00267) | |
| INST | 0.408 *** | 0.342 *** | 0.462 *** | 0.138 ** |
| (0.0666) | (0.0552) | (0.0569) | (0.0644) | |
| DUMOUT | −10.03 *** | −10.12 *** | −10.71 *** | −10.96 *** |
| (0.242) | (0.209) | (0.204) | (0.138) | |
| Log(POP) | 0.747 *** | 0.864 *** | 1.059 *** | 0.943 *** |
| (0.0526) | (0.0392) | (0.0307) | (0.0246) | |
| Observations—Countries | 331–77 | 331–77 | 324–75 | 323–75 |
| AR1 (p-Value) | 0.0397 | 0.0460 | 0.0296 | 0.0374 |
| AR2 (p-Value) | 0.7107 | 0.8162 | 0.4568 | 0.5830 |
| AR3 (p-Value) | 0.2905 | 0.3584 | 0.4424 | 0.7236 |
| OID (p-Value) | 0.3988 | 0.3597 | 0.6654 | 0.4896 |
| Variables | RLFP | RLFP |
|---|---|---|
| (1) | (2) | |
| RLFPt−1 | 0.137 *** | 0.116 *** |
| (0.0113) | (0.00890) | |
| Log(AfTTOT) | 0.638 *** | −0.223 ** |
| (0.139) | (0.0915) | |
| [Log(AfTTOT)]*[SHOCK] | −0.0384 *** | |
| (0.00423) | ||
| ECI | 15.52 *** | |
| (2.209) | ||
| [Log(AfTTOT)]*[ECI] | −0.953 *** | |
| (0.122) | ||
| Log(GDPC) | 1.368 *** | 1.300 *** |
| (0.117) | (0.0750) | |
| SHOCK | 0.718 *** | 0.00280 |
| (0.0796) | (0.00347) | |
| HUM | −0.320 ** | −0.175 |
| (0.126) | (0.135) | |
| FD | 0.0126 *** | 0.00426 |
| (0.00347) | (0.00270) | |
| INST | 0.220 *** | 0.181 *** |
| (0.0777) | (0.0690) | |
| DUMOUT | −11.00 *** | −11.50 *** |
| (0.304) | (0.223) | |
| Log(POP) | 1.159 *** | 1.095 *** |
| (0.0457) | (0.0424) | |
| Observations—Countries | 333–77 | 333–77 |
| AR1 (p-Value) | 0.0747 | 0.0531 |
| AR2 (p-Value) | 0.6538 | 0.5632 |
| AR3 (p-Value) | 0.5111 | 0.2940 |
| OID (p-Value) | 0.3467 | 0.7393 |
Disclaimer/Publisher’s Note: The statements, opinions and data contained in all publications are solely those of the individual author(s) and contributor(s) and not of MDPI and/or the editor(s). MDPI and/or the editor(s) disclaim responsibility for any injury to people or property resulting from any ideas, methods, instructions or products referred to in the content. |
© 2023 by the author. Licensee MDPI, Basel, Switzerland. This article is an open access article distributed under the terms and conditions of the Creative Commons Attribution (CC BY) license (https://creativecommons.org/licenses/by/4.0/).
Share and Cite
Gnangnon, S.K. Do Aid for Trade Flows Affect Technology Licensing in Recipient Countries? J. Risk Financial Manag. 2023, 16, 513. https://doi.org/10.3390/jrfm16120513
Gnangnon SK. Do Aid for Trade Flows Affect Technology Licensing in Recipient Countries? Journal of Risk and Financial Management. 2023; 16(12):513. https://doi.org/10.3390/jrfm16120513
Chicago/Turabian StyleGnangnon, Sèna Kimm. 2023. "Do Aid for Trade Flows Affect Technology Licensing in Recipient Countries?" Journal of Risk and Financial Management 16, no. 12: 513. https://doi.org/10.3390/jrfm16120513