1. Introduction
In recent decades, the capital market has become an extremely important option for organisations that require a greater volume of resources, as it has allowed them to materialise projects inherent to their raison d’être or expansionist plans. The capital market provides access to debt and equity financing. Likewise, for the market and investors in general, it also represents a source of benefits that result in greater liquidity and market depth by allowing different investors to buy or sell shares. The analysis and monitoring of the capital market is becoming increasingly important for governments and central banks, as many companies have succumbed to the stock market prior to compliance with the administrative demands established in the legal systems (Common Law and Civil Law) and regulatory standards (corporate governance codes, harmonization of accounting frameworks, convergence of investor protection standards, protection of shareholders and institutional investors). Having complied with these and other legal requirements, European companies have made their way into the securities markets through direct introductions, private placements, mixed placements and initial public offerings (hereinafter IPOs), using different methods for price determination including auctions, fixed price and book-building or the order book method.
Although the economic and financial systems of the member countries of the European Union have similarities, given the regulatory framework, the pricing mechanisms used in IPOs can vary over time and from country to country, regardless of their geographic proximity. An example of this situation occurred in the 1980s where auction-based offerings were the main denominator in countries such as the United Kingdom (
Jenkinson and Mayer 1988), the Netherlands (
Buijs and Eijgenhuijsen 1993), France (
Jacquillat 1986), Portugal and Switzerland, while countries such as Germany, Belgium and Spain opted mainly for book-building. In the last two decades, this method has gained ground over the others by allowing greater control over the demand for shares and the final price of the IPO, characterised to a large extent by the underpricing of the securities issued.
Taking into account the above, it can be seen that the incorporation of companies to the capital market and the underpricing in IPOs has been a phenomenon that has aroused the interest of many researchers. Although there are many documentary studies that have adopted a theoretical approach, giving an overview regarding the existence of variables that justify the underpricing, these have not been sufficient to complete the literature. Hence, with this research, we intend to analyse empirically the institutional factors that affect the performance of listed companies with an approach to European IPOs. The aim is to carry out an empirical analysis, which allows us to contribute to the existing IPO literature in terms of the variables that may directly affect the underpricing of issued shares. Similarly, we analyse how these variables may or may not condition the behaviour of the same medium in the short and long term.
For researchers in general and investors, the present research may be of interest by increasing the sources of information and expanding the literature on securities finance and law. More precisely, it complements the IPO literature and provides a more specific view on the post-issuance behaviour of IPOs, including legal factors and institutional and economic/financial variables. The main objective is to show the impact that the legal and economic environment and institutional variables can have on the stock markets and, consequently, on the performance of shares issued through IPOs for 18 European Union member countries, which is extremely important when making investment decisions and/or portfolio diversification. This is why this research can contribute to the understanding and comprehension of the role played by legal systems and institutional factors in IPOs; it can reveal the relationship that these have on the investment appetite and future performance of the shares.
In this paper we identify the impact of institutional and/or macroeconomic factors on the short-, medium- and long-term performance of listed companies issued from IPOs in European Union member countries over the period 1995–2013. We have chosen this period because, in addition to the fact that it is the one that allows us to achieve profitability windows of up to 5 years (the final time frame is 2018), it is an intense period of IPOs at the European level. Indeed, one of the problems that is occurring in recent years, especially since 2015, is a significant reduction in the number of companies willing to go public. Choosing this sample period, which has not yet been affected by the fall in the number of companies willing to go public, allows us to isolate the study of the effect of this cold IPO market in which we now find ourselves at the European level (hot-issue markets versus cold-issue markets). This period also avoids the effects of COVID-19 and Russia’s war in Ukraine. The countries analysed, despite being all European, are characterised by marked differences, given the existing gaps in their levels of economic development, degree of investor protection, control over corruption, financial education and legal systems (Common Law/Civil Law), systems that have been implemented either by development or inherited from another country. In addition, the following objectives are proposed to complement the previous one: (i) to recognise the average return or profitability of European IPOs, both in the short term (initial profitability) and in the medium and long term; (ii) to identify the institutional factors that influence the profitability of the IPOs analysed; (iii) to measure the incidence of institutional variables on the performance or yield of listed shares; (iv) to determine whether there are statistically significant differences in the legal systems implemented in the countries issuing the shares analysed; and (v) to determine whether geo–economic factors affect the profitability of IPOs.
The rest of the paper is organised as follows.
Section 2 provides a classified literature review relevant to this study. In
Section 3, the database and the methodology are described.
Section 4 includes the hypotheses of this research. In
Section 5, the results of the empirical analysis are presented. Future research directions and conclusions are provided in
Section 6.
2. Literature Review
The primary purpose of financial markets is to link agents with financing capacity with those needing financing. So it seems legitimate that a company turns to the markets to raise funds. Moreover, as shown by
Pagano et al. (
1998) for the Italian market, the choice of the financial market could ultimately be a way to increase the debt capacity and the bargaining power of the company vis-à-vis banking institutions. The IPO is often deemed to have the virtue of enhancing the firm notoriety. In support of this argument, several theoretical and empirical studies show that the operation can signal the good quality of the company’s products (
Stoughton et al. 2001), increase visits to corporate web pages (
Demers and Lewellen 2003) or arouse the interest of the press (
Reese 2003). The IPO is also a means of share transfer for existing shareholders. This assignment will be at a price similar to a good market price, often much higher than that obtained for an unlisted company. In this regard, the IPO can be a preferred exit for a particular class of shareholders: venture capitalists.
The going public decision is a crucial switch in a company’s life. The act of going public is one of the most important events in the life of a firm (
Chemmanur and Fulghieri 1999). This decision incurs major structural changes and must never be envisaged carelessly. As documented in extant literature, the IPO phenomenon gives birth to major anomalies: short-term underpricing and long-term underperformance. Studies relating to IPO initial underpricing can be effortlessly divided into three categories: those that attempt to check whether or not the IPO underpricing phenomenon is present in a particular case; those that try to outline the potential relationships between IPO underpricing and country-level institutional characteristics; and, unlike earlier studies that mainly focused on checking for the presence or absence of initial underpricing, other studies attempted to outline the causes of the initial underpricing. In this regard, many theories and reasons are put forward as explanations of IPO underpricing.
The IPO initial underpricing is a phenomenon well-observed in stock markets for a long time (
Ritter and Welch 2002), although the level of this underpricing fluctuates in time (
Loughran and Ritter 2002). According to these authors, this underpricing averaged at 7% in the 1980s and 15% in the years 1990–1998 before reaching a peak at 65% during the internet bubble. Although the degree of underpricing depends on its measurement and is probably influenced by national and tax regulations, the initial underpricing is observed on all US and European stock markets. As it obviously appears, the IPO undepricing phenomenon is a well-documented anomaly in financial literature around the globe. For decades, many authors have been outlining strong empirical evidence of this phenomenon in Europe (
Ljungqvist (
1997); Asia (
Chan et al. 2004) and America (
Ritter (
1984a);
Rock (
1986);
Welch (
1989);
Loughran and Ritter (
2002);
Loughran and McDonald (
2013)).
However, it is worth mentioning that a new research avenue and trend recently emerged and is progressively grasping researchers’ attention. Indeed, unlike early studies that only focused on assessing whether or not the IPO initial underpricing exists on a specific issue, on a specific stock market or a specific continent, recent scientific attention is much more interested in outlining firm- and/or country-specific factors impacting or moderating the intensity of the IPO underpricing phenomenon. Our research is in line with this recent trend. Earlier research that outlines the role of country-level institutional frameworks on the equity market was
La Porta et al. (
1997). These authors documented that a country’s institutional quality impacts firms’ ability to raise equity. In order to explain this assertion, they emphasised the fact that few companies decide to go public in countries where investors’ protection is weak. A growing stream of literature examines the impact of country institutions, such as legal frameworks and political stability on the noteworthy cross-country discrepancy in IPO underpricing after controlling for firm- and issue-specific factors.
Boulton et al. (
2010a) posit that strong institutional quality is a double-edged sword for entrepreneurs seeking to raise external financing through equity offerings. Whereas strong institutions make it easier to raise capital, they also strengthen the position of outside investors, putting entrepreneurs’ control over their enterprises at risk. However, outsiders may have little incentive to exercise the rights granted to them by the legal system if their ownership stakes are relatively low. At the IPO, insiders can generate excess demand from outsiders by setting a low offer price, and that excess demand may lead to a more dispersed ownership structure with less active monitoring by outside investors. Consistent with this conjecture,
Boulton et al. (
2010a) find that when firms go public in a country with stronger investor protection, underpricing is higher and ownership dispersion greater.
Peng and Jiang (
2010) argue that in countries with more developed institutions, the benefits of concentrated family ownership may outweigh the costs, and firms with concentrated family ownership have little need to underprice shares at the IPO to maintain control.
Engelen and Van Essen (
2010) using a large firm-level database of 2920 IPOs from 21 countries, examined the influence of country-level institutional setting on the level of IPO underpricing. In order to test whether a country’s legal framework influences the intensity of IPO underpricing,
Engelen and Van Essen (
2010) compiled and analysed a database made up of 2920 IPOs from many countries experiencing different institutional and legal settings and belonging to different legal families. The data were from a six-year period running from 2000 to 2005. Their finding is without appeal: the explanatory power of a country’s specific characteristics on the variation in the level of IPO underpricing is 10%. According to these authors, companies that undertake IPO in countries with higher level of investors’ protection, with a better quality of legal system and a higher level of legal enforcement (these are the mobilised proxies for developed legal system) experience lower underpricing of their stocks after going public.
Hopp and Dreher (
2013) empirically analyse the determinants of IPO underpricing using panel data from 24 countries over the period 1988–2005. They emphasise the prominence of institutional and legal aspects in explaining cross-country variations. According to their findings, companies that undertake IPO in countries with stronger protection of outsider investors experience higher underpricing than firms going public in countries where outside investors are less protected. This puts forward the fact that incumbent executives endeavour to use IPO underpricing as an instrument to safeguard their private benefits of control when undertaking an IPO.
Autore et al. (
2014) examined over 10,700 IPOs issued in 37 countries on the period 1998–2008 and found evidence of the positive relationship between institutional quality and IPO underpricing. The same results were achieved by
Boulton et al. (
2010a). Among the existing indicators of institutional quality, previous studies found a strong positive relationship between firm-level IPO underpricing and country-level measures of political stability, absence of violence, government effectiveness, regulatory burden and control of corruption. However, recent research is focused on the factors that might potentially influence the relationship between institutional quality and IPO underpricing. It being acknowledged worldwide that the IPO underpricing phenomenon is strongly associated with a country’s quality of institutional framework, researchers are increasingly becoming interested in checking whether or not some country-specific factors or firm-level characteristics may induce differences in the intensity of underpricing. Concerning this research avenue, many factors have been highlighted by scientists.
Research has shed light on the importance of a country’s financial market development status in the relationship between institutional quality and IPO underpricing.
Autore et al. (
2014) scrutinised around 10,700 IPOs issued in 37 countries on a 10-year period and were able to assert that countries with emerging markets and those with developed markets cannot be treated similarly with respect to the institution–underpricing nexus. Their results highlight differentiated evidence of the nexus of institutional quality and IPO underpricing between developed markets and emerging ones. Otherwise stated, they posit that the link between country-level institutional quality and IPO underpricing is present in IPOs issued in countries with developed markets but absent for IPOs undertaken in emerging markets. In an attempt to somewhat explain such empirical discrepancy, they invoke differences in extra-legal institutions. There are various examples about how the influence of the institutional framework of a country plays a major role (see
Kho et al. (
2009);
Engelen and Van Essen (
2010);
Banerjee et al. (
2011);
Doidge et al. (
2013);
Hopp and Dreher (
2013);
Autore et al. (
2014);
Caglio et al. (
2016) and
Marcato et al. (
2018) among others).
Moreover,
Boulton et al. (
2010b) document that IPO underpricing is more important when corporate control markets are active. Boulton et al., also in favour of the argument according to which control is an incentive for IPO underpricing, likewise find a positive association between the level of ownership dispersion and the level of IPO underpricing. The authors also find a similar association between ownership dispersion and the probability for an IPO firm to stay independent.
Brau and Fawcett (
2006) also find a positive relationship between IPO underpricing and the control incentive. More precisely, they survey the CFOs (Chief Financial Officers) of 336 firms in the US that tried IPO from 2000 to 2002 and find that for 135 CFOs out of 336, an important factor in determining IPO underpricing was “ensuring a wide base of owners”. Consistent with this idea,
González et al. (
2015) explore the role of family firms in Latin American IPOs. They find that the average underpricing for family firms is lower than for non-family firms. It is worth noting that some authors such as
Mello and Parsons (
1998),
Field and Sheehan (
2004),
Cornelli and Goldreich (
2001) and
Zingales (
1995) challenge this argument and provide alternative motivations for managers’ desire for the dispersion of ownership structure after going public.
Recent studies explore the influence of media sentiment over IPO underpricing (
Bajo and Raimondo 2017) and how short selling affects IPO underpricing.
Boulton et al. (
2020) find, in a worldwide analysis, that underpricing tends to be greater in countries where short selling is constrained. On the other hand,
Huibers (
2020) explores the optimal IPO mechanism and concludes that technological innovation in the IPO market through the application of recent advances in data science, experimental economics and artificial intelligence allows for the optimization of IPO mechanisms and crowdfunding platforms which, in turn, improves the access to equity required for entrepreneurial finance.
Ritter (
2015) explores the effect of growth capital investing, finding that one-third of growth capital-backed IPOs are rollups and that these have produced much higher returns for investors than rollups without a financial sponsor.
In short, the literature has made clear the influence of institutional differences on valuation in financial markets but less so on their effect on the anomalies associated with IPOs, which is the focus of this research.
3. Database and Methodology
3.1. Database
The analysis of the incidence of institutional variables on the performance of shares issued under the IPO modality has been carried out based on secondary information obtained through the DATASTREAM database. The database consists of financial information associated with the assets, liabilities and equity of each of the companies, as well as the operating results for the year in which the shares were issued. It also has the share prices that each company has presented from the time of its listing on its respective stock exchange until the last year of the sample period and with a window of 5 years after the IPO. Although, initially, the base registered a total of 1140 companies, after analysing the consistency of the information provided, 24.21% of the data was cleaned, thus arriving at a study sample composed of 864 records of companies listed on the stock exchanges of 18 member countries of the European Union between 1995 and 2013 whose economic activities are associated with the industrial sector and/or non-financial services. Since data needs to be collected for 1-, 3- and 5-year returns, the database and prices are finally closed in 2018.
From the information provided in
Table 1, we can see that the period with the highest concentration of IPOs is the 3-year period from 2005 to 2007, which includes 335 of the 864 observations, i.e., 38.77% of the population under study. Subsequent years show a considerable reduction in the number of IPOs, which could be associated with the financial and economic crisis that severely affected the growth of European economies over the last decade.
The figures in
Table 1 above show that approximately 23.5% (203/864) of the IPOs analysed are made up of companies belonging to the Media and/or Entertainment sector, followed by the Pharmaceuticals and Biotechnology sector, which represents around 13.7% of the total sample analysed, while the Construction and Materials sector is in third place with 12.6%. The sector with the lowest sample representation is the Forestry and Paper sector, whose participation in the sample is around 2.3% of the IPOs analysed.
Table 1 shows that the database under study concentrates a not insignificant sample of companies belonging to the Media and Pharmaceutical/Biotechnology sectors, which, together with the Construction sector, account for 50% of the data analysed.
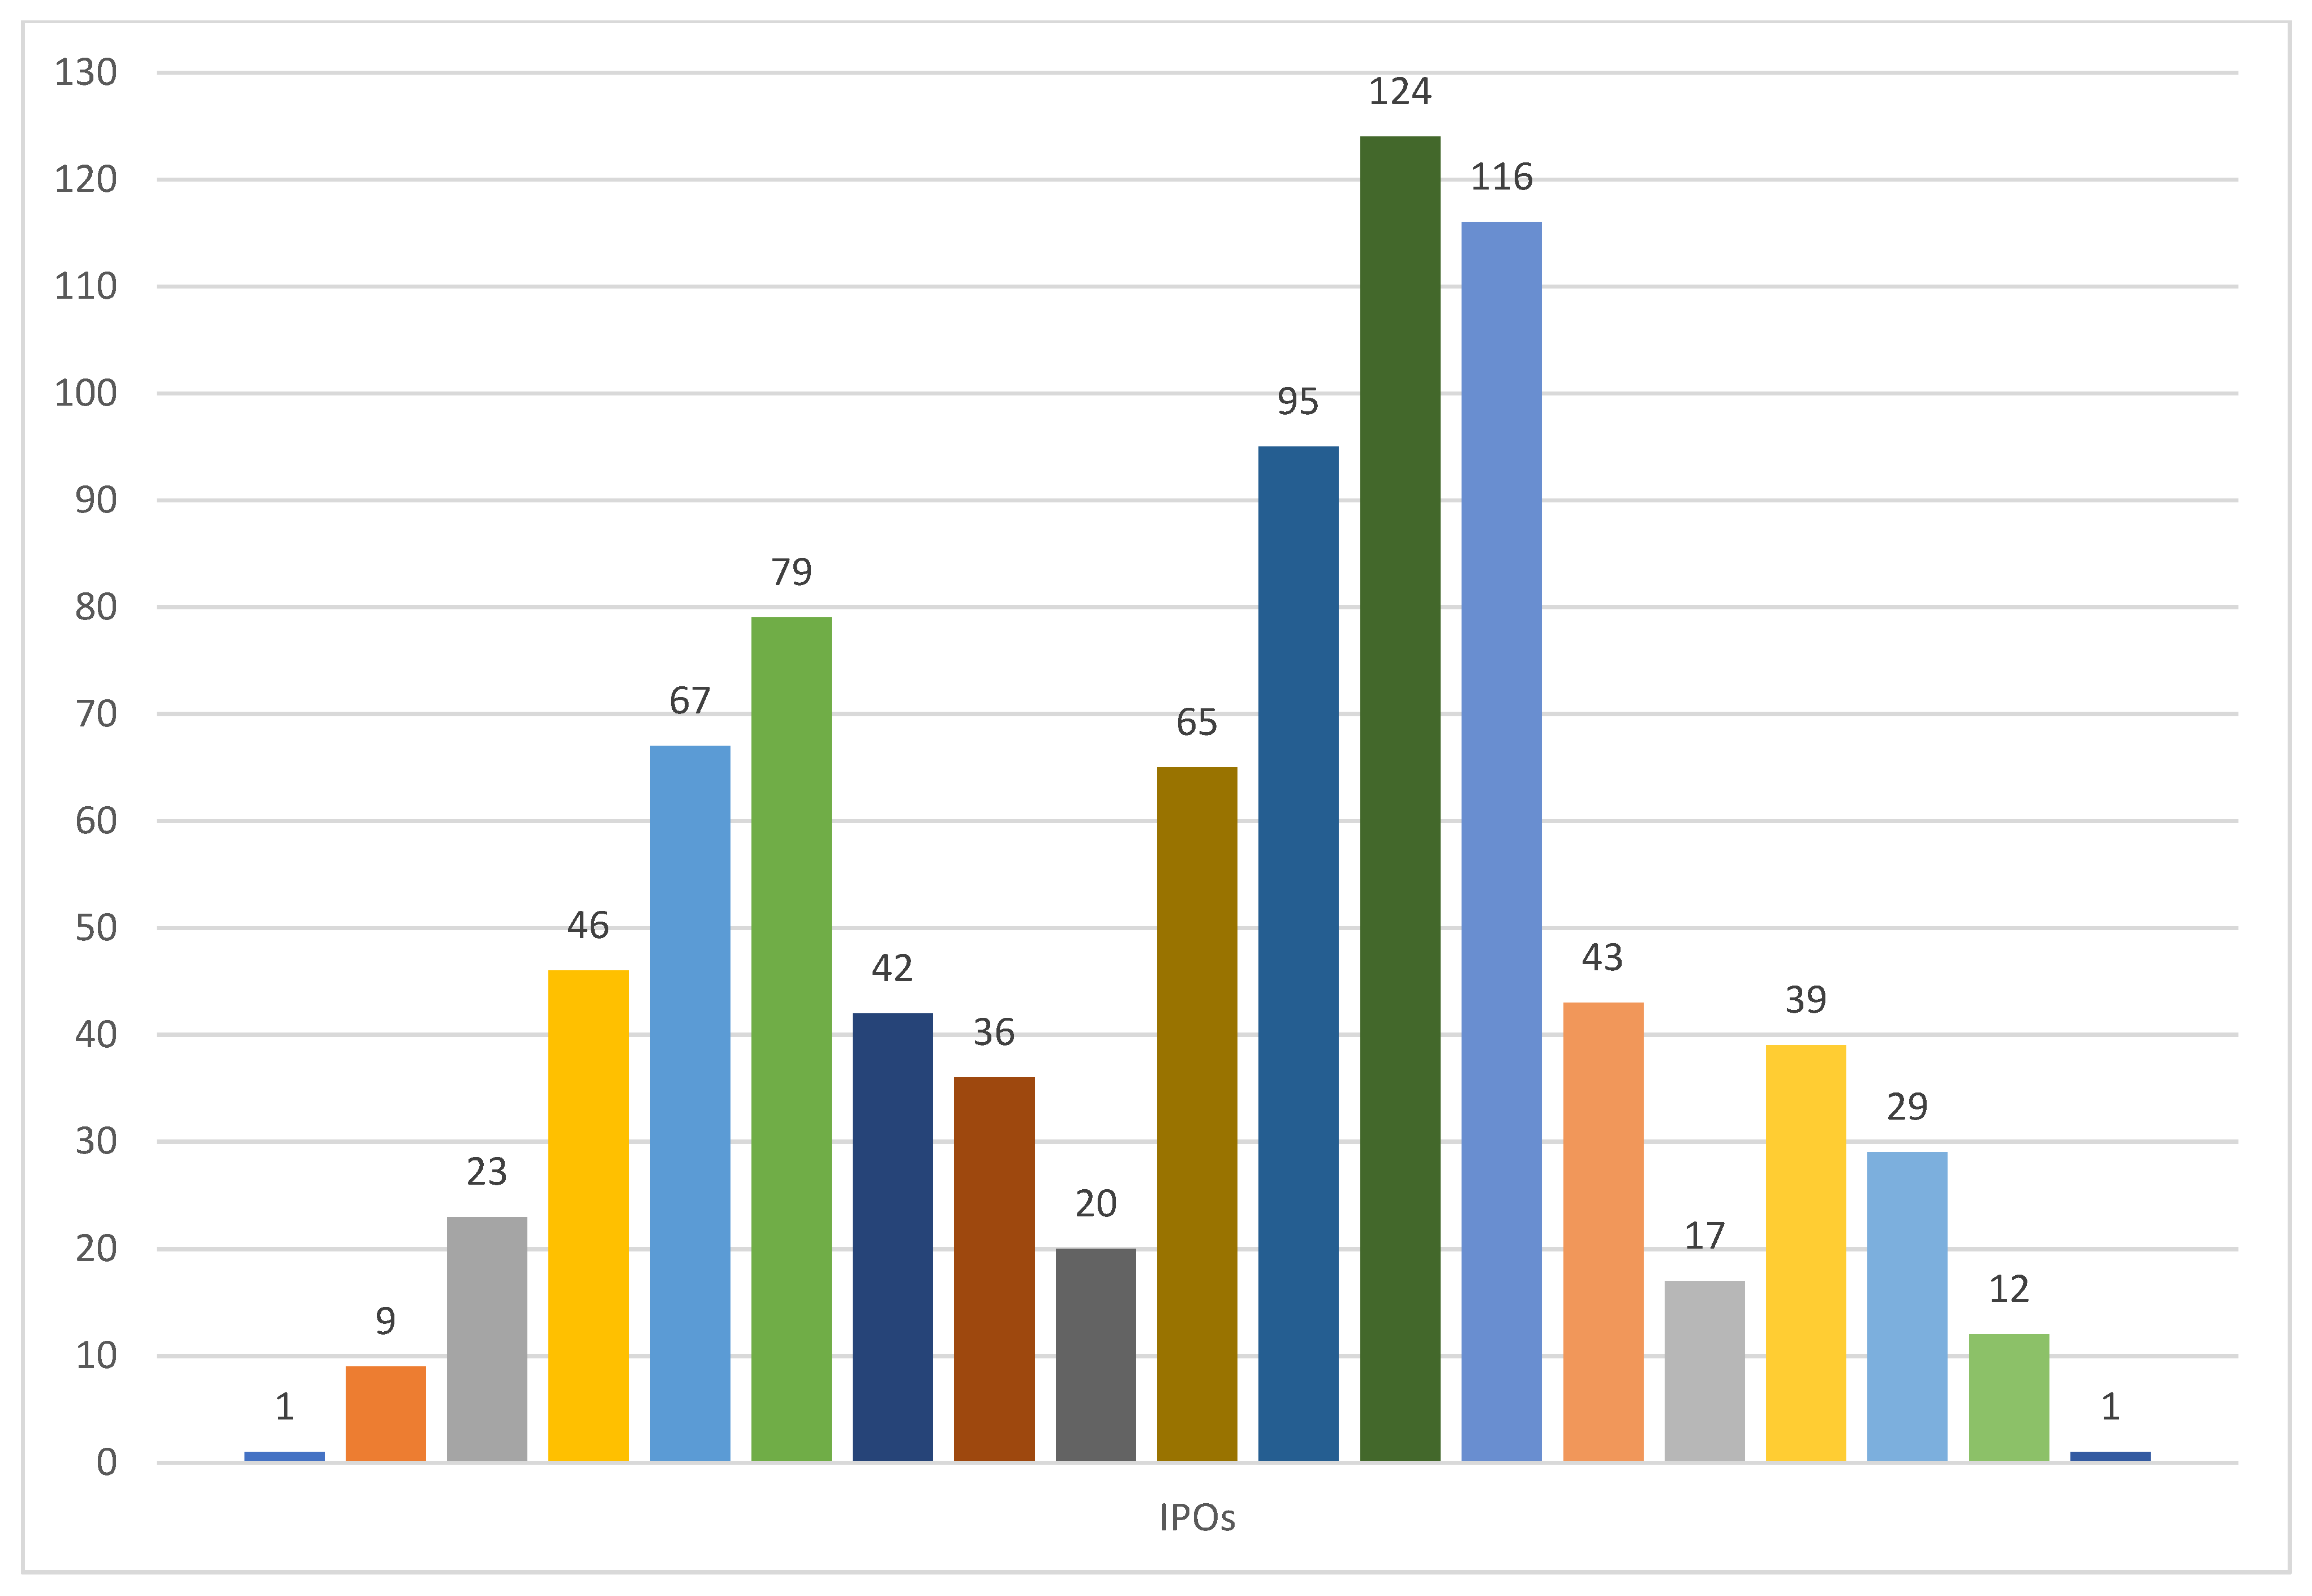
Figure 1 shows the annual distribution of the sample. Moreover, 26% of the population is made up of companies from the United Kingdom, where Common Law is the legal system by tradition, followed by German and French companies, which are characterised by the use of a civil system whose adaptation and implementation has given rise to the German Civil Law and French Civil Law. On the other hand, the countries with the lowest representation within the sample are the Baltic countries, representing only 0.93% of the sample and contributing eight companies, a situation that is due to the lower development and depth of the stock market in these countries.
Although it is true that the largest proportion of the companies analysed is made up of companies whose IPO has taken place in the British market, it is no less true that the legal system of greatest importance in the analysis is Civil Law: a legal system that represents 72.34% of the total sample and, when broken down, shows that the German system contributes 35.3%, the French system 26.62% and the Scandinavian system 10.42% of the total sample.
On the other hand, it should be noted that, for the development of this research, it was necessary to extract information from the Global Competitiveness Index (GCI) database, thus providing valuable information regarding the degree of competitiveness and the level of development of each of the countries analysed. Similarly, in order to analyse those institutional variables that could be factors affecting the performance of stocks listed on the stock exchange, data was consulted and downloaded from the WGI website, which is an interactive tool for data exploration and access to sources available at
www.govindicators.org. The information reported by WGI is produced by Daniel Kaufmann (Natural Resource Governance Institute and Brookings Institution) and Aart Kraay (World Bank Development Research Group:
https://www.worldbank.org/en/research/brief/researchers accessed on 12 October 2019).
3.2. Methodology
Taking into account that our main objective is focused on the analysis of the institutional factors that affect the performance of shares issued from IPOs, the starting point consisted of determining the profitability of the group of shares evaluated, both on the first day, first year, first three years and first five years after the IPO. Given the above, the profitability of each share was calculated in two ways, according to the moment analysed:
For the initial moment, the first thing that was undertaken was to calculate the profitability obtained by the variation (∆) existing in the quotation at the moment of buying the shares in the IPO and the closing price of the first day of quotation. As far as the average return of the IPO is concerned, the calculation of the long-term variations was executed, setting three investment horizons for them: first year (12 months), first three-year period (36 months) and first five-year period (60 months) after the IPO:
where
(
Álvarez-Otero and González-Méndez 2005) is the existing wealth or profitability index for the period from
t = 1 to
t = T, where
T is alternatively 12, 36 and 60 months.
Alternating the analysis of the underpricing of IPOs, this paper continues the study of the long-term performance of the IPOs of 18 European Union member countries, using one of the most important estimation methods (
Barber and Lyon 1997), buy-and-hold abnormal returns (BHANRs). Long-term returns are calculated monthly for 12, 36 and 60 months after IPO issuance and are adjusted based on expected returns:
which is calculated from the difference of an existing investment portfolio (market index) and the cumulative return of buying and holding a stock over a certain period of time, which in this case are 12, 36 and 60 months. Since data needs to be collected for 1-, 3- and 5-year returns, the database and prices are closed in 2018. Having calculated the profitability of the securities, and taking into account that the undervaluation and performance of the shares in the periods described above are the variables on which the present research revolves, we proceeded to analyse these and other independent variables with statistical tools of a descriptive type.
The variables referring to IPOs were processed and analysed as dependent variables, expressing such data in absolute terms. In the subsequent econometric estimations through STATA, these variables were taken in natural logarithm. As a working model, the model proposed by
Hopp and Dreher (
2007) was used as a reference, where the following equation was adopted:
Underpricing refers to the IPO valuation of a given company or group of companies in a country or the population under study in general. X
i is the vector of variables tested under the hypotheses posed and would refer to a vector of variables under control, ∝ is a constant term and ∈ a variable associated with the statistical error of the test. In
Table 2, the behaviour of BHAR in the three windows analysed is summarised.
Based on the information provided in
Table 2, it is possible to affirm that, for a shareholder, it would be much more profitable to invest in the basket of shares representing the market index than to invest its resources in a new issue of shares through an IPO. This statement is based on the benefits associated with risk diversification, the minimization of adverse market results at time zero and the average profitability reported by the market for the period analysed. Given the above, it is necessary to emphasise that, in this case, the stock index or basket of shares report a higher level of profitability than that recorded by the initial public offerings. When analysing the performance in the short term, there is clear evidence of a rebound in the profitability of the shares issued, with 15 of the 18 countries analysed showing positive results that far exceed the performance of the stock market.
However, in the third year after the securities were issued, there is a strong change in the trend, where the returns reported by the shares tend to resemble market returns. This situation can be explained by the investment horizon stipulated by many investment funds, whose permanence does not exceed the short term. Finally, in the fifth year after issuance, the market performance is increasingly higher than that of the securities issued or, failing that, becomes similar. This situation would be in line with the findings of
Ibbotson and Jaffe (
1975), who, based on 120 IPO issues carried out during 1960–1969, identifies that, to a large extent, the highest profits or rents that an investor can accumulate are based mainly in the short term, while, over a 5-year horizon, the return on IPOs is equal to or much lower than the average returns reported by the market, with accumulated profits often being lower than those reported by the IPOs at the time of issue or, alternatively, those obtained in the first month or two after the issue; in short, what is documented in the IPO financial literature as the low long-term yield.
4. Hypotheses
This section presents the hypotheses to be tested in this empirical study. In order to facilitate the monitoring and understanding of these hypotheses, as well as the variables used in the econometric estimations,
Table 3 summarises the hypotheses to be tested in this research and the variables used for this purpose.
The empirical literature on IPOs has found two regularities in relation to this operation. The first is based on the fact that IPOs, on average, present an initial price reduction, allowing investors who subscribe to shares in the IPO to obtain short-term returns. Associated with this regularity, the existence of an institutional factor has been perceived, which partially explains the returns obtained by investors in this type of operation in the sense that, in a bull market, on average, initial returns are unusually high, and in a cold market, the opposite reaction is observed. The second empirical regularity stems from the performance of IPOs over the long term; the results found show that, over a period of time ranging from several months to several years according to the studies, returns are typically negative. Numerous research studies have suggested various explanations for the fact that the IPO price is substantially lower than the price the shares achieve in the market on the first day of public trading.
1 Two explanations are most common. First, it has been argued that the underpricing is the result of ex ante uncertainty about the market price of the share and, in this respect, the role of the IPO underwriter in resolving some of this uncertainty has also been studied (
Rock (
1986);
Beatty and Ritter (
1986) and
Carter and Manaster (
1990)). Second, research has focused on the informativeness of underpricing. Thus,
Allen and Faulhaber (
1989),
Grinblatt and Hwang (
1989) and
Welch (
1989) argue that underpricing is an equilibrium phenomenon that signals to the financial market the quality of the company going public. In this research, a number of hypotheses are put forward that can explain, at the institutional level, the differences between these two regularities or anomalies: initial undervaluation and long-term underperformance. Country-specific hypotheses will be presented, in addition to firm-specific hypotheses with variables relating to each company that has gone public, as well as the control variables required in the estimations.
We then propose the different hypotheses to be tested, which are seven in total, and which will allow us to assess the influence of the institutional differences on the initial profitability and performance of IPOs in the different European countries that constitute the database described and analysed in the previous section. The dependent variables are the initial IPO returns (the difference between the price at the end of the first trading day less the IPO price over the last one), both gross and adjusted for market performance, as well as the long-term returns, in windows of 1, 3 and 5 years after the IPO. The proposed hypotheses to be tested and which constitute the core of the empirical and econometric work of this research are the following.
This hypothesis aims to measure the institutional influence that the type of regulation or legal system of each country has on the profitability and performance of IPOs in each country considered in this study. Based on the empirical studies analysed and reviewed, the variables used to test this hypothesis are two: CIVILAW, which is a dummy variable that takes value 1 if the country’s legal system is Civil Law and 0 otherwise, and TYPEREGUL, which is a variable that classifies the country’s legal system into four levels: 1 if it is Common Law, 2 if it is German Civil Law, 3 if it is French Civil Law and 4 if it is Scandinavian Civil Law. For both variables, the expected sign is positive, in accordance with the established assumptions derived from previous literature reviewed in this regard.
H2. Level of Development.
This hypothesis aims to measure the institutional influence that the level of development of each country has on the profitability and performance of IPOs in each country considered in this study. Based on the empirical studies analysed and reviewed, the variable used to test this hypothesis is LDEVELOP which is a variable to capture the level of development of the country and the fundamentals of the economy. This variable is ranked on a scale of 1 to 7 according to The Global Competitiveness Report (World Economic Forum). For this variable, the expected sign is positive, in accordance with the established assumptions derived from previous literature reviewed in this regard.
This hypothesis aims to measure the institutional influence that the level of corruption in each country has on the profitability and performance of IPOs in each country considered in this study. Based on the empirical studies analysed, the variable used to test this hypothesis is CORRUPT, which is a variable that captures the level of corruption in the country based on different indicators such as political stability, absence of violence and terrorism, among others. It is measured in standard normal distribution units between −2.5 and +2.5, obtained from Worldbank. For this variable, the expected sign is negative in accordance with the established assumptions derived from previous literature reviewed in this regard.
H4. Government Effectiveness.
This hypothesis aims to measure the institutional influence that the level of government effectiveness of each country has on the profitability and performance of IPOs in each country considered in this study. Based on the empirical studies analysed and reviewed, the variable used to test this hypothesis is EFFECTGOV, which is a variable that captures the perceived quality of government and public services. It is measured in standard distribution units between −2.5 and +2.5, is annual and is obtained from Worldbank. For this variable, the expected sign is positive, in line with established assumptions derived from previous literature reviewed in this regard.
This hypothesis aims to measure the institutional influence that the quality of a country’s regulation has on the profitability and performance of IPOs in each country considered in this study. The variable used to test this hypothesis is REGQUAL which is a variable that captures the perception of the government’s ability to formulate and enforce sound policies and regulations. It is measured in standard normal distribution units between −2.5 and +2.5, is annual and is obtained from Worldbank. For this variable, the expected sign is positive in accordance with established assumptions derived from previous literature reviewed in this regard.
H6. Perception of Freedom.
This hypothesis aims to measure the institutional influence that the perception of freedom in a country has on the profitability and performance of IPOs in each of the countries considered in this study. The variable used to test this hypothesis is REGRANK which is a variable that captures the perception of the extent to which a country’s citizens possess freedom of expression, freedom of association and free media. It is obtained from the Global Development Network Growth Database, estimated on a scale of 0 to 10. For this variable, the expected sign is positive in accordance with the established assumptions derived from previous literature reviewed in this regard.
H7. Information Asymmetry.
This hypothesis aims to measure the institutional influence that the level of information asymmetry in a country has on the profitability and performance of IPOs in each of the countries considered in this study. Given the existence of information asymmetry among potential investors in IPOs, and the difference in quality among companies seeking to go public, investors value a signal from the latter that a given IPO is made by a good company. Such a company can bear the cost of issuing a signal by underpricing its IPO, because that initial loss can be recouped over time. Therefore, by assuming a significant initial cost, good issuers give a credible signal that is also costly for other companies to imitate. Indeed, issuers that do not have such quality cannot take the risk of being identified in the market and having their characteristics detected by investors, so they cannot afford such a signal. According to this explanation, better companies will underprice more, have higher returns and perform better in the capital market. Underpricing is a credible signal if imitation costs for low quality firms are high. The idea conjectured by
Ibbotson and Jaffe (
1975) that IPOs must be underpriced in order to leave a good taste in the mouths of investors has been formalised in the model of
Welch (
1989), as well as
Grinblatt and Hwang (
1989) and
Allen and Faulhaber (
1989). The owner’s incentive is the possibility to return to the capital market for the sale of additional securities on better terms.
This explanatory hypothesis of underpricing assumes that the firm has better information than investors about the present value and risk of its future cash flows. In this context, underpricing becomes a means of convincing potential buyers of the high value of the securities. If a company is able to bear the cost of underpricing the shares in the IPO, it communicates to the market that it is a “good” company and is likely to enjoy a better stock market valuation as well as a better chance of raising new financing in the capital markets. Therefore, according to this argument, there is a positive relationship between the level of underpricing suffered and the stock market value of the company. Moreover, high quality issuers underprice IPOs in order to pave the way for the subsequent IPO. Thus, the underpricing of the IPO manifests itself as an exogenous cost signal because the company incurs an opportunity cost by losing funds during the IPO process. In return, the idea conveyed to investors is that this loss of capital can only be recouped by companies with favourable earnings prospects, i.e., high quality companies.
To assess information asymmetry, most academic studies use proxies for ex ante uncertainty that are divided into three groups: the size, the level of profitability of operations and the risk of financial insolvency of the IPO firms. Each of these three elements makes it possible to assess the ex ante uncertainty of the IPO conducted by the IPO target company. With regard to size, large companies show lower degree of uncertainty about their value because they are generally better known to potential investors. In this research, assets are included as a measure of firm size to allow us to make a proper assessment of information asymmetry in relation to firm size. The expected relationship between assets and IPO underpricing, as argued, is of negative sign. The selection of this variable is consistent with the notion that smaller offerings tend to be more speculative than larger ones, so that the initial return required by investors is also higher.
2 A company that has not been profitable may represent greater risk to investors, so investors will demand more return from it in the IPO. If the IPO company is profitable in its operations, it is reasonable to expect it to have a higher attractiveness to investors. The operating performance of the issuing entity provides potential investors with evidence of management effectiveness. This is of crucial importance to investors in companies with significant management ownership prior to the IPO, as the disciplinary force of the management market has not been imposed. The achievement of a high margin of return may relieve investors as to the effectiveness of the management team of the IPO target company and, consequently, reduces the ex ante uncertainty of the IPO.
Consequently, the higher the firm’s past profitability, the lower the ex ante uncertainty, which lowers the initial return required from the IPO. In our estimates, we will include measures of corporate profit and sales, which allow us to assess the ex ante uncertainty considered in this way. The consequences of higher financial indebtedness are well known. Different capital structure models argue that the risk of financial insolvency rises with increasing levels of indebtedness. The higher this risk in the issuing firm, the higher the ex ante uncertainty and, therefore, the higher the initial return demanded by the market in the IPO. The incorporation of the variable measuring corporate debt should a priori have a direct relationship with the level of underpricing of the IPO, although it is not clear what the influence on the long-term performance of IPOs might be.
Based on previous financial literature on asymmetric information, different variables are used, alternatively, to assess the influence of information asymmetry on IPOs and to try to catalogue the level of ex ante uncertainty and are as follows: LNASSETS, which are the firm’s total assets at the end of the year (in natural logarithm); LNSALES, which are the firm’s total sales at the end of the year (in natural logarithm); LNPROFIT, which is the firm’s net profit at the end of the year (in natural logarithm); LNEBIDTA, which is the firm’s EBIDTA at year-end (in natural logarithm); LNDEBT, which is the firm’s total debt at year-end (in natural logarithm) and BOOKV, which is the firm’s book-to-market ratio at year-end. For these variables that capture asymmetric information, the expected sign is positive for all of them except for LNASSETS, where it is negative, and for LNDEBT, which depends on its consideration in the short and long run.
In addition to the independent variables detailed above as explanatory of the initial return and the returns at 1, 3 and 5 years after the IPO according to the different hypotheses, the econometric models incorporate the necessary control variables, which are the control for market return, the control for type of country and the control for country productivity. For the market return control, the LNRMARKET variable is incorporated, which is the natural logarithm of the return of the initial market index at 1, 3 and 5 years, the expected sign being logically positive by application of the market model. Related to this control variable,
Ritter (
1984b) and later by
Jenkinson (
1990) and
Kunz and Aggarwal (
1994) proposed the idea of the institutional lag. According to this idea, the underpricing of IPOs could be attributed to the possible rise in the market between the pricing of the offer and the first day of trading. If the price is determined at a point in time prior to the IPO process and the market rises before the IPO is consummated, the logical consequence is the underpricing of the IPO. The delay is given by the time lag between the IPO pricing and the day of the IPO. The existing empirical evidence is not in favour of institutional delay.
Kunz and Aggarwal (
1994) show that the variable measuring market return has the expected positive sign, but is not statistically significant. This result is consistent with that obtained by
Ritter (
1984b) for the United States, who concludes that the institutional lag hypothesis fails to explain much of the initial return of IPOs; of the 56.2% average initial return of the first issues of natural resource companies made during the period 1977–1982, virtually all of it is unexplained by changes in the market index. In any case, here we are treating it as a control variable for market performance in the period of return calculation which, in each case, is being used as the dependent variable in the model. To control for the type of country, the variable SOUTH is used, which is a dummy variable that takes value 1 if the IPO takes place on a stock exchange in a southern European country (Portugal, Spain, Italy and Greece) and 0 otherwise. The purpose of this variable is to control whether there are significant differences between the performance of southern European IPOs, whose capital markets are a priori considered less developed, and those of the rest of Europe. Finally, the LNGDP variable is a variable that captures the annual percentage growth rate of GDP at market prices based on constant local currency and is obtained from Worldwide Governance Indicators. It aims to control whether the productivity and growth of the country has any effect on the activity and performance of each country’s stock markets.
5. Results
The results of the test of the hypotheses presented in the previous section, obtained using the econometric package STATA, are presented in
Table 4,
Table 5,
Table 6,
Table 7 and
Table 8. The dependent variables of these econometric estimations were, successively, the initial or market index-adjusted returns and the 1-, 3- and 5-year buy-and-hold returns, determined in order to measure the influence of all the variables obtained on the initial returns and the short- and long-term performance of IPOs in Europe over the study period, as well as to ascertain the possible influence of institutional differences between these countries. The VIF results of each regression reflect the absence of correlation problems in these estimates. Previous tests indicated that sectors do not have a significant effect, so they have been excluded in the final estimations. Post-estimation tests confirm the validity of the results presented in the following tables.
The results presented in
Table 4,
Table 5,
Table 6,
Table 7 and
Table 8 show the validity of the hypotheses proposed as explanatory of the influence of institutional differences on the performance of IPOs, both at the level of initial underpricing and 1-, 3- and 5-year performance. The results of this research represent a relevant empirical contribution to add to the international evidence; they allow us to test the influence of institutional differences on initial and long-term performance in a large database of IPOs from 18 European countries, bearing in mind that the European framework has been less analysed than the US institutional environment. On the other hand, the main novelty and contribution of this research in relation to previous research, as we have already pointed out, is that existing research to date only analyses the institutional effect on the anomaly that occurs on the first day of IPO, i.e., underpricing, whereas this study is more ambitious and looks at both the underpricing and the long-term performance of the IPOs considered in windows of 1, 3 and 5 years after the IPO and in an updated time period, ending in 2013, which allows us to cover subsequent returns up to 5 years after the IPO. As data needs to be collected for 1-, 3- and 5-year returns, the database and prices are closed in 2018. This is therefore the largest study to date, to our knowledge, on the effect of institutional factors on the two IPO anomalies: short and long term.
Important previous references include the work of
Engelen and Van Essen (
2010), who have a large database of 2920 IPOs in 21 countries but only analyse the effect of some of the institutional factors analysed here, and only on the underpricing anomaly. In this paper, we have used a larger number of institutional elements that may have a potential influence on both anomalies: initial underpricing and long-term underperformance. The same is true for a more recent paper by
Hopp and Dreher (
2013), which covers 24 countries over the period 1988–2005. This study highlights the influence of legal and institutional factors in explaining cross-country differences in IPOs, but only on the underpricing anomaly. They find that underpricing is higher in countries with stronger protection from outside investors, suggesting that managers use underpricing as a means to secure private profits when going public. They also find that underpricing is reduced when the legal system and accounting information reduce the value of private benefits from control.
Autore et al. (
2014) use a larger database for 37 countries over the period 1998–2005 but, again, they only analyse the effect of institutional differences on the underpricing anomaly.
The results of this research provide a joint analysis for the European IPO market of the institutional effects on both underpricing and long-term underperformance anomalies in 1-, 3- and 5-year windows, making it the most comprehensive study to date of which we are aware.
Analysed together, for the sake of clarity of the results, we find confirmation of the regulation type hypothesis (H1). The results of the econometric analysis show that the type of regulation has a positive and significant influence on both the initial returns of IPOs and their long-term performance in windows of 1, 3 and 5 years after IPO. In general, initial returns and long-term performance are lower for countries with a Common Law system relative to those with a Civil Law system, and within the latter they are higher for those with Scandinavian Civil Law, given the way the explanatory variable is categorised, and the results of the coefficients obtained are statistically significant.
Regarding the hypothesis of the country’s level of development (H2), the results of our estimations only partially support this hypothesis; we do not find statistically significant results that show a relationship between the country’s level of development, as measured by the LDEVELOP variable, and the initial returns of IPOs and their level of underpricing. However, a positive and statistically significant relationship is detected on the performance of IPOs 1 and 5 years after IPO. Therefore, although the level of development of the country does not seem to affect the profitability of the companies at the time of their IPO, it is possible to find a clear influence in the long term. This means that companies that start trading on the stock market have better long-term returns the higher their level of development.
More convincing are the results presented by the coefficients of the variable that capture the level of corruption in the country, which refers to both political stability and the absence of violence and terrorism as its main factors (H3). The results obtained for this variable in the estimations carried out reveal a negative and statistically significant relationship such that, in countries with a higher level of corruption, companies have lower IPO returns, as well as worse performance or returns in the long term, with the result becoming clearer for the 3-year window after the IPO.
With regard to the governance effectiveness hypothesis (H4), what the results of this research show is that countries with a higher level of perceived governance effectiveness have a lower level of underpricing at the time of IPO, i.e., a lower initial price reduction. On the other hand, in the long term, they do show better results, which are particularly evident in the 3-year window after the IPO, indicating that IPOs in these countries perform better in the long term, at least up to 3 years; in the 5-year window, the results are negative again.
The regulatory quality hypothesis (H5) is ruled out in our research. Except in two of the regressions for the long-term window of 5 years, the results obtained for the coefficient of the REGQUAL variable are not statistically significant, so it can be concluded that the perception of regulatory quality, understood as the government’s ability to formulate and implement sound policies and regulations, does not have a positive and statistically significant influence on IPO returns in both the short and the long run.
The hypothesis of perceived freedom and trust (H6) is found to have a significant influence and to be explanatory of IPO behaviour in the short run, but not in the long run. The REGRANK variable presents a positive and statistically significant coefficient in the results obtained in the first two tables, i.e., for the initial return and for the adjusted initial return of the IPO, but not for the estimations in which the dependent variable is a measure of IPO performance at 1, 3 and 5 years. This means that the perception of the country’s freedom, understood as the fact that the citizens of a country have freedom of expression and association, as well as a free media, has an impact on the valuation of IPOs at the time of IPO listing, which is when they present the greatest information asymmetry because they have never been listed. However, this does not seem to have such an influence when they have been listed for some years and are therefore much better known to the investing public.
With regard to the last hypothesis (H7), concerning information asymmetry, the results show more clearly, with measures related to the type of company, that IPOs of companies with higher levels of debt have a greater need to undercut the IPO price; that is, there is greater underpricing at the time of listing but, in the long run, they present worse stock market results or performances given the negative and statistically significant sign for all the estimates in the 3-year performance and also in one of the 5-year ones. On the other hand, the size of the company, in terms of assets, does not seem to affect its valuation or stock market performance, neither in the short nor in the long term. It is possible to observe that IPOs of firms with higher profits show better performance at 1, 3 and 5 years after IPO, given the statistical significance of the coefficient used for this variable. In sum, given the results discussed for some of the variables used to test this hypothesis in the financial literature, we find support for the asymmetric information hypothesis.
Finally, regarding the control variables, the results corroborate the market model, given the positive and statistically significant 99% relationship between the 1-, 3- and 5-year market performance and the market index of each country over the study period. Regarding the type of country, the dummy variable that captures the effect of the IPO being carried out in a southern European stock market is only significant for the day of listing and does not explain the performance of the IPOs in the long term. Thus, for IPOs conducted in southern European countries, the level of underpricing is lower given the negative and statistically significant relationship between this variable and measures of initial IPO performance, both overall and adjusted for the market index. Finally, with regard to the productivity of the country, significant influence is only found for the 1-year IPO performance and the level of gross domestic product of the country.
In short, the results corroborate most of the hypotheses proposed as explanatory, showing a clear influence of institutional variables on the initial profitability and performance of IPOs in windows of 1, 3 and 5 years after the time of IPO which, consequently, has a differential effect depending on the country and institutional environment on the type of IPO anomaly. Our results, therefore, by highlighting the divergences in IPO returns in both the short and long term, depending on the country where the IPO takes place and the institutional characteristics that define each particular market, have implications for researchers seeking to further investigate institutional differences in IPOs, as well as for investors. Our results represent an advance in relation to previous studies because they include information from different countries that have not previously been taken into account.
6. Conclusions
In this research, after a review of the literature on the influence and importance of institutional characteristics based on the analysis of the institutional factors that affect the performance of listed companies, an observation has been carried out on the determinants that may have influenced the shares issued through IPOs, carried out in 18 member countries of the European Union. The results of the empirical study demonstrate the validity of the hypotheses proposed to explain the influence of institutional differences on IPO performance, both at the level of initial underpricing and at the level of 1-, 3- and 5-year performance. Our results represent a relevant empirical contribution to add to the international evidence because they allow us to test the influence of institutional differences on initial and long-term performance in the large database described above. The results of the econometric analysis show that the type of regulation has a positive and significant influence on both the initial returns of IPOs and their long-term performance in windows of 1, 3 and 5 years after IPO. In general, initial returns and long-term performance are lower for countries with a Common Law system relative to those with a Civil Law system, and within the latter they are higher for those with Scandinavian Civil Law, given the way the explanatory variable is categorised. The results of the coefficients obtained are statistically significant. The results obtained show a negative and statistically significant relationship such that, in countries with higher levels of corruption, companies have lower IPO returns, as well as worse performance or long-term returns, with the result becoming clearer for the 3-year window after the IPO. With regard to the variable of perceived governance effectiveness, the results of this research show that countries with a higher level of perceived governance effectiveness have a lower level of underpricing at the time of IPO, i.e., a lower initial price reduction. On the other hand, in the long run, they do perform better, especially in the 3-year window after the IPO, which indicates that IPOs in these countries perform better in the long run. We also find support for the asymmetric information hypothesis, given the results discussed for some of the variables used to test this important hypothesis in the financial literature. In short, the results of our research corroborate most of the hypotheses proposed as explanatory, showing a clear influence of institutional variables on the initial profitability and performance of IPOs in windows of 1, 3 and 5 years after the time of IPO listing which, consequently, has a differential effect depending on the country and the institutional environment on the type of IPO anomaly.
We can conclude that this research has implications both for researchers seeking to further investigate institutional differences in IPOs, as well as for investors; it highlights divergences in the profitability of IPOs in both the short and long term, depending on the country where the IPO takes place and the institutional characteristics that define each particular market. Moreover, all the information synthesised here is useful for practitioners involved in the IPO process and for policy makers interested in promoting securities markets or in privatisation issues. It is also useful, of course, for academics conducting research in the area, for non-specialists wishing to update their knowledge of the IPO literature for teaching or research purposes and for students of corporate finance. Throughout, the focus of this paper has been on an international perspective, drawing on evidence from different countries, both theoretically and empirically. The important institutional and legal differences that exist across countries, even within the European framework, are directly relevant both for the theoretical literature on IPOs and for policy debates on the regulation of the IPO process, and for the initial and long-term performance outcomes in 1-, 3- and 5-year windows after IPO, as just demonstrated.


