
The Impact of the 2008 Financial Crisis on Lisbon’s Housing Prices


Abstract
:1. Introduction
2. Literature Review
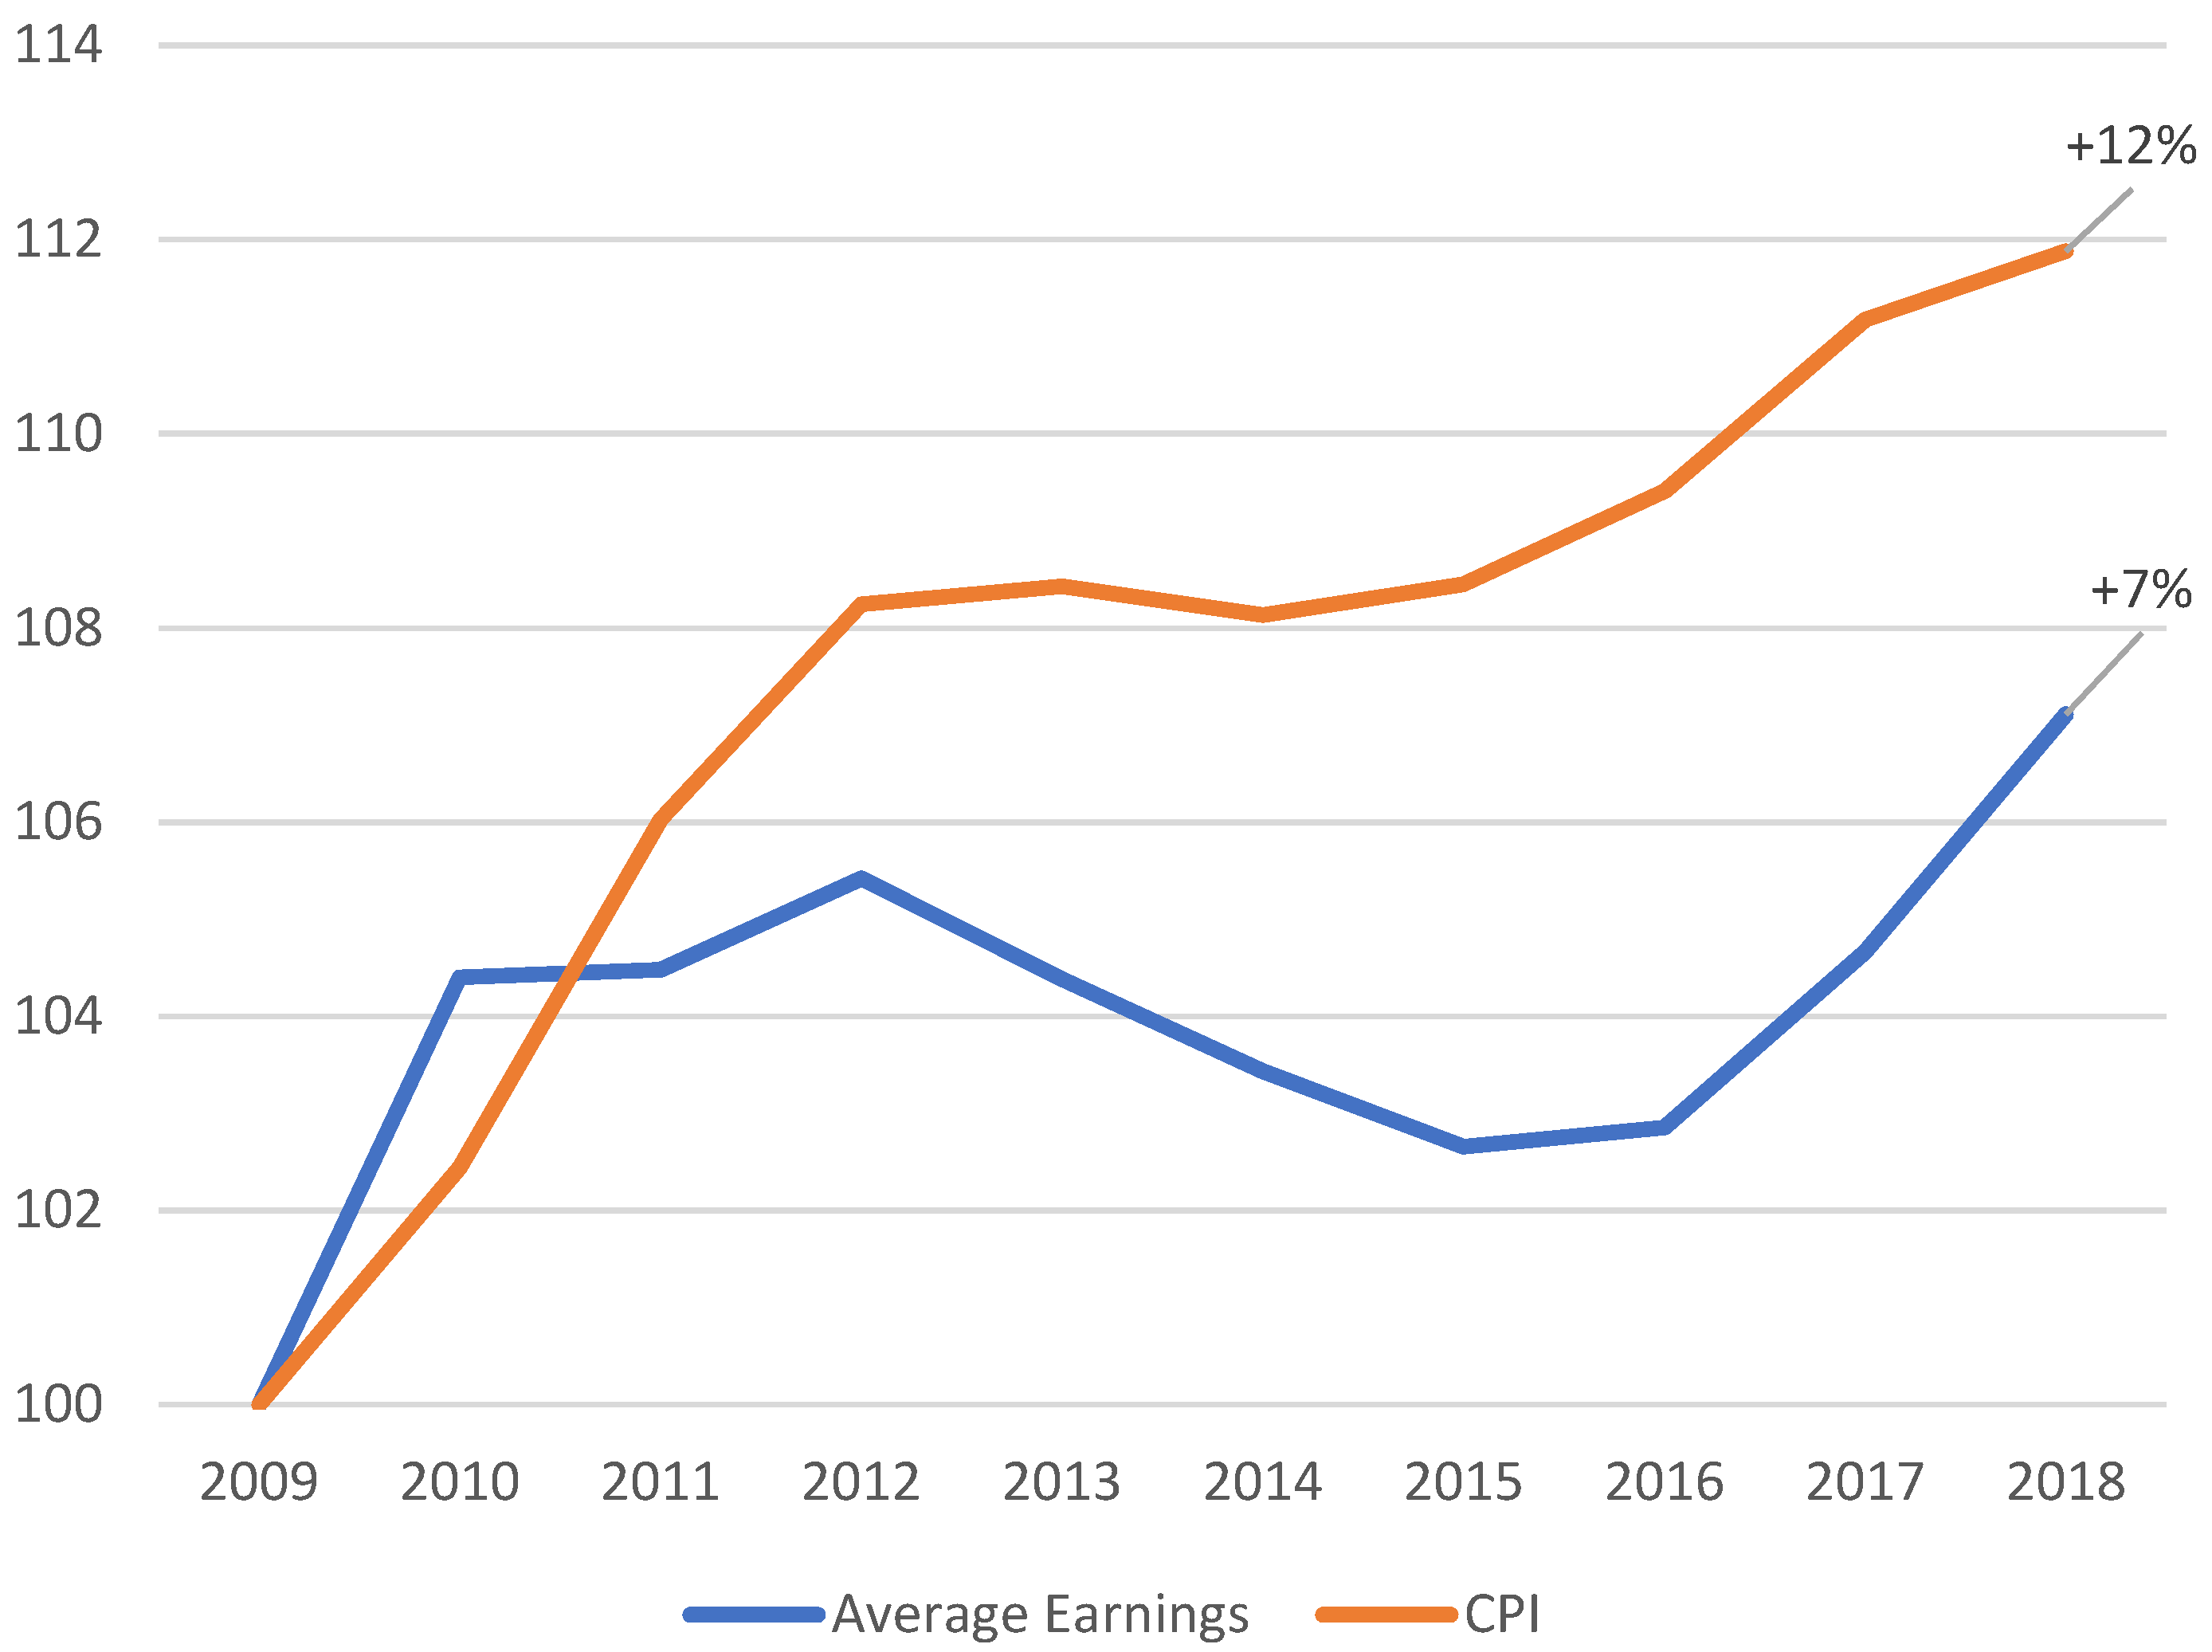
2.1. Population and Household Income
2.2. Housing Supply
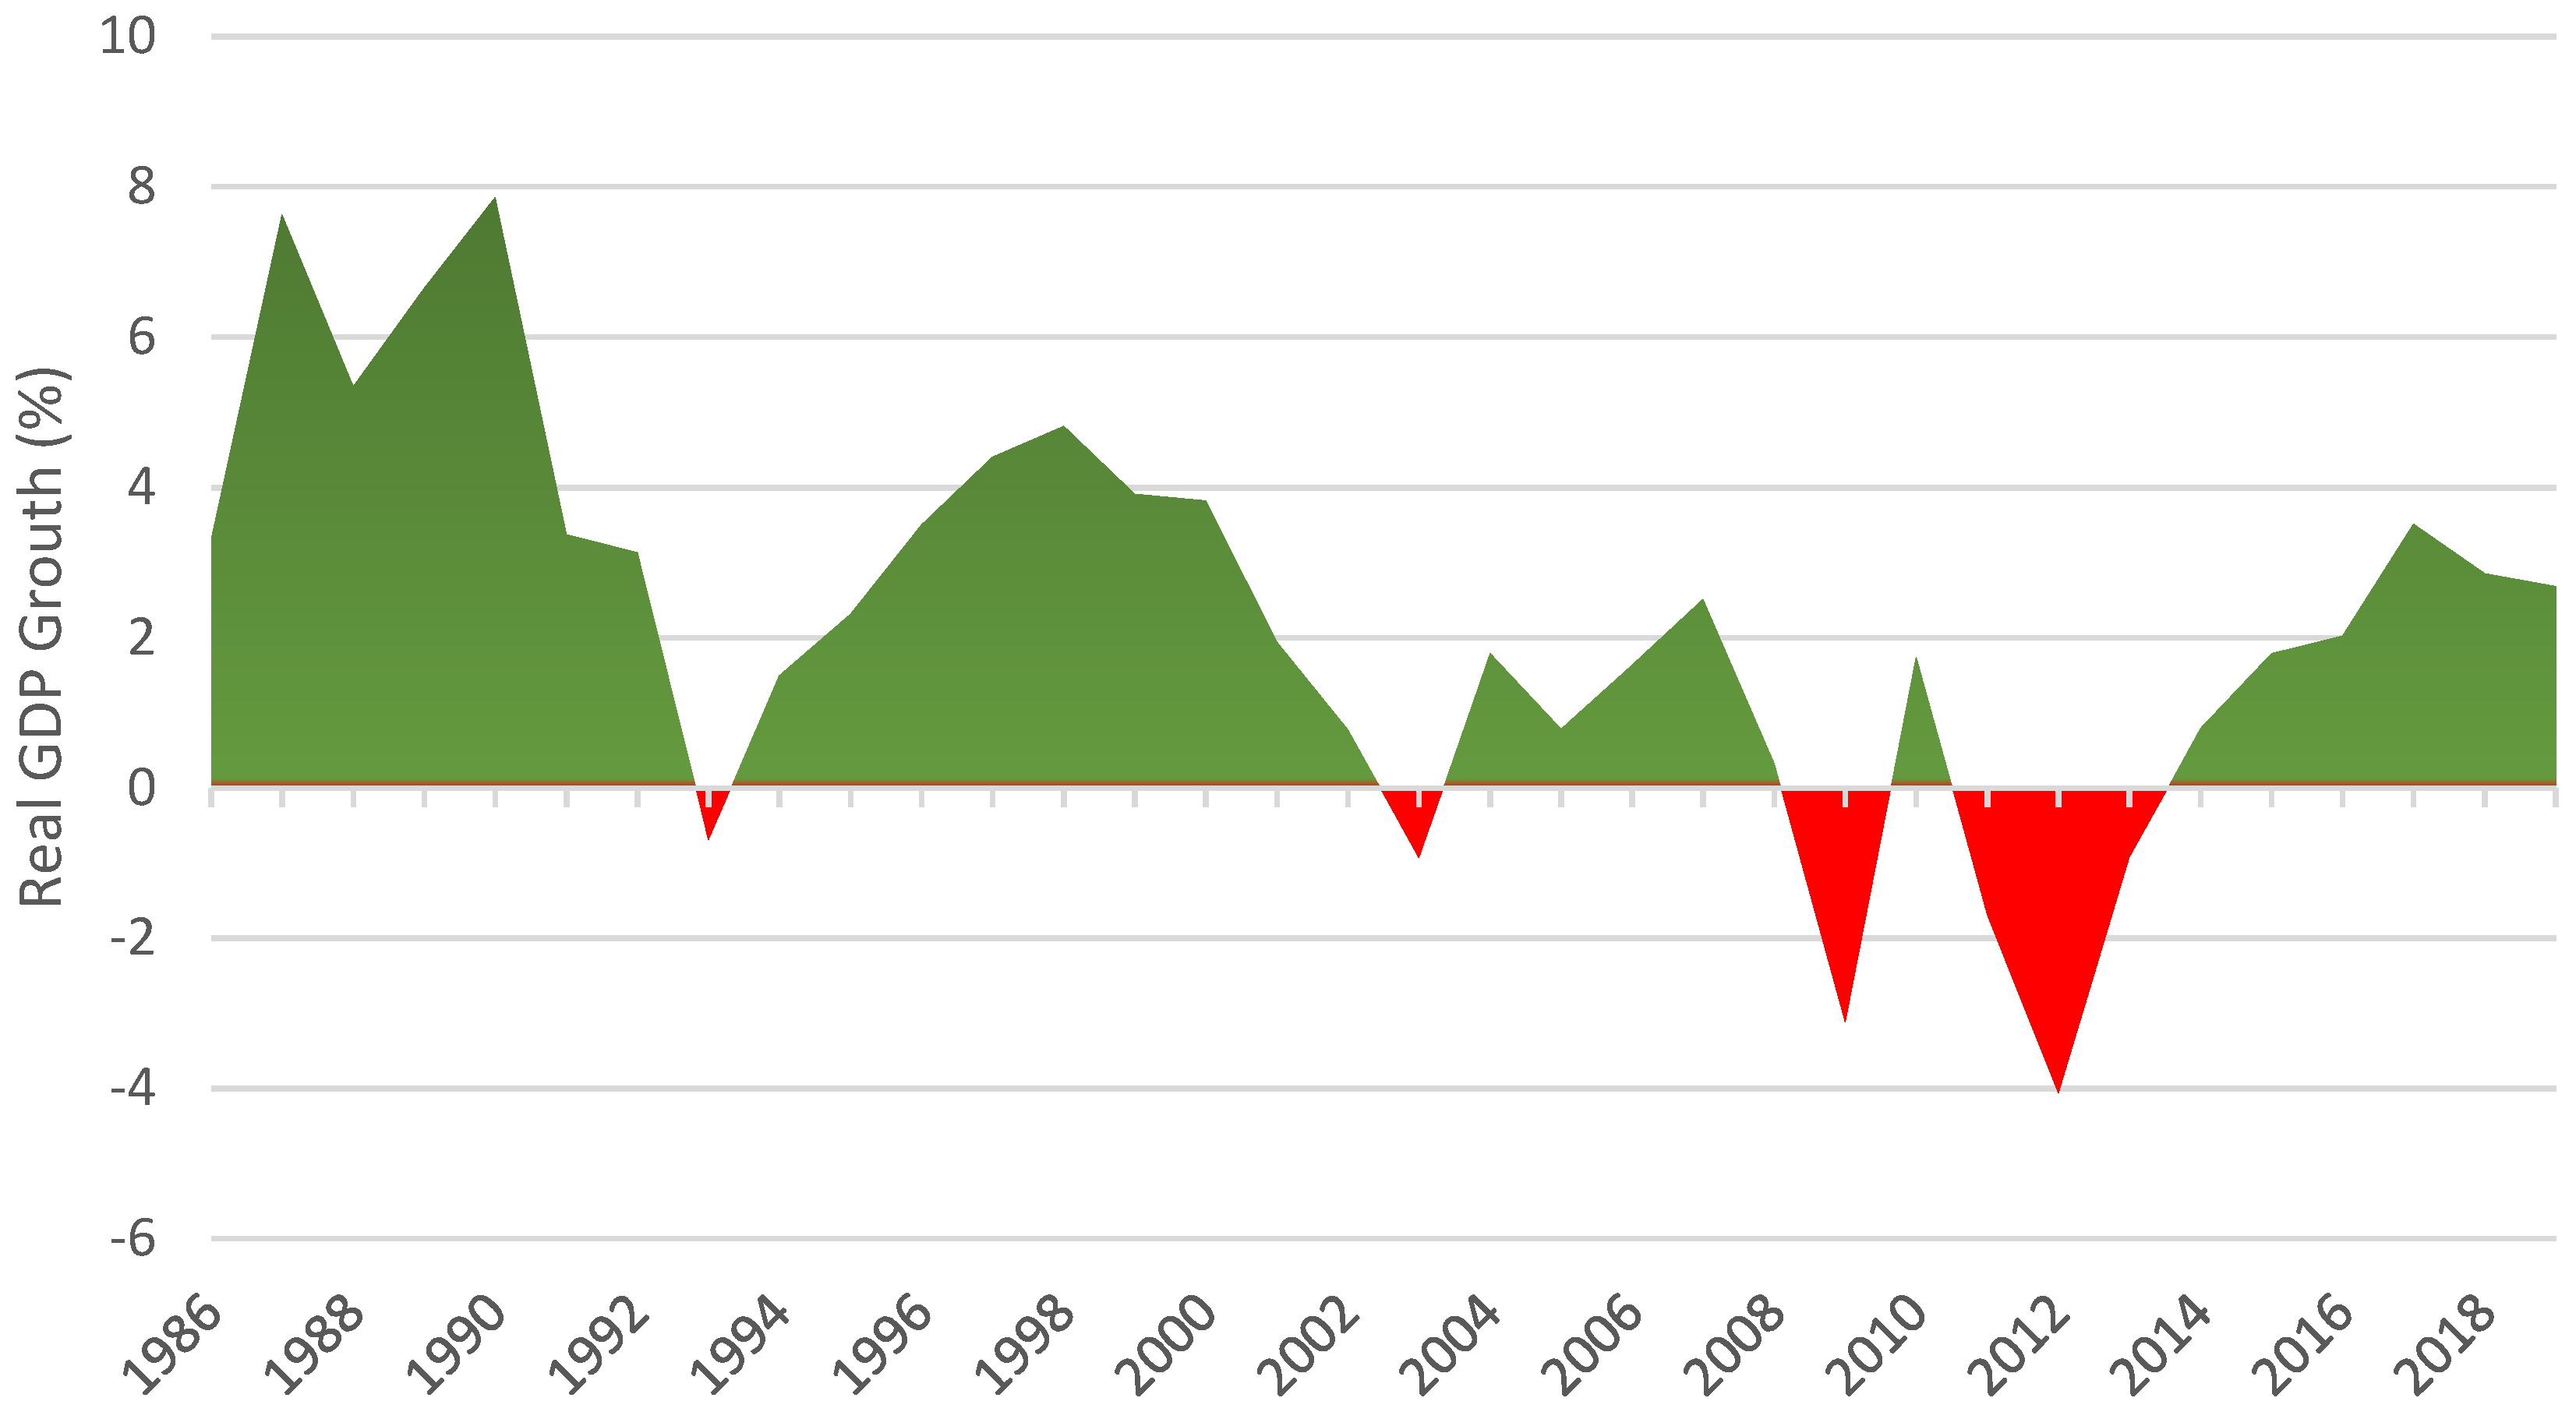
2.3. Gross Domestic Product (GDP)
2.4. Unemployment Rate
2.5. Interest Rates
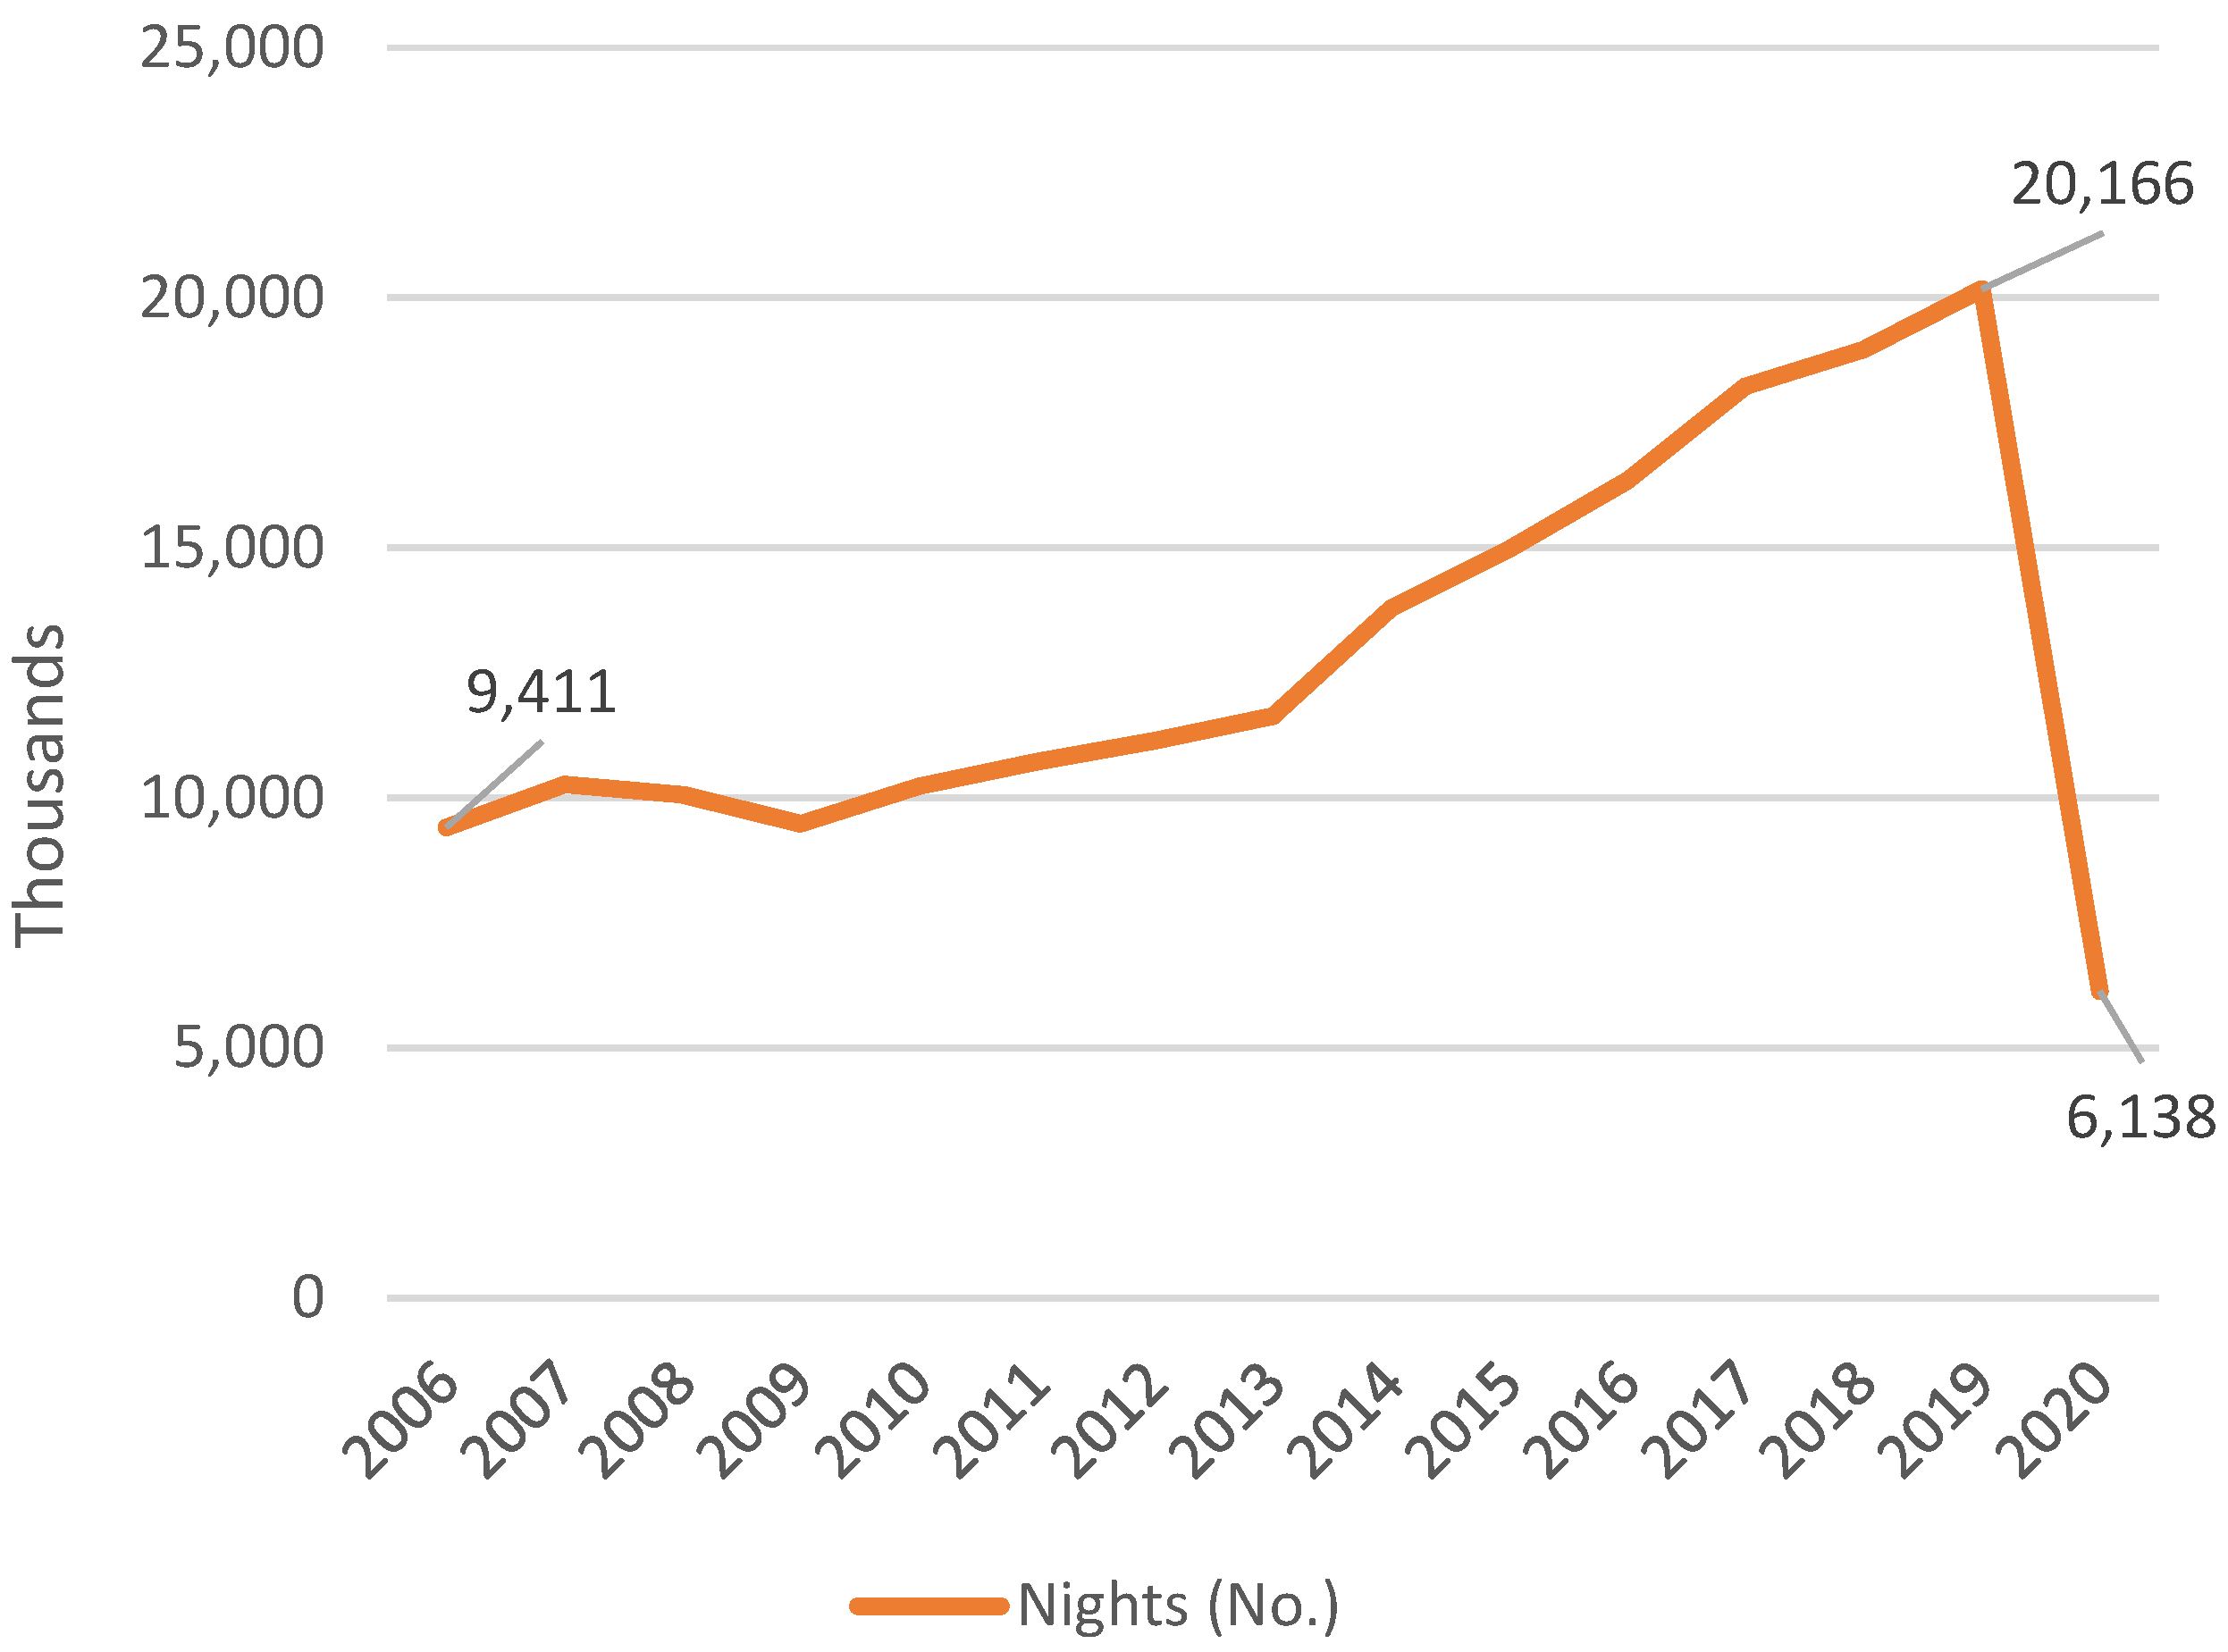
2.6. Tourism
3. Lisbon’s Case
3.1. The Years Prior to the Crisis
3.2. The 2008–2013 Crisis
3.3. The Years That Followed
4. Data and Methods
5. Results and Discussion
6. Conclusions
Author Contributions
Funding
Data Availability Statement
Conflicts of Interest
| 1 | Malaysia, Singapore, Indonesia and Thailand. |
| 2 | Meaning shorter tourist seasons. |
| 3 | In fact, it was not the rent itself that was frozen but the valuation of rental properties, leading to a freeze in rent increases. |
| 4 | The first regime of subsidized credit was in fact created in 1976 and updated during the 80s and 90s (Santos et al. 2014). |
| 5 | Inflation during mid-80s almost peaked at 30%, therefore, investing in a house was one of the best ways to hedge against inflation (Braga 2013). |
| 6 | See, for reference, Santos et al. (2014), chart 15, p. 33. |
| 7 | Decision group created by the European Commission (EC), the European Central Bank (ECB) and the International Monetary Fund (IMF). |
| 8 | The New Urban Lease Law (NRAU), Law n.º 6/2006, presented in 2006, was set to revitalize the rental market, especially in Lisbon and Porto. However, it still presented large restrictions to rent increases, especially in the case of lease contracts prior to 1990, rehabilitation of rented properties and eviction procedures. The original document can be seen at https://dre.pt/dre/legislacao-consolidada/lei/2006-34578375; accessed on 6 January 2023. |
| 9 | For more information refer to https://www.portaldahabitacao.pt/pt/nrau/home/apresentacao_nnrau.html; accessed on 6 January 2023. |
| 10 | For more information refer to https://www.sef.pt/en/pages/conteudo-detalhe.aspx?nID=21; accessed on 9 January 2023. |
| 11 | For more information refer to https://www.globalcitizensolutions.com/pt-pt/estatisticas-golden-visa/; accessed on 9 January 2023. |
| 12 | During this period, the country saw a 234% increase, according to Cunha and Lobão (2022). |
| 13 | https://www.pordata.pt/home/; accessed on 9 January 2023. |
| 14 | Best Linear Unbiased Estimators (BLUE). |
| 15 | Note that covariance matrices are used for determining significance of regression coefficients (p-value) and constructing confidence intervals for each coefficient. |
| 16 | |
| 17 | RATE and CRISIS variables are both significant at 10% under the FGLS estimation. |
References
- Afxentiou, Diamando, Peter Harris, and Paul Kutasovic. 2022. The COVID-19 Housing Boom: Is a 2007–2009-Type Crisis on the Horizon? Journal of Risk and Financial Management 15: 371. [Google Scholar] [CrossRef]
- Agnew, Kerri, and Ronan C. Lyons. 2018. The impact of employment on housing prices: Detailed evidence from FDI in Ireland. Regional Science and Urban Economics 70: 174–89. [Google Scholar] [CrossRef]
- Azevedo, Alda Botelho. 2020. Como Vivem os Portugueses—População e famílias, alojamentos e habitação. Lisbon: Fundação Francisco Manuel dos Santos. ISBN 978-989-9004-49-8. [Google Scholar]
- Banco de Portugal. 2022. Press Release of the Banco de Portugal on the Convergence of the Average Maturity of New Credit Agreements for House Purchase towards 30 Years. Available online: https://www.bportugal.pt/en/comunicado/press-release-banco-de-portugal-convergence-average-maturity-new-credit-agreements-house (accessed on 30 December 2022).
- Biagi, Bianca, Maria G. Brandano, and Dionysia Lambiri. 2015. Does Tourism Affect House Prices? Evidence from Italy. Growth and Change 46: 501–28. [Google Scholar] [CrossRef]
- Blanco-Romero, Asunción, Macià Blázquez-Salom, and Gemma Cànoves. 2018. Barcelona, housing rent bubble in a tourist city. Social responses and local policies. Sustainability 10: 2043. [Google Scholar] [CrossRef] [Green Version]
- Braga, Francisco Moreira. 2013. Mercado Imobiliário em Portugal. Jurismat: Revista Jurídica 2: 199–216. Available online: https://revistas.ulusofona.pt/index.php/jurismat/article/view/7799 (accessed on 11 October 2022).
- Caldera, Aida, and Åsa Johansson. 2013. The price responsiveness of housing supply in OECD countries. Journal of Housing Economics 22: 231–49. [Google Scholar] [CrossRef] [Green Version]
- Carreira, Carlos, Paulino Teixeira, Ernesto Nieto-Carillo, and João Eira. 2021. Crise e Crédito: Lições da Recessão de 2008–2013. Lisbon: Fundação Francisco Manuel dos Santos. ISBN 978-989-9064-32-4. [Google Scholar]
- Case, Karl E., John M. Quigley, and Robert J. Shiller. 2005. Comparing wealth effects: The stock market versus the housing market. Advances in Macroeconomics 5: 1235. [Google Scholar] [CrossRef] [Green Version]
- Câmara Municipal de Lisboa (CML). 2022. Conselho Municipal de Habitação—1ª reunião de co-criação da Carta Municipal da Habitação. Available online: https://cidadania.lisboa.pt/fileadmin/cidadania/participacao/CMH/1_Reuniao_CMH_24-2-2022.pdf (accessed on 11 October 2022).
- Cermáková, Klára, and Eduard Hromada. 2022. Change in the Affordability of Owner-Occupied Housing in the Context of Rising Energy Prices. Energies 15: 1281. [Google Scholar] [CrossRef]
- Cocola-Gant, Agustin, and Ana Gago. 2021. Airbnb, buy-to-let investment and tourism-driven displacement: A case study in Lisbon. Environment and Planning A: Economy and Space 53: 1671–88. [Google Scholar] [CrossRef] [Green Version]
- Cunha, António, and Júlio Lobão. 2022. The effects of tourism on housing prices: Applying a difference-in-differences methodology to the Portuguese market. International Journal of Housing Markets and Analysis 15: 762–79. [Google Scholar] [CrossRef]
- Dietsch, Michel, and Cécile Welter-Nicol. 2014. Do LTV and DSTI Caps Make Banks More Resilient? Available online: https://acpr.banque-france.fr/sites/default/files/medias/documents/201406-do-ltv-and-dsti-capsmake-banks-more-resilient_0.pdf (accessed on 30 December 2022).
- DiPasquale, Denise. 1999. Why don’t we know more about housing supply? The Journal of Real Estate Finance and Economics 18: 9–23. [Google Scholar] [CrossRef]
- Drazen, Allan. 2003. Interest rate defense against speculative attack as a signal. A primer. In Managing Currency Crises in Emerging Markets. Chicago: University of Chicago Press, pp. 37–60. [Google Scholar]
- Duca, John V., John Muellbauer, and Anthony Murphy. 2010. Housing markets and the financial crisis of 2007–2009: Lessons for the future. Journal of Financial Stability 6: 203–17. [Google Scholar] [CrossRef] [Green Version]
- Franco, Sofia F., and Carlos Daniel Santos. 2021. The impact of Airbnb on residential property values and rents: Evidence from Portugal. Regional Science and Urban Economics 88: 103667. [Google Scholar] [CrossRef]
- Füller, Henning, and Boris Michel. 2014. ‘Stop Being a Tourist!’ New Dynamics of Urban Tourism in Berlin-K reuzberg. International Journal of Urban and Regional Research 38: 1304–18. [Google Scholar] [CrossRef]
- Garcia-López, Miquel-Àngel, Jordi Jofre-Monseny, Rodrigo Martínez-Mazza, and Mariona Segú. 2020. Do short-term rental platforms affect housing markets? Evidence from Airbnb in Barcelona. Journal of Urban Economics 119: 103278. [Google Scholar] [CrossRef]
- Garha, Nachatter Singh, and Alda Botelho Azevedo. 2021. Population and Housing (Mis)match in Lisbon, 1981–2018. A Challenge for an Aging Society. Social Sciences 10: 102. [Google Scholar] [CrossRef]
- Glaeser, Edward, and Joseph Gyourko. 2018. The Economic Implications of Housing Supply. Journal of Economic Perspectives 32: 3–30. [Google Scholar] [CrossRef] [Green Version]
- Glaeser, Edward L., Joseph Gyourko, and Albert Saiz. 2008. Housing supply and housing bubbles. Journal of Urban Economics 64: 198–217. [Google Scholar] [CrossRef] [Green Version]
- Goodhart, Charles, and Boris Hofmann. 2008. House Prices, Money, Credit, and the Macroeconomy. Oxford Review of Economic Policy 24: 180–205. [Google Scholar] [CrossRef] [Green Version]
- Gordon, Joshua. 2020. Reconnecting the Housing Market to the Labour Market: Foreign Ownership and Housing Affordability in Urban Canada. Canadian Public Policy 46: e2019009. [Google Scholar] [CrossRef]
- Grimes, Arthur, and Andrew Aitken. 2010. Housing supply, land costs and price adjustment. Real Estate Economics 38: 325–53. [Google Scholar] [CrossRef]
- Grum, Bojan, and Darja Kobe Govekar. 2016. Influence of Macroeconomic Factors on Prices of Real Estate in Various Cultural Environments: Case of Slovenia, Greece, France, Poland and Norway. Procedia Economics and Finance 39: 597–604. [Google Scholar] [CrossRef] [Green Version]
- Hayashi, Fumio. 2011. Econometrics. Princeton: Princeton University Press. Available online: https://books.google.lt/books?id=QyIW8WUIyzcC (accessed on 9 January 2023).
- Hromada, Eduard, and Klara Cermakova. 2021. Financial Unavailability of housing in the Czech Republic and recommendations for its solution. International Journal of Economic Sciences X: 47–58. [Google Scholar] [CrossRef]
- Ismail, Nur Hafizah, and Sabri Nayan. 2019. Determinants of Housing Prise: Evidence from Panel Data. Working Paper. Available online: http://repo.uum.edu.my/id/eprint/26496/ (accessed on 10 October 2022).
- Jaeho, Yoon, and Lee Joohyung. 2014. The linked movement of house prices and GDP in the G7 Countries. The Korea Spatial Planning Review 6: 49–60. [Google Scholar] [CrossRef]
- Kiefer, Nicholas M. n.d. Generalized Least Squares (GLS). Cornell University, Econ 620, Lecture 11. Available online: https://courses.cit.cornell.edu/econ620/Lec11.pdf (accessed on 19 October 2022).
- Leamer, Edward Emory. 2007. Housing is the business cycle. Paper presented at the Economic Policy Symposium, Jackson Hole, WY, USA, August 22–24; Working Paper. pp. 149–233. [Google Scholar] [CrossRef]
- Li, Han, and Yehua Dennis Wei. 2020. Spatial inequality of housing value changes since the financial crisis. Applied Geography 115: 102141. [Google Scholar] [CrossRef]
- MacKinnon, James Gordon, and Halbert White. 1983. Some Heteroskedasticity Consistent Covariance Matrix Estimators with Improved Finite Sample Properties. Queen’s Economics Department Working Paper, No. 537. Kingston: Queen’s University, Department of Economics. [Google Scholar]
- McKee, Kim. 2012. Young people, homeownership and future welfare. Housing Studies 27: 853–62. [Google Scholar] [CrossRef]
- Meen, Geoffrey. 2018. How Should Housing Affordability be Measured. Glasgow: UK Collaborative Centre for Housing Evidence. [Google Scholar]
- Memisevic, Emil, and Nouhad Jalloul. 2022. The Swedish Housing Market: Impact of the 2008 Financial Crisis and the COVID-19 Pandemic: A Comparison between the Financial Crisis in 2008 and the COVID-19 Pandemic. Trollhättan: University West, School of Business, Economics and IT. Available online: http://www.diva-portal.org/smash/record.jsf?pid=diva2%3A1674557&dswid=5978 (accessed on 7 October 2022).
- Mendes, Luís. 2011. Postmodern city, gentrification and the social production of fragmented space. Cidades, Comunidades e Territórios 23: 82–96. [Google Scholar] [CrossRef]
- Mendes, Luís. 2017. Gentrificação turística em Lisboa: Neoliberalismo, financeirização e urbanismo austeritário em tempos de pós-crise capitalista 2008–2009. Cadernos Metropole 19: 479–512. [Google Scholar] [CrossRef]
- Mikulić, Josip, Maruska Vizek, Nebojsa Stojčić, James Payne, Anita Časni, and Tajana Barbić. 2021. The effect of tourism activity on housing affordability. Annals of Tourism Research 90: 103264. [Google Scholar] [CrossRef]
- Miller, Steve, and Richard Startz. 2018. Feasible Generalized Least Squares Using Machine Learning. Available online: https://ssrn.com/abstract=2966194 (accessed on 19 October 2022).
- Mostafa, Anirban, Francis Wong, and Chi Hui. 2006. Relationship between housing affordability and economic development in mainland China: Case of Shanghai. Journal of Urban Planning and Development 132: 62–70. [Google Scholar] [CrossRef]
- Pereira, Sónia Santos. 2022. Dinheiro Vivo. Available online: https://www.dinheirovivo.pt/economia/nacional/venda-de-casas-a-estrangeiros-aumenta-mais-de-70--14963626.html (accessed on 19 October 2022).
- Phelps, Edmund. 1967. Phillips Curves, Expectations of Inflation and Optimal Unemployment over Time. Economica 34: 254–81. [Google Scholar] [CrossRef] [Green Version]
- Phillips, Alban William. 1958. The Relation Between Unemployment and the Rate of Change of Money Wage Rates in the United Kingdom, 1861–1957. Economica 25: 283–99. [Google Scholar] [CrossRef]
- Quigley, John. 1999. Real Estate Prices and Economic Cycles. International Real Estate Review 2: 1–20. [Google Scholar] [CrossRef]
- Reinhart, Carmen, and Kenneth Rogoff. 2008. Is the 2007 US Sub-prime Financial Crisis So Different? An International Historical Comparison. American Economic Review 98: 339–44. [Google Scholar] [CrossRef] [Green Version]
- Rodrigues, José Maria. 2011. O Memorando de Entendimento com a «troika» e as Intervenções Legislativas Programadas para o Mercado de Habitação. Vida Imobiliária, n.º 160 y n.º 161. Available online: https://www.uria.com/pt/publicaciones/3136-o-memorando-de-entendimento-com-a-troika-e-as-intervencoes-legislativas-progra (accessed on 14 October 2022).
- Rodrigues, Paulo, and Rita Fradique Lourenço. 2017. House Prices in Portugal—What Happened Since the Crisis? Economic Bulletin and Financial Stability Report Articles and Banco de Portugal Economic Studies, Banco de Portugal, Economics and Research Department. Available online: https://www.bportugal.pt/sites/default/files/anexos/papers/re201713_e.pdf (accessed on 18 October 2022).
- Rodrigues, Paulo, Duarte Gonçalves, Eduard Anselmo Castro, João Duarte, João Lourenço Marques, João Pereira dos Santos, Luís Aguiar-Conraria, Maria Joana Soares, Paulo Batista, Pedro Brinca, and et al. 2022. O mercado imobiliário em Portugal. Lisbon: Fundação Francisco Manuel dos Santos. ISBN 978-989-9118-00-3. Available online: https://www.ffms.pt/sites/default/files/2022-08/resumo-do-estudo-o-mercado-imobiliario-em-portugal.pdf (accessed on 18 October 2022).
- San Ong, Tze. 2013. Factors affecting the price of housing in Malaysia. Journal of Emerging Issues in Economics, Finance and Banking (JEIEFB) 1: 414–29. [Google Scholar]
- Santos, Ana Cordeiro, Nuno Teles, and Nuno Serra. 2014. Finança e Habitação Em Portugal. Lisboa: Observatório Sobre Crises e Alternativas. [Google Scholar]
- Schäfer, Philipp, and Nicole Braun. 2016. Misuse through short-term rentals on the Berlin housing market. International Journal of Housing Markets and Analysis 9: 287–311. [Google Scholar]
- Schiffmann, Kim. 2019. Foreigners Invest e343.9 Million in Housing in Lisbon. The Portugal News. December 6. Available online: www.theportugalnews.com/news/foreigners-invest-3439-million-in-housing-inlisbon/52249 (accessed on 12 February 2021).
- Seyfried, William. 2010. Monetary policy and housing bubbles: A multinational perspective. Research in Business & Economic Journal 2: 1. Available online: http:www.aabri.com/manuscripts/09351.pdf (accessed on 8 October 2022).
- Shiller, Robert. 2007. Understanding Recent Trends in House Prices and Homeownership. Paper presented at the Economic Policy Symposium, Jackson Hole, WY, USA, August 31–September 1; pp. 89–123. [Google Scholar] [CrossRef]
- Taylor, John. 1993. Discretion versus policy rules in practice. Carnegie-Rochester Conference Series on Public Policy 39: 195–214. [Google Scholar] [CrossRef]
- UNTWO. 2019. World Tourism Organization—International Tourism Highlights. Available online: https://www.e-unwto.org/doi/pdf/10.18111/9789284421152 (accessed on 9 January 2023).
- Valadez, Ray. 2011. The housing bubble and the GDP: A correlation perspective. Journal of Case Research in Business and Economics 3: 1. [Google Scholar]
- Venhoda, Ondrej. 2022. Application of DSTI and DTI macroprudential policy limits to the mortgage market in the Czech Republic for the year 2022. International Journal of Economic Sciences 11: 105–16. [Google Scholar] [CrossRef]
- Vigna, Olivier, and Laurent Ferrara. 2009. Cyclical Relationships between GDP and Housing Market in France: Facts and Factors at Play. Working Papers 268. Paris: Banque de France. Available online: https://publications.banque-france.fr/sites/default/files/medias/documents/working-paper_268_2009.pdf (accessed on 9 January 2023).
- Vizek, Maruska, Nebojsa Stojčić, and Josip Mikulić. 2022. Spatial spillovers of tourism activity on housing prices: The case of Croatia. Tourism Economics. [Google Scholar] [CrossRef]
- White, Halbert. 1980. A Heteroskedasticity-Consistent Covariance Matrix Estimator and a Direct Test for Heteroskedasticity. Econometrica 48: 817–38. [Google Scholar] [CrossRef]
- Wu, Tsung-Pao, Hung-Che Wu, Chien-Ming Wang, and Yu-Yu Wu. 2021. Causality between tourism and housing prices: A wavelet-based approach. Journal of Policy Research in Tourism, Leisure and Events 2021: 1–21. [Google Scholar] [CrossRef]
- Xu, Ting. 2017. The relationship between interest rates, income, GDP growth and house prices. Research in Economics and Management 2: 30–37. [Google Scholar] [CrossRef]
- Yang, Li, Asadullah Khaskheli, Syed Ali Raza, and Nida Shah. 2023. Panel smooth transition regression approach to analyzing tourism development—Housing price nexus in G7 countries. International Journal of Housing Markets and Analysis 16: 218–31. [Google Scholar] [CrossRef]
- Yates, Judith. 2008. Australia’s Housing Affordability Crisis. Australian Economic Review 41: 200–14. [Google Scholar] [CrossRef]
- Zeileis, Achim. 2004. Econometric Computing with HC and HAC Covariance Matrix Estimators. Available online: https://cran.r-project.org/web/packages/sandwich/vignettes/sandwich.pdf (accessed on 19 October 2022).


| Variable | Description | Units | Mean | SD | Min | Max |
|---|---|---|---|---|---|---|
| POP | Resident population | individuals | 525,119.16 | 18,988.17 | 504,471.00 | 550,934.00 |
| NIGHTS | Overnight stays (No.) in hotel establishments | --- | 2,710,980.57 | 855,250.91 | 1,410,553.00 | 4,472,052.00 |
| GDP | Gross Domestic Product | million € | 45,106.35 | 2488.13 | 41,690.80 | 50,908.10 |
| RATE | Euribor 3-months | % | 2.05 | 1.31 | 1.01 | 5.29 |
| EARNINGS | Average monthly earnings | € | 1559.20 | 29.35 | 1508.80 | 1616.10 |
| CRISIS | Period under crisis | dummy | 0.55 | 0.50 | 0.00 | 1.00 |
| PRICE | Sale price of properties | normalized values | 0.96 | 0.16 | 0.74 | 1.45 |
| Variables | OLS (HC0) | FGLS |
|---|---|---|
| INTERCEPT | 102.9110 *** (3.505) | 100.0736 *** (2.820) |
| POP | −29.7019 *** (9.467) | −27.225 *** (9.431) |
| NIGHTS | 0.0065 (0.034) | −0.0097 (0.034) |
| GDP | 9.0911 *** (1.989) | 7.8101 *** (2.242) |
| RATE | −23.7773 ** (10.933) | −23.3798 * (12.470) |
| EARNINGS | −9.5210 *** (2.867) | −7.5919 ** (3.230) |
| CRISIS | −10.7764 ** (4.368) | −8.4970 * (4.768) |
| R-squared | 0.564 | 0.564 |
| Adj. R-squared | 0.474 | 0.471 |
| F-statistic | 8.412 | 6.043 |
| Prob (F-statistic) | 0.000 | 0.000 |
| AIC | 275.9 | 259.2 |
| Durbin-Watson | 1.464 | 1.709 |
Disclaimer/Publisher’s Note: The statements, opinions and data contained in all publications are solely those of the individual author(s) and contributor(s) and not of MDPI and/or the editor(s). MDPI and/or the editor(s) disclaim responsibility for any injury to people or property resulting from any ideas, methods, instructions or products referred to in the content. |
© 2023 by the authors. Licensee MDPI, Basel, Switzerland. This article is an open access article distributed under the terms and conditions of the Creative Commons Attribution (CC BY) license (https://creativecommons.org/licenses/by/4.0/).
Share and Cite
Januário, J.F.; Cruz, C.O. The Impact of the 2008 Financial Crisis on Lisbon’s Housing Prices. J. Risk Financial Manag. 2023, 16, 46. https://doi.org/10.3390/jrfm16010046
Januário JF, Cruz CO. The Impact of the 2008 Financial Crisis on Lisbon’s Housing Prices. Journal of Risk and Financial Management. 2023; 16(1):46. https://doi.org/10.3390/jrfm16010046
Chicago/Turabian StyleJanuário, João Fragoso, and Carlos Oliveira Cruz. 2023. "The Impact of the 2008 Financial Crisis on Lisbon’s Housing Prices" Journal of Risk and Financial Management 16, no. 1: 46. https://doi.org/10.3390/jrfm16010046