Article

Earnings Less Risk-Free Interest Charge (ERIC) and Stock Returns—A Value-Based Management Perspective on ERIC’s Relative and Incremental Information Content

1
Institute for Management, Accounting & Finance, Leuphana University, Universitätsallee 1, 21355 Lüneburg, Germany
2
Department of Business and Management, University of Southern Denmark, Universitetsparken 1, 6000 Kolding, Denmark
*
Author to whom correspondence should be addressed.
J. Risk Financial Manag. 2022, 15(8), 368; https://doi.org/10.3390/jrfm15080368
Submission received: 28 July 2022 / Revised: 12 August 2022 / Accepted: 13 August 2022 / Published: 19 August 2022
(This article belongs to the Special Issue Business Performance)

Abstract

:
This paper investigates the relative and incremental information content of KPMG’s recently developed metric for shareholder value creation: earnings less risk-free interest charge (ERIC). We assess if ERIC has a better ability to predict stock returns than earnings, cash flow from operations (CFO), earnings before extraordinary items (EBEI), residual income (RI), or economic value added (EVA). We evaluate data from 214 companies listed on the U.S. Standard & Poor’s 500 Index from 2003 to 2012 (2354 firm-year observations). Similar to previous studies, we confirm that CFO and EBEI have the strongest association with stock returns in the short term, while EVA trails behind all other metrics. In terms of new findings, ERIC is the best predictor of stock returns over a 5-year period, as well as during times of crises (from 2009 to 2010). In this period, ERIC also adds incremental information content beyond that of EBEI. However, the low-short-/mid-term predictive ability of shareholder value metrics (EVA, ERIC) raises concerns regarding their reliable use in future research on shareholder value creation. We consequently propose a research agenda that focuses less on the measurement and more on the management of shareholder value.

1. Introduction

Within the area of value-based management (VBM), scholars and practitioners have developed several financial metrics that supposedly predict stock returns. Managers need such metrics in order to set targets that are in line with shareholder interests. Common accounting metrics (e.g., earnings) fall short of this goal, partly because they ignore the different risks of different investments (Koller et al. 2015; Stewart 1991). Empirical evidence documents the difficulty of finding internally controllable metrics that approximate stock returns and are robust against noise. Large consulting firms have gone to “Metric Wars” with each other over which metric is the best proxy for stock returns (Myers 1996). Results remained mixed even when the debate spread into academic journals. The value relevance of value-based measures remains of interest in current research (Brück et al. 2022; Liao et al. 2021; Mavropulo et al. 2021). In their systematic literature review on this topic, Toft and Lueg (2015b) show that some authors provide evidence that sophisticated metrics based on residual income outperform classic accounting metrics in predicting stock returns, while at the same time, a considerable amount of studies negate the superiority of these metrics, especially the most popular one, economic value added (EVA), developed by the consulting firm Stern Stewart. Despite these ambiguous results, managers need a sense of direction as to which financial goals they should target. This debate remains relevant since alternative multiple-goal performance measurement systems have not proven to be a strong alternative to VBM.
KPMG and Velthuis (2004) attempted to advance the debate by fundamentally rethinking the approach to residual value. They argue that extant residual-income-based performance metrics such as EVA use an exaggerated capital charge when evaluating managers ex post for their efforts, and that a firm has created shareholder value if its investments have realized a return higher than its risk-free cost of capital. The authors argue that the assumptions of net present value are being violated if realized (i.e., risk-free) profits are ex post benchmarked against expected (i.e., ex ante, risky) profits. Performance management systems built on this fallacy would motivate managers to pick investments with low-variance outcomes, but not those that are expected to create the highest stock returns. As a result, the authors introduce the metric earnings less risk-free interest charge (ERIC). ERIC benchmarks managerial performance in terms of realized (risk-free) profits against the investment’s risk-free cost of capital.
As yet, no study has provided empirical evidence to show if ERIC constitutes a superior metric of shareholder value creation (Velthuis and Wesner 2005). Such an investigation is warranted because KPMG, a Big 4 audit firm, is an influential source of management practices. In addition, a simultaneous check regarding the performance of EVA may settle conflicting results and confirm the ongoing validity of previous findings (e.g., on EVA by Biddle et al. 1997). Hence, it is the goal of this study to 
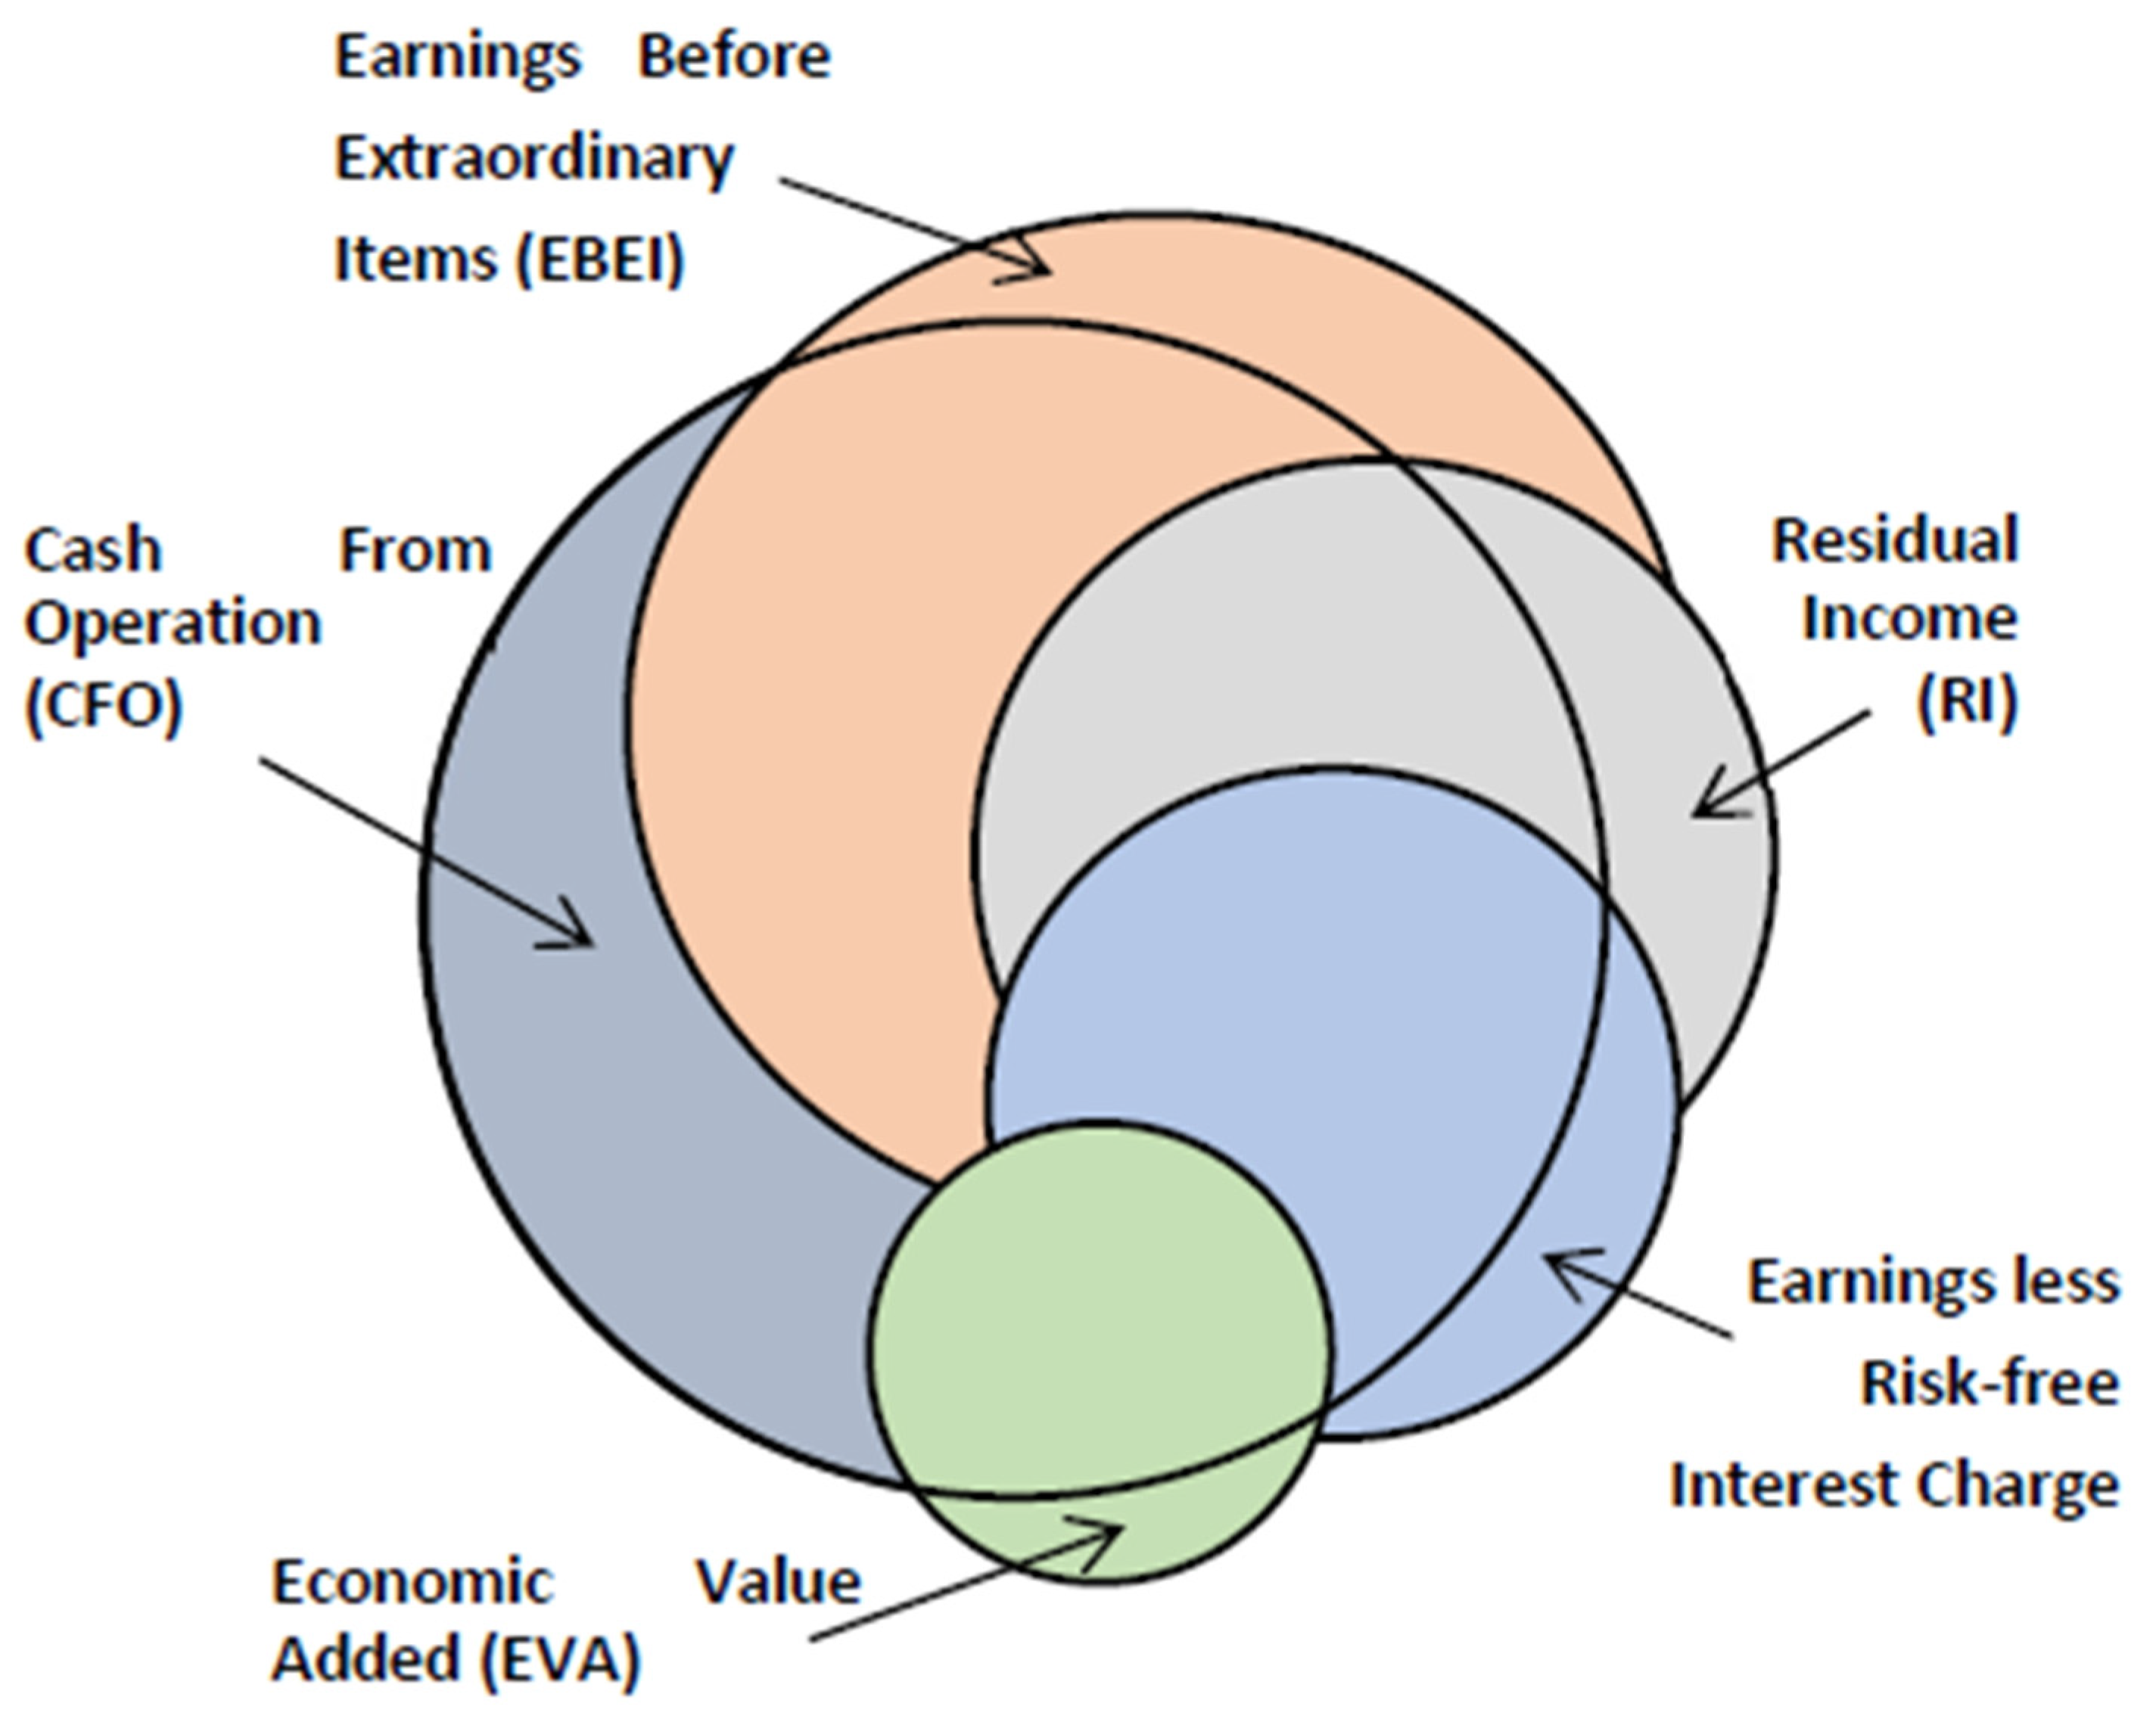
evaluate the relative and incremental information content of ERIC in predicting stock returns. Relative information content examines if ERIC has a greater association with stock returns than other proxies. For this, we compare ERIC to previously investigated stock return proxies, i.e., cash flow from operations (CFO), earnings before extraordinary items (EBEI), residual income (RI), and EVA. Incremental information content assesses whether any one component of ERIC adds incremental information content beyond that which is contained in its other components. The components of ERIC are CFO, accrual, extraordinary items (ExtraOrd), after-tax interest expenses (ATInt), certainty equivalent adjustments (CEQAdj), and capital charge (CapChg).
To ensure comparability with previous studies, we follow the established methodology in this field (Biddle et al. 1997; Easton and Harris 1991). Our dataset contains information on 214 S&P500 companies from annual reports and the U.S. stock market over a 10-year period ranging from 2003 to 2012. We present two major findings. First, we find that accounting-based performance metrics exhibit the strongest association with stock returns in the short and long term. Residual income prevails in the intermediate term. Second, as a novelty in this field, we can document that ERIC clearly outperforms EVA in predicting stock returns. This might spark new debates on controversial VBM metrics such as EVA. As to incremental information content, five of ERIC’s six components add incremental information content in the short term (the exception being extraordinary items). Overall, we find that ERIC is not a predictor of transient and myopic 1-year stock returns. Rather, we provide evidence that ERIC is a valid predictor of long-term stock returns. On this basis, we debate how using ERIC can benefit practicing managers in target setting and managing firm value.
The remainder of the study is organized as follows: Section 2 describes the components of ERIC, the hypothesis, and the statistical tests. Section 3 describes the data, the variables, and the descriptive statistics. Section 4 and Section 5 provide the analyses and sensitivity analyses, respectively. Finally, Section 6 discusses the results, and Section 7 sums up the study.

2. Theoretical Background and Hypotheses

2.1. The Association of Shareholder Value Metrics with Stock Returns

Value-based management (VBM) supports decision making and control directed toward the objective of maximizing firm value (Firk et al. 2016; Lueg 2010a). VBM is a comprehensive strategic performance management system (SPMS) across all functions of a for-profit firm that aligns managerial action with a key financial metric (Firk et al. 2019). Hence, metrics such as ERIC are not synonymous with VBM, but a small part of it (Burkert and Lueg 2013; Lueg 2009, 2010b). From an external perspective, firm value is generally approximated through stock returns (Schmaltz et al. 2019). From an internal perspective, proponents of VBM argue that managers need to have tools and targets that link their actions and the expectations of shareholders (Firk et al. 2019; Stewart 1991; Young and O’Byrne 2001). The quality of these metrics is generally assessed by their correlation with stock returns (Bacidore et al. 1997). Biddle et al. (1997) conducted the seminal study on this topic (Feltham et al. 2004; Lueg and Schäffer 2010). In their main findings, they show that earnings outperform EVA in explaining stock returns (relative information content), and that EVA components offered only marginally more incremental information content over earnings. Their study has triggered a stream of research on this topic, with mixed results (Toft and Lueg 2015b). Several replication studies agree that cash-/accounting-based performance metrics are most accurate for predicting stock returns (Chen and Dodd 2001; Clinton and Chen 1998; Holler 2008; Ismail 2006; Kaur and Narang 2009; Kumar and Sharma 2011; Kyriazis and Anastassis 2007; Maditinos et al. 2009). However, other researchers using different firms and time frames have found that EVA outperforms earnings in both relative and incremental information content (Bacidore et al. 1997; Feltham et al. 2004; O’Byrne 1999; Parvaei and Farhadi 2013; Worthington and West 2004). It is particularly noteworthy that a paradox exists in the current state of empirical research on VBM metrics that warrants further investigation: even the studies opposing residual-value-based metrics as a better empirical predictor of stock returns agree that the consideration of capital charges is conceptually sensible (Toft and Lueg 2015b).

2.2. Linkages between Shareholder Value Metrics

2.2.1. From Accounting Metrics to Residual Income

We now demonstrate how the selected performance metrics build on each other. We need this breakdown of metrics to study the incremental information content of single components. EBEI consists of CFO and accruals.
EBEI t = CFO t + Accrual t
where
  • CFO t = Cash flow from operations;
  • Accrual t = Total accruals related to the operating activities. Accruals could be depreciation, amortization, changes in non-cash current assets, changes in current liabilities, and changes in deferred taxes.
Net Operating Profit After Taxes (NOPAT) is defined as EBEI plus the cost of interest expenses after taxes. It thereby represents a firm’s profits independent of its choices on equity/debt financing.
NOPAT t = EBEI t + ATInt t
where
  • ATInt t = After tax interest expenses.
NOPAT represents firm-specific amounts of capital employed, and each firm’s operations are subject to their individual capital costs. RI accounts for these differences by deducting a capital charge (CapChg). The capital charge is calculated by multiplying the weighted cost of debt and equity capital with the capital employed to earn the NOPAT. RI = 0 indicates that shareholder value has been created that matches the expectations of shareholders. RI > 0 is seen as a proxy for shareholder value creation above the return that would be required for this asset class (Bromwich and Walker 1998).
RI t = NOPAT t k CE t 1
where
  • k   = weighted average cost of capital (WACC);
  • CE t 1 = Capital employed at the beginning of the period = Short   debt t 1 + long   debt t 1 + Other   long   liabilities t 1 + shareholders   equity t 1 .
Stewart (1991) suggests that CE should only include the long-term debt. The reason is that a firm cannot rely on assets financed in the short term to sustain its long term “business model” (Friis et al. 2015; Haubro et al. 2015; R. Lueg et al. 2019). However, the firm effectively uses these funds. Moreover, the exclusion of short-term debt violates the principle of clean surplus accounting (Velthuis and Wesner 2005). We include all capital to conform to the definition of ERIC.

2.2.2. EVA

Stern Stewart & Co. suggests calculating EVA as RI with adjustments to NOPAT and the capital employed (Stewart 1991).
EVA t = NOPAT t + AcctAdj op k ( CE + AcctAdj c )
where
  • AcctAdj op : Stern Stewart offered over 160 adjustments to NOPAT, but generally limited the actual number to a handful (Stewart 1994). We made common adjustments to EVA based on Young (1999) and Ray (2012), i.e., for amortization.
  • AcctAdj c : Stern Stewart also offered many adjustments to the capital employed, but also recommended only employing the most relevant capital (Stewart 1994). We made common adjustments to EVA based on Young (1999) and Ray (2012), i.e., the elimination of current liabilities.
To test the incremental information content of EBEI, NOPAT, RI, and EVA, we can now break down the performance metrics as follows:
EVA t = CFO t + Accrual t Earnings   ( EBEI ) + ATInt t Operating   Profits   ( NOPAT )     CapChg t 1   Residual   Income +   AccAdj t 1 Economic   Value   Added  
where
  • CapChgt−1 = k * (CEt−1);
  • AcctAdjt−1 = AcctAdjop − (k * AcctAdjc).

2.2.3. ERIC

ERIC is based on the RI from Equation (3). Yet, ERIC differs from RI (that is, also EVA) in three ways. First, ERIC is based on clean surplus accounting that includes both the NOPAT as well as the (5) extraordinary items in total profit. Thereby, ERIC achieves more congruent incentives for executives to act in the interest of shareholders, who are the residual claimants of all (and not just the operating) profits. Second and third, RI and EVA use a single, WACC-based discount rate to account for the riskiness of future profits after tax (PATs) and the time value of money. ERIC accounts for these two aspects separately and thereby circumvents the fallacy of mixing ex ante decision making with ex post compensation for realized risk (Feltham and Ohlson 1999; Pfeiffer and Velthuis 2009; Velthuis and Wesner 2005). As to risk, ERIC does not use estimates of risky PATs as RI and EVA. ERIC immediately deducts the equity risk premium from the estimated risky PATs in absolute, monetary terms. This leaves lower PATs that now represent the certainty equivalents (denoted by PAT t ¯ ) investors would require if they could arbitrage a risky investment with a risk-free investment in the same firm/asset class (Toft and Lueg 2015a). Naturally, to calculate this certainty equivalent, the same information on the cost of equity is necessary that is also required to calculate RI and EVA. Third, ERIC accounts separately for the time value of money. This is completed by discounting the lower (risk-free) certainty equivalents by the risk-free rate of return (denoted by i). Evaluating an investment over its entire life span, RI, EVA, and ERIC will yield the same result because the lower PATs of ERIC are also discounted by a lower risk-free rate of return. The only difference is the timing of payouts: ERIC will estimate higher short-term and lower long-term returns. Hence, ERIC can be written as
ERIC t = NOPAT + ExtraOrd ¯ t i CE t 1
where
  • NOPAT + ExtraOrd t ¯   = (NOPAT + ExtraOrd) − CEQAdjt;
  • i t = risk-free rate of return for the specific firm;
  • CE t 1 = see above.
The certainty equivalent adjustment (CEQAdjt) represents the risk premium. It is calculated as a percentage of the expected total profit (NOPAT + ExtraOrd) (KPMG and Velthuis 2004, p. 16). CEQAdjt is determined by the relation of the WACC (k) to the risk-free rate of return (i), where i < k, because the risk-free interest rate is assumed to be the lowest possible return of an investment. We start with the equation showing that the total risky profit (NOPAT + ExtraOrd) discounted by the WACC (k) equals the certainty equivalent (NOPAT + ExtraOrd − CEAdjt) discounted by the risk-free rate of return:
E(CFt)/(1 + k)t = [E(CFt) − At]/(1 + rf)t
Solving for CEAdjt, we can calculate the absolute amount that needs to be deducted from the total profit to transform it into a certain future profit:
E(CFt) × (1 + rf)t = E(CFt) × (1 + k)t − At × (1 + k)t
CEQAdj t = ( NOPAT + ExtraOrd t ) α t
where
α t = ( ( 1 + k ) t ( 1 + i ) t ) / ( 1 + k ) t 1
This results in the factor α t. When we now multiply the risky future profits by α t, we obtain the security equivalent of these profits, i.e., they have been transformed into certain future profits.
At = [[(1 + k)t − (1 + rf)t] / (1 + k)t] × E(CFt)
where = αt [[(1 + k)t − (1 + rf)t]/(1 + k)t]
By removing the risk of uncertainty from a future cash flow, one will be compensated only for the time value of money. Hence, the certainty equivalents can now be discounted by the risk-free rate of return (i) instead of WAAC (k).
To test the incremental information content of ERIC, the performance metric must be broken down through the above performance metrics.
ERIC t = CFO t + Accrual t Earnings   ( EBEI ) + ATInt t Operating   Profits   ( NOPAT )   CEQAdj t Certainty   Equivalent   ( NOPAT ¯ t ) CapChg t 1 Earnings   less   Risk free   Interest   Charge   ( ERIC )

2.3. Hypotheses Development

This study will test relative information content and incremental information content. Relative information content analyzes which performance metric (CFO, EBEI, RI, EVA, or ERIC) has a greater stock association than the others (Biddle et al. 1997, p. 307):
HR. 
The information content of metric X1 is equal to that of X2.
The analysis is a ranking of performance metrics and choosing between mutually exclusive performance metrics. Rejection of HR indicates significant differences in relative information content between pairwise combinations of CFO, EBEI, RI, EVA, and ERIC.
Incremental information content tests whether any one component of ERIC contributes value-orientated information content beyond the information contained in other components of the performance metric investigated.
HI. 
Component X1 does not provide information content beyond that provided by the remaining components X2–X5.
X1–X5 are components of ERIC (CFO, accrual, ATInt, CEQAdj, and CapChg). First, we test if one metric provides information content beyond the information content contained in other components using a t-test. We then test the null hypothesis using F-statistics. Rejection of HI indicates that one component of ERIC adds statistically significant information content beyond that contained in the other components of ERIC.

2.4. Statistical Tests

This study uses the same statistical tests that Biddle et al. (1997, pp. 308–11) did in Journal of Accounting & Economics for reasons of the comparability of results. The model for testing relative information content is a one-lag model accounting for expected values that estimates market expectations jointly with slope coefficients. It can be written as follows:
D t = b 0 + b 1 X t / MVE t 1 + b 2 X t 1 / MVE t 1 + e t
Based on Equation (11), we make 10 pairwise comparisons between the R2s of our five metrics (CFO, EBEI, RI, EVA, ERIC). Furthermore, the model used for testing incremental information content, consistent with the model used by Biddle et al. (1997), is as follows:
D t = b 0 + b 1 X t / MVE t 1 + b 2 X t 1 / MVE t 1 + b 3 Y t / MVE t 1 + b 4 Y t 1 / MVE t 1 + e t
Analyses, which use other variants of the above model in Equations (11) and (12), are specified in the note below the tables. All the performance metrics and components of ERIC are scaled by the market value of equity (MVEt−1) three months after the beginning of the fiscal year. This is done to reduce heteroscedasticity (Biddle et al. 1997).

3. Sample Selection, Variable Definitions, and Descriptive Statistics

In order to ensure comparability with previous studies in this field, we align our methodology as much as possible with Biddle et al.’s (1997) seminal study. The data used in this study refer to the firms of the Standard & Poor’s 500 Index, and are collected from Compustat, the Center for Research in Security Prices (CRSP), and Bloomberg. We cover a 10-year period beginning on 1 January 2003 and ending on 31 December 2012. Some of our calculated metrics require information for the fiscal year 2002, which gives a total of 11 years. A total of 269 firms were removed, either because their fiscal year ended during the year or due to data unavailability. A total of 17 firms were removed due to extreme outliers that would substantially distort the linear equation for the majority of the sample (Hair et al. 2018). For the same reason, 103 firm-year observations were winsorized within four standard deviations (Wooldridge 2017). That is, variables are assigned a value equal to the median minus (plus) four standard deviations. The final data set encompasses 214 firms for the period 2002–2012.

3.1. Dependent Variable

MktAdjRets is the dependent variable. It comprises the 12-month compound stock return of a firm (January–December), less a 12-month compound return on the S&P500 stock market index (April–March). The comparison to the market return detects the over-/underperformance of a firm. We subtract a 3-month-lagged stock return since market participants need some time to incorporate all information contained in the annual report into stock prices (K. Lueg et al. 2019; Lueg 2022; Lueg and Pesheva 2021; Muheki et al. 2014). Data are obtained from CRSP.

3.2. Independent Variables and Descriptive Data: Relative Information Content Tests

This study deals with the same independent variables as Biddle et al. (1997), but with one additional variable, ERIC.
CFO: Cash flow from operation, acquired through Compustat data item D308 and item name “Operating Activities Net Cash Flow”. The definition from Compustat is “change in cash from all items classified in the Operating Activities section on a Statement of Cash flow”.
EBEI: Earnings before extraordinary items, obtained from Compustat data item D18 and item name “Income before Extraordinary Items”.
RI: Calculated using EBEI plus ATInt less WACC, obtained from Bloomberg using the mnemonic “WACC” multiplied by the CE using KPMG and Velthuis’ (2004) definition.
EVA: Economic value added is calculated using the same information as RI, but with adjustments defined by Young (1999) and Ray (2012).
ERIC: Earnings less risk-free interest charge is calculated using the certainty equivalents of PAT ( P A T t ¯ ) and risk-free interest charge of capital ( i C E t 1 ), calculated as per KPMG and Velthuis (2004). See Section 3.2 for a more detailed data description.
All independent variables are deflated by the MVE three months after the beginning of the fiscal year (MVEt−1) to reduce heteroscedasticity. Table 1 shows the pooled descriptive data. Like Biddle et al. (1997), this study of the descriptive statistics finds the lowest standard deviation for EBEI and higher values for the mean and median for CFO. 
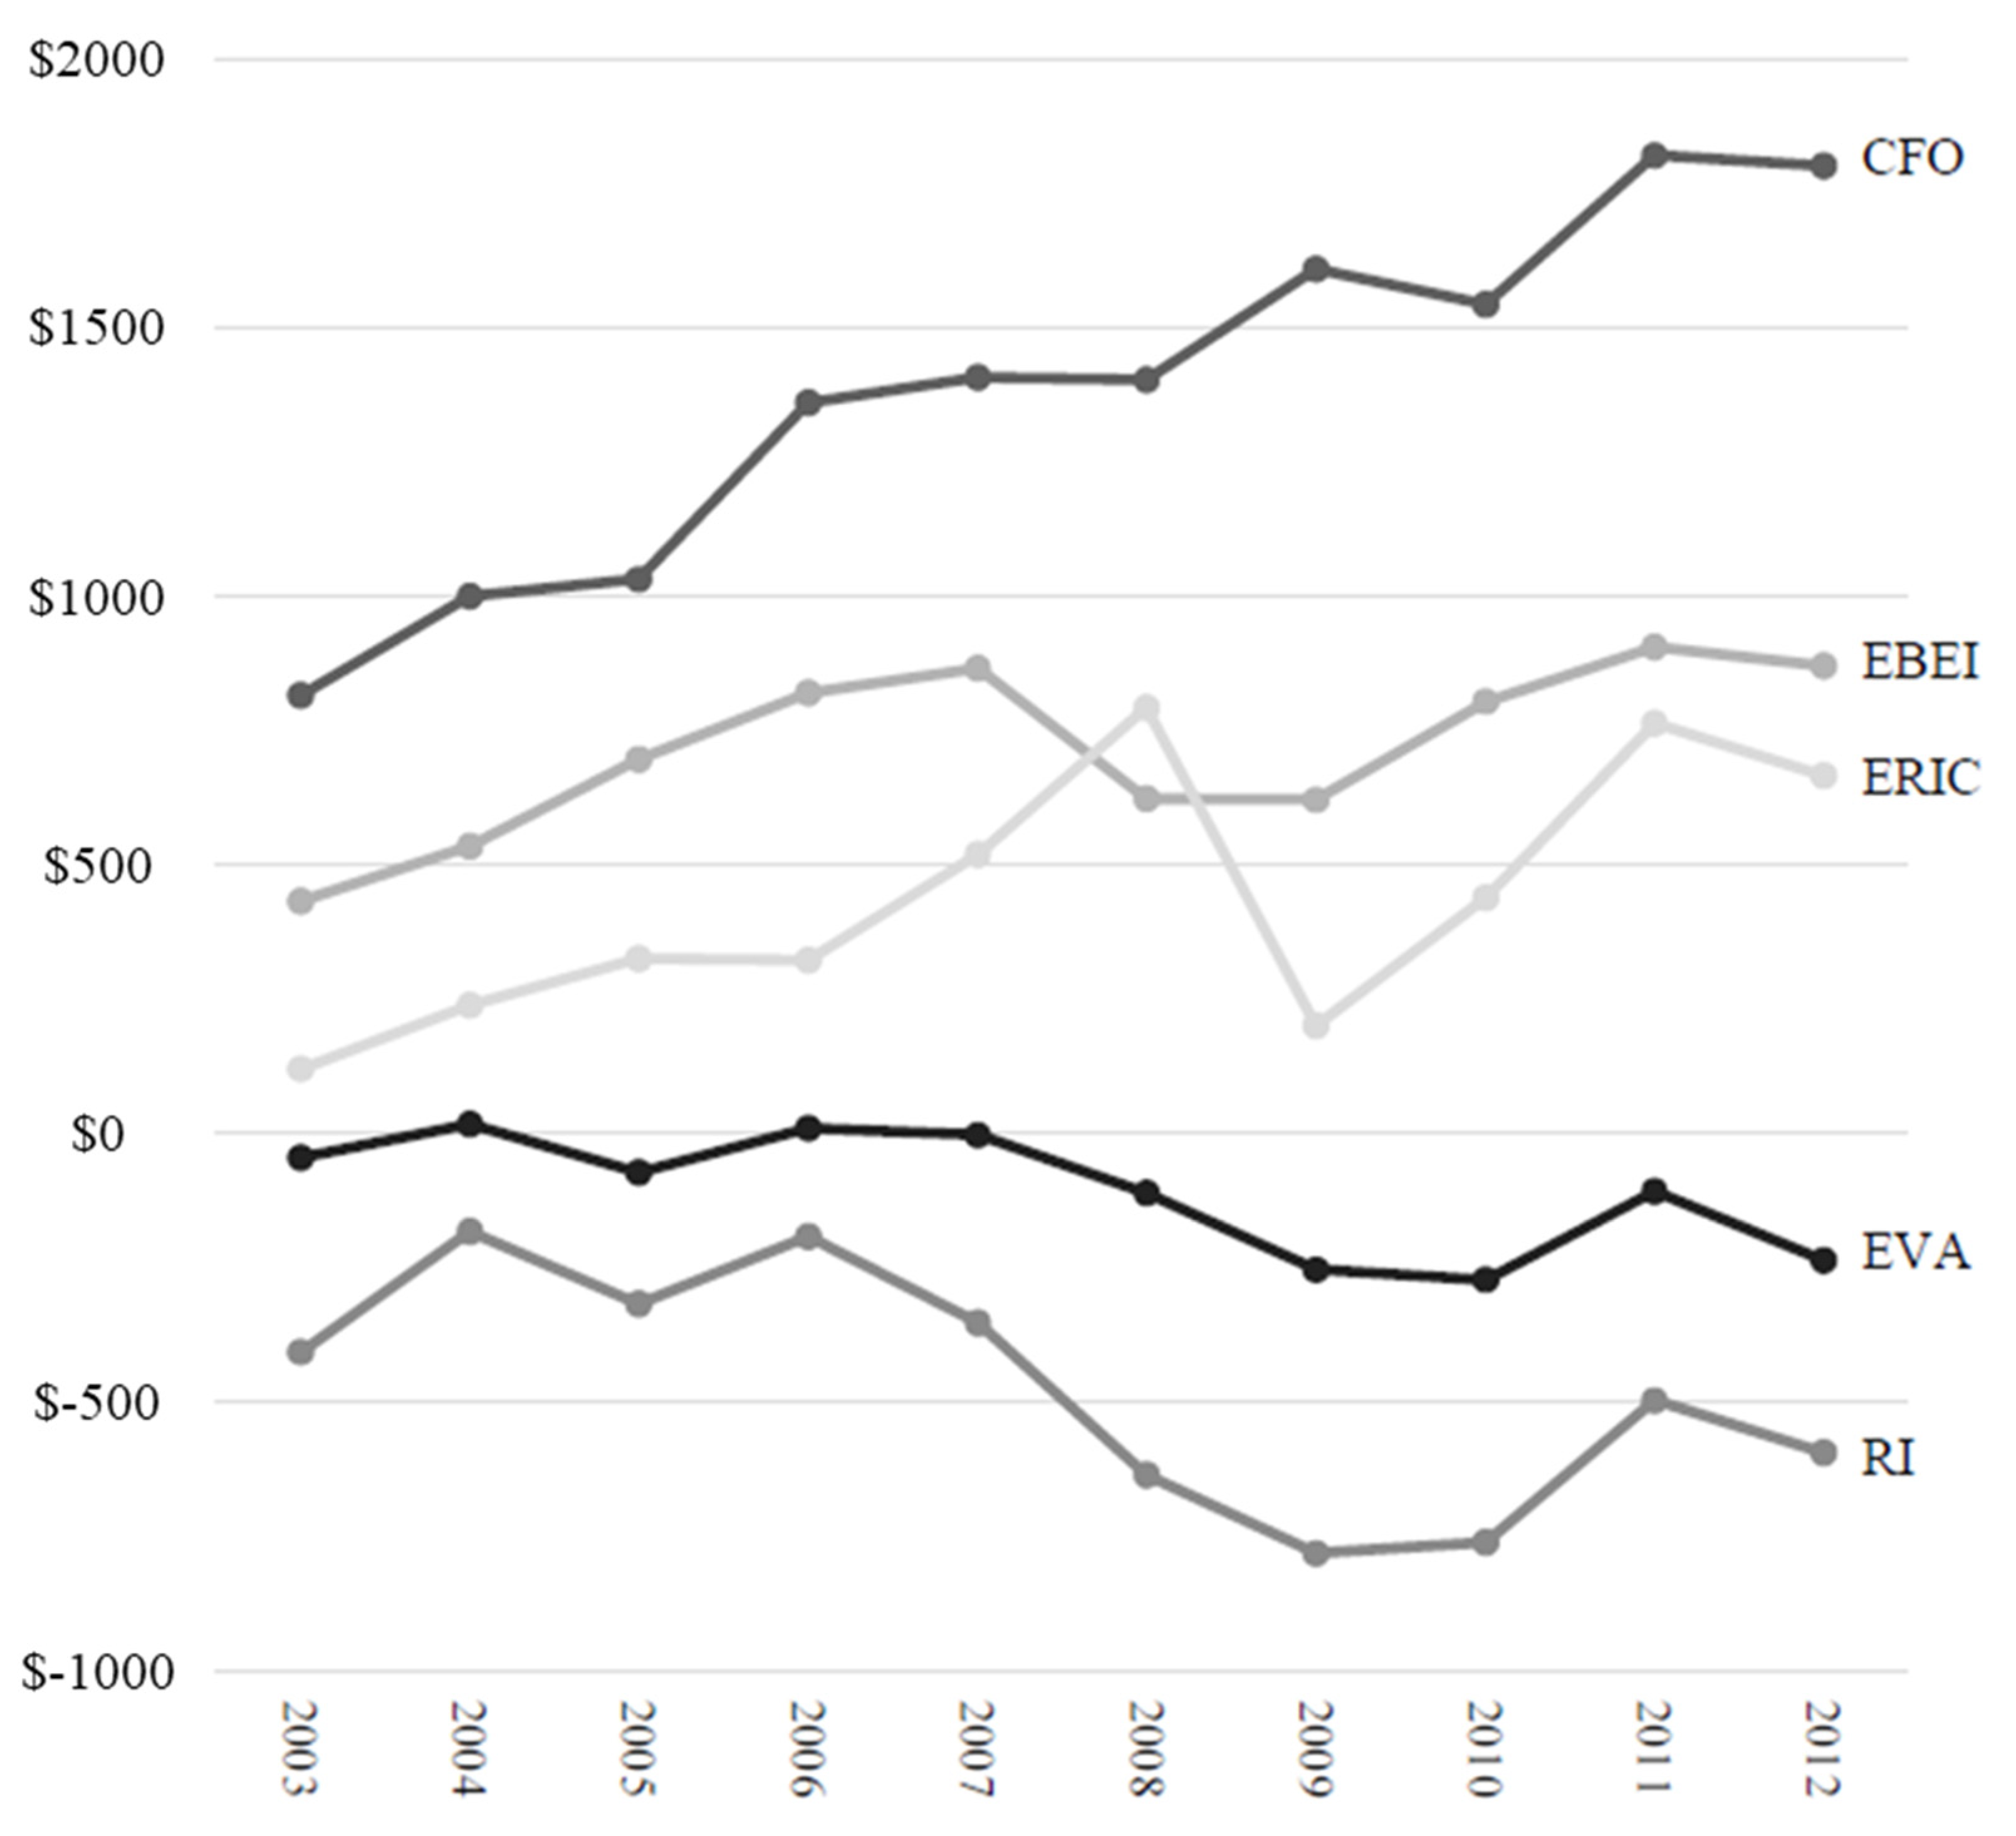
Figure 1 illustrates the non-deflated median values from each performance metric. EVA is negative for 8 out of 10 years, and RI is negative for 5 out of 10 years. CFO, EBEI, and ERIC are positive every year. The negative values of EVA and RI could indicate the difficulties of earning above the capital costs in a competitive market (Chen and Dodd 2001). It could likewise indicate the use of overly high levels of cost of capital, making it difficult for companies to create shareholder value, as claimed by KPMG and Velthuis (2004). To investigate the level of the performance metrics, Bacidore et al. (1997) argue that a performance metric must have a natural level, which must be zero, meaning that if a particular performance metric is positive, then one should expect a positive reaction in the stock price, and the opposite if negative. CFO has the same sign as stock returns in 1186 of 2140 firm years (55.4%), which is higher than EBEI, ERIC, EVA, and RI with 55.3%, 52.9%, 51.6% and 51.4%, respectively. This analysis does not take into account the level above or below the performance metric and stock returns, respectively, but only if the sign of the performance metric is the same as the stock return, which could indicate that performance metrics have a natural level for shareholder value creation.
Unlike Biddle et al. (1997), who found EBEI to be most correlated with MktAdjRets, but consistent with Clinton and Chen (1998), this study indicates that CFO is most correlated with MktAdjRets; CFO is followed by RI, ERIC, EVA, and EBEI. RI, ERIC, and EVA are surprisingly negatively correlated with MktAdjRets; this is also consistent with Clinton and Chen (1998), who found EVA to be negatively correlated with stock returns and RI to be insignificant. According to Clinton and Chen (1998), the reason might be that the market is not as efficient as assumed, or the cost of capital information might not be incorporated into the stock prices. RI seems to be highly correlated with EBEI, EVA, and ERIC, but EBEI is also highly correlated with ERIC.

3.3. Independent Variables and Descriptive Data: Incremental Information Content Tests

ERIC is composed of five components: CFO (defined above), accrual, ATInt, ExtraOrd, CEQAdj, and CapChg.
Accrual: Like Biddle et al. (1997), accrual is calculated as E B E I C F O . It is expected to be negative due to non-cash items, which is the case according to panel B of Table 1.
ATInt: After-tax interest expenses are obtained from Bloomberg.
ExtraOrd: Extraordinary Items are included to make ERIC match more with existing theory.
CEQAdj: Certainty equivalent adjustment is an adjustment to earnings before interest after taxes (EBIAT). CEQAdj is calculated using the Capital Asset Pricing Model (CAPM) and the risk-free interest charge.
CapChg: Capital charge is calculated using the definition of CE by Pfeiffer and Velthuis (2009) and the risk-free interest rate used in the calculation of CEQAdj.
Like Biddle et al. (1997), panel B in Table 1 shows that the accrual median and mean are negative, meaning that, on average, CFO is larger than EBEI, and that the firm in the income statement is burdened by non-cash items such as depreciation, amortization, change in non-cash current assets and current liabilities, and so forth. Accrual and CFO are highly negatively correlated, consistent with Biddle et al. (1997). CapChg is only statistically significantly correlated at a 0.05 level with MktAdjRets, which is inconsistent with the theoretical argument of the superiority of performance metrics including CapChg over those excluding CapChg. All other components are mutually statistically significant at a level of 0.01. The ERIC-specific components ExtraOrd and CEQAdj are not statistically significant with MrkAdjRets (panel B in Table 1). All other components are correlated at a level of 0.01 except CapChg and CEQAdj, which are correlated at a level of 0.05. CEQAdj and CapChg are not statistically significantly correlated with ExtraOrd.

4. Empirical Results

4.1. Relative Information Content Tests

The first test addresses the relative information content. We regress each of the five performance metrics (CFO, EBEI, RI, EVA, ERIC) against MktAdjRets. Table 2 ranks the performance metrics from left (highest) to right (lowest) by their explanatory power (adjusted R2s). Below the adjusted R2s, we show the statistical significance of the ten pairwise comparisons of these five metrics. The explanatory value of all the performance metrics differs significantly at p < 0.000. According to panel A of Table 2, CFO is the best predictor of adjusted market returns (7.9%), followed by EBEI (4.6%) and RI (also 4.6%). ERIC is fourth (3.4%), and clearly outperforms EVA (2.5%) in explaining adjusted stock returns. All pairwise combinations of performance metrics are statistically significant at a p < 0.001 level. Therefore, we reject the null hypothesis (HR) that the information content is the same for all the performance metrics.
Biddle et al. (1997) argue that positive coefficients of the performance metrics (i.e., profitable firm years) will cause stronger market reactions than negative ones (i.e., loss-making firm years). Panel B of Table 2 uses a modified version of Equation (11) where we separated the coefficients of each performance metric over the observation period into positive and negative ones. For all performance metrics, the coefficients for non-lagged observations are higher than the lagged observations, and four of the five are positive. Three of the five p-values for non-lagged observations are equal to or more significant than the p-values of the lagged observations. Although only partly consistent with Biddle et al. (1997), this study expects non-lagged (lagged) coefficients to be positive (negative). EBEI (10.7%) outperforms ERIC, CFO, RI, and EVA (10.0%, 9.7%, 5.8%, and 3.2%, respectively). In both analyses, ERIC beats EVA on a statistically significant level. All p-values are statistically significant at a p < 0.001 level. All metrics increase explanation power when values are split between those positive and negative. EBEI seems to perform best when values are split, while ERIC triples its explanatory power and only slightly underperforms EBEI. Overall, we can conclude that ERIC beats EVA in predicting 1-year stock returns. However, accounting-based performance metrics perform even better than residual-income-based performance metrics.

4.2. Incremental Information Content Tests

To perform tests for incremental information content, we use the following regression model:
D t = b 0 + b 1 CFO t + b 2 CFO t 1 + b 3 Accrual t + b 4 Accrual t 1 + b 5 ATInt t + b 6 ATInt t 1 + b 7 CEQAdj t + b 8 CEQAdj t 1 + b 9 CapChg t + b 10 CapChg t 1 + e t
Predicted signs of the coefficients are shown in Table 3. Of course, the lagged coefficients are predicted to be the opposite of the non-lagged coefficient (Biddle et al. 1997). There should be a positive association between CFO, accrual, and ExtraOrd, and a negative association between ATInt, CEQAdj, and CapChg.
Table 3 indicates that 9 of the 12 predicted signs were predicted correctly. All components are statistically significant at a level of 0.05 except for ATIntt, ATIntt−1, ExtraOrdt−1, CEQAdjt, and CEQAdjt−1. The F-statistics show that CFO has the greatest incremental information, followed by accrual, CapChg, ATInt, CEQAdj, and ExtraOrd. These components of ERIC explain 12.7% (=R2) of the variance in 1-year MktAdjRets. Compared with the relative information content, the components of ERIC seem superior in explaining MktAdjRets compared with the other performance metrics. The components of ERIC contribute more incremental information content than the other performance metrics. Therefore, we reject the null hypothesis (HI) that none of the components add information content beyond that contained in other components.
The Venn diagram (Figure 2) illustrates the relative and incremental information content for the performance metrics. The size of the circles illustrates relative information content, and the non-overlapping areas illustrate incremental information content. CFO has the largest relative information content, as reported in panel A of Table 4. CFO illustrates considerably greater information content than RI, EVA, EBEI, and ERIC.

5. Sensitivity Analyses and Extensions

We test the sensitivity of the results in Table 2 and Table 3. This section tests the same performance metrics in several different ways by using four different tests: partitioning of annual observations into five non-overlapping two-year periods (Section 5.1); adopters of EVA/ERIC-like metrics (Section 5.2); long-term association with stock returns (five-year) (Section 5.3); and changing returns from contemporaneous (one-year) to contemporaneous plus one-year ahead (two-year) returns (Section 5.4).

5.1. Differences across Subperiods

This section divides the dataset into five two-year subperiods from 2003 to 2004, 2005 to 2006, 2007 to 2008, 2009 to 2010, and 2011 to 2012 (results are not separately tabulated but summarized later in Table 7). In the period from 2003 to 2004, CFO had the highest R2 (6.3%). From 2005 to 2006, RI (14.9%) was most associated with MktAdjRets. From 2007 to 2008, EBEI was the strongest predictor of stock returns (12.4%). During the period of the financial crisis from 2009 to 2010, ERIC was most associated with MktAdjRets and explained 11.9% of the annual returns. In the period from 2011 to 2012, EBEI again had the highest R2 (16.2%). ERIC outperformed EVA in all periods, except from 2003 to 2004, but the greater R2 in that period was not statistically significant.
In incremental information content tests, 13 (12) of 30 ERIC components (6 over 5 periods) are significant at a level of p < 0.05 (p < 0.01). None of the components are statistically significant at conventional levels (p < 0.05) in any period. For the two-year periods, CFO adds the most incremental information content beyond that contained in the other components.

5.2. Do adopters of VBM Metrics React More Strongly?

Firms that adopt VBM metrics are, obviously, more likely to manage them and aim for their maximization (Toft and Lueg 2015b). Accordingly, VBM adopters should eventually show greater association with MktAdjRets than non-adopters (Biddle et al. 1997; Palliam 2006). To distinguish between (sophisticated) adopters and non-adopters, we examined annual reports and proxy statements for 2140 firm years from 2003 to 2012. We searched for the terms ERIC, EVA, economic value added, economic profit, residual income, abnormal earnings, excess earnings, excess income, excess realizable profit, and super-profits. None of the firms used ERIC. We created two categories of adopters: VBM adoption was used as a dummy variable metric if firms mentioned one of our search terms. A total of 146 of the 214 firms used these VBM-related terms in their annual reports or proxy statements (68.2%). The second, VBM compensation, was used if firms mentioned that the metric was used in this specific year for compensation purposes. Of the possible 2140 firm years, 1170 firm years (54.7%) were found to contain such metrics in relation to the top executive compensation in that given year. We re-ran our regression from above, expecting that the importance of RI, EVA, and ERIC would increase.
Table 4 depicts our results for the relative information content. Compared with our original investigation (Table 2), all explanatory power of the metrics decreased. We would have expected this decrease for CFO and EBEI, as VBM adopters (both VBM adoption and VBM compensation) should focus more on RI, EVA, and ERIC. However, the predictive power of VBM metrics also decreased. Overall, CFO and EBEI are still better predictors of stock returns than VBM metrics. In this test, among VBM adopters, ERIC does not significantly outperform EVA anymore. This is probably because none of the firms mentioned ERIC, so none of them have attempted to manage ERIC.
Table 5 depicts our results for the incremental information content. Both VBM adoption and VBM compensation show greater R2 (15.50% and 18.50%) than the model used in Table 3 (12.70%). This suggests that firms using VBM metrics have a greater association with one-year MktAdjRets. CFO and accrual are once more the two components with the greatest information content. However, they add less incremental value among VBM adopters, as shown by the lower F-statistics compared to Table 3. Further components of ERIC add less incremental value to explaining stock returns, and yet, they are higher among VBM adopters (Table 5) than among the whole sample (Table 3). Unlike in Table 3, the ExtraOrd items are significant.

5.3. Five-Year Returns as the Dependent Variable

Stewart (1994) reports the strongest results for EVA over a five-year period. This test will take the stock return from 31 March 2008 to 31 March 2013 and the five different performance metrics from 1 January 2008 to 31 December 2012 (2008–2012) as the non-lagged (Xt) performance metric, and from 1 January 2003 to 31 December 2007 (2003–2007) as the lagged (Xt−1) performance metrics. Because of the data used in this regression, only one test is performed. This test is the single most important test of our study, clarifying the ability of the performance metrics to gauge long-term shareholder value (Copeland et al. 2004; Holler 2008, pp. 16–18; KPMG and Velthuis 2004; Venanzi 2012, p. 9). In this test, depicted in Table 6, EBEI (7.5%) outperforms all other performance metrics, yet its relative value of R2 is lower compared with Biddle et al. (1997). ERIC is now a much better performance metric in the long term than EVA, predicting 3.7% of 5-year stock returns. Contrary to our previous 1-year return analyses, CFO contributes the least relevant information in the long term.

5.4. Two-Year (Contemporaneous and One-Year Ahead) Returns as the Dependent Variable

This test allows for the possibility that the stock market takes longer than one year to incorporate performance metrics into stock prices (not tabulated, later summarized in Table 7). We take the contemporaneous year and the next year’s stock returns as the dependent variable. This test finds RI to be better associated with two-year stock returns (4.3%) than CFO, ERIC, EBEI, and EVA (3.7%, 1.5%, 1.5%, and 1.3%, respectively). ERIC once again significantly outperforms EVA, and all pairwise combinations of performance metrics are statistically significant at a level of p < 0.01. From the incremental information content test, all F-statistics are statistically significant at a level of 0.01 except CEQAdj, which is statically significant at a level of p < 0.05. ExtraOrd is not statistically significant. The R2 for the components of ERIC is 6.6%, suggesting that ERIC’s components add information content beyond those of CFO. The ERIC-specific components are statistically significant, and the F-statistics suggests that the capital charge component is important to ERIC and only slightly less important than CFO.

6. Discussion

6.1. Synthesis of the Findings

Motivated by the equivocal findings from previous studies (Toft and Lueg 2015b) and based on an alternative theoretical foundation (Velthuis and Wesner 2005), this study analyzed whether ERIC had a greater association with contemporaneous annual stock returns than CFO, EBEI, RI, and EVA (relative information content). Furthermore, we examined the components of ERIC to see whether any one component added information content beyond that contained in the others (incremental information content). We conducted several tests for robustness on our initial results: we partitioned our observation into five non-overlapping two-year periods, investigated (sophisticated) adopters of VBM metrics only, tested for long-term performance over 5 years, and changed returns from contemporaneous (one-year) to contemporaneous plus one-year ahead (two-year). The results, summarized in Table 7, indicate that we have created robust insights.
Table 7. Synthesis of the information content of ERIC.
#ReferenceTestObs.Findings
Best Worst
1Table 2 Panel AOne-year return2140CFOEBEIRIERICEVA
0.0790.0460.0460.0340.025
2Table 2 Panel BOne-year return—Positive and Negative values differ2140EBEIERICCFORIEVA
0.1070.1000.0970.0580.032
3Section 5.1Two-year sub-period 2003–2004214CFOEBEIEVARIERIC
0.0630.0390.0370.0190.000
4Section 5.1Two-year sub-period 2005–2006214RIERICEBEICFOEVA
0.1490.0810.0780.0520.030
5Section 5.1Two-year sub-period 2007–2008214EBEICFOERICRIEVA
0.1240.0980.0760.0560.007
6Section 5.1Two-year sub-period 2009–2010214ERICRICFOEBEIEVA
0.1190.1000.0980.0510.004
7Section 5.1Two-year sub-period 2011–2012214EBEIERICRICFOEVA
0.1620.0540.0500.0060.003
8Table 4‘Any’1460CFOEBEIERICRIEVA
0.1140.0480.0410.0400.000
9Table 4‘Comp Year’1170CFORIEBEIERICEVA
0.1360.0520.0470.0450.002
10Table 6Five-year returns214EBEIERICRIEVACFO
0.0750.0370.0330.0110.003
11Section 5.4Contemporaneous and one-year ahead1926CFORIERICEBEIEVA
0.0370.0430.0150.0150.013
OverallBest Worst
CFO51221
EBEI43220
RI13340
EVA00119
ERIC14321
Jrfm 15 00368 i001

6.2. Contributions to Theory and Practice

This study makes three major contributions to the extant literature. First, we contribute the first empirical evidence that ERIC is a valid metric for long-term value creation (along with EBEI) and in times of economic crisis (relative information content). We do so by rejecting the null hypothesis (HR) that the information content is the same for all the performance metrics. This aligns with Velthuis and Wesner’s (2005) initial intention to draw managerial attention to creating shareholder value in the long term rather than myopically managing quarterly earnings. Unlike previous empirical evidence (e.g., Biddle et al. 1997; Feltham et al. 2004; Holler 2008), this study suggests that cash (CFO) is an even better proxy for short term future value than earnings (EBEI).
Second, we show that ERIC has incremental information content beyond earnings (EBEI). We do so by rejecting the null hypothesis (HI) that none of the components add any information content beyond that contained in the others. Thereby, ERIC also outperforms the other residual-income-based metrics we tested (RI and EVA).
Third, ERIC might bring new momentum to the use of VBM metrics in practice as it consistently beats the controversial EVA, and is easier to apply for decision making, performance metrics, and incentive compensation in the long term (Andersen and Lueg 2017; Korinth and Lueg 2022; Profitlich et al. 2021). Practitioners should favor ERIC as it is easier to calculate than EVA and has a theory-based edge over conventional metrics that use the complex WACC instead of plain, risk-free interest rates (e.g., KPMG and Velthuis 2004; Robichek and Myers 1966). Residual-based metrics better reflect the intrinsic, long-term value of a firm than daily stock prices, so managers might prefer them for internal decision making (Firk et al. 2019; Knapik and Lueg 2016).

7. Conclusion and Future Research

7.1. Conclusion and Comparison to Previous Studies

Overall, we confirm that CFO and EBEI tend to be the strongest predictors of stock returns, followed by classic RI and the new metric, ERIC. EVA tends to be the worst predictor of stock returns (Table 7). As to ERIC in particular, it consistently outperforms EVA in predicting stock returns (except for reference #3 in Table 7 in the short period from 2003 to 2004). The predictive power of ERIC is particularly high when it is used as a predictor of long-term shareholder value creation (#10 in Table 7, only bettered by EBEI). ERIC was the best metric in predicting stock returns during the financial crisis from 2009–2010 (#6 in Table 7).
The best metric to predict stock returns depends on the period. The analyses are robust in the short term (#1, #2, #8, #9, and #11 in Table 7) for annual pooled observations, suggesting that, on average, CFO outperforms the other performance metrics. Firms focusing on short-term shareholder value creation should focus on CFO and not on ERIC. In the intermediate term (#3, #4, #5, #6, and #7 in Table 7), none of them seem to outperform all the others. Accounting-based and residual-income-based performance metrics (RI, ERIC, EVA) seem equally suited in the intermediate term. In the long term (#10 in Table 7), once more, EBEI seems to perform best, although the more sophisticated performance metrics (such as residual-income-based metrics) perform well on average. However, ERIC still adds some incremental information content beyond that contained in EBEI. We conclude that, among the residual-based income metrics, ERIC appears to be the best predictor of stock returns.
Several studies that replicated Biddle et al. (1997) came to a different conclusion and found that EVA outperformed conventional metrics such as earnings and cash (Bacidore et al. 1997; Feltham et al. 2004; O’Byrne 1999; Parvaei and Farhadi 2013; Worthington and West 2004). Our results are rather in line with Biddle et al. (1997). Like several other studies, we confirm that earnings and cash outperform residual-income-based measures such as EVA in predicting stock returns (Biddle et al. 1997; Chen and Dodd 2001; Clinton and Chen 1998; Holler 2008; Ismail 2006; Kaur and Narang 2009; Kumar and Sharma 2011; Kyriazis and Anastassis 2007; Maditinos et al. 2009). We can also confirm previous findings that—among the residual-income-based measures—classic residual income outperforms EVA (Biddle et al. 1997; Chen and Dodd 2001; Holler 2008). However, as a new insight, we find across different analyses that ERIC tends to perform just as well, or even better, than residual income.

7.2. Limitations and Future Research

While this study is subject to all standard limitations of quantitative panel research (Wooldridge 2017), we would like to address the main issue of our rejected hypotheses: ERIC failed to outperform cash-based and earnings-based metrics in predicting short-term stock returns. It would be too simple to attribute this missing association only to ERIC. We would like to venture some points for debate as to why we think the fact that ERIC is (a good but) not the best predictor of stock returns might be partly due to market participants. These offer avenues for future research.
First, stock returns represent changes in expectations regarding a firm’s business, some of which might materialize within the coming months and others only after decades, such as investments in disruptive technologies. Thus, matching current metrics with stock returns poses an ongoing challenge (O’Byrne 1999). Second, the applied risk rates of EVA and ERIC are firm-specific, so managers can only manage what they can control. Investors, however, diversify so they do not have to care so much about firm-specific risk (Lueg 2008). Future studies might elaborate on the issue of if and how investors in diversified portfolios care about the management of firm-specific risk. Third, many investors have a functional fixation on cash and earnings when valuing firms. Thus, even if these two metrics are—on a theoretical level—inferior to residual-income-based metrics, firm valuation will continue to rely—on a practical level—on these inferior metrics of cash and earnings (Biddle et al. 1997). Investors find residual-based-income metrics hard to calculate and rarely use them (Graham et al. 2006). Future research might investigate how to bridge this gap between what is theoretically appropriate and what is feasible in corporate practice. Fourth, none of the firms in our sample used ERIC for decision making or compensation. Even if they had, we would not know the precise details of their ERIC calculations. If firms do not manage performance in alignment with ERIC, their performance (stock returns) is less likely to be predicted by ERIC (Toft and Lueg 2015b). An additional aspect that might deserve some research attention is that ERIC, by design, will estimate higher short-term and lower long-term returns (Velthuis and Wesner 2005), so that managers might prefer ERIC to EVA for compensation purposes. Fifth, the observed period can make a substantial difference to the results, as seen when Feltham et al. (2004) replicated Biddle et al.’s (1997) study on EVA some years later but got better results. Since this is the first study examining the association of ERIC with stock returns, more studies should be conducted to ascertain the appropriateness of ERIC as a long-term performance metric.

Author Contributions

Conceptualization, R.L. and J.S.T.; methodology, R.L. and J.S.T.; software, R.L. and J.S.T.; validation, R.L. and J.S.T.; formal analysis, R.L. and J.S.T.; investigation, R.L. and J.S.T.; resources, R.L. and J.S.T.; data curation, J.S.T.; writing—original draft preparation, J.S.T.; writing—review and editing, R.L.; visualization, R.L. and J.S.T.; supervision, R.L.; project administration, R.L. and J.S.T.; funding acquisition, R.L. All authors have read and agreed to the published version of the manuscript.

Funding

This research received no external funding.

Institutional Review Board Statement

Not applicable.

Informed Consent Statement

Not applicable.

Data Availability Statement

Not applicable.

Conflicts of Interest

The authors declare no conflict of interest.

References

  1. Andersen, Christian Vium, and Rainer Lueg. 2017. Management Control Systems, culture and upper echelons—A systematic literature review on their interactions. Corporate Ownership & Control 14: 312–25. [Google Scholar]
  2. Bacidore, J. M., J. A. Boquist, T. T. Milbourn, and A. V. Thakor. 1997. The search for the best financial performance measure. Financial Analysts Journal 53: 11–20. [Google Scholar] [CrossRef]
  3. Biddle, Gary, Robert Bowen, and James Wallace. 1997. Does EVA beat earnings? Evidence on associations with stock returns and firm values. Journal of Accounting & Economics 24: 301–36. [Google Scholar]
  4. Bromwich, Michael, and Martin Walker. 1998. Residual income past and future. Management Accounting Research 9: 391–419. [Google Scholar] [CrossRef]
  5. Brück, Christian, Thorsten Knauer, and Anja Schwering. 2022. Disclosure of value-based performance measures: Evidence from German listed firms. Accounting and Business Research, 1–28. [Google Scholar] [CrossRef]
  6. Michael, Burkerta, and Rainer Lueg. 2013. Differences in the sophistication of Value-based Management—The role of top executives. Management Accounting Research 24: 3–22. [Google Scholar]
  7. Chen, Shimin, and James L. Dodd. 2001. Operating income, residual income and EVA: Which metric is more value relevant? Journal of Managerial Issues 13: 65–86. [Google Scholar]
  8. Clinton, B. Douglas, and Shimin Chen. 1998. Do new performance measures measure up? Management Accounting 80: 38–43. [Google Scholar]
  9. Copeland, Tom, Aaron Dolgoff, and Alberto Moel. 2004. The Role of Expectations in Explaining the Cross-section of Stock Returns. Review of Accounting Studies 9: 149–88. [Google Scholar] [CrossRef]
  10. Easton, Peter D., and Trevor S. Harris. 1991. Earnings as an explanatory variable for returns. Journal of Accounting Research 29: 19–36. [Google Scholar] [CrossRef]
  11. Feltham, Gerald A., and James A. Ohlson. 1999. Residual earnings valuation with risk and stochastic interest rates. The Accounting Review 74: 165–83. [Google Scholar] [CrossRef]
  12. Feltham, Glenn D., Grant E. Issac, Chima Mbagwu, and Ganesh Vaidyanathan. 2004. Perhaps EVA does beat earnings—Revisiting previous evidence. Journal of Applied Corporate Finance 16: 83–88. [Google Scholar] [CrossRef]
  13. Firk, Sebastian, Sebastian Schrapp, and Michael Wolff. 2016. Drivers of value creation—The role of value-based management and underlying institutions. Management Accounting Research 33: 42–60. [Google Scholar] [CrossRef]
  14. Firk, Sebastian, Torben Schmidt, and Michael Wolff. 2019. Exploring Value-Based Management sophistication: The role of potential economic benefits and institutional influence. Contemporary Accounting Research 36: 418–50. [Google Scholar] [CrossRef]
  15. Friis, J., R. Lueg, R. Mayanja, Simon Tind Salling, and Kasper Aalund Møller Sørensen. 2015. Business model or strategy: Which comes first? A lifecycle perspective in the Scandinavian software industry. Problems and Perspectives in Management 13: 161–69. [Google Scholar]
  16. Graham, John R., Campbell R. Harvey, and Shiva Rajgopal. 2006. Value destruction and financial reporting decisions. Financial Analysts Journal 62: 27–39. [Google Scholar] [CrossRef]
  17. Hair, Joseph F., Barry J. Babin, Rolph E. Anderson, and William C. Black. 2018. Multivariate Data Analysis, 8th ed. Upper Saddle River: Pearson. [Google Scholar]
  18. Haubro, Anders P., Henrik A. Lomholt, Rainer Lueg, Sverre V. Nielsen, and Ulrik Knudsen. 2015. Tactical and strategic choices in business models: Evidence from a Danish fashion outlet. Journal of Fashion Marketing and Management 19. [Google Scholar] [CrossRef]
  19. Holler, Annette. 2008. Have earnings lost value-relevance? Revisiting latest evidence on EVA. The Business Review 10: 245–54. [Google Scholar]
  20. Ismail, Ahmad. 2006. Is Economic Value Added more associated with stock return than accounting earnings? The UK evidence. International Journal of Managerial Finance 2: 343–53. [Google Scholar] [CrossRef]
  21. Kaur, Mandeep, and Sweety Narang. 2009. Does EVA dominate earnings? Empirical evidence from Indian market. Asia Pacific Business Review 5: 75–90. [Google Scholar] [CrossRef]
  22. Knapik, Magdalena, and Rainer Lueg. 2016. Risk management with management control systems: A pragmatic constructivist perspective. Corporate Ownership & Control 13: 71–80. [Google Scholar]
  23. Koller, Tim, Marc Goedhart, and David Wessels. 2015. Valuation: Measuring and Managing the Value of Companies, 6th ed. Hoboken: Wiley. [Google Scholar]
  24. Korinth, Fabio, and Rainer Lueg. 2022. Corporate sustainability and risk management—The u-shaped relationships of disaggregated esg rating scores and risk in the German capital market. Sustainability 14: 5735. [Google Scholar] [CrossRef]
  25. KPMG, and L. J. Velthuis. 2004. Value Based Management—ERIC-Management and Incentive Concept. Frankfurt am Main: KPMG. [Google Scholar]
  26. Kumar, Satish, and Anil K. Sharma. 2011. Association of EVA and accounting earnings with market value: Evidence from India. Asia-Pacific Journal of Business Administration 3: 83–96. [Google Scholar] [CrossRef]
  27. Kyriazis, Dimitris, and Christos Anastassis. 2007. The validity of the Economic Value Added approach: An empirical application. European Financial Management 13: 71–100. [Google Scholar] [CrossRef]
  28. Liao, Lin, Helen Kang, and Richard D. Morris. 2021. The value relevance of fair value and historical cost measurements during the financial crisis. Accounting & Finance 61: 2069–107. [Google Scholar]
  29. Lueg, Rainer. 2008. Value-Based Management: Empirical Evidence on Its Determinants and Performance Effects. Vallendar: WHU Otto Beisheim School of Management. [Google Scholar]
  30. Lueg, Rainer. 2009. Führt der Einsatz externer Berater zur Überimplementierung innovativer Steuerungsinstrumente? Zeitschrift der Unternehmensberatung 4: 249–53. [Google Scholar]
  31. Lueg, Rainer. 2010a. Shareholder Value und Value Based Management—Wie steuern die HDAX-Konzerne? Zeitschrift für Controlling 22: 337–44. [Google Scholar] [CrossRef]
  32. Lueg, Rainer. 2010b. Value-based Management—Antecedents and performance effects. In Summa Cum Laude 2008: Wirtschaftswissenschaften. Edited by Katinka Pantz. Darmstadt: Roter Fleck Verlag, pp. 284–85. [Google Scholar]
  33. Lueg, Rainer. 2022. Constructs for assessing integrated reports—Testing the predictive validity of a taxonomy for organization size, industry, and performance. Sustainability 14: 7206. [Google Scholar] [CrossRef]
  34. Lueg, Rainer, and Radina Pesheva. 2021. Corporate sustainability in the Nordic countries—The curvilinear effects on shareholder returns. Journal of Cleaner Production 315: 127962. [Google Scholar] [CrossRef]
  35. Lueg, Rainer, and Utz Schäffer. 2010. Assessing empirical research on Value-based Management: Guidelines for improved hypothesis testing. Journal für Betriebswirtschaft 60: 1–47. [Google Scholar] [CrossRef]
  36. Lueg, Klarissa, Boris Krastevb, and Rainer Luegb. 2019. Bidirectional effects between sustainability disclosure and risk—A disaggregate analysis of listed companies in South Africa. Journal of Cleaner Production 229: 268–77. [Google Scholar] [CrossRef]
  37. Lueg, Rainer, Christian Schmaltz, and Modestas Tomkus. 2019. Business models in banking: A cluster analysis using archival data. Trames: A Journal of the Humanities and Social Sciences 23: 79–107. [Google Scholar] [CrossRef]
  38. Maditinos, Dimitrios, Zeljko Sevic, and Nikolaos Theriou. 2009. Modelling traditional accounting and modern value-based performance measures to explain stock market returns in the Athens Stock Exchange (ASE). Journal of Modelling in Management 4: 182–201. [Google Scholar] [CrossRef]
  39. Mavropulo, Olena, Marc Steffen Rapp, and Iuliia A. Udoieva. 2021. Value-based management control systems and the dynamics of working capital: Empirical evidence. Management Accounting Research 52: 100740. [Google Scholar] [CrossRef]
  40. Muheki, Mark, Klarissa Lueg, Rainer Lueg, and Christian Schmaltz. 2014. How business reporting changed during the financial crisis: A comparative case study of two large U.S. banks. Problems and Perspectives in Management 12: 191–208. [Google Scholar]
  41. Myers, R. 1996. Metric wars. CFO 12: 41–50. [Google Scholar]
  42. O’Byrne, Stephen F. 1999. EVA and its critics. Journal of Applied Corporate Finance 12: 92–96. [Google Scholar] [CrossRef]
  43. Palliam, Ralph. 2006. Further evidence on the information content of economic value added. Review of Accounting and Finance 5: 204–15. [Google Scholar] [CrossRef]
  44. Parvaei, Akbar, and Soran Farhadi. 2013. The ability of explaining and predicting of Economic Value Added (EVA) versus net income (NI), residual income (RI) & free cash flow (FCF) in Tehran stock exchange (TSE). International Journal of Economics & Finance 5: 67–77. [Google Scholar]
  45. Pfeiffer, Thomas, and Louis Velthuis. 2009. Incentive System Design Based on Accrual Accounting: A Summary and Analysis. Journal of Management Accounting Research 21: 19–53. [Google Scholar] [CrossRef]
  46. Profitlich, Mirko, Yassin Denis Bouzzine, and Rainer Lueg. 2021. The relationship between CFO compensation and corporate sustainability: An empirical examination of German listed firms. Sustainability 13: 12299. [Google Scholar] [CrossRef]
  47. Ray, S. 2012. Efficacy of Economic Value Added concept in business performance measurement. Advances in Information Technology and Management 2: 260–67. [Google Scholar]
  48. Robichek, Alexander A., and Stewart C. Myers. 1966. Conceptual problems in the use of risk-adjusted discount rates. The Journal of Finance 21: 727–30. [Google Scholar]
  49. Schmaltz, Christian, Rainer Lueg, Jesper Agerholm, and Kasper Wittrup. 2019. Value-based management in banking: The effects on shareholder returns. International Journal of Business Science and Applied Management 14: 35–50. [Google Scholar]
  50. Stewart, G. Bennett. 1991. The Quest for Value: A Guide for Senior Managers. New York: Harper Business. [Google Scholar]
  51. Stewart, G. Bennett. 1994. EVA: Facts and fantasy. Journal of Applied Corporate Finance 7: 71–84. [Google Scholar] [CrossRef]
  52. Toft, Jon, and Rainer Lueg. 2015a. A screening model for corporate bond picking. The International Journal of Finance 27: 437–53. [Google Scholar]
  53. Toft, Jon, and Rainer Lueg. 2015b. Does EVA beat earnings? A literature review of the evidence since Biddle et al. (1997). Corporate Ownership and Control 12: 8–18. [Google Scholar] [CrossRef]
  54. Velthuis, Louis John, and Peter Wesner. 2005. Value Based Management. Bewertung, Performancemessung und Managemententlohnung mit ERIC, 1st ed. Stuttgart: Schäffer-Poeschel. [Google Scholar]
  55. Venanzi, Daniela. 2012. Financial Performance Measures and Value Creation: The State of the Art. Berlin: Springer. [Google Scholar]
  56. Wooldridge, Jeffrey M. 2017. Introductory Econometrics: A Modern Approach. Boston: South-Western College Publishers. [Google Scholar]
  57. Worthington, Andrew, and Tracey West. 2004. Australian evidence concerning the information content of Economic Value Added. Australian Journal of Management 29: 201–23. [Google Scholar] [CrossRef]
  58. Young, David. S. 1999. Some reflections on accounting adjustments and Economic Value Added. Journal of Financial Statement Analysis 4: 7–13. [Google Scholar]
  59. Young, S. David, and Stephen F. O’Byrne. 2001. EVA and Value Based Management: A Practical Guide to Implementation. New York: McGraw-Hill. [Google Scholar]
Figure 1. Median values of performance measures, 2003–2012.
Jrfm 15 00368 g001
Figure 2. Illustration of relative and incremental information content of CFO, EBEI, RI, EVA, and ERIC. Relative information content is indicated by the size of the circles and is the R2-adjusted from Table 4; CFO = 2.6% > EBEI = 1.3% > RI = 1.0% > ERIC = 0.4% > EVA = 0.1%. Incremental information content is indicated by the non-overlapping area and is derived from F-statistics; CFO = 29.619 > EBEI = 15.326 > RI = 11.651 > ERIC = 4.761 > EVA = 1.975.
Jrfm 15 00368 g002
Table 1. Descriptive statistics for pooled data.
Panel A: Descriptive Statistics of the Dependent and Independent Variables in Relative Information Content Tests a
Dependent VariableIndependent Variables
MktAdjRettCFOtEBEItRItEVAtERICt
Descriptive statistics
Mean0.0760.1290.057−0.236−0.0690.015
Median0.0270.1040.061−0.029−0.0100.039
Std. Dev.0.3380.1000.0620.5660.2500.136
Correlations b
MktAdjRett1.000
CFOt0.280 **1.000
EBEIt0.092 **0.244 **1.000
RIt−0.215 **−0.167 **0.157 **1.000
EVAt−0.115 **−0.143 **0.290 **0.489 **1.000
ERICt−0.133 **−0.127 **0.471 **0.486 **0.751 **1.000
Panel B: Descriptive Statistics of the Dependent and Independent Variables in Incremental Information Content Tests a
Dependent VariableIndependent Variables
MktAdjRettCFOtAccrualtATInttExOrdItemstCEQAdjtCapChgt
Descriptive statistics
Mean0.0760.129−0.0730.0120.0000.0020.048
Median0.0270.104−0.0420.0070.0000.0020.025
Std. Dev.0.3380.1000.1070.0170.0020.0490.085
Correlations b
MktAdjRett1.000
CFOt0.280 **1.000
Accrualt−0.209 **−0.788 **1.000
ATIntt0.131 **0.510 **−0.441 **1.000
ExOrdItemst−0.0160.089 **−0.071 **0.143 **1.000
CEQAdjt0.0190.086 **−0.116 **0.093 **0.0261.000
CapChgt0.175 **0.323 **−0.301 **0.234 **0.0340.049 *1.000
a The sample includes 2354 firm-year observations. All variables are winsorized ±4 standard deviations from the median. Extreme observations more than ±8 standard deviations from the median are removed. All independent variables are deflated by the market value of equity three months after the beginning of the fiscal year. b Correlation coefficients levels; ** Correlation is significant at the 0.01 level; * Correlation is significant at the 0.05 level.
Table 2. Tests of the relative information content of CFO, EBEI, RI, EVA, and ERIC when predicting 1-year stock returns.
Ranked Order of R2ObservationsRelative Information Content
(1) (2) (3) (4) (5)
Panel A: Coefficient of Positive and Negative Values of Each Performance Metric Constrained to Be Equal a
All firms2140CFO> EBEI> RI ERIC> EVA
Adj. R2 0.079 0.046 0.046 0.034 0.025
p-value b (0.000) (0.000) (0.000) (0.000)
(0.000) (0.000) (0.000)
(0.000) (0.000)
(0.000)
Panel B: Coefficient of Positive and Negative Values of Each Performance Metric Allowed to Differ c
All firms2140EBEI> ERIC> CFO> RI> EVA
Adj. R2 0.107 0.100 0.097 0.058 0.032
p-value b (0.000) (0.000) (0.000) (0.000)
(0.000) (0.000) (0.000)
(0.000) (0.000)
(0.000)
a Regression: D t = b 0 + b 1 X t / M V E t 1 + b 2 X t 1 / M V E t 1 + e t ; where D t = market-adjusted returns; X = a given performance metric (CFO, EBEI, RI, EVA, or ERIC), and M V E = the market value of equity three months after the beginning of the fiscal year. Performance metrics are listed in order of R2s from highest (on the left) to lowest (on the right). Statistical tests of differences in explanatory power across performance metrics are presented centered in parentheses below the adjusted R2s. b Two-tailed p-values in parentheses represent tests of the null hypothesis of no difference between pairwise comparisons of adjusted R2s. The first row presents the p-values for comparison between the first- and second-ranked metrics, second- and third-ranked metrics, third- and fourth-ranked metrics, and fourth- and fifth-ranked metrics. The next row shows comparisons between the first- and third-ranked metrics, second- and fourth-ranked metrics, and third- and fifth-ranked metrics. The third row presents comparisons between the first- and fourth-ranked metrics, and the second- and fifth-ranked metrics. The last row comparisons are between the first- and fifth-ranked metrics. c Regressions are modified to allow different coefficients on positive versus negative values of the independent variables: D t = b 0 + b 1 X t , p o s / M V E t 1 + b 2 X t , n e g / M V E t 1 + b 3 X t 1 , p o s / M V E t 1 + b 4 X t 1 , n e g / M V E t 1 + e t , where D t = market-adjusted returns; X = a given performance metric (CFO, EBEI, RI, EVA, or ERIC), and M V E = the market value of equity three months after the beginning of the fiscal year.
Table 3. Test for incremental information content of ERIC components among all firms: Cash flow from operation, accruals, after=tax interest expenses, certainty equivalent adjustments, and capital charge.
Variables aPredicted SignsCoefficientsp-Value bF-Stat.p-Value
Constant −0.0040.365
CFOt+1.1400.00092.1270.000
CFOt−1−0.8510.000
Accrualt+0.3160.00289.6480.000
Accrualt1−0.7110.000
ATIntt−1.1950.15018.7070.000
ATIntt1+0.7640.252
ExtraOrdt+−5.2840.0410.5270.295
ExtraOrdt1−0.5340.274
CEQAdjt−0.2000.07813.3850.000
CEQAdjt1+0.0340.150
CapChgt2.1550.00065.3640.000
CapChgt1+−2.0100.000
Obs. 2140
Adj. R2 0.127
a Dependent variable = market-adjusted returns; independent variables are components of ERIC (CFO, accruals, after-tax interest expenses, extraordinary items, certainty equivalent adjustment, and capital charge) and are shown in non-lagged forms as column headings. Each independent variable is deflated by the market value of equity three months after the beginning of the fiscal year. b p-values represent non-directional F-tests of the null hypothesis of incremental information content.
Table 4. Tests of relative information content of CFO, EBEI, RI, EVA, and ERIC for VBM adopters and VBM compensation.
Ranked Order of R2ObservationsRelative Information Content b,c
(1) (2) (3) (4) (5)
Panel A: Coefficient of Positive and Negative Values of Each Performance Metric Constrained to Be Equal
“VBM adoption” a1460CFO> EBEI> RI> ERIC> EVA
Adj. R2 0.026 0.014 0.003 0.000 0.000
p-value (0.000) (0.000) (0.121) (0.344)
(0.000) (0.000) (0.158)
(0.000) (0.000)
(0.000)
“VBM compensation” a1170CFO> EBEI> RI> ERIC> EVA
Adj. R2 0.022 0.014 0.004 0.000 0.000
p-value (0.000) (0.000) (0.095) (0.563)
(0.000) (0.000) (0.117)
(0.000) (0.000)
(0.000)
a Firms are categorized in their use of ERIC (or like metric) as follows: “VBM adoption” represents all firms that mentioned that they use VBM-related metrics—even if that use appears minimal. “VBM compensation” represents a subset of observations from “VBM adoption” which only includes years where firms had a compensation plan based on VBM-related metrics. b Regression: D t = b 0 + b 1 X t / M V E t 1 + b 2 X t 1 / M V E t 1 + e t ; where D t = market-adjusted returns; X = a given performance metric (CFO, EBEI, RI, EVA, or ERIC), and M V E = the market value of equity three months after the beginning of the fiscal year. Performance metrics are listed in order of R2s from highest (on the left) to lowest (on the right). Statistical tests of differences in explanatory power across performance metrics are presented centered in parentheses below the adjusted R2s. c Two-tailed p-values in parentheses represent tests of the null hypothesis of no difference between pairwise comparisons of adjusted R2s. The first row presents the p-values for comparison between the first- and second-ranked metrics, second- and third-ranked metrics, third- and fourth-ranked metrics, and fourth- and fifth-ranked metrics. The next row shows comparisons between the first- and third-ranked metrics, second- and fourth-ranked metrics, and third- and fifth-ranked metrics. The third row presents comparisons between the first- and fourth-ranked metrics, and the second- and fifth-ranked metrics. The last row comparisons are between the first- and fifth-ranked metrics.
Table 5. Test for incremental information content of ERIC components among VBM adopters: Cash flow from operation, accruals, after-tax interest expenses, certainty equivalent adjustments, and capital charge.
“VBM Adoption” aPredicted SignsCoefficients bp-Value cF-Stat.p-Value
Constant 0.0060.015
CFOt+1.2760.15387.8930.000
CFOt−1−0.8070.147
Accrualt+0.4260.12267.3550.000
Accrualt−1−0.5640.099
ATIntt0.6201.32636.2160.000
ATIntt−1+0.5331.346
CEQAdjt−0.0270.1627.5740.001
CEQAdjt−1+0.0020.033
CapChgt2.1760.23255.1520.000
CapChgt−1+−2.0920.262
Obs. 1460
Adj. R2 0.153
“VBM Compensation” aPredicted SignsCoefficientsp-Value cF-Stat.p-Value
Constant −0.0040.017
CFOt+1.2860.16986.2620.000
CFOt−1−0.7570.160
Accrualt+0.4230.13362.8790.000
Accrualt−1−0.5110.108
ATIntt1.6351.62344.2670.000
ATIntt−1+0.3471.622
CEQAdjt−0.0030.1705.2230.006
CEQAdjt−1+−0.0040.035
CapChgt2.2350.25051.3950.000
CapChgt−1+−2.1350.284
Obs. 1170
Adj. R2 0.173
a Firms are categorized in their use of ERIC (or like metric) as follows: “VBM adoption” represents all firms that mentioned that they use VBM-related metrics—even if that use appears minimal. “VBM compensation” represents a subset of observations from “VBM adoption” which only includes years where firms have a compensation plan based on VBM-related metrics. b Dependent variable = market-adjusted returns; independent variables are components of ERIC (CFO, accruals, after-tax interest expenses, certainty equivalent adjustment, and capital charge) and are shown in non-lagged forms as column headings. Each independent variable is deflated by the market value of equity three months after the beginning of the fiscal year. c p-values represent non-directional F-tests of the null hypothesis of incremental information content.
Table 6. Tests of relative information content of CFO, EBEI, RI, EVA, and ERIC predicting 5-year stock returns.
Ranked Order of R2ObservationsRelative Information Content a
(1) (2) (3) (4) (5)
5-Year Stock Returns
214EBEI> ERIC> RI> EVA> CFO
Adj. R2 0.075 0.037 0.033 0.011 0.003
p-value b (0.001) (0.005) (0.045) (0.260)
(0.000) (0.007) (0.022)
(0.001) (0.035)
(0.001)
a Underlying regression: 5 y e a r   p e r i o d s :   D t = b 0 + b 1 X t / M V E t 5 + b 2 X t 5 / M V E t 5 + e t , where is defined over the five-year periods from 2003–2007 (lagged) and 2008–2012 (non-lagged), respectively; Dt is market-adjusted returns over five years; X = a given performance metric (CFO, EBEI, RI, EVA, or ERIC); and MVE = the market value of equity three months after the beginning of the fiscal year. b p-values in parentheses represent tests of the null hypothesis of no difference between pairwise comparisons of adjusted R2s. The first row presents p-values for comparison between the first- and second-ranked metrics, second- and third-ranked metrics, third- and fourth-ranked metrics, and fourth- and fifth-ranked metrics. The next row shows comparisons between the first- and third-ranked metrics, second- and fourth-ranked metrics, and third- and fifth-ranked metrics. The third row presents comparisons between the first- and fourth-ranked metrics, and the second- and fifth-ranked metrics. The last row comparisons are between the first- and fifth-ranked metrics.
Publisher’s Note: MDPI stays neutral with regard to jurisdictional claims in published maps and institutional affiliations.

