
Capital Structure and Its Determinants—A Comparison of European Top-Rated CSR and Other Companies


Abstract
:1. Introduction
2. Literature Review
2.1. Capital Structure Theories Review
2.2. CSR-Oriented Studies in the Context of Capital Strcuture Theories as a Basis for Hypotheses Development
3. Materials and Methods
3.1. Variables
3.2. Methods for the Hypotheses Testing
3.3. Data
3.4. Econometric Tests of the Models
4. Results and Discussion
5. Conclusions
Author Contributions
Funding
Institutional Review Board Statement
Informed Consent Statement
Data Availability Statement
Conflicts of Interest
Appendix A


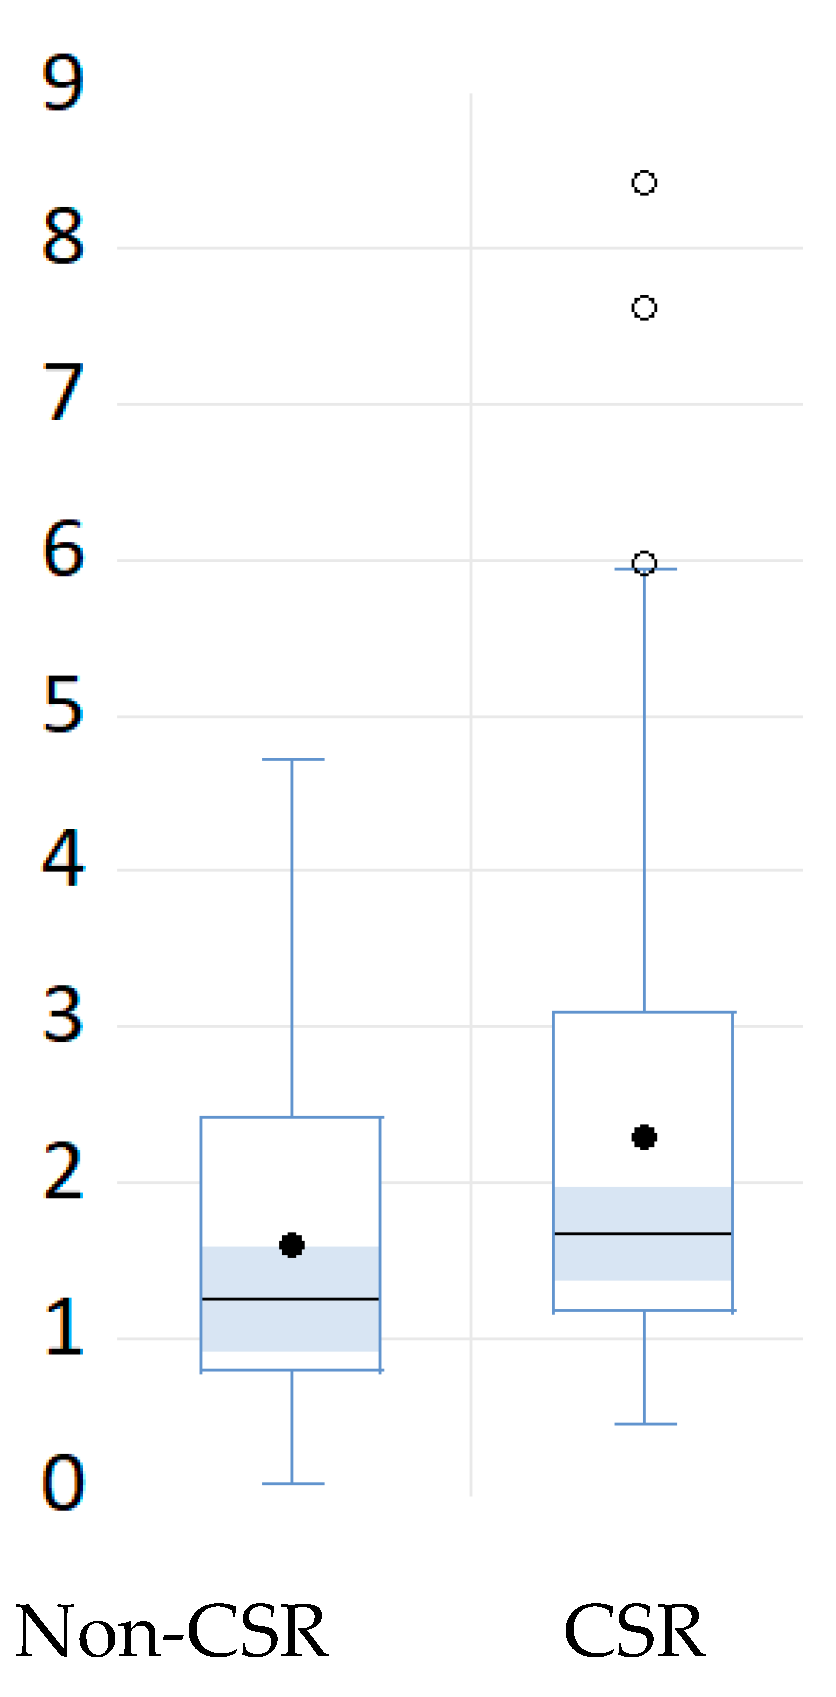
| CSR | Mean | Median | Standard Deviation | Observations |
|---|---|---|---|---|
| non-CSR | 1.6142 | 1.2647 | 0.9994 | 59 |
| CSR | 2.2936 | 1.6830 | 1.6330 | 103 |
| all | 2.0462 | 1.6344 | 1.4686 | 162 |
References
- Abdelfattah, Tarek, and Ahmed Aboud. 2020. Tax avoidance, corporate governance, and corporate social responsibility: The case of the Egyptian capital market. Journal of International Accounting 38: 1–16. [Google Scholar] [CrossRef]
- Akdal, Sinan. 2010. How Do Firm Characteristics Affect Capital Structure? Some UK Evidence. Munich Personal RePEc Archive. Available online: https://mpra.ub.uni-muenchen.de/29199/1/MPRA_paper_29199.pdf (accessed on 17 December 2020).
- Akhtar, Hameeda, Ming Xiao, and Abdur R. Usama. 2016. Impact of Corporate Social Responsibility on the Speed of Capital Structure Adjustment: A Structural Equation Modeling Approach. Paper presented at IEEE International Conference on Logistics, Informatics and Service Sciences (LISS), Sydney, Australia, July 24–27. [Google Scholar]
- Arribas, Iván, María Dolores Espinós-Vañó, Fernando García, and Paula Beatriz Morales-Bañuelos. 2019. The Inclusion of Socially Irresponsible Companies in Sustainable Stock Indices. Sustainability 11: 2047. [Google Scholar] [CrossRef] [Green Version]
- Bae, Kee-Hong, Sadok El Ghoul, Omrane Guedhami, Chuck C. Y. Kwok, and Ying Zheng. 2019. Does corporate social responsibility reduce the costs of high leverage? Evidence from capital structure and product market interactions. Journal of Banking and Finance 100: 135–50. [Google Scholar] [CrossRef]
- Baker, Malcolm, and Jeffrey Wurgler. 2002. Market Timing and Capital Structure. The Journal of Finance 57: 1–32. [Google Scholar] [CrossRef]
- Barnea, Amir, and Amir Rubin. 2006. Corporate Social Responsibility as a Conflict between Shareholders. Journal of Business Ethics 97: 71–86. [Google Scholar] [CrossRef]
- Benlemlih, Mohammed. 2017. Corporate social responsibility and firm financing decisions: A literature review. Journal of Multinational Financial Management 42–43: 1–10. [Google Scholar] [CrossRef]
- Bhaird, Ciarán M. A., and Brian M. Lucey. 2010. Determinants of capital structure in Irish SMEs. Small Business Economics 35: 357–75. [Google Scholar] [CrossRef] [Green Version]
- Bouzguenda, Karima. 2018. Emotional intelligence and financial decision making: Are we talking about a paradigmatic shift or a change in practices? Research in International Business and Finance 44: 273–84. [Google Scholar] [CrossRef]
- Brealey, Richard A., and Stewart C. Myers. 1992. Teorie a Praxe Firemních Financí. Praha: Victoria Publishing, p. 971. [Google Scholar]
- Bukalska, Elżbieta. 2019. Testing trade-off theory and pecking order theory under managerial overconfidence. International Journal of Management and Economics 55: 99–117. [Google Scholar] [CrossRef] [Green Version]
- Cantino, Valter, Alain Devalle, and Simona Fiandrino. 2017. ESG Sustainability and Financial Capital Structure: Where they Stand Nowadays. International Journal of Business and Social Science 8: 116–26. [Google Scholar]
- Chen, Long, and Xinlei Zhao. 2006. On the relation between the market-to-book ratio, growth opportunity, and leverage ratio. Finance Research Letters 3: 253–66. [Google Scholar] [CrossRef]
- Cheng, Beiting, Ioannis Ioannou, and George Serafeim. 2014. Corporate social responsibility and access to finance. Strategic Management Journal 35: 1–23. [Google Scholar] [CrossRef]
- Chittenden, Francis, Graham Hall, and Patrick Hutchinson. 1996. Small Firm Growth, Access to Capital Markets and Financial Structure: Review of Issues and Empirical Investigation. Small Business Economics 8: 59–67. [Google Scholar] [CrossRef]
- Cumming, Geoff. 2009. Inference by eye: Reading the overlap of independent confidence intervals. Statistics in Medicine 28: 205–20. [Google Scholar] [CrossRef] [PubMed]
- Cumming, Geoff, and Sue Finch. 2005. Inference by Eye: Confidence Intervals and How to Read Pictures of Data. American Psychologist 60: 170–80. [Google Scholar] [CrossRef] [PubMed] [Green Version]
- Diez-Cañamero, Borja, Tania Bishara, Jose R. Otegi-Olaso, Rikardo Minguez, and José M. Fernández. 2020. Measurement of Corporate Social Responsibility: A Review of Corporate Sustainability Indexes, Rankings and Ratings. Sustainability 12: 2153. [Google Scholar] [CrossRef] [Green Version]
- Drobetz, Wolfgang, and Roger Fix. 2003. What are the Determinants of the Capital Structure? Some Evidence for Switzerland. Swiss Journal of Economics and Statistics 141: 1–37. [Google Scholar]
- Faccio, Mara, and Jin Xu. 2015. Taxes and Capital Structure. Journal of Financial and Quantitative Analysis 50: 277–300. [Google Scholar] [CrossRef] [Green Version]
- Fama, Eugene F., and Merton H. Miller. 1972. The Theory of Finance. New York: Holt Rinehart and Winston, p. 346. [Google Scholar]
- Girerd-Potin, Isabelle, Sonia Jimenez-Garcès, and Pascal Louvet. 2011. The Link between Social Rating and Financial Capital Structure. Revue de L’Association Française de Finance 32: 9–52. [Google Scholar] [CrossRef]
- Goss, Alen, and Gordon S. Roberts. 2011. The impact of corporate social responsibility on the cost of bank loans. Journal of Banking & Finance 35: 1794–810. [Google Scholar] [CrossRef]
- Investing—Stocks—Financials. 2021. [Data Set]. Available online: https://www.investing.com/equities/ (accessed on 19 April 2021).
- Iqbal, Nadeem, Naveed Ahmad, Nauman Ahmad Basheer, and Muhammad Nadeem. 2012. Impact of Corporate Social Responsibility on Financial Performance of Corporations: Evidence from Pakistan. International Journal of Learning & Development 2: 107–18. [Google Scholar] [CrossRef] [Green Version]
- Jensen, Michael. 1986. Agency Costs of Free Cash Flow, Corporate Finance and Takeovers. American Economic Review 76: 323–29. [Google Scholar]
- Jensen, Michael, and William Meckling. 1976. Theory of the Firm: Managerial Behaviour, Agency Costs and Ownership Structure. Journal of Financial Economics 3: 305–60. [Google Scholar] [CrossRef]
- Kim, Han E. 1978. A Mean-Variance Theory of Optimal Capital Structure and Corporate Debt. Journal of Finance 33: 45–64. [Google Scholar] [CrossRef]
- Kráľovič, Jozef, and Karol Vlachynský. 2006. Finančný Manažment. Bratislava: IURA Edition, p. 455. [Google Scholar]
- Kraus, Alan, and Robert H. Litzenberger. 1973. A State-Preference Model of Optimal Financial Leverage. The Journal of Finance 28: 911–22. [Google Scholar] [CrossRef]
- Krištofík, Peter. 2002. Determinanty kapitálovej štruktúry a finančného rozhodovania v podmienkach slovenských podnikov. Ekonomický Časopis 50: 197–216. [Google Scholar]
- Krištofík, Peter. 2010. Finančná Ekonómia s Aplikáciou na Rozvíjajúce sa Trhy. Bratislava: Iura Edition, p. 122. [Google Scholar]
- Li, Jiu-Jin, Chang Xu, Hung-Gay Fung, and Kam C. Chan. 2021. Do venture capital firms promote corporate social responsibility? International Review of Economics and Finance 71: 718–32. [Google Scholar] [CrossRef]
- Lin, Kenny Z., Suwina Cheng, and Fang Zhang. 2017. Corporate social responsibility, institutional environments, and tax avoidance: Evidence from a subnational comparison in China. The International Journal of Accounting 52: 303–18. [Google Scholar] [CrossRef]
- Lu, Hao, Won-Yong Oh, Anne Kleffner, and Young Kyun Chang. 2021. How do investors value corporate social responsibility? Market valuation and the firm specific contexts. Journal of Business Research 125: 14–25. [Google Scholar] [CrossRef]
- M’ng, Jacinta Chan Phooi, Mahfuzur Rahman, and Selvam Sannacy. 2017. The determinants of capital structure: Evidence from public listed companies in Malaysia, Singapore and Thailand. Cogent Economics & Finance 5: 1–34. [Google Scholar] [CrossRef]
- Mahadwartha, Putu A., and Fitri Ismiyanti. 2008. Debt policy, free cash flow hypothesis, and balancing of agency theory through ownership: Evidence from Indonesia. Corporate Ownership & Control 5: 256–63. [Google Scholar] [CrossRef]
- Modigliani, Franco, and Merton H. Miller. 1958. The Cost of Capital, Corporation Finance, and the Theory of Investment. American Economic Review 48: 261–97. [Google Scholar]
- Modigliani, Franco, and Merton H. Miller. 1963. Corporate Income Taxes and the Cost of Capital: A Correction. American Economic Review 56: 333–91. [Google Scholar]
- Mouline, Boubker, and Hicham Sadok. 2021. Corporate Cash Holdings and Agency Conflicts: Evidence from Moroccan Developing Market. Universal Journal of Accounting and Finance 9: 24–32. [Google Scholar] [CrossRef]
- Myers, Stewart C. 1984. The Capital Structure Puzzle. The Journal of Finance 39: 574–92. [Google Scholar] [CrossRef]
- Myers, Stewart C. 2001. Capital Structure. Journal of Economic Perspectives 15: 81–102. [Google Scholar] [CrossRef] [Green Version]
- Myers, Stewart C., and Nicholas S. Majluf. 1984. Corporate financing and investment decisions when firms have information that investors do not have. Journal of Financial Economics 13: 187–221. [Google Scholar] [CrossRef] [Green Version]
- Orjinta, Hope, and Stella Agubata. 2017. Effect of Taxes on Capital Structure Decision: Evidence from Non-financial Firms in Nigeria. Palgo Journal of Business Management 4: 95–102. [Google Scholar]
- Pijourlet, Guillaume. 2013. Corporate Social Responsibility and Financing Decisions. Paper presented at European Financial Management Association, Annual Meetings, Reading, UK, June 26–29; Available online: https://efmaefm.org/0EFMAMEETINGS/EFMA%20ANNUAL%20MEETINGS/2013-Reading/accepted%20papers/P.php (accessed on 10 February 2021).
- Rahman, Rashidah A., and Maha F. Alsayegh. 2021. Determinants of Corporate Environment, Social and Governance (ESG) Reporting among Asian Firms. Journal of Risk and Financial Management 14: 167. [Google Scholar] [CrossRef]
- Rehman, Zia U., Sher A. Khan, and Asad Khan. 2019. External Factors and Capital Structure. Journal of Business and Tourism 5: 183–93. [Google Scholar]
- Režňáková, Mária, Petr Svoboda, and Anna Polednáková. 2010. Determinants of Capital Structure: Empirical Evidence from Slovakia. Ekonomický Časopis 58: 237–50. [Google Scholar]
- Ross, Stephen A. 1985. Debt and Taxes and Uncertainty. Journal of Finance 40: 37–657. [Google Scholar] [CrossRef]
- Scott, James H. 1977. Bankruptcy, Secured Debt and Optimal Capital Structure. Journal of Finance 32: 1–19. [Google Scholar] [CrossRef]
- Stiglitz, Joseph E. 1969. A Re-Examination of the Modigliani-Miller Theorem. The American Economic Review 59: 784–93. [Google Scholar]
- Szymańska, Aleksandra, Stijin V. Puyvelde, and Marc Jegers. 2015. Capital structure of social purpose companies—A panel data analysis. Journal of Sustainable Finance & Investment 5: 1–23. [Google Scholar] [CrossRef]
- Thomson Reuters. 2020. Refinitiv Eikon [Data Set]. Available online: https://eikon.thomsonreuters.com/index.html (accessed on 1 March 2020).
- Verwijmeren, Patrick, and Jeroen Derwall. 2010. Employee well-being, firm leverage, and bankruptcy risk. Journal of Banking & Finance 34: 956–64. [Google Scholar] [CrossRef]
- Weston, J. Fred, and Eugene F. Brigham. 1981. Managerial Finance, 7th ed. Hinsdale: Dryden Press, p. 1086. [Google Scholar]
- Yang, Shenggang, Zhu Qi, Feiying He, and Ziang Zou. 2016. How Does Corporate Social Responsibility Change Capital Structure? Asia-Pacific Journal of Accounting & Economics 25: 352–87. [Google Scholar] [CrossRef]
- Yeh, Chin-Chen, Fengyi Lin, Teng-Shih Wang, and Chia-Ming Wu. 2020. Does corporate social responsibility affect cost of capital in China? Asia Pacific Management Review 25: 1–12. [Google Scholar] [CrossRef]


| Determinant/Theory | MM Tax-Including Model | Trade-Off Theory | Agency Costs Theory | Pecking-Order Theory | Life Cycle Theory | Market- Timing Theory |
|---|---|---|---|---|---|---|
| Effective corporate income and dividend 1 tax rate | ||||||
| + | + | |||||
| Effective interest income tax rate 1 | - | - | ||||
| Depreciation & amortization | - 2 | - 2 | - | |||
| Tax optimization | - 2 | - 2 | ||||
| Profitability | + | + 3 | - | - | ||
| Business risk | - | |||||
| Bankruptcy costs | - | |||||
| Cash | + | - | ||||
| Growth opportunities | - | + | ||||
| Rating | + | + | ||||
| Dividends | + | |||||
| Asset tangibility (collateral) | + | + | + | |||
| Size and age | + | |||||
| Market to book ratio 4 | - | |||||
| Interest rate | - |
| Traditional/Financial Determinant (and Its Effect on Leverage) | Theory | Context | Behavioral Determinant | Effect of Behavioral Determinant on Leverage |
|---|---|---|---|---|
| Collateral and covenants (+) | Agency costs, Life cycle | Motivating investors by mitigating the risk of their investment | CSR governance and overall | + (CSR replaces collateral) |
| Business risk (-) | Trade-off | Less risky company can afford to have higher leverage | CSR governance and overall | + (CSR = higher safety) |
| Indirect bankruptcy costs: (lost) growth opportunities (-) | Trade-off | Risk of non-implementation of business or CSR projects because of a financial distress | CSR community | - (aim is to mitigate bankruptcy risk) |
| Indirect bankruptcy costs: loss of key employees (-) | Trade-off | Risk of staff redundancies because of a financial distress | CSR employees | - (aim is to mitigate bankruptcy risk) |
| Available cash (+) | Agency costs | Motivating managers to reduce inefficient consumption (through debt or better governance) CSR alternative to inefficient managerial consumption = community projects implemented in order to be perceived as a “good citizen“ | CSR governance CSR community | - (CSR replaces moralization function of debt) + (moralization function of debt is needed to avoid inefficient consumption) |
| Interest tax shield (+) | MM tax-including model, Trade-off | Less motivation for CSR companies to use the shield, as they are expected to pay “adequate” taxes Increased use of the shield while “justifying” optimization by CSR activities | CSR overall CSR community | - (interest tax shield is not needed) + (interest tax shield is used) |
| Test/Statistics | Null Hypothesis | p-Value or Value of VIF (Model 1, CSR) | p-Value or Value of VIF (Model 2, Non-CSR) |
|---|---|---|---|
| Jarque–Bera of residuals | Normal distribution | 0.2038 | 0.9459 |
| White | Homoskedasticity | 0.0562 | 0.1170 |
| Breusch–Pagan–Godfrey | Homoskedasticity | 0.1140 | 0.2759 |
| Ramsey reset test | Correct specification | 0.4532 | 0.0343 |
| VIF for TAX | 1.0517 | 1.0375 | |
| VIF for DA | 1.0157 | 1.4078 | |
| VIF for TAN | 1.2437 | 2.3777 | |
| VIF for CASH | 1.3010 | 2.4256 |
| Variable | Model 1 | Model 2 | ||
|---|---|---|---|---|
| Coefficient | Standardized Coefficient | Coefficient | Standardized Coefficient | |
| Intercept | 0.8566 * | - | −0.0719 | - |
| TAX | 0.0672 | 0.0548 | 0.1225 | 0.0768 |
| DA | 0.0427 | 0.0306 | −0.1013 | −0.0957 |
| TAN | 0.1805 | 0.0643 | −0.4346 * | −0.3080 |
| CASH | −0.5909 *** | −0.3758 | −0.9625 *** | −0.7984 |
Publisher’s Note: MDPI stays neutral with regard to jurisdictional claims in published maps and institutional affiliations. |
© 2022 by the authors. Licensee MDPI, Basel, Switzerland. This article is an open access article distributed under the terms and conditions of the Creative Commons Attribution (CC BY) license (https://creativecommons.org/licenses/by/4.0/).
Share and Cite
Krištofík, P.; Medzihorský, J.; Musa, H. Capital Structure and Its Determinants—A Comparison of European Top-Rated CSR and Other Companies. J. Risk Financial Manag. 2022, 15, 325. https://doi.org/10.3390/jrfm15080325
Krištofík P, Medzihorský J, Musa H. Capital Structure and Its Determinants—A Comparison of European Top-Rated CSR and Other Companies. Journal of Risk and Financial Management. 2022; 15(8):325. https://doi.org/10.3390/jrfm15080325
Chicago/Turabian StyleKrištofík, Peter, Juraj Medzihorský, and Hussam Musa. 2022. "Capital Structure and Its Determinants—A Comparison of European Top-Rated CSR and Other Companies" Journal of Risk and Financial Management 15, no. 8: 325. https://doi.org/10.3390/jrfm15080325